


Water Infrastructure System Leakage Analysis: Evaluation of Factors Impacting System Performance and Opportunity Cost


Abstract
:1. Introduction
2. Challenges and Complexities with Infrastructure System Management
2.1. Financial and Economic Challenges
- Authorized Consumption:
- Billed to Customer (Revenue Water)
- Metered Consumption
- Unmetered Consumption
- Not Billed to Customer (Non-Revenue Water)
- Metered Consumption
- Unmetered Consumption
- Water Loss:
- Apparent Loss (Non-Revenue Water)
- Unauthorized Water Consumption
- Customer Meter Errors and Inaccuracies
- System Data Errors
- Real Loss (Non-Revenue Water)
- Water Leakage on Distribution
- Water Leakage Storage Overflow
- Water Leakage on Customer Service Connections
2.2. Water Utility Governance
2.3. Water Leakage Tools
2.4. Water Loss Improvements
3. Systems Approach to Water Management
3.1. System Process Improvements
3.2. System Sub-Optimization to Aid Improvements
3.3. Management of Water Resources
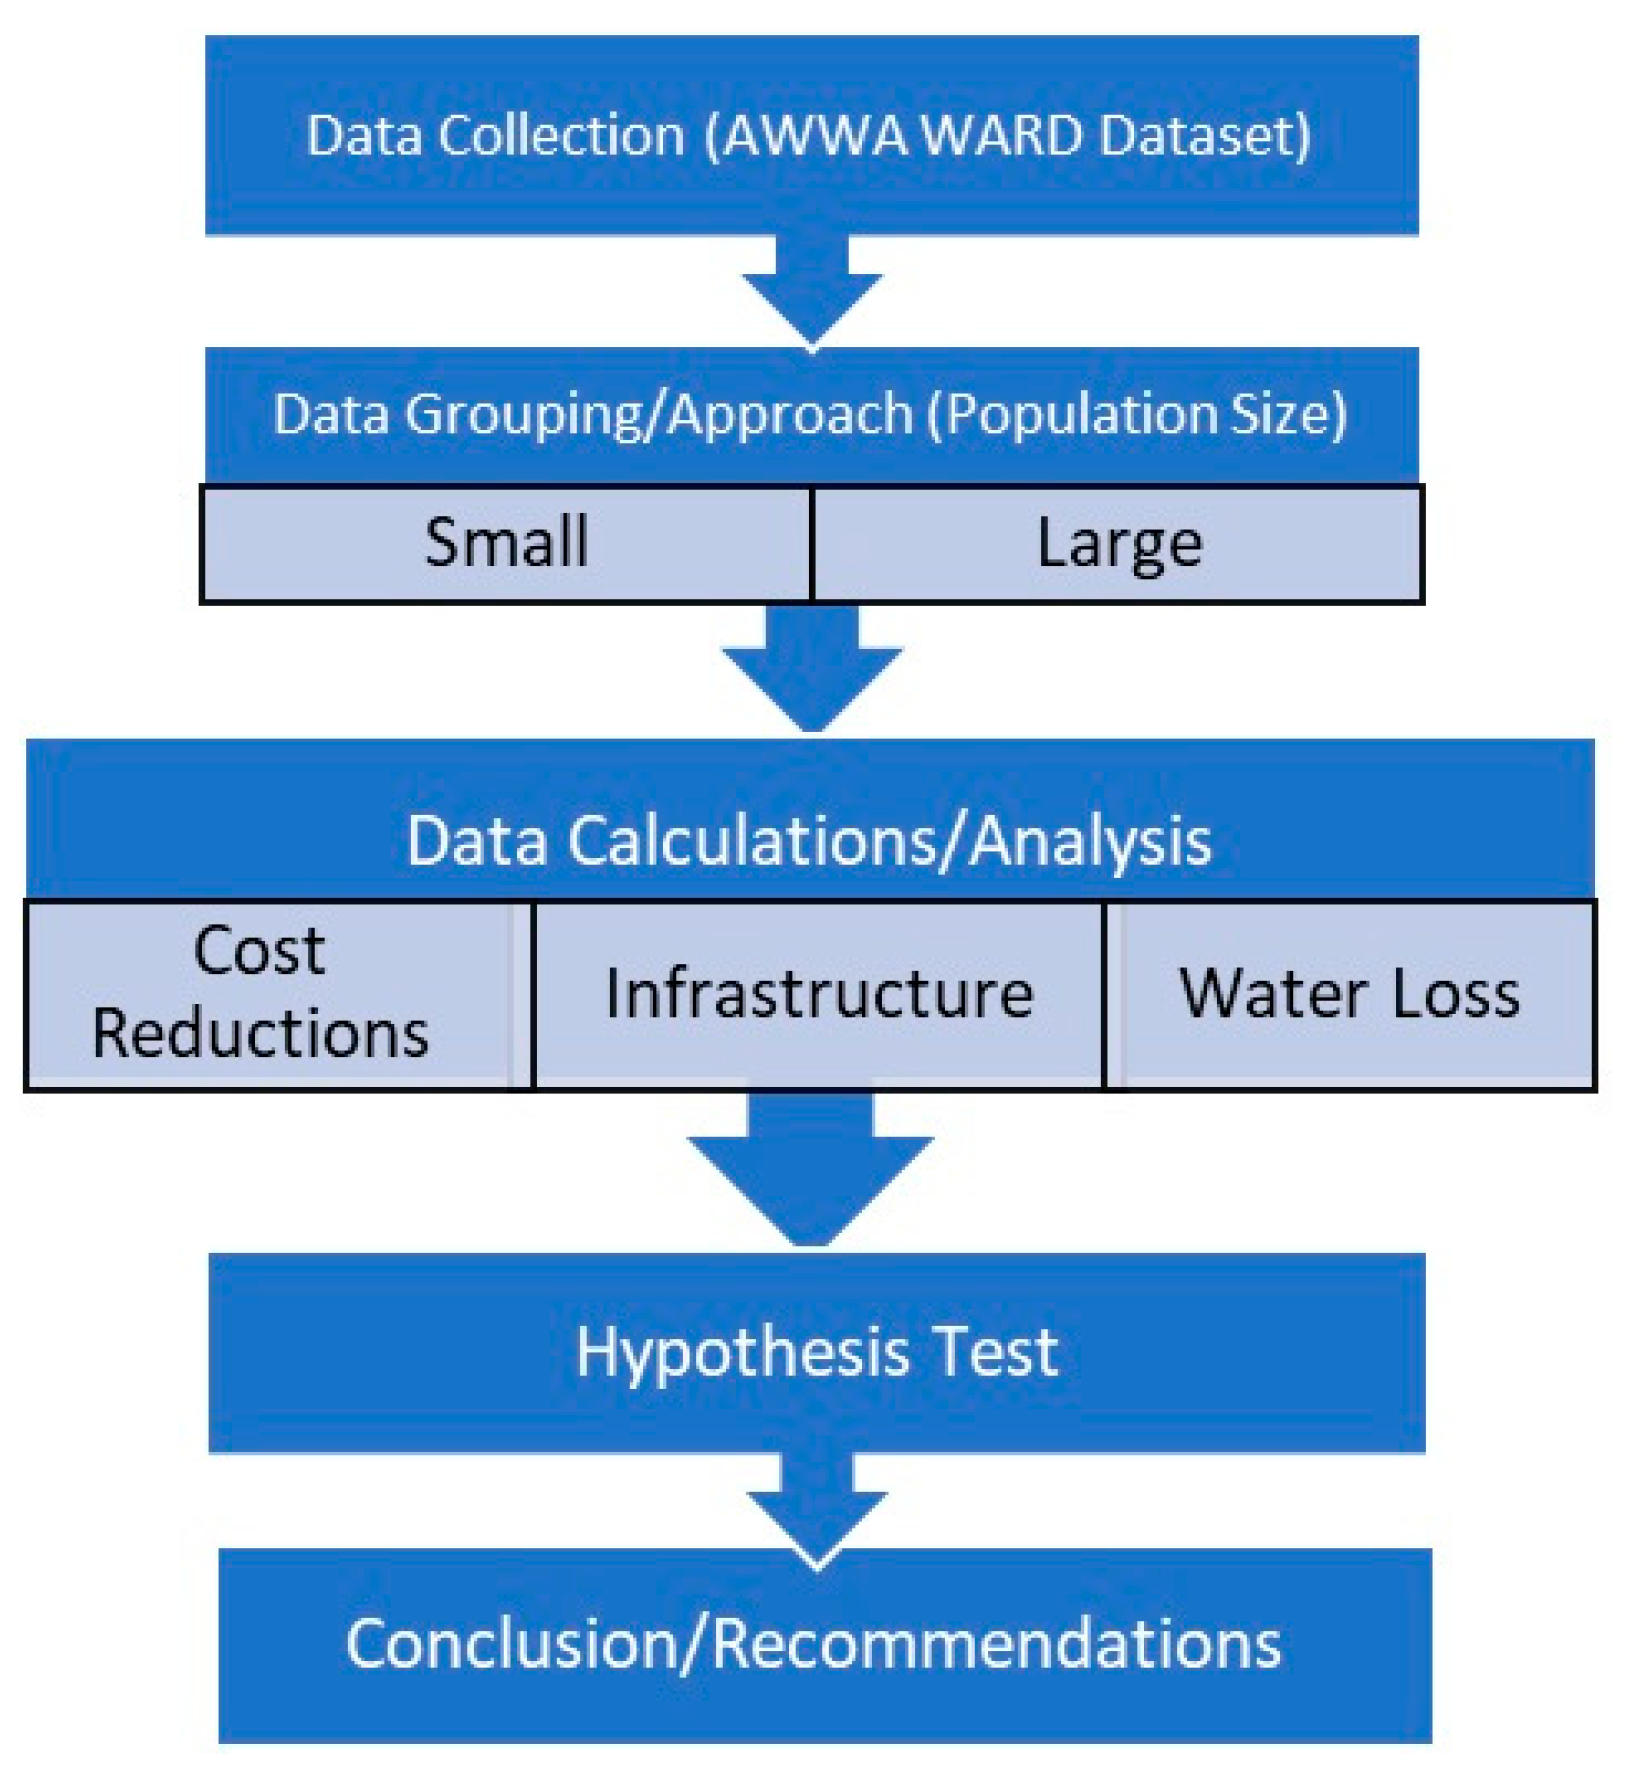
4. Methodological Approach
4.1. Area Served Quantification Data Structures and Treatment
- Identify and appropriately correct errors in data and the application of the methodology to ensure the reliability of the dataset for analysis.
- Evaluate and communicate uncertainty in water audit data inputs to eliminate possible data inconsistencies and ensure a reliable dataset.
- Completion of an Annual Water Loss Audit (due by March 1 annually to the GA EPD)
- Development and implementation of a Water Loss Control Program (effective July 2016)
- Development of individual goals to set measures of water supply efficiency
- Demonstration of progress toward improving water supply efficiency
4.1.1. Population Served Approach Using U.S. Census Data Guidelines
- Urbanized Areas (UAs)—built-up areas with a population of 50,000 or more; for classification purposes, we would call this the Large grouping.
- Urban Places Outside of UAs or Urban Clusters (UC)—a census-designated place (CDP) with at least 2500 inhabitants; for classification purposes, we would call this the Medium grouping.
- Rural Places and Territory—any incorporated place or CDP with fewer than 2500 inhabitants that is located outside of an Urbanized Area (UA); for classification purposes, we would call this the Small grouping.
4.1.2. Population Served Approach Using NCES Criteria
4.1.3. Population Served Approach Using U.S. EPA Guidelines
4.1.4. Population Groupings for Georgia and California
- State of Georgia, 198 total water utilities from the 2018 AWWA WARD dataset:
- Five under the three thousand three hundred in population were served (these water utilities have been removed from this analysis)
- There were 99 categorized as Small, but one was removed from analysis due to incomplete information, bringing the total Small utilities to 98.
- There were 94 categorized as Large
- State of California, 268 total water utilities from the 2018 AWWA WARD dataset:
- Two under the three thousand three hundred population were served (these water utilities have been removed from this analysis and do include 1 in which the population served data were not included in the original dataset but obtained directly through state data)
- There were 12 categorized as Small (includes 3 in which population served data were not included in the original dataset but obtained directly through state data)
- There were 254 categorized as Large (includes 30 in which population served data were not included in the original dataset but obtained directly through state data)
4.2. Evaluation of Key Water Loss Performance Indicators
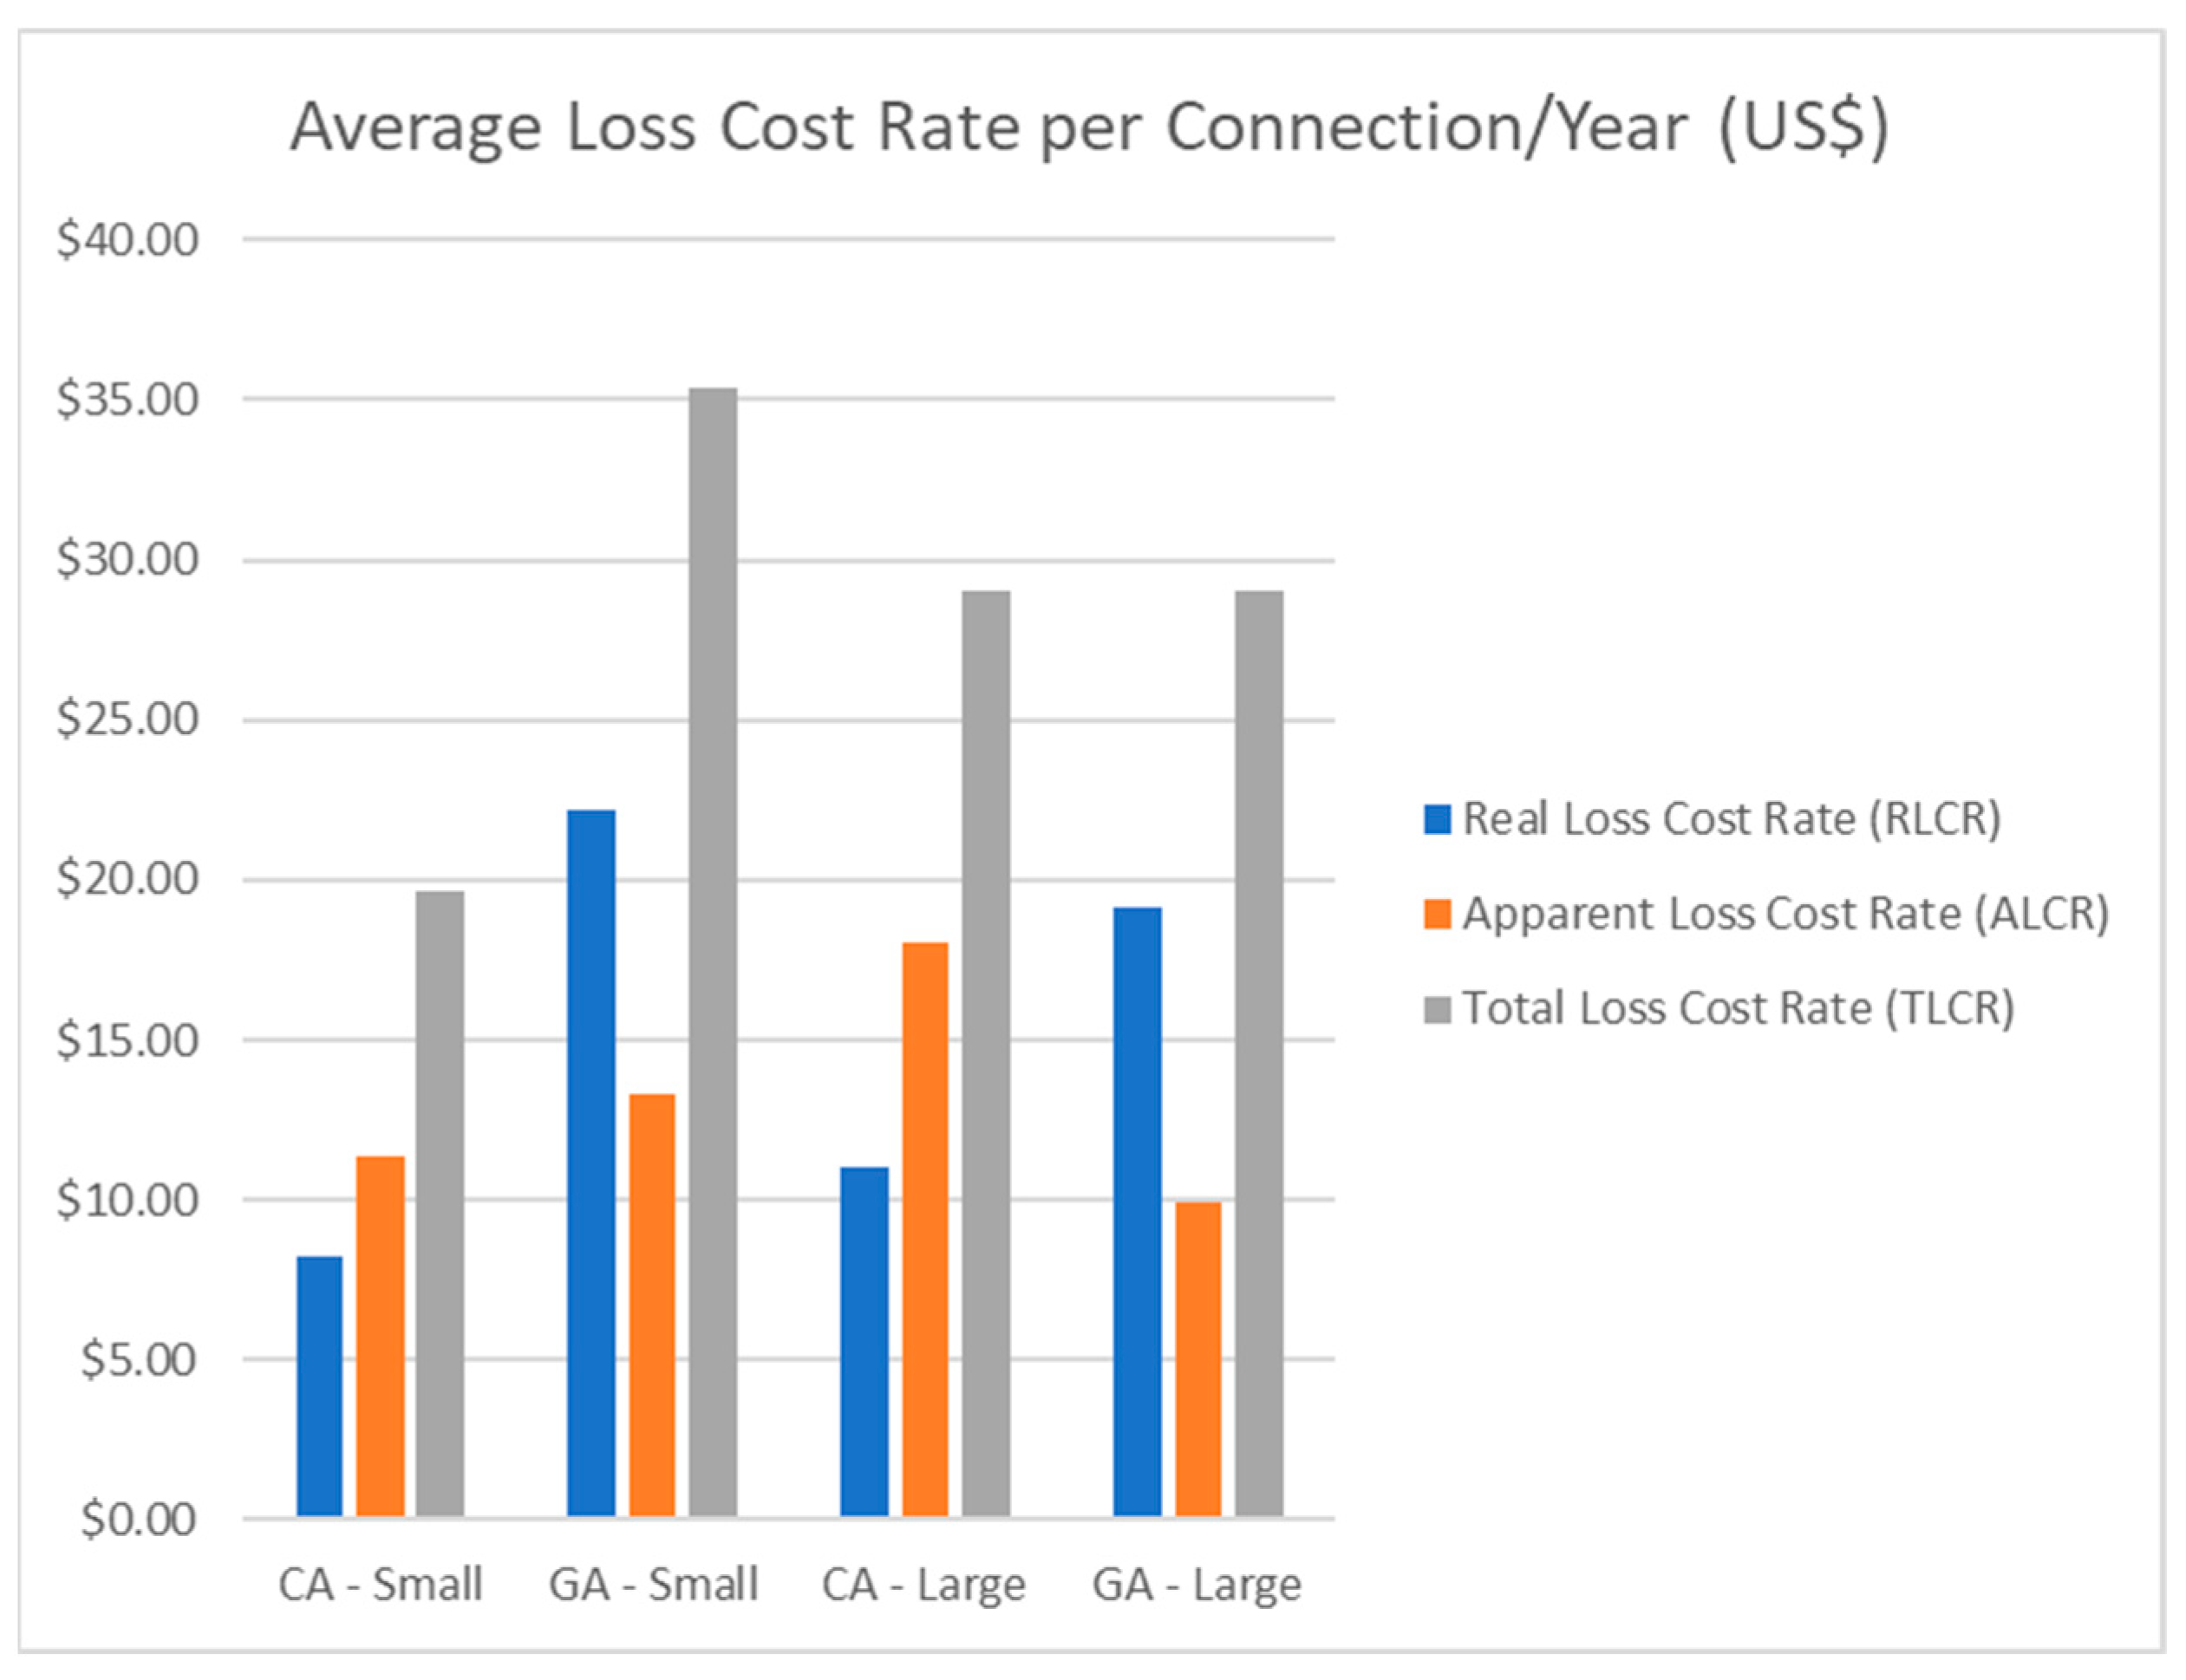
- TLCR: Total Loss Cost Rate (measured in USD per connection, per year); equates to the rate of total water loss, including Real and Apparent losses
- ALCR: Apparent Loss Cost Rate (measured in USD per connection, per year); apparent loss is water that is not physically lost but under-recorded [42]; examples include metering errors and inaccuracies
- RLCR: Real Loss Cost Rate (measured in USD per connection, per year); real losses include water that is physically lost [42]; examples include pipe leakage and water main failures
- ULR: Unit Total Losses (measured in gallons [1 gallon = 3.785 L] per connection, per day); equates to the total sum of Unit Real and Unit Apparent losses
- UAL: Unit Apparent Losses (measured in gallons [1 gallon = 3.785 L] per connection, per day); compromised of adding loss components of systematic data handling errors, customer metering inaccuracies (incorrect meter reading, difficulty of access to meters), and unauthorized consumption [34].
- URLA: Unit Real Losses A (measured in gallons [1 gallon = 3.785 L] per connection, per day); the difference between total water supplied to consumer and Authorized Consumption to customer, in gallons per connection [34]. For this analysis, the metric is best used when evaluating water leakage per connection.
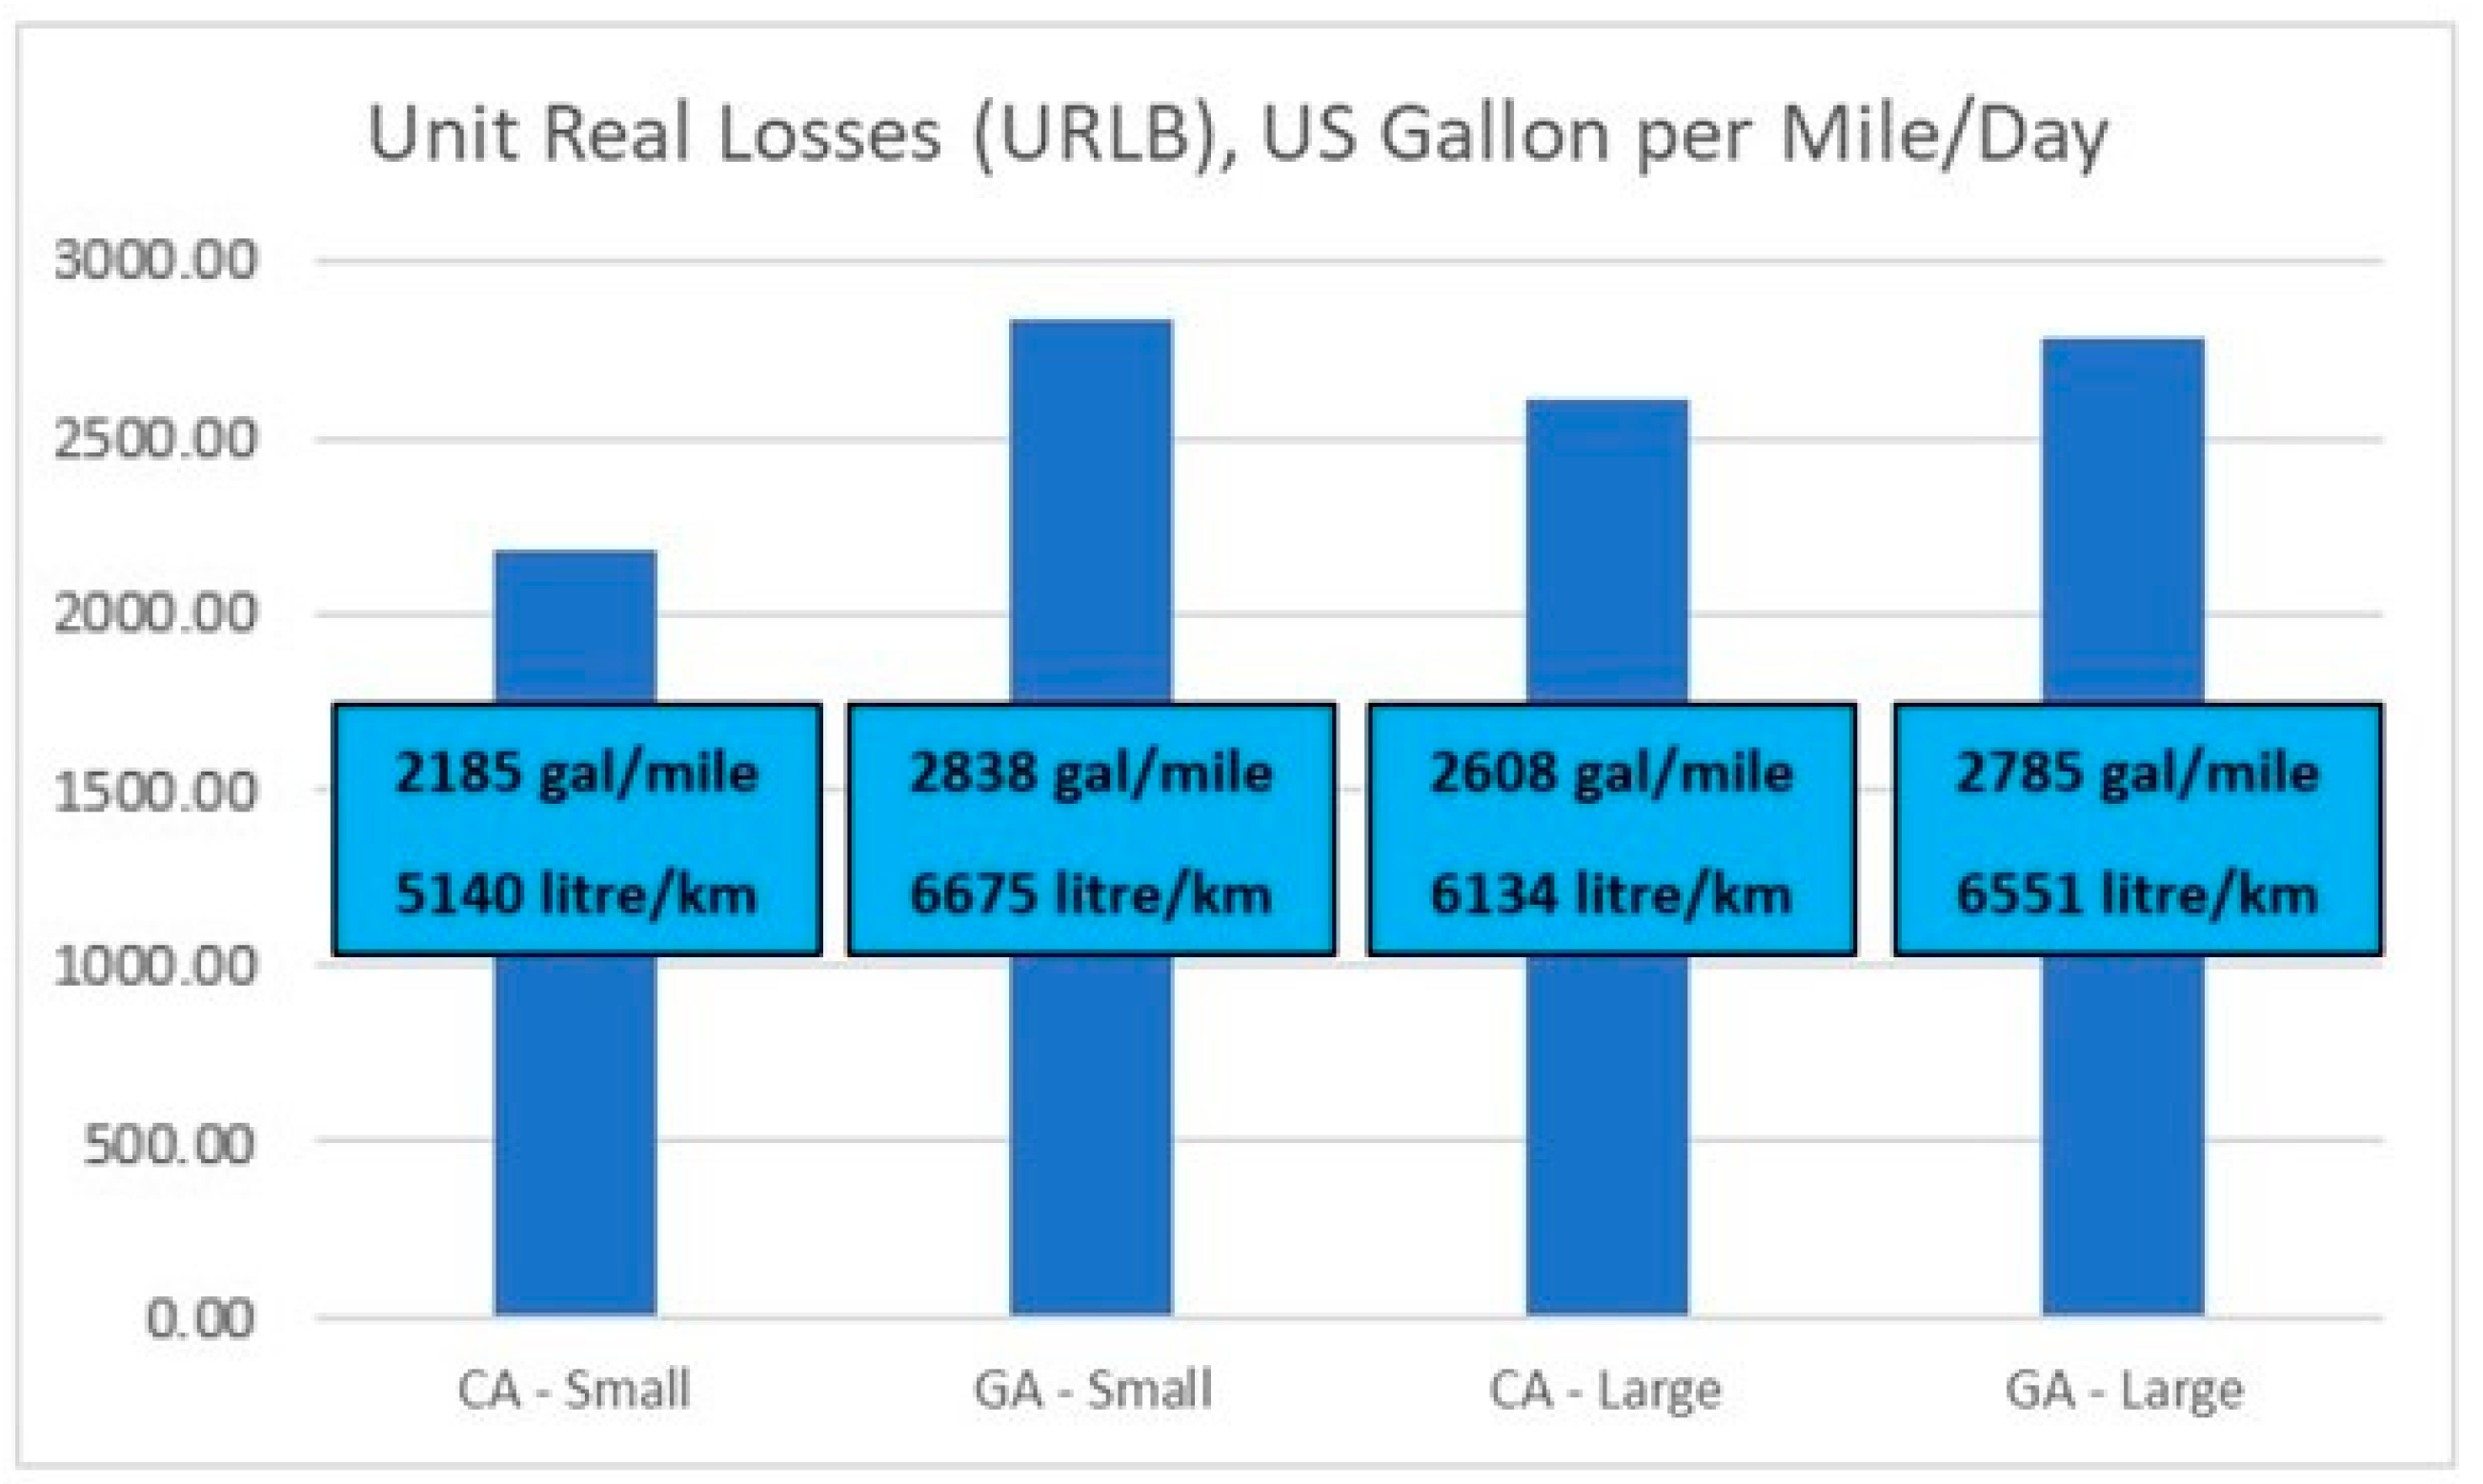
- URLB: Unit Real Losses B (measured in gallons [1 gallon = 3.785 L] per mile [1 mile = 1.609 km], per day); the difference between total water supplied to consumer and Authorized Consumption to customer, in gallons per mile [34]. For this analysis, the metric is used when measuring leakage over system distance.
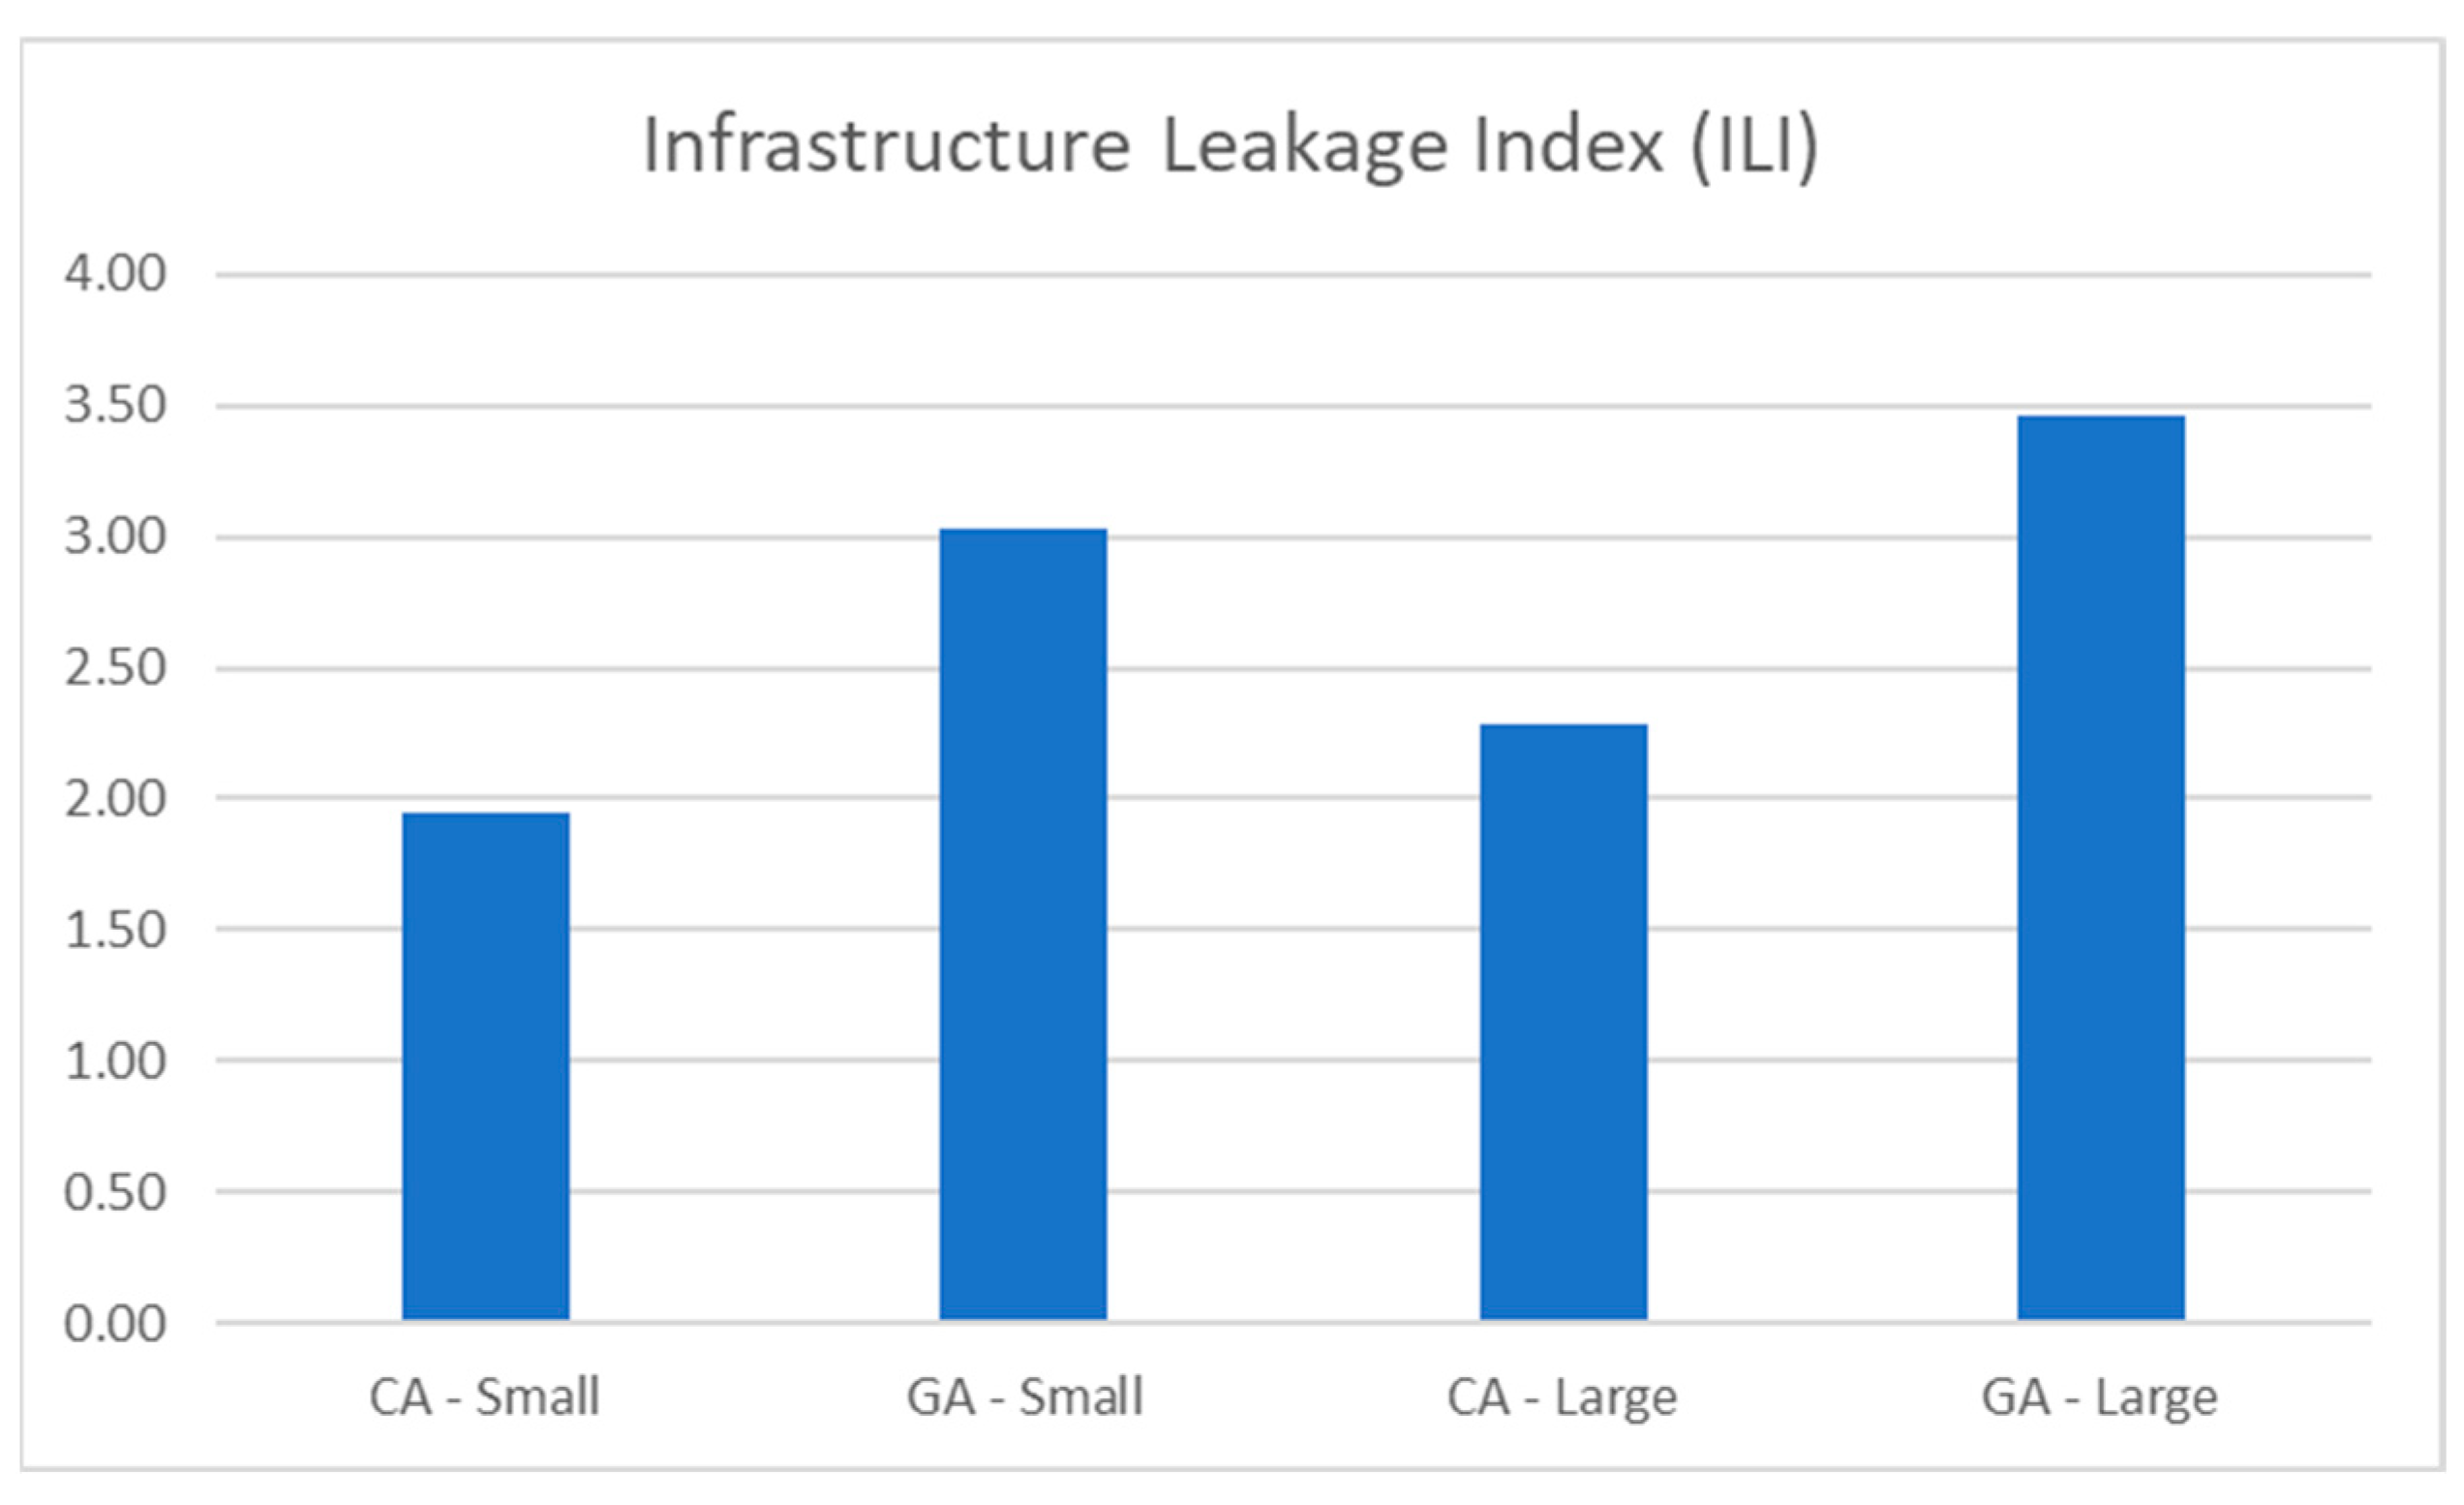
- ILI: Infrastructure Leakage Index (system performance indicator for comparisons of water leakage management used for benchmarking performance; this KPI is dimensionless); the difference between Current Annual Real Losses (CARL) and Unavoidable Real Loss (UARL) [34].
4.3. Evaluation of Water Supplied and Consumed
5. Data Analysis and Results
5.1. Water Loss Data
- CA—Small: between the 50 and 75th percentile
- GA—Small: above the 75th percentile
- CA—Large: between the 50 and 75th percentile
- GA—Large: above the 75th percentile
5.2. Data Analysis: Cost and Opportunity Evaluation
6. Conclusions
- The utilities analyzed provide rates to customers that do not sufficiently meet the financial needs for growth and improvement to the utility.
- The state of California has stricter water guidance in place, coupled with rates closer to what is being supplied to the customer and less water loss when compared to utilities in the state of Georgia; states are relying on outside funding for these projects or are unable to complete key projects due to lack of reasonable funding for the utility.
- An opportunity is presented to evaluate customer rate fairness based on the amount of water that is consumed by the customer when compared to other utilities.
Author Contributions
Funding
Data Availability Statement
Conflicts of Interest
References
- United States Environmental Protection Agency (EPA). EPA Control and Mitigation of Drinking Water Losses in Distribution Systems. EPA Office of Water (4606M), EPA 816-R-10-019; 2010. Available online: http://water.epa.gov/drink (accessed on 20 September 2021).
- American Water Works Association (AWWA). The State of Water Loss Control in Drinking Water Utilities; A White Paper from the American Water Works Association; AWWA: Denver, CO, USA, 2016. [Google Scholar]
- Horbatuck, K.; Burgess, R.; Beruvides, M. Water infrastructure sustainment via optimization: A systems approach. In 2018 American Society of Engineering Management (ASEM) Annual Conference Proceedings; American Society of Engineering Management: Coeur d’Alene, ID, USA, 2018. [Google Scholar]
- Rouse, M. Institutional Governance and Regulation of Water Services: The Essential Elements, 2nd ed.; Intl Water Assn, Publishing: New York, NY, USA, 2013. [Google Scholar]
- Bohan, G.; Horney, N. Pinpointing the real cost of quality in a service company. Natl. Product. Rev. 1991, 10, 309–317. [Google Scholar] [CrossRef]
- Fedler, C. Water Stewardship: A Sustainable Perspective for Agriculture. In Proceedings of the 2017 American Society of Agricultural and Biological Engineers (ASABE) Conference, Spokane, WA, USA, 16–19 July 2017. [Google Scholar] [CrossRef]
- Maya, A. Solving the Aging Infrastructure Problem. WaterWorld, 2018. Available online: https://www.waterworld.com/drinking-water/distribution/article/16190115/solving-the-aging-infrastructure-problem/ (accessed on 12 September 2019).
- American Society of Civil Engineers (ASCE). 2017 Infrastructure Report Card. 2017. Available online: https://www.infrastructurereportcard.org/ (accessed on 12 September 2019).
- WaterWorld. U.S. Infrastructure Gets near Failing Grade in New ASCE Report. WaterWorld, 2017. Available online: https://www.waterworld.com/drinking-water/article/16223567/us-infrastructure-gets-near-failing-grade-in-new-asce-report/ (accessed on 12 September 2019).
- Water Research Foundation (WRF). Project Number 5057, Level 1 Water Audit Validation Guidance Manual, 2nd ed.; Sturm, R., Stief, C., Jernigan, W., Blackwell, D., Eds.; The Water Research Foundation: Alexandria, VA, USA, 2021. [Google Scholar]
- American Water Works Association (AWWA). AWWA Water Loss Control Committee Water Audit Reference Datasheet (WARD), published 30 March 2021. 2021. Available online: https://www.awwa.org/Resources-Tools/Resource-Topics/Water-Loss-Control/Free-Water-Audit-Software (accessed on 22 August 2021).
- Young, J. Troubled Utilities: Seeing the Way Forward. J. AWWA 2023, 115, 24–29. [Google Scholar] [CrossRef]
- Banasik, M.; Beruvides, M. A case study of the costs of quality: Water utilities. Eng. Manag. J. 2012, 24, 3–14. [Google Scholar] [CrossRef]
- Honey-Rosés, J.; Pareja, C. Metrics and methods for comparing water utility rate structures. Water Econ. Policy 2019, 5, 1850018-1–1850018-12. [Google Scholar] [CrossRef]
- Duffy, D.P. Non-Revenue Water Loss: Its Causes and Cures; WaterWorld Published 26 May 2016. , 2016. Available online: https://www.waterworld.com/home/article/14070145/nonrevenue-water-loss-its-causes-and-cures (accessed on 30 April 2022).
- Sink, S.; Tuttle, T. Planning and Measurement in Your Organization of the Future; Industrial Engineering and Management Press: Boca Raton, FL, USA, 1989. [Google Scholar]
- Sandoval-Chavez, D.; Beruvides, M. Using Opportunity Costs to Determine the Cost of Quality: A Case Study in a Continuous-Process Industry. Eng. Econ. 1998, 43, 107–124. [Google Scholar] [CrossRef]
- Horbatuck, K.; Beruvides, M. Isomorphic analysis within commons infrastructure systems for commonality and optimization. In 2019 IISE Annual Conference Proceedings; Institute of Industrial and Systems Engineers: Orlando, FL, USA, 2019. [Google Scholar]
- Water Research Foundation (WRF). Project Number 4695, Guidance on Implementing an Effective Water Loss Control Plan; Trachtman, B., Cooper, J., Sriboonlue, S., Wyatt, A., Davis, S., Kunkel, G., Jr., Eds.; The Water Research Foundation: Alexandria, VA, USA, 2019. [Google Scholar]
- Moore, C. ‘We Can Modernize Them’: City of Warner Robins Awarded $11M for Water and Sewer Upgrades. 13 WMAZ-TV News. Published 24 February 2022. 2022. Available online: https://www.13wmaz.com/article/news/local/city-of-warner-robins-awarded-11m-for-water-and-sewer-upgrades-2/93-39db89c1-14bd-4680-bb70-f7b70d240783 (accessed on 30 April 2022).
- Associated Press. Georgia City Struggling to Repair Hundreds of Water Leaks. Pub. 30 August 2021. 2021. Available online: https://www.usnews.com/news/best-states/georgia/articles/2021-08-30/georgia-city-struggling-to-repair-hundreds-of-water-leaks (accessed on 30 April 2022).
- Ding, J. Think You Can Cheat Water Restrictions? This Tiny Disk Will Tame the Thirstiest Water Hogs. Los Angeles Times Published 7 June 2022. , 2022. Available online: https://www.latimes.com/environment/story/2022-06-07/this-drought-device-stops-water-hogs-in-their-soggy-tracks (accessed on 6 August 2022).
- Rivera, R. Aging Water Infrastructure Threatens Drinking Water Quality. 2018. Available online: https://diamondsci.com/blog/aging-water-infrastructure-causes-water-quality-issues/ (accessed on 12 November 2019).
- Parnaby, J. A systems approach to engineering organisation. Ind. Manag. Data Syst. 1991, 91, 8–16. [Google Scholar] [CrossRef]
- Burgess, R.; Horbatuck, K.; Beruvides, M. From mosaic to systemic redux: The conceptual foundation of resilience and its operational implications for water resource management. Systems 2019, 7, 32. [Google Scholar] [CrossRef]
- Hernandez-Uddameri, A.; Uddameri, V. Environmental Literacy Workshop; Texas Tech University Llano River Field Station: Junction, TX, USA, 2014. [Google Scholar]
- Deming, W.; Orsini, J. Chapter 7: Management is Prediction (Statistical Thinking Is Required). In The Essential Deming: Leadership Principles from the Father of Quality; McGraw-Hill: New York, NY, USA, 2013. [Google Scholar]
- Rao, S. Engineering Optimization: Theory and Practice, 4th ed.; John Wiley and Sons: Hoboken, NJ, USA, 2009; p. 550. [Google Scholar] [CrossRef]
- Deming, W.E. The New Economics for Industry, Government, Education, 2nd ed.; The MIT Press: Cambridge, MA, USA, 1994. [Google Scholar]
- Lawson, E.; Farmani, R.; Woodley, E.; Butler, D. A resilient and sustainable water sector: Barriers to the operationalisation of resilience. Sustainability 2020, 12, 1797. [Google Scholar] [CrossRef]
- Cyr-Gagnon, J.; Rodriguez, M. Optimizing data management for municipal source water protection. Land Use Policy 2021, 100, 103788. [Google Scholar] [CrossRef]
- Strager, M.; Fletcher, J.; Strager, J.; Yuill, C.; Eli, R.; Petty, J.; Lamont, S. Watershed analysis with GIS: The watershed characterization and modeling system software application. Comput. Geosci. 2010, 36, 970–976. [Google Scholar] [CrossRef]
- Choi, J.; Engel, B.; Farnsworth, R. Web-based GIS and spatial decision support system for watershed management. J. Hydroinformatics 2005, 7, 165–174. [Google Scholar] [CrossRef]
- Kunkel, G., Jr. Water Audits and Loss Control Programs, Manual of Water Supply Practices—M36, 4th ed.; American Water Works Association (AWWA): Denver, CO, USA, 2016; pp. 18, 21, 74–75, 91, 293–295. [Google Scholar]
- Georgia Environmental Protection Division (GA EPD). Georgia Water Stewardship Act of 2010, Georgia Senate Bill 370. Available online: https://epd.georgia.gov/document/document/georgia-water-stewardship-act/download/ (accessed on 17 June 2021).
- Andrews, L.; Gasner, K.; Sturm, R.; Kunkel, G.; Jernigan, W.; Cavanaugh, S. Level 1 Water Audit Validation: Guidance Manual (Project 4639A); Water Research Foundation: Denver, CO, USA, 2016. [Google Scholar]
- Andrews, L.; Gasner, K.; Sturm, R.; Kunkel, G.; Jernigan, W.; Cavanaugh, S. Utility Water Audit Validation: Principles and Programs (Project 4639B); Water Research Foundation: Denver, CO, USA, 2017. [Google Scholar]
- United States Census Bureau. U.S. Census Urban and Rural Classification and Urban Area Criteria. 2 December 2019. Available online: https://www.census.gov/programs-surveys/geography/guidance/geo-areas/urban-rural/2010-urban-rural.html (accessed on 18 September 2021).
- United States Census Bureau. United States Census Bureau—Glossary. Dated 26 September 2018. Available online: https://www.census.gov/programs-surveys/soma/about/glossary.html (accessed on 18 September 2021).
- National Center for Education Statistics (NCES). NCES Locale Classifications and Criteria. 2021. Available online: https://nces.ed.gov/programs/edge/docs/locale_classifications.pdf (accessed on 3 September 2021).
- United States Environmental Protection Agency (EPA). Building the Capacity of Drinking Water Systems—Learn about Capacity Development. 2021. Available online: https://www.epa.gov/dwcapacity/learn-about-capacity-development (accessed on 18 September 2021).
- American Water Works Association (AWWA). Key Performance Indicators for Non-Revenue Water—AWWA Water Loss Control Committee Report. Published November 2019. Available online: https://www.awwa.org/Portals/0/AWWA/ETS/Resources/WLCCKPIReport%202019.pdf?ver=2019-11-20-094638-933 (accessed on 20 June 2021).
- Makaya, E. Performance Based Water Loss Management for Gweru, Zimbabwe. Am. J. Water Resour. 2017, 5, 100–105. [Google Scholar] [CrossRef]
- Lambert, A.; Brown, T.; Takizawa, M.; Weimer, D. A review of performance indicators for real losses from water supply systems. Aqua-J. Water Serv. Res. Technol. 1999, 48, 227–237. [Google Scholar] [CrossRef]
- California Department of Water Resources (DWR). The California Water System. 2022. Available online: https://water.ca.gov/water-basics/the-california-water-system (accessed on 30 April 2022).
- Bundy, F. How Much Does It Cost to Install a Water Meter? Published 19 September 2021. Available online: https://howmuchly.com/water-meter-installation-cost (accessed on 30 April 2022).


| Improvement | Detail |
|---|---|
| Capture Leak/Break Occurrence and Frequency | Document break-in lines and note leaks upon occurrence; inform and prioritize leak detection crews to address them. |
| Measure Response Time | Document time for maintaining or fixing a leak repair. |
| Real-Time Field Data | Capture field data of water-using activities outside the utility, including fire hydrant flushing, service line installation, seasonal reservoir drainage, etc. |
| Municipal Use Measurements | Track water consumed as part of firefighting, street cleaning, and other uses from municipal departments. |
| Area of Influence | Definition |
|---|---|
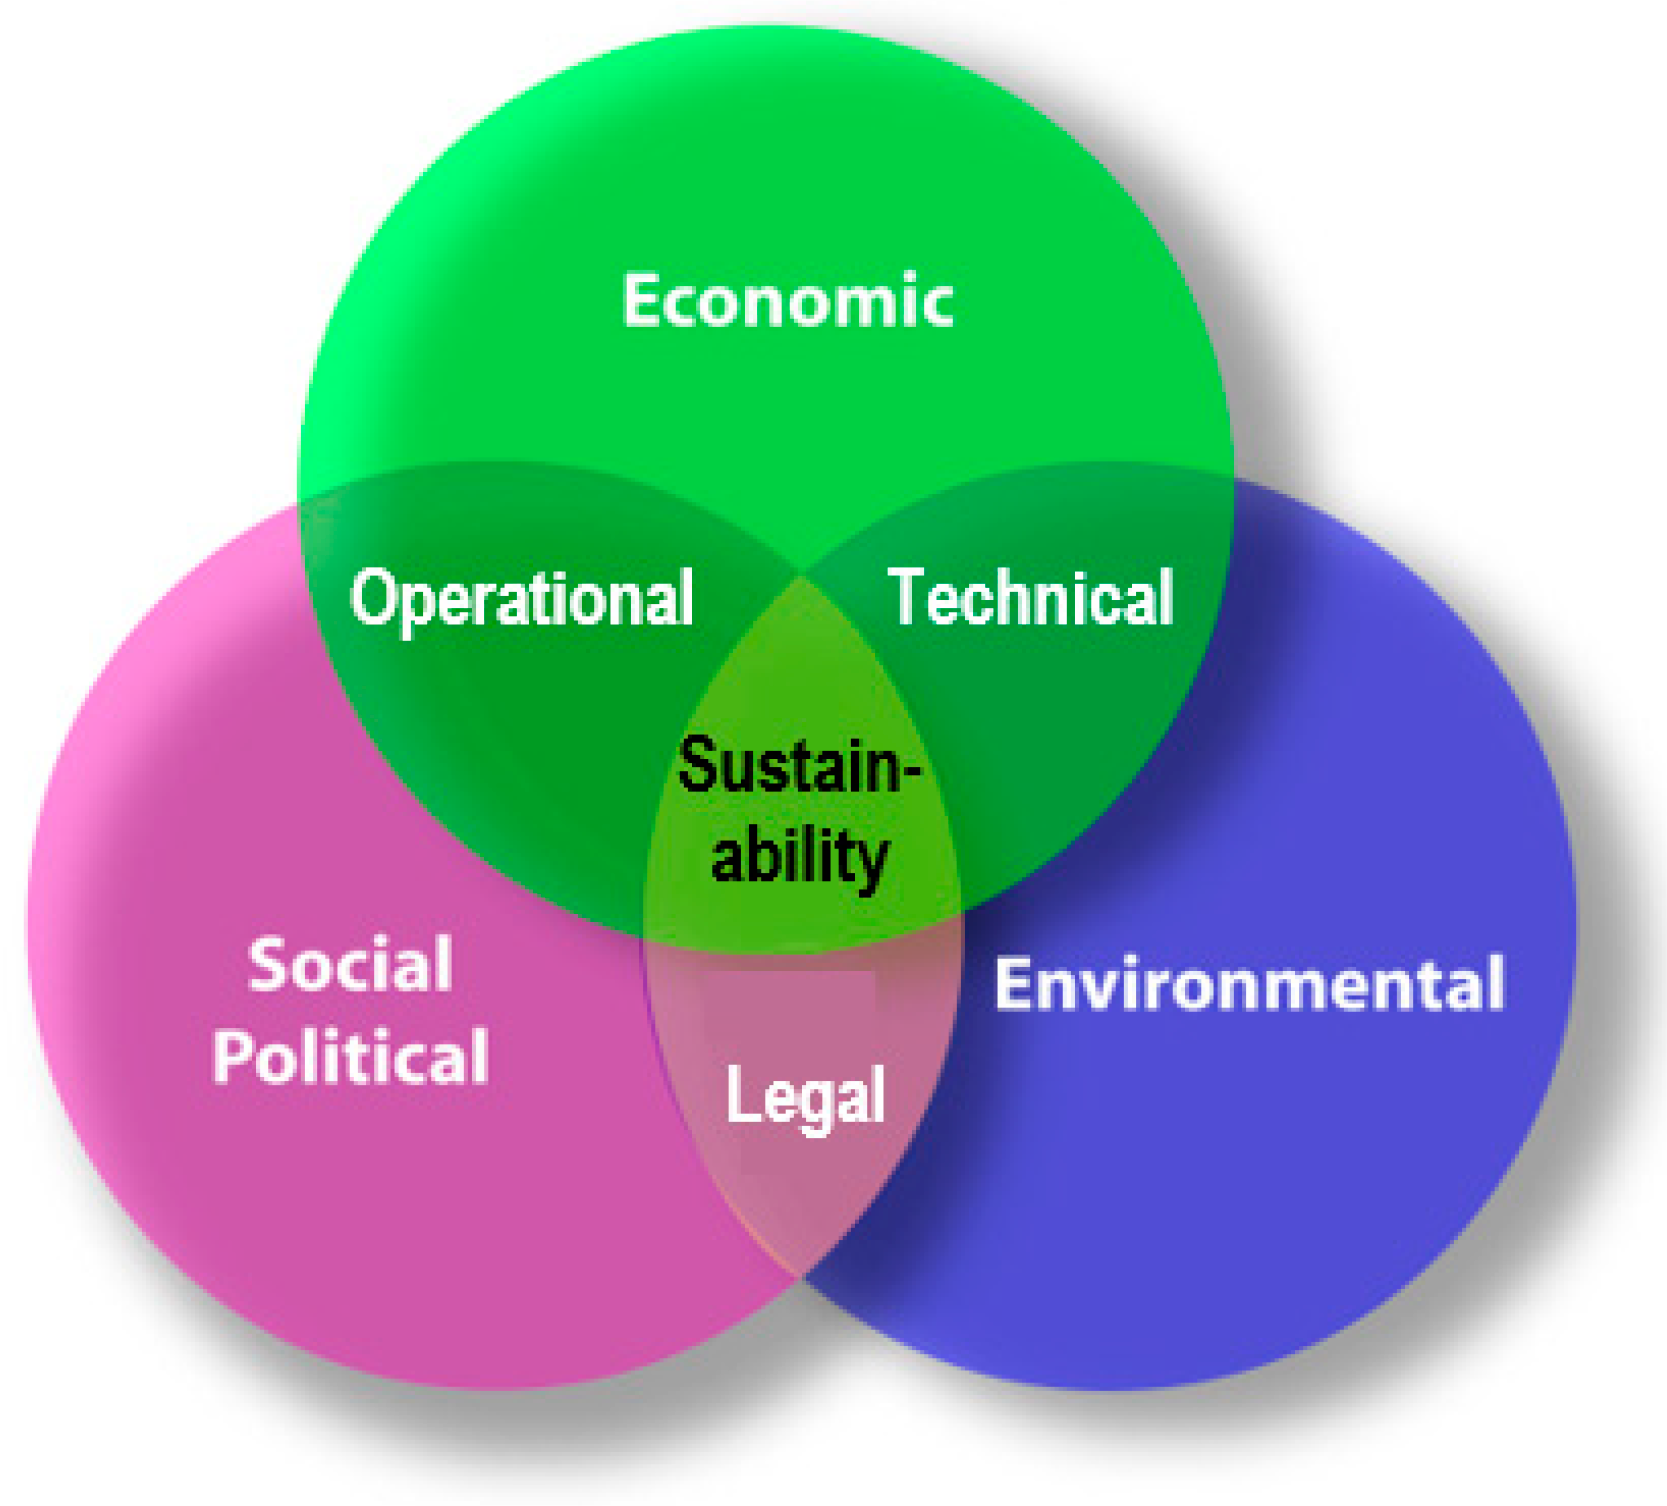
| Economic | Water Utility System, including the Quality of Product, Cost Control and Revenues, and Environmental Stewardship |
| Social Political | Various Customers and Stakeholders, including perceived Affordability of Service, Quality and Quantity Service, Economic Viability, and Environmental Protection |
| Environmental | Regulatory Requirements, including Water Resource Management, Public Health, Affordability, and Rate of Return to Utility |
| Grouping | Definition |
|---|---|
| City—Large | Territory inside a UA, inside a PC, and a population of 250,000 or more |
| City—Midsize | Territory inside a UA and PC with a population less than 250,000 and greater than or equal to 100,000. |
| City—Small | Territory inside a UA, inside a PC with a population less than 100,000. |
| Suburban—Large | Territory outside a PC, inside a UA, with a population of 250,000 or more. |
| Suburban—Midsize | Territory outside a PC, inside a UA with a population less than 250,000 and greater than or equal to 100,000. |
| Suburban—Small | Territory outside a PC, inside a UA, with a population less than 100,000. |
| Town—Fringe | Territory inside a UC less than or equal to 10 miles from a UA. |
| Town—Distant | Territory inside a UC more than 10 miles and less than or equal to 35 miles from a UA. |
| Town—Remote | Territory inside a UC more than 35 miles from a UA. |
| Rural—Fringe | Census-defined rural territory less than or equal to 5 miles from a UA and rural territory less than or equal to 2.5 miles from a UC. |
| Rural—Distant | Census-defined rural territory more than 5 miles but less than or equal to 25 miles from a UA, as well as rural territory more than 2.5 miles but less than or equal to 10 miles from a UC. |
| Rural—Remote | Census-defined rural territory more than 25 miles from a UA and also more than 10 miles from a UC. |
| Small | Large | |
|---|---|---|
| California | 7981 | 104,912 |
| Georgia | 5758 | 72,939 |
| Water Loss Compared to Water Supplied | |
|---|---|
| CA—Small | 14.58% |
| CA—Large | 8.92% |
| GA—Small | 38.58% |
| GA—Large | 20.62% |
| Average Charge Difference—Water Billed vs. Water Supplied | |
|---|---|
| CA—Small | 15.70% |
| CA—Large | 9.84% |
| GA—Small | 43.97% |
| GA—Large | 23.99% |
Disclaimer/Publisher’s Note: The statements, opinions and data contained in all publications are solely those of the individual author(s) and contributor(s) and not of MDPI and/or the editor(s). MDPI and/or the editor(s) disclaim responsibility for any injury to people or property resulting from any ideas, methods, instructions or products referred to in the content. |
© 2024 by the authors. Licensee MDPI, Basel, Switzerland. This article is an open access article distributed under the terms and conditions of the Creative Commons Attribution (CC BY) license (https://creativecommons.org/licenses/by/4.0/).
Share and Cite
Horbatuck, K.H.; Beruvides, M.G. Water Infrastructure System Leakage Analysis: Evaluation of Factors Impacting System Performance and Opportunity Cost. Water 2024, 16, 1080. https://doi.org/10.3390/w16081080
Horbatuck KH, Beruvides MG. Water Infrastructure System Leakage Analysis: Evaluation of Factors Impacting System Performance and Opportunity Cost. Water. 2024; 16(8):1080. https://doi.org/10.3390/w16081080
Chicago/Turabian StyleHorbatuck, Keith H., and Mario G. Beruvides. 2024. "Water Infrastructure System Leakage Analysis: Evaluation of Factors Impacting System Performance and Opportunity Cost" Water 16, no. 8: 1080. https://doi.org/10.3390/w16081080
APA StyleHorbatuck, K. H., & Beruvides, M. G. (2024). Water Infrastructure System Leakage Analysis: Evaluation of Factors Impacting System Performance and Opportunity Cost. Water, 16(8), 1080. https://doi.org/10.3390/w16081080