Abstract
Urban areas produce large amounts of stormwater runoff due to vast areas of impervious surfaces. Stormwater inlets, or catch basins, are commonly used for collecting and directing stormwater runoff away from streets and sidewalks. The conveyances used to direct flow to surface waters may be part of a municipal separate storm sewer systems (MS4s). Typically, MS4s redirect runoff without providing a means for removing harmful pollutants. These pollutants are then often discharged directly into local lakes, rivers, and streams, potentially harming native aquatic ecosystems. Post-construction stormwater practices are commonly used to treat runoff from urban areas by reducing the total runoff volume, lowering peak flow rates, and/or removing harmful pollutants from runoff. However, some post construction stormwater practices require large footprints, construction, and maintenance. Catch basin inserts (CBIs) are one type of post-construction best management practice that are installed within existing catch basins and require no additional land use while still providing a means for removing pollutants from stormwater runoff before entering the MS4. However, limited data is available to demonstrate the expected performance of various CBIs to ensure that these practices meet the pollutant removal standards set forth by the US Environmental Protection Agency (USEPA). The objective of this study was to evaluate the sediment removal capabilities of eight different proprietary CBI products for potential use as a post-construction stormwater practice for Department of Transportation projects. Results indicate that only two basket-type CBIs met the 80% sediment retention benchmark established for the study. While not surpassing the benchmark, three bag-type CBIs did achieve more than 70% sediment retention. The remaining three CBIs (one basket-type, one bag-type, and one cartridge type) fell notably short of the performance benchmark.
1. Introduction
Stormwater runoff from roadways suspends and transports sediment, trash and debris, oils, gas and other hydrocarbons, and other chemicals from the roadway surface, which are often conveyed into municipal separate storm sewer systems (MS4s). These pollutants are eventually discharged into local water bodies, harming the native aquatic ecosystems. For this reason, stormwater discharges are regulated through the U.S. Environmental Protection Agency’s (USEPA) National Pollutant Discharge Elimination System (NPDES) [1]. The NPDES requires municipal MS4 operators to comply with certain water quality standards before discharging stormwater into local waterbodies.
Discharged pollutants from non-point sources (NPS) harm waterbodies and are detrimental to the environment [2]. A National Rivers and Streams Assessment study performed by the USEPA estimated that 46% of accessed rivers and streams in the United States are in poor biological condition due to pollution [3]. The Nationwide Urban Runoff Program (NURP) assessed stormwater runoff quality from 28 major metropolitan areas and verified urban runoff as a detriment to overall water quality [4]. The USEPA regulates effluent discharges conveyed by municipalities through the NPDES Phase II MS4 General Permit to ensure compliance with water quality standards before discharging into the local environment [1].
Most municipalities and Departments of Transportation (DOTs) have developed stormwater management guidelines that are intended to improve the water quality of stormwater runoff from DOT projects to stay in compliance with local, state, and USEPA regulations [5]. One such regulation states that alternative best management practices (BMPs) must have a minimum total suspended solids (TSS) removal efficiency of 80% [6,7]. The Ohio DOT has a comprehensive postconstruction management plan, including the use of numerous BMPs, including catch basin inserts (CBIs) [8]. CBIs are pre-manufactured systems that are designed to be installed within an existing stormwater inlet or catch basin, providing treatment to stormwater runoff before entering the MS4. As opposed to most other forms of post-construction BMPs (i.e., detention and retention ponds, drainage swales, etc.), CBIs require no additional land use, making them advantageous to projects where space is limited.
2. Objective
The main objective of this research effort was to examine the sediment removal effectiveness of eight proprietary CBI products readily accessible on the market. The primary goal in assessing sediment removal efficiency was to identify CBI products capable of retaining a minimum of 80% of the suspended sediment that enters the stormwater inlet.
3. Background
A literature review was conducted to gain a further understanding of the work that has been performed in evaluating the sediment removal capabilities of CBIs. Of the studies collected during the review process, most were field studies involving the installation of products at field sites and monitoring performance over time. The purpose of this study was not to evaluate the field performance of CBIs but to use large-scale laboratory testing procedures to analyze performance in a controlled setting. Therefore, the literature review was focused on collecting previous studies that used laboratory testing methods to evaluate CBIs.
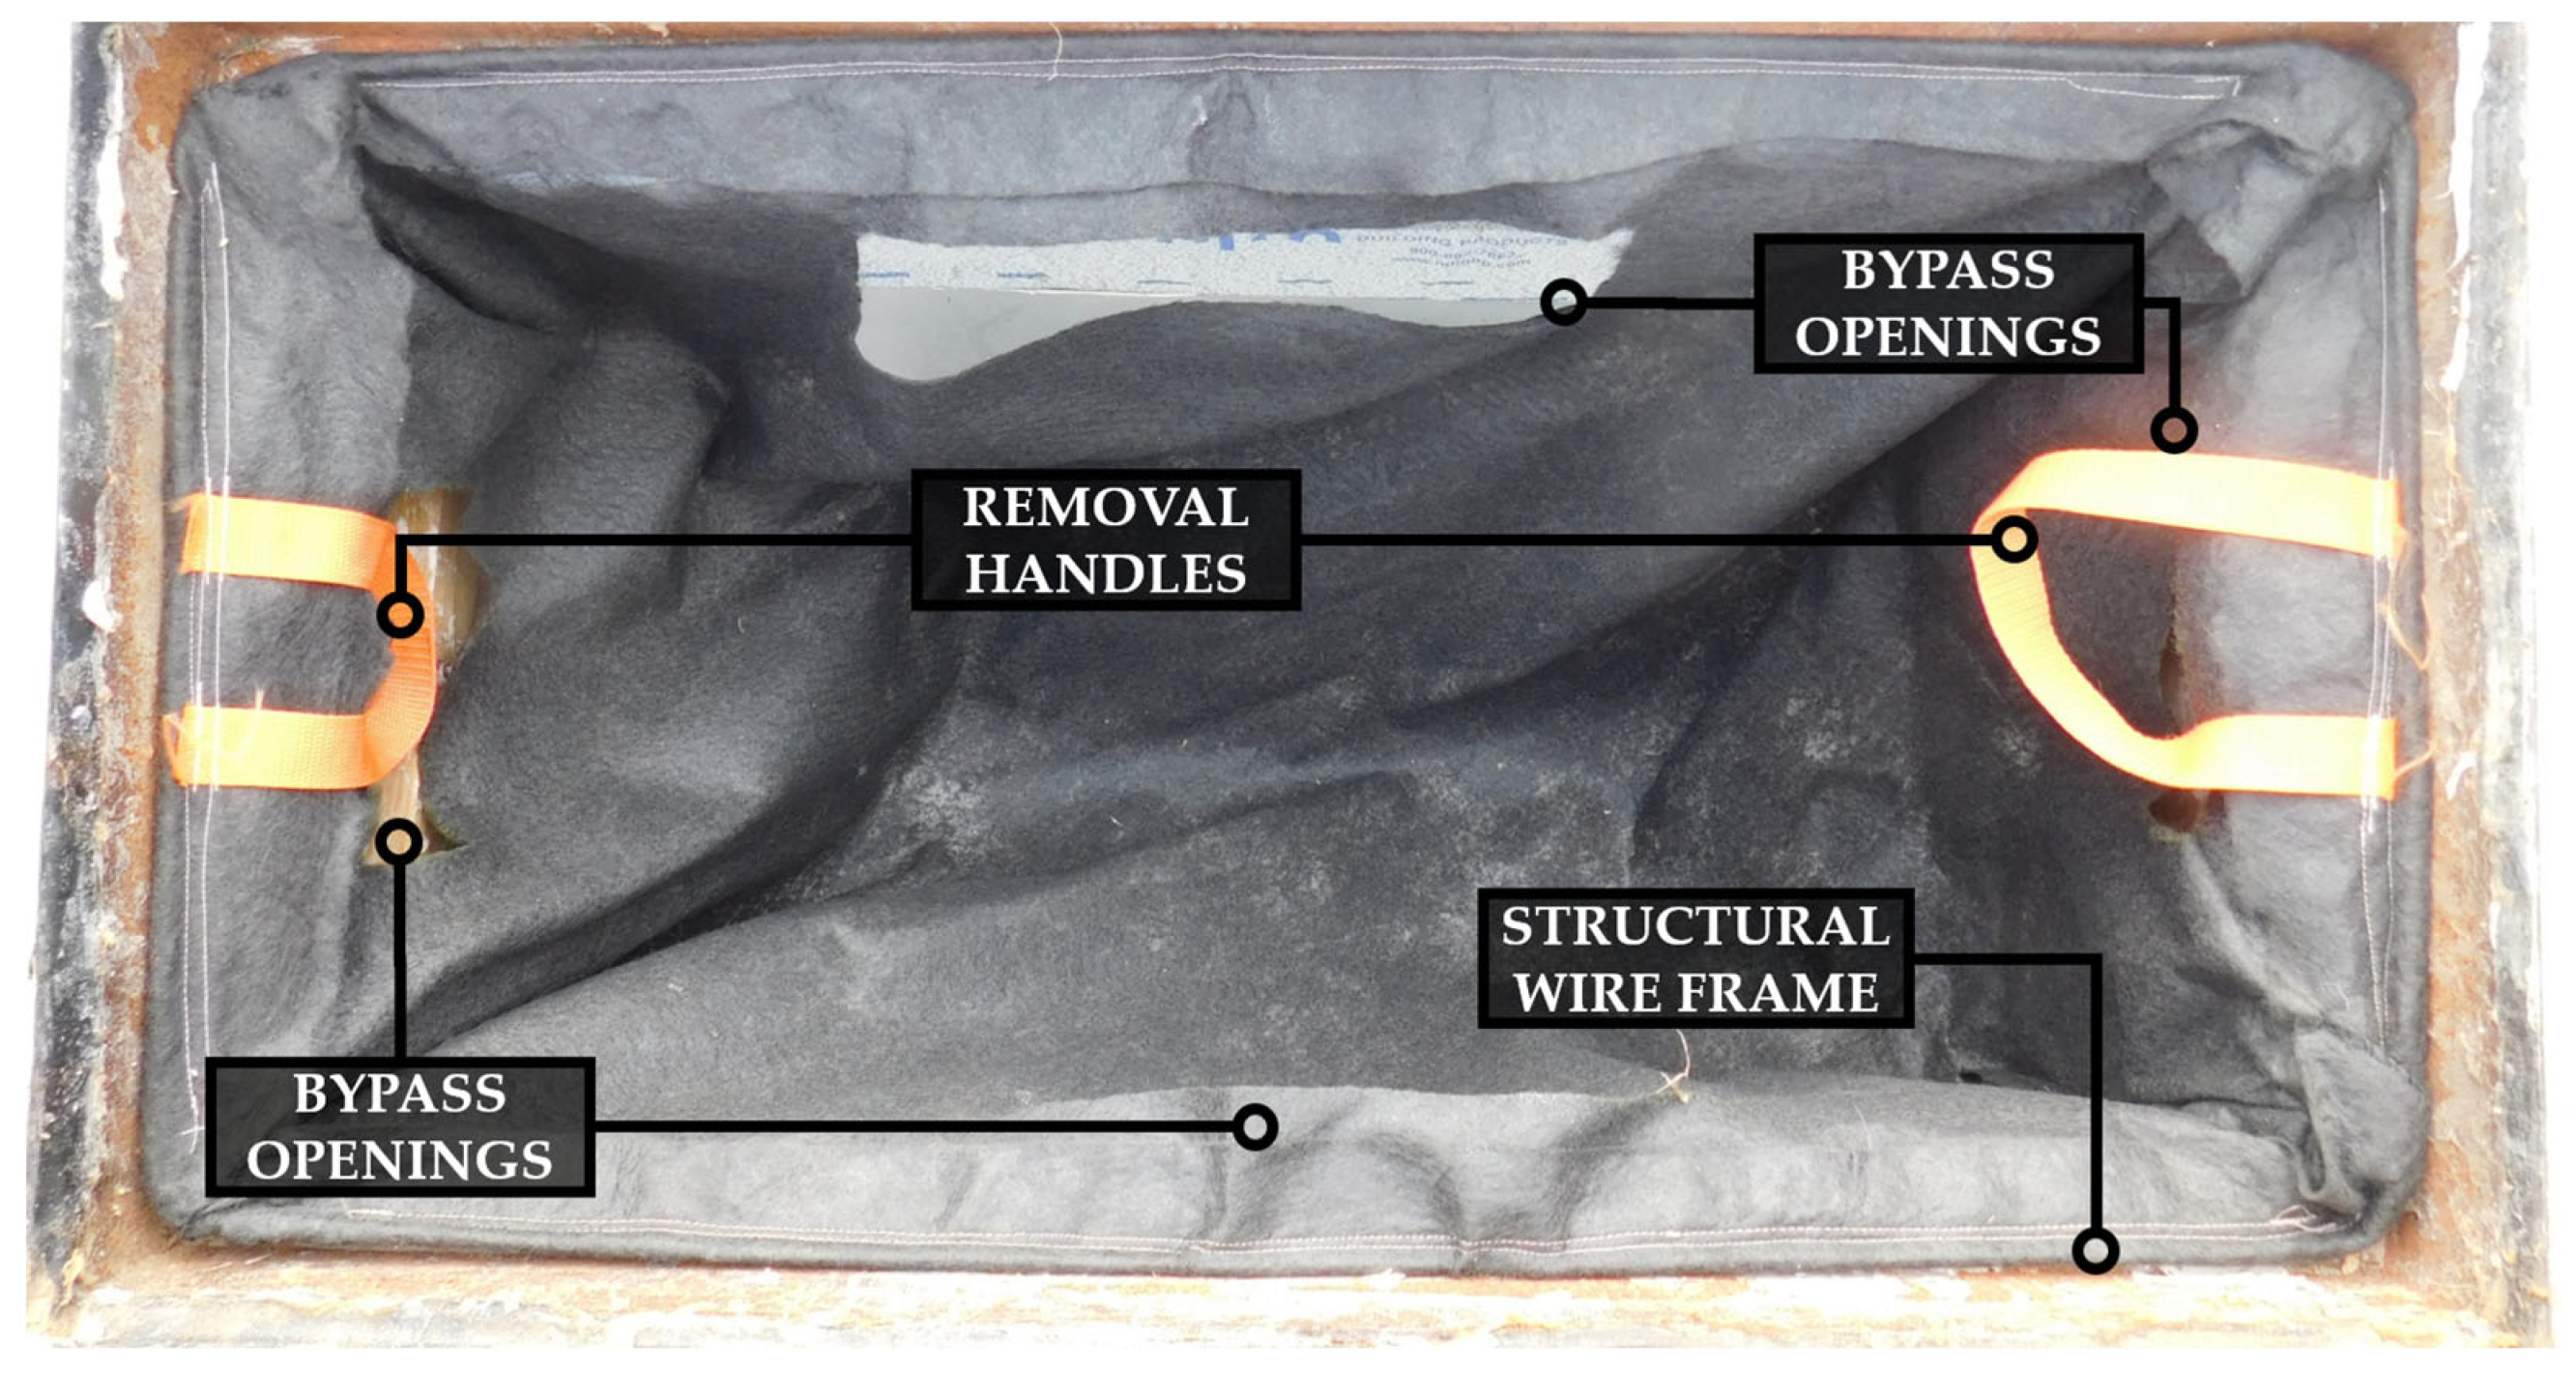
Several studies have been conducted to evaluate the performance of a variety of proprietary CBIs using flow rates ranging from 1.1 to 34.0 L/s (0.04 to 1.2 ft3/s) and sediment concentrations ranging from 30 to 300 mg/L (0.004 to 0.040 oz/gal) [9,10,11,12,13]. These studies reported TSS removal efficiencies ranging from 10 to 91% for the CBIs tested. Table 1 provides an overview of the results obtained from testing CBI TSS removal efficiency for several laboratory studies that were reviewed. TSS removal efficiencies varied greatly in some of these studies because of the differences in influent flow rates and TSS concentrations. CBIs were tested for a duration of 30 min for two of the studies, but the durations for the remaining three studies were unknown. CBIs treat stormwater most effectively at lower influent flow rates and TSS concentrations, while higher influent flow rates and TSS concentrations can cause CBIs to become clogged with sediment, forcing influent to flow through the bypass mechanism of the CBI. As the influent flows through the bypass, polluted stormwater enters the conveyance system untreated, minimizing the TSS removal efficiency of the CBI. Figure 1 illustrates key design features of a generic bag-type CBI.

Table 1.
Summary of previous laboratory CBI testing studies.
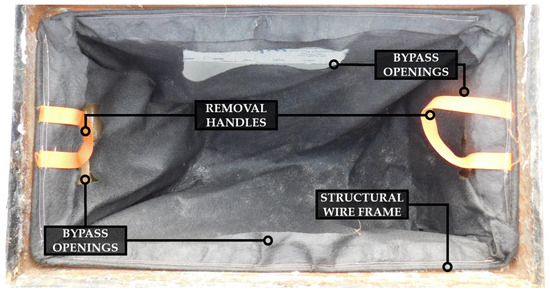
Figure 1.
Basic design of a bag-type CBI installed within a typical catch basin.
4. Materials and Method
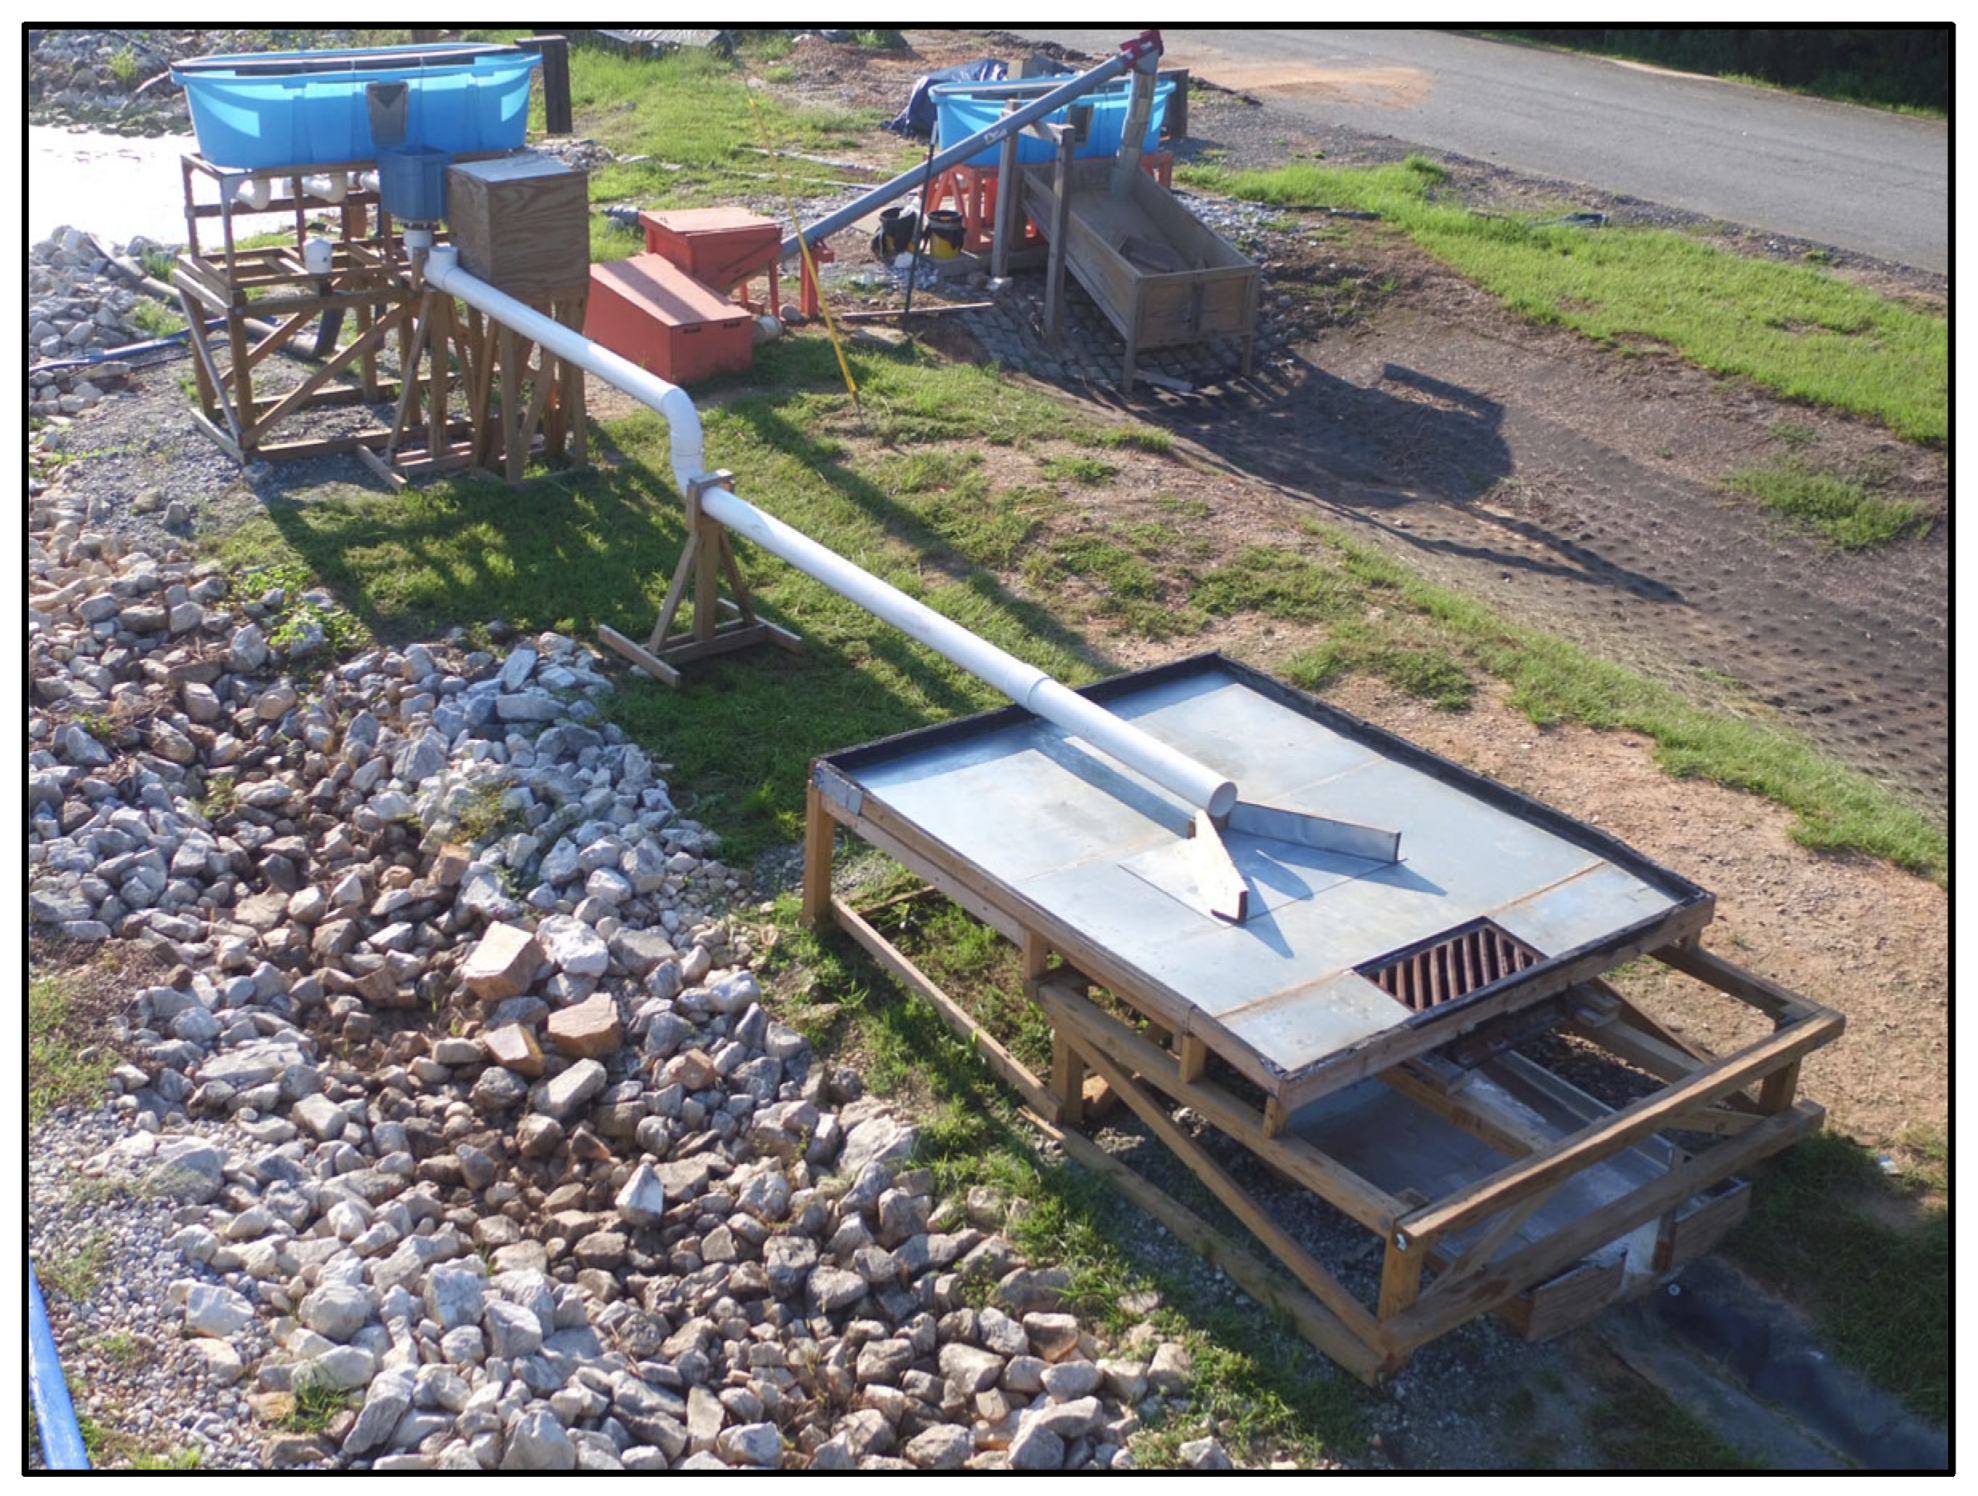
Tests were conducted using a large-scale testing apparatus located at the Auburn University-Stormwater Research Facility (AU-SRF) designed for evaluating the sediment removal capabilities of CBIs, as shown in Figure 2. The apparatus is comprised of a flow introduction system, a sediment introduction system, a conveyance structure, and a catch basin drainage platform. Flow introduction was achieved by pumping water from the onsite supply pond to an equilibrium tank (i.e., blue tank). Discharge valves were used to regulate water depth within the equilibrium tank, which was equipped with a v-notch discharge weir that was correlated to various flow rates. Sediment was introduced using a programmed mechanical feeder housed in a wooden box. Flow and sediment entered the conveyance structure (i.e., pipe), where mixing occurred prior to discharge onto the catch basin drainage platform. Once discharged, sediment-laden flow entered the catch basin grate that was fitted with a CBI. In total, eight CBIs were evaluated during this study to evaluate their sediment removal efficiency. Sediment-laden effluent passing through/over the CBI was captured on a collection platform directly under the catch basin grate.

Figure 2.
CBI testing apparatus.
A variety of ASTM standard test methods and existing large-scale test methodologies were reviewed as part of this study to identify contributing factors (i.e., contributing drainage area, flow rates, sediment loads, runoff sampling methods, etc.) that needed to be considered during testing [13,14,15,16,17,18,19,20]. This aided in the development of a standard test method to evaluate the performance of CBIs using large-scale testing methods. Additional details pertaining to the design and construction of the testing apparatus, as well as the developed testing protocol for large-scale testing of CBIs, are outlined in Basham et al. [21].
The design of the apparatus was based on the Ohio DOT Location & Design Manual, Volume Two stormwater management design requirements and the standard size [8]. CBI testing was divided into two phases: (1) performance evaluation testing and (2) longevity testing. During performance evaluation testing, CBIs were tested at three different influent flow rates of 1.7, 3.4, and 5.1 L/s (0.06, 0.12, and 0.18 ft3/s) for 70 min, representative of drainage areas of 0.04, 0.08, and 0.12 ha (0.1, 0.2, and 0.3 acres). CBIs were also tested using two different soil types: an OK110 silica sand gradation introduced at a target concentration of 450 mg/L (0.028 lb./ft3) and a sandy loam introduced at a target concentration of 185 mg/L (0.012 lb./ft3). Originally, CBIs were tested with OK110 silica sand under sheet flow conditions. However, after these tests were completed, flow introduction methods were modified to discharge flow directly into the catch basin. The intent of the direct discharge method is to minimize flow bypass, as some CBIs could not provide a proper seal within the catch basin and allowed flow to run under or around the product instead of through it. All CBIs were then tested with both soil types under the direct discharge testing method, in which the sediment-laden influent flowed directly into the catch basin.
CBIs were evaluated for sediment retention percentage and reduction in TSS. While the Ohio EPA regulates an 80% reduction in TSS, it was determined that, for the purposes of this study, sediment retention would be a more accurate method of quantifying pollutant removal. Sediment retention was determined by dividing the total sediment retained over the course of a test by the total amount of sediment introduced throughout the test. TSS reduction was determined by taking upstream and downstream 1.0 L (0.0353 ft3) grab samples at five-minute intervals, which were analyzed in a laboratory. New and clean CBIs were used for each performance evaluation test conducted.
Longevity testing consisted of consecutive tests performed on an installed CBI and were conducted using each soil type at a low flow rate. The low flow rate was chosen because the performance evaluation testing phase of the project showed little potential for most of the CBIs to achieve 80% retention at higher flow rates. Sediment retention percentage was calculated for each individual test as well as cumulatively across all longevity tests. The longevity testing cycle continued until it was determined that a CBI was no longer capable of reaching the 80% sediment retention percentage during an individual test event or until the CBI failed structurally. The longevity testing methodology provides a representative understanding of the number of storm events a CBI can effectively treat runoff until maintenance or removal in the field is required while still satisfying water quality standards.
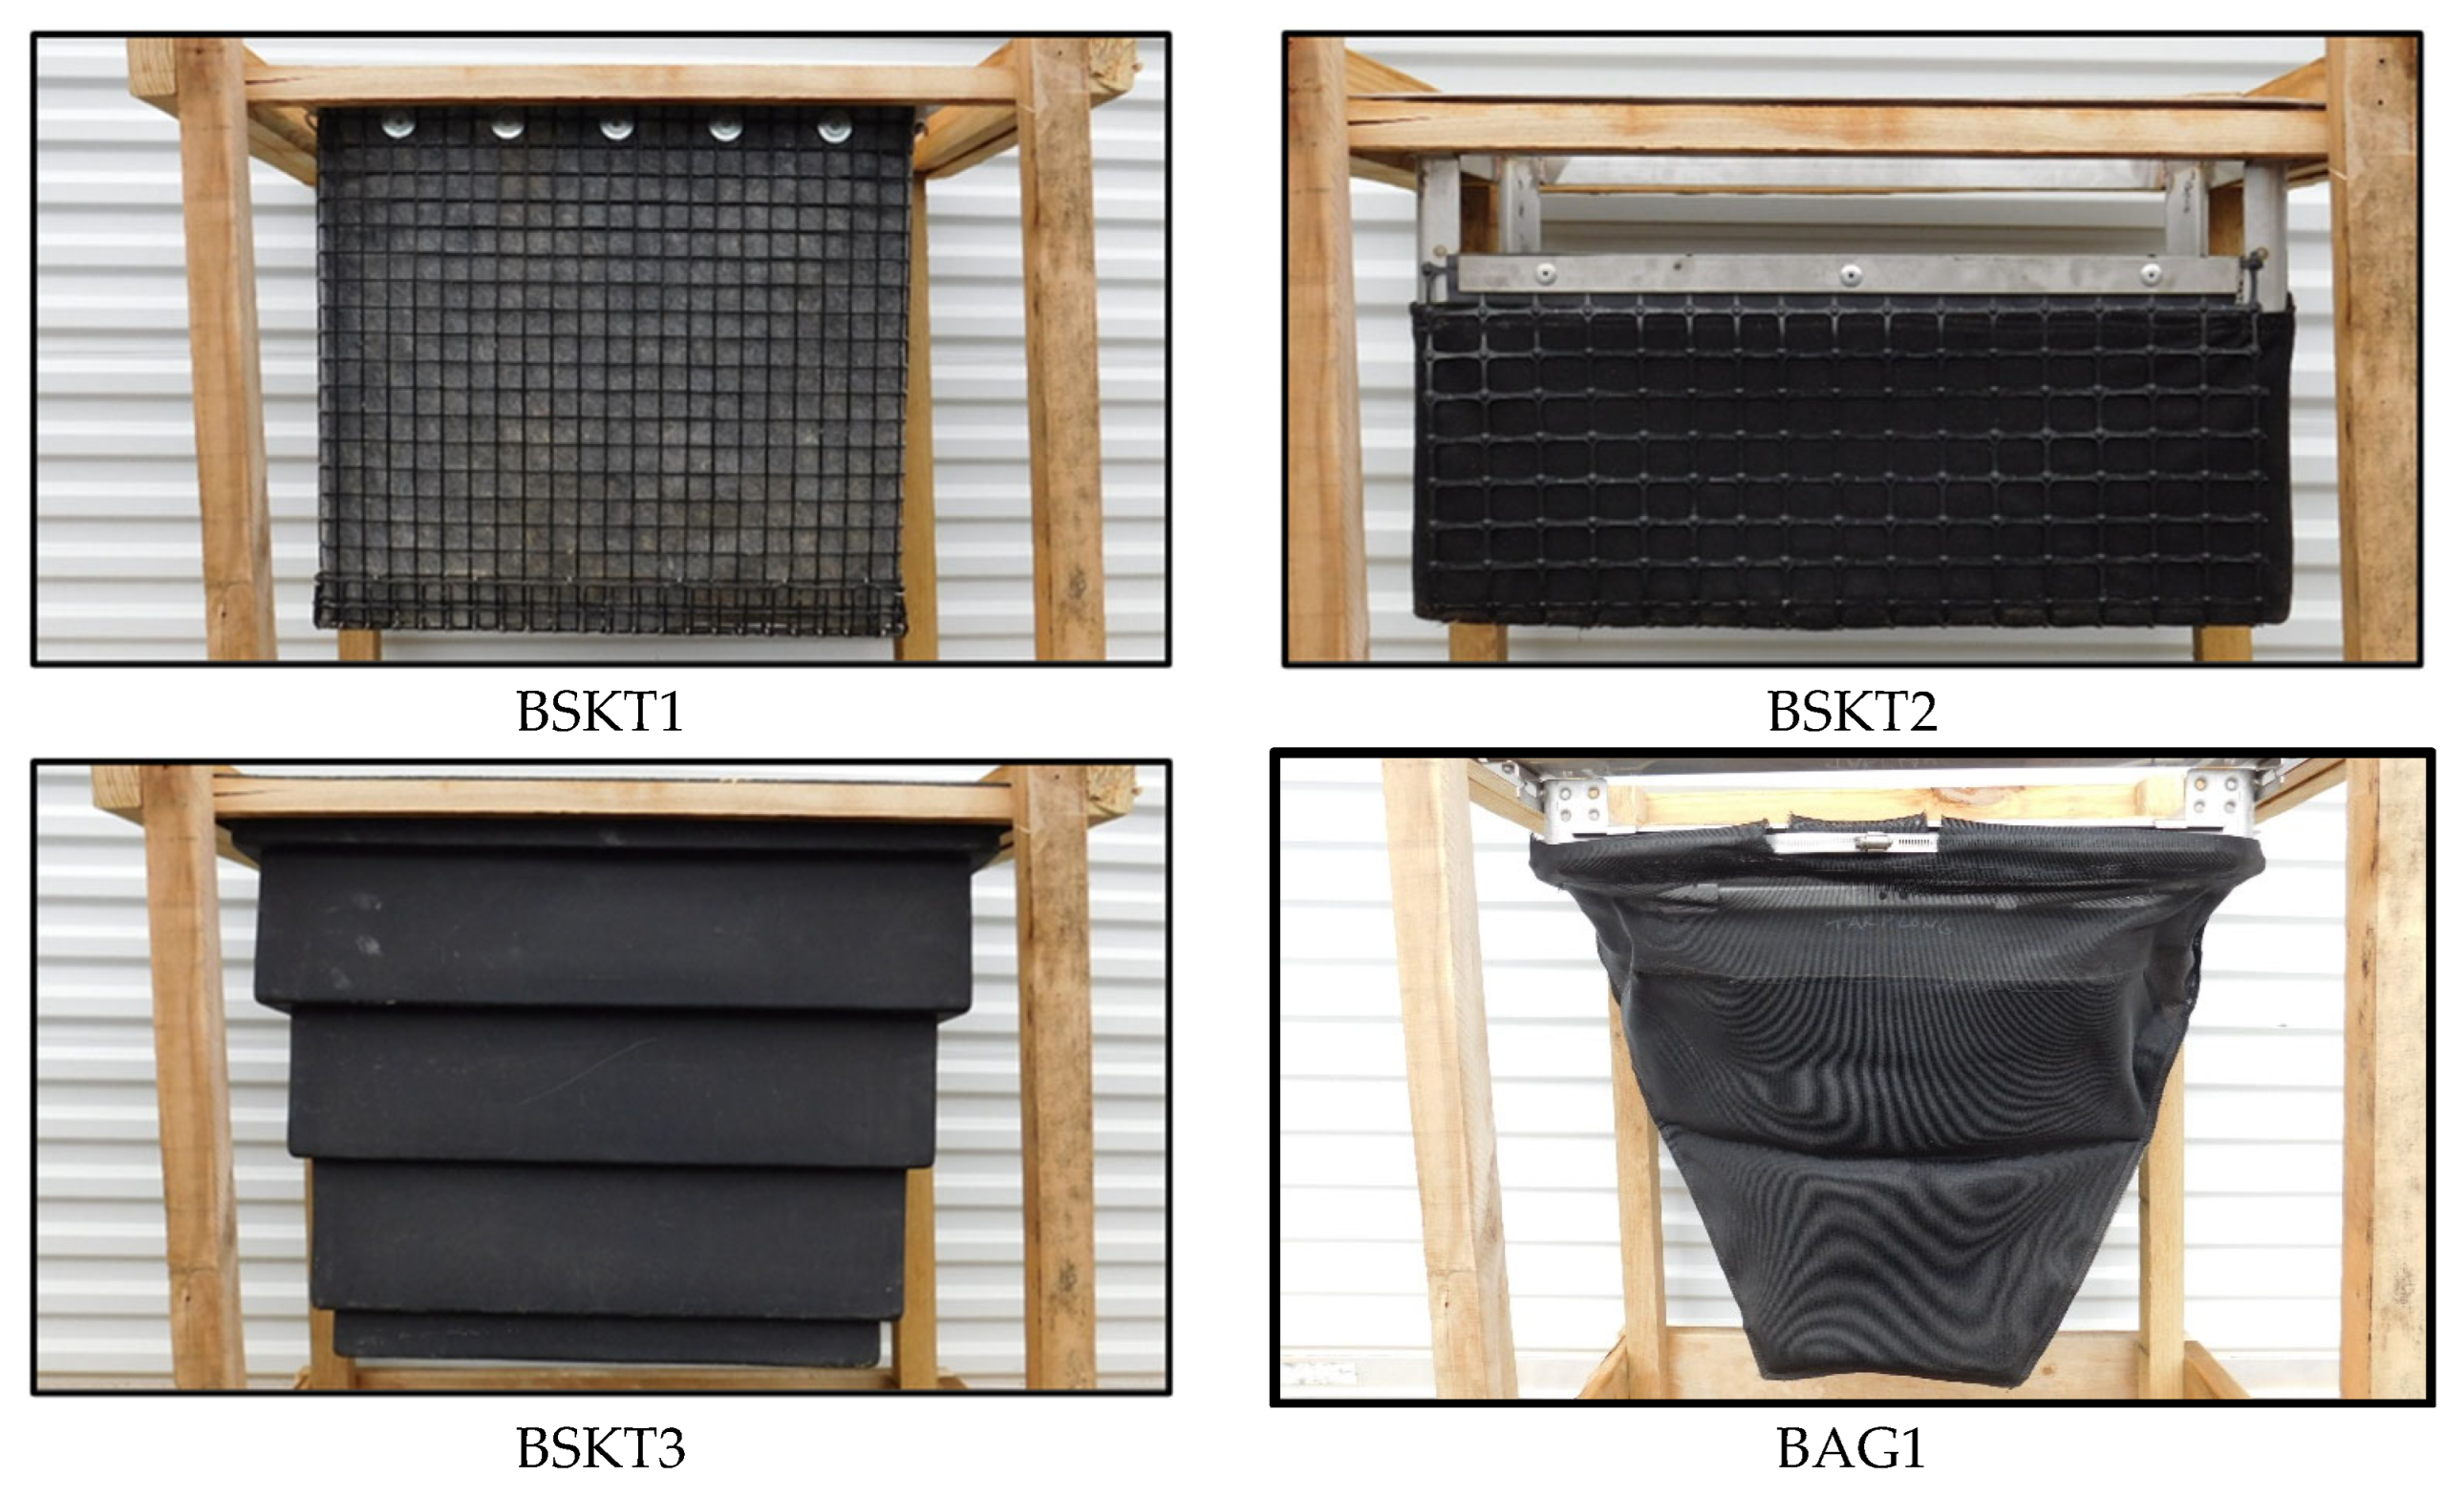
Evaluated products were selected based on a review of manufacturer information. The selected products claimed to be able to remove 80% of TSS and were available in sizes that fit within the catch basin testing apparatus [22]. Table 2 provides a summary of the CBIs evaluated, their type, filter material, overflow capabilities, and published flow-through rate. Additionally, Figure 3 shows the profile of each manufactured CBI evaluated.
Table 2.
Evaluated CBIs and associated design characteristics.
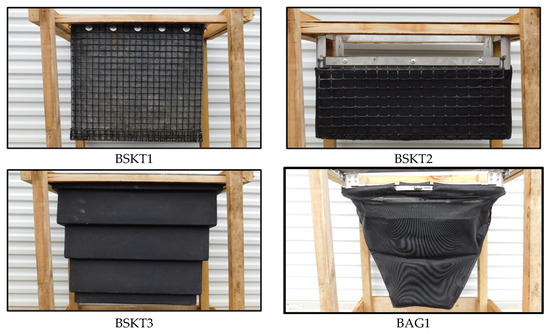
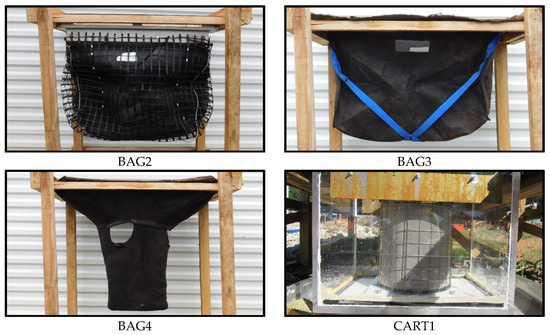
Figure 3.
Manufactured CBIs that were evaluated.
5. Results
Table 3 summarizes all sediment retention and TSS reduction percentage data and the time for overflow to occur for all performance evaluation tests. As shown, BSKT1 exceeded the 80% threshold for both sediment retention and TSS reduction multiple times. Additionally, BSKT2 met the 80% threshold for sediment retention once, while other products failed to exceed the threshold. However, BAG1, BAG3, and BAG4 did approach the target value, with sediment retention values reaching above 70% for some flow rates.
Table 3.
Results of performance evaluation.
6. Discussion and Analysis
To statistically determine the effects of CBI products and testing configurations, multiple linear regression models were developed (eight in total). Each CBI performance test had a corresponding combination of independent variables considered in the analysis: (1) the product itself, (2) the product discharge method, (3) sediment soil type, and (4) the introductory flow rate. The dependent variable selected for the analysis, which is directly affected by each independent variable, was sediment retention. In total, eight regression models were developed. The primary difference between each model was the base variable (i.e., base CBI), from which variations were compared. Results from the analysis, along with statistical significance, are shown in Table 4.
Table 4.
Product comparison using linear regression analysis.
The data allows us to compare the sediment retention capabilities of the products, while isolating the effect that the other factors (i.e., discharge method, soil type, flow rate) have on sediment retention. A p-value of less than α = 0.05 suggests that there is a statistically significant difference between the base product and the comparison product. These comparison products are bolded to easily distinguish significant differences in performance. A significant p-value paired with a negative comparison coefficient suggests that the original product performs better than the comparison product, while a positive comparison coefficient suggests that the comparison product performs better. Therefore, the regression analysis suggests that the BSKT1 retained sediment at a significantly higher rate than any of the other products, while the BAG2 retained sediment at a significantly lower rate than any of the other products.
The regression analysis, summarized in Table 5, also analyzes the effects that the other testing characteristics have on product sediment retention performance. Negative coefficients and significant p-values suggest that there is a significant decrease in sediment retention between low flow tests and medium and high flow tests. However, because the 1.70 L/s (0.06 ft3/s) flow was used as the constant during this regression analysis, it does not conclude whether there is a difference in sediment retention between medium and high flow tests. Therefore, a separate regression analysis was conducted with 3.40 L/s (0.12 ft3/s) as the base. The coefficient between the 3.40 L/s (0.12 ft3/s) and 5.10 L/s (0.18 ft3/s) flow rates was −7.25 with a p-value of 0.044, suggesting that there is a significant decrease in sediment retention between the 3.40 L/s (0.12 ft3/s) tests and the 5.10 L/s (0.18 ft3/s) tests.
Table 5.
Test characteristic comparison.
It can also be concluded that there was a significant increase in sediment retention between sheet flow and direct discharge method tests. This supports the observations that many of the products were allowing sheet flow to bypass the CBI, treating a smaller percentage of the runoff and therefore capturing less sediment. Additionally, data does show that there was a small decrease in sediment retention amongst tests with sandy loam compared to tests with OK110 silica sand; however, the p-value is greater than α = 0.05, meaning it cannot be concluded that there is a significant difference in sediment retention based on soil type.
6.1. Impacts of Overflow on Sediment Retention
Sediment retention data was also used to analyze the effect overflow events had on CBI performance. Sediment retention data was separated into two scenarios: (1) tests where overflow does not occur, and (2) tests where overflow does occur. As shown in Table 6, a two-sample t-test was used to determine whether there was a significant difference in mean sediment retention between the two scenarios.
Table 6.
Statistical analysis of overflow scenarios.
The p-value of 0.002, which is less than α = 0.05, suggests that there is a difference in sediment retention results between tests where overflow does not occur and where overflow does occur. Average sediment retention results were higher during tests with an overflow event. A possible explanation for this is that tests in which overflow events occur have maximized impoundment depths, thereby allowing particles to settle out of suspension. This could also be an indication that sediment loss is greater through the fabric if flow never reaches the bypass. If CBI fabric flow through rates are higher than other CBI fabric types and overflow never occurs, larger-sized sediment particles are able to pass through the fabric with larger pore openings in comparison to sediment discharged through the bypass. Lower flow through rate fabrics result in a larger mass fraction being contained within the product rather than allowing sediment to pass through the fabric, compared to CBIs containing fabrics with larger openings.
Another possible explanation for this is that of the 30 tests where overflow does not occur, nine tests were conducted using BAG2, which has already been proven statistically inferior to the other products. Observations of tests concluded that during the nine BAG2 tests, little to no impoundment occurs, hindering the sediment retention capabilities and possibly biasing the comparison between tests in which overflow does and does not occur. For this reason, the two-sample t-test assuming unequal variances was conducted once again but excluded the nine BAG2 tests. Results from this test are shown in Table 7.
Table 7.
Statistical analysis of overflow scenarios without BAG2 test data.
The p-value of 0.285, which is greater than α = 0.05, suggests that there is no difference in sediment retention results between tests where overflow does not occur and where overflow does occur when excluding the nine BAG2 tests. Therefore, it is likely that overflow does not influence sediment retention performance, and results from the previous statistical test were biased by the BAG2 results. This may also show that, indeed, the flow through the fabric has a greater effect on the performance of the product. In this case, the BAG2 created minimal impoundment, meaning a much greater flow-through rate, resulting in larger sediment particles being allowed to pass through the fabric, resulting in minimal sediment retention.
To further analyze overflow characteristics, Figure 4 plots sediment retention compared to the percent of the storm event that was treated before overflow occured. Treated flow refers to sediment-laden flow that passes through a sediment removal mechanism and sediment is captured. On the other hand, overflow refers to the sediment-laden flow that enters a CBI but does not pass through a treatment mechanism (i.e., fabric, filter medium, etc.), but instead exits the CBI through an overflow weir or orifice. This illustrates the relationship between overflow and sediment retention values. For example, if 90% of the storm event is treated before overflow occurs, sediment retention is likely to be greater than if only 10% of the storm event was treated before overflow begins. The data was then fitted with a logarithmic trend line to measure the relationship between the two variables. It can be seen from the coefficient of determination that there is a positive, moderately strong correlation between the time at which overflow occurs and sediment retention. This means that tests that lasted longer before allowing overflow were more likely to retain a higher percentage of sediment. A logarithmic trend line provided the best-fit trend line because, while sediment retention does continue to increase with an increase in time before overflow, sediment retention will eventually reach a maximum and begin to plateau. Therefore, if overflow occurs early, one can expect much less sediment to be captured. However, overflow that begins near the end of the event has little impact on sediment retention. From these analyses, it appears that the best performing product would be one that minimizes flow through the fabric to the point of water impounding close to the point of overflow. However, overflow should be minimal and begin near the end of the storm event, resulting in the largest percentage of particle size capture.
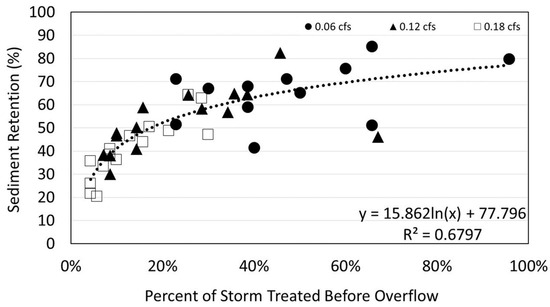
Figure 4.
Comparing overflow to sediment retention.
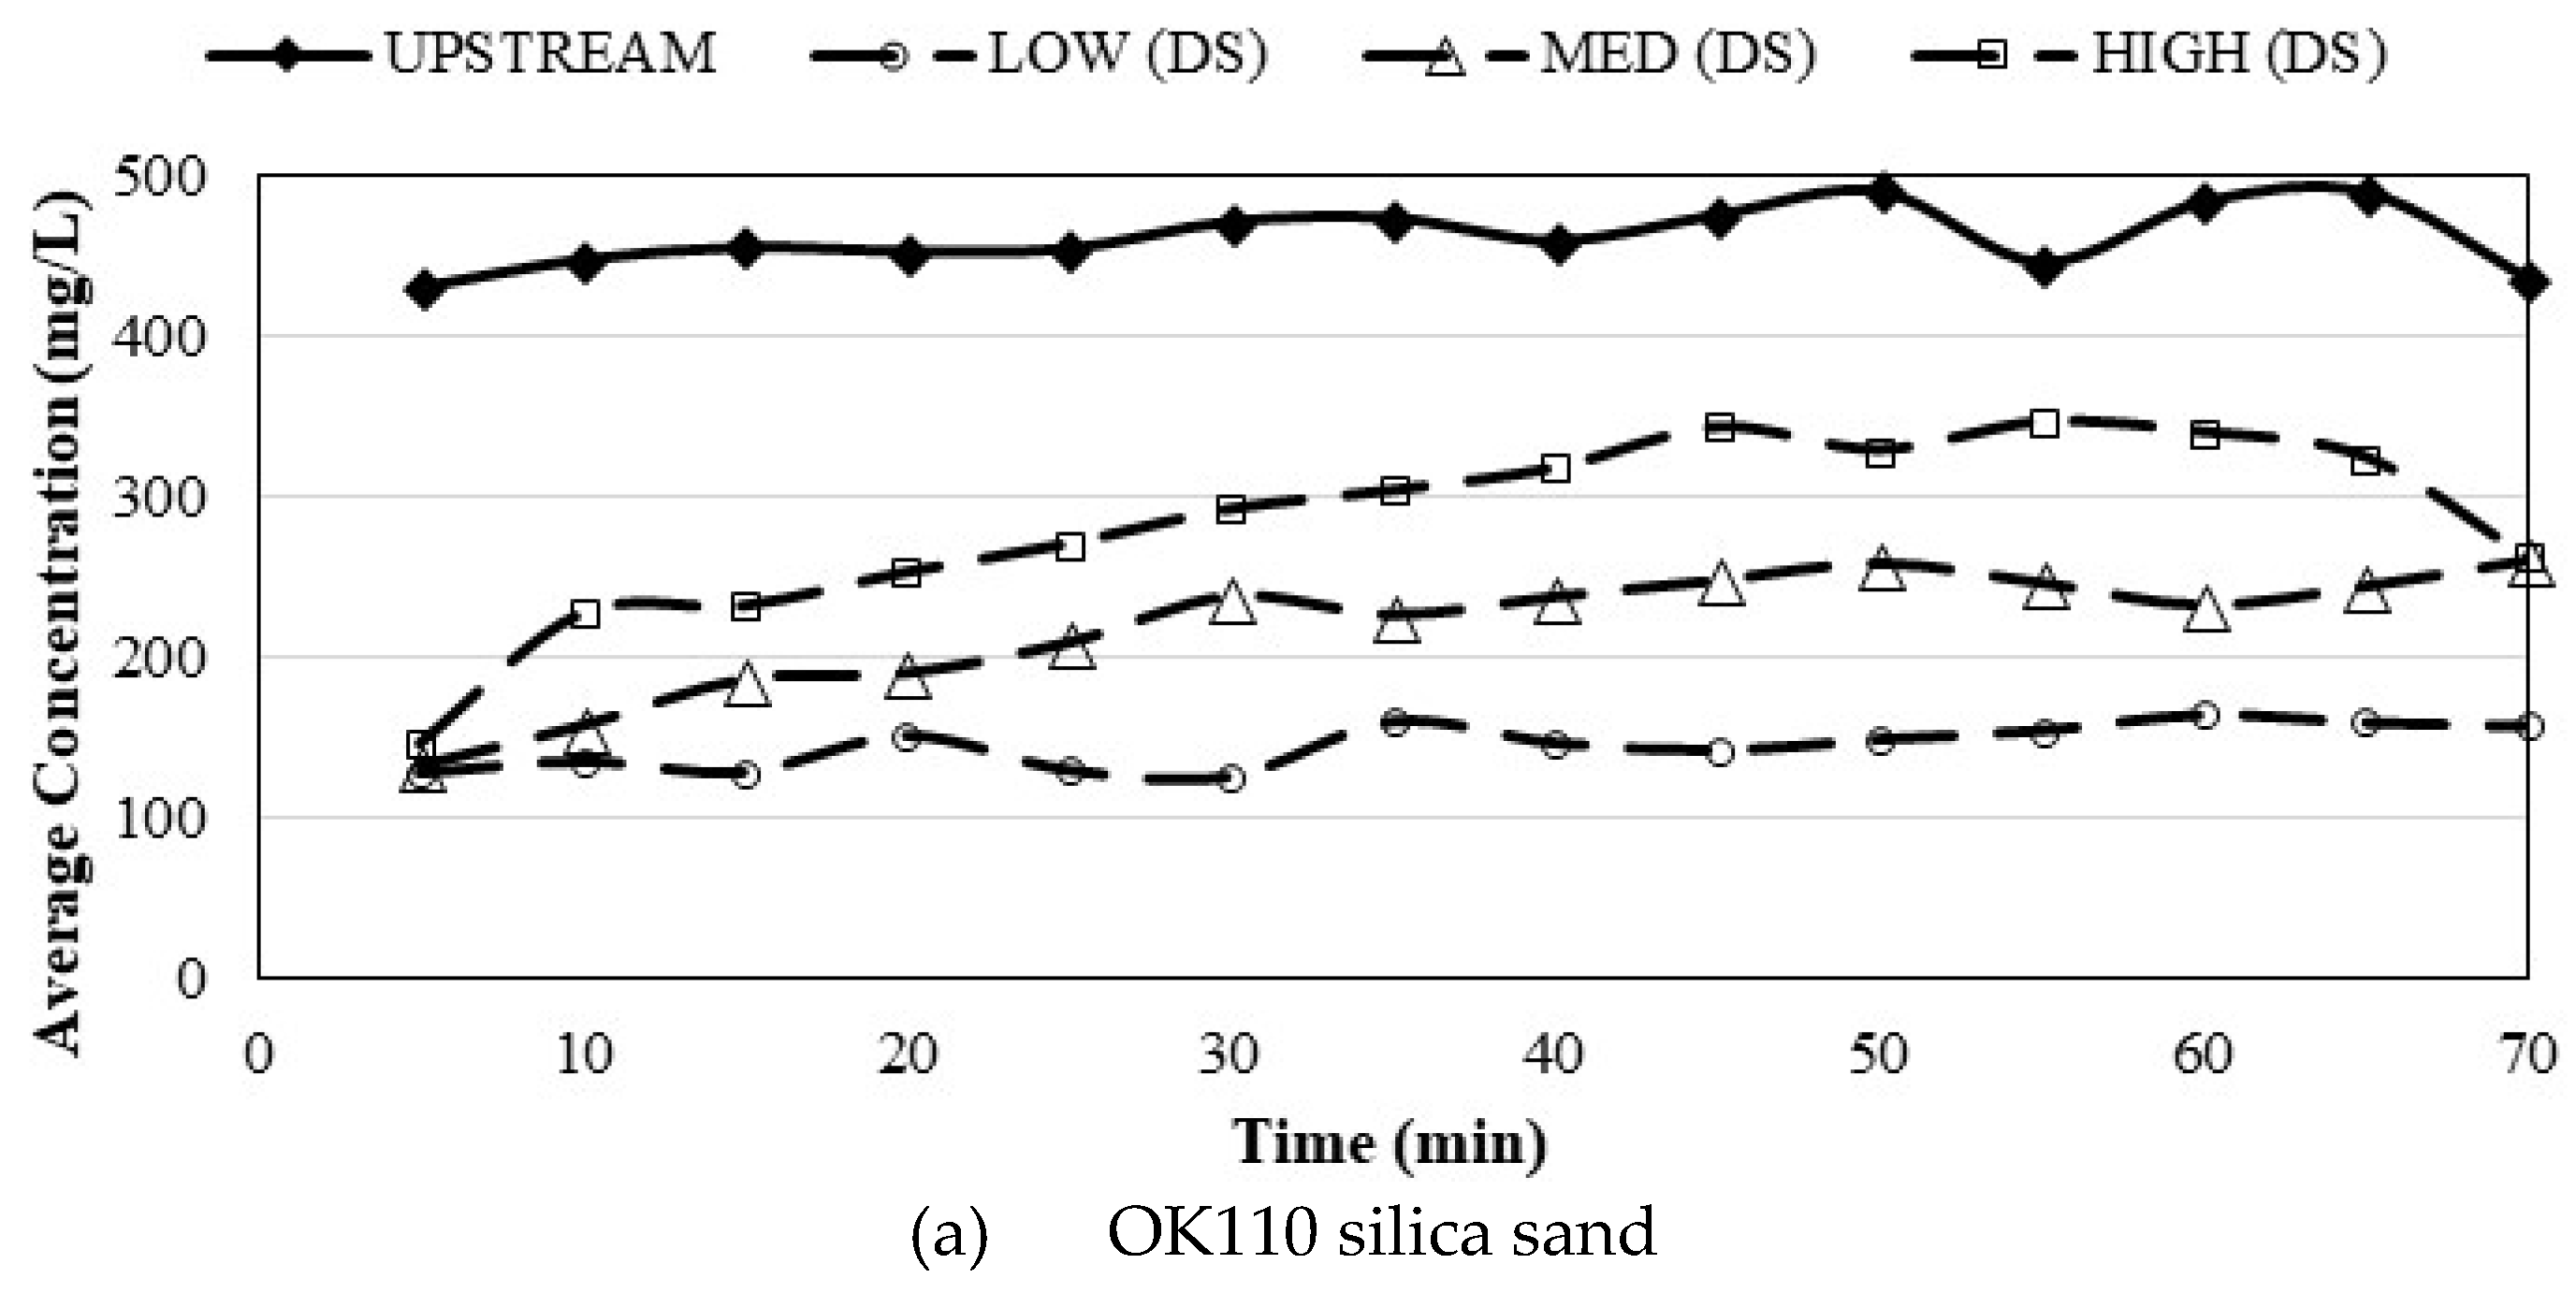
Average TSS concentrations were also used to determine how the filtering efficiency of the CBIs changed throughout the tests. As illustrated in Figure 5a, a reduction occurred from the upstream to the downstream sample for all three flow rates. At the low flow rate, there was little difference in downstream TSS concentrations from the beginning of the test until the end. However, at medium flow, the downstream TSS concentrations were higher at the end of the tests than at the beginning of the test. Finally, the high flow rate saw the largest increase in downstream TSS concentration from the beginning to the end of the test. This suggests that, with the OK110 silica sand, TSS reduction performance declined more rapidly when an increase in runoff volume was introduced.

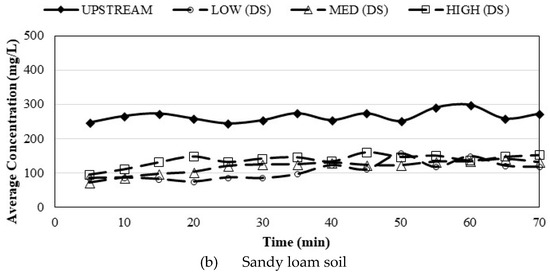
Figure 5.
TSS reduction by flow rate.
Figure 5b provides a summary of the average TSS reduction achieved for all tests performed. As shown, there is minimal change in TSS reduction between the three flow rates. Downstream TSS concentrations did tend to gradually increase with time, indicating a decline in TSS reduction performance, but flow rate seemed to have little effect. While the two soil types were affected by flow rates differently in terms of TSS reduction, the overall average TSS reductions for all OK110 and sandy loam tests were 46.9% and 45.3%, respectively, further indicating that soil type had little effect on TSS reduction.
6.2. Longevity Analysis
Longevity analyses were performed on each CBI to assess the number of storm events it could effectively treat before its sediment removal capability diminished or it ceased to function properly. Each CBI underwent a dedicated longevity analysis, involving a sequence of consecutive tests. These longevity tests simulated sediment-laden runoff from multiple storm events, with the CBI left uncleaned or unreplaced between simulations. The objective of these analyses was to replicate repetitive storm occurrences on a CBI installation without maintenance, aiming to determine its long-term performance characteristics.
Table 8 presents a comprehensive summary of sediment retention percentages observed across all longevity tests conducted. Initially, eight longevity tests (L1–L8) were planned for each CBI; however, the actual number of tests carried out varied based on the performance of individual products. The variability in testing stemmed from two primary factors: a product’s capability to retain 80% of the introduced sediment and its ability to maintain structural integrity throughout the testing series. Among the CBIs assessed for longevity, only one, BSKT2, consistently met performance criteria across all eight longevity tests using OK110 silica sand as the soil type. While there were fluctuations in individual sediment retention values, the cumulative retention rate remained relatively stable across tests. Notably, while BSKT2 demonstrated effectiveness in capturing OK110 silica sand, its performance was subpar when loaded with sandy loam soil. Table 8 and Figure 6 vividly illustrate the disparity in performance among CBIs over the long term. Most CBIs did not sustain satisfactory performance levels. Overall, these longevity findings suggest that CBIs will likely necessitate considerable maintenance or replacement after exposure to only two storm events.
Table 8.
Longevity Analysis of Sediment Retention.
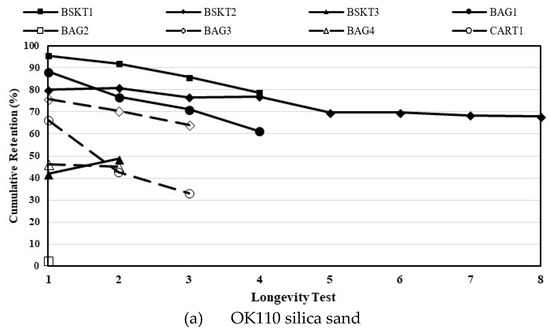

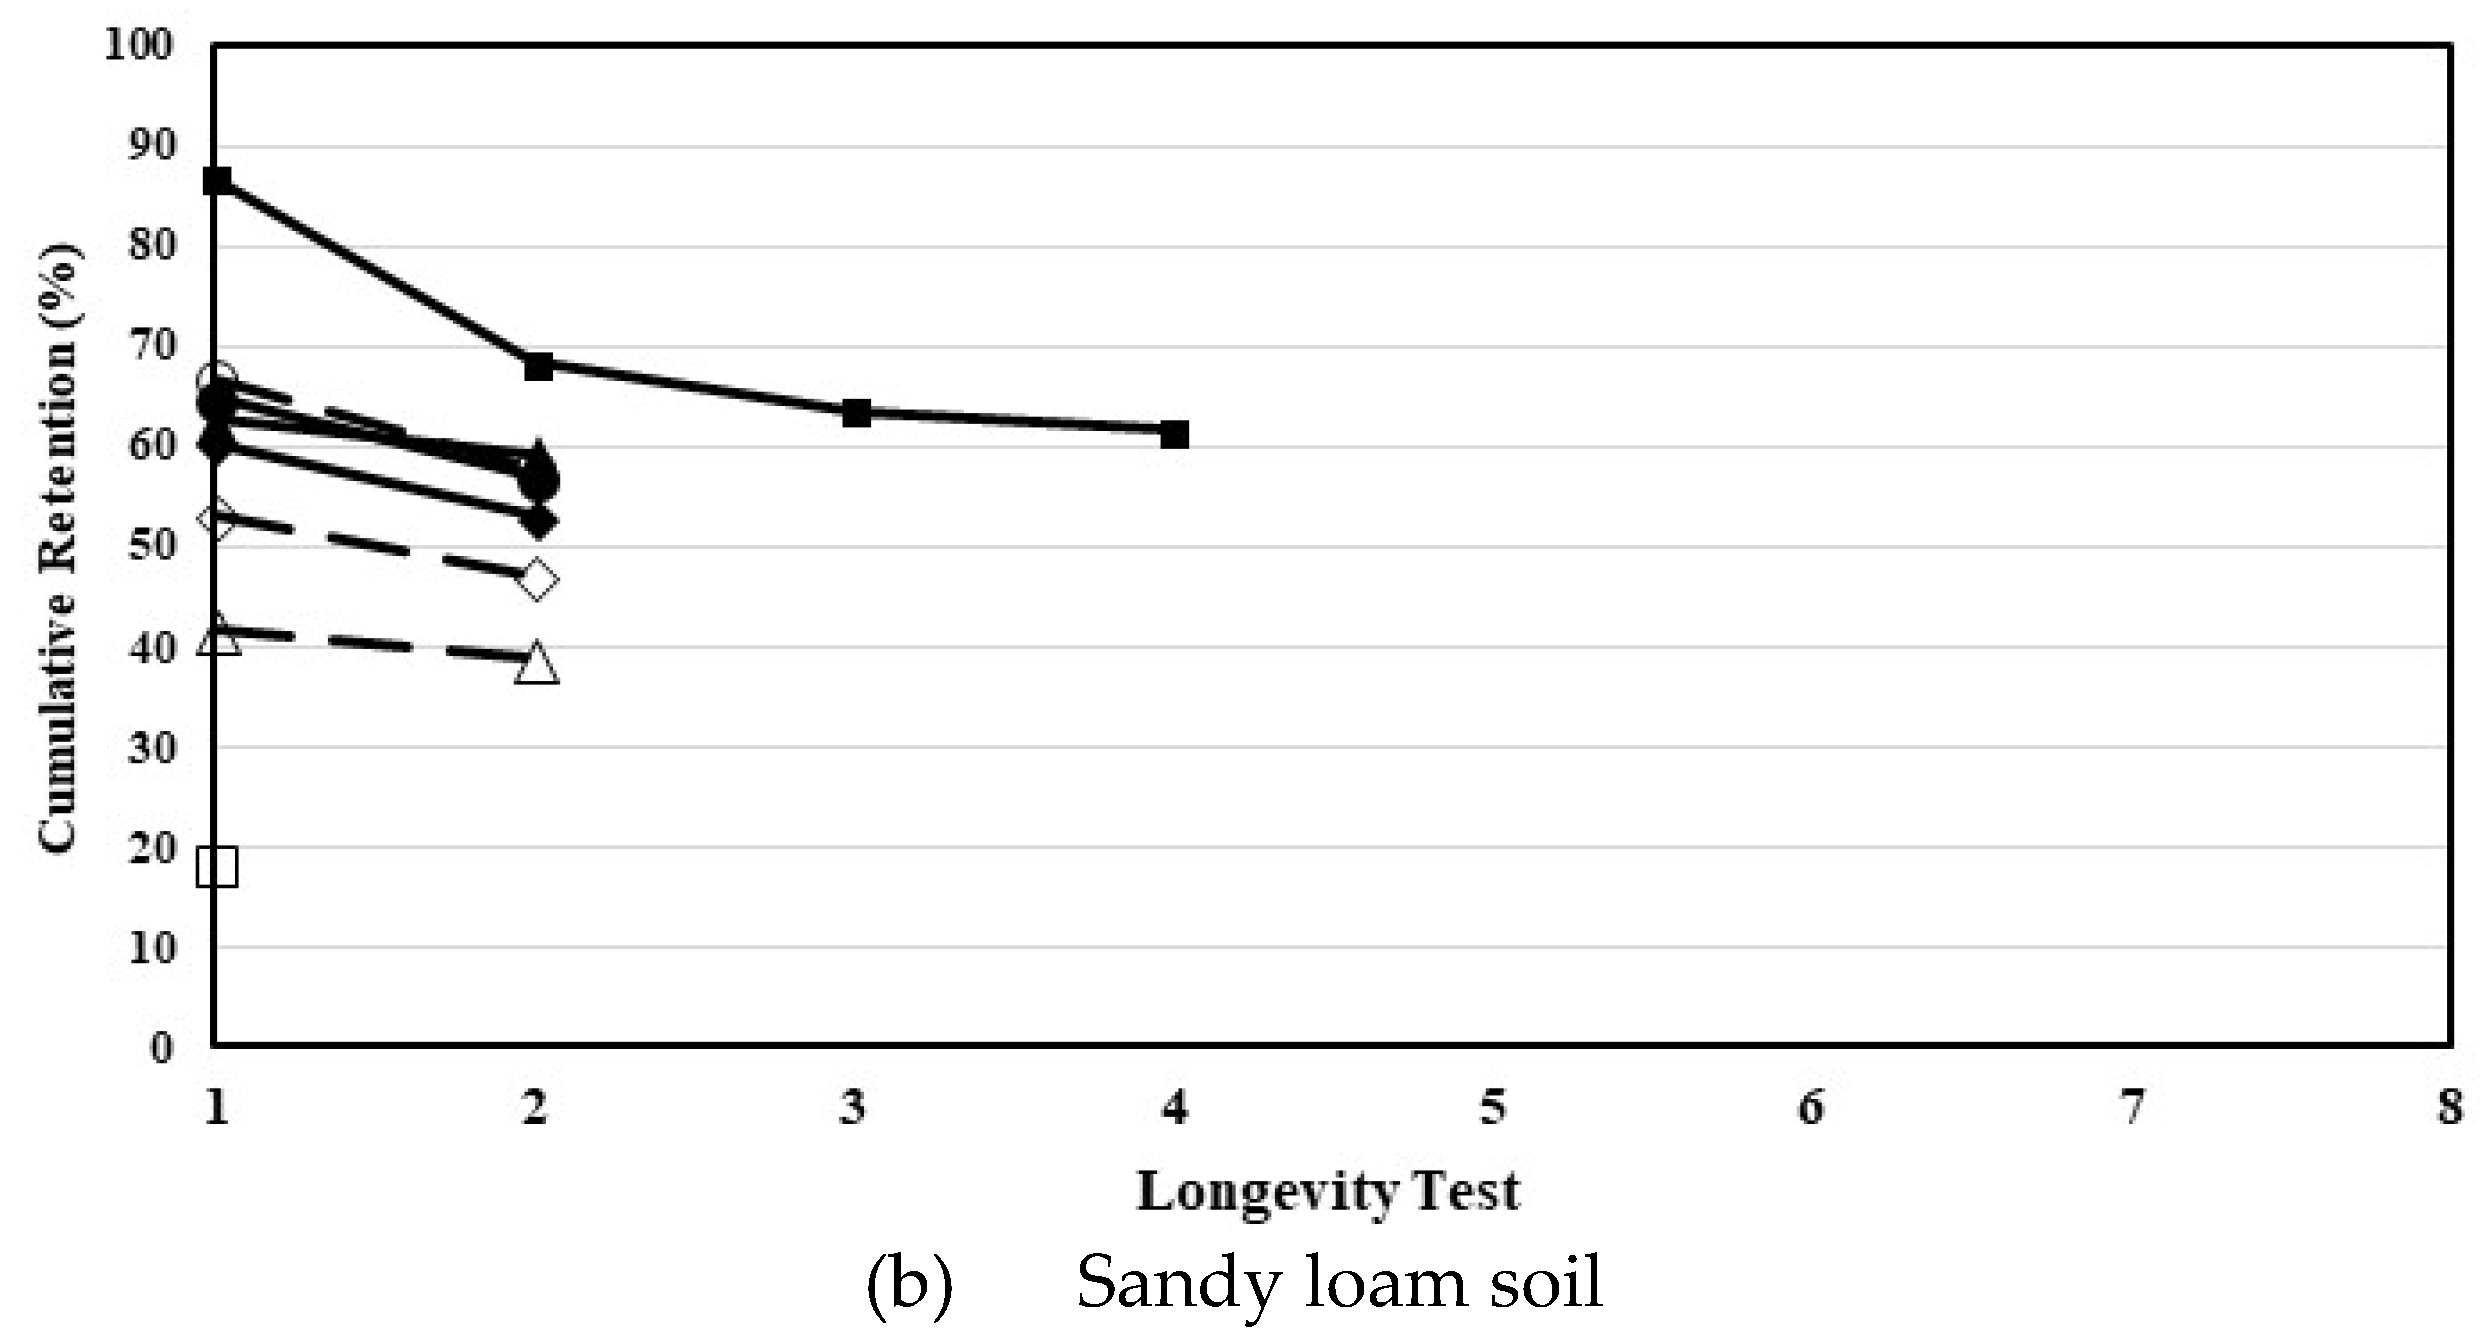
Figure 6.
Longevity testing summary of sediment retention.
Figure 6 illustrates cumulative sediment retention percentages for each CBI throughout their respective longevity testing tenures. As shown, on average, CBIs went longer without requiring maintenance when using the OK110 silica sand than when using the sandy loam soil, despite the OK110 silica sand being introduced at higher concentrations. This is most likely due to the higher clay content in the sandy loam soil, which causes the filter material to become clogged or blinded, hindering the flow-through ability and performance of the CBIs. For most CBIs, sediment retention percentage was also higher through the first few tests with OK110 silica sand than with sandy loam soil, indicating that the larger-sized sand particles in the OK110 silica sand were easier to capture than the smaller silt and clay particles in the sandy loam soil.
7. Conclusions
This investigation aimed to assess the practicality and efficiency of CBIs for sediment capture within MS4s. The study measured the amount of sediment captured to determine if a product could achieve an 80% sediment retention efficiency, which served as the performance benchmark. Results indicate that only two CBIs, namely BSKT1 and BSKT2, surpassed the benchmark across the performance evaluations. Although they did not meet the benchmark, BAG1, BAG3, and BAG4 achieved over 70% sediment retention during evaluations. The remaining three CBIs (i.e., BSKT3, BAG2, and CART1) fell notably short of the performance benchmark.
The data were also analyzed statistically to determine whether variability in performance was present when comparing the products. Figure 7 summarizes the statistical comparison of the products by plotting the average sediment retention capabilities of each of the eight products based on the multiple linear regression analysis. Labels along the horizonal axis identify each CBI and its associated alphabetical letter (i.e., A, B, C, D, etc.). Alphabetical labels above each bar identify CBIs that were determined to be statistically comparable to the considered CBI. Therefore, bars with no labels suggest that the sediment retention capability of the product was statistically different from all other products. BSKT1 was determined to have statistically higher average sediment retention percentages than all other products, while BAG2 was determined to capture sediment at rates significantly lower than all other products.
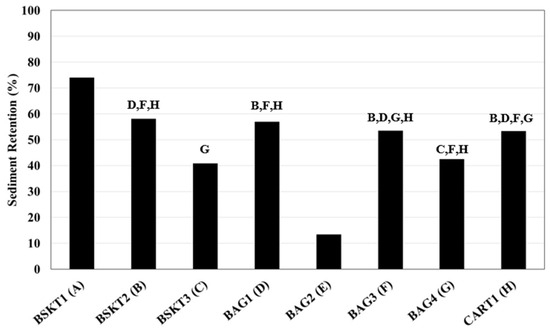
Figure 7.
Comparison of sediment retention coefficients between products. Note: Alphabetical letters above each bar identify CBIs that are statistically comparable to the CBI under consideration.
Evaluation of the different variables that may have also affected performance showed that water flowing into the catch basin as sheet flow may bypass a product, creating a condition of only partial treatment. Therefore, the direct discharge method was determined as an improved means of introducing sediment-laden water and evaluating each CBI’s performance. Sediment type did not appear to affect overall sediment retention capabilities, as the average sediment retention for the OK110 gradation sand and the sandy loam soil was 46.9% and 45.3%, respectively. Testing also showed that flow through rate of the filtration media may affect performance since products with higher flow through rates capture lower amounts of sediment. However, fabrics that had too low of a flow through rate resulted in overtopping conditions early in the testing that resulted in poor sediment retention performance. From this, it appears that the optimal configuration for a CBI is one that does not have a high flow through rate and does not overflow, thereby maximizing its impoundment within the product to capture and contain sediment.
Limitations for the results presented include flow introduction rates, sediment introduction rates, sediment soil type, and sediment-laden flow discharge method (i.e., direct or indirect) into the CBI. These limitations highlight the need for further investigation into the impact of variable flow and sediment conditions on the performance of CBIs. Additionally, this study only analyzed eight manufactured CBIs. Future research should aim to address these limitations by developing variable flow and sediment introduction systems that mimic typical hydrograph distributions. Furthermore, the specific environmental conditions under which the CBIs were tested may not fully represent all potential scenarios encountered in the field. Therefore, while the results provide valuable insights into the performance of CBIs under controlled conditions, caution should be exercised when extrapolating these findings to diverse field environments.
Abbreviations
| BMP | Best Management Practice |
| CBI | Catch Basin Insert |
| DOT | Department of Transportation |
| MS4 | Municipal Separate Stormwater Sewer System |
| NPDES | National Pollutant Discharge Elimination System |
| TSS | Total Suspended Solids |
| USEPA | United States Environmental Protection Agency |
Author Contributions
Conceptualization, D.B., W.Z. and W.D.; methodology, D.B., W.Z. and W.D.; formal analysis, D.B., W.Z. and W.D.; investigation, D.B., W.Z. and W.D.; data curation, D.B.; writing—original draft preparation, D.B., W.Z., W.D. and J.W.; writing—review and editing, D.B., W.Z., W.D. and J.W.; project administration, W.Z.; funding acquisition, W.Z. All authors have read and agreed to the published version of the manuscript.
Funding
This research was funded by the Ohio Department of Transportation (ODOT PID 103684).
Data Availability Statement
Some or all data, models, or codes that support the findings of this study are available from the corresponding author upon reasonable request. The following data sets are available: spreadsheet database and results.
Conflicts of Interest
The authors declare no conflicts of interest.
References
- National Pollutant Discharge Elimination System (NPDES). Available online: https://www.epa.gov/npdes (accessed on 3 April 2024).
- Polluted Runoff: Nonpoint Source (NPS) Pollution. Available online: https://www.epa.gov/nps (accessed on 3 April 2024).
- United States Environmental Protection Agency. Office of Water and Office of Research and Development. In National Rivers and Streams Assessment 2008–2009: A Collaborative SURVEY (EPA/841/R-16/007); United States Environmental Protection Agency: Washington, DC, USA, 2016. [Google Scholar]
- United States Environmental Protection Agency. Water Planning Division. Results of the Nationwide Urban Runoff Program, Volume 1—Final Report; United States Environmental Protection Agency: Washington, DC, USA, 1983.
- Ohio EPA. Small Municipal Separate Storm Sewer Systems (MS$s)—General Permit (OHQ000004). Available online: https://dam.assets.ohio.gov/image/upload/epa.ohio.gov/Portals/35/permits/OHQ000004.pdf (accessed on 3 April 2024).
- Ohio EPA. General Permit Authorization for Storm Water Discharges Associated with Construction Activity Under the National Pollutant Discharge Elimination System. Available online: https://epa.ohio.gov/divisions-and-offices/surface-water/permitting/npdes-general-permits (accessed on 7 March 2024).
- Ohio Department of Transportation. Supplemental Specification 995 Precast Water Quality Structure. Available online: https://www.dot.state.oh.us/Divisions/ConstructionMgt/Specification%20Files/995_01152010_for_2010.PDF (accessed on 3 April 2024).
- Ohio Department of Trasnsporation (a). Location & Design Manual, Volume Two. Available online: https://www.transportation.ohio.gov/working/engineering/hydraulic/location-design-vol-2 (accessed on 7 March 2024).
- MacLure. Performance of a Catch Basin Filter and Leachate from Biocidal Media for Stormwater Treatment. Master’s Thesis, California Polytechnic State University, San Luis Obispo, CA, USA, 2009. Available online: https://digitalcommons.calpoly.edu/theses/47/ (accessed on 7 March 2024).
- Morgan, R.; Edwards, F.G.; Brye, K.R.; Burian, S.J. An Evaluation of the Urban Stormwater Pollutant Removal Efficiency of Catch Basin Inserts. Water Environ. Res. 2005, 77, 500–510. [Google Scholar] [CrossRef] [PubMed]
- NJCAT. Aqua-Swirl Concentrator and Aqua-Filter Stormwater Treatment Systems. New Jersey Corporation for Advanced Technology, Final Report. 2005. Available online: http://www.njcat.org/uploads/newDocs/AquaSwirl_AquaFilterNJCATLaboratoryVerification905.pdf (accessed on 7 March 2024).
- Remley, R.; Morgan, R.A.; Edwards, F.G.; Brye, K.R.; Burian, S.J. Pollutant Removal Capacity of Stormwater Catch basin Inserts. In Impacts of Global Climate Change, Proceeding; ASCE: New York, NY, USA, 2012. [Google Scholar] [CrossRef]
- ASTM D5141-11; Efficiency and Flow Rate of the Filtration Component of a Sediment Retention Device. ASTM International: West Conshohocken, PA, USA, 2011.
- ASTM D5907-18; Standard Test Methods for Filterable Matter (Total Dissolved Solids) and Non-Filterable Matter (Total SUSPENDED Solids) in Water. ASTM International: West Conshohocken, PA, USA, 2018.
- ASTM D7351-21; Test Method for Determination of Sediment Retention Device (SRD) Effectiveness in Sheet Flow Applications. ASTM International: West Conshohocken, PA, USA, 2021.
- STM D4491/D4491M-22; Standard Test Methods for Water Permeability of Geotextiles by Permittivity. ASTM International: West Conshohocken, PA, USA, 2022.
- Bhattarai, R.; Kalita, P.; Azeem, A.; Jha, R. Evaluation of Curb and Gutter Inlet Protection Products for Sediment Retention; Research Report No. FHWA-ICT-16-001; Illinois Center for Transportation: Rantoul, IL, USA, 2016. [Google Scholar]
- Perez, M.A. Evaluation of Inlet Protection Practices (IPPs) Using Large-Scale Testing Techniques. Ph.D. Thesis, Auburn University, Auburn, AL, USA, 2014. [Google Scholar]
- Perez, M.A.; Zech, W.C.; Donald, W.N.; Fang, X. Methodology for evaluating inlet protection practices using large-scale testing techniques. J. Hydrol. Eng. 2015, 20, 1019. [Google Scholar] [CrossRef]
- Perez, M.A.; Zech, W.C.; Donald, W.N.; Fang, X. Installation enhancements to common inlet protection practices using large-scale testing techniques. Transp. Res. Rec. J. Transp. Res. Board 2015, 2521, 151–161. [Google Scholar] [CrossRef]
- Basham, D.L.; Zech, W.C.; Donald, W.N.; Perez, M.A. Design and Construction of a Full-Scale Testing Apparatus for Evaluating the Performance of Catch Basin Inserts. ASCE J. Sustain. Water Built Environ. 2018, 5, 868. [Google Scholar] [CrossRef]
- Ohio Department of Transportation (b). Catch Basin No. 3A. Standard Hydraulic Construction Drawing, Office of Hydraulic Engineering. Available online: https://www.dot.state.oh.us/SCDs/Pages/hydraulic.aspx (accessed on 7 March 2024).


Disclaimer/Publisher’s Note: The statements, opinions and data contained in all publications are solely those of the individual author(s) and contributor(s) and not of MDPI and/or the editor(s). MDPI and/or the editor(s) disclaim responsibility for any injury to people or property resulting from any ideas, methods, instructions or products referred to in the content. |
© 2024 by the authors. Licensee MDPI, Basel, Switzerland. This article is an open access article distributed under the terms and conditions of the Creative Commons Attribution (CC BY) license (https://creativecommons.org/licenses/by/4.0/).