Abstract
Pesticide exposure patterns tested in laboratory bioassays often do not match real-world pesticide exposure profiles in edge-of-field waterbodies. Toxicokinetic–toxicodynamic (TKTD) models are therefore increasingly used, as they allow for predictions of the toxic effects under actual time-variable field exposures. The TKTD models from the General Unified Threshold models of Survival (GUTS), for example, are considered ready for use by regulators for calculating the survival rates for any time-variable exposure profile. However, questions remain regarding their predictive power for compounds showing increased toxicity over time, such as neonicotinoid insecticides. The aim of the present study was therefore to compare the GUTS-predicted 28 d toxicity values of three neonicotinoids (imidacloprid, clothianidin, and thiamethoxam) for the common New Zealand mayfly genus Deleatidium spp. with those observed in a previously published study. Overall, the GUTS modeling results underestimated the toxicity values derived experimentally. From the three neonicotinoids, clothianidin showed the best fit between the estimated and observed 28 d LC50 (median-lethal-concentration) values. Shortcomings of the modeling exercise, future research needs, and implications for the application of GUTS models in regulatory risk assessment are discussed.
1. Introduction
The growing world population and related megatrends, such as urbanization and the growing global middle class, have increased the food demand over the past decades. This has been accompanied by an increasing need to intensify agricultural production and, hence, the production and use of fertilizers and pesticides [1]. Combined global sales of fertilizers and pesticides are still growing over 3.1% per year and are foreseen to reach USD 290 billion by 2030 [2].
Unlike most industrial chemicals, pesticides are deliberately released into the environment to exert their desired functions, which implies that they may provoke risks to the environment and human health [1]. Pesticides used for crop protection in agriculture, which are generally referred to as plant protection products, may enter irrigation canals, drainage ditches, ponds, lakes, and rivers in numerous ways, such as by direct overspray, spray drift, leaching to surface and groundwater, runoff from land, and/or accidental spills [3,4]. To protect sensitive freshwater ecosystems from pesticide stress, jurisdictions of many countries require a prospective Environmental Risk Assessment (ERA) before the registration of a pesticide to ensure that its intended use is not foreseen to exert unacceptable side effects to edge-of-field aquatic ecosystems. If the prospective ERA does not indicate unacceptable risks, thus allowing the use of the pesticide, a retrospective ERA is conducted by setting water quality criteria and conducting pesticide-monitoring campaigns [4].
Prospective aquatic ERAs of pesticides confront the predicted environmental concentrations (PECs) in edge-of-field waterbodies with the predicted no-effect concentrations (PNECs). A PNEC is calculated by applying an uncertainty factor to the toxicity values derived from ecotoxicity tests. Such toxicity tests may range from single-species laboratory bioassays to large-scale outdoor mesocosm studies [5]. Laboratory bioassays are conducted with a limited number of standard test species, traditionally the invertebrate Daphnia sp., an alga, and a fish [4], which are considered as surrogates for other aquatic organisms. The sole use of the Daphnia sp. as representative of invertebrates, however, was disputed because D. magna is over two orders of magnitude less sensitive than several macrocrustacean and insect species (e.g., [6]). Subsequently, the data requirements adopted about a decade ago in Europe also started to request acute toxicity tests with a second species (besides D. magna), such as, for example, chironomid larvae or mysid shrimps [7]. Despite efforts to improve the ERAs of pesticides, a recent report by the United Nations Environmental Program still identified several gaps in systematic reviews, environmental risk assessments, and systematic monitoring [1].
Regarding pesticide exposure assessments in prospective ERAs, the PEC is estimated using computer simulation models like those developed by FOCUS (Forum for the Co-ordination of Pesticide Fate Models and Their Use), using the pesticide characteristics, the recommended intended use of pesticides, and a simulated landscape scenario as the input parameters [8]. As discussed above, pesticides may enter edge-of-field waterbodies in numerous ways, with spray drift and runoff considered as the two principal entry routes [3,4]. Pesticide exposure profiles in waterbodies adjacent to agricultural fields therefore have highly variable dynamics and depend on pesticide application schemes and entry pathways that, in turn, are influenced by environmental variables [9]. For example, the main entry routes usually considered to calculate PECs (i.e., runoff and spray drift) are known to be highly variable depending on the geographical area and, hence, the agroecosystem characteristics [10,11,12]. These variable real-world dynamic pesticide concentrations are not accounted for in laboratory ecotoxicity tests. Instead, such tests generally evaluate a single-peak, pulsed, or constant-exposure pattern over a standardized period, which does not reflect dynamic field exposure profiles over time. This thus dictates that the classical dose–response models applied to data from laboratory toxicity tests do not assess the actual risk resulting from real-world exposure patterns [13].
The discrepancy in the pesticide exposure between the actual field and laboratory tests can be overcome by conducting laborious refined-exposure laboratory toxicity tests (see, e.g., [7]) or by using toxicokinetic–toxicodynamic (TKTD) models. TKTD models have specifically been designed to deliver relevant information for the extrapolation of the toxicity obtained under static laboratory exposure to that expected under actual time-variable field exposure [14]. For example, TKTD models from the family of General Unified Threshold models of Survival (GUTS) enable estimating survival probabilities for any time-variable exposure profile [15,16]. GUTS modeling results are species- and compound-specific and explicitly describe the internal exposure dynamics in an organism (toxicokinetics) and the related damage and effect dynamics (toxicodynamics), thereby connecting the external exposure concentration dynamics with the simulated mortality or immobility over time [17].
In their scientific opinion published in 2018, the European Food Safety Authority (EFSA) concluded that the GUTS framework may be considered ready for use in aquatic risk assessment given that user-friendly modeling tools are available and a sufficient number of application examples and validation exercises for aquatic species and pesticides has been published in the scientific literature [18]. However, the EFSA [18] also identified an open issue for the use of the GUTS in regulatory risk assessments related to compounds that are suspected of showing increased toxicity over time, such as neonicotinoids. Indeed, Focks et al. [9] reported that GUTS predictions based on acute exposure to the neonicotinoids thiacloprid and thiamethoxam were underpredicting the actual effects of the pulsed exposure of these pesticides on the survival of macroinvertebrates. This thus warrants additional validation studies of the GUTS for a representative number of substances differing in exposure dynamics and toxic modes of action, with special emphasis on compounds with the potential to show increased toxicity under long-term exposure, such as neonicotinoids [9,17,18,19]. Neonicotinoids also receive special attention because they have been reported to affect the mobility and survival of aquatic mayfly nymphs already at low concentrations [20,21,22,23].
The main aim of this study was to analyze whether the survival of a mayfly species under exposure to time-variable concentrations of three neonicotinoids can be accurately predicted by using the GUTS. A second aim was to analyze the influence of the model type (stochastic death—SD versus individual tolerance—IT), software used (OpenGUTS versus MOSAIC), and test compound (imidacloprid, clothianidin, and thiamethoxam) on the quality of the survival predictions.
2. Materials and Methods
2.1. Experimental Data Source
The raw data used for the present study were obtained from the Supplementary Material of Macaulay et al. [24]. In their study, nymphs of the common New Zealand mayfly genus Deleatidium spp. were evaluated for their sensitivity to the neonicotinoid insecticides imidacloprid, clothianidin, and thiamethoxam. Static-renewal aquatic laboratory bioassays were conducted for a period of 28 d, and the survival, immobility, impairment, and mayfly molting propensity were measured at varying time points throughout this experimental period. Deleatidium spp. nymphs were exposed to 10 neonicotinoid concentrations in each test with 5 replicates per test concentration. Each replicate consisted of a 1.16 L aerated glass chamber (19.9 cm × 14.4 cm × 6.3 cm) containing at least 15 nymphs. Exposure solutions were prepared with ASTM artificial soft water and were renewed every 7 days. At each exposure solution renewal, a fresh periphyton tile that served as food was placed in each test chamber. The ceramic tiles had been incubated in a local creek for two weeks to allow periphyton growth on the tiles.
Test concentrations of the neonicotinoids were analyzed using a Triple-Quadrupole Mass Spectrometer (Agilent 6490, Santa Clara, CA, USA). These verified concentrations for imidacloprid, clothianidin, and thiamethoxam deviated −19, −38, and +66% on average from the nominal concentrations, respectively. Variations in the overall measured test concentrations (i.e., average of initial and final measured concentrations) were low, with an average coefficient of variation of 4% (ranging from 1 to 10%; calculated by the authors based on information provided in the Supplementary Material of Macaulay et al. [24]). However, because concentrations were only verified for three of the ten treatments, Macaulay et al. [24] discussed that it was more feasible to use nominal concentrations for further analyses. For the same reason, nominal concentrations were used in the present study. For more details on the experimental design and procedure of this study, the readers are referred to Macaulay et al. [24].
2.2. GUTS Models Evaluated
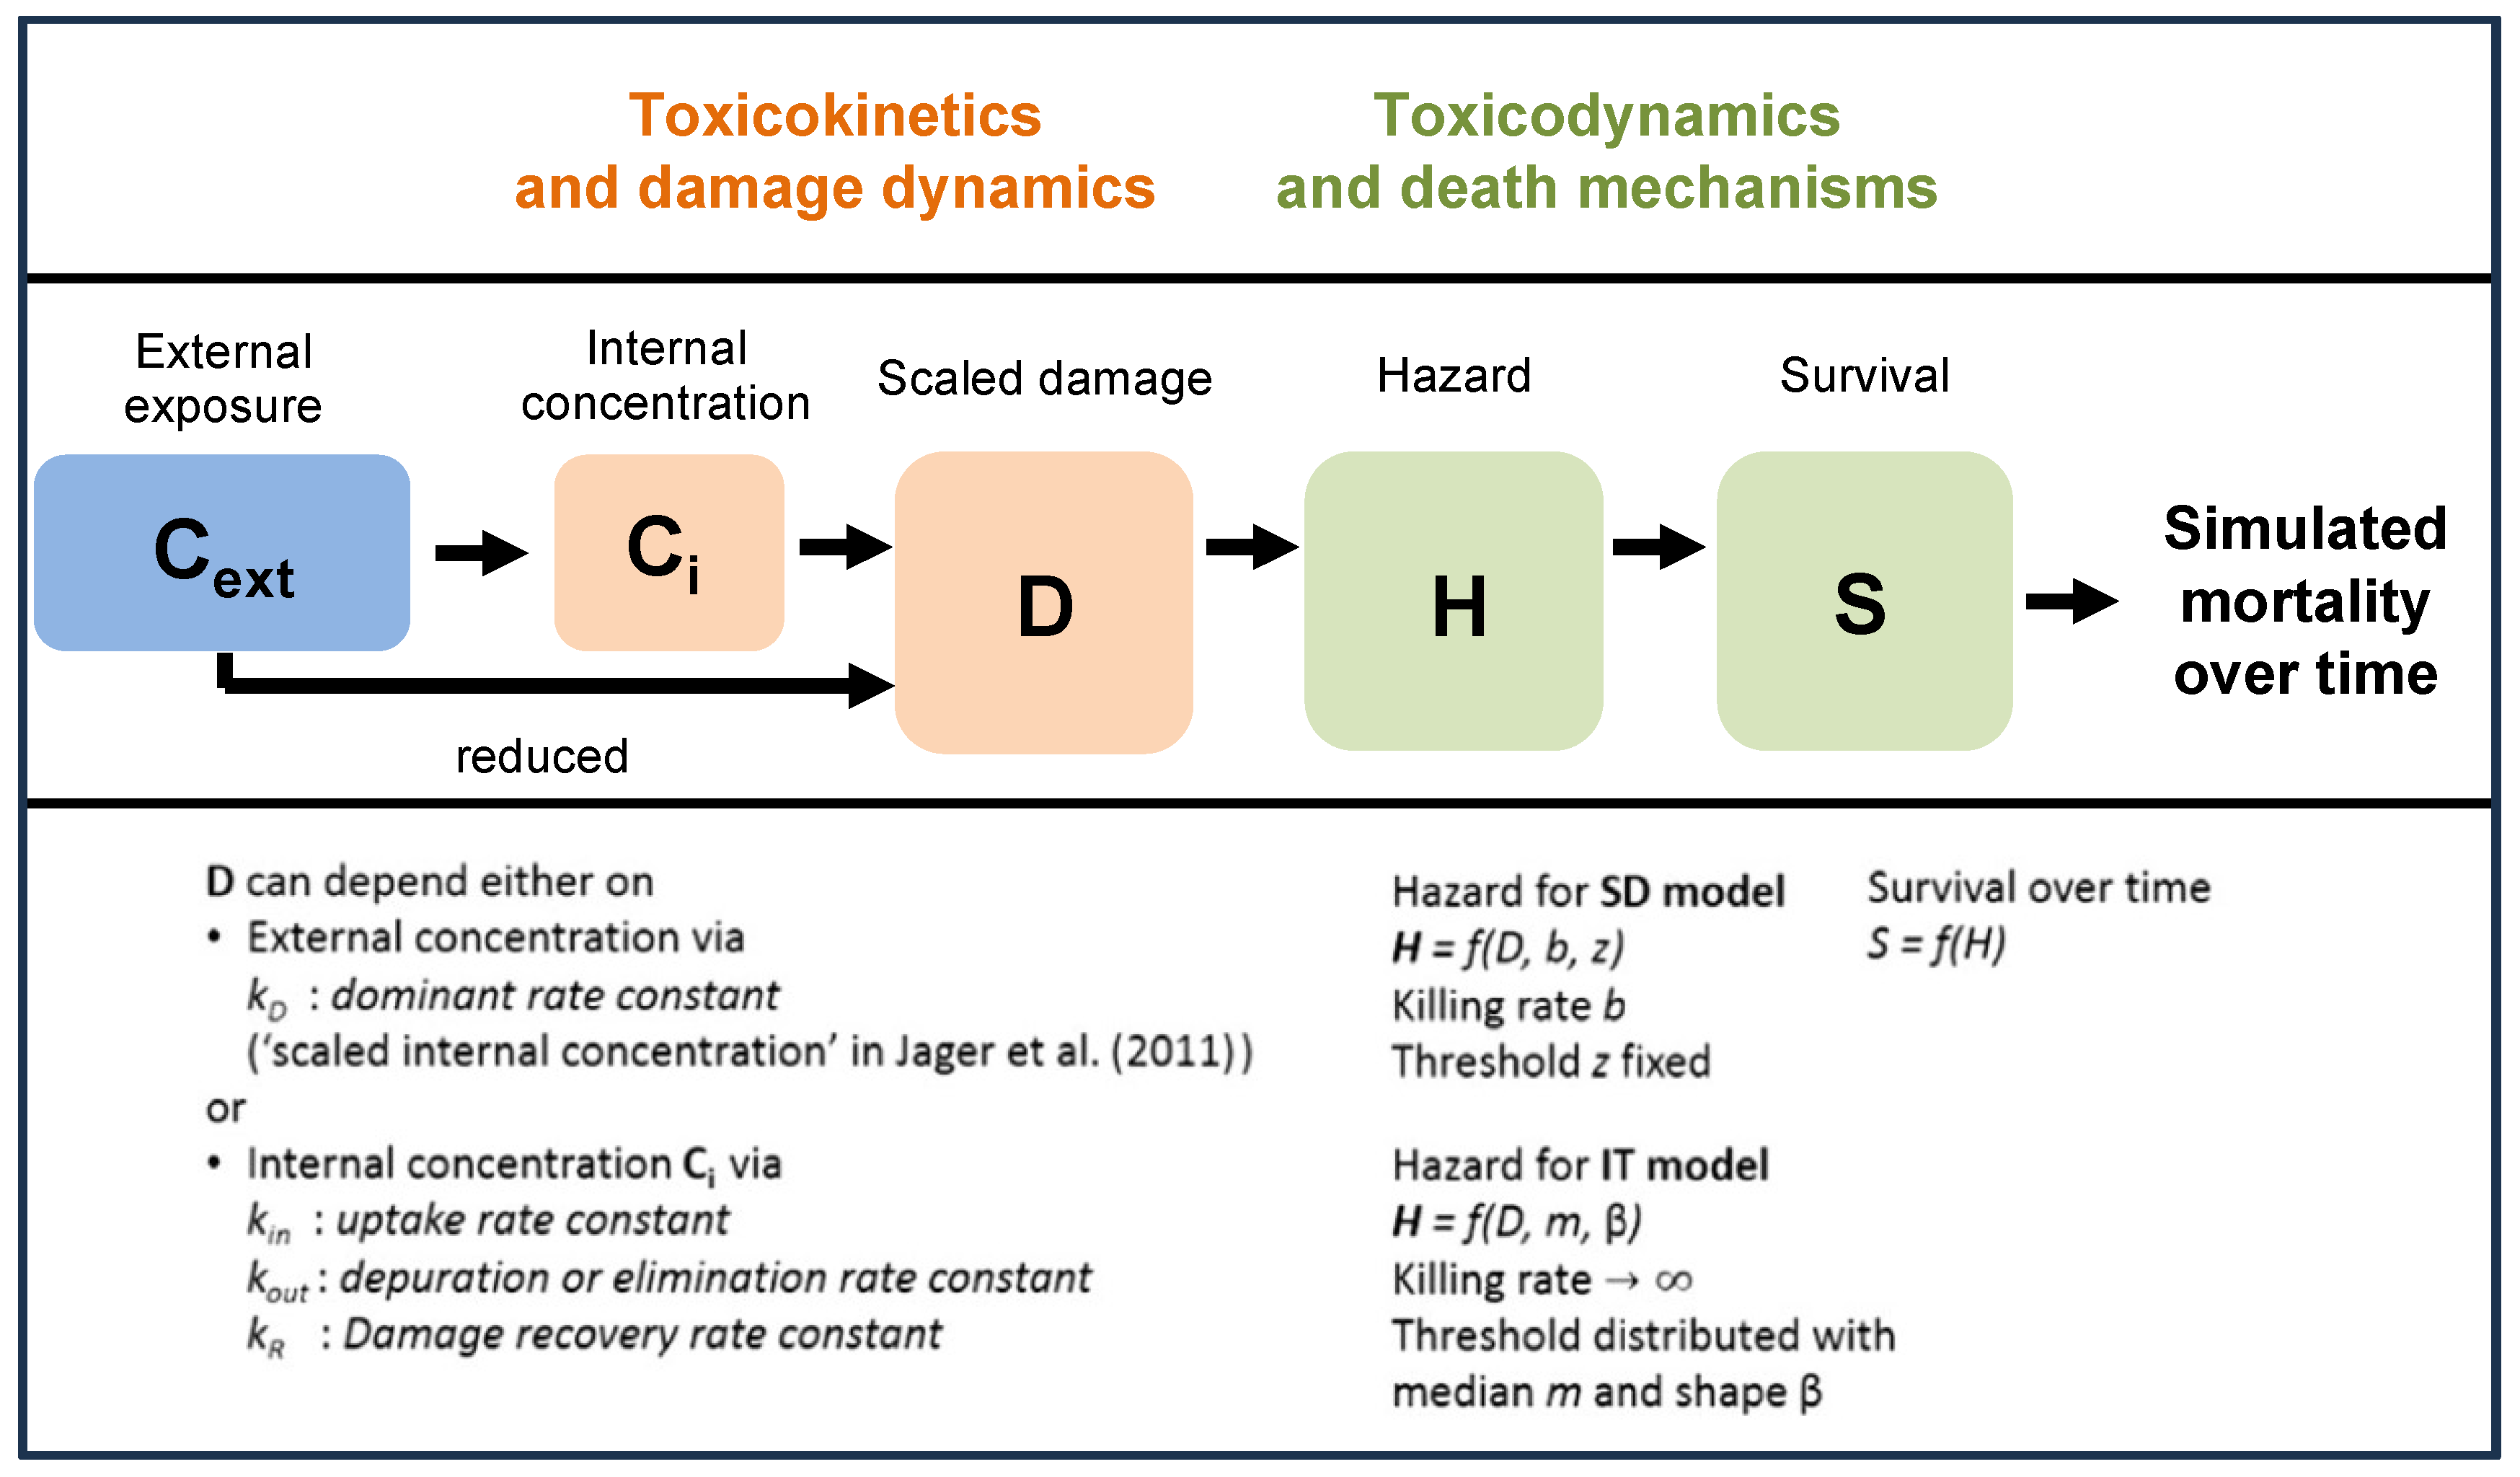
Two GUTS models were applied to the datasets of Macaulay et al. [24]: the stochastic death (SD) and individual tolerance (IT) models [15]. These two models differ in the variability of the assumed internal threshold within a group of individuals (Figure 1). In the SD model, the threshold is assumed to be the same for all individuals within a group, and death occurs at a certain rate when this threshold is exceeded. In the IT model, however, death occurs immediately when the internal threshold of an individual is exceeded. The equations of both models have previously been reported and discussed in detail and can be consulted in Jager et al. [15].
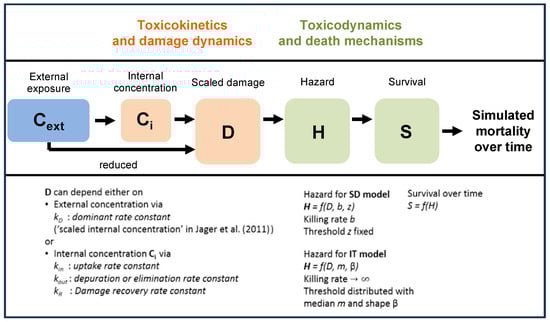
Figure 1.
Overview of state variables in the General Unified Threshold models of Survival (GUTS) framework. The toxicokinetic part of the GUTS theory translates an individual damage state dynamics in a more or less (reduced model) detailed way from an external concentration. Regarding the toxicodynamic part of the model, two death mechanisms can be distinguished: stochastic death (SD) and individual tolerance (IT) (adapted from the EFSA [18]).
In the reduced version of the GUTS, the external concentration can be directly used as scaled damage without accounting for repair or depuration (Figure 1). Subsequently, the choice of the reduced GUTS models is considered appropriate in case internal organism concentrations have not been measured, so that the use of the full model for cases in which internal concentrations are not measured cannot be recommended [18,25]. Because the internal organism concentrations were not measured in Macaulay et al. [24], the reduced versions of the GUTS models were used in our study. The SD and IT reduced GUTS models (GUTS-RED) were run using both the OpenGUTS (https://openguts.info/) and MOSAIC (https://mosaic.univ-lyon1.fr/guts/) online software packages (accessed on 1 February 2022).
2.3. Model Calibrations and Quality Assessment of Model Predictions
Automatic calibrations of the GUTS-RED-SD and GUTS-RED-IT modeling for the determination of the LCx (lethal concentration for x% of the test population) can be implemented in both OpenGUTS and MOSAIC. Even though the OpenGUTS software also has the option of a manual parametrization model, the calibrations were performed automatically in both software applications to allow for a more direct comparison of the results obtained from the two models. Focks et al. [9] reported that GUTS model predictions calibrated to acute test results underpredicted the effects of pulsed exposure on the survival for thiacloprid and thiamethoxam. Only when calibrating the SD and IT models based on data from chronic exposure were acceptable predictions obtained [9]. Consequently, we used the chronic test data from the study by Macaulay et al. [24] for the model calibrations. Because the actual test concentrations were not verified for all treatments in that study (see Section 2.1), the GUTS modeling exercise was performed using the nominal test concentrations reported in Macaulay et al. [24].
The classical root-mean-square error (RMSE) aggregates the magnitude of the prediction errors for various time points into a single measure for the power of the prediction. Subsequently, to provide a criterion expressed as a percentage, the RMSE normalized by the mean of the observations was calculated in the present study using the following equation (for explanation, see Focks et al. [9]):
2.4. Species Sensitivity Distributions (SSDs)
The differential chronic toxicity of the three neonicotinoids to arthropods (crustaceans and insects) besides the test species used in the present study (Deleatidium spp.) was also evaluated. To this end, toxicity data for clothianidin, imidacloprid, and thiamethoxam were extracted from the US-EPA (United States Environmental Protection Agency) ECOTOX database (http://cfpub.epa.gov/ecotox/). Only median-lethal-concentration (LC50) values with a test duration ≥ 14 d using mortality as a test parameter were considered. In case more than one toxicity value for one of the test compounds was available for the same species, the geometric mean (gm) of these values was calculated and used for the construction of the SSDs. Subsequently, a certain species was only represented with a single data point in the SSDs. This was performed to avoid an overrepresentation of more frequently tested species in the differential sensitivity analysis.
SSDs were constructed using the ETX computer program version 2.0 [26]. Because this program assumes a lognormal distribution of the toxicity data, the lognormality of the toxicity dataset of each test compound was tested using the Anderson–Darling Test included in the ETX software package. Lognormality was accepted at the 5% significance level, which was the case for each of the three test compounds. The hazardous concentrations for 5% (HC5) and 50% (HC50) of each species assemblage, together with their 95% confidence intervals, were also calculated with the ETX program, which is based on the methodology outlined in Aldenberg and Jaworska [27].
3. Results and Discussion
3.1. Relative Toxicities of Test Compounds
Macaulay et al. [24] reported that imidacloprid and clothianidin exerted the highest chronic toxicities to Deleatidium nymphs, with 28 d LC50 values of 0.28 and 1.36 μg/L, respectively. Thiamethoxam showed the lowest toxicity, with a 28 d LC50 > 4 μg/L (i.e., the highest concentration tested). The nicotinic acetylcholine receptor binding affinity and specificity have been reported to be similar among different neonicotinoids [28]. It may thus be anticipated that different neonicotinoid insecticides show similar toxicity potencies to the same species [9]. In addition, imidacloprid, clothianidin, and thiamethoxam all contain an electronegative nitro-substituted heterocyclic group [21]. Such compounds have been reported to be more toxic than neonicotinoids containing a cyano-substituted heterocyclic group, such as acetamiprid and thiacloprid, which have greater detoxification potential [29,30].
Based on the above, no differential toxicity of the three neonicotinoids, as denoted both experimentally as well as through the modeling exercise in the present study (see below), would be expected. Because differences in the hydrophobicity of the test substances may affect the uptake (i.e., penetration across the cuticle and membrane), this may affect the insecticidal activity [31]. However, this is not likely to be critical to aquatic invertebrate species [21]. Differences in neonicotinoid potency are best explained at the cellular level by differential binding, with both the neonicotinoid structure and receptor subunits playing a role, or at the physiological level by variation in nervous system inhibition [32,33]. In other words, the toxicity of a neonicotinoid depends on the toxicokinetics and toxicodynamics and, as such, on the combination of the test compound and test species evaluated (Figure 1). In line with this, Van den Brink et al. [20] reported equal acute and chronic toxicities to a winter generation of the mayfly Cloeon dipterum for imidacloprid and thiamethoxam.
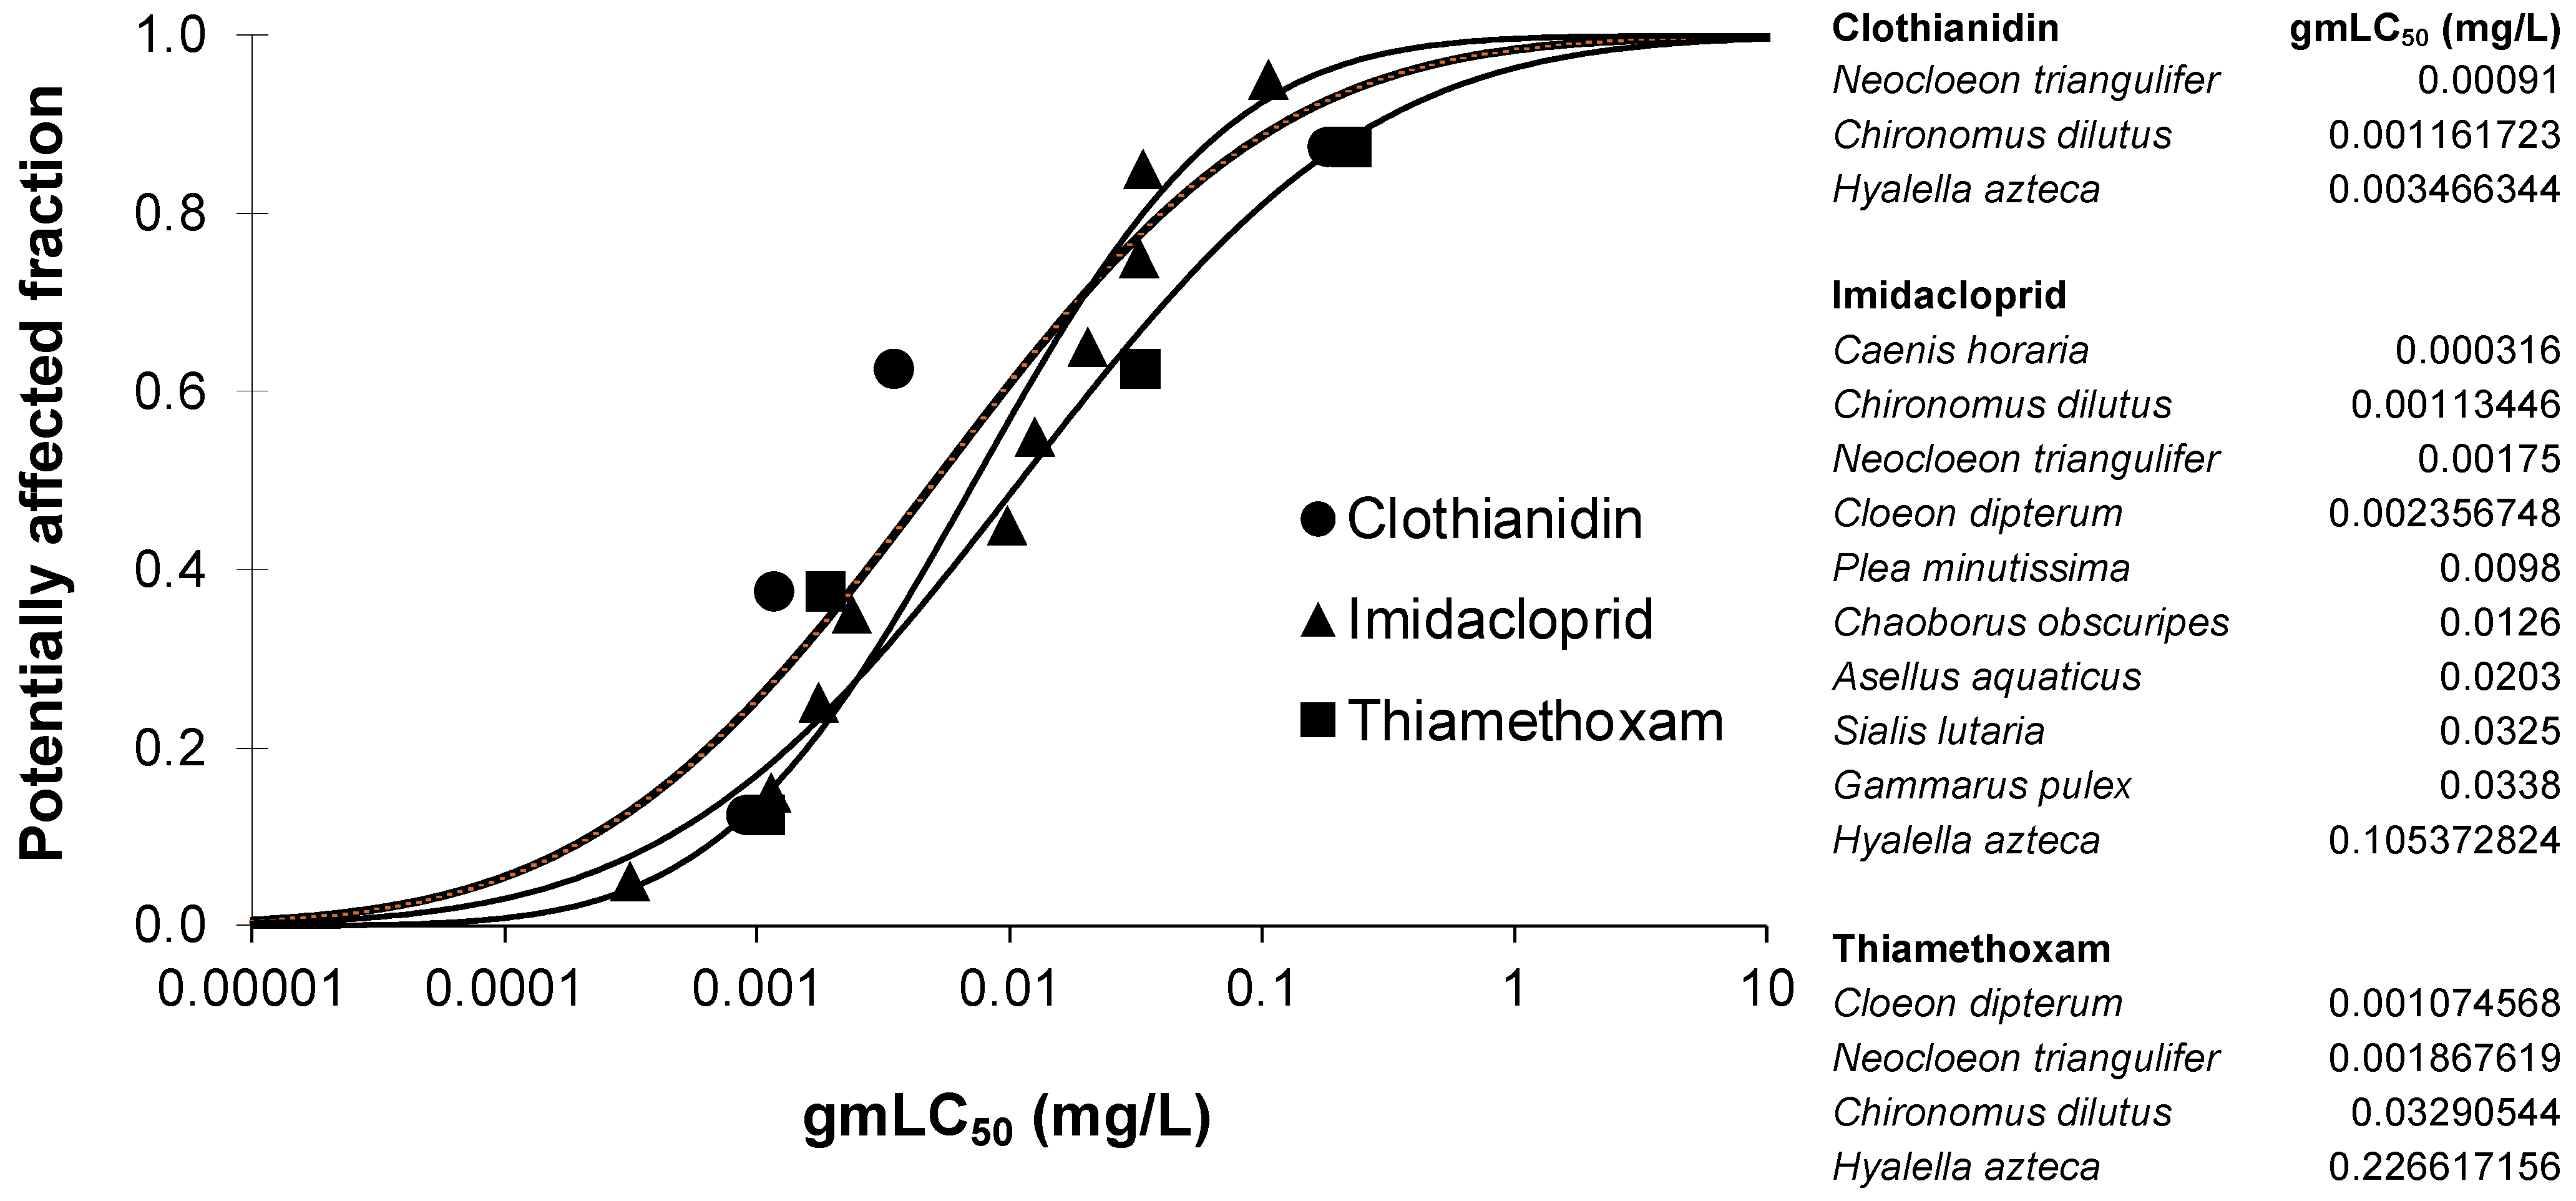
As outlined in Section 2.4, the differential sensitivity of arthropods (crustaceans and insects) besides the test species used in the present study (Deleatidium spp.) towards the three neonicotinoids was also evaluated. Figure 2 shows the SSD curves that were constructed based on the ≥14 d LC50 data that were mined from the US-EPA ECOTOX database (see Section 2.4 for details). The sensitivity distribution curves of clothianidin, imidacloprid, and thiamethoxam lay close together, which confirms the overall similar sensitivity of arthropods as a whole taxonomic group to the three test compounds. This is confirmed by the similarity in the HC50 values and the overlap in their 95% confidence intervals for clothianidin (5.1; 0.28–92), imidacloprid (7.3; 2.5–21), and thiamethoxam (11; 0.58–212) (all data in μg/L). However, differences in the sensitivity of individual arthropod taxa to the three test neonicotinoids were also confirmed, as the most sensitive species differed for clothianidin (Neocloeon triangulifer), imidacloprid (Caenis horaria), and thiamethoxam (C. dipterum). Although this evidently also depends on the data availability (the amount and type of species tested were indeed different among the three neonicotinoids), the most sensitive species for all the compounds was a mayfly, confirming the high chronic sensitivity of this insect order to neonicotinoids, as discussed above.
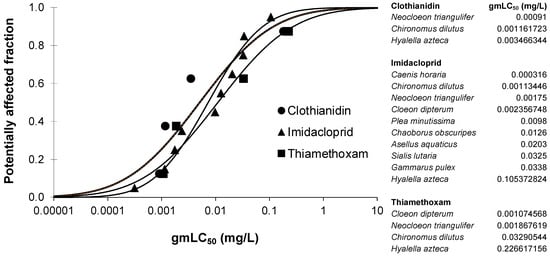
Figure 2.
Species sensitivity distribution curves of gmLC50 (geometric-mean-of-median-lethal-concentration) values of arthropods (crustaceans and insects) for clothianidin, imidacloprid, and thiamethoxam (for explanation, see text). The gmLC50 values used to construct the curves are indicated on the right side of the figure.
3.2. Toxicity of Neonicotinoids Increased with Increasing Test Duration
The dataset described in the previous section was also used to evaluate the increase in toxicity of the three neonicotinoids for crustaceans and insects separately. To this end, acute gmLC50 values of these compounds were compared with those using a longer test duration. Acute gmLC50 values included those values with a test duration between one and four days, in which preference was given to the toxicity value with the lowest test duration (i.e., 1 d; if not available, 2 d, etc.). Ratios in percentages were calculated by dividing a gmLC50 value for a test duration longer than the gmLC50 with the shortest test duration available (e.g., 28 d gmLC50 = 0.1 mg/L) by the gmLC50 with the shortest test duration available (e.g., 1 d gmLC50 = 100). With these example values, the calculated ratio was 0.1/100 × 100% = 0.1%, for an increase in the test duration of 27 d. Figure 3 shows the curves that were constructed based on these ratios for crustacean and insects separately. It can be concluded from this figure that the increase in toxicity with the increasing exposure duration is greater for insects than for crustaceans. In line with this, Song and Brown [34] reported a median time to 50% lethality (LT50) of 27 h–29 h for the mosquito Aedes taeniorhynchus, whereas the corresponding LT50 interval for brine shrimp (Artemia sp.) was 34 h–52 h.
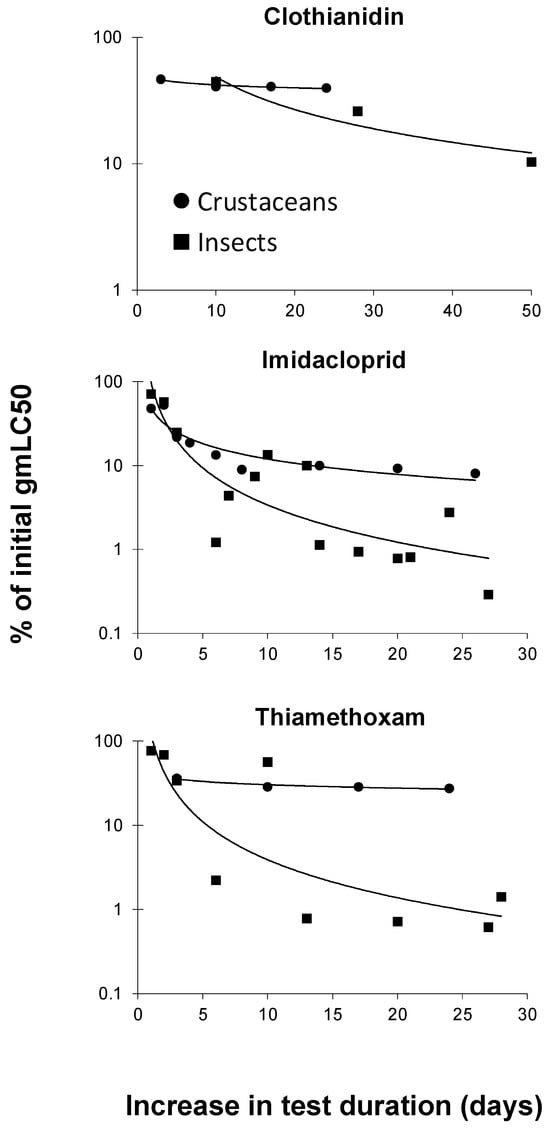
Figure 3.
Decreases in LC50 (median-lethal-concentration) values (as percentages of initial values) for crustaceans and insects with increasing exposure duration to clothianidin, imidacloprid, and thiamethoxam (for detailed explanation, see text).
Neonicotinoids are specifically designed to bind to the nicotinic acetylcholine receptors (nAChRs) found in insect pest species [21]. Because insects are most sensitive to neonicotinoids [21,33], it is anticipated that they may suffer the most from increasing neonicotinoid exposure durations.
3.3. Comparison of Model Performances
As discussed above, the EFSA [18] considered that the GUTS framework is ready for use in aquatic risk assessment. They demonstrated this by using the dataset of Nyman et al. [35], in which the survival of the crustacean Gammarus pulex exposed to the azole fungicide propiconazole was assessed. He et al. [36] also concluded that there was a negligible difference between the experimentally observed survival and predictions by the GUTS for zebrafish (Danio rerio) exposed to metals. Subsequently, the GUTS framework has been demonstrated to be an accurate tool for several compounds [36]. However, as the EFSA [18] also discussed, doubts remain regarding the predictive power of the GUTS framework for compounds that show increased toxicity over time, such as neonicotinoids.
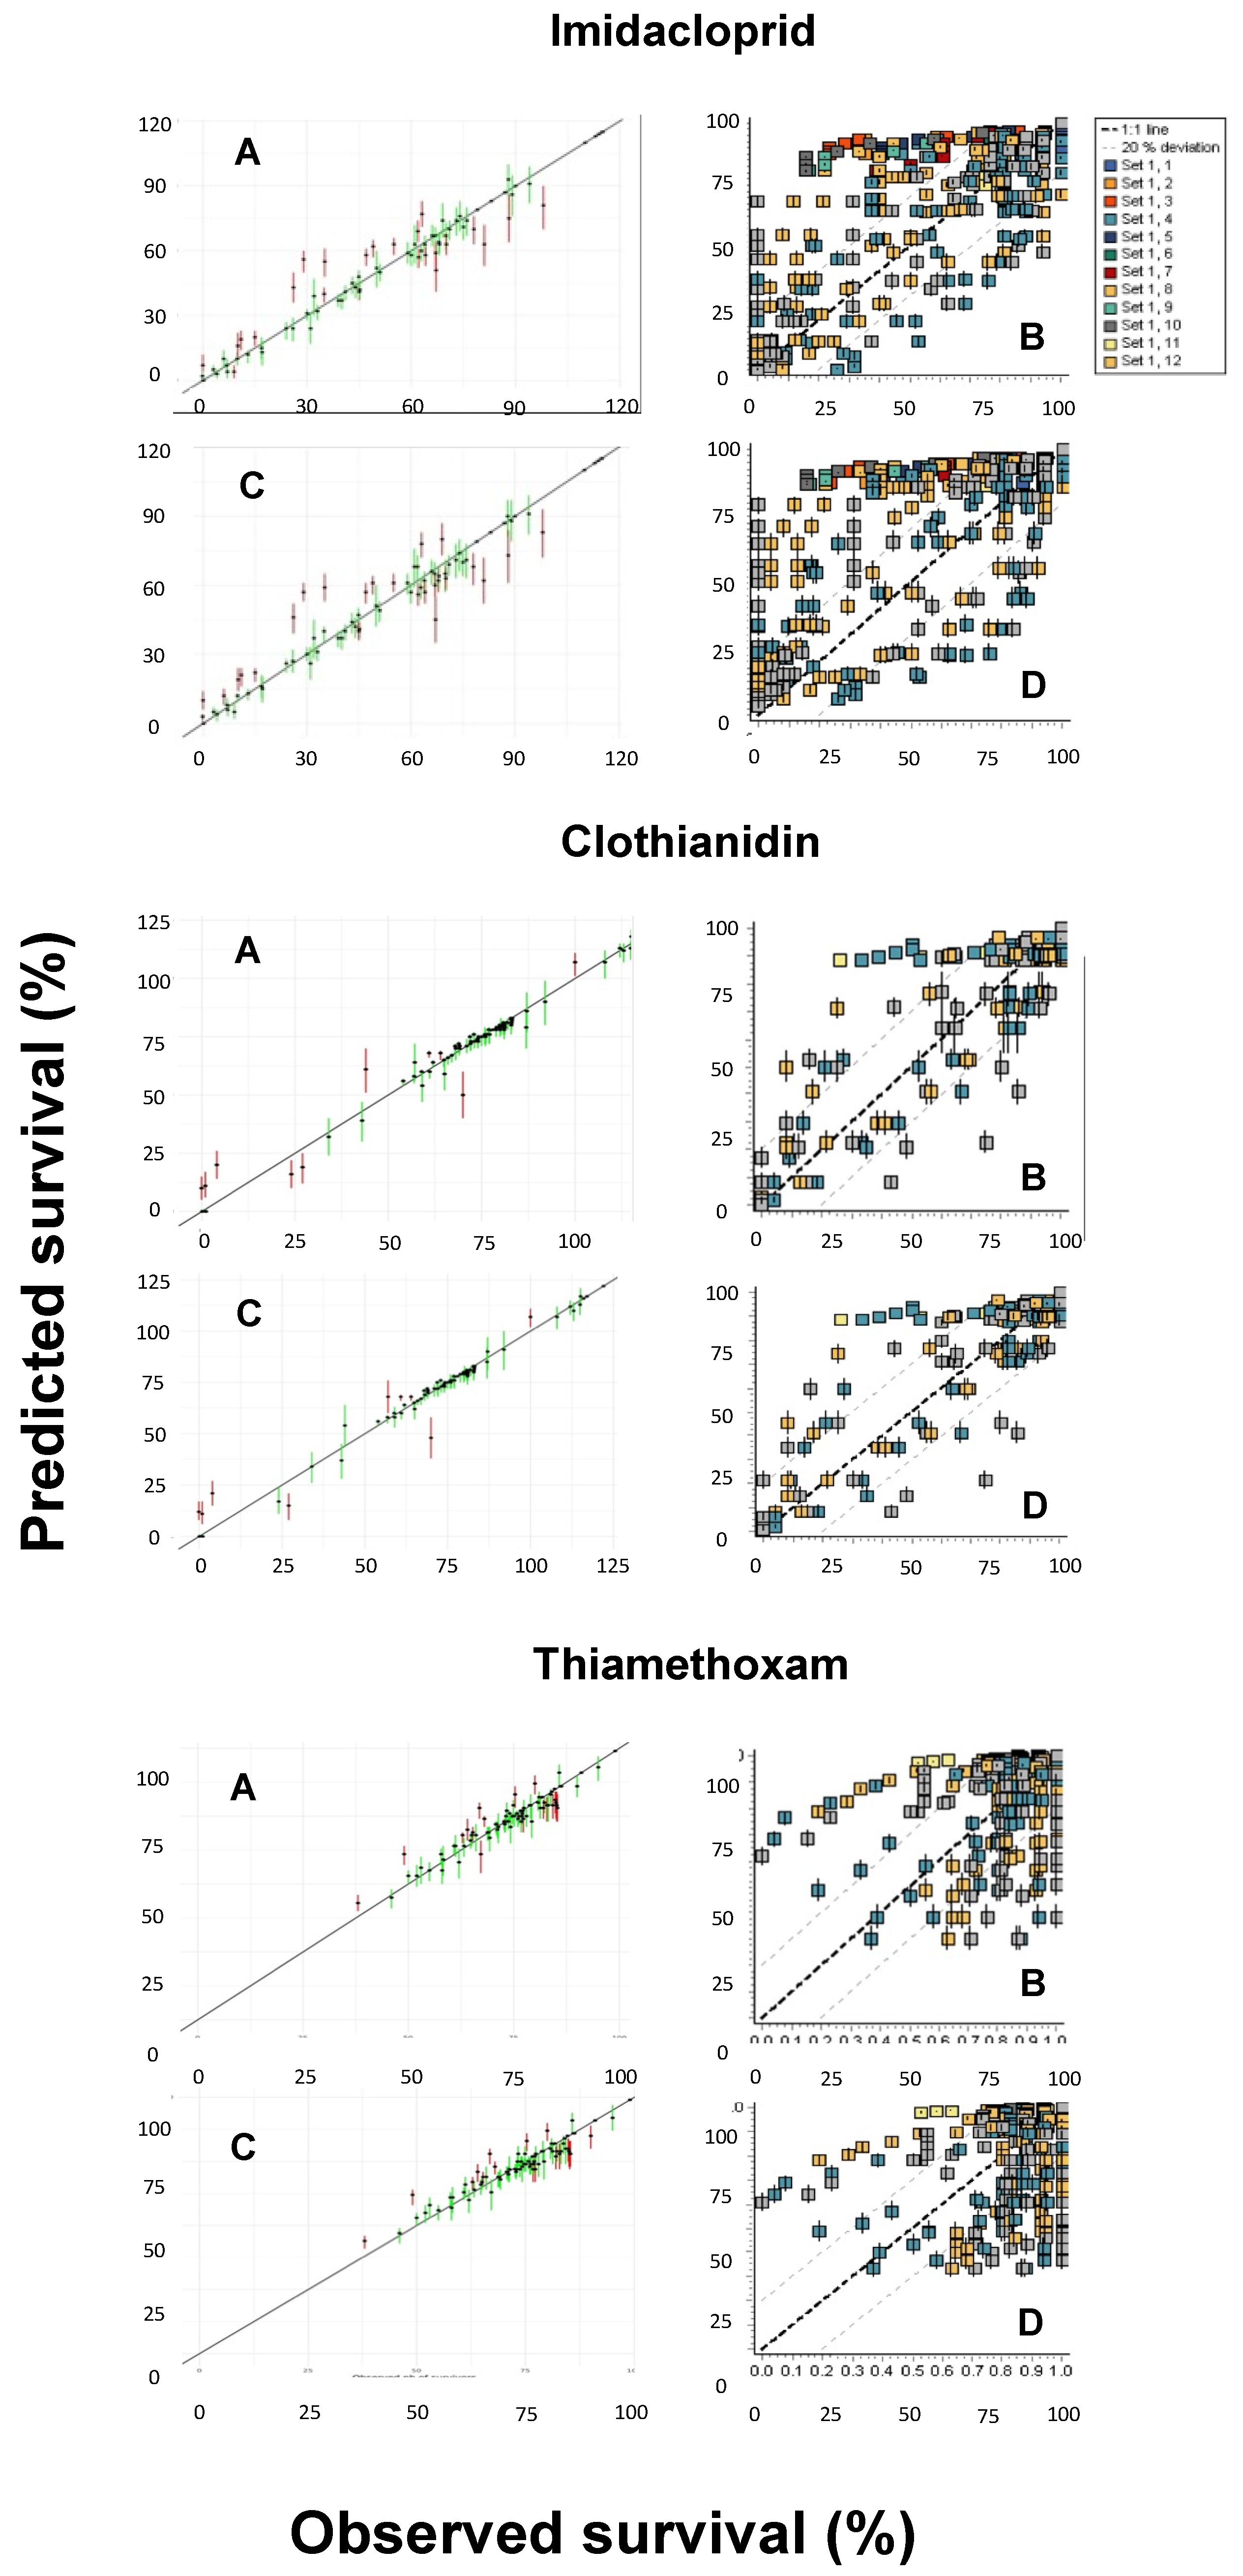
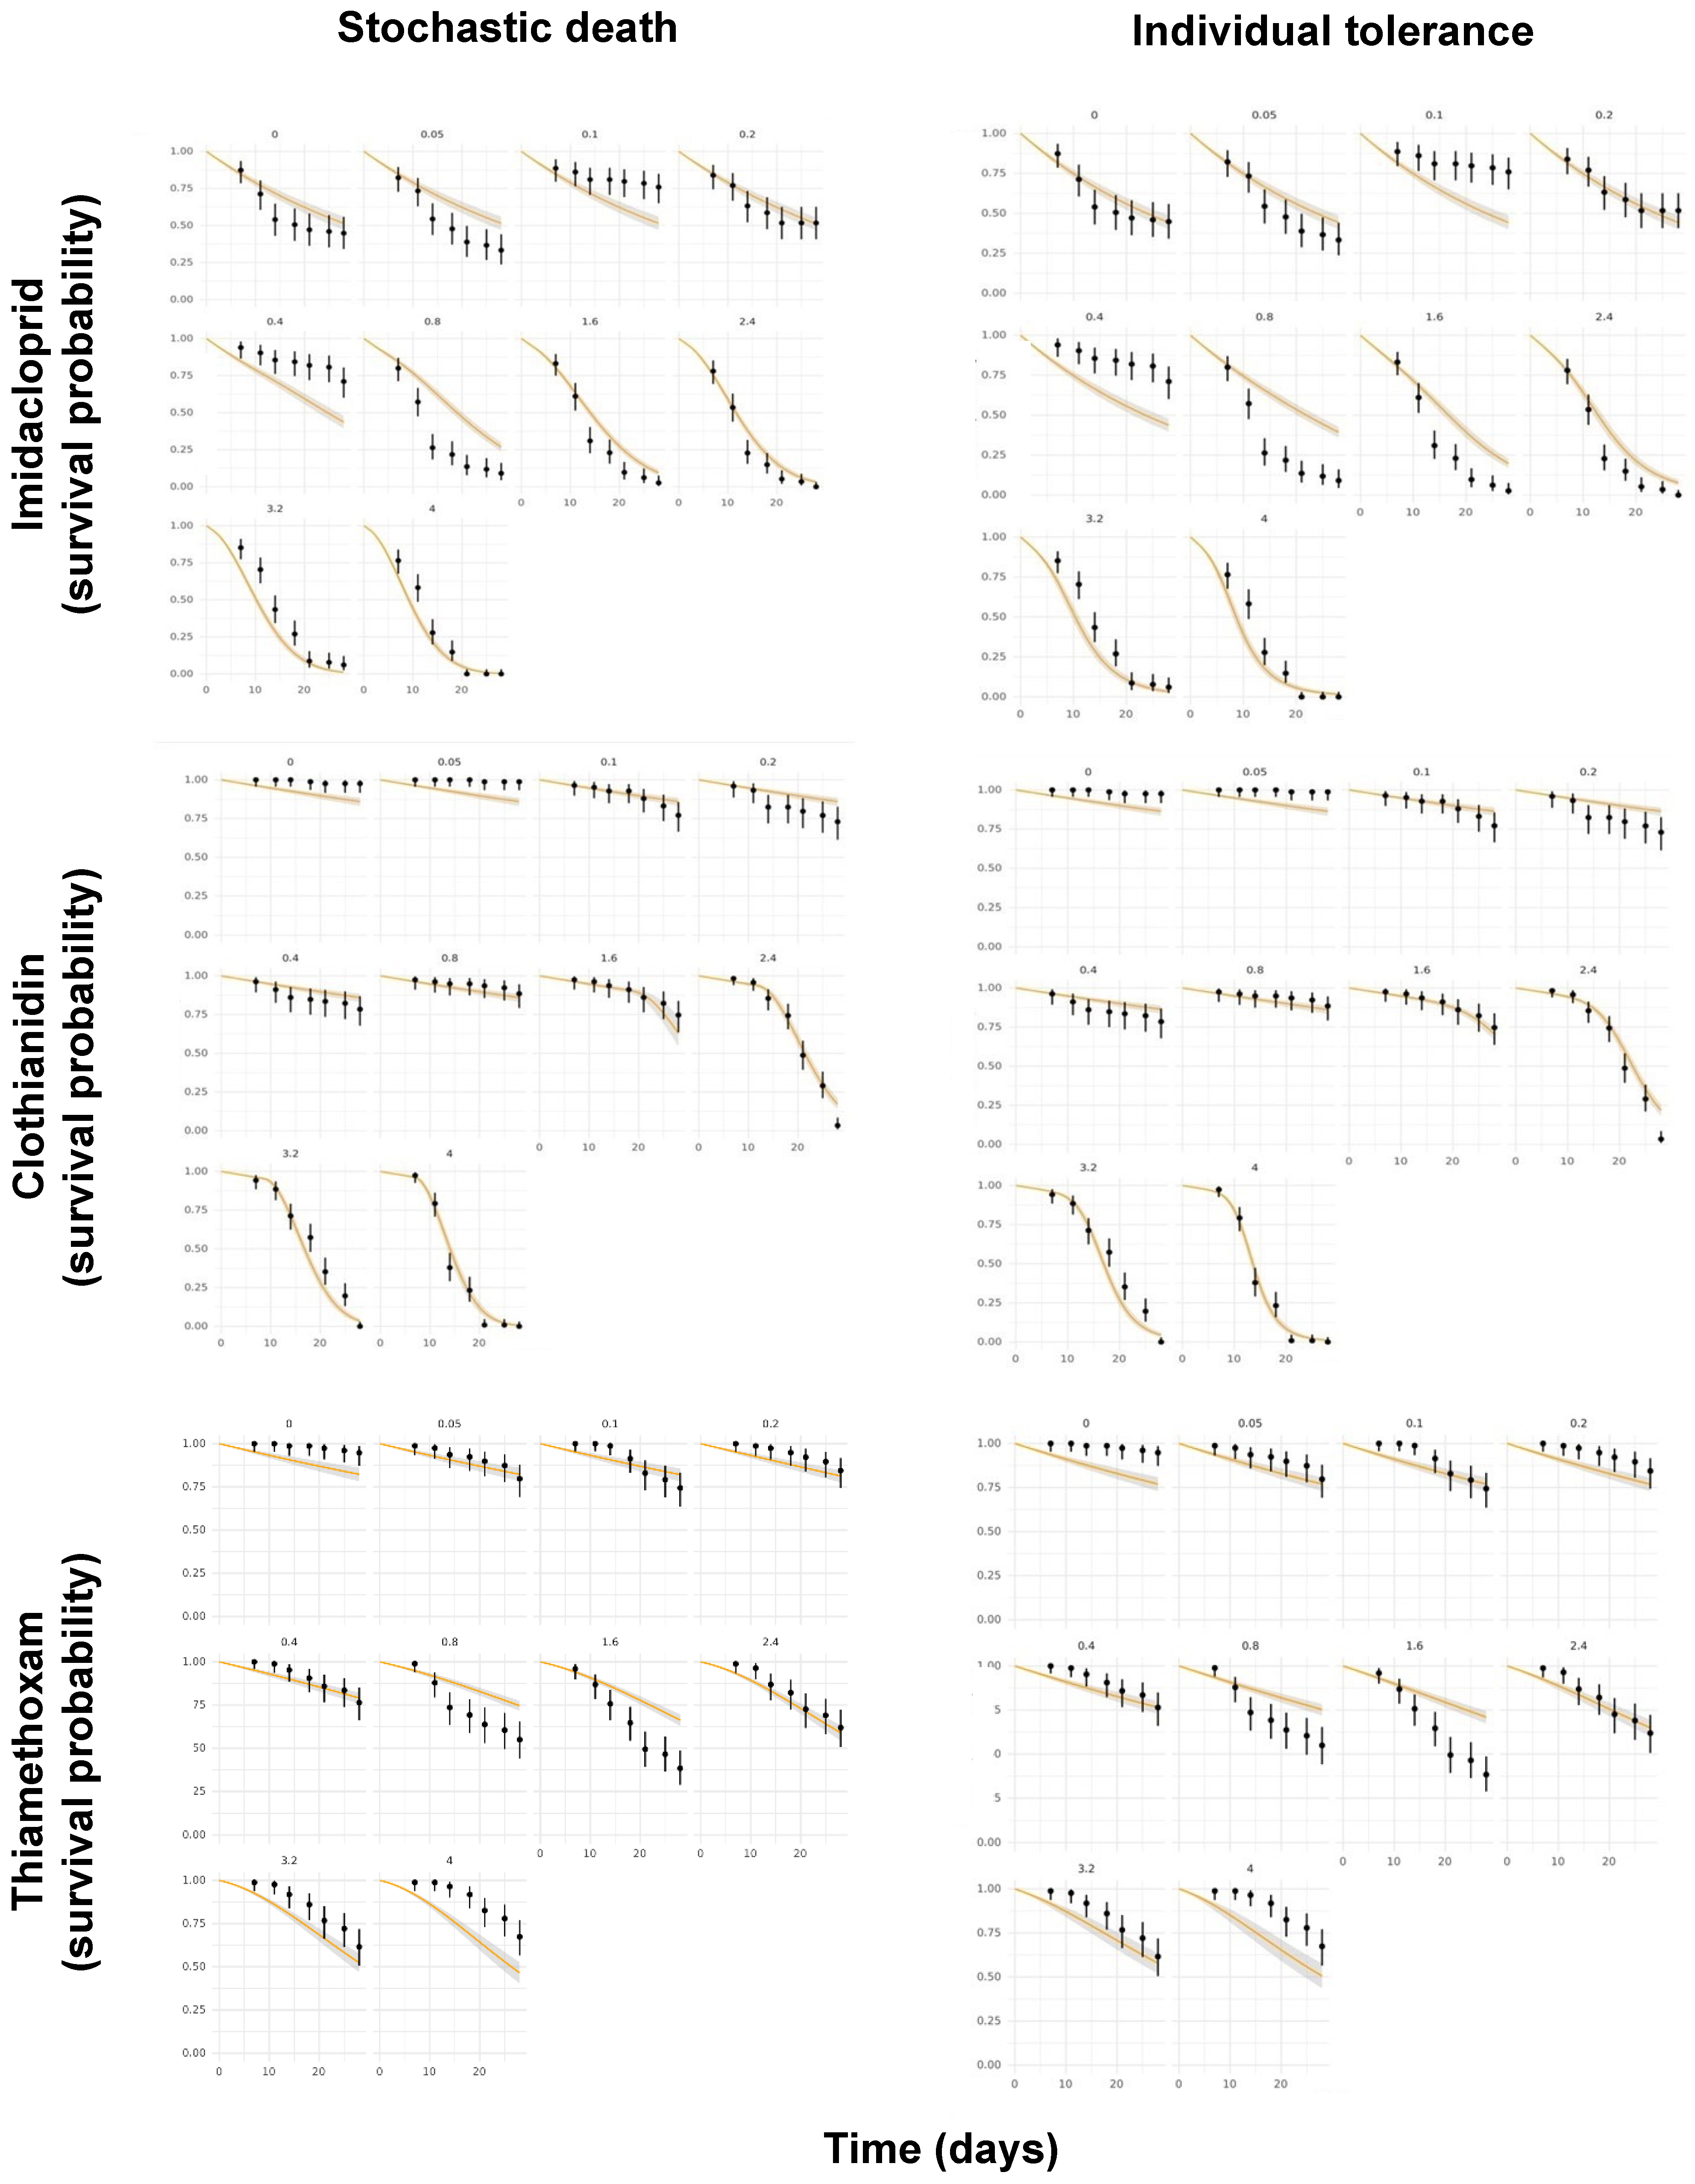
Another pending issue discussed by the EFSA [18] is the duality of the SD and IT death mechanisms. While both the GUTS-SD and GUTS-IT models outcompete classical target time (TT) approaches, choosing one preferentially over the other is still challenging [37,38]. However, because the data requirements for the model calibration are the same, both reduced models can usually be parameterized [18], as was performed in the present study. Figure 4 shows the posterior predictive checks (PPCs) for the models evaluated, whereas Figure 5 allows for a visual comparison of the experimentally derived survival rates and those modeled by the MOSAIC-SD and MOSAIC-IT models. From these, it can be deduced that there was an overall match between the observed and predicted survival probabilities for clothianidin, although there were some differences for imidacloprid and, to a lesser extent, thiamethoxam (Figure 5).
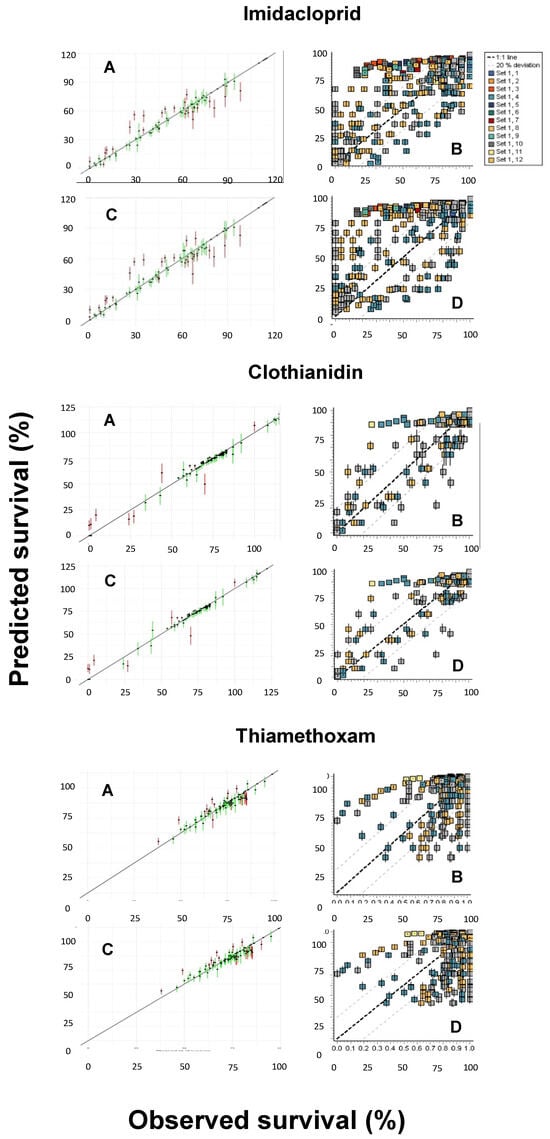
Figure 4.
Posterior predictive checks (PPCs) for the General Unified Threshold models of Survival (GUTS) models and the three neonicotinoids (imidacloprid, clothianidin, and thiamethoxam) evaluated: (A) MOSAIC-SD; (B) OpenGUTS-SD; (C) MOSAIC-IT; (D) OpenGUTS-IT, where SD refers to stochastic death and IT refers to individual tolerance. The diagonal lines represent the 1:1 lines of the predicted and observed effects.
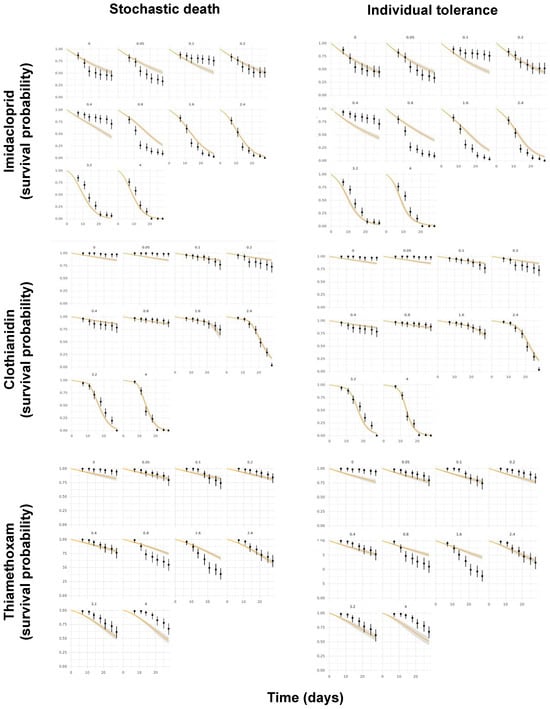
Figure 5.
Comparison of the experimentally derived survival probabilities in time (black dots) for imidacloprid, clothianidin, and thiamethoxam and those modeled by the MOSAIC-SD (stochastic death) and MOSAIC-IT (individual tolerance) models (orange curves), with their respective 95% confidence intervals.
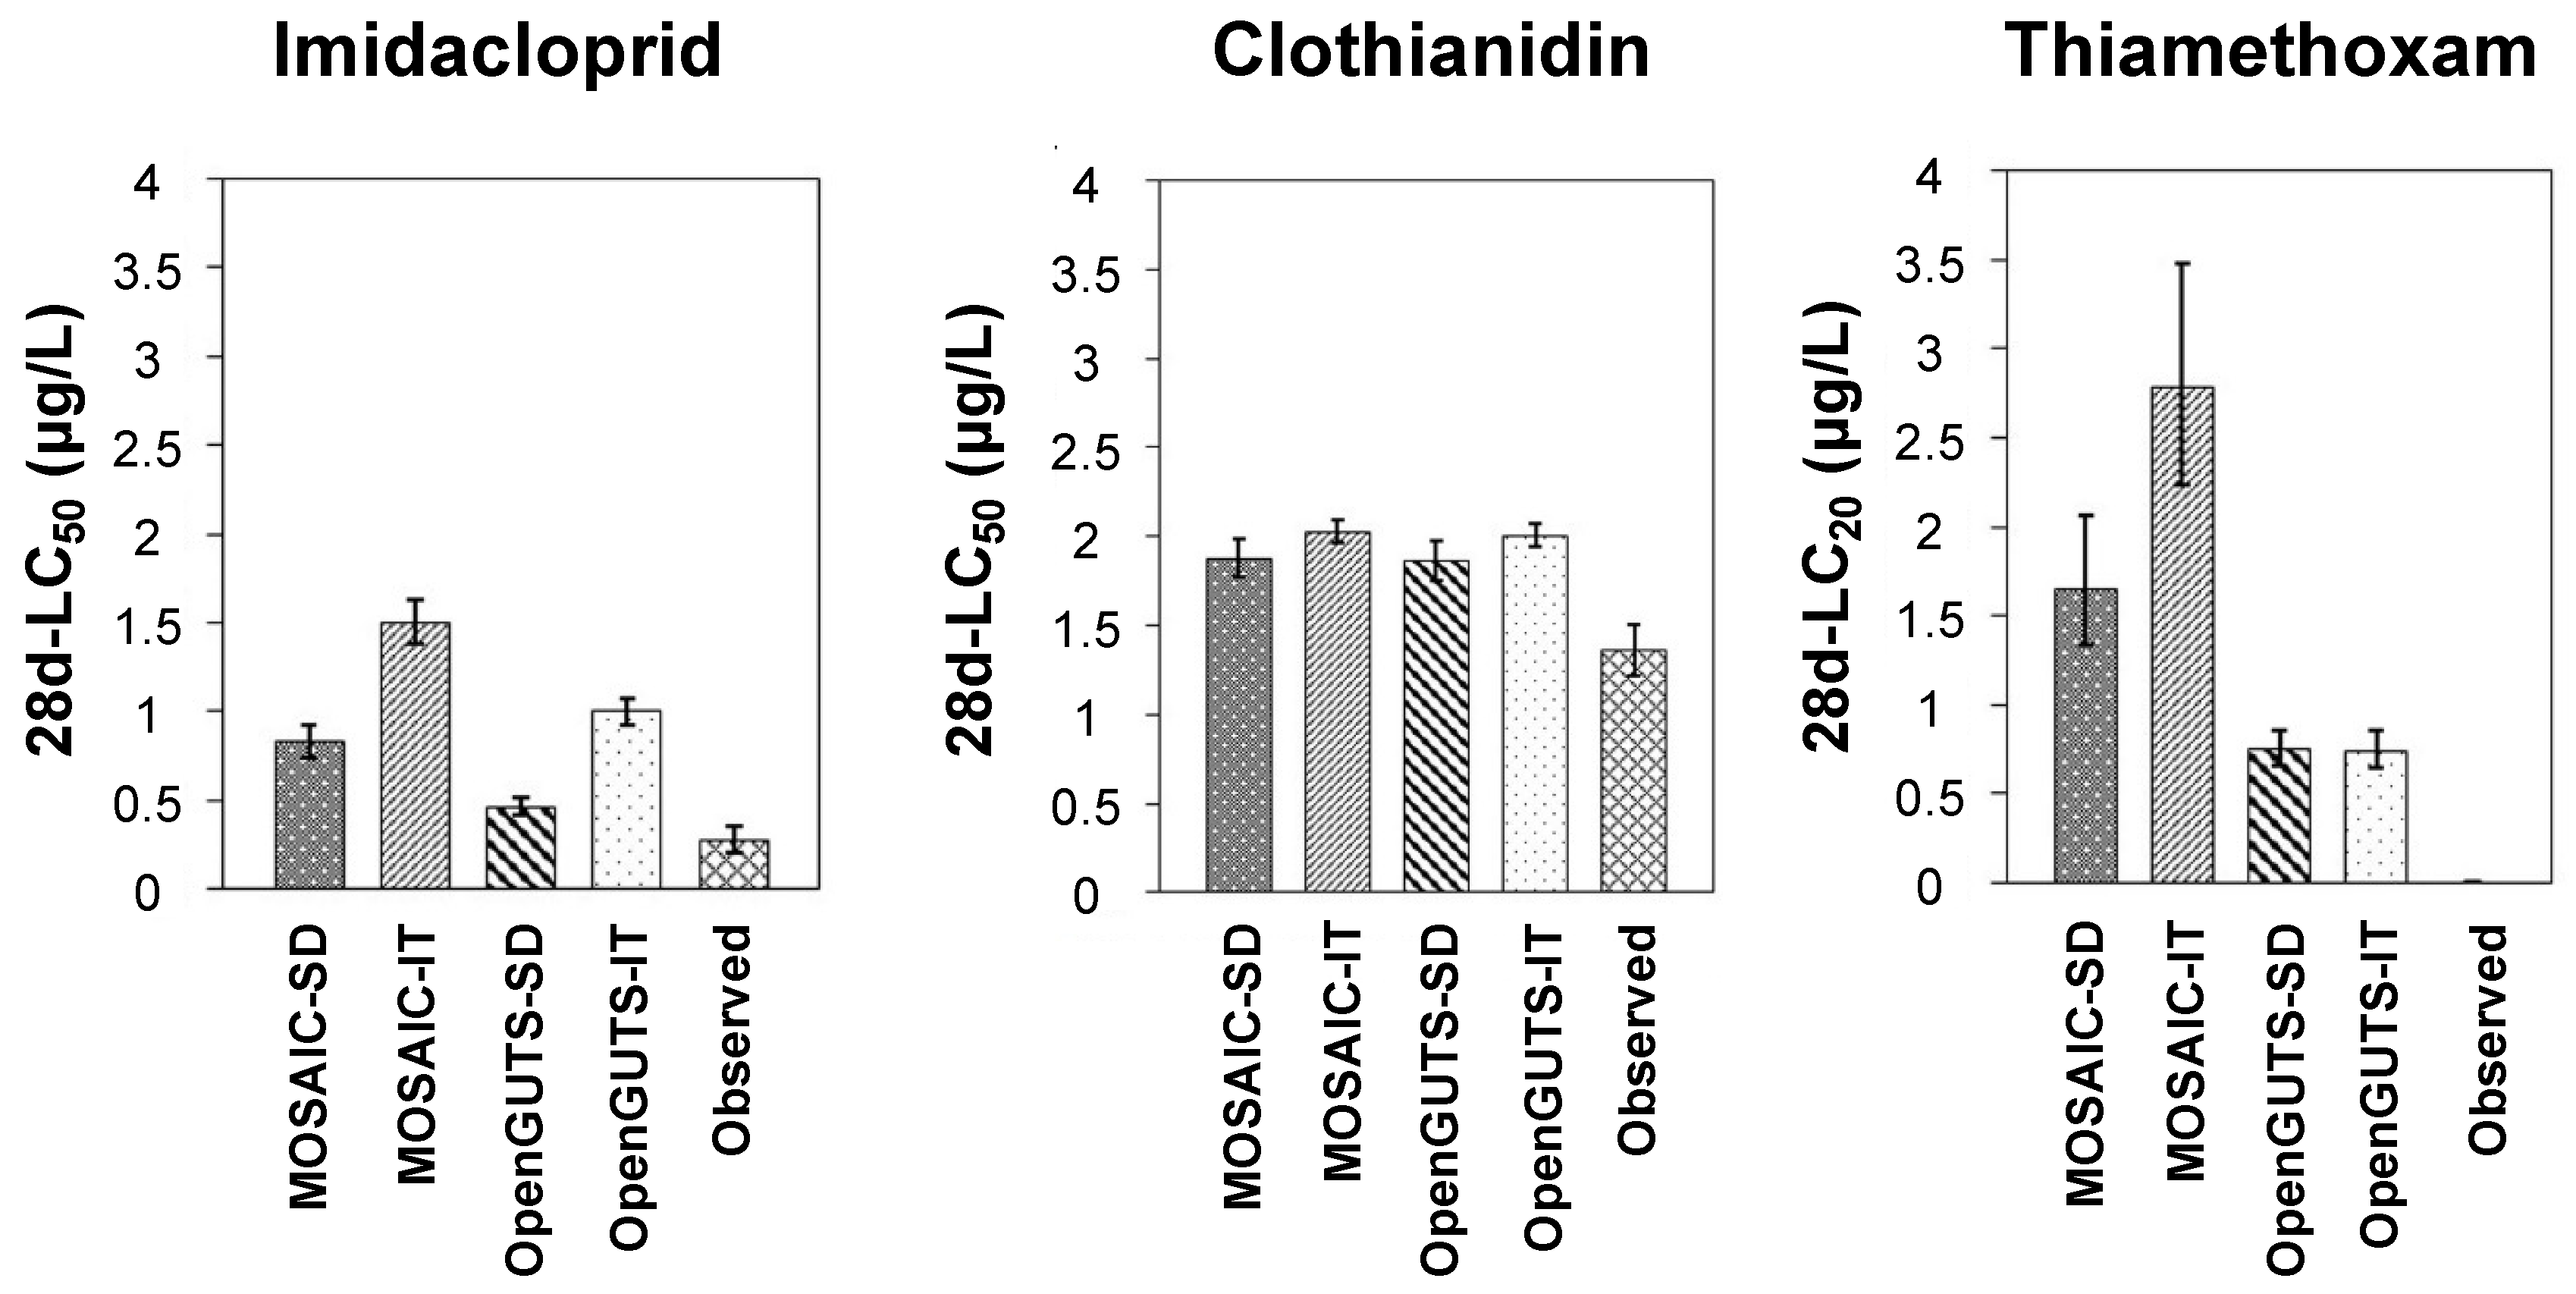
As discussed above, the normalized root-mean-square error (NRMSE) has been indicated as one of the most suitable quantitative indicators for the comparison of the predicted and experimentally derived survival in time [9,18]. For clothianidin, the NRMSE values were lower (20% for both SD and IT) than those for imidacloprid (56% for SD and 67% for IT) and thiamethoxam (27% for SD and 29% for IT). Consequently, these NRMSE values corroborate the overall visual observations discussed above. For thiamethoxam, the low fit between the modeled and experimental survival in time is probably related to the test concentrations evaluated by Macaulay et al. [24]. Because the highest thiamethoxam test concentration did not exceed a 50% effect on the survival rates, deriving an LC50 value for this compound was not possible. Subsequently, LC20 values were used for further comparison between the modeled and experimental results (Figure 6). Large estimation errors may indeed be expected in low-toxic-effect data because the linearizing transformation enlarges the errors at both ends of the sigmoid dose–response curve [39].

Figure 6.
Comparison of the predicted and experimentally derived (observed) toxicity thresholds (median lethal concentration (LC50) for imidacloprid and clothianidin, and lethal concentration for 20% of the test population (LC20) for thiamethoxam). Each column represents a mean toxicity value, and bars indicate the standard deviation. SD—stochastic death; IT—individual tolerance.
3.4. Predicted versus Observed Toxicity Values
Figure 6 allows for a visual comparison of the predicted and experimentally derived toxicity thresholds (LC50 for imidacloprid and clothianidin, and LC20 for thiamethoxam). The LC20 values predicted by all the models for thiamethoxam differed more than the maximum acceptable level of 50% suggested by the EFSA [18], for the reasons discussed in the previous section. However, this criterion was achieved for clothianidin in all the models, with little difference between the four models evaluated (Figure 6). For imidacloprid, all the models underestimated the observed LC50 values, although the SD models of both OpenGUTS and MOSAIC clearly showed a closer approximation to the observed LC50 values than the corresponding IT models (Figure 6). Indeed, the (reduced versions of the) SD models have been recommended for implementation in regulatory risk assessments because their model predictions tend to lead to an overestimation of the mortality and thus to a more conservative risk assessment than (reduced versions of the) IT models [18]. Focks et al. [9] also showed several cases of neonicotinoid LC50 underestimations using especially IT models for five macroinvertebrates, including the mayflies C. horaria and C. dipterum. Although the underestimations were lowered when the models were calibrated using data from chronic-exposure studies (rather than acute data), the SD model results overall remained better than those obtained through IT models [9].
The overall modeling misfit (except for clothianidin), especially considering that it resulted in an underestimation of the toxic effects, reinforces the above discussion that the application of GUTS models for risk assessments of neonicotinoids needs further evaluation. More (sensitive) species should be tested in specifically designed (repeated) experiments that allow for validating the use of GUTS models for predicting time-varying neonicotinoid toxicity. Additionally, the underlying equations used in the GUTS models may need to be amended to come to better model predictions for compounds with substantial increases in toxicity over time, like neonicotinoids.
3.5. Concluding Remarks and Indications for Future Research
Both the present study and the study by Focks et al. [9] stress the need to shed better light on the applicability of (eventually adapted) GUTS models for implementation in regulatory risk assessments of neonicotinoids. Such studies should also account for the various parameters that are known to influence the modeling results, such as differences in the test compounds, experimental durations, and test species, including their size/sensitive life stage and sex [13,17,40], as well as the influence of pesticide mixtures on the predicted toxicity [41]. Huang et al. [40], for example, demonstrated that females of the aquatic sowbug Asellus aquaticus were less sensitive to imidacloprid than males. The authors explained this by the lower internal biotransformation of imidacloprid to the more toxic imidacloprid–olefin in females as compared to males [40]. Organisms are seldomly exposed to a single chemical stressor in the field. Bart et al. [41] assessed the predictive power of the GUTS for D. magna, the terrestrial oligochaete Enchytraeus crypticus, and the honeybee Apis mellifera exposed to binary chemical mixtures. They demonstrated that GUTS models are also a useful tool when assessing the risk of mixtures, and that they offer a framework to implement new mechanistic knowledge [41].
The use of data from published studies is potentially an option, but, practically, they rarely provide raw data and/or adopt an experimental design that allows for a GUTS modeling exercise [42]. Indeed, for the present study, numerous papers were evaluated but only the study by Macaulay et al. [24] could be used, despite the shortcomings discussed above.
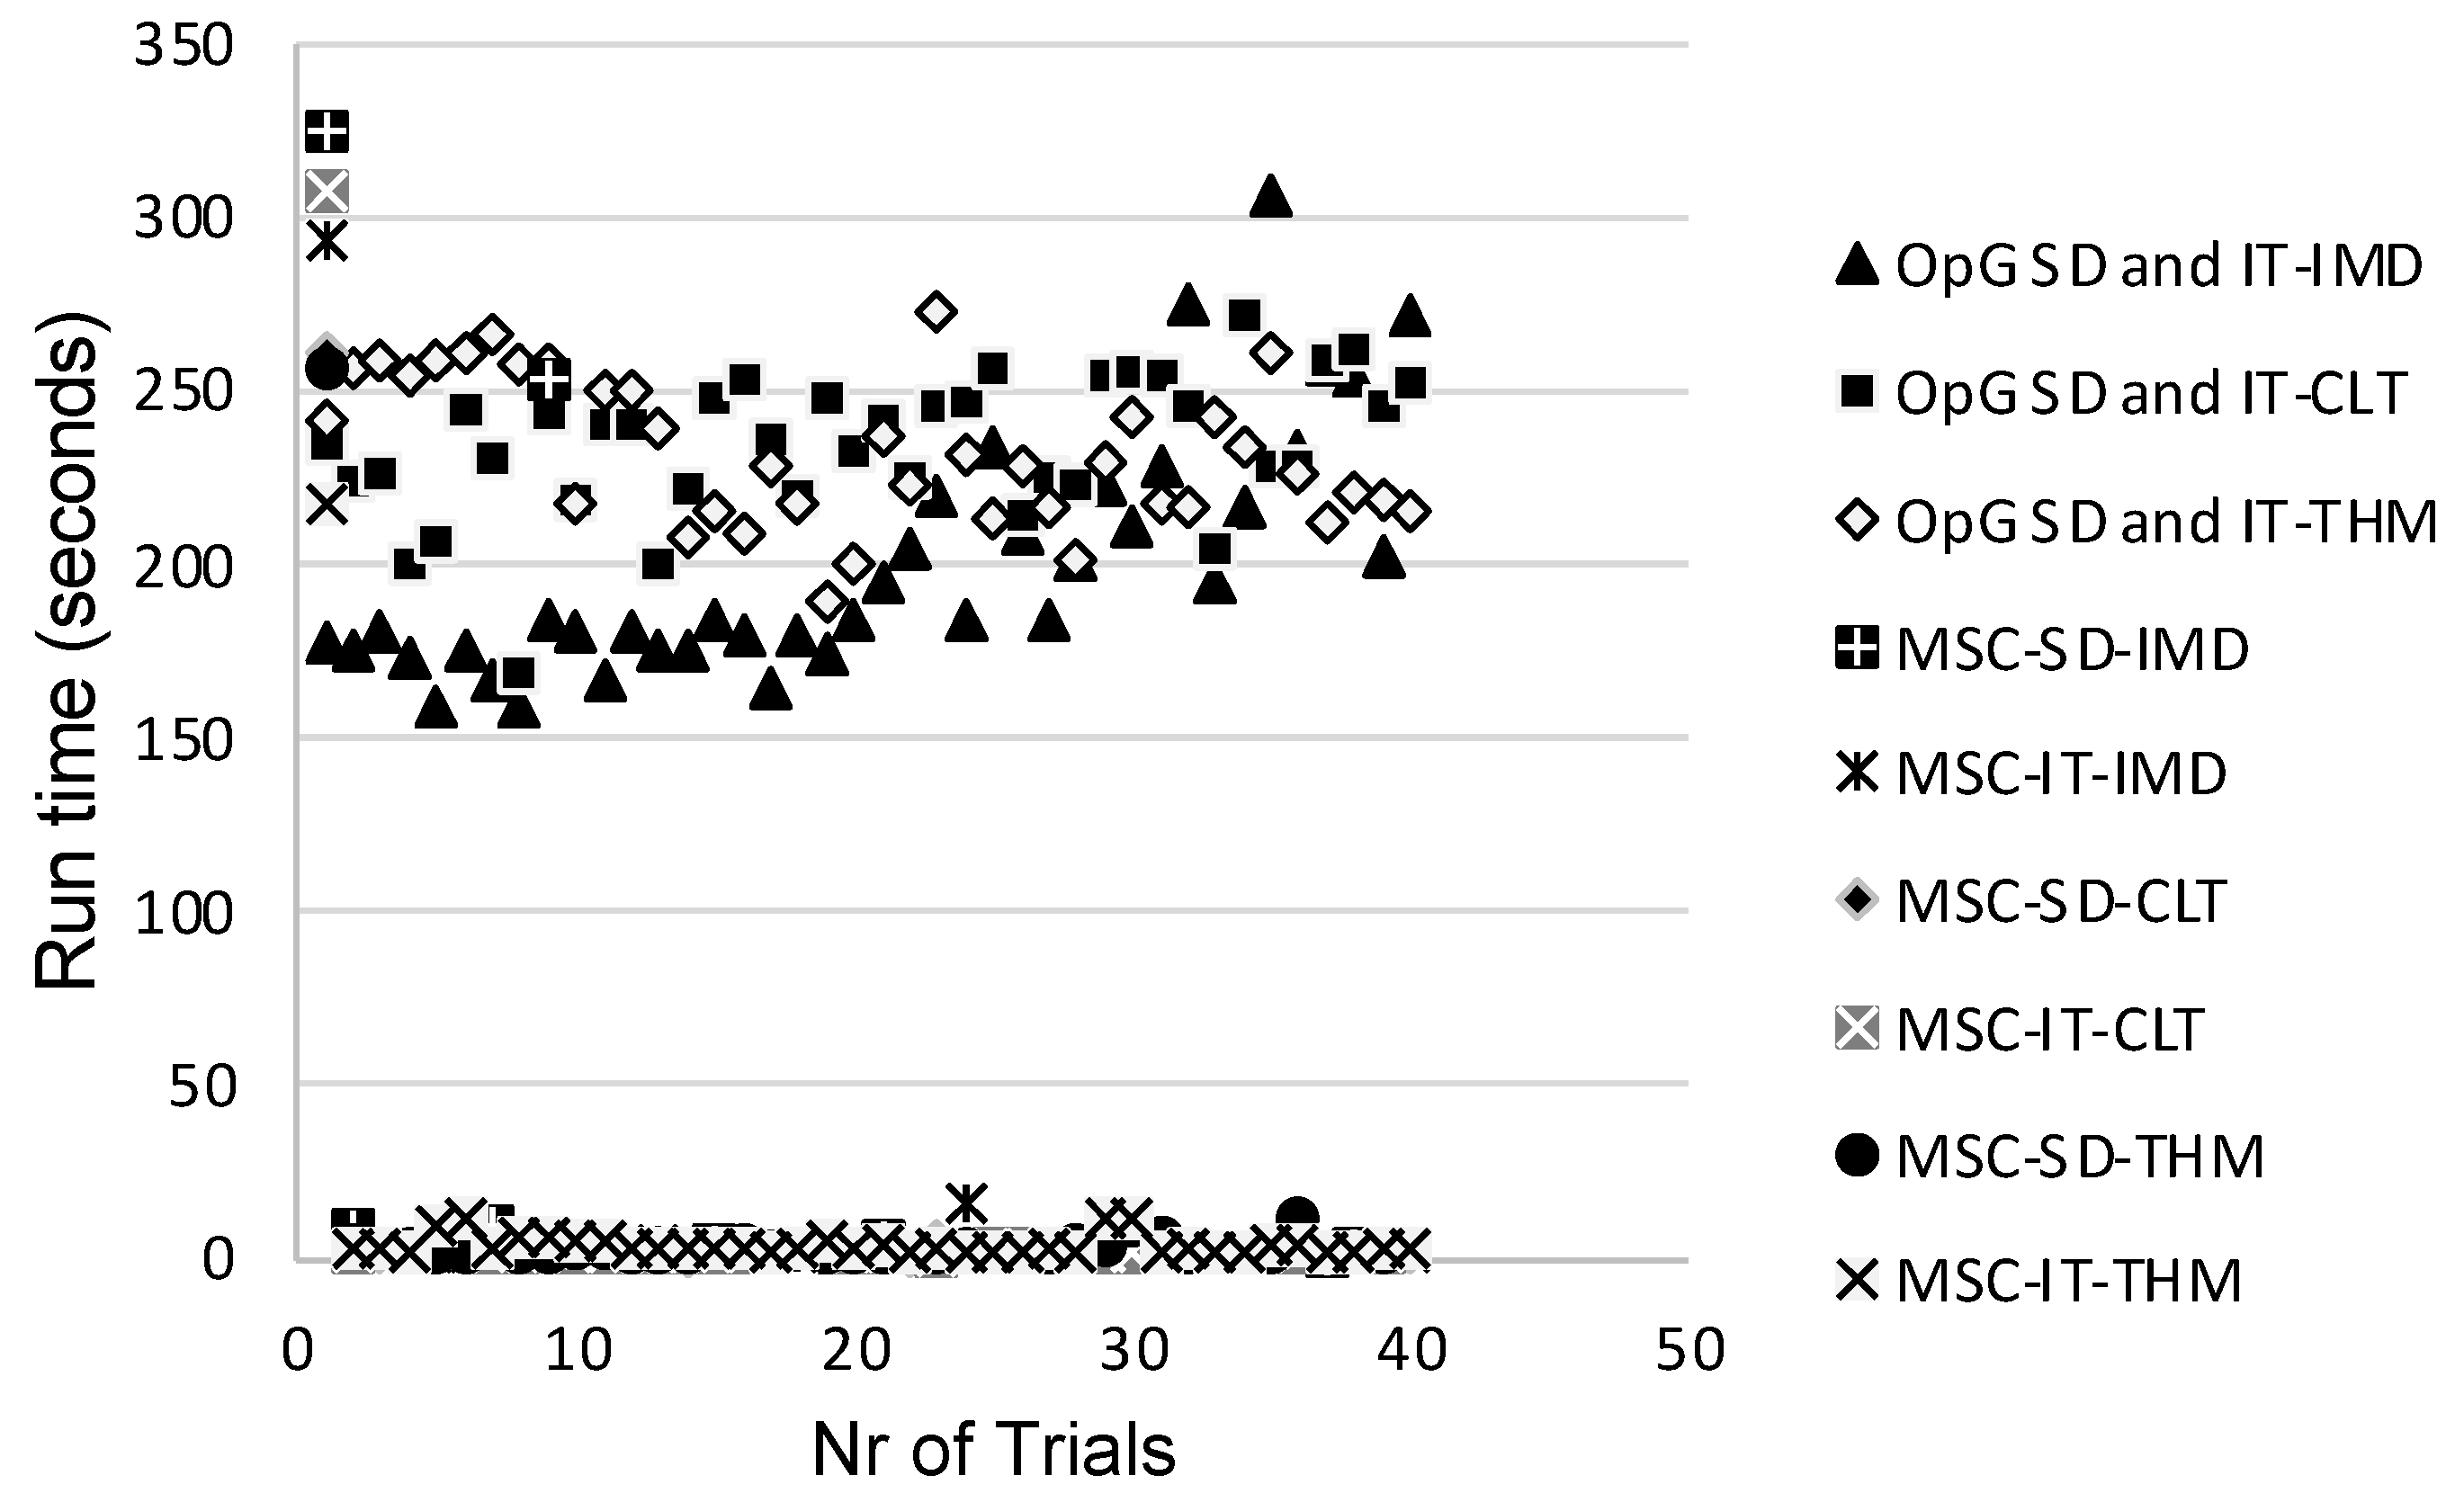
Ideally, future studies should evaluate the RED-SD and RED-IT models using both the OpenGUTS and MOSAIC software to enable assessing which model and software combination is most suitable for implementation in actual regulatory risk assessment. Charles et al. [43] discussed that the MOSAIC software package may be more suitable because its founding principles were specifically designed considering the direct expectations of practitioners, making it an easily accessible, ready-to-use tool encompassing all the necessary services that have already been recognized as providing toxicity indices of interest in full compliance with regulatory guidelines and risk assessment decision criteria. A logistic reason for opting for MOSAIC is that the runtime per trial is only a matter of seconds, whereas the runtime for OpenGUTS is in the multiple-minutes range, as determined in the present study (Figure 7).
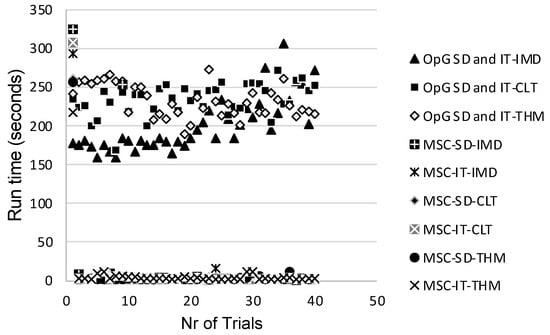
Figure 7.
Runtime per trial for each of the evaluated General Unified Threshold models of Survival (GUTS) models. OpG—OpenGUTS; MSC—MOSAIC; SD—stochastic death; IT—individual tolerance; IMD—imidacloprid; CLT—clothianidin; THM—thiamethoxam.
Author Contributions
Conceptualization, V.S.C.L.; methodology, V.S.C.L. and M.A.D.; resources, M.A.D.; writing—original draft preparation, V.S.C.L.; writing—review and editing, M.A.D. and N.L.F.; supervision, M.A.D. and N.L.F.; funding acquisition, M.A.D. and N.L.F. All authors have read and agreed to the published version of the manuscript.
Funding
This research was funded by the Portuguese Foundation for Science and Technology (FCT) through the strategic projects UIDB/04085/2020 (CENSE), LA/P/0121/2020 (CHANGE), UIDB/04292/2020 (MARE), and LA/P/0069/2020 (ARNET).
Data Availability Statement
Data are contained within the article.
Conflicts of Interest
The authors declare no conflicts of interest.
References
- UNEP. Environmental and Health Impacts of Pesticides and Fertilizers and Ways of Minimizing Them: Synthesis Report; United Nations Environment Program: Nairobi, Kenya, 2022; ISBN 9789280739299. [Google Scholar]
- Grandview Research Agrochemicals Market Size To Reach $289.56 Billion by 2030. Available online: https://www.grandviewresearch.com/press-release/global-agrochemicals-market (accessed on 17 January 2024).
- Capri, E.; Trevisan, M. Prediction of Environmental Concentrations (PECs) by Mathematical Model Application in Europe. Pestic. Outlook 1998, 9, 26–30. [Google Scholar]
- Daam, M.A.; Van Den Brink, P.J. Risk Assessment of Agrochemicals on Irrigation Water Quality. Acta Hortic. 2011, 922, 41–47. [Google Scholar] [CrossRef]
- Van den Brink, P.J.; Daam, M.A. Multispecies Environmental Testing Designs. In Encyclopedia of Toxicology, 3rd ed.; Elsevier: Amsterdam, The Netherlands, 2014; pp. 399–402. ISBN 9780123864543. [Google Scholar]
- Beketov, M.A.; Liess, M. Acute and Delayed Effects of the Neonicotinoid Insecticide Thiacloprid on Seven Freshwater Arthropods. Environ. Toxicol. Chem. 2008, 27, 461–470. [Google Scholar] [CrossRef] [PubMed]
- EFSA. Guidance on Tiered Risk Assessment for Plant Protection Products for Aquatic Organisms in Edge-of-Field Surface Waters. EFSA J. 2013, 11, 3290. [Google Scholar] [CrossRef]
- FOCUS Surface Water Scenarios in the EU Evaluation Process under 91/414/EEC. Report of the FOCUS Working Group on Surface Water Scenarios. EC Document Reference SANCO/4802/2001-Rev.2; EUROPEAN COMMISSION: Brussels, Belgium, 2001.
- Focks, A.; Belgers, D.; Boerwinkel, M.C.; Buijse, L.; Roessink, I.; Van den Brink, P.J. Calibration and Validation of Toxicokinetic-Toxicodynamic Models for Three Neonicotinoids and Some Aquatic Macroinvertebrates. Ecotoxicology 2018, 27, 992–1007. [Google Scholar] [CrossRef] [PubMed]
- Casallanovo, F.; Santos, G.S.; Cione, A.P.; Simone, D.M.; de Oliveira Kaminski, T.S.; Chen, W. Qualitative Analysis of the Most Locally Relevant Runoff and Erosion Parameters for Constructing Brazilian Scenarios. Integr. Environ. Assess. Manag. 2023, 19, 1374–1384. [Google Scholar] [CrossRef] [PubMed]
- Casallanovo, F.; Simone, D.M.; Santos, G.S.; de Oliveira Kaminski, T.S.; Cione, A.P.; Peranginangin, N. Estimating Pesticide Environmental Concentrations in Latin America: The Importance of Developing Local Scenarios. Integr. Environ. Assess. Manag. 2021, 17, 901–904. [Google Scholar] [CrossRef]
- Daam, M.A.; Cerejeira, M.J.; van den Brink, P.J.; Brock, T.C.M. Is It Possible to Extrapolate Results of Aquatic Microcosm and Mesocosm Experiments with Pesticides between Climate Zones in Europe? Environ. Sci. Pollut. Res. 2011, 18, 123–126. [Google Scholar] [CrossRef] [PubMed]
- Baudrot, V.; Charles, S. Recommendations to Address Uncertainties in Environmental Risk Assessment Using Toxicokinetic-Toxicodynamic Models. Sci. Rep. 2019, 9, 11432. [Google Scholar] [CrossRef]
- Ashauer, R.; Escher, B.I. Advantages of Toxicokinetic and Toxicodynamic Modelling in Aquatic Ecotoxicology and Risk Assessment. J. Environ. Monit. 2010, 12, 2056–2061. [Google Scholar] [CrossRef]
- Jager, T.; Albert, C.; Preuss, T.G.; Ashauer, R. General Unified Threshold Model of Survival—A Toxicokinetic-Toxicodynamic Framework for Ecotoxicology. Environ. Sci. Technol. 2011, 45, 2529–2540. [Google Scholar] [CrossRef]
- Jager, T. Robust Likelihood-Based Approach for Automated Optimization and Uncertainty Analysis of Toxicokinetic-Toxicodynamic Models. Integr. Environ. Assess. Manag. 2021, 17, 388–397. [Google Scholar] [CrossRef]
- Brock, T.; Arena, M.; Cedergreen, N.; Charles, S.; Duquesne, S.; Ippolito, A.; Klein, M.; Reed, M.; Teodorovic, I.; van den Brink, P.J.; et al. Application of General Unified Threshold Models of Survival Models for Regulatory Aquatic Pesticide Risk Assessment Illustrated with an Example for the Insecticide Chlorpyrifos. Integr. Environ. Assess. Manag. 2021, 17, 243–258. [Google Scholar] [CrossRef] [PubMed]
- EFSA. Scientific Opinion on the State of the Art of Toxicokinetic/Toxicodynamic (TKTD) Effect Models for Regulatory Risk Assessment of Pesticides for Aquatic Organisms. EFSA J. 2018, 16, e05377. [Google Scholar] [CrossRef]
- Larras, F.; Charles, S.; Chaumot, A.; Pelosi, C.; Le Gall, M.; Mamy, L.; Beaudouin, R. A Critical Review of Effect Modeling for Ecological Risk Assessment of Plant Protection Products. Environ. Sci. Pollut. Res. 2022, 29, 43448–43500. [Google Scholar] [CrossRef] [PubMed]
- Van den Brink, P.J.; Van Smeden, J.M.; Bekele, R.S.; Dierick, W.; De Gelder, D.M.; Noteboom, M.; Roessink, I. Acute and Chronic Toxicity of Neonicotinoids to Nymphs of a Mayfly Species and Some Notes on Seasonal Differences. Environ. Toxicol. Chem. 2016, 35, 128–133. [Google Scholar] [CrossRef] [PubMed]
- Morrissey, C.A.; Mineau, P.; Devries, J.H.; Sanchez-Bayo, F.; Liess, M.; Cavallaro, M.C.; Liber, K. Neonicotinoid Contamination of Global Surface Waters and Associated Risk to Aquatic Invertebrates: A Review. Environ. Int. 2015, 74, 291–303. [Google Scholar] [CrossRef] [PubMed]
- Roessink, I.; Merga, L.B.; Zweers, H.J.; Van den Brink, P.J. The Neonicotinoid Imidacloprid Shows High Chronic Toxicity to Mayfly Nymphs. Environ. Toxicol. Chem. 2013, 32, 1096–1100. [Google Scholar] [CrossRef]
- Sibley, P.; Lagadic, L.; McCoole, M.; Norberg-King, T.; Roessink, I.; Soucek, D.; Watson-Leung, T.; Wirtz, J. Mayflies in Ecotoxicity Testing: Methodological Needs and Knowledge Gaps. Integr. Environ. Assess. Manag. 2020, 16, 292–293. [Google Scholar] [CrossRef]
- Macaulay, S.J.; Hageman, K.J.; Alumbaugh, R.E.; Lyons, S.M.; Piggott, J.J.; Matthaei, C.D. Chronic Toxicities of Neonicotinoids to Nymphs of the Common New Zealand Mayfly Deleatidium spp. Environ. Toxicol. Chem. 2019, 38, 2459–2471. [Google Scholar] [CrossRef]
- Schneeweiss, A.; Juvigny-Khenafou, N.P.D.; Osakpolor, S.; Scharmüller, A.; Scheu, S.; Schreiner, V.C.; Ashauer, R.; Escher, B.I.; Leese, F.; Schäfer, R.B. Three Perspectives on the Prediction of Chemical Effects in Ecosystems. Glob. Chang. Biol. 2023, 29, 21–40. [Google Scholar] [CrossRef] [PubMed]
- Van Vlaardingen, P.L.A.; Traas, T.P.; Wintersen, A.M.; Aldenberg, T. ETX 2.0. A Program. to Calculate Hazardous Concentrations and Fraction Affected, Based on Normally Distributed Toxicity Data. 2004. Available online: https://www.researchgate.net/publication/27452022_ETX_20_A_Program_to_Calculate_Hazardous_Concentrations_and_Fraction_Affected_Based_on_Normally_Distributed_Toxicity_Data (accessed on 15 March 2021).
- Aldenberg, T.; Jaworska, J.S. Uncertainty of the Hazardous Concentration and Fraction Affected for Normal Species Sensitivity Distributions. Ecotoxicol. Environ. Saf. 2000, 46, 1–18. [Google Scholar] [CrossRef] [PubMed]
- Zhang, A.; Kayser, H.; Maienfisch, P.; Casida, J.E. Insect Nicotinic Acetylcholine Receptor: Conserved Neonicotinoid Specificity of [3H]Imidacloprid Binding Site. J. Neurochem. 2000, 75, 1294–1303. [Google Scholar] [CrossRef] [PubMed]
- Iwasa, T.; Motoyama, N.; Ambrose, J.T.; Roe, R.M. Mechanism for the Differential Toxicity of Neonicotinoid Insecticides in the Honey Bee, Apis mellifera. Crop Prot. 2004, 23, 371–378. [Google Scholar] [CrossRef]
- Manjon, C.; Troczka, B.J.; Zaworra, M.; Beadle, K.; Randall, E.; Hertlein, G.; Singh, K.S.; Zimmer, C.T.; Homem, R.A.; Lueke, B.; et al. Unravelling the Molecular Determinants of Bee Sensitivity to Neonicotinoid Insecticides. Curr. Biol. 2018, 28, 1137–1143.e5. [Google Scholar] [CrossRef] [PubMed]
- Yamamoto, I.; Tomizawa, M.; Saito, T.; Miyamoto, T.; Walcott, E.C.; Sumikawa, K. Structural Factors Contributing to Insecticidal and Selective Actions of Neonicotinoids. Arch. Insect Biochem. Physiol. 1998, 37, 24–32. [Google Scholar] [CrossRef]
- Vehovszky, Á.; Farkas, A.; Ács, A.; Stoliar, O.; Székács, A.; Mörtl, M.; Gyori, J. Neonicotinoid Insecticides Inhibit Cholinergic Neurotransmission in a Molluscan (Lymnaea stagnalis) Nervous System. Aquat. Toxicol. 2015, 167, 172–179. [Google Scholar] [CrossRef]
- Raby, M.; Zhao, X.; Hao, C.; Poirier, D.G.; Sibley, P.K. Chronic Toxicity of 6 Neonicotinoid Insecticides to Chironomus dilutus and Neocloeon triangulifer. Environ. Toxicol. Chem. 2018, 37, 2727–2739. [Google Scholar] [CrossRef] [PubMed]
- Song, M.Y.; Brown, J.J. Influence of Fluctuating Salinity on Insecticide Tolerance of Two Euryhaline Arthropods. J. Econ. Entomol. 2006, 99, 745–751. [Google Scholar] [CrossRef]
- Nyman, A.M.; Schirmer, K.; Ashauer, R. Toxicokinetic-Toxicodynamic Modelling of Survival of Gammarus pulex in Multiple Pulse Exposures to Propiconazole: Model Assumptions, Calibration Data Requirements and Predictive Power. Ecotoxicology 2012, 21, 1828–1840. [Google Scholar] [CrossRef]
- He, A.; Liu, X.; Qu, L.; Gao, Y.; Feng, J.; Zhu, L. Comparison of the General Threshold Model of Survival and Dose–Response Models in Simulating the Acute Toxicity of Metals to Danio rerio. Environ. Toxicol. Chem. 2019, 38, 2169–2177. [Google Scholar] [CrossRef] [PubMed]
- Baudrot, V.; Veber, P.; Gence, G.; Charles, S. Fit Reduced GUTS Models Online: From Theory to Practice. Integr. Environ. Assess. Manag. 2018, 14, 625–630. [Google Scholar] [CrossRef]
- Baudrot, V.; Preux, S.; Ducrot, V.; Pave, A.; Charles, S. New Insights to Compare and Choose TKTD Models for Survival Based on an Interlaboratory Study for Lymnaea stagnalis Exposed to Cd. Environ. Sci. Technol. 2018, 52, 1582–1590. [Google Scholar] [CrossRef]
- Andersen, J.S.; Holst, H.; Spliid, H.; Andersen, H.; Baun, A.; Nyholm, N. Continuous Ecotoxicological Data Evaluated Relative to a Control Response. J. Agric. Biol. Environ. Stat. 1998, 3, 405–420. [Google Scholar] [CrossRef]
- Huang, A.; Roessink, I.; van den Brink, N.W.; van den Brink, P.J. Size- and Sex-Related Sensitivity Differences of Aquatic Crustaceans to Imidacloprid. Ecotoxicol. Environ. Saf. 2022, 242, 113917. [Google Scholar] [CrossRef] [PubMed]
- Bart, S.; Jager, T.; Robinson, A.; Lahive, E.; Spurgeon, D.J.; Ashauer, R. Predicting Mixture Effects over Time with Toxicokinetic-Toxicodynamic Models (Guts): Assumptions, Experimental Testing, and Predictive Power. Environ. Sci. Technol. 2021, 55, 2430–2439. [Google Scholar] [CrossRef]
- Tagliati, A.; Hazlerigg, C.; Brignall, S.; Beinum, W. Van Exploring GUTS in the Environmental Risk Assessment of Pesticides. In Proceedings of the Poster Presentation a the SETAC EUROPE 32 ND Annual Meeting, Copenhagen, Denmark, 15–19 May 2022. [Google Scholar]
- Charles, S.; Ratier, A.; Baudrot, V.; Multari, G.; Siberchicot, A.; Wu, D.; Lopes, C. Taking Full Advantage of Modelling to Better Assess Environmental Risk Due to Xenobiotics—The All-in-One Facility MOSAIC. Environ. Sci. Pollut. Res. 2022, 29, 29244–29257. [Google Scholar] [CrossRef]

Disclaimer/Publisher’s Note: The statements, opinions and data contained in all publications are solely those of the individual author(s) and contributor(s) and not of MDPI and/or the editor(s). MDPI and/or the editor(s) disclaim responsibility for any injury to people or property resulting from any ideas, methods, instructions or products referred to in the content. |
© 2024 by the authors. Licensee MDPI, Basel, Switzerland. This article is an open access article distributed under the terms and conditions of the Creative Commons Attribution (CC BY) license (https://creativecommons.org/licenses/by/4.0/).