
Local Water Inrush Risk Assessment Method Based on Moving Window and Its Application in the Liangshuijing Mining Area

Abstract
:1. Introduction
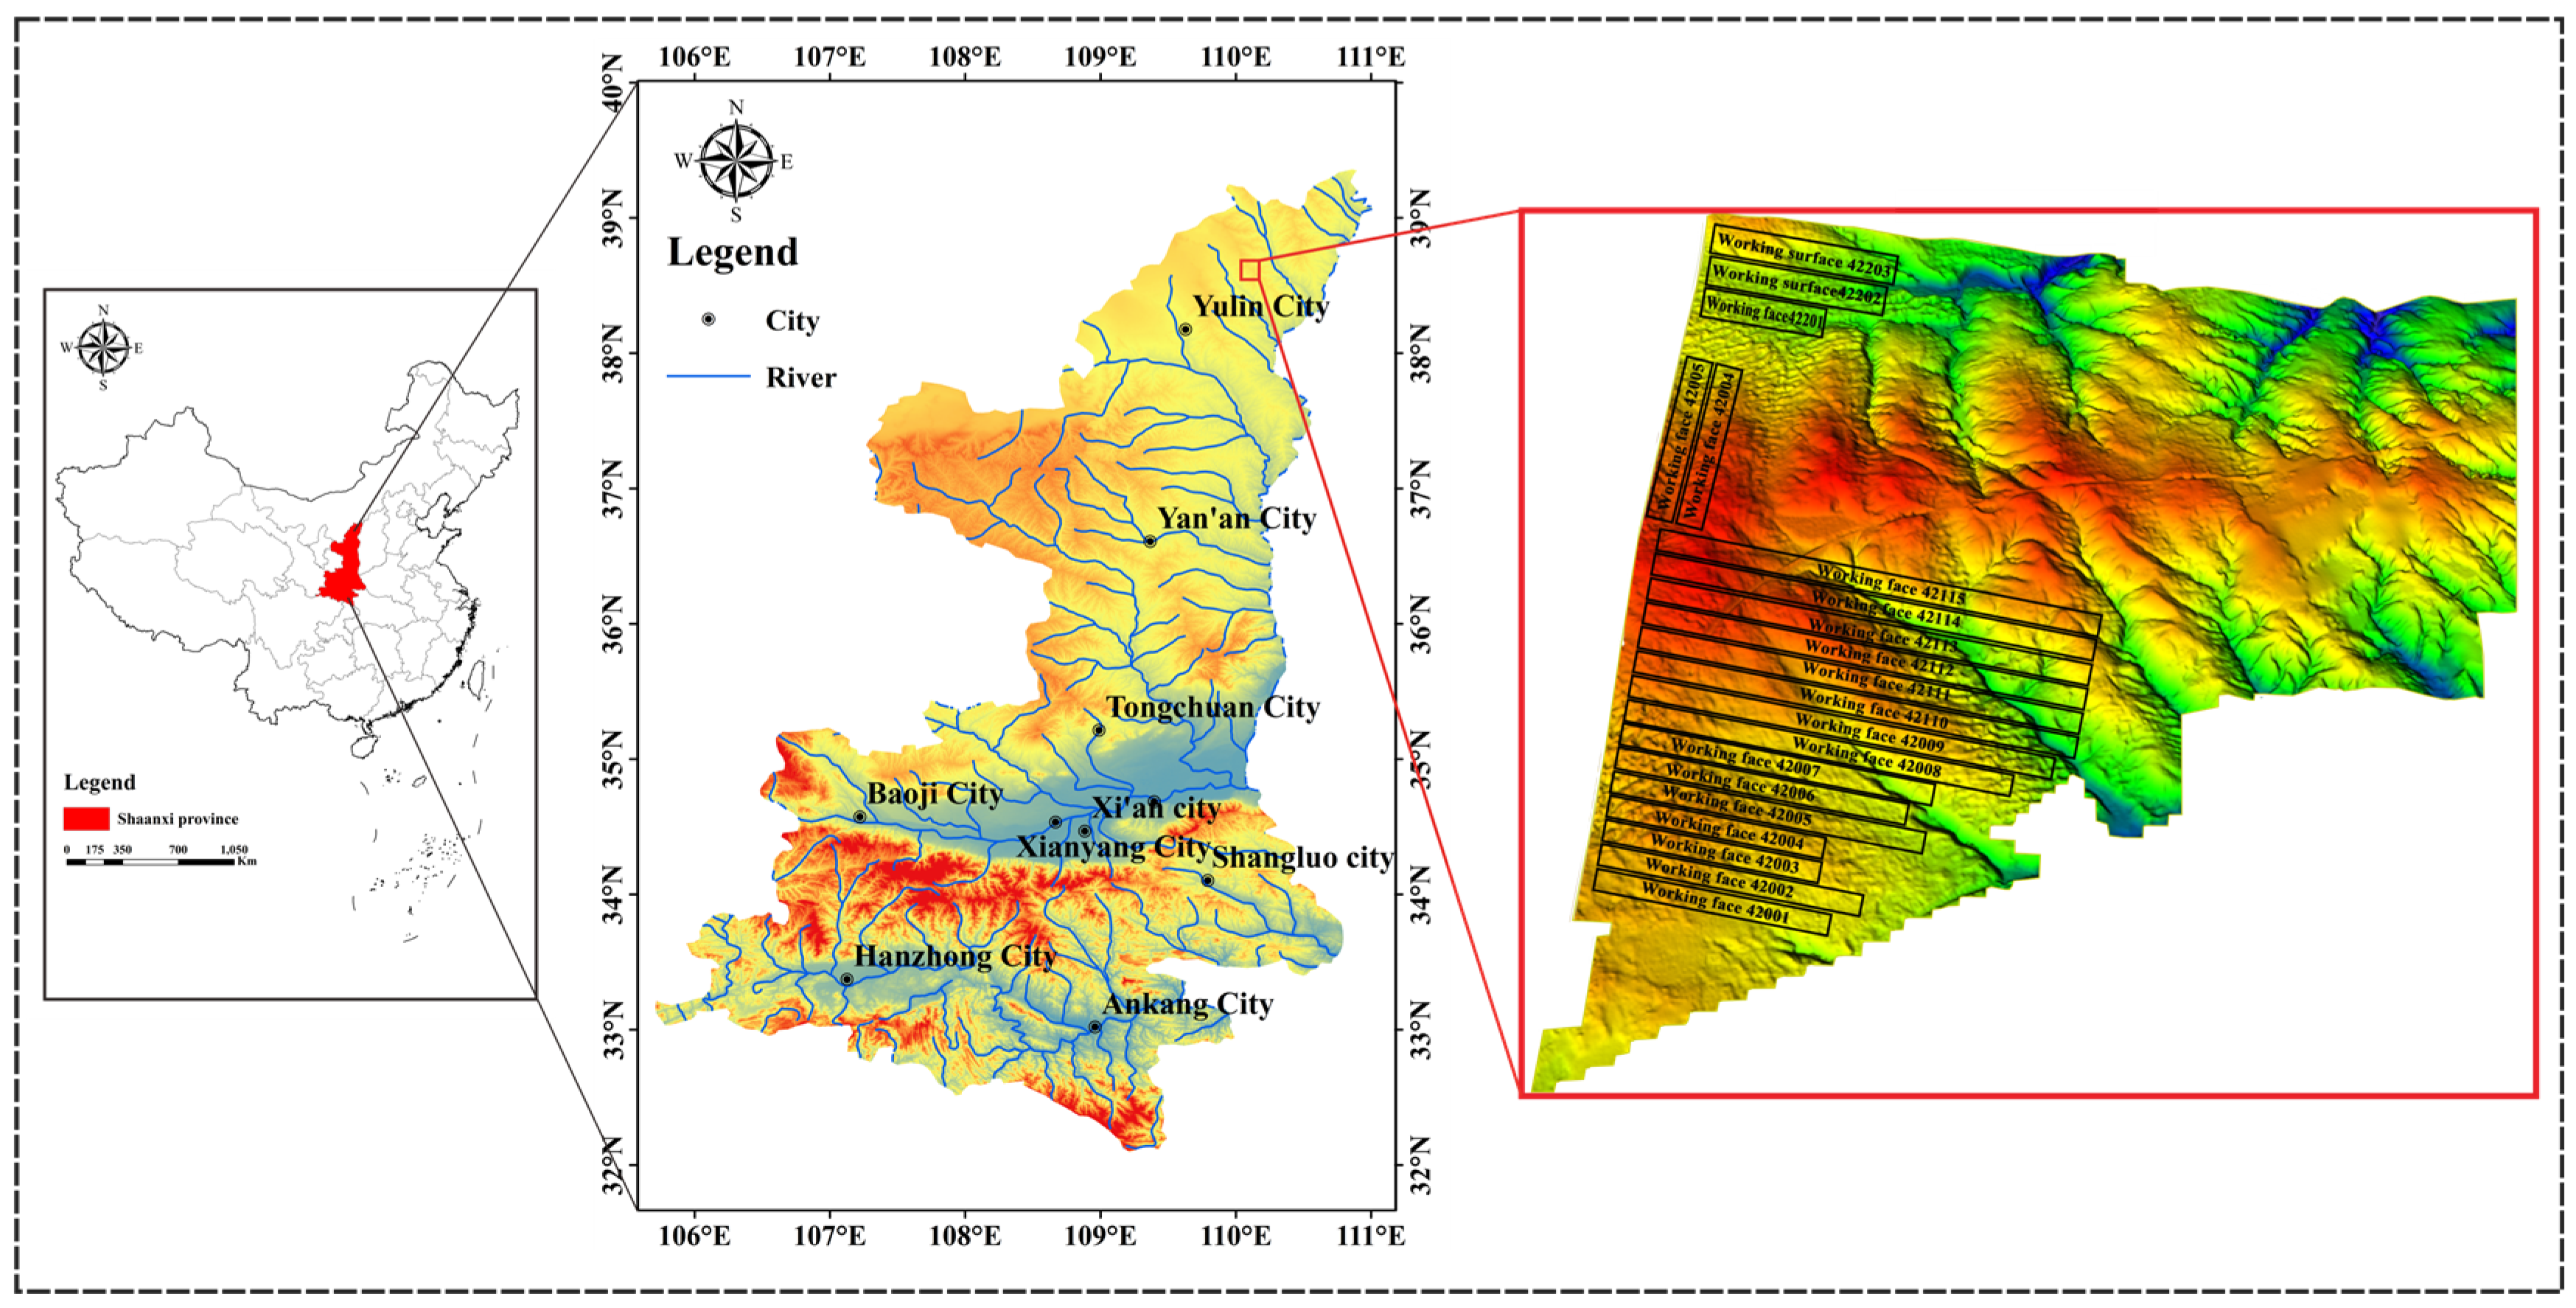
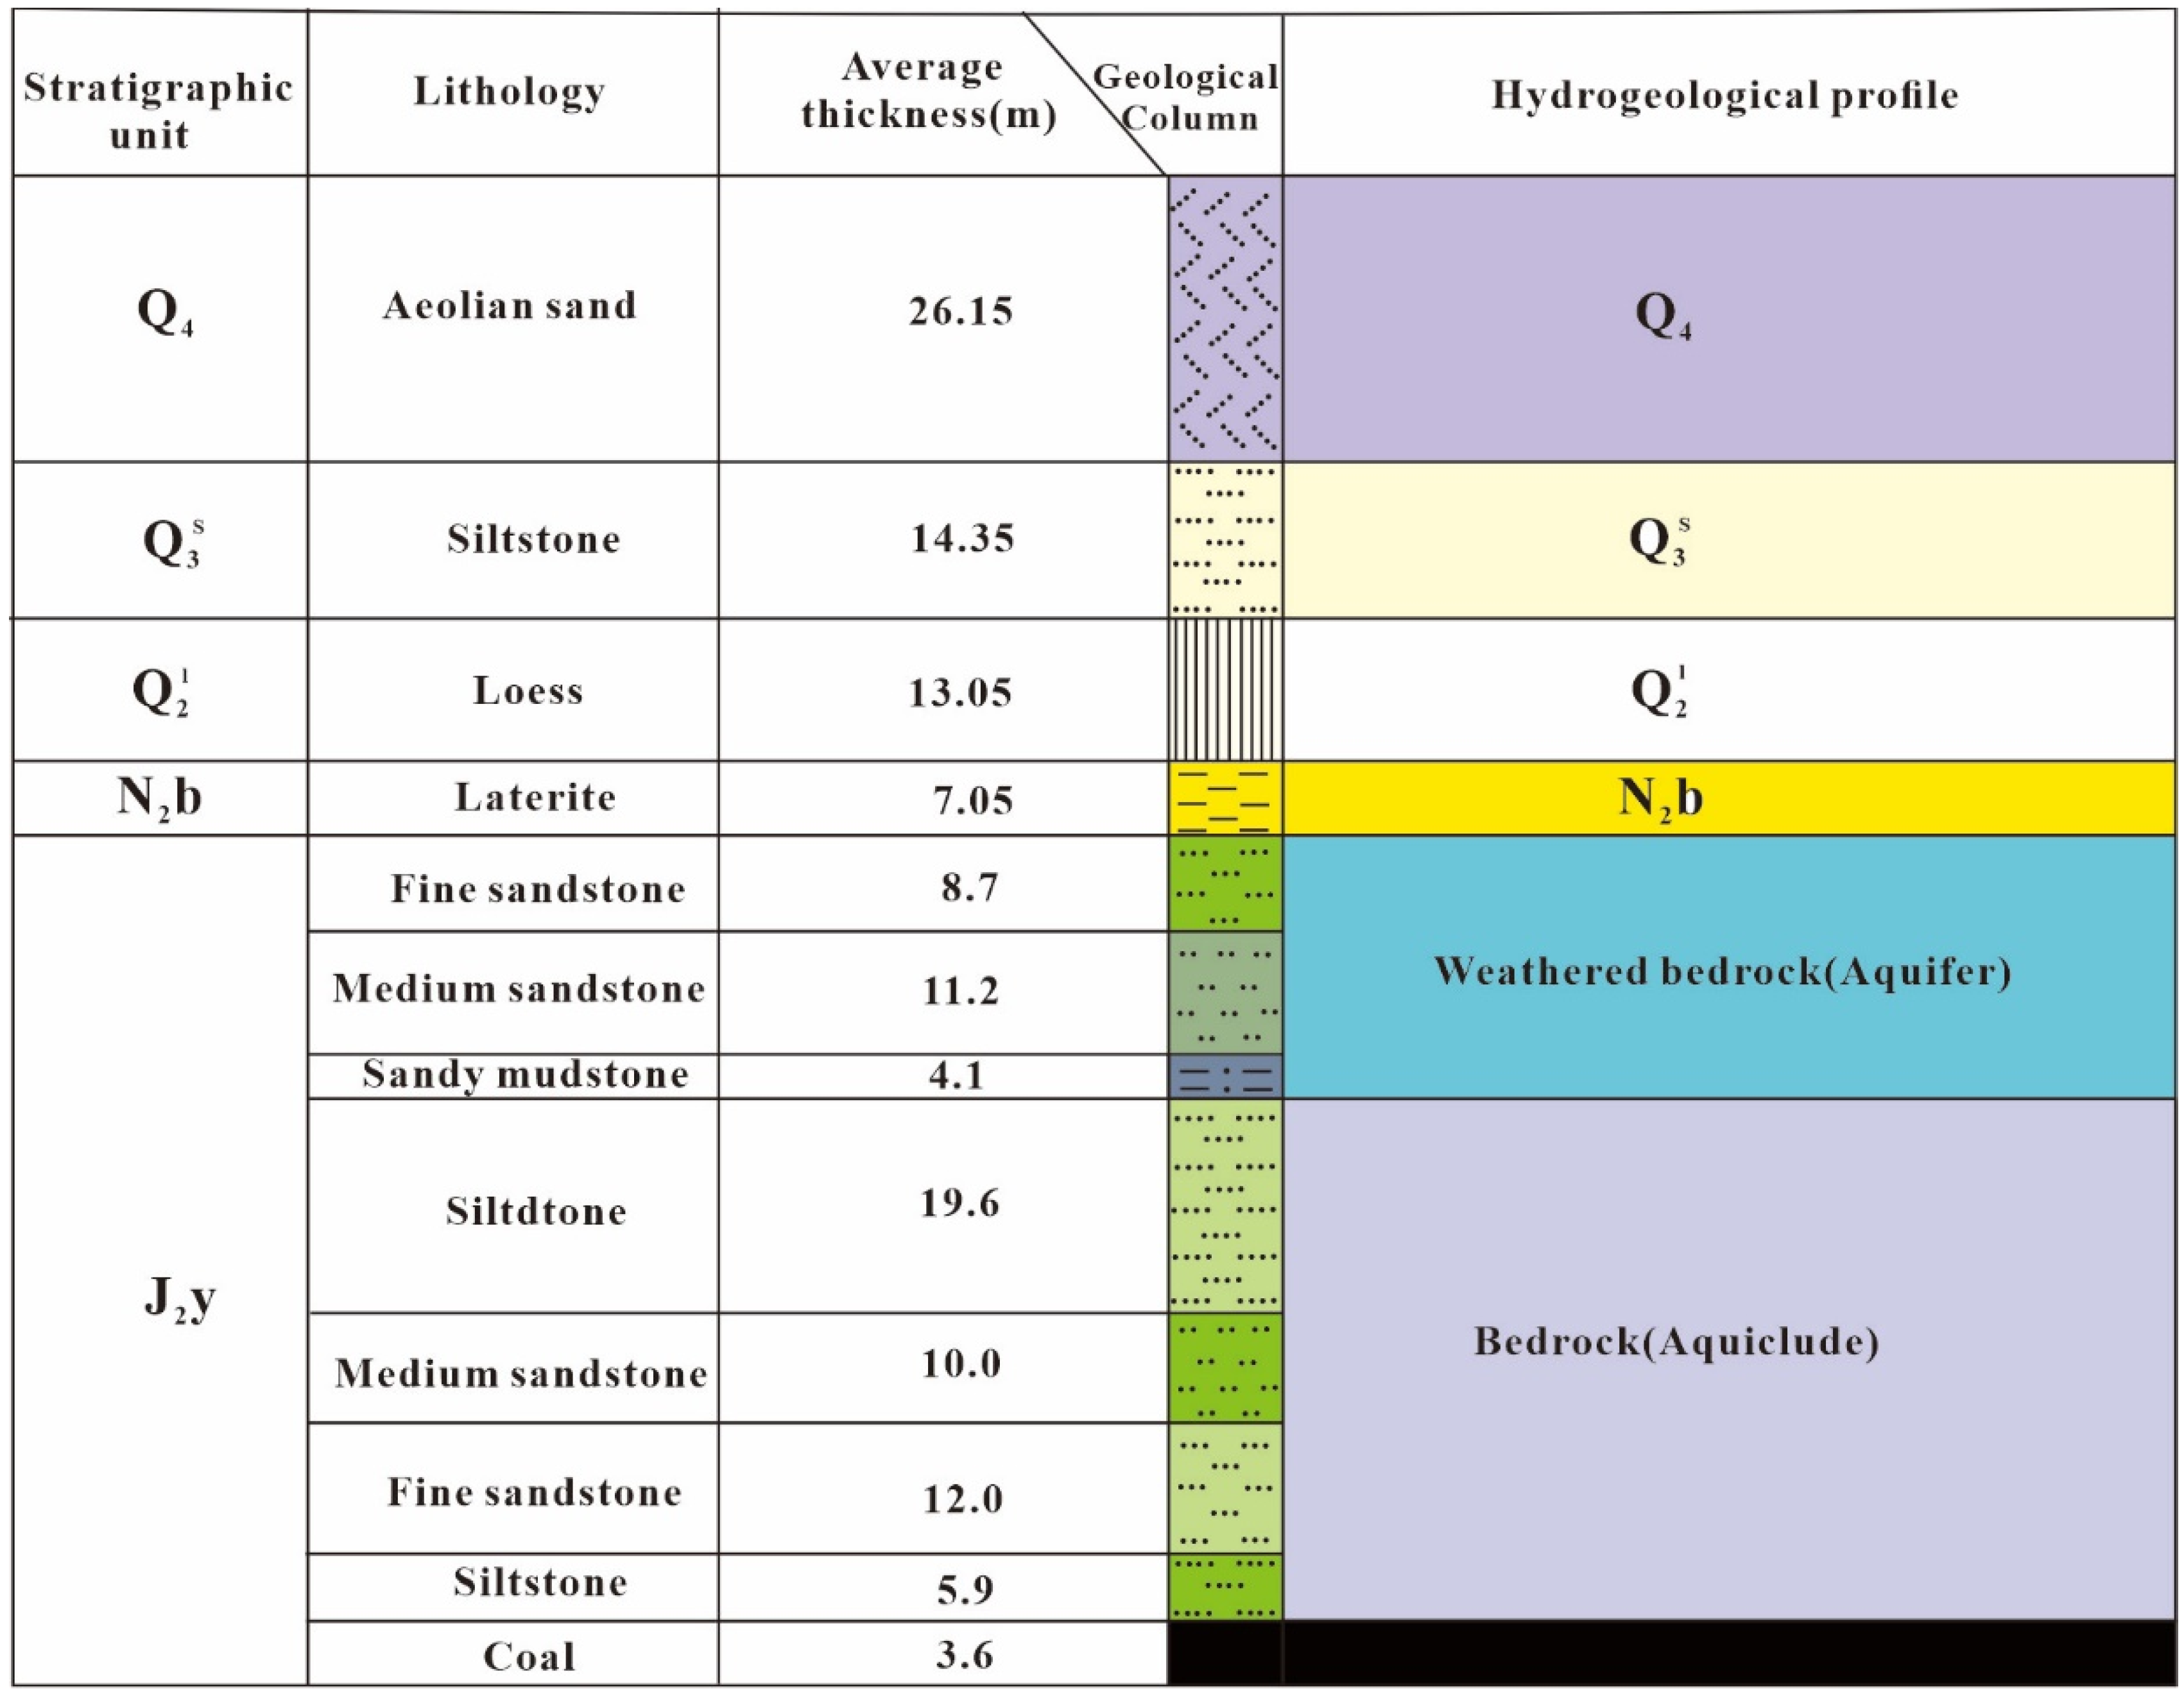
2. Study Area and Data
3. Methodology
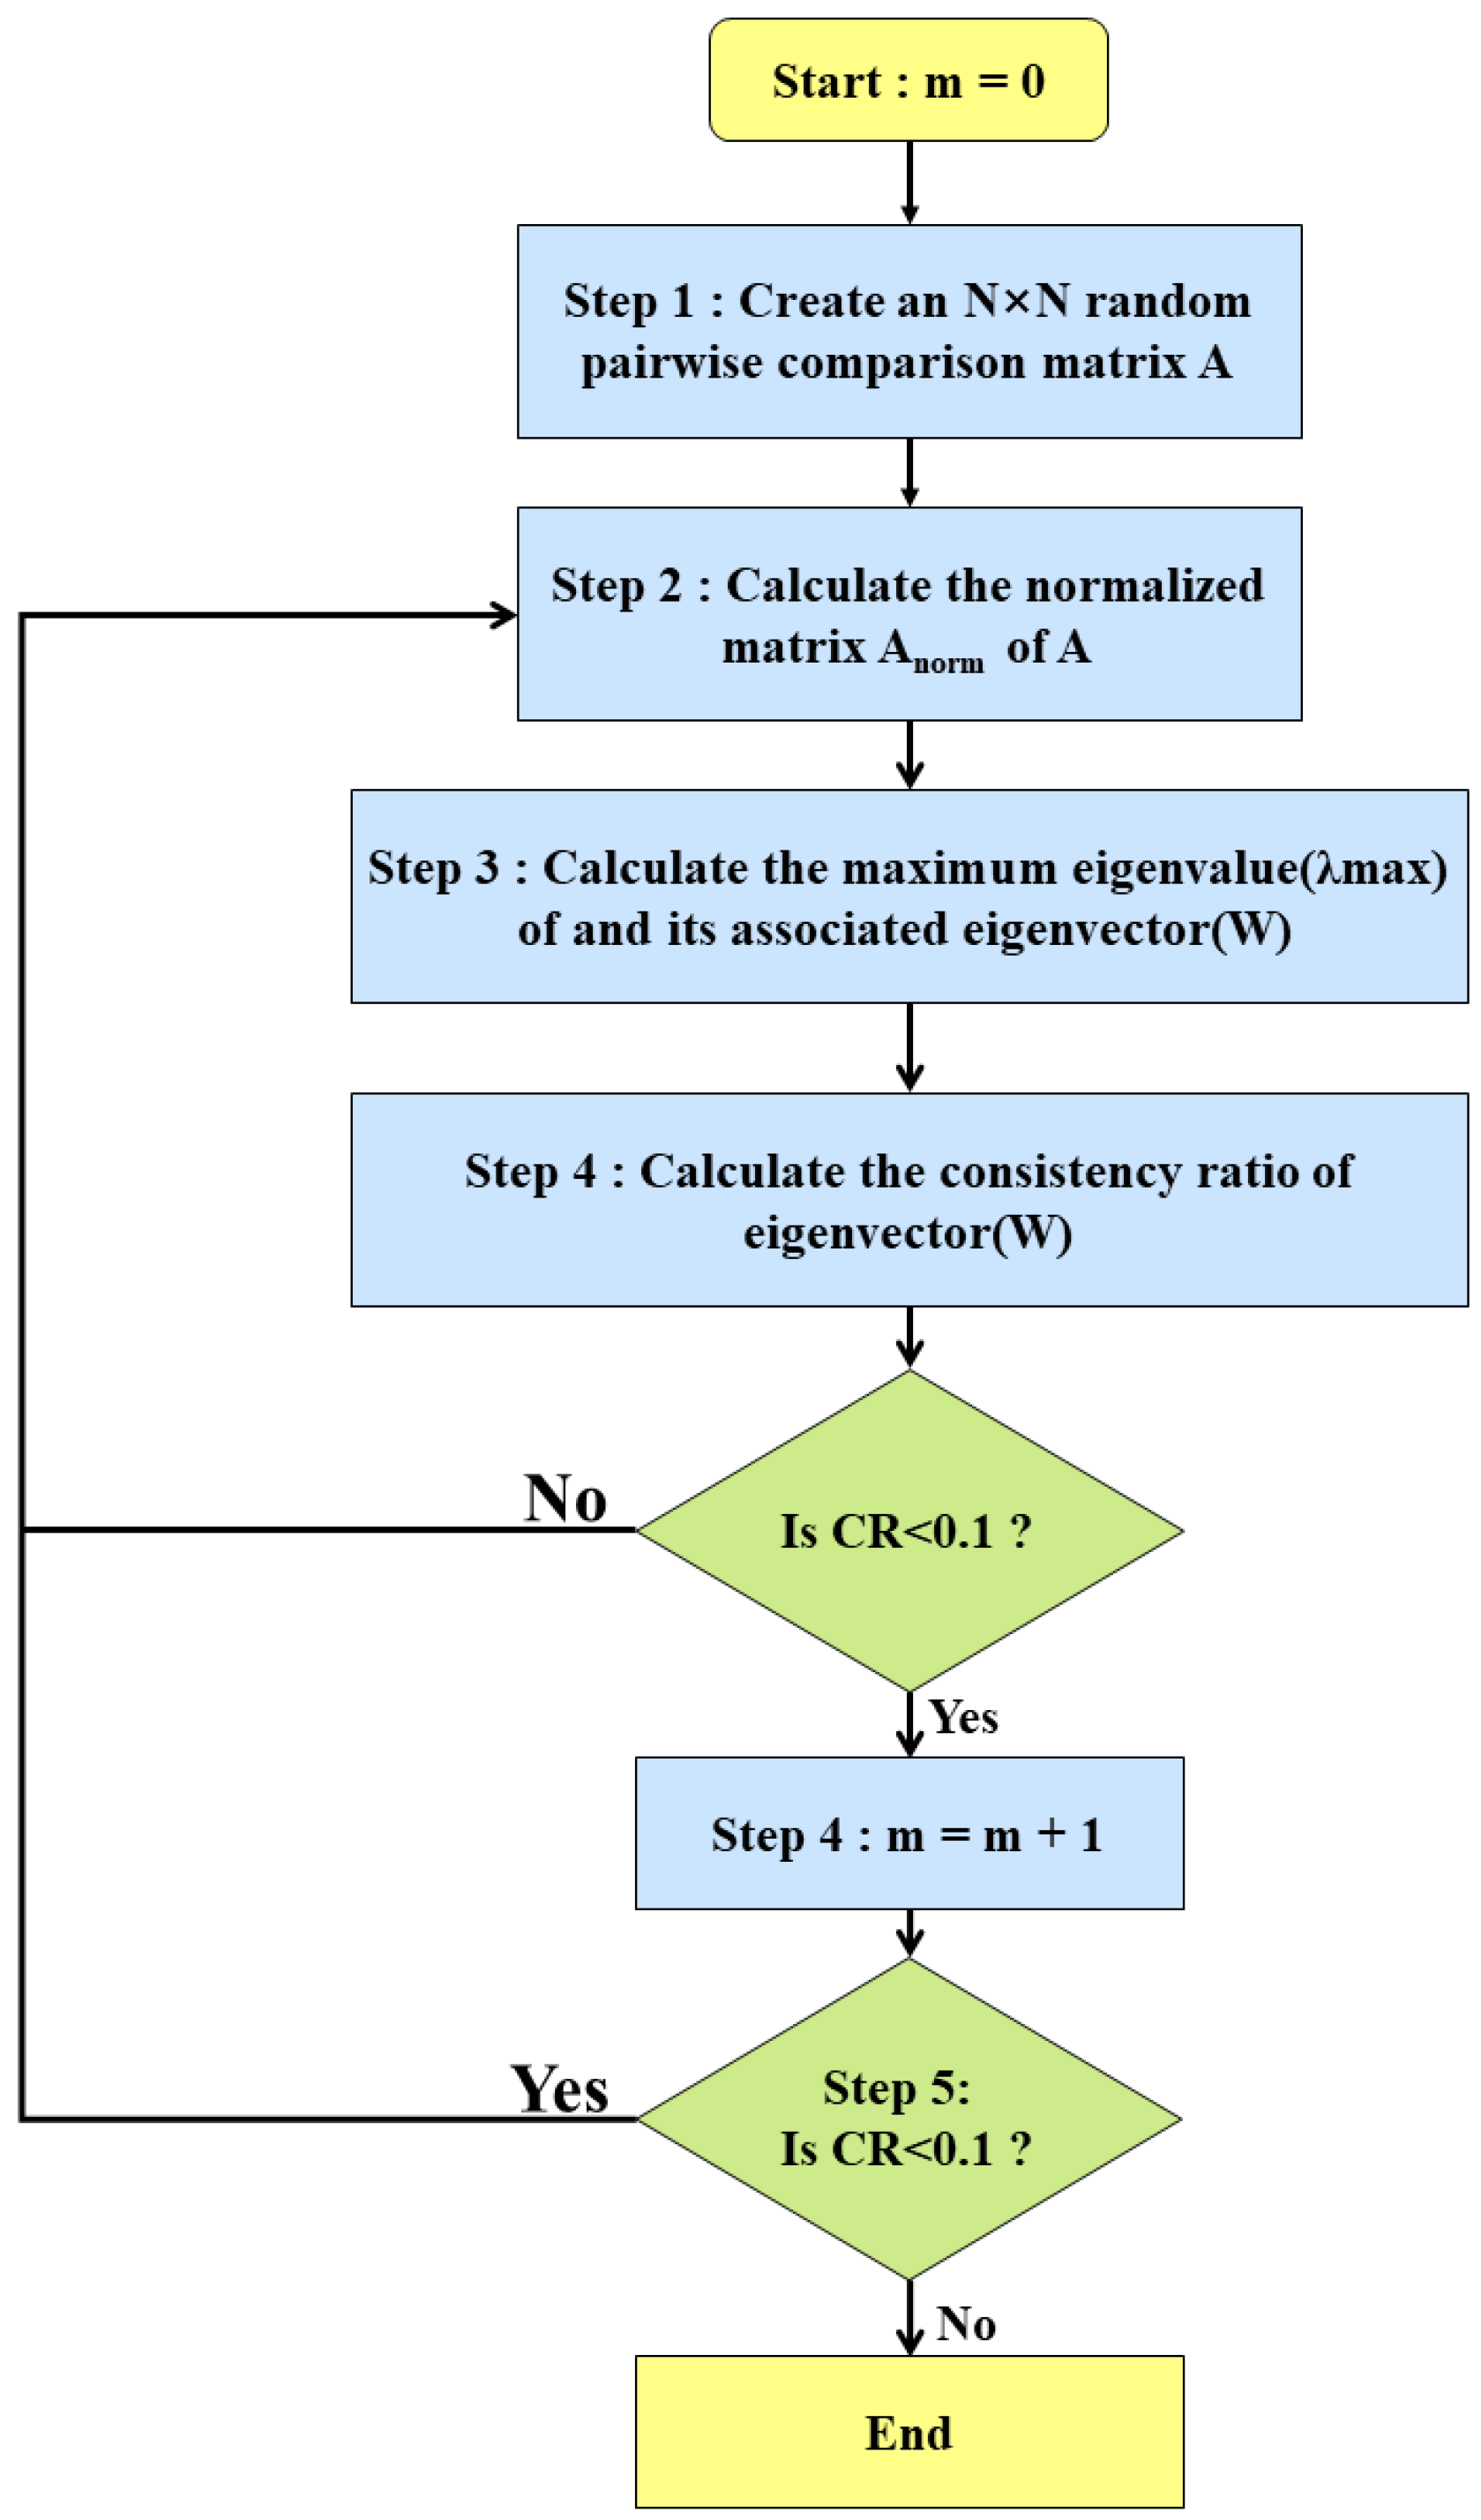
3.1. MAHP
- (1)
- (2)
- The relative importance between evaluation indicators typically requires precise numerical descriptions, which experts often struggle to provide accurately.
- (3)
- In cases where the relative significance of evaluation indicators is similar, it becomes challenging to ascertain which indicator holds greater importance.
3.2. Global Evaluation Method
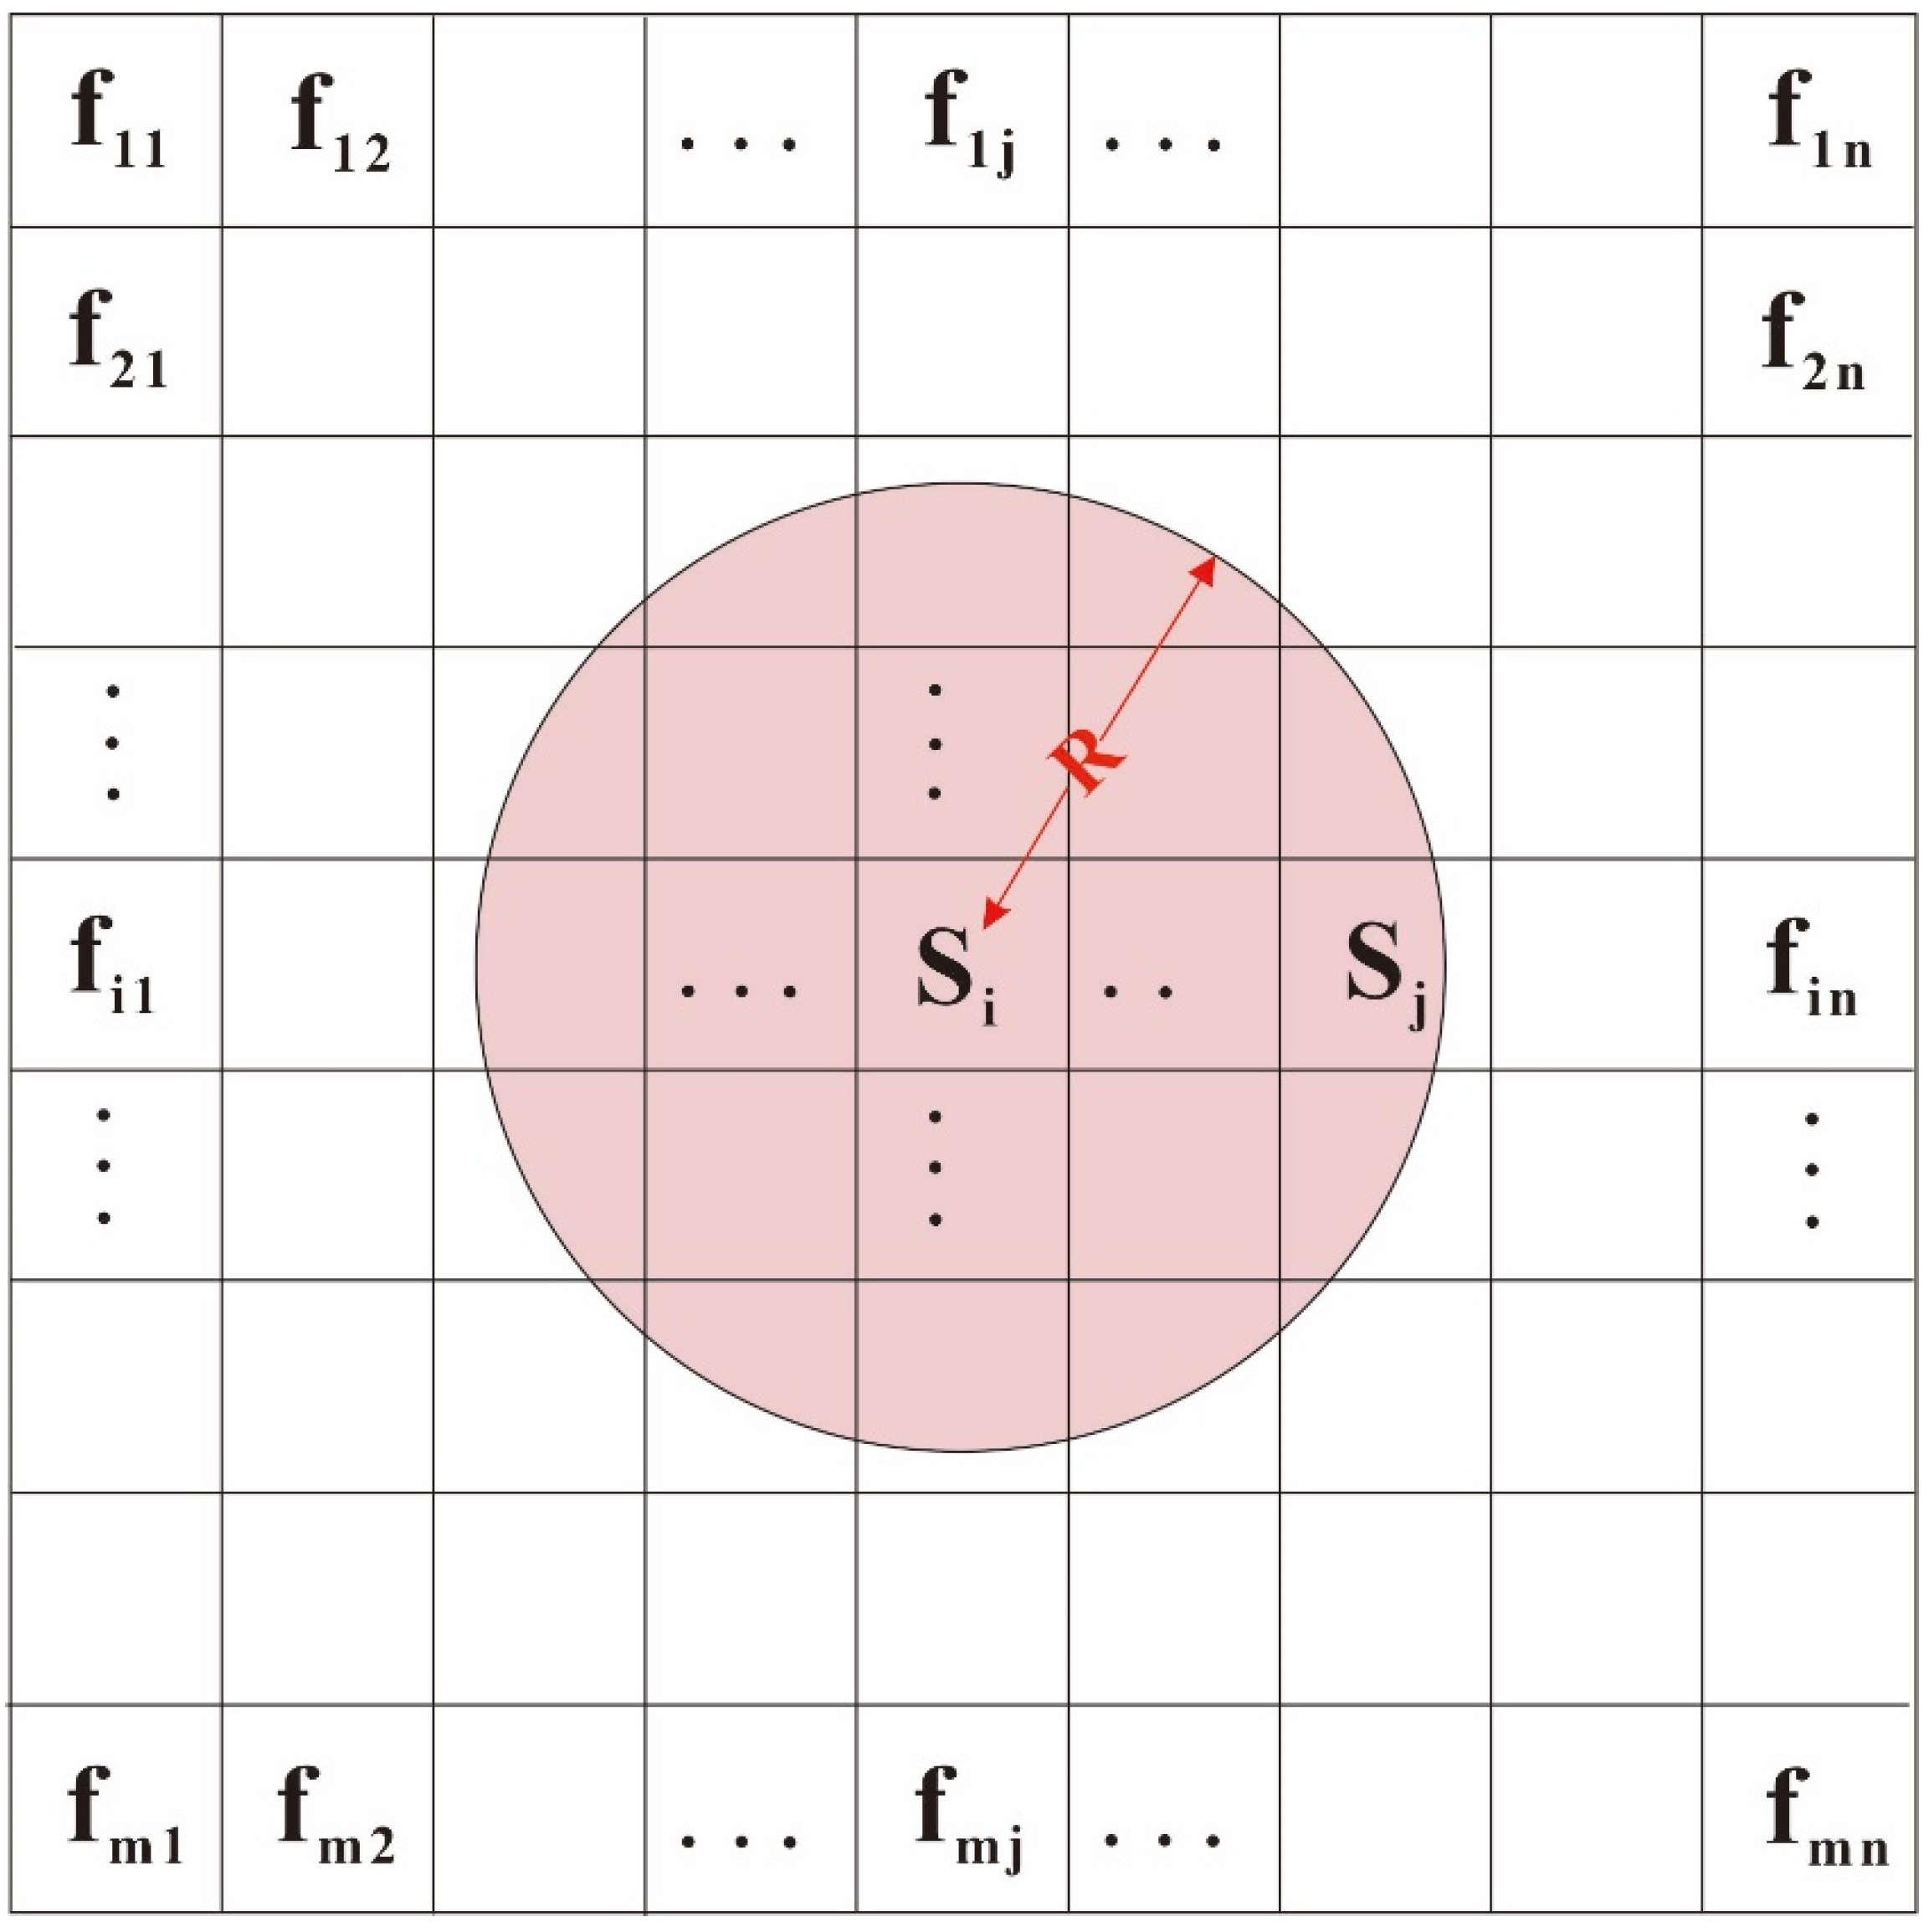
3.3. Local Evaluation Method
- (1)
- Local standardization of evaluation indicators.
- (2)
- Localized weighting of evaluation indicators.
- (3)
- Establishing the local water inrush risk assessment model.
4. Results
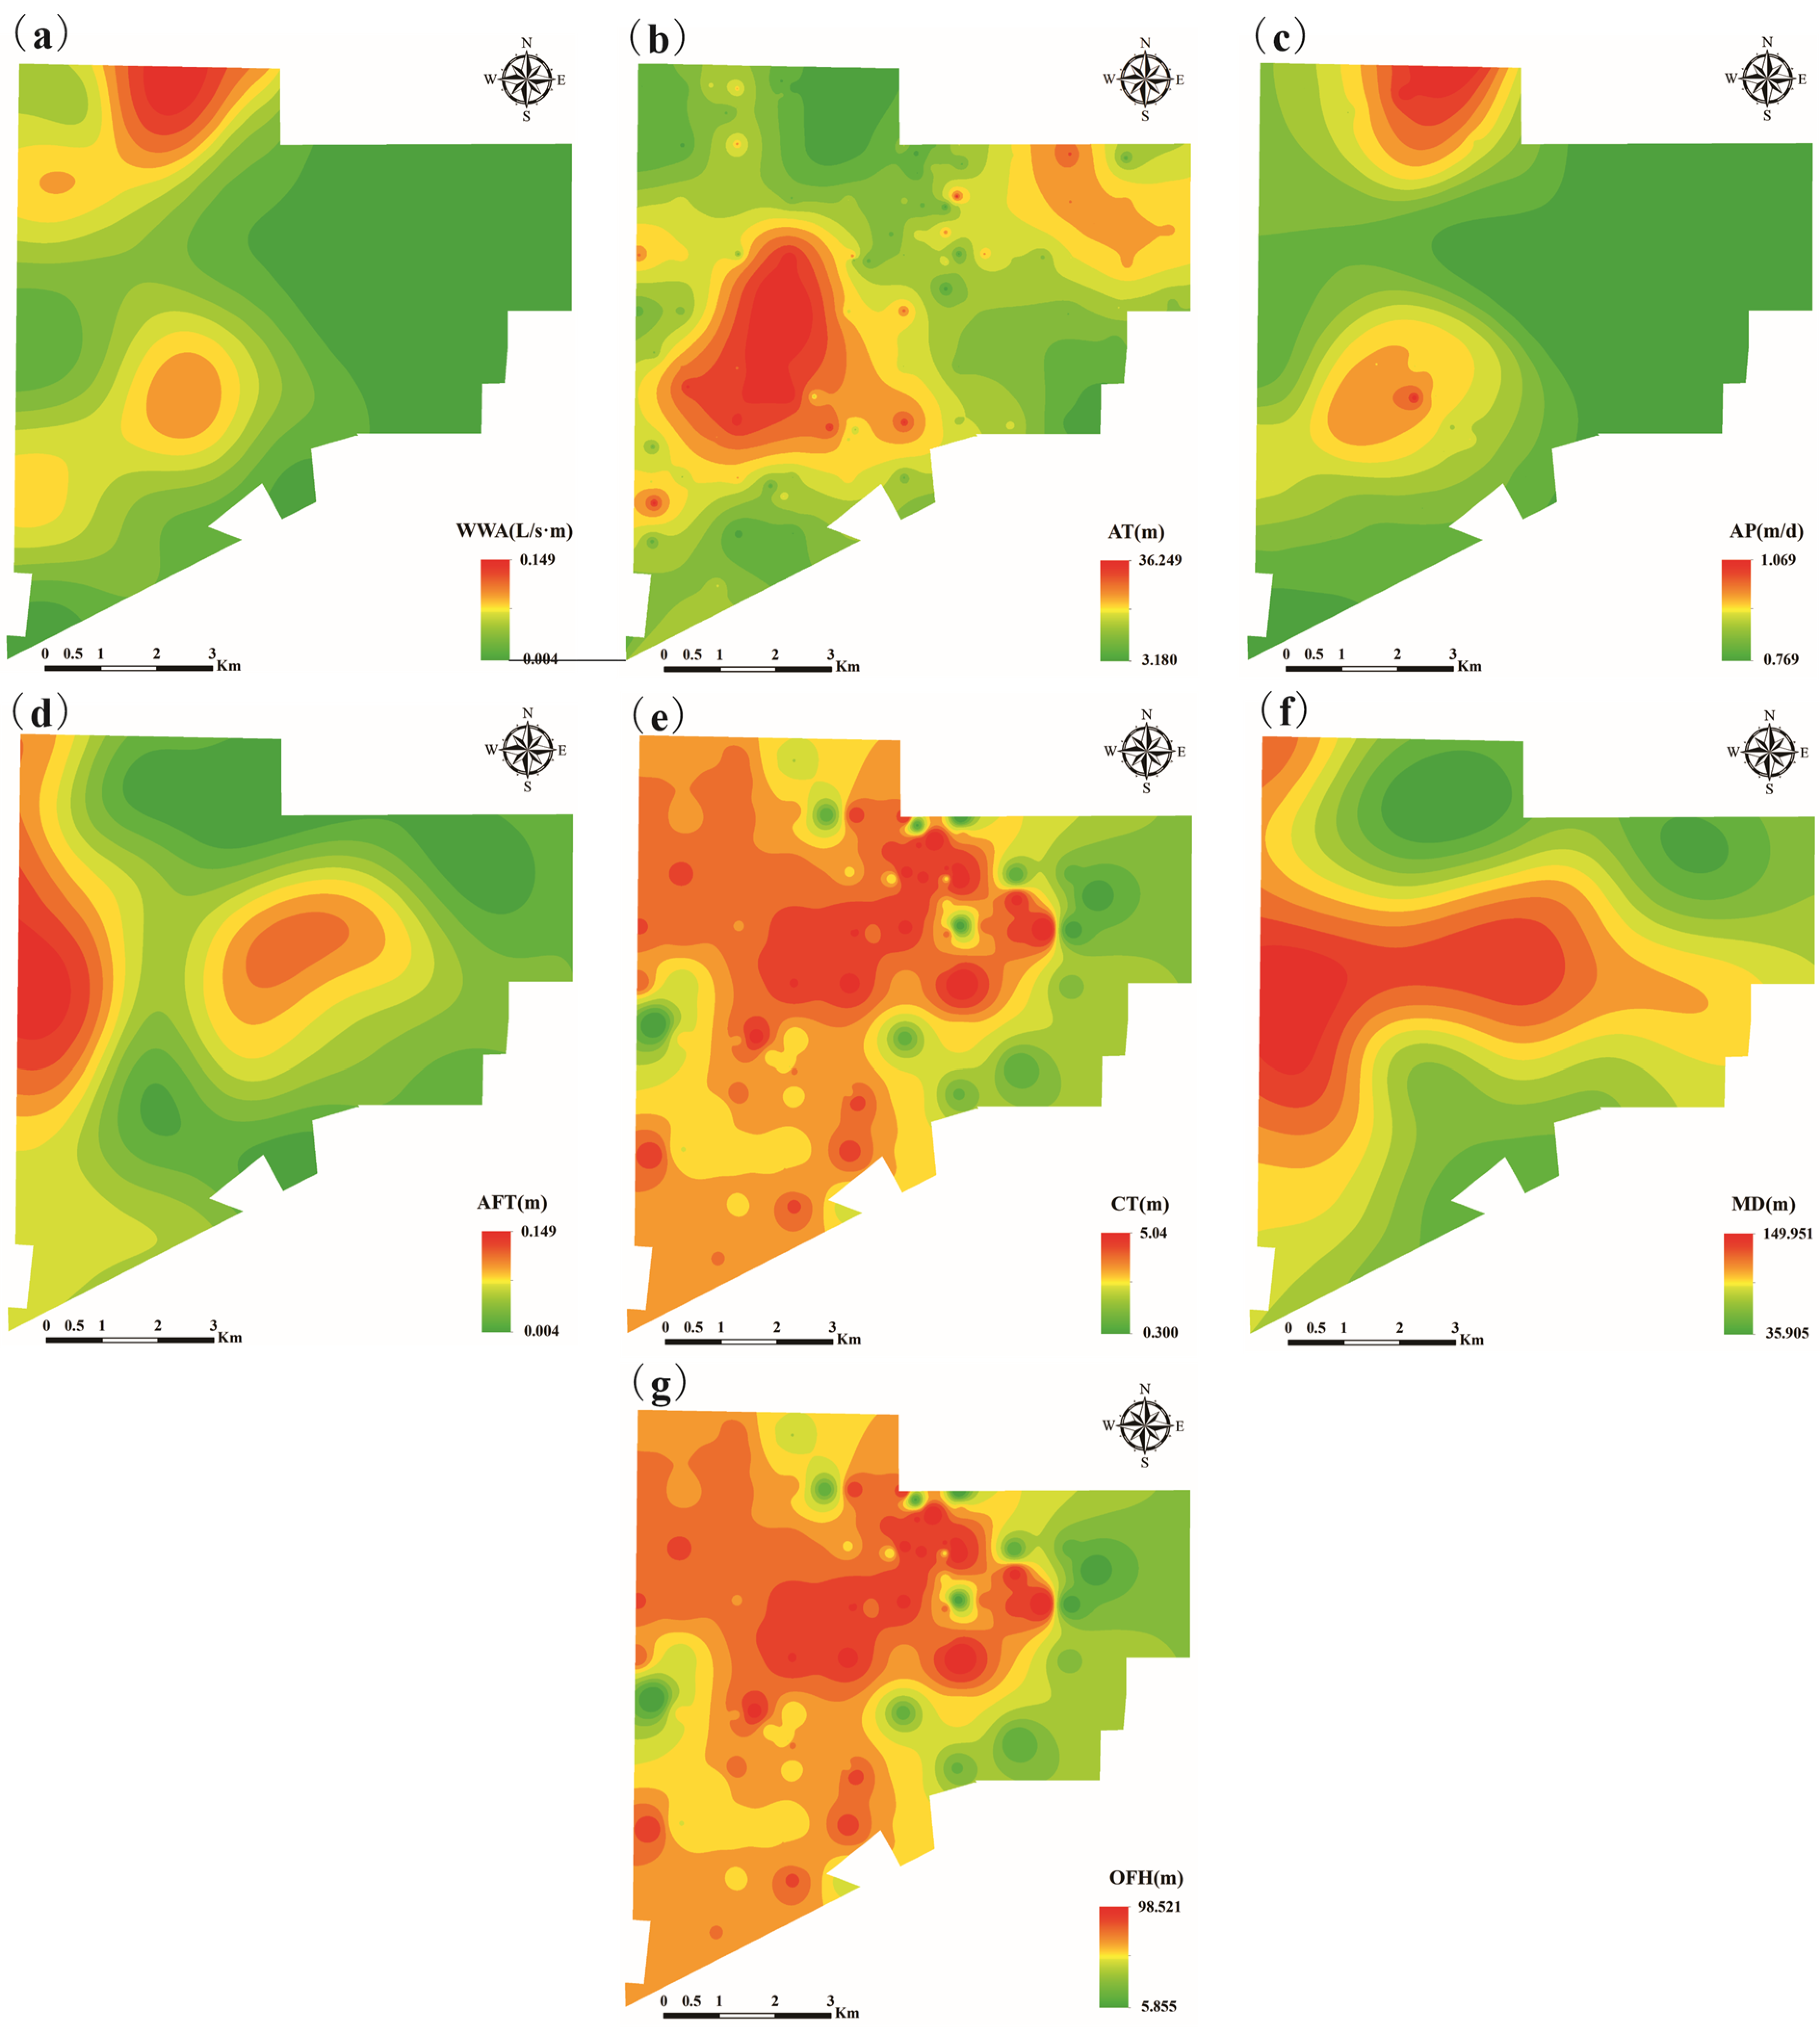
4.1. Standardization of Evaluation Indicators
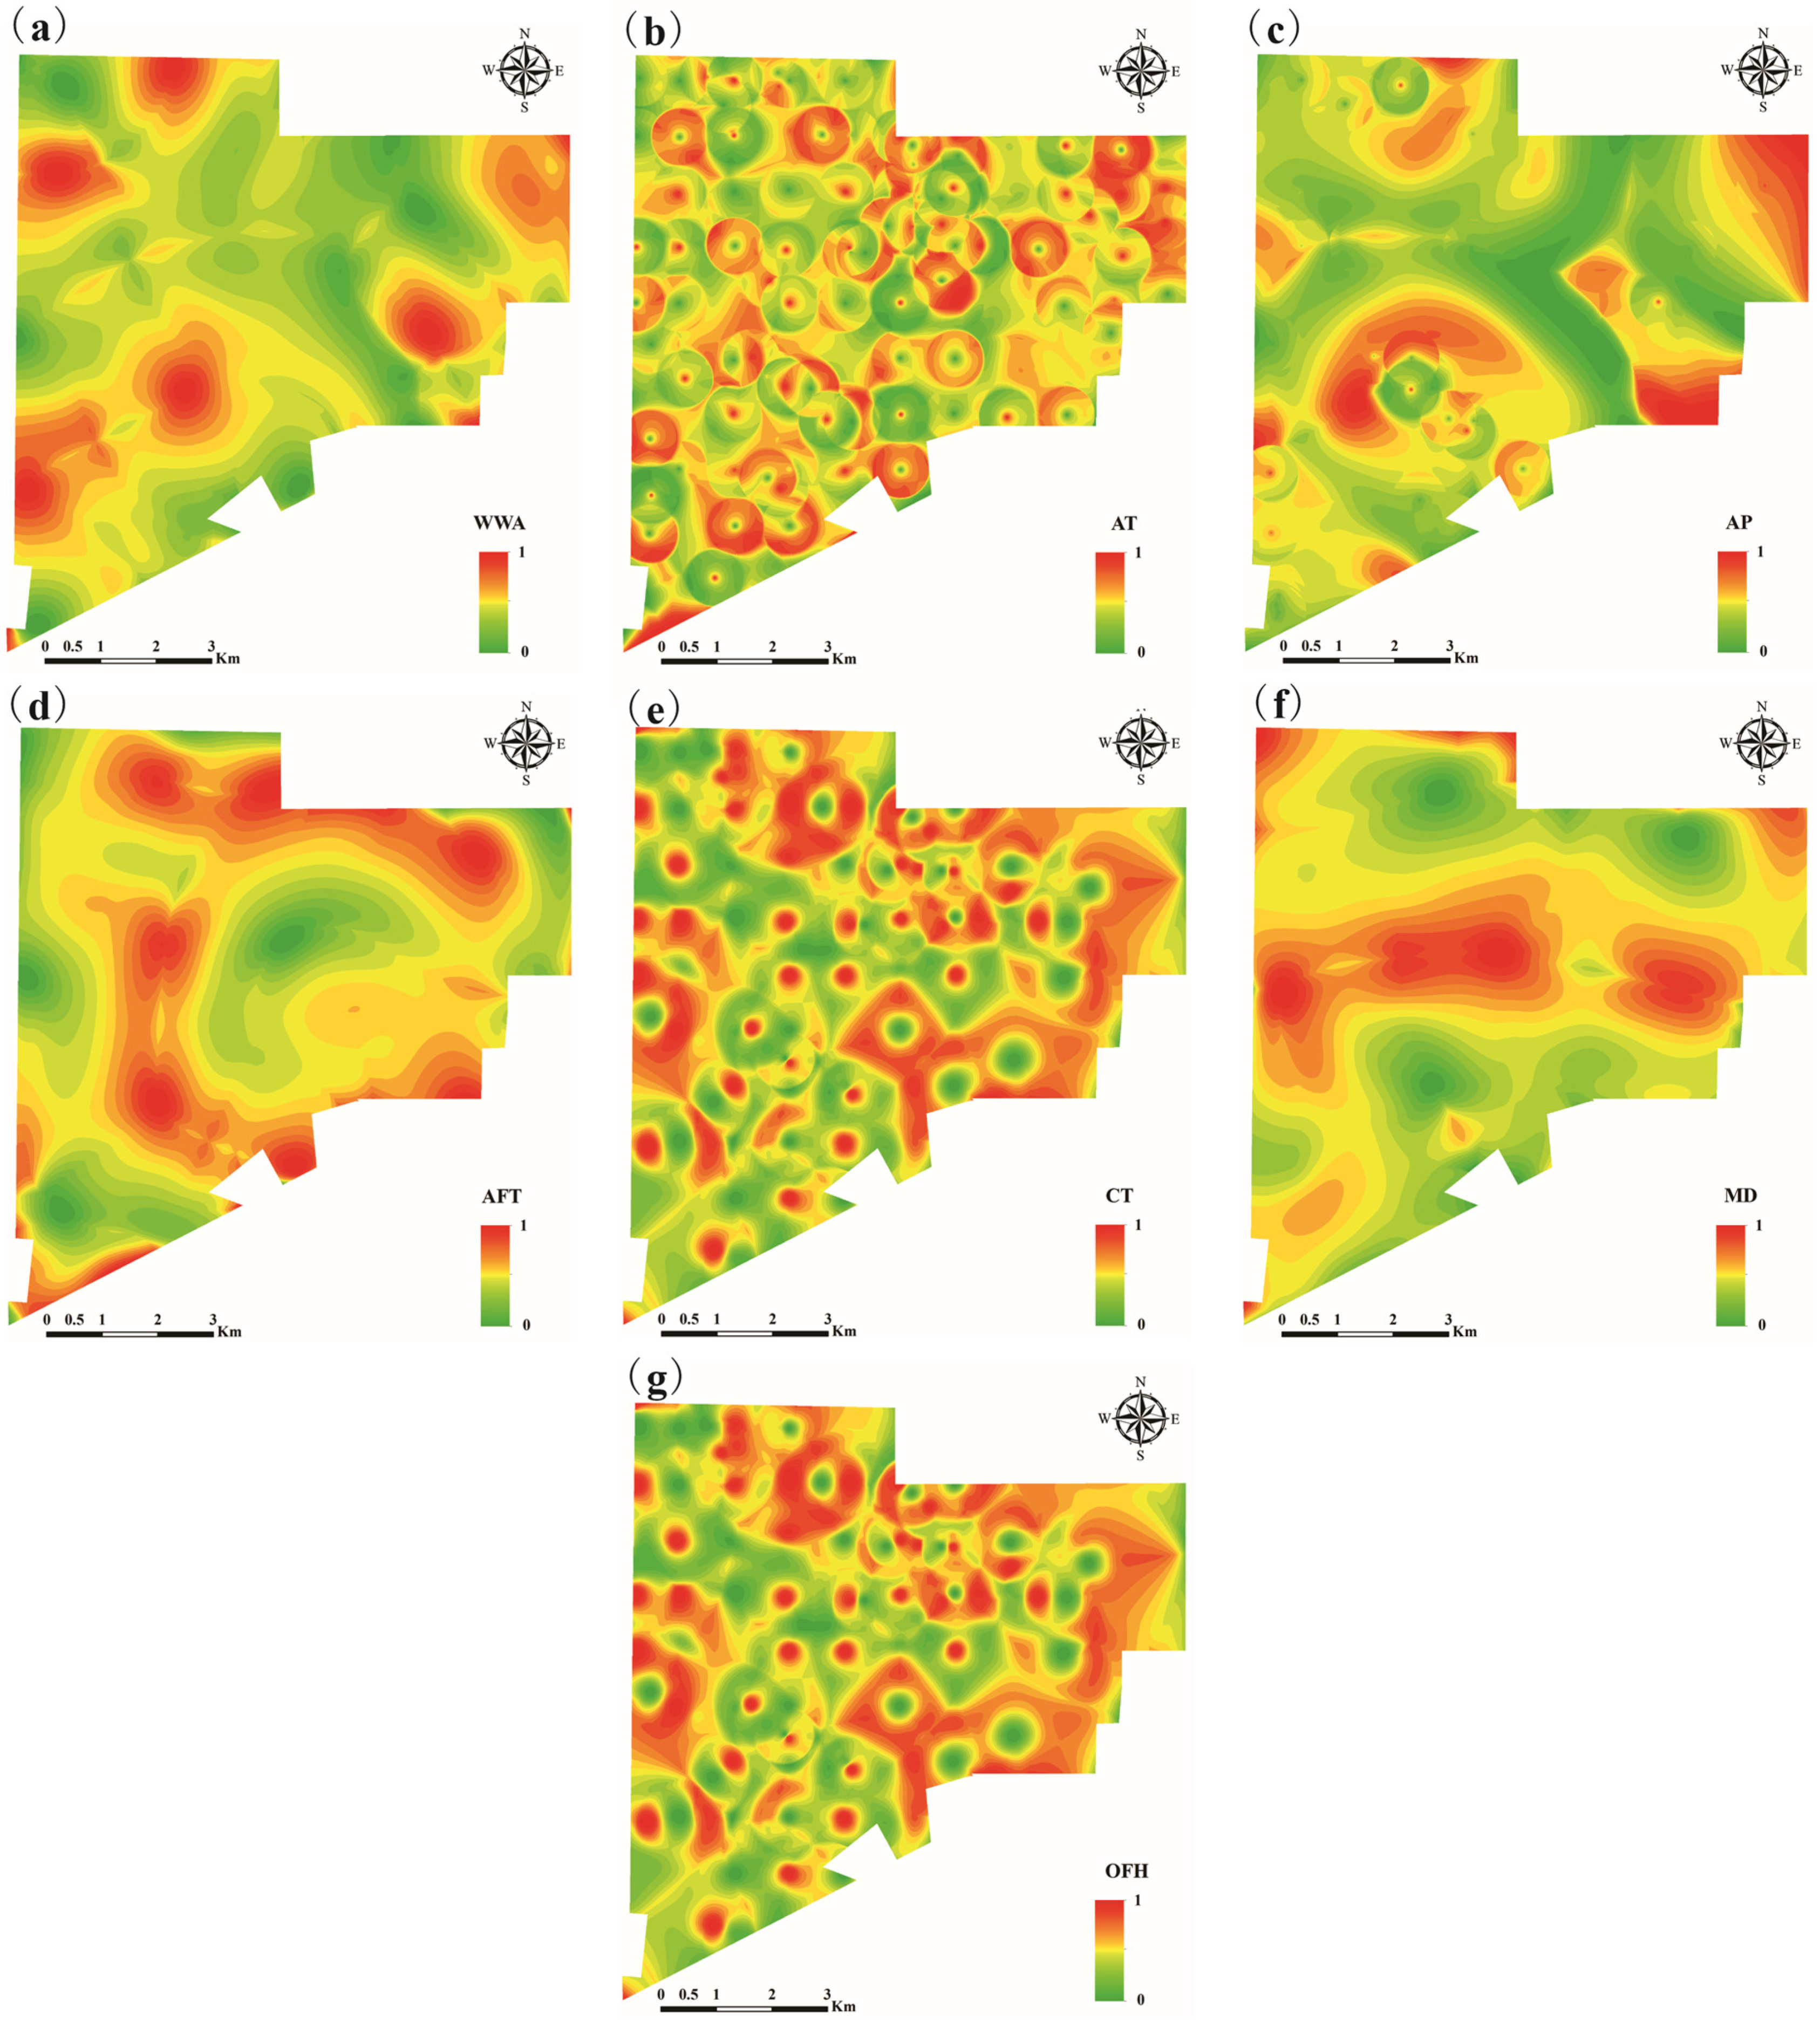
4.1.1. Global Standardization of Evaluation Indicators
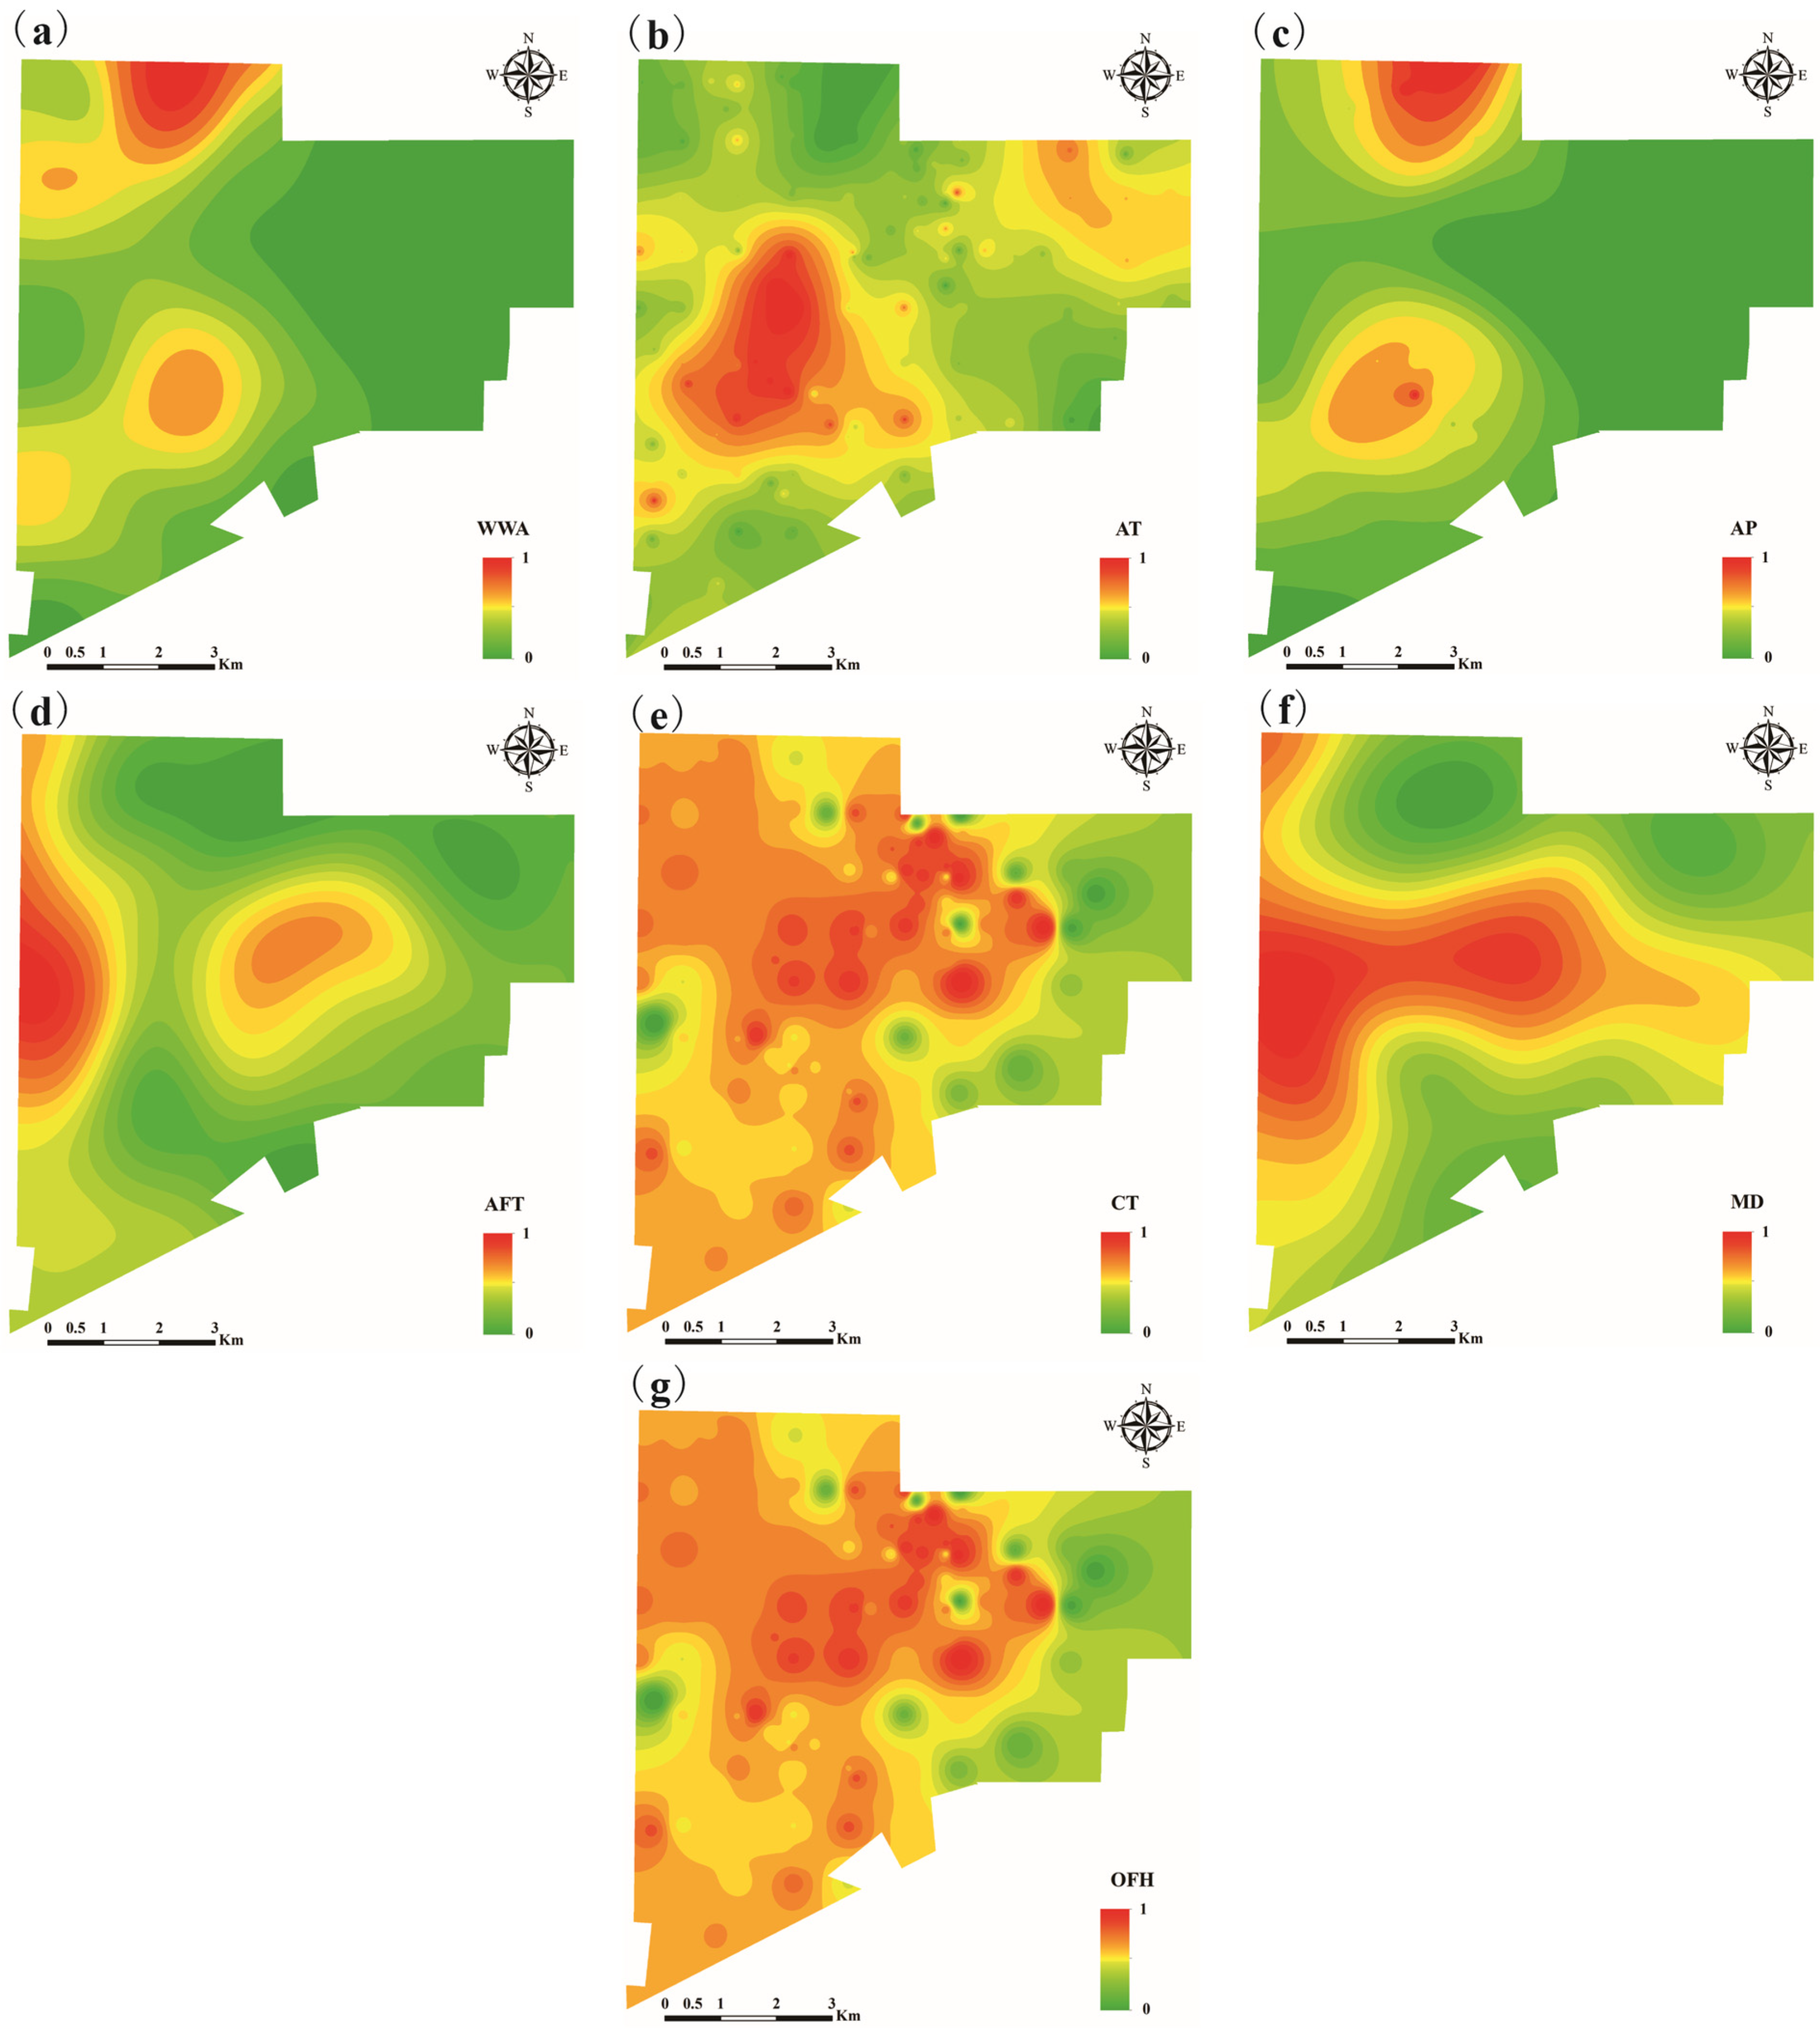
4.1.2. Localized Standardization of Evaluation Indicators
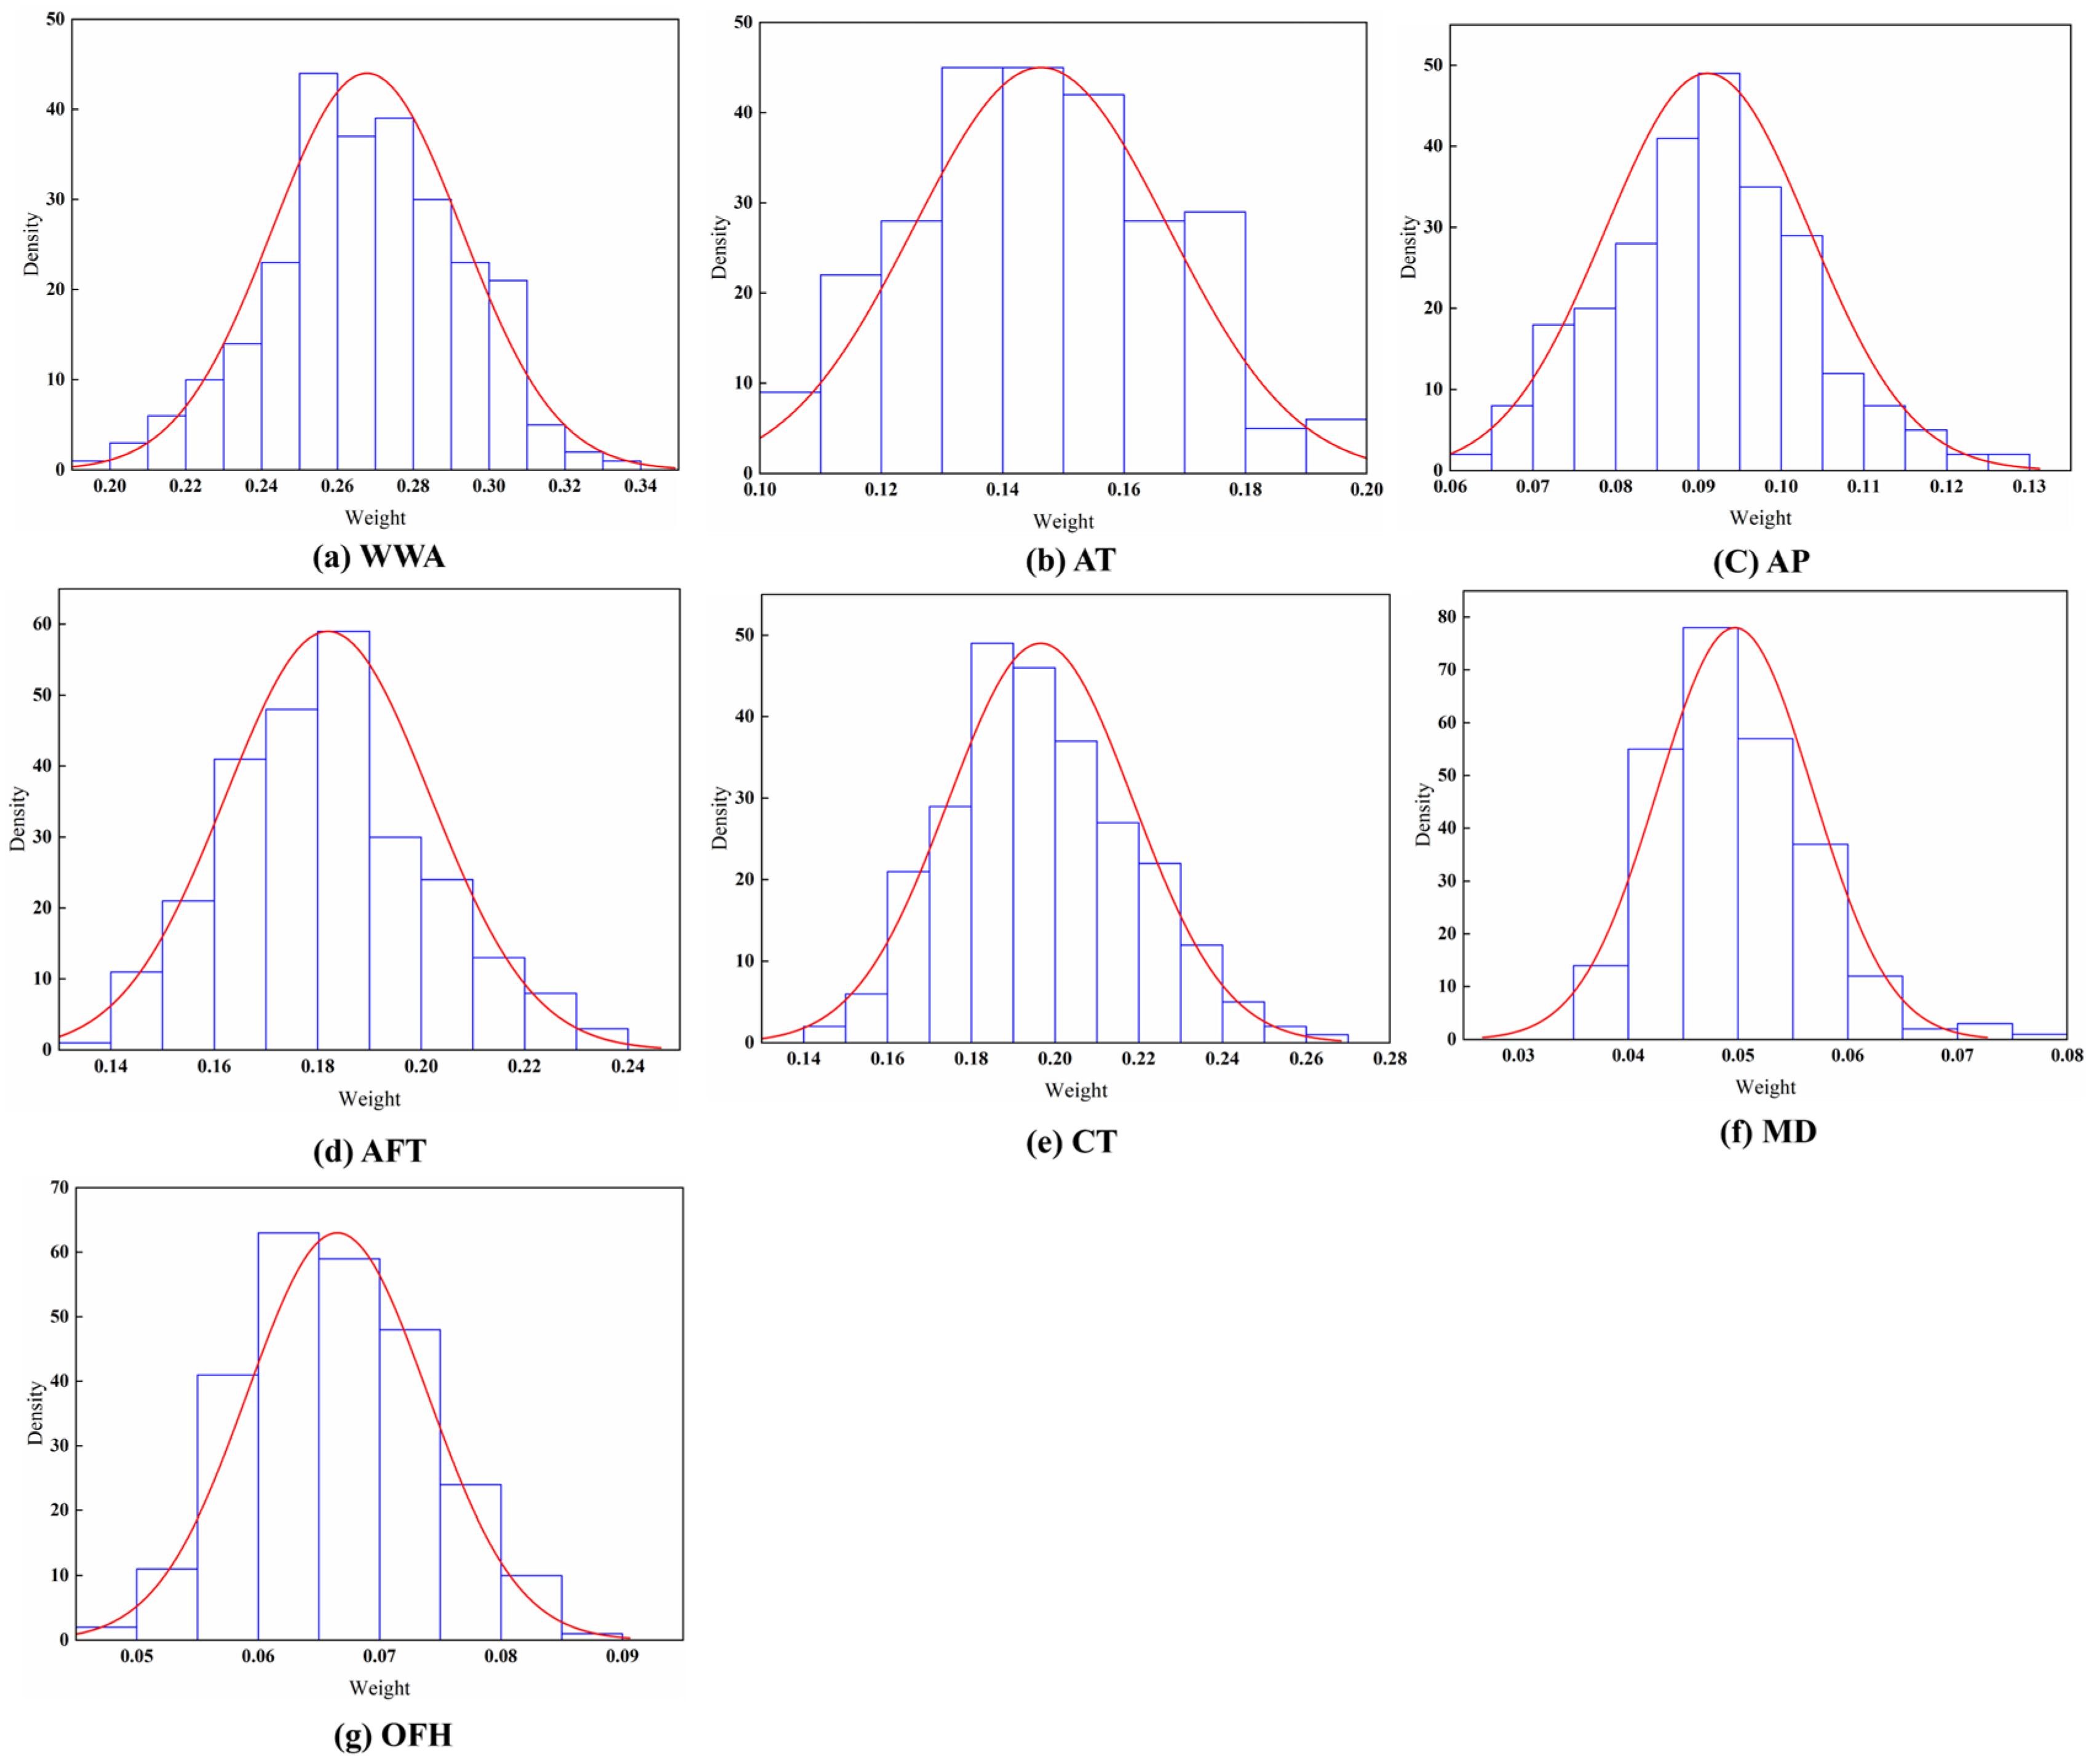
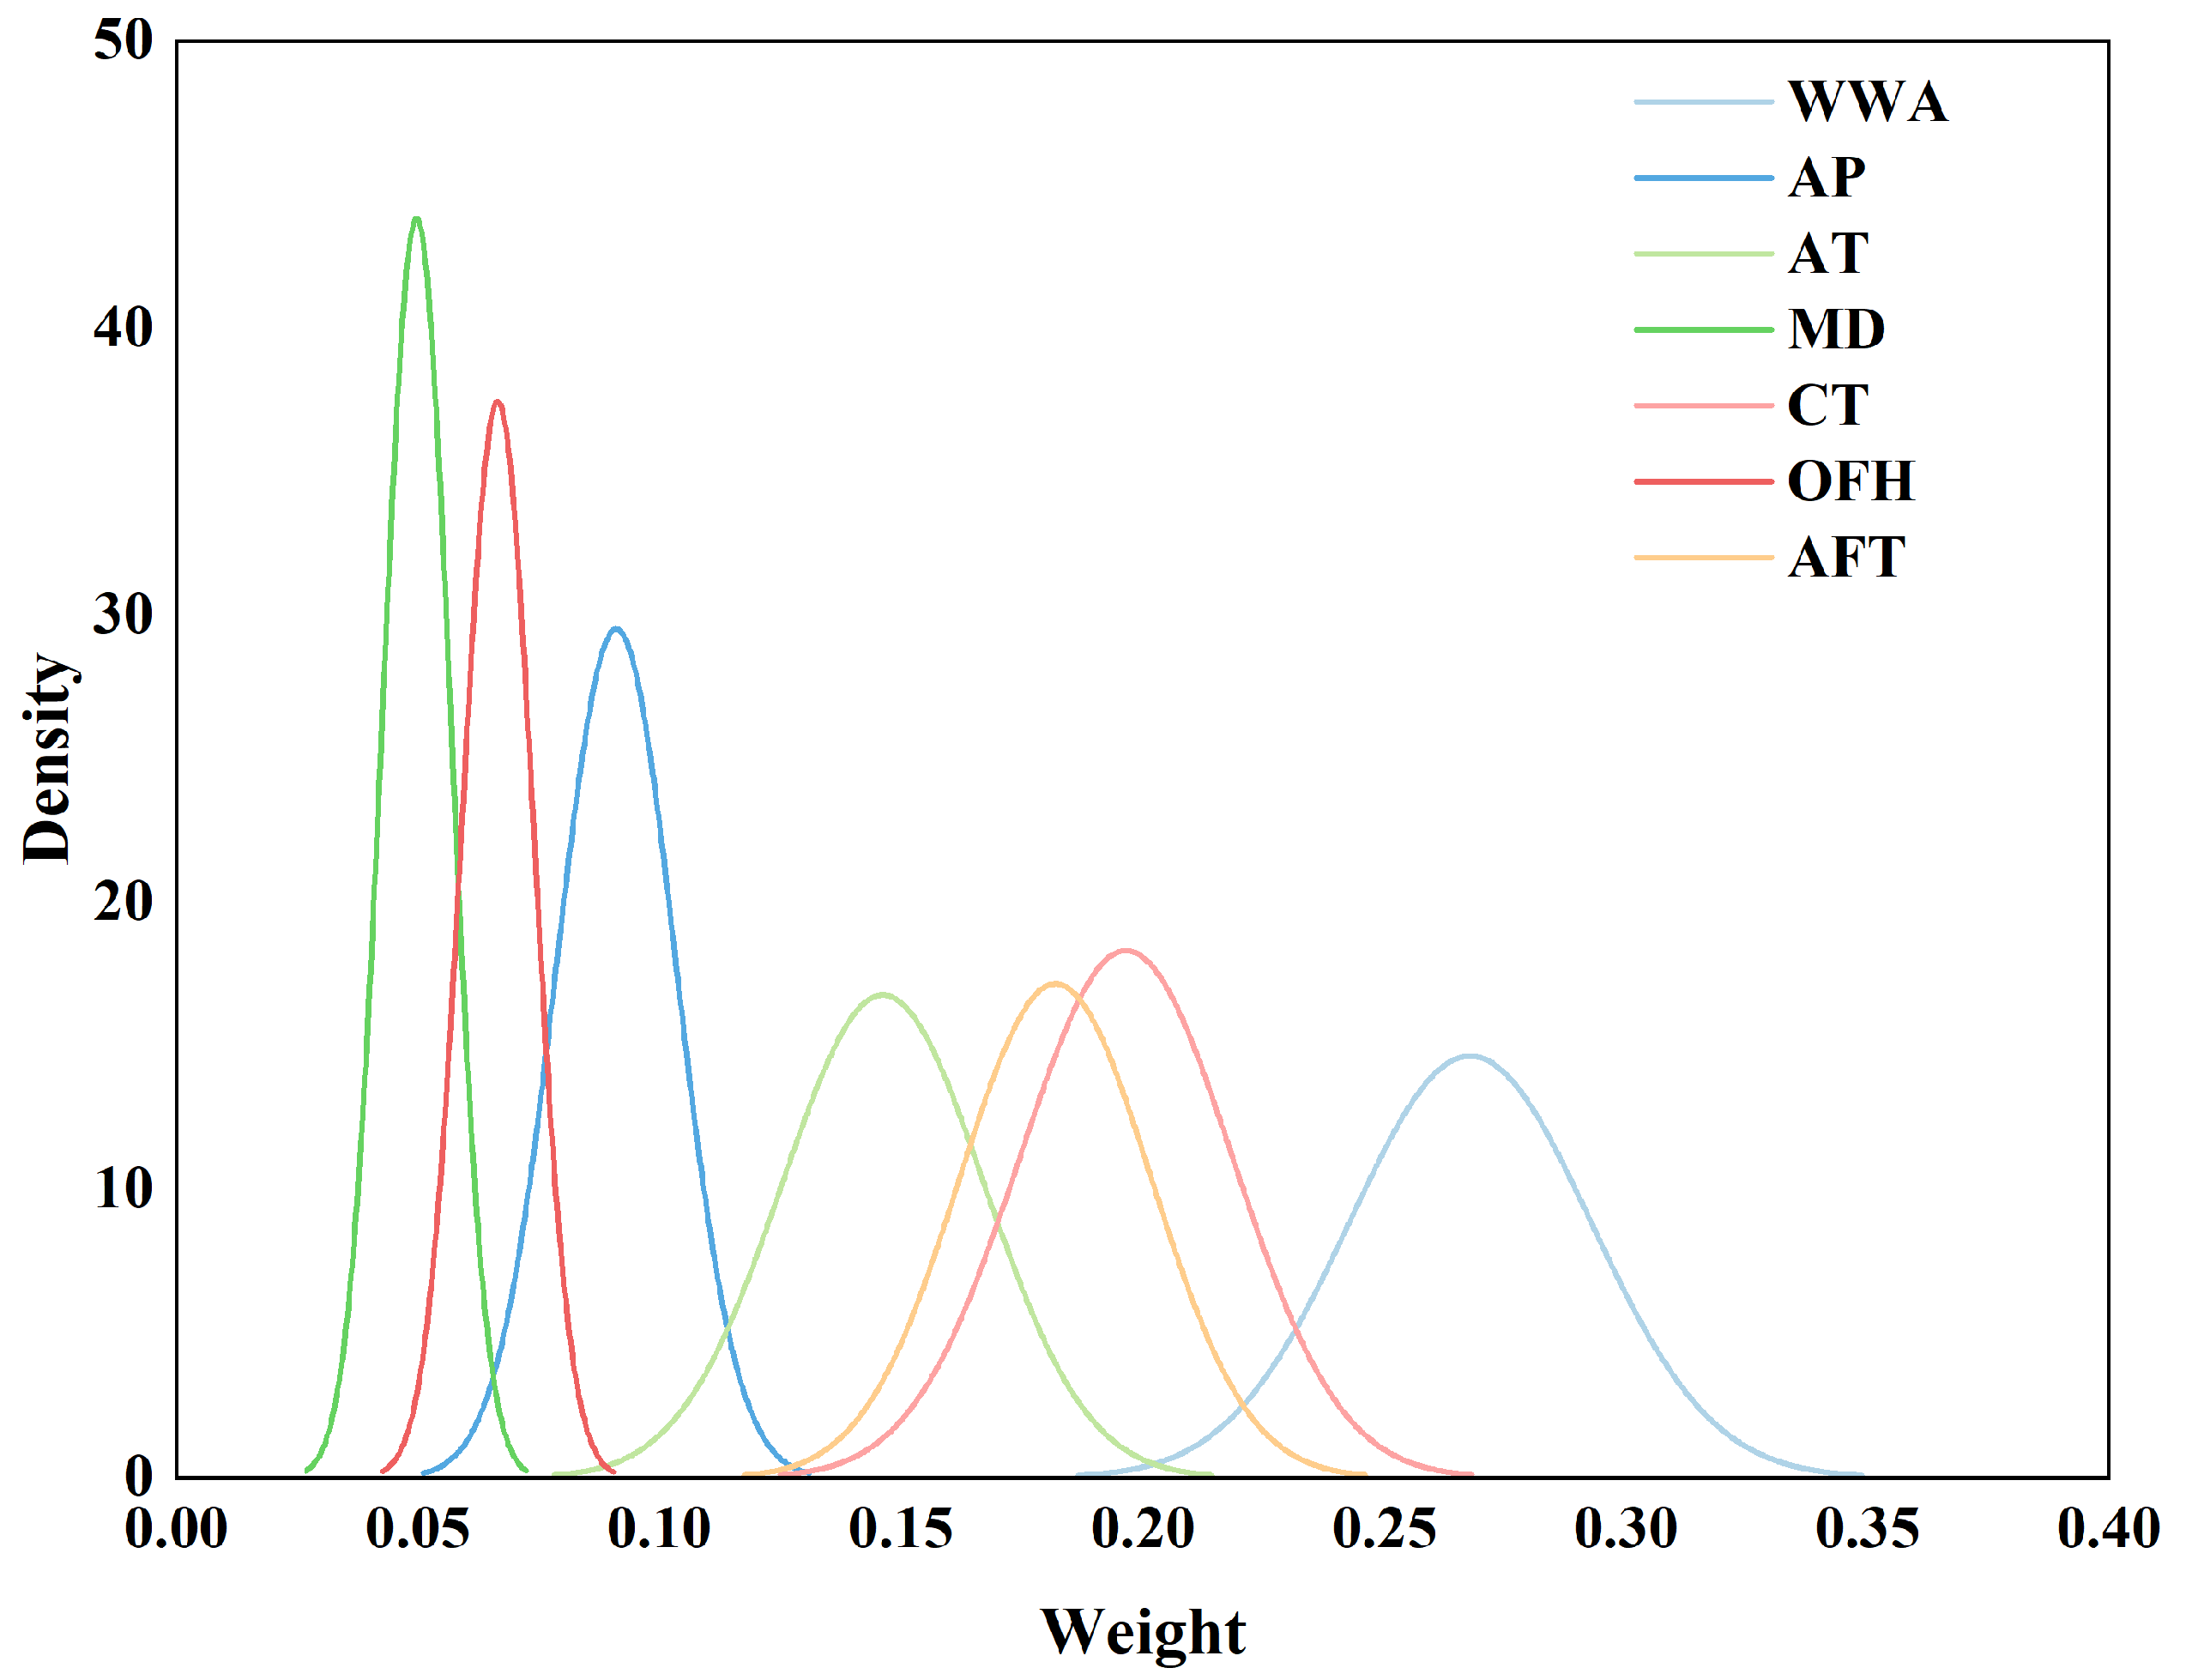
4.2. Global Weights of Evaluation Indicators
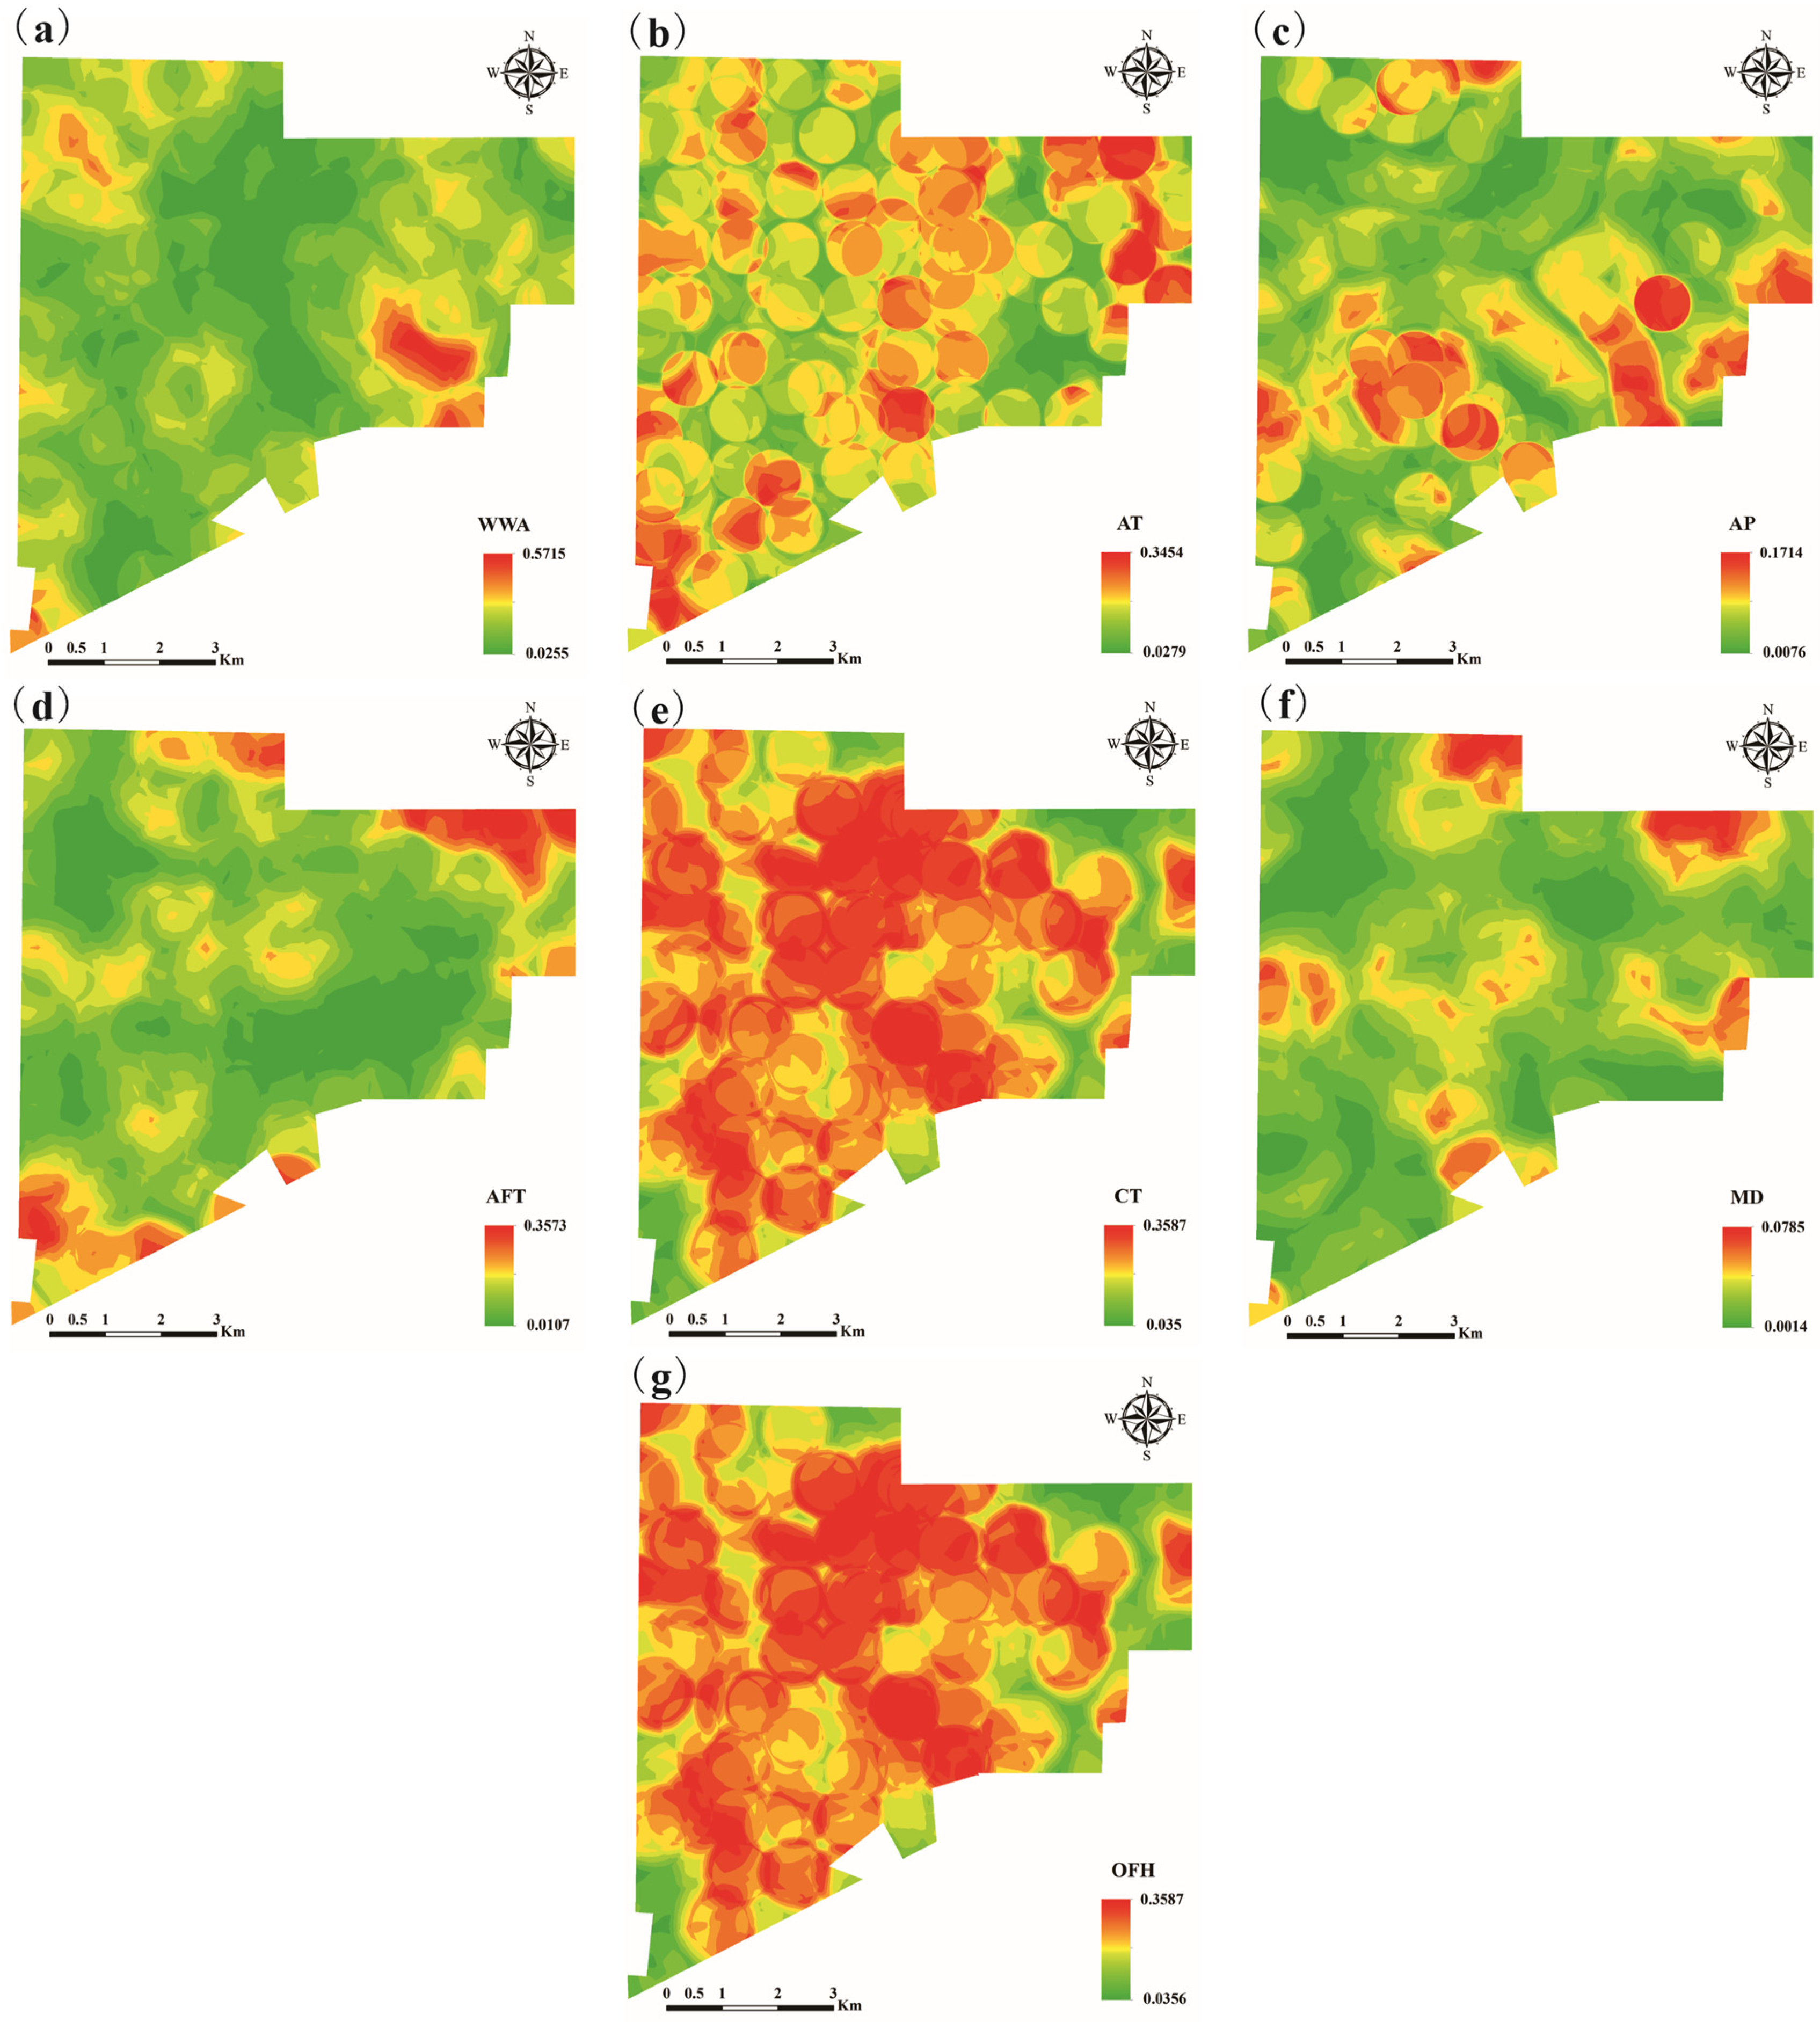
4.3. Evaluation Indicators’ Local Weights
4.4. Water Inrush Risk Evaluation Results
4.4.1. Global Evaluation Model
- (1)
- Establishing the evaluation model.
- (2)
- Evaluation results of water inrush risk.
4.4.2. Local Evaluation Model
4.5. Model Validation
5. Discussion
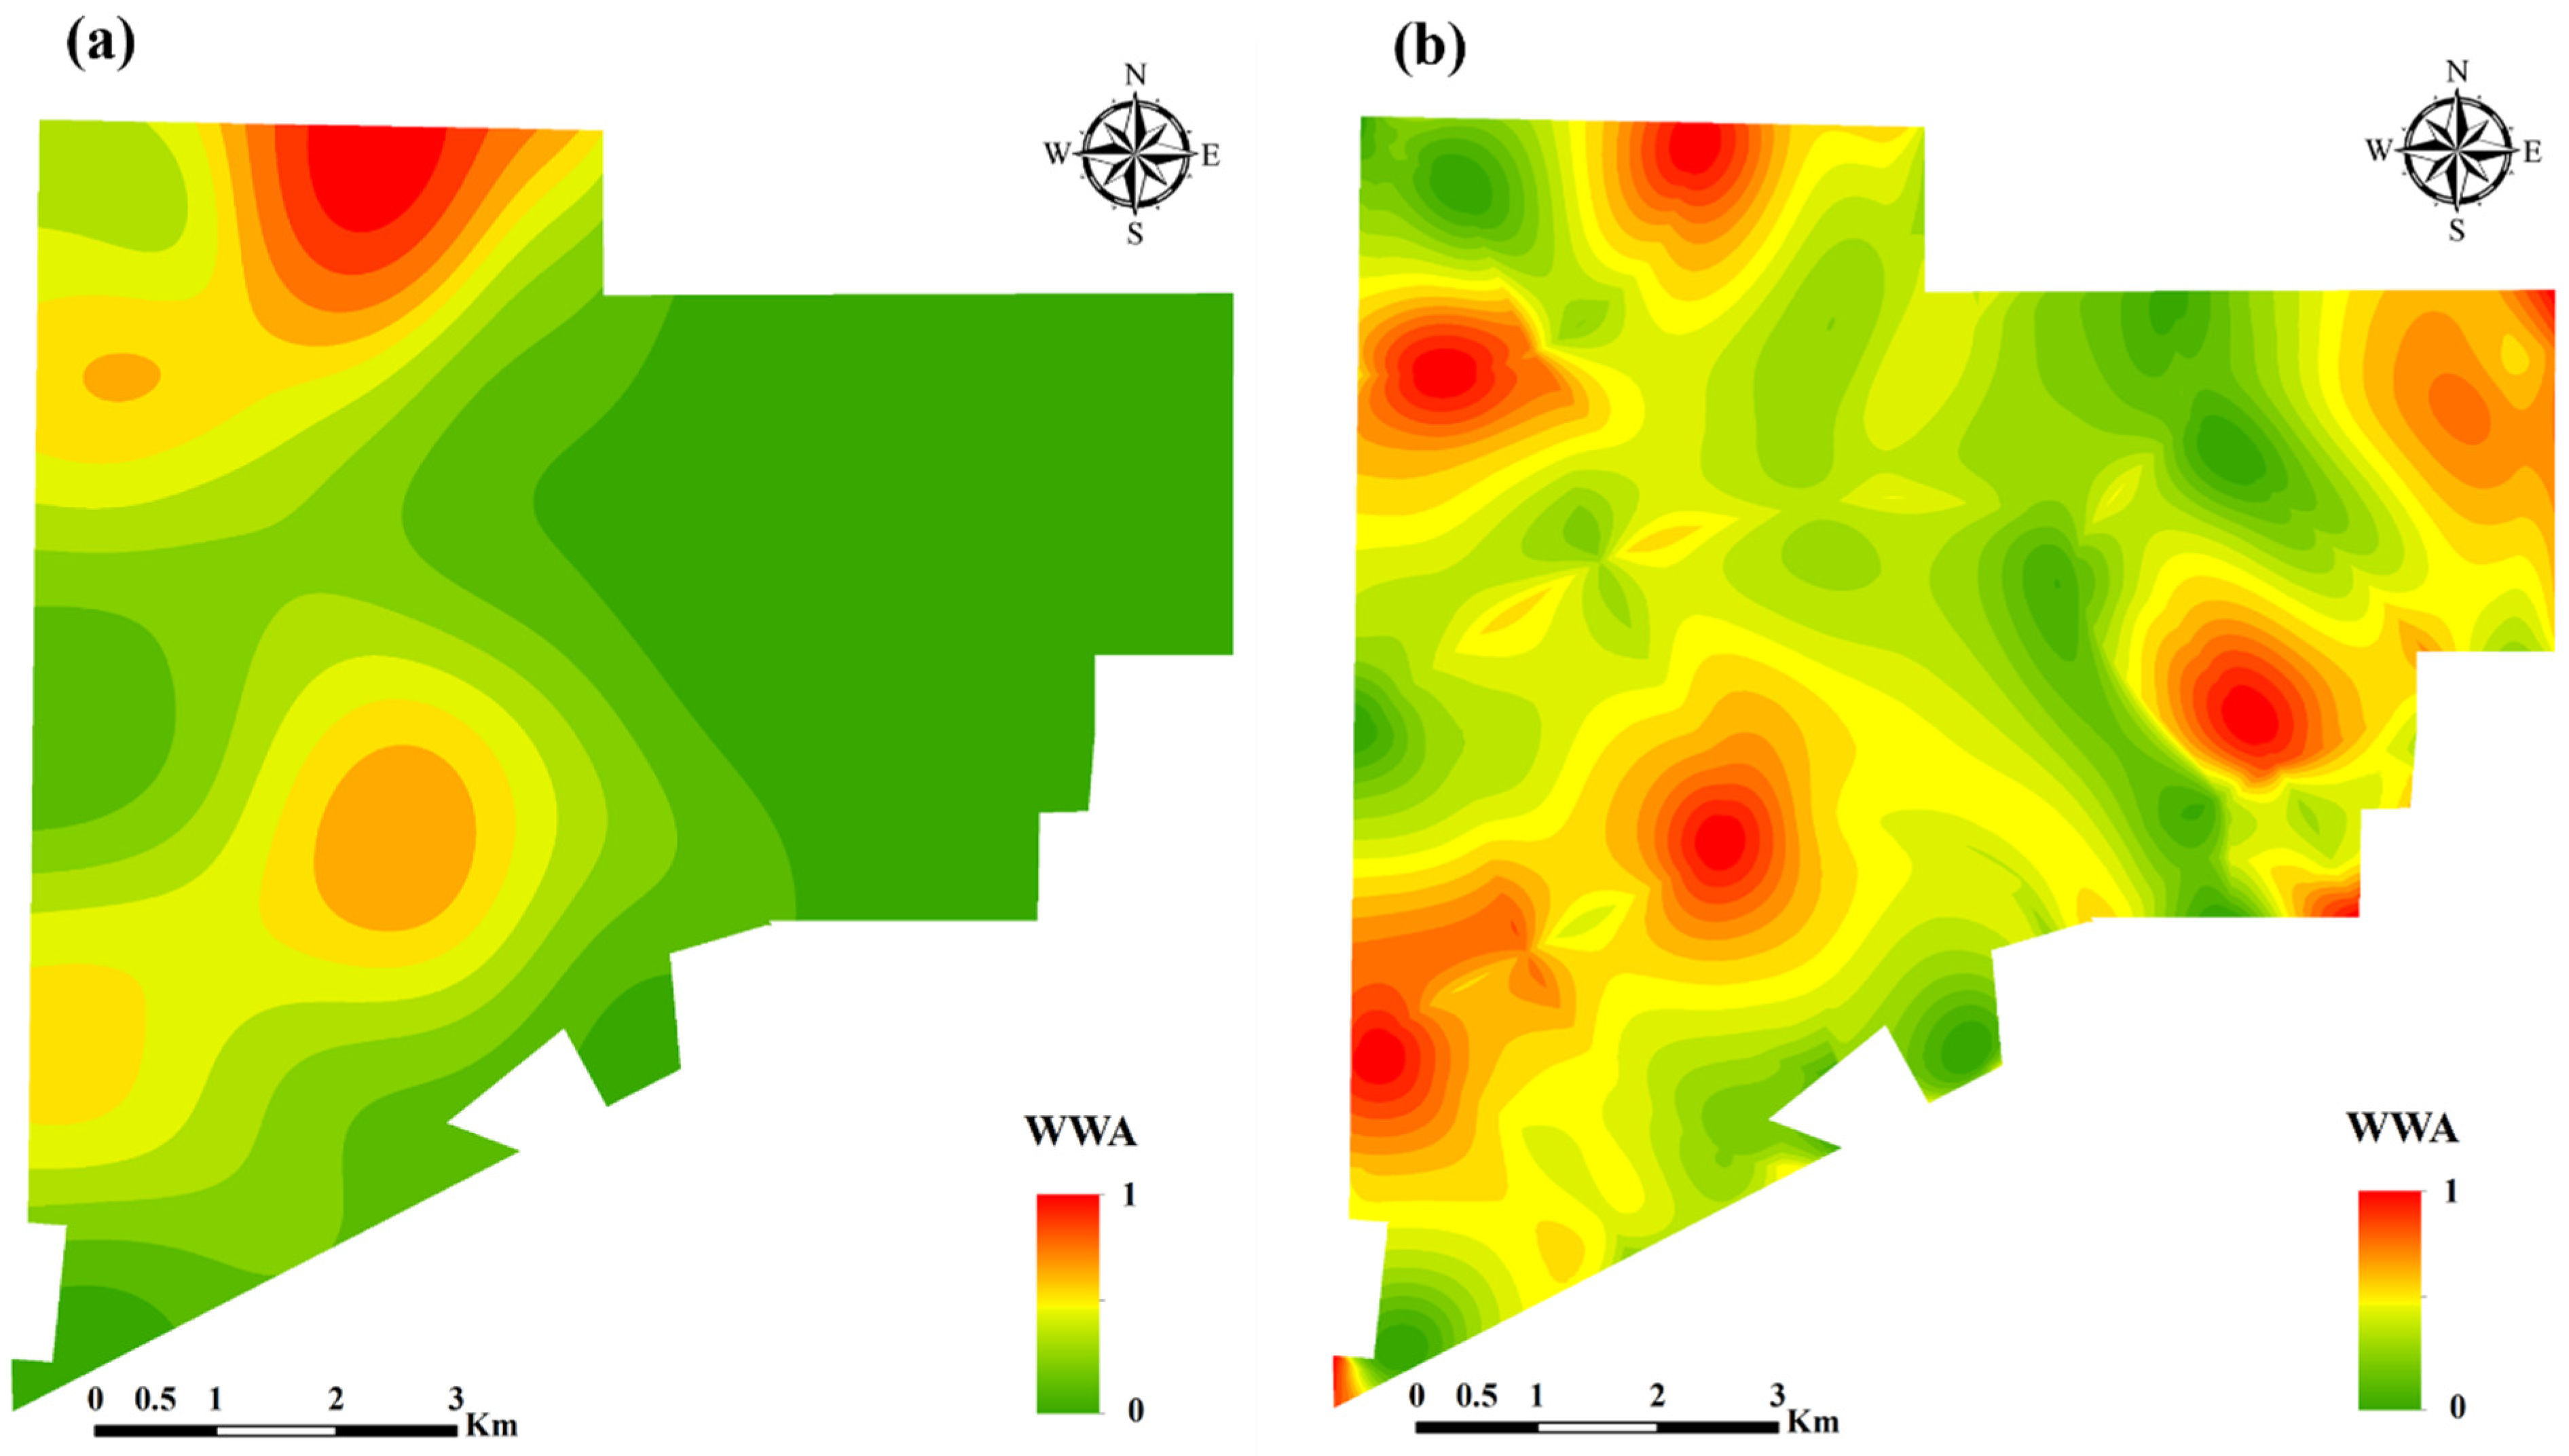
5.1. Comparison of the Spatial Distribution of Evaluation Indicator Attribute Values after Global and Local Standardization
5.2. Comparison of the Spatial Distribution of Global and Local Weights for Evaluation Indicators
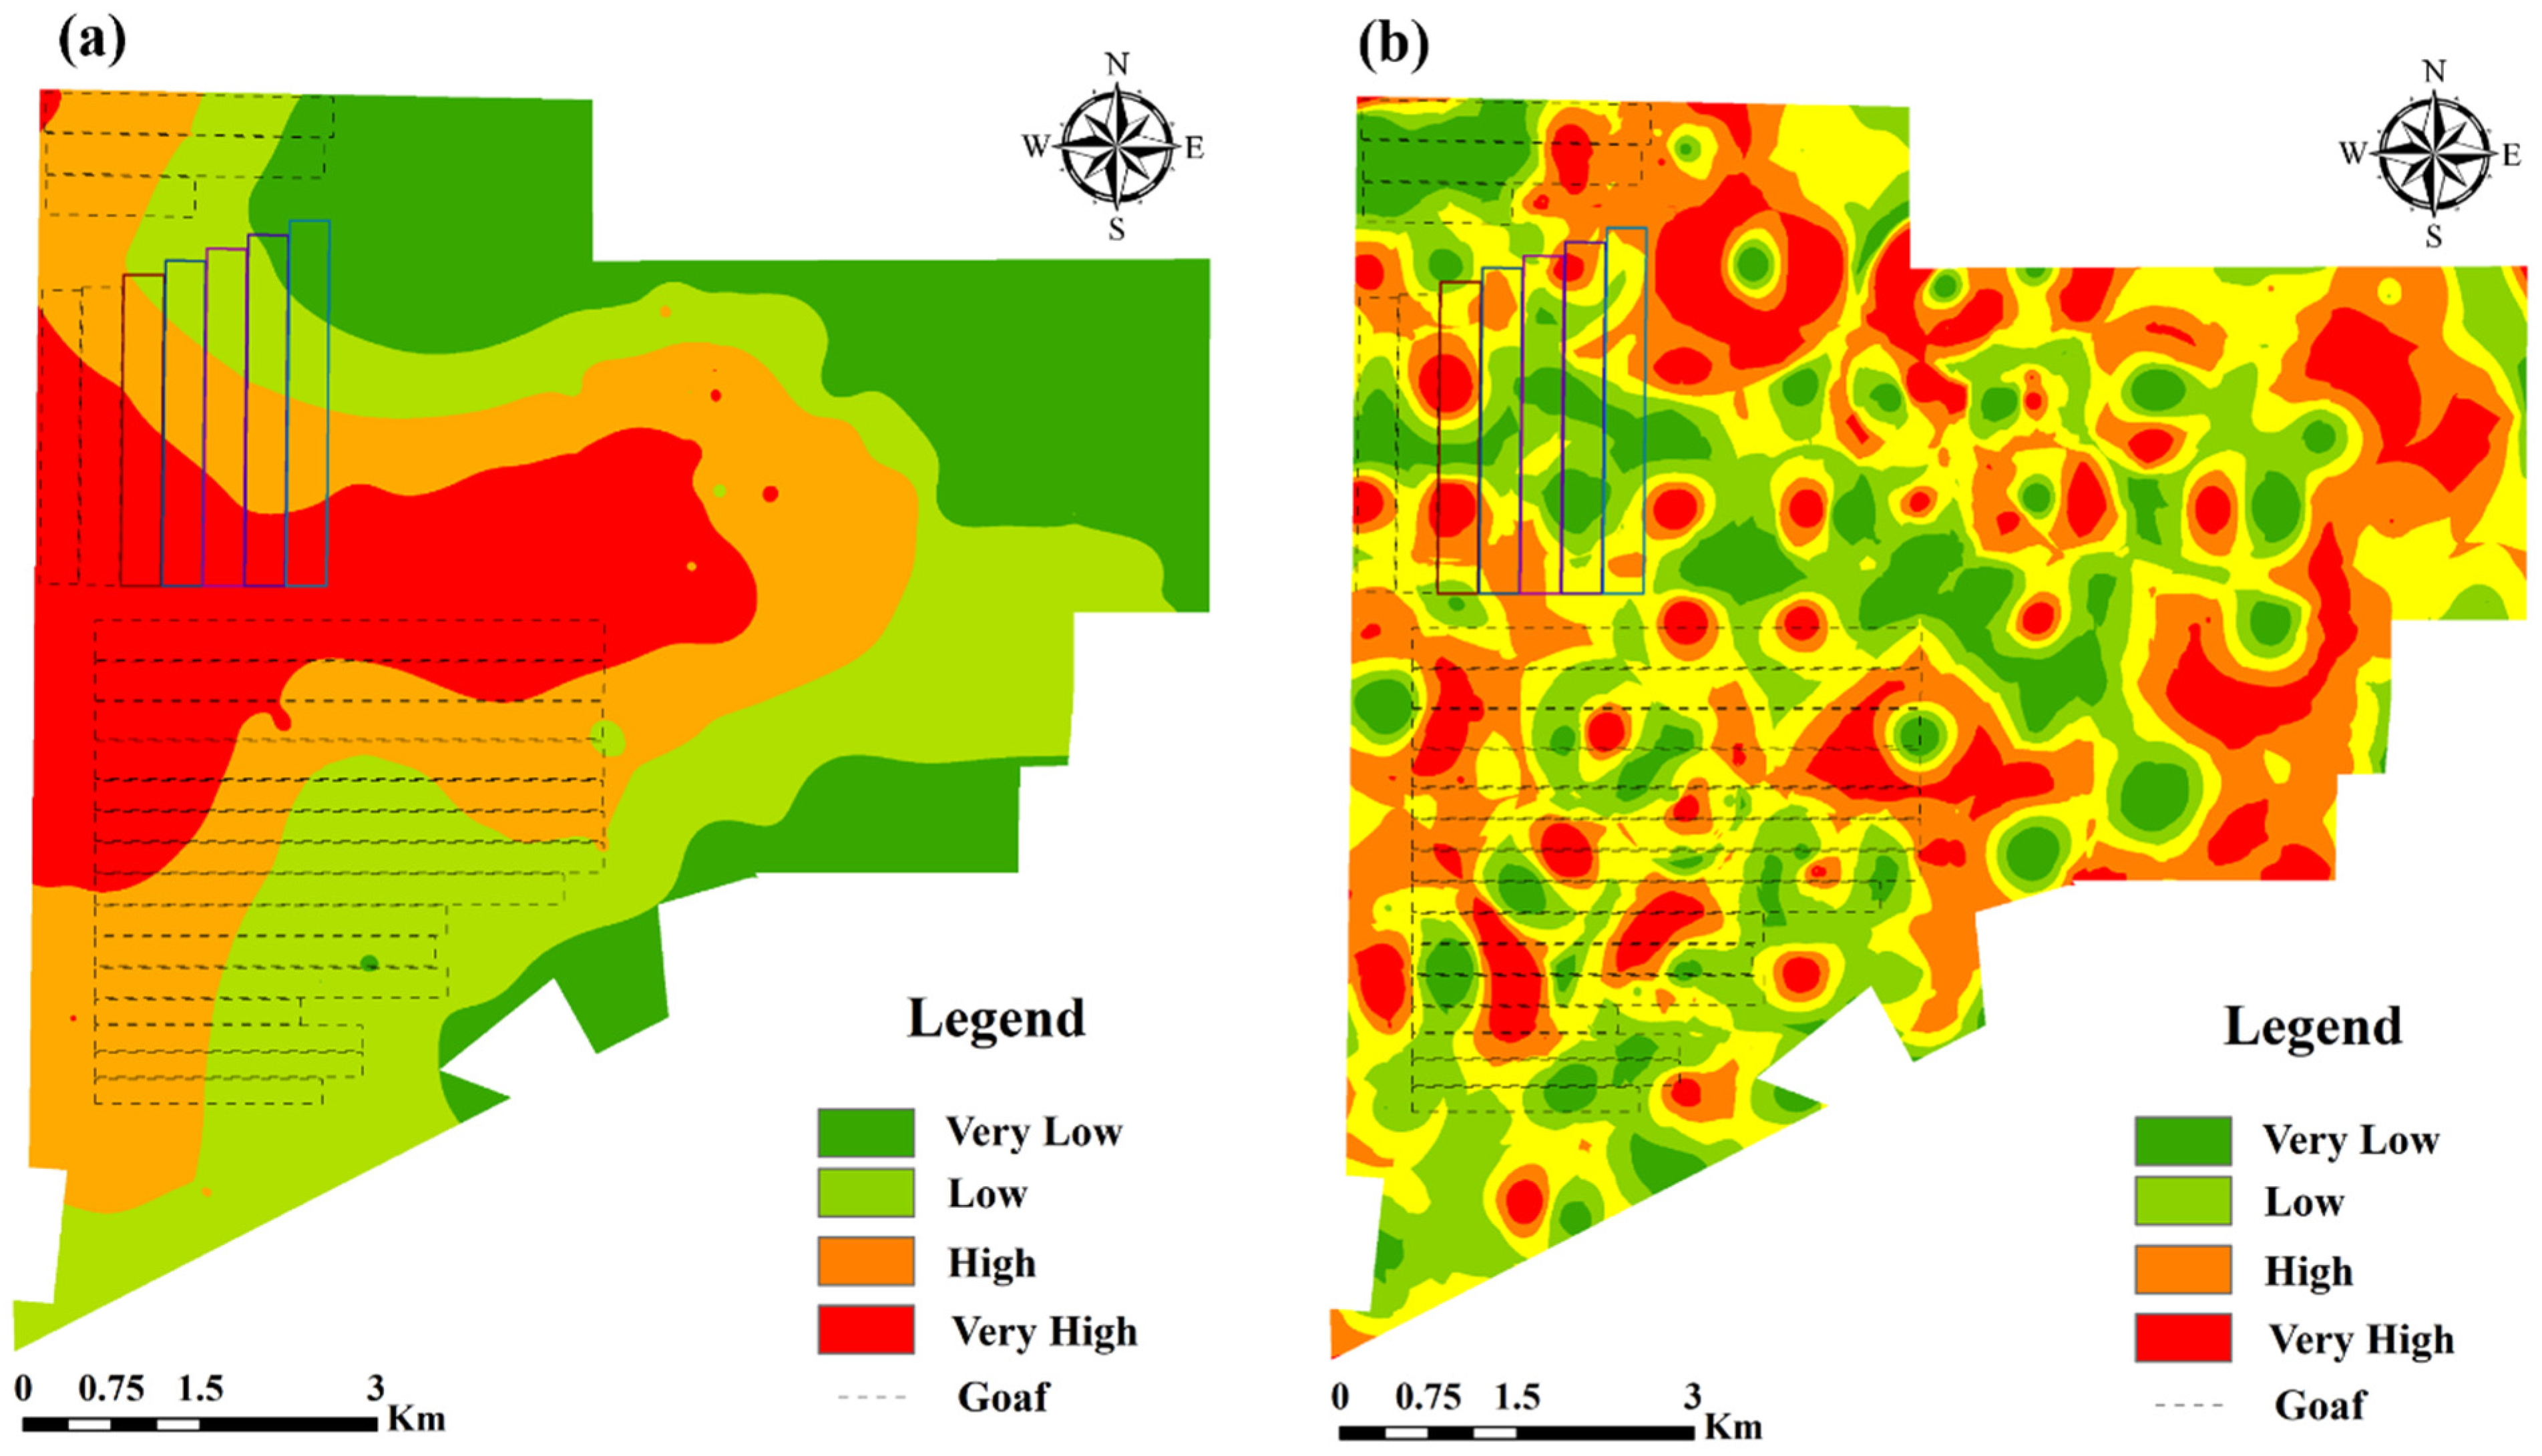
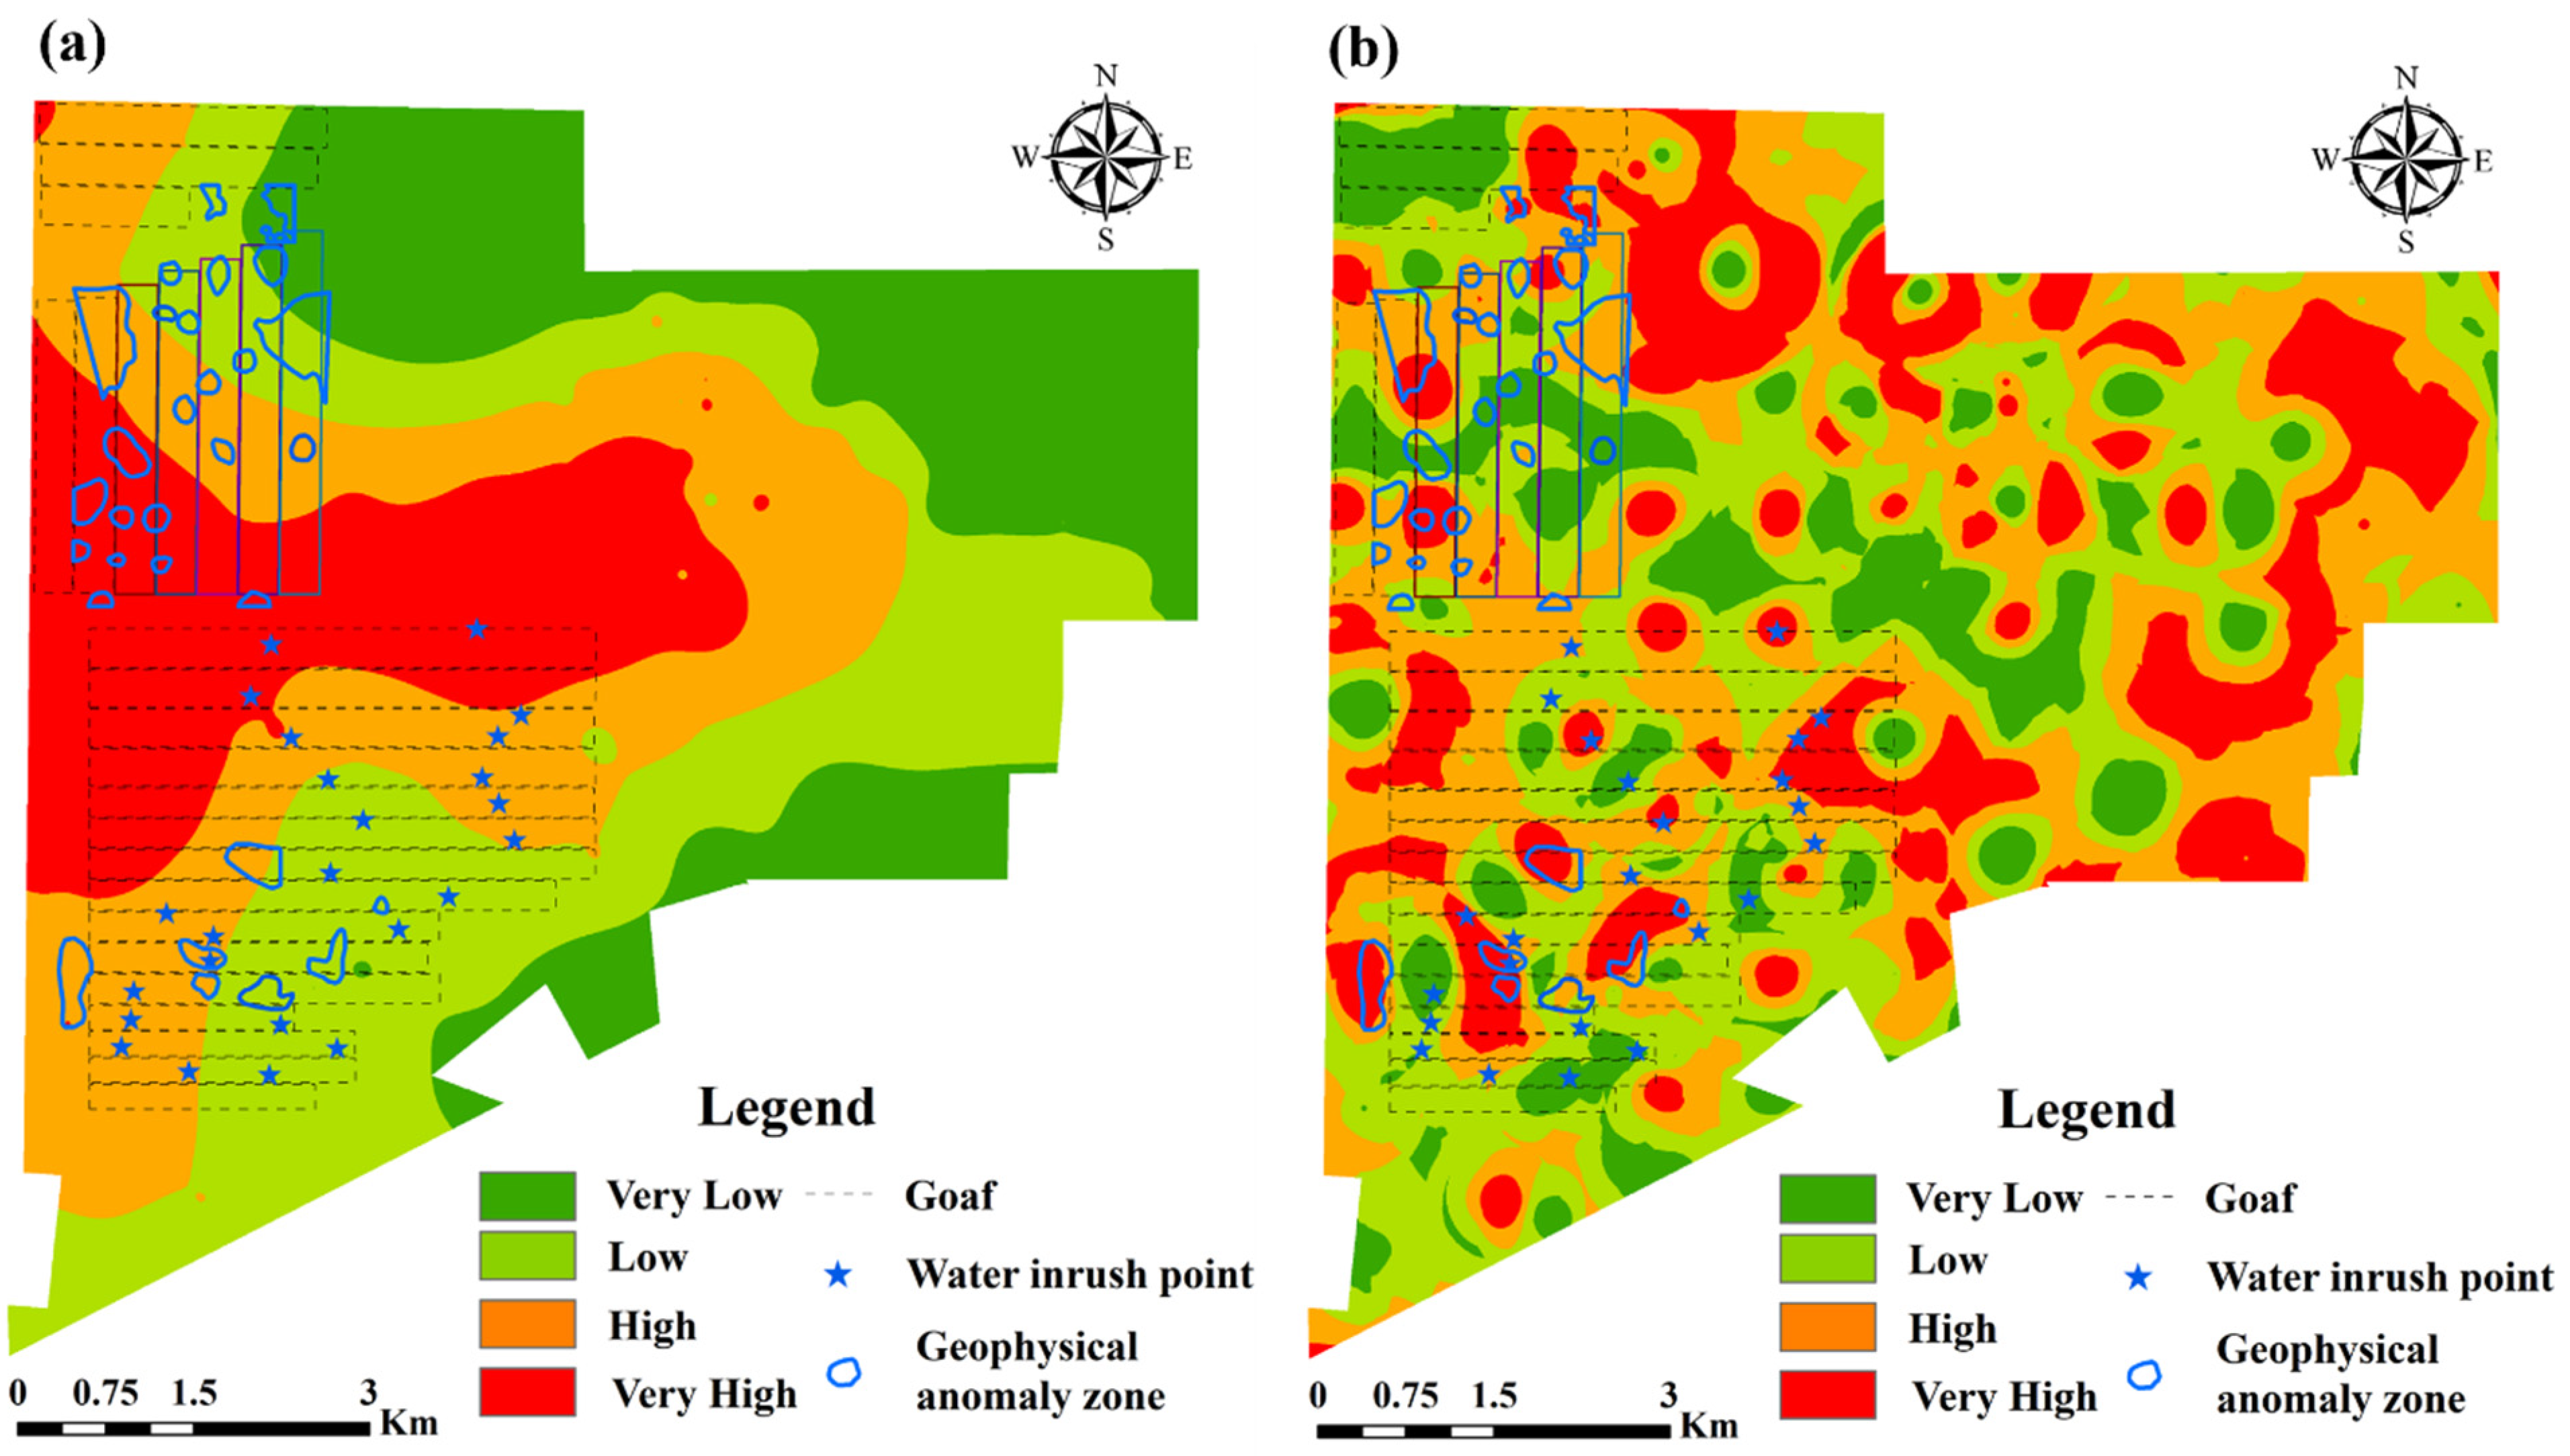
5.3. Comparison of the Spatial Distribution of Water Inrush Risk Assessment Results between Global and Local Models
6. Conclusions
- (1)
- This paper employed a Monte Carlo Analytic Hierarchy Process (AHP) method to calculate the global weights of evaluation criteria, establishing a global evaluation model for roof water inrush. Simultaneously, a circular window was utilized to traverse each position within the study area, standardizing the criterion indicators and calculating evaluation factor weights within the circular local range. This process facilitated the establishment of a local water inrush risk assessment model.
- (2)
- Roof water inrush risk in the Liangshuijing mining area was evaluated using both global and local evaluation models, resulting in the generation of a zoning map for roof water inrush risk. Subsequently, the study area was divided into four categories of water inrush risk—very high, high, low, and very low—using the natural break method in GIS.
- (3)
- Compared to the global evaluation model, the local evaluation model exhibits higher prediction accuracy. Moreover, it reduces the area of high-risk zones while achieving higher accuracy than the global evaluation model, resulting in a more specific delineation of the distribution of water inrush risk zones.
- (4)
- The proposed local water inrush risk assessment model achieves higher accuracy and provides evaluation results that are more consistent with reality. It offers a more detailed delineation of water inrush risk areas, thereby providing a new evaluation method for water inrush risk assessment.
Author Contributions
Funding
Data Availability Statement
Acknowledgments
Conflicts of Interest
References
- Li, P. Mine Water Problems and Solutions in China. Mine Water Environ. 2018, 37, 217–221. [Google Scholar] [CrossRef]
- Zeng, Y.F.; Li, Z.; Gong, H.J.; Zheng, J. Water abundance characteristics in aquifer of weathered roof bedrock and prediction on water inrush risk. Coal Eng. 2018, 50, 100–104. [Google Scholar]
- Dong, S.N.; Ji, Y.D.; Wang, H.; Zhao, B.F.; Cao, H.D.; Liu, Y.; Liu, Y.F.; Ji, Z.K.; Liu, B.G. Prevention and control technology and application of roof water disaster in Jurassic coal field of Ordos Basin. J. China Coal Soc. 2020, 45, 2367–2375. [Google Scholar]
- The Coal Safety Network. Available online: https://www.mkaq.org/ (accessed on 30 March 2024).
- Hu, W.Y.; Tian, G. Mine Water Disaster Type and Prevention and Control Counterm easures in China. Coal Sci. Technol. 2010, 38, 92–96. [Google Scholar]
- Wu, Q.; Zhou, W.; Wang, J.; Xie, S. Prediction of groundwater inrush into coal mines from aquifers underlying the coal seams in China; application of vulnerability index method to Zhangcun coal mine, China. Environ. Earth Sci. 2009, 57, 1187–1195. [Google Scholar] [CrossRef]
- Wu, Q.; Liu, Y.; Luo, L.; Liu, S.; Sun, W.; Zeng, Y. Quantitative evaluation and prediction of water inrush vulnerability from aquifers overlying coal seams in Donghuantuo coal mine, China. Environ. Earth Sci. 2015, 74, 1429–1437. [Google Scholar] [CrossRef]
- Wu, Q.; Xu, K.; Zhang, W.; Wei, Z. Roof aquifer water abundance evaluation; a case study in Taigemiao, China. Arab. J. Geosci. 2017, 10, 254. [Google Scholar] [CrossRef]
- Zeng, Y.; Wu, Q.; Liu, S.; Zhai, Y.; Lian, H.; Zhang, W. Evaluation of a coal seam roof water inrush: Case study in the Wangjialing coal mine, China. Mine Water Environ. 2018, 37, 174–184. [Google Scholar] [CrossRef]
- Wu, Q.; Liu, Y.; Zhou, W.; Li, B.; Zhao, B.; Liu, S.; Sun, W.; Zeng, Y. Evaluation of water inrush vulnerability from aquifers overlying coal seams in the Menkeqing coal mine, China. Mine Water Environ. 2015, 34, 258–269. [Google Scholar] [CrossRef]
- Wu, Q.; Guo, X.; Shen, J.; Xu, S.; Liu, S.; Zeng, Y. Risk Assessment of Water Inrush from Aquifers Underlying the Gushuyuan Coal Mine, China. Mine Water Environ. 2017, 36, 96–103. [Google Scholar] [CrossRef]
- Wu, Q.; Zhang, Y.; Liu, Y. Using the Vulnerable Index Method to Assess the Likelihood of a Water Inrush through the Floor of a Multi-seam Coal Mine in China. Mine Water Environ. J. 2011, 25, 54–60. [Google Scholar] [CrossRef]
- Wu, Q.; Zhao, D.; Wang, Y.; Shen, J.; Mu, W.; Liu, H. Method for assessing coal-floor water-inrush risk based on the variable-weight model and unascertained measure theory. Hydrogeol. J. 2017, 25, 2089–2103. [Google Scholar] [CrossRef]
- Li, Q.; Sui, W. Risk evaluation of mine-water inrush based on principal component logistic regression analysis and an improved analytic hierarchy process. Hydrogeol. J. 2021, 29, 1299–1311. [Google Scholar] [CrossRef]
- Cheng, X.; Qiao, W.; Li, G.; Yu, Z. Risk assessment of roof water disaster due to multi-seam mining at Wulunshan Coal Mine in China. Arab. J. Geosci. 2021, 14, 1116. [Google Scholar] [CrossRef]
- Liu, M.; Qiao, W.; Meng, Q.; Bu, Z. A new risk zoning method for water inrush from separated layers at coal mines: A case study, Cuimu coal mine, China. Arab. J. Geosci. 2021, 14, 2544. [Google Scholar] [CrossRef]
- Wang, D.; Sui, W.; Ji, Z. Fault complexity degree in a coal mine and the implications for risk assessment of floor water inrush. Geomat. Nat. Hazards Risk 2024, 15, 2293464. [Google Scholar] [CrossRef]
- Gao, C.; Wang, D.; Liu, K.; Deng, G.; Li, J.; Jie, B. A Multifactor Quantitative Assessment Model for Safe Mining after Roof Drainage in the Liangshuijing Coal Mine. ACS Omega 2022, 7, 26437–26454. [Google Scholar] [CrossRef]
- Zhao, Z.; Gu, J. Risk Evaluation of Mine-Water Inrush Based on Comprehensive Weight Method. Geotech. Geol. Eng. 2023, 41, 189–203. [Google Scholar] [CrossRef]
- Li, L.; Li, W.; Zhou, S.; He, J.; Chen, W.; Wang, Q. An improved risk zoning method of bed-separation water inrush in underground coal mines: A case study in Ningxia, China. Environ. Sci. Pollut. Res. Int. 2023, 30, 57518–57528. [Google Scholar] [CrossRef]
- Zhao, B.; Liu, Q.; Zhu, J. Risk Assessment and Zonation of Roof Water Inrush Based on the Analytic Hierarchy Process, Principle Component Analysis, and Improved Game Theory Method. Sustainability 2023, 15, 11375. [Google Scholar] [CrossRef]
- Wang, D.; Gao, C.; Liu, K.; Gong, J.; Fang, Y.; Xiong, S. A GIS-Based Probabilistic Spatial Multicriteria Roof Water Inrush Risk Evaluation Method Considering Decision Makers’ Risk-Coping Attitude. Water 2023, 15, 254. [Google Scholar] [CrossRef]
- Liu, Q.; Xu, J.; Wang, Q.; Li, W. Risk Assessment of Water Inrush from Coal Seam Roof Based on the Combined Weighting of the Geographic Information System and Game Theory: A Case Study of Dananhu Coal Mine No. 7, China. Water 2024, 16, 710. [Google Scholar] [CrossRef]
- Rosenbloom, E.S. A probabilistic interpretation of the final rankings in AHP. Eur. J. Oper. Res. 1997, 96, 371–378. [Google Scholar] [CrossRef]
- Hsu, T.; Pan, F.F.C. Application of Monte Carlo AHP in ranking dental quality attributes. Expert. Syst. Appl. 2009, 36, 2310–2316. [Google Scholar] [CrossRef]
- Wang, C.; Yang, S.; Jiang, C.Y.; Wu, G.Y.; Liu, Q.Z. Monte Carlo analytic hierarchy process for selection of the longwall mining method in thin coal seams. J. S. Afr. Inst. Min. Metall. 2019, 119, 1005–1012. [Google Scholar]
- Ataei, M.; Shahsavany, H.; Mikaeil, R. Monte Carlo Analytic Hierarchy Process (MAHP) approach to selection of optimum mining method. Int. J. Min. Sci. Technol. 2013, 23, 573–578. [Google Scholar] [CrossRef]
- Tang, Z.; Yi, S.; Wang, C.; Xiao, Y. Incorporating probabilistic approach into local multi-criteria decision analysis for flood susceptibility assessment. Stoch. Env. Res. Risk A 2018, 32, 701–714. [Google Scholar] [CrossRef]
- Tang, Z.; Zhang, H.; Yi, S.; Xiao, Y. Assessment of flood susceptible areas using spatially explicit, probabilistic multi-criteria decision analysis. J. Hydrol. 2018, 558, 144–158. [Google Scholar] [CrossRef]
- Xiao, Y.; Yi, S.; Tang, Z. A Spatially Explicit Multi-Criteria Analysis Method on Solving Spatial Heterogeneity Problems for Flood Hazard Assessment. Water Resour. Manag. 2018, 32, 3317–3335. [Google Scholar] [CrossRef]
- Malczewski, J.; Liu, X. Local ordered weighted averaging in GIS-based multicriteria analysis. Ann. GIS 2014, 20, 117–129. [Google Scholar] [CrossRef]


| Evaluation Indicators | Mean | Min | Max | Standardization | Confidence Interval |
|---|---|---|---|---|---|
| WWA | 0.2678 | 0.1974 | 0.3301 | 0.02498 | (0.2647–0.2708) |
| AP | 0.0911 | 0.0633 | 0.1288 | 0.01233 | (0.0895–0.0925) |
| AT | 0.1463 | 0.1044 | 0.1985 | 0.0209 | (0.1437–0.1488) |
| MD | 0.0497 | 0.0370 | 0.0761 | 0.0070 | (0.0488–0.0505) |
| CT | 0.1965 | 0.1401 | 0.2613 | 0.0220 | (0.1938–0.1992) |
| OFH | 0.0665 | 0.0484 | 0.0875 | 0.0074 | (0.0656–0.0674) |
| APT | 0.1819 | 0.1395 | 0.2398 | 0.01979 | (0.1795–0.1843) |
| Global Evaluation Model | Local Evaluation Model | |
|---|---|---|
| Predictive accuracy of geophysical anomaly areas (%) | 57.08 | 89.31 |
| Predictive accuracy of water inrush points (%) | 66.66 | 62.5 |
| Average accuracy (%) | 61.87 | 75.9 |
| Global Evaluation Model | Local Evaluation Model | |
|---|---|---|
| The number of pixels (count) within the very high- and high-risk zones. | 906,962 | 781,558 |
| The number of pixels (count) within the very low- and low-risk zones. | 608,489 | 733,893 |
Disclaimer/Publisher’s Note: The statements, opinions and data contained in all publications are solely those of the individual author(s) and contributor(s) and not of MDPI and/or the editor(s). MDPI and/or the editor(s) disclaim responsibility for any injury to people or property resulting from any ideas, methods, instructions or products referred to in the content. |
© 2024 by the authors. Licensee MDPI, Basel, Switzerland. This article is an open access article distributed under the terms and conditions of the Creative Commons Attribution (CC BY) license (https://creativecommons.org/licenses/by/4.0/).
Share and Cite
Gao, C.; Wang, D.; Ma, J.; Liu, K.; Fang, Y. Local Water Inrush Risk Assessment Method Based on Moving Window and Its Application in the Liangshuijing Mining Area. Water 2024, 16, 1083. https://doi.org/10.3390/w16081083
Gao C, Wang D, Ma J, Liu K, Fang Y. Local Water Inrush Risk Assessment Method Based on Moving Window and Its Application in the Liangshuijing Mining Area. Water. 2024; 16(8):1083. https://doi.org/10.3390/w16081083
Chicago/Turabian StyleGao, Chengyue, Dangliang Wang, Jin Ma, Kerui Liu, and Yafei Fang. 2024. "Local Water Inrush Risk Assessment Method Based on Moving Window and Its Application in the Liangshuijing Mining Area" Water 16, no. 8: 1083. https://doi.org/10.3390/w16081083