Article

Design Issue Analysis and Operation Effect Evaluation of Large-Scale Storage Tank

1
Key Laboratory of Urban Stormwater System and Water Environment, Ministry of Education, Beijing University of Civil Engineering and Architecture, Beijing 100044, China
2
Beijing Energy Conservation & Sustainable Urban and Rural Development Provincial and Ministry Co-Construction Collaboration Innovation Center, Beijing 100044, China
*
Author to whom correspondence should be addressed.
Water 2024, 16(8), 1097; https://doi.org/10.3390/w16081097
Submission received: 9 February 2024 / Revised: 5 April 2024 / Accepted: 9 April 2024 / Published: 11 April 2024
(This article belongs to the Special Issue Urban Flood Mitigation and Sustainable Stormwater Management)

Abstract

:
In order to address the issue of combined sewer overflows (CSOs), W city has constructed a large-scale storage tank with a volume of 220,000 m3. The storage tank is planned for CSO control in the near term and stormwater runoff pollution control in the long term. However, the actual operation of the storage tank is unsatisfactory. This paper elucidates the design scheme and operation mode of the tank and analyzes the challenges encountered during its design and operation. A storm water management model (SWMM) model was constructed to simulate the effect of the storage tank working in a combined sewer system (CSS), a separate sewer system (SSS) and a decentralized storage situation. This study determined that during the 2022 rainy season, the actual reduction in pollutants by the storage tank was only about 60% of the designed value. As a result, the inadequate treatment capacity of the downstream wastewater treatment plant (WWTP) resulted in the water being retained in the tank for a long time, leading to unsatisfactory operation outcomes. If the storage tank works in SSS and the problem of water retention can be solved, it could reduce the total runoff volume by 30% and the total amount of pollutants by 40% during the same rainy season. At the same time, under the premise of constant total storage volume, if decentralized storage tanks were used to control runoff pollution, the reduction effect can be increased by up to 11.6% compared with that of the centralized storage.

1. Introduction

Although separate sewer systems (SSS) are basically implemented in newly built urban areas in China [1,2], the transformation from combined sewer systems (CSS) to SSS in older urban areas is also ongoing. Many cities still use the CSS constructed decades ago [3,4]. When the rainfall becomes heavy, the combined sewage volume exceeds the treatment capacity of the wastewater treatment plant (WWTP), and combined sewer overflow (CSO) events occur, resulting in untreated wastewater and stormwater discharges to the receiving water body (RWB) [5]. In recent years, climate change and the rapid urbanization process have led to increased CSO volume and pollution loads [6].
As an important part of the infrastructure in CSO control, storage tanks play an important role in reducing overflow frequency, pollutant discharge [7], the thermal pollution of stormwater runoff [8], as well as in ensuring the quality of the receiving water body (RWB) [9,10,11], and have been widely used all over the world [12,13]. When rainfall causes CSO to occur, the wastewater is diluted by stormwater in the CSS and the combined sewage is subsequently discharged into the storage tank. Although the storage tank cannot directly remove the pollutants, after the end of rainfall, when the treatment capacity of the WWTP is surplus, the pollutants can be removed by conveying the storage water to the WWTP for treatment [14]. This allows the storage tank to reduce pollutants indirectly, as the CSO that would otherwise be discharged into the RWB is stored by the storage tank and conveyed to the WWTP for treatment after the rainfall, thus meeting the discharge standards. Similarly, in the SSS, the storage tank also plays the same role [15]. During the initial period of rainfall, stormwater runoff with high pollutant concentrations is collected by storage tanks and conveyed to WWTPs or other treatment facilities after rainfall. In general, whether in CSS or SSS, the role of the storage tank is to protect the RWB by collecting sewage with high pollutant concentrations [16], directly reducing the discharge volume of CSO or stormwater runoff. Then, the storage water is conveyed to the treatment facility to remove most of the pollutants [17].
The volume calculation of storage tank is usually based on the comprehensive design index of the equivalent rainfall depth, which has the advantage of simplicity and is easy to calculate. However, the equivalent rainfall depth of the storage volume is also affected by factors such as total rainfall depth, rain type, land surface type, and the sub-catchment area [18]. As a result, the storage volume calculated by an empirical formula cannot meet the actual demand in general [19]. Moreover, it is not easy to find the problems in design and operation of the storage tank, and it is difficult to provide references for subsequent projects without simulating them through models [20]. At the same time, large-scale storage tanks also need to face vital problems such as the treatment of storage sewage and the change of the function of the storage tank after the corresponding sewer system change from CSS to SSS.
The study is based on an actual system and the name is removed for confidentiality. In order to protect the water quality of the RWB, W city has built a large-scale storage tank at the CSO outfall. The storage tank is used for CSO control in the short term and for stormwater runoff pollution control in the long term. In the current CSS, the storage tank is used to collect the combined sewage that exceeds the conveying capacity of the sewer system and the treatment capacity of the WWTP during the rainfall, and the storage sewage is conveyed to the WWTP for treatment after rainfall. Similarly, when the sewer system is converted to SSS in the future, the storage tank will be used to collect stormwater runoff with a high concentration of pollutants during early periods of rainfall, and the storage runoff is also conveyed to WWTP after rainfall. However, the actual operation effect of the storage tank is not good; the control effect for water quantity and pollutants has not reached the set expectations.
This research presents the design structure and operation status of the large-scale storage tank, analyzes the problems existing in the design scheme and actual operation process, and discusses the problems that led to the unsatisfactory pollutant reduction effect of the storage tank. A storm water management model (SWMM) model was constructed to simulate the CSO control effect under the current conditions and the runoff control effect after the storage tank is used as stormwater storage in the future. In addition, the runoff pollution control effect of centralized storage and decentralized storage in the SSS was also compared. The results show that in order to fully achieve the designed capacity of the large-scale storage tank, it is necessary to formulate the storage water treatment scheme, enhance the WWTP’s treatment capacity, or construct other treatment facilities to match the storage capacity. The objective of this article is to provide a reference for the design and operation management of the large-scale storage tank, ensuring efficient operation of the storage tank and the control of more pollutants.

2. Materials and Methods
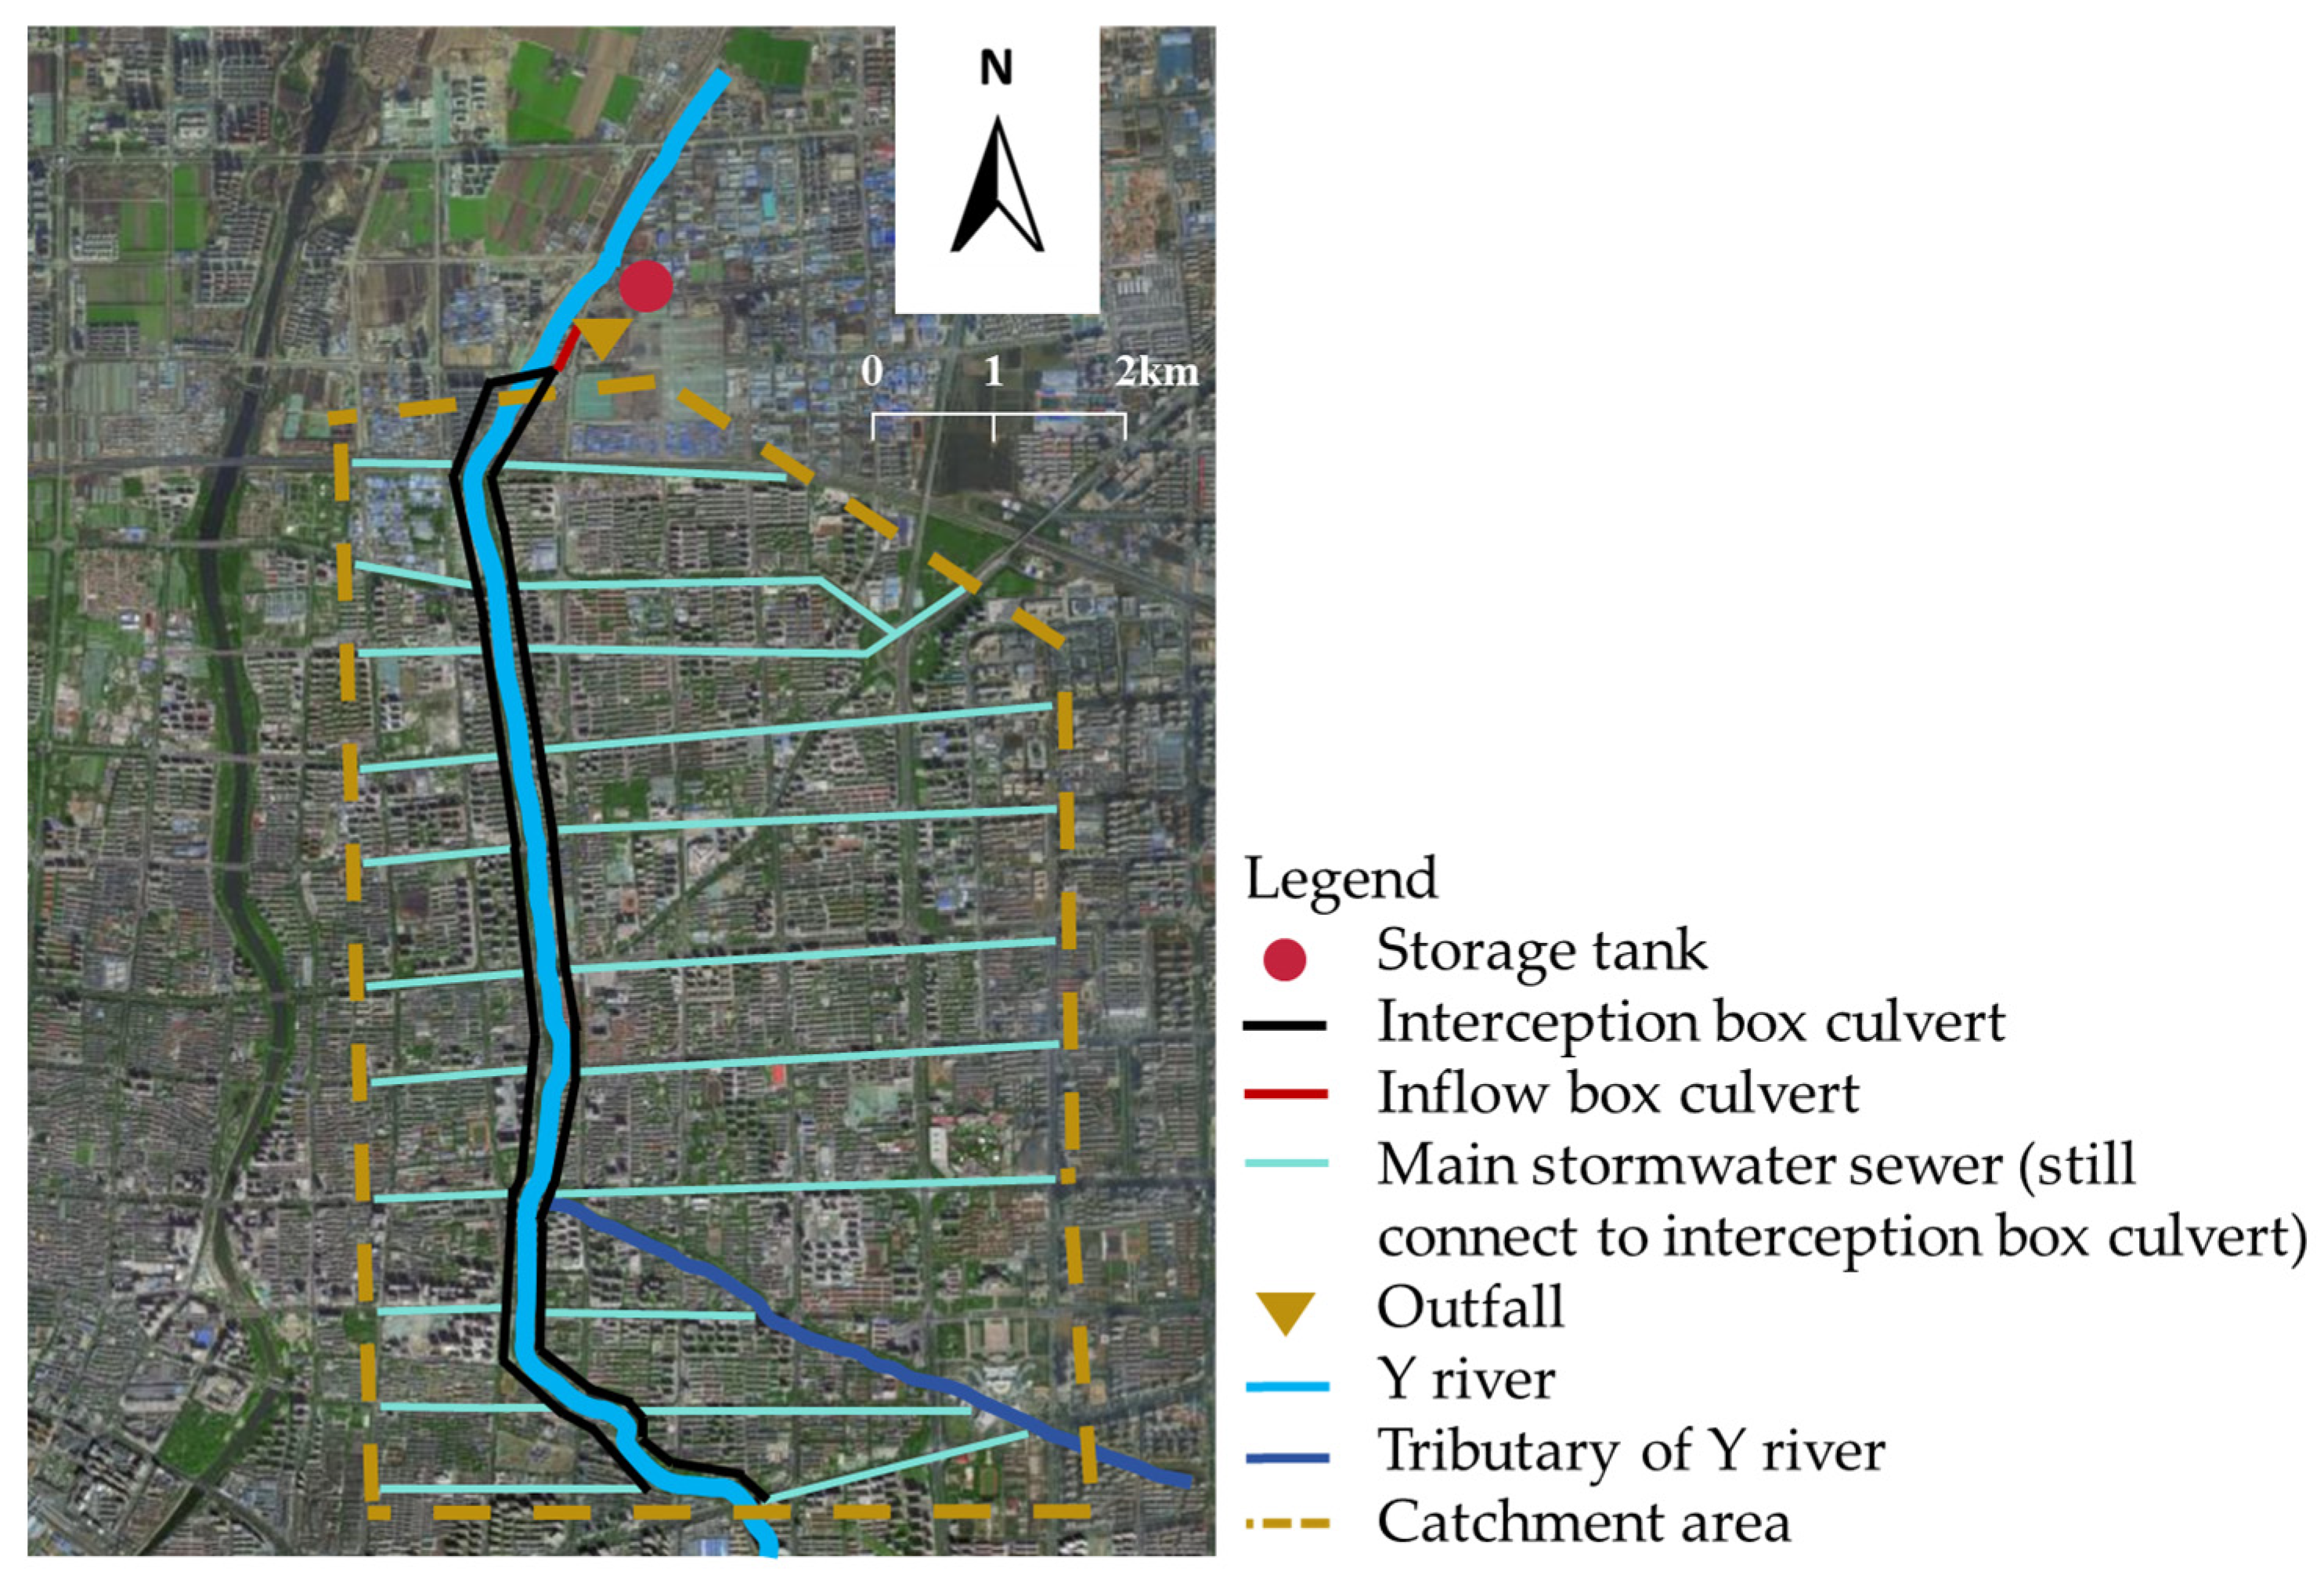
2.1. Study Area

W city is located in a border zone between inland and coastal areas. June to September is the rainy season, and frequent rainfalls cause serious CSO problems. The Y river is one of the main water systems in the city, and it plays an important role in flood prevention and landscaping. As shown in Figure 1, the study area is located in the Y river basin. Most of the area is residential land, while a small percentage of land use is industrial, green and commercial. The overall terrain is high in the south and low in the north, with an average gradient of 0.1%~0.2%. The sewer system in the study area basically comprises SSS, but there are still some combined sewers in a few districts. In addition, the stormwater sewer and sanitary sewer in the study area are all connected to the interception box culverts on both sides of the Y river. In general, the sewer system in the study area shows the characteristics of the intercepting CSS, and it has been operating in this mode for many years. Because there is no overflow outfall in the upper and middle reaches of the interception box culvert, the overflow sewage is all discharged centrally by the only outfall in the lower reaches of the box culvert during the CSOs. In order to protect the water quality of the Y river, W city has built a large-scale storage tank of 220,000 m3 at the overflow outfall in 2019.

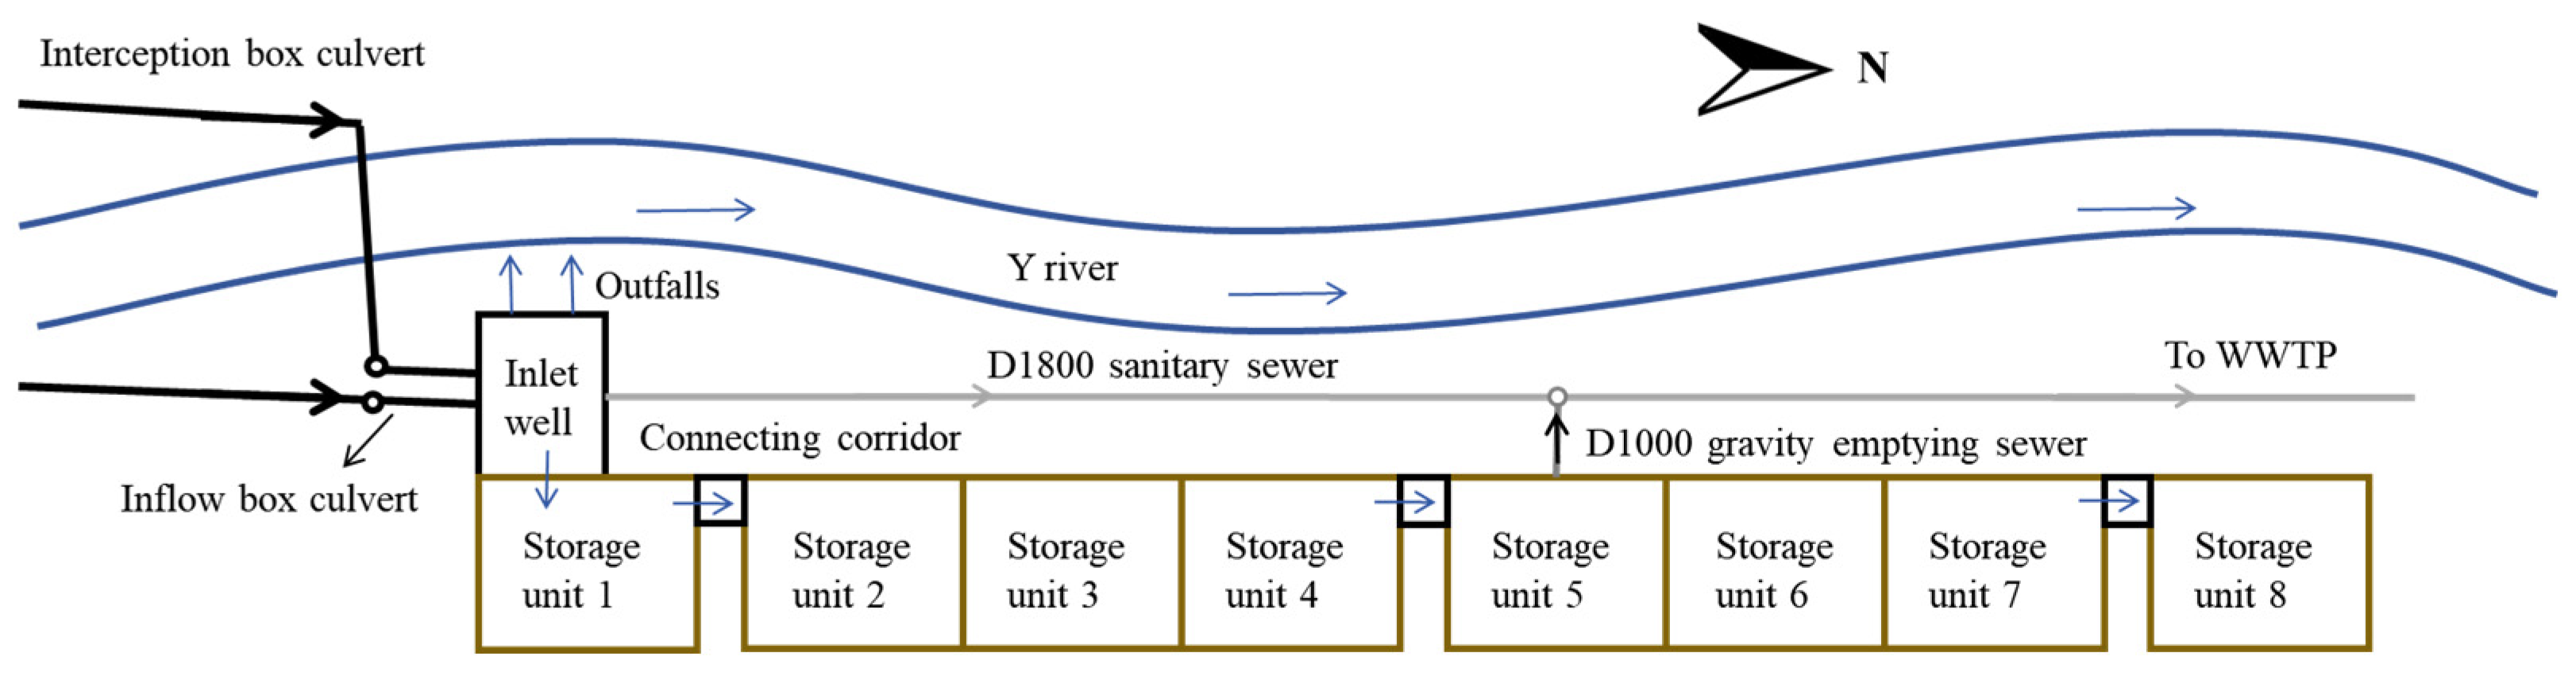
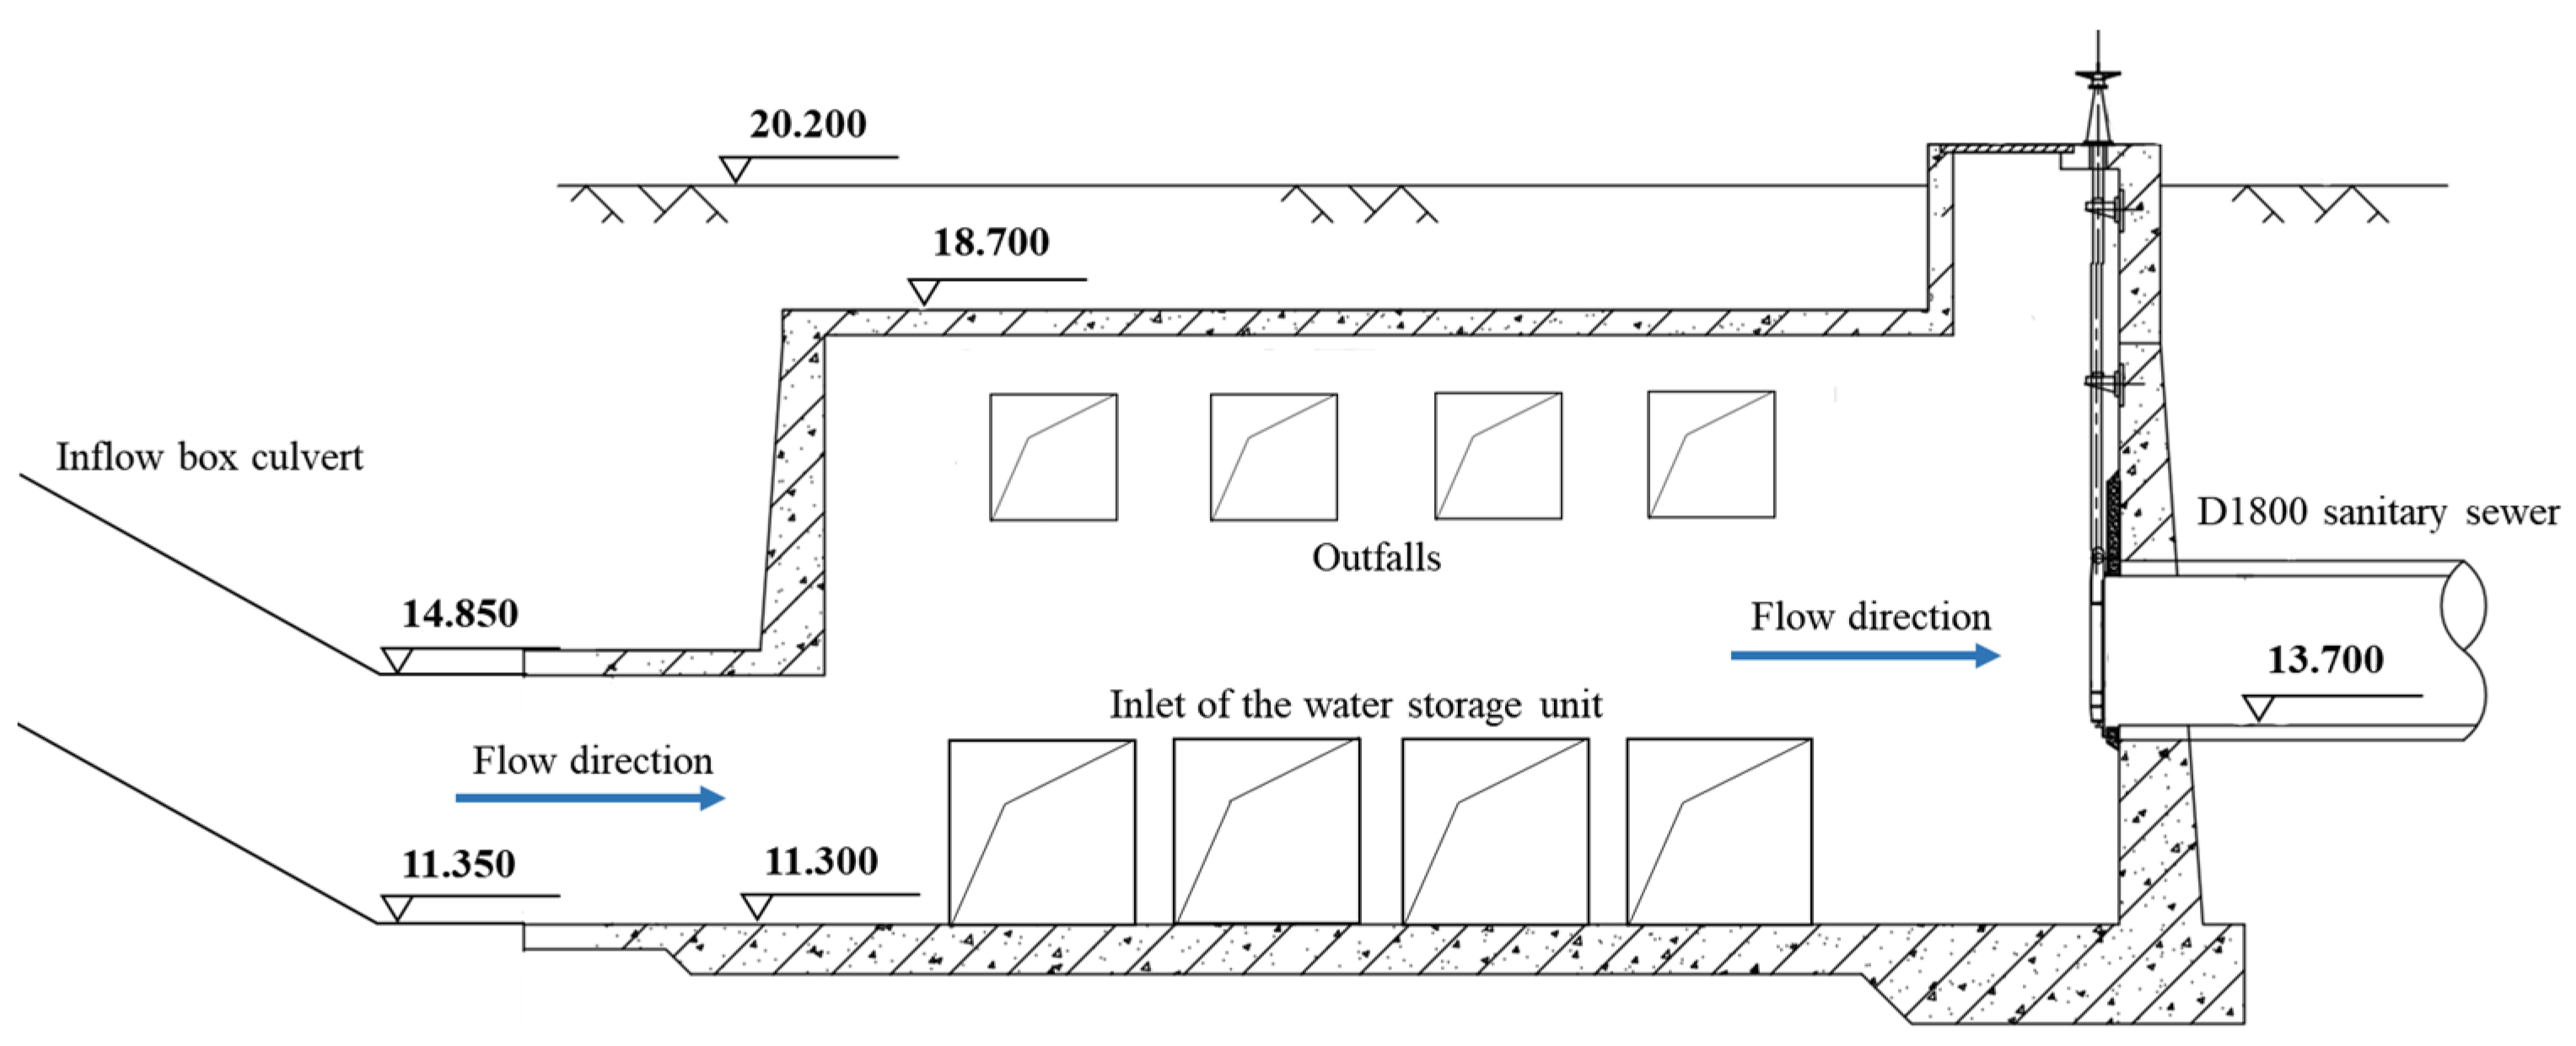
2.2. Storage Tank Description

As W city is carrying out a CSS separation project and plans to complete it in the coming years, the designer did not calculate the storage volume according to the CSO storage tank design formula when designing the large-scale storage tank, but took into account the CSS separation project; therefore, they designed the storage volume according to the design formula of the stormwater storage tank. The storage tank was planned to be used in the near term for CSO pollution control and in the long term for stormwater runoff pollution control, after the sewer system is transformed to SSS. The designer determined the effective volume of the storage tank by the criterion of the stormwater storage tank and calculates it by the following rainfall estimation formula [21]:
V = 10 D F Ψ β
where V (m3) is the total volume of the storage tank, calculated to be 220,000 m3; D (mm) is the designed rain depth of storage per unit area, designed with 8 mm; F (hm2) is the area of the catchment, designed with 5000 hm2; Ψ (-) is the runoff coefficient, designed with 0.5; β (-) is the safety coefficient, designed with 1.1. The formula determines the volume of the storage tank based on the runoff coefficient of the catchment surface, the catchment area, and the designed rainfall depth.
As shown in Figure 2, the large-scale storage tank is an underground rectangular structure, constructed with concrete and is approximately 996 m long and 30 m wide. The whole storage tank consists of 1 water inlet well with 8 water storage units in a series. The sewage inflows into the inlet well by two holes of 3.5 m × 3 m in a box culvert upstream of the south side, and the inlet well is connected to a D1800 (diameter 1800 mm) sanitary sewer with a gate downstream of the north side. The dry weather sanitary and some combined sewage during rainfall is conveyed to the wastewater treatment plant (WWTP) at the north side via the sanitary sewer. The length of a single water storage unit is 77.4~119.4 m, including a sediment flushing tank and gate flushing system, flushing corridor, precipitation groove and emptying pumping station. Water storage unit 5 is additionally equipped a D1000 gravity emptying sewer with a gate, which is connected to a D1800 sanitary sewer. Water storage units are connected through three connecting corridors, and the inlet is located in front of the first water storage unit. The inlet well is equipped with four outfalls with gates.
The storage tank is filled by gravity, and the water inflows through the inlet well into the 1–8 storage unit in turn. The bottom elevation of the storage unit is 7.50–8.00 m, the highest storage water-level elevation is 17.20 m (based on relative elevation, the maximum water depth in the storage tank is 9.7 m), and the overflow elevation between the storage units is 11.75 m. After the rainfall ends and the water level in the D1800 sanitary sewer drops to 14.90 m, the operator starts pumps in each storage unit to empty the tank. The design water outflow rate is 80,000 m3/d. The storage tank is controlled by a programmable logic controller (PLC). When the flow meter in the inflow box culvert detects that the flow rate reaches the threshold (2.78 m3/s), the gate in front of the water storage unit will be opened and the combined sewage begins to inflow into the storage tank.

2.3. Data Collection

The rainfall depth data were recorded from two rain gauges in the study area. The accuracy of the rain gauge was 0.2 mm, and the range of effective rainfall intensity was 0~4 mm/min. Data from 23 rainfall events in 2022 were collected and 12 of those rainfall events were used in the model simulation. The parameters of 12 rainfall events are shown in Table 1.
The water-quality data used for model calibration and discussion were provided by a testing institution entrusted by the government.

2.4. Catchment Model Based on the SWMM

A SWMM model was constructed to simulate different operational scenarios of the sewer system and storage tank in the study area. The version of the SWMM model is 5.2.1. The model specifies the physical parameters of the catchment, the sewer and storage tank. The model simulation included water-quantity simulation and water-quality simulation, in which the chemical oxygen demand (COD), the suspended solids (SS) and total nitrogen (TN) were selected to simulate water-quality variation.

2.4.1. Basic Parameters of SWMM

Based on the site planning and sewer system data of W city, the ArcGIS system was used to divide the sub-catchments with the aid of the Thiessen polygon method and calculate the imperviousness rate of each sub-catchment in the study area [22,23]. Then the model was manually adjusted according to the current stormwater sewer and interception box culvert drainage orientations. The fixed physical parameters of the model were extracted from ArcGIS (version 10.4), drawings, and an onsite survey. The other parameters which could not be directly measured were assigned initially through references, and adjusted by calibration with the real monitored data. Through model generalization, the whole study area was divided into 3811 sub-catchments, 4229 nodes, and 4259 conduits. Stormwater runoff in each sub-catchment area was assumed to flow into the node. The imperviousness coefficients of the sub-catchments ranged from 0.24 to 0.89.
It is worth emphasizing that before the 2022 rainy season, W city had already completed the CSS separation project in some areas and constructed some new stormwater outfalls, which means that some stormwater sewers were no longer connected to the interception box culvert. This resulted in a reduction in the catchment area of the tank from 5000 ha as designed to 3500 ha. In order to simulate a more realistic operation of the storage tank, the simulation was performed according to the current catchment area, rather than as designed.

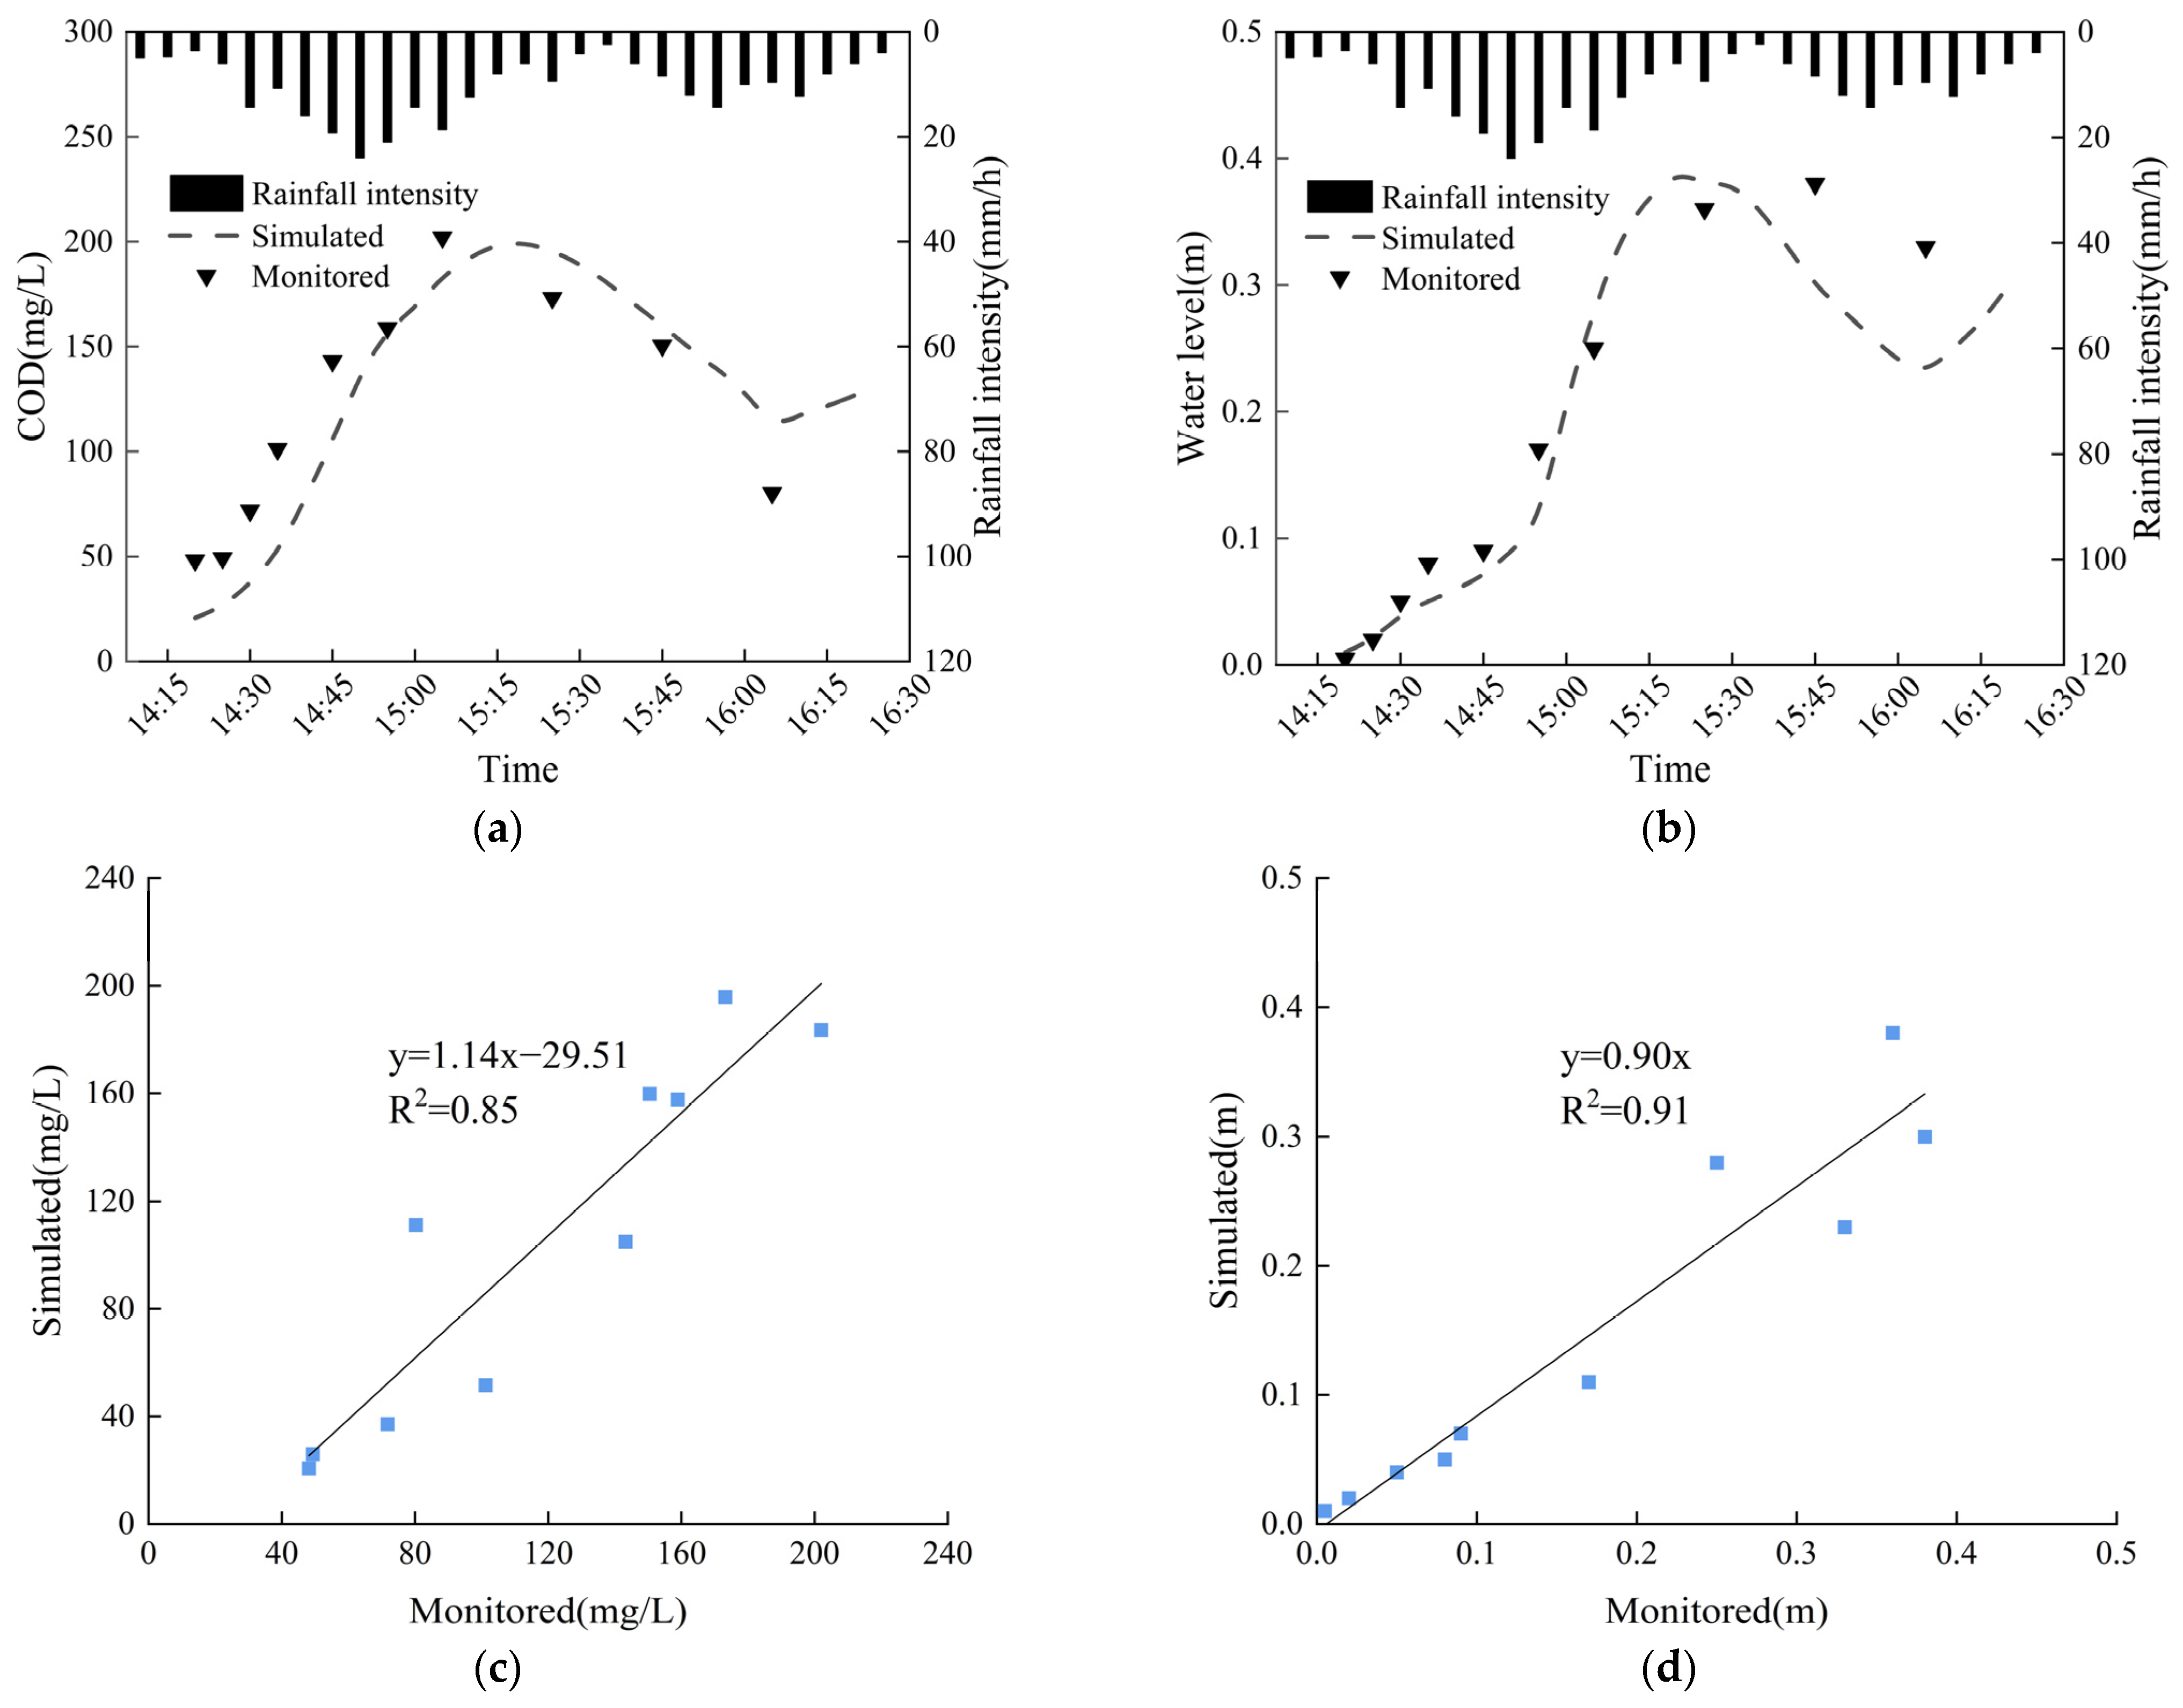
2.4.2. Model Pollutant Parameters Options, Calibration and Validation

A stormwater sewer outfall located in a tributary to the Y river was selected to calibrate and validate the model. Two rainfall events on 28 July and 14 September 2022 were used to model the water-quantity and water-quality calibration. The water-quantity model used the outfall water level as the analytical index and the water-quality model used pollutant concentration as the analytical index. The rainfall event on 19 August 2022 was used to validate the model and the correlation coefficient (R2) was used to assess the reliability of the model [24]. As shown in Figure 3a, although the monitored value is slightly higher than the simulated value in the early period, the R2 between the monitored value and the simulated value is 0.85 (Figure 3c), which indicates that the model can simulate the water quality. As shown in Figure 3b, the monitored values of the water level are closer to the simulated values; the R2 between the two is 0.91 (Figure 3d), which means that the model can better simulate water quantity [25]. Through the same method, the R2 between the monitored values and the simulated values of SS and TN are 0.87 and 0.93, respectively.
The values of the main pollutant parameters of the model after rate calibration are shown in Table 2.

2.4.3. Storage Tank Options

In the simulation of the CSS, the storage tank was set at the end of the interception box culvert. In this scenario, the storage tank was used to simulate the control effect of the CSO volume and pollutant load. The shape of the storage tank was set to cubical, with the depth and the bottom area set to 9.7 m and 22,680 m2, respectively, (the total storage volume was 220,000 m3). According to the actual inflow pattern (when the flow rate in the interception box culvert is greater than 2.78 m3/s, the combined sewage begins to inflow), an orifice was set up between the storage tank and the inlet well in the SWMM model. The opening and closing of the orifice were controlled by the “Control Rules” setting; the orifice setting value of 1 indicates that the orifice is open, and only then can sewage flow through it. On the contrary, if the orifice is set to 0, sewage will not flow through it. It is assumed that the orifice can only be fully opened or fully closed, so the inflow efficiency is 100% once the water starts inflowing. The specific control rules are as follows:
  • RULE R1A
  • IF CONDUIT 1 FLOW > 2.78
  • AND NODE STORAGEUNIT DEPTH < 9.7
  • THEN ORIFICE 1 SETTING = 1
  • RULE R1B
  • IF CONDUIT 1 FLOW < 2.78
  • OR NODE STORAGEUNIT DEPTH > 9.7
  • THEN ORIFICE 1 SETTING = 0
In the simulation of the SSS, the parameter of the storage tank remained unchanged, but the control rules were not set, meaning that the stormwater runoff flows into the storage tank automatically. In this scenario, the storage tank was used to simulate the control effect of stormwater runoff volume and pollutant load. At the same time, the storage tank was assumed to be emptied according to the designed discharge rate.
In the simulation of decentralized storage in SSS, 33 storage tanks were set at the end of each stormwater sewer, which was connected to the interception box culvert, with a single storage volume ranging from 1000 to 18,000 m3. The volume of the single storage tank was calculated according to Formula (1). In this scenario, storage tanks were used to simulate the control effect of the stormwater runoff pollutant load, so as to compare the control effect of centralized storage and decentralized storage.

3. Results and Discussion

3.1. Storage Tank Design Issues

Although the large-scale storage tank is a better solution to the problem of CSO pollution control in the current, there are still some design deficiencies.
First, compared with the inflow box culvert and the downstream D1800 sewage sewer, the inlet well of the storage tank is an inverted siphon section. Moreover, the slope of the upstream box culvert is large, and the inlet well is at the end of the inflow section, which is prone to becoming a silt accumulation point during dry weather sanitary flow.
Based on the monitoring data of the interception box culvert and inlet well, the concentration of COD and SS over time during the dry day are shown in Figure 4. Dry weather effluent was monitored at 2 h intervals, and it should be emphasized that the effluent samples were from the lower layers of the interception box culvert and inlet well. Figure 4a shows that COD concentrations in the inlet well are slightly higher than in the interception box culvert at most times of the day, at an average of 15 mg/L higher, and the magnitude of change over time is significant. The COD concentration in the inlet well is higher than that in the interception box culvert during the day, except for the periods from 18:00 to 20:00 and 14:00, and the difference is the largest—40 mg/L—at 22:00. At that time, the COD concentration in the inlet well was 266 mg/L, and that in the interception box culvert was 226 mg/L. The reason for the variation in COD concentrations over time is the water use habits of residents, where COD concentrations in the interception box culvert and inlet well are elevated in the morning and evening and decrease at midnight. COD concentrations in the inlet well were lower than in the interception box culvert at 18:00–20:00 and at 14:00, which may be due to sampling errors.
As shown in Figure 4b, the SS concentration in the inlet well is much higher—1.7~3.5 times higher—than that in the interception box culvert. The SS concentration in the interception box culvert changes significantly over time, and the rule of variation is close to that of the COD concentration, while the SS concentration in the inlet well is essentially unchanged over time, stabilizing in the range of 324~387 mg/L. The maximum difference in SS concentrations between the inlet well and the interception box culvert occurred at 4:00; at this time, the SS concentration in the inlet well was 356 mg/L, while the SS concentration in the interception box culvert was only 98 mg/L.
As shown in Figure 5, the reason for the high concentration of SS pollutants in the inlet well may be due to the low elevation relative to the inflow box culvert and the downstream D1800 sewage sewer, resulting in the inlet well becoming an inverted siphon structure. On dry days, the water level in the inlet well is usually not high, and after the sanitary sewage enters the inlet well through the inflow box culvert, the upper sewage flows into the D1800 sanitary sewer, while the sewage remaining in the lower part of the inlet well cannot flows into this sewer. Over time, large amounts of SS and debris will be deposited in the inlet well. However, the inlet of the storage tank is located under the inlet well, which happens to be in the most serious deposition area. When the inflow of the storage tank begins, the stored water under the inlet well will first enter the storage tank. As a result, there are some undesirable conditions that can arise from the operation of the storage tank. On the one hand, due to the elevation of the bottom of the storage tank being much lower than the inlet well, when the water inflow begins, the floating debris and the bottom sediment in this inverted siphon section will flush into the tank, resulting in the transfer of garbage and sediment to the front water storage unit, leading to increased difficulties in cleaning up. This may not only affect the efficiency of water inflow and subsequent treatment of water quality, but also affect the operation of the grid, flushing equipment, pumps, and other equipment. On the other hand, garbage and sediments in the inlet well will be rapidly discharged into the river during overflow, causing more serious environmental pollution of the RWB [26].

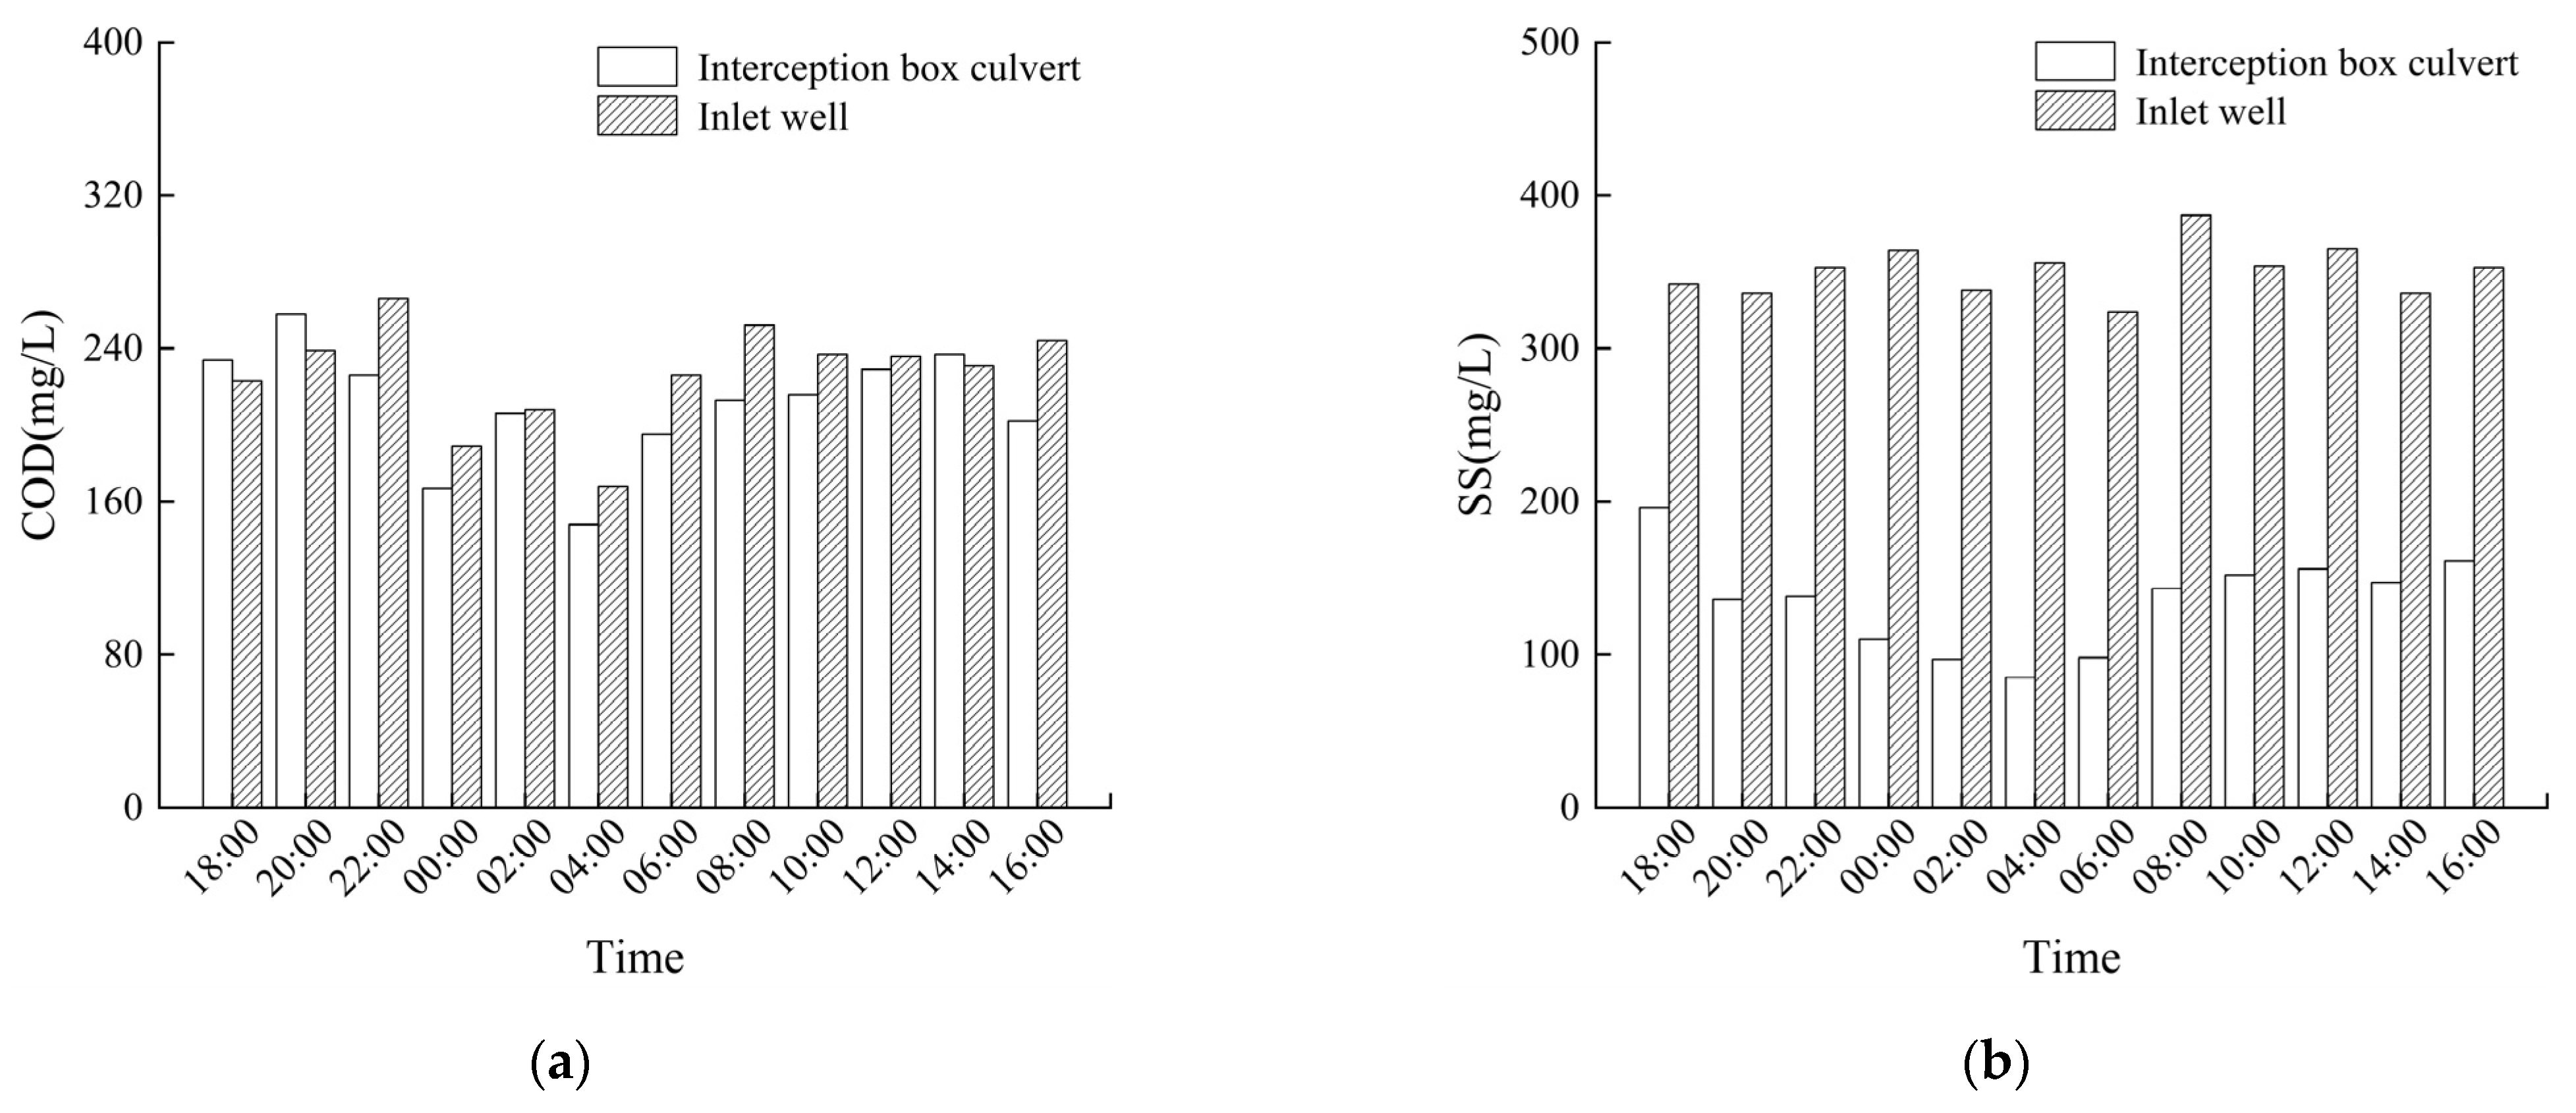
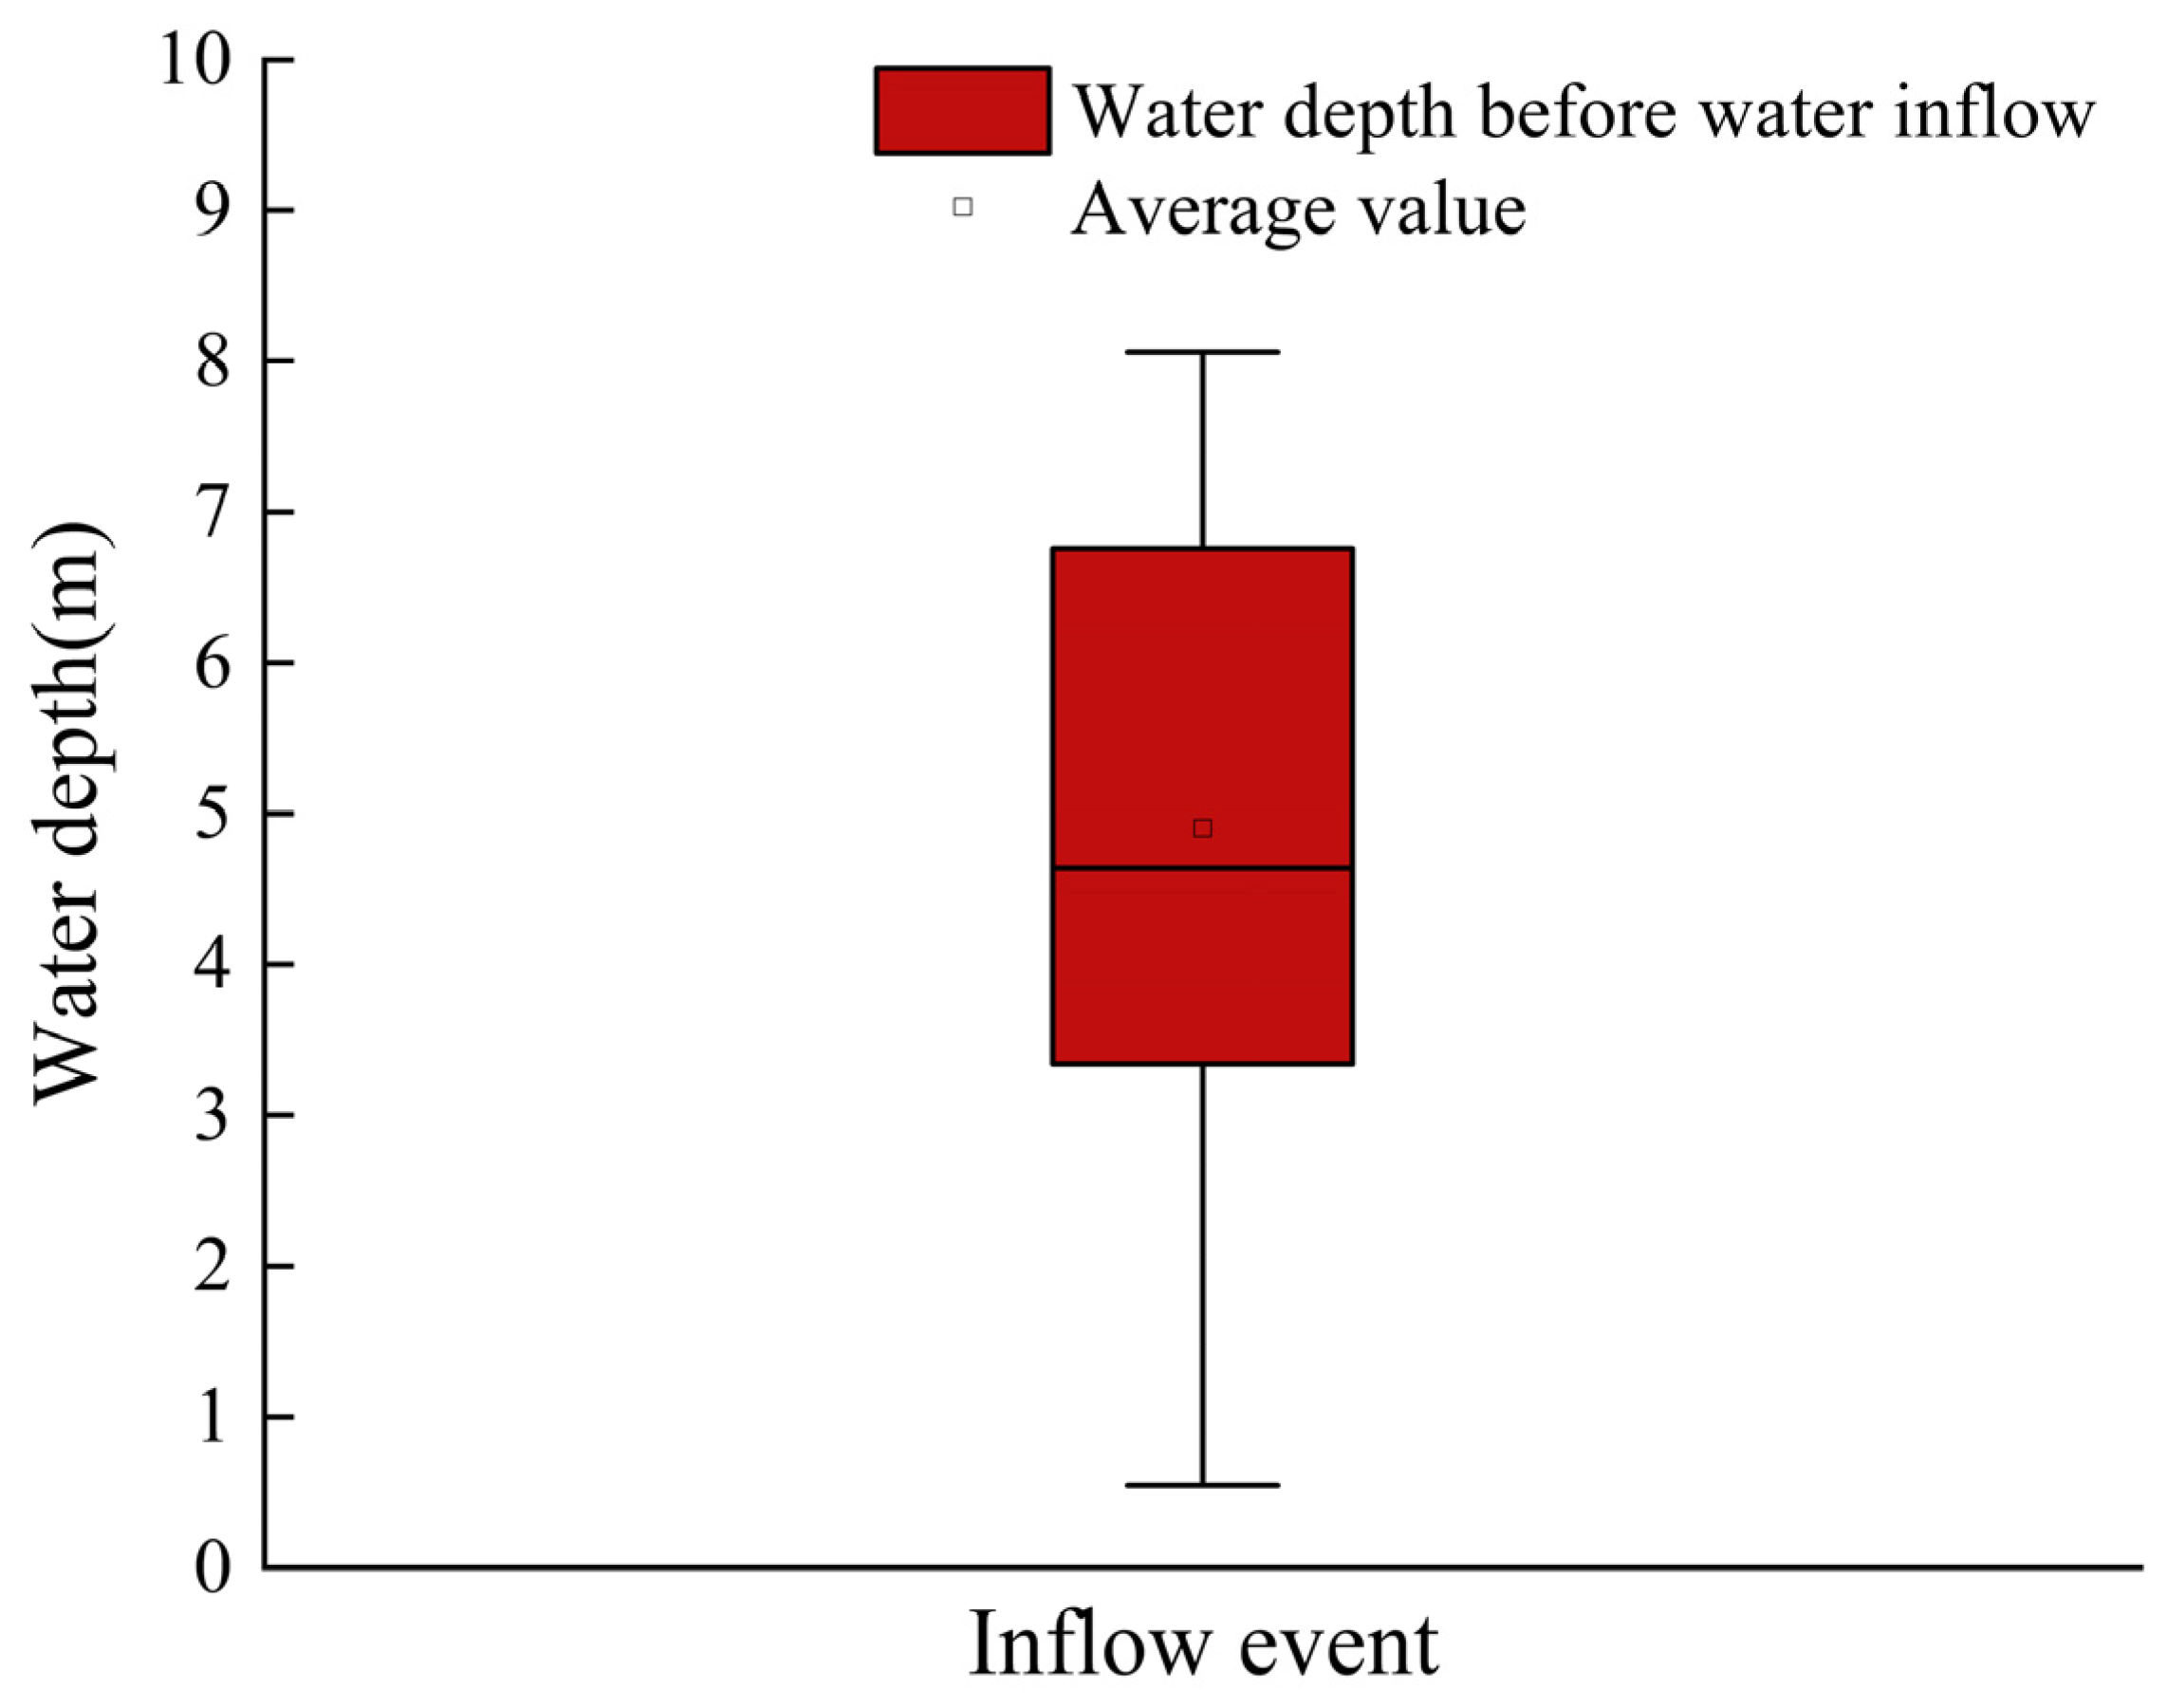
3.2. Storage Tank Operation Issues

The large-scale storage tank started operation in April 2020. With a total combined sewage storage volume of about 4.94 million m3, the tank plays an important role in the protection of RWB water quality, but there are still some challenges in its operation.
The storage tank was operated 55 times from 2020 to 2022, with a maximum inflow volume of 186,800 m3, a minimum inflow volume of 17,200 m3, and an average inflow volume of 89,800 m3, which is less than one-half of the designed situation. As shown in Figure 6, according to the water-level recording data from the storage unit 8, the lowest water depth in the tank before the water inflow is 0.55 m, the highest water depth is 8.06 m, and the average water depth is 4.9 m, which leads to the actual water inflow depth being less than half of the design depth of the tank. The actual operation of the storage tank does not meet the ideal conditions as designed, with high water-depth operation being the norm. The tank fails to perform its function efficiently and controls only a portion of the combined sewage. In the rainy season when rainfall is more frequent, the storage sewage cannot be emptied in time, affecting the subsequent water inflow, and greatly reducing the operational efficiency of the storage tank.
Two reasons may cause the storage tank to not be emptied properly. First, the combined sewage is allowed to be discharged to the WWTP when the water level of the downstream sanitary sewer drops to 14.9 m. However, the interception box culvert takes up most of the daily sanitary sewage conveyed to the catchment area, making the water level at the end of the box culvert and in the D1800 sanitary sewer usually high. Therefore, it is more difficult for the storage tank to meet the emptying conditions during the rainy season when rainfall intervals are shorter.
In addition, as shown in Table 3, the construction of WWTPs in W city took place at an earlier date, and the design capacities are lower, with most of them are operating at high loads or even overload; the same is true for WWTP A and C, which are responsible for the treatment of the combined sewage in the tank. In this case, the WWTP could not afford to treat tens of thousands of tons of sewage in the tank during more frequent rainfalls, which causes water to be stored for long periods of time. If the storage water reaches a maximum volume of 220,000 m3, it will take 4 days to treat all the combined sewage in the tank, even if the daily treatment capacity of WWTP A and C is at its minimum. When the daily treatment capacity of the two WWTPs is the average, the treatment period takes more than 10 days, which largely extends the emptying time of the storage tank, which is the main reason why the storage tank operates at high water levels during the rainy season. As a result of the current situation of high-capacity operation of the WWTP, some of the sewage must be retained in the tank and slowly conveyed to the WWTP after rainfall, which makes it difficult to effectively empty the storage tank, causing the large difference with the designed discharge rate of 80,000 m3/d.

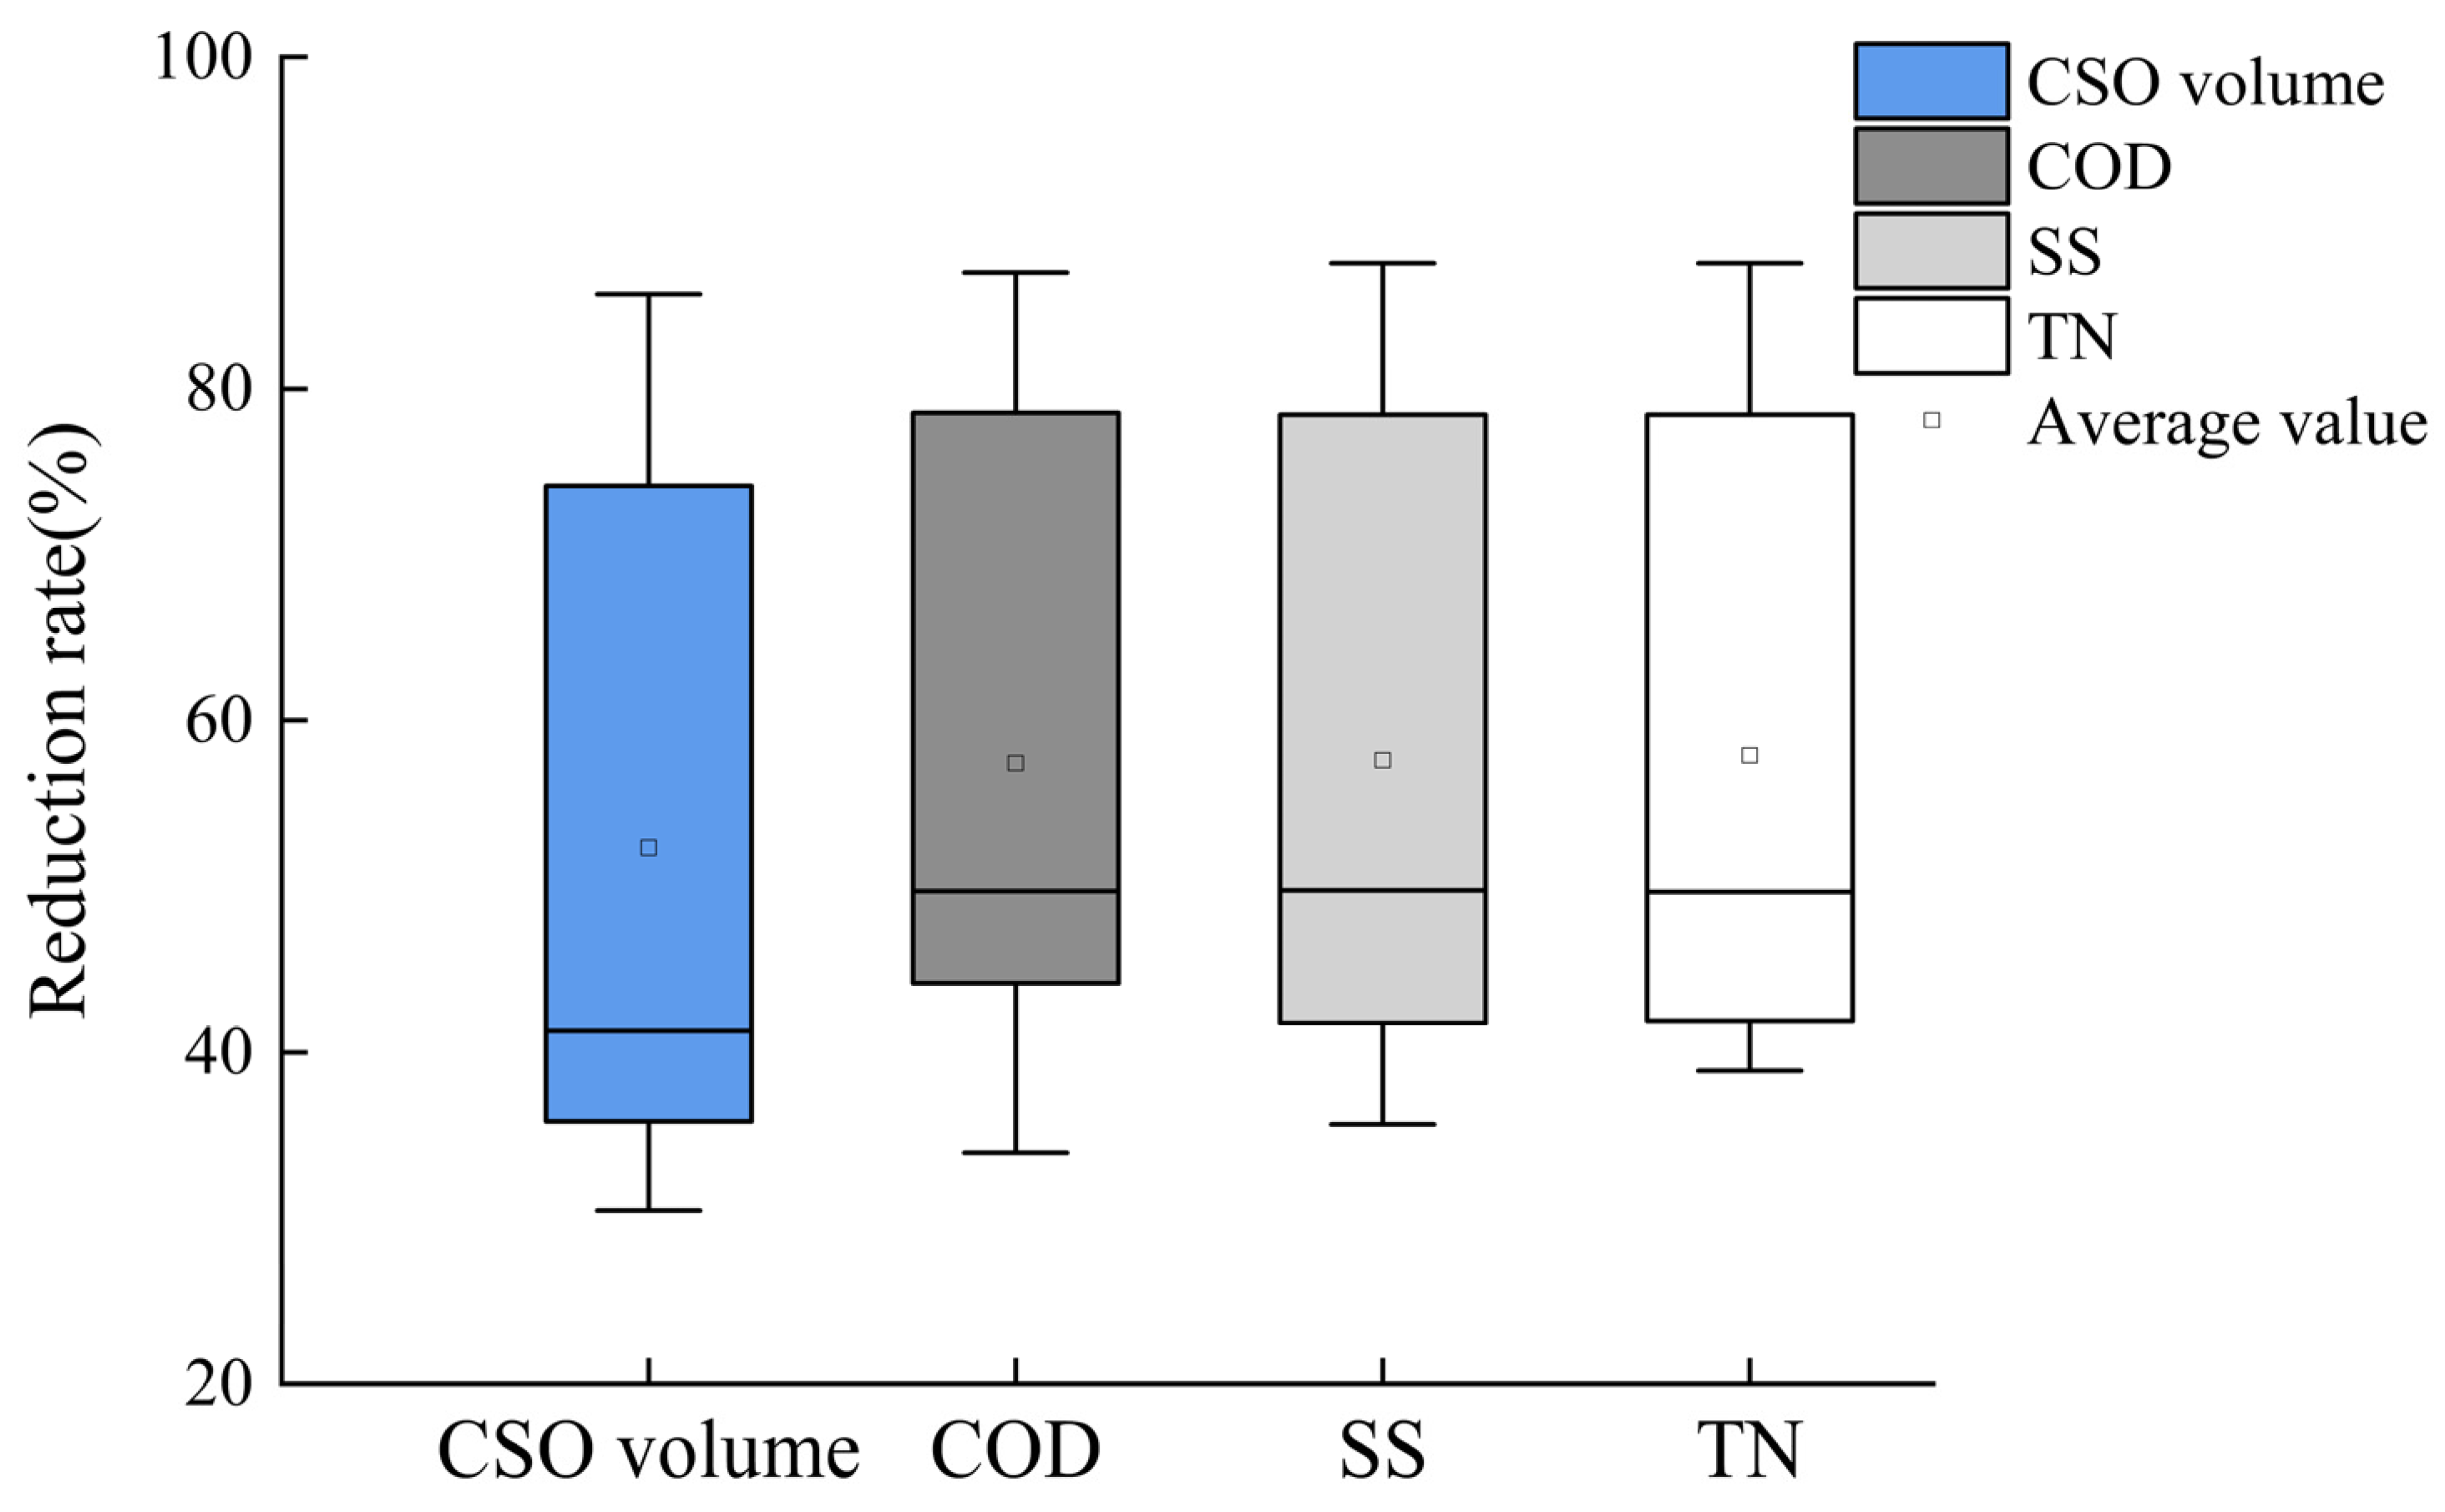
3.3. Effect of CSO Pollution Control in the Current

Although the water inflow of the storage tank is unsatisfactory, its pollutant reduction effect is still unknown. There is a lack of a sufficient scientific basis with which to evaluate the operation effect of the storage tank only by the amount of inflow volume. Therefore, 12 typical rainfalls (the water inflow volume > 30,000 m3 during the rainfall process) during the rainy season (from June to September) in 2022 were selected to simulate the total pollutant reductions of the storage tank through the SWMM model.
Practical pollutant reductions were simulated based on the practical water inflow record, and the designed pollutant reduction was simulated based on the designed storage volume of the storage tank, i.e., the maximum depth of water was 9.7 m, corresponding to the storage volume of 220,000 m3, and the discharge rate is 80,000 m3/d. The practical and designed reductions in the combined sewage volume and pollutant load by the storage tank for the rainy season in 2022 are shown in Table 4.
According to the actual operation records and simulation results, the designed storage volume of the storage tank during the rainy season of 2022 should be 8.90~22.00 × 10⁴ m3, but the practical storage volume was 3.20~18.68 × 10⁴ m3. The total design storage volume is 22.626 × 10⁵ m3, while the total practical storage volume is only 12.038 × 10⁵ m3, which is nearly half of the difference. The same gap is also reflected in the reduction in pollutants, the total design reduction of COD should be 450,020 kg, but the practical reduction is 274,490 kg; therefore, the practical reduction represents 60.97% of the design reduction. The design reduction in SS is 626,100 kg, while the practical reduction is 382,100 kg; therefore, the practical reduction represents 61.03% of the design reduction. The design reduction in TN should be 15,798 kg, but the practical reduction is only 9691 kg; therefore, the practical reduction represents 61.34% of the design reduction. From the perspective of the overall CSO control effect of the storage tank during the rainy season in 2022, the overall reduction of the CSO volume accounted for 53.49% of the design volume, and the total reduction in pollutants accounted for about 60% of the design value.
As shown in Figure 7, in the 12 operating events of the storage tank during the 2022 rainy season, compared with the designed situation, the minimum CSO volume reduction rate of the storage tank is only 30.46%, and the maximum reduction rate is 85.69%. The median of the CSO volume reduction rate is 43.67%; this means that for half of the 12 inflow events of the storage tank, the CSO volume reductions are less than 50% of the design volume. The highest practical reduction rate of COD is 87.58% and the lowest is only 33.95%, while the highest practical reduction rate of SS and TN is 87.58% and the lowest is 35.65% and 39.40%, respectively. The median pollutant reduction rates for the three pollutants are relatively close to each other, at about 50%. This indicates that under half of the operational scenarios during the 2022 rainy season, the practical pollutant control volume by the storage tank was only 50% of the design condition. The simulation results proves that the actual operation effect of the storage tank is unsatisfactory.
The reason why the practical storage volume and pollutant reduction of the storage tank did not meet the designed purpose is mainly because it could not be emptied according to the design water discharge rate, and water was stored in the tank for a long time during the rainy season when there were frequent rainfalls, which resulted in a reduction in its operational efficiency of nearly 50%. The reason for this unsatisfactory operation is that the designer did not take into account the treatment capacity of the WWTP that undertakes combined sewage treatment, which led to deficiencies in the “WWTP” part of the CSO pollution control process [27]. Due to the fact that there is no design for other treatment schemes, such as discharging the upper layer sewage to the RWB after sufficient precipitation or conveying storage water to other treatment facilities. Therefore, the storage sewage can only be conveyed to the WWTP, once the operating load of the WWTP is high, the sewage can only be stored in the storage tank.
Most of the CSS in various regions of China were put into operation in the last century, and generally did not consider building storage tanks to store overflow sewage when they were first designed. Hence the designed capacity of the downstream WWTP was only based on the amount of dry weather effluent and stormwater runoff corresponding to the interception ratio. The volume of combined sewage in the storage tank, which was constructed to reduce CSO pollution, places an additional treatment burden on the WWTP.
Therefore, when constructing storage tanks in CSS, especially large-scale centralized storage tanks, there is a need to avoid a single WWTP corresponding to the storage tank, and it is important to establish a match between the WWTP’s current treatment capacity and the designed storage volume.

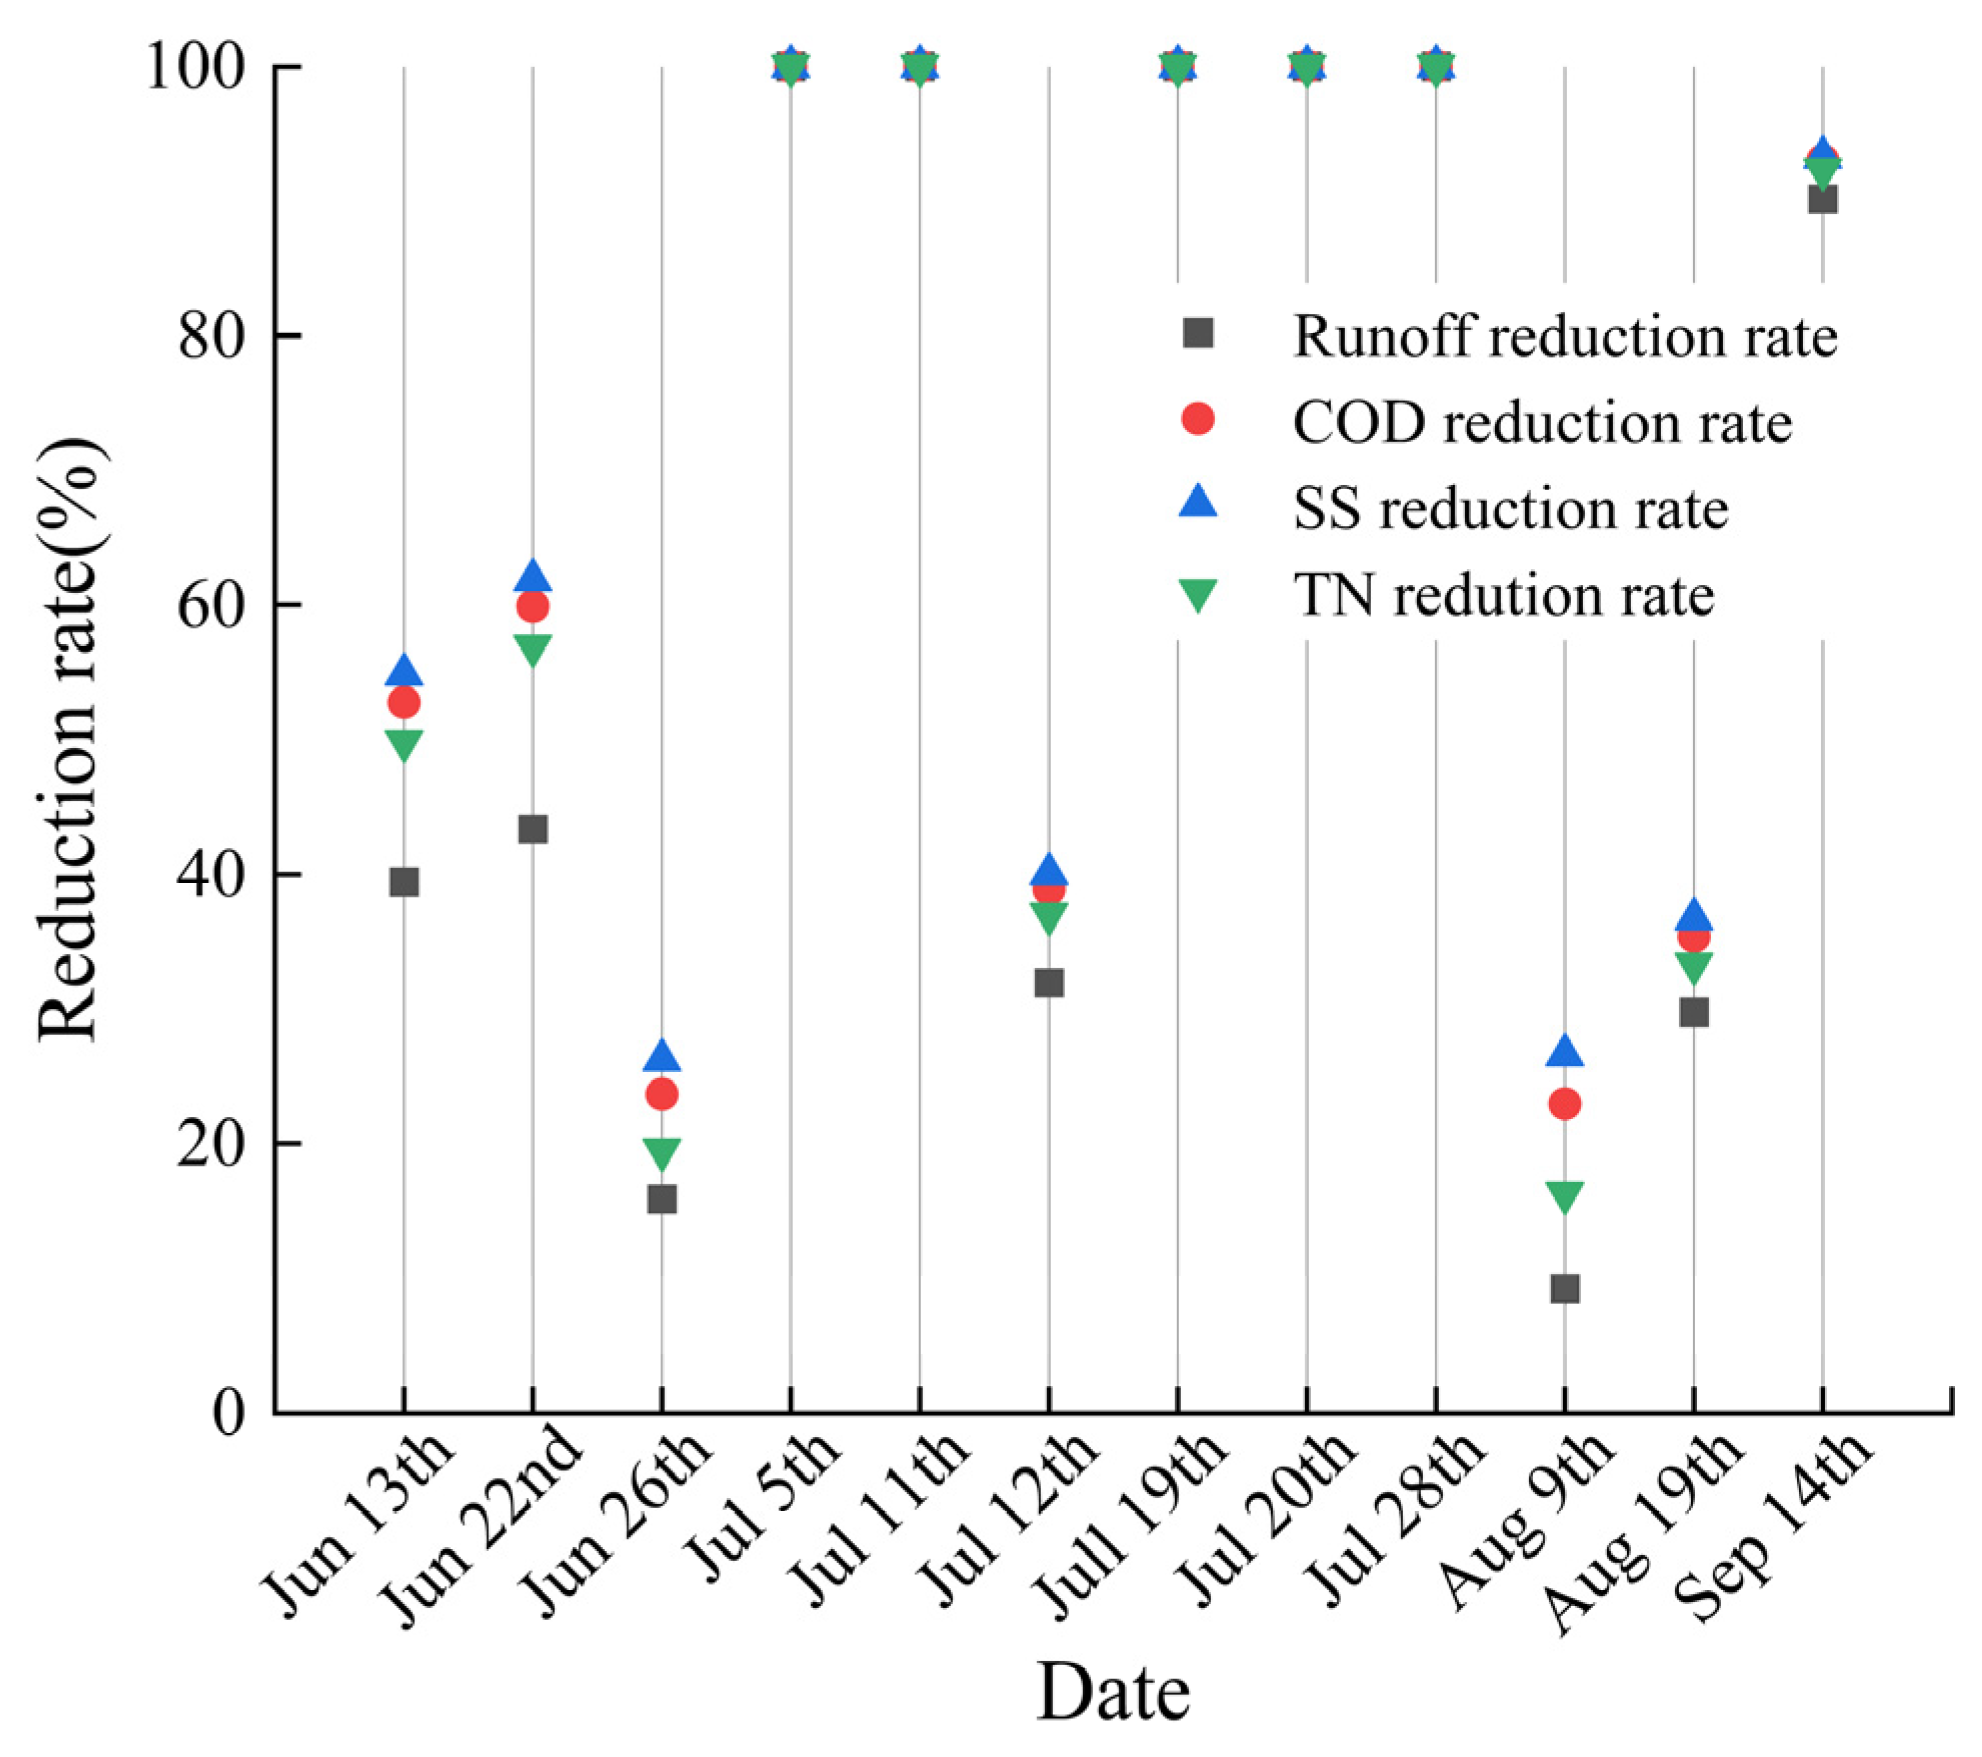
3.4. Runoff Control Effect of the Storage Tank

Based on the typical rainfall data in Section 3.3, the SWMM model was used to simulate the runoff volume and pollutant reduction effect of the storage tank after being used for stormwater storage. In this case, it was assumed that the original interception box culvert only served as the drainage channel of stormwater runoff and the sanitary sewage would not enter it, so that the inflow mode of the storage tank would not change. The total amount of storage volume and the discharge rate were unchanged in the simulation. It is important to emphasize that the simulation was based on the condition that the storage tank could be emptied in time (the storage tank is emptied at the rate of 80,000 m3/d, and no water is stored in the tank unless continuous rainfall occurs). The 2022 rainy season runoff and pollutant reductions from the storage tank are shown in Table 5.
According to the simulation results, if the storage tank is used as stormwater storage, it can totally reduce runoff volume by 2,054,900 m3 with a reduction rate of 30.02%; reduce COD by 288,264 kg with a reduction rate of 36.24%; reduce SS by 443,016 kg with a reduction rate of 39.01%; and reduce TN by 6332 kg with a reduction rate of 30.33% during the rainy season in 2022. During the five rainfall events, the storage tank can also ensure the complete storage of stormwater runoff. In general, if the storage tank is operated under ideal conditions, a single storage tank can exert a better stormwater control effect, so that the total runoff control rate in the study area can reach 30%.
As shown in Figure 8, the water inflow of the storage tank shows a slight first-flush effect during some specific rainfall events (the early inflow water is more contaminated than the later inflow water [28,29]). During the 22 June rainfall event, the runoff reduction rate from the storage tank was 43.37%, and COD, SS, and TN reductions rate reached 52.79%, 54.85%, and 49.87%, respectively. During the 9 August rainfall event, the runoff reduction rate from the storage tank was 9.22%, while the SS reduction rate reached 22.6%, and the COD and SS reduction rates were 22.99% and 16.34%, respectively. This demonstrates that the total amount of pollutants carried in the stormwater runoff was higher in the early period of rainfall; however, due to the large catchment area of the study area, this effect was not as significant as that of the smaller catchment area [30].
The simulation only shows the good effect of the storage tank on the reduction of runoff pollution under the design conditions and does not consider the important issue of emptying. Although the treatment of stormwater in the tank is more diverse than combined sewage, and there is a possibility to reuse storage stormwater, exploring a rational measure to treat more than 200,000 m3 of stormwater in the tank is still a pressing concern.

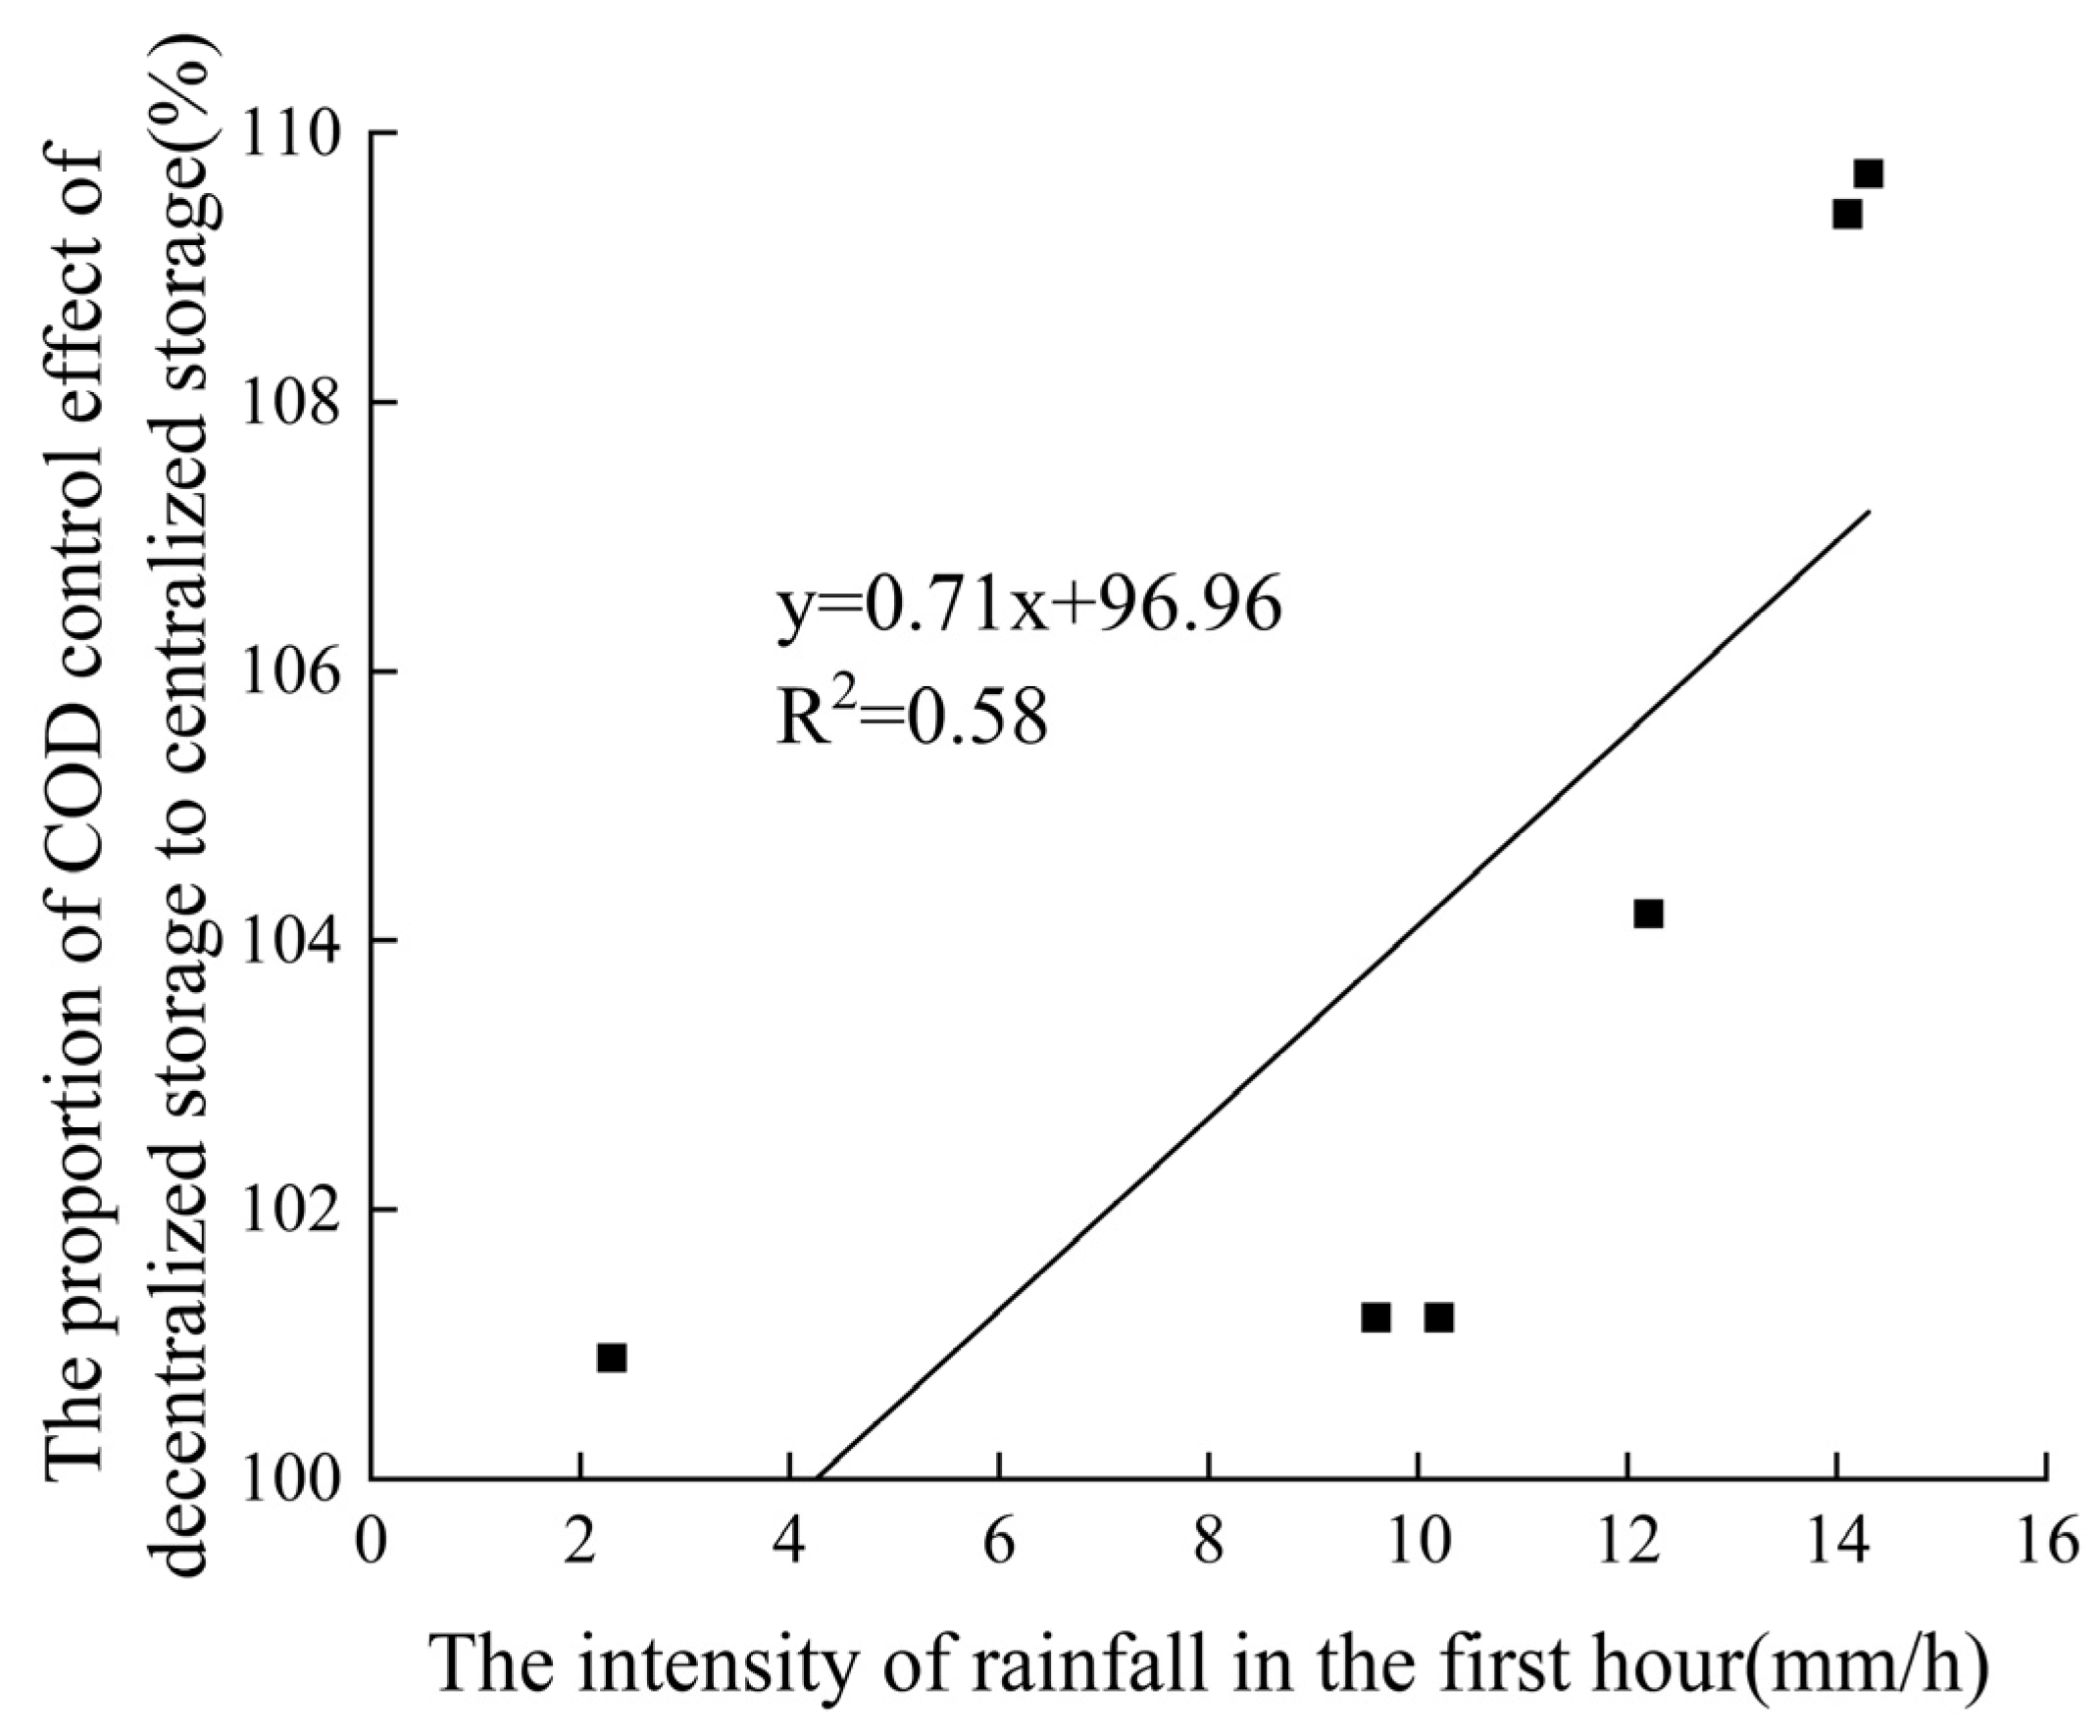
3.5. Effect of Decentralized Storage

The large-scale storage tank in W city was designed with the concept of stormwater control, combining two key issues of controlling the CSO pollution in the current and the change in the function of the tank after the CSS separation. However, the storage tank at the end of the sewer system is too centralized due to the wide catchment area. In order to compare the centralized storage and decentralized storage on the reduction effect of runoff pollution, 6 typical rainfall events were selected from the rainfall events in Section 3.3; the runoff pollutant reduction effect of decentralized storage and its proportion in relation to that of the centralized storage are shown in Table 6.
As shown in Table 6, during the rainfall on 26 June, the decentralized storage reduced, by 4059 kg of COD and 8554 kg of SS, more than the centralized storage, with the reduction rate in COD increased by 9.7% and SS increased by 11.2%. During the rainfall on 9 August, decentralized storage reduced, by 5429 kg of COD and 10,943 kg of SS, more than the centralized storage, with the reduction rate of COD increased by 9.4% and that of the SS increased by 11.6%. Although the antecedent dry days of these two rainfall events were not long, the intensity of rainfall in the first hour was strong, reaching 14.3 mm/h and 14.1 mm/h respectively, which may be the reason why the effect of decentralized storage was better than that of the centralized storage during these two rainfall events. In other rainfall events, although the intensity of rainfall in the first hour was different, the reduction effect of the decentralized storage was not inferior to that of the centralized storage. In general, decentralized storage was more effective in reducing runoff pollution, and this is the same conclusion that some previous studies have reached [31].
As shown in Figure 9, in the decentralized storage scenario, there is a correlation between the increase in the pollutant control effect and the intensity of rainfall in the first hour of rainfall, and the R2 between them is 0.58. This may indicate that the stronger the rainfall intensity in the early period, the better the effect of decentralized storage. Those rainfall events share a common point in that the scouring intensity of the pollutants was strong during the early period of rainfall, resulting in a large number of pollutants discharged with the runoff rapidly. Decentralized storage tanks at the source are suitable for storing this portion of the first flush of stormwater runoff. Whereas with the centralized storage end of the sewer system, such rainfall produces more runoff volume in a short period of time, and the runoff downstream of the catchment rapidly inflows to the storage tank. However, because of the wide catchment area, when the upstream initial stormwater runoff with higher pollutant concentrations is conveyed to the end of the sewer system, part of the space in the storage tank is occupied by the downstream “medium-term stormwater runoff” with gradually decreasing pollutant concentrations, resulting in the upstream initial stormwater runoff not being able to inflow to the tank. At this point, centralized storage is not as effective in reducing pollutants as the decentralized storage that better captures initial stormwater runoff with high pollutant concentrations. However, although there is a correlation between the increase in the pollutant control effect and the rainfall intensity in the first hour of rainfall, the R2 between them is less than 0.8. This shows that the correlation between the two is not very strong, and there may be other reasons for the improvement in the pollutant control effect of decentralized storage, such as the dry days before rainfall, the catchment area of the storage tank, and the type of land used.
In addition, the decentralized storage tanks are located at various locations in the city and the volume of a single tank is relatively small; therefore, the storage water treatment methods are more flexible and diversified. The storage water can be reused for green watering, road cleaning, and river replenishment according to the needs of the surrounding area after precipitation, filtration and disinfection [32]. On the contrary, to deal with the storage water in the centralized storage tank, due to the excessive storage volume, the scale of the corresponding treatment facilities needs to be greatly increased to ensure the emptying efficiency, resulting in increased treatment difficulty. If the treated stormwater is not used only for river replenishment on the spot, a large amount of equipment needs to be dispatched for water reuse, which in turn increases the cost of reuse. In general, decentralized storage has certain advantages over centralized storage.

4. Conclusions

In this research, the design scheme, actual operation conditions and model simulation results of a storage tank in W city were analyzed. The following conclusions were obtained:
(1) When the storage tank is used for CSO control, the downstream WWTP is unable to meet the storage water treatment demand due to its daily operation at high loads, resulting in a practical reduction in pollution at about only 60% of the designed reduction capability, leading to unsatisfactory operation of the storage tank;
(2) If the storage tank is used for stormwater runoff control in SSS and the emptying problem can be solved, the total runoff volume could be reduced by 30.02% in the rainy season of 2022. The reduction rate of COD, SS, and TN could be up to 36.24%, 39.01%, and 30.33%, respectively. This indicates that the storage tank has a better control effect on stormwater runoff. At the same time, due to the large catchment area of the storage tank, there is a first effect of the water inflow, but it is not significant;
(3) In the SSS, decentralized storage shows a stronger pollutant reduction effect compared to centralized storage, thus the reduction effect of COD and SS can be increased by up to 9.7% and 11.6%, respectively. In addition, the pollutant reduction effect of decentralized storage has a certain correlation with the previous rainfall intensity.
Based on the research findings, if there is a plan to build a large-scale storage tank, it is necessary to plan a treatment facility at a scale that can match the volume of the storage tank or enhance the treatment capacity of the corresponding WWTP to ensure the operational efficiency of the storage tank. Nonetheless, this study has certain limitations that should be addressed in future studies. Although the pollutant control effect of decentralized storage is better than that of centralized storage, other factors, such as cost implications and environmental impacts, were not considered. In future studies, multiple factors can be integrated to investigate whether the overall effect of decentralized storage is better.

Author Contributions

Data curation, C.Y.; methodology, C.Y.; writing—original draft preparation, J.L. and C.Y.; writing—review and editing, J.L. and C.Y.; modeling, C.Y.; supervision, J.L. All authors have read and agreed to the published version of the manuscript.

Funding

This research was funded by the National Natural Science Foundation of China, grant number 52070013, and the Project of Construction and Support for High-Level Innovative Teams of Beijing Municipal Institutions, grant number BPHR20220108.

Data Availability Statement

Data are contained within the article.

Conflicts of Interest

The authors declare no conflicts of interest.

References

  1. Li, T.; Zhang, W.; Feng, C.; Shen, J. Performance assessment of separate and combined sewer systems in metropolitan areas in southern China. Water. Sci. Technol. 2014, 69, 422–429. [Google Scholar] [CrossRef] [PubMed]
  2. Jia, N.; Sitzenfrei, R.; Rauch, W.; Liang, S.; Liu, Y. Effects of urban forms on separate drainage systems: A virtual city perspective. Water 2019, 11, 758. [Google Scholar] [CrossRef]
  3. Huang, D.; Liu, X.; Jiang, S.; Wang, H.; Wang, J.; Zhang, Y. Current state and future perspectives of sewer networks in urban China. Front. Environ. Sci. Eng. 2018, 12, 2. [Google Scholar] [CrossRef]
  4. Ning, Y.-F.; Dong, W.-Y.; Lin, L.-S.; Zhang, Q. Current research trend on urban sewerage system in China. IOP Conf. Ser. Earth Environ. Sci. 2017, 59, 012048. [Google Scholar] [CrossRef]
  5. Fu, X.; Goddard, H.; Wang, X.; Hopton, M. Development of a scenario-based stormwater management planning support system for reducing combined sewer overflows (CSOs). J. Environ. Manag. 2019, 236, 571–580. [Google Scholar] [CrossRef] [PubMed]
  6. Zhang, D.; Lindholm, G.; Ratnaweera, H. Use long short-term memory to enhance Internet of Things for combined sewer overflow monitoring. J. Hydrol. (Amst.) 2018, 556, 409–418. [Google Scholar] [CrossRef]
  7. Gong, Y.; Chen, Y.; Yu, L.; Li, J.; Pan, X.; Shen, Z.; Xu, X.; Qiu, Q. Effectiveness analysis of systematic combined sewer overflow control schemes in the sponge city pilot area of Beijing. Int. J. Environ. Res. Public Health 2019, 16, 1503. [Google Scholar] [CrossRef] [PubMed]
  8. Sabouri, F.; Gharabaghi, B.; Perera, N.; McBean, E. Evaluation of the thermal impact of stormwater management ponds. J. Water Manag. Model. 2013, 12, 221–233. [Google Scholar] [CrossRef]
  9. Romei, M.; Lucertini, M.; Esposito Renzoni, E.; Baldrighi, E.; Grilli, F.; Manini, E.; Marini, M.; Iagnemma, L. A detention reservoir reduced combined sewer overflows and bathing water contamination due to intense rainfall. Water 2021, 13, 3425. [Google Scholar] [CrossRef]
  10. Ferrario, C.; Tesauro, M.; Consonni, M.; Tanzi, E.; Galli, A.; Peruzzi, C.; Beltrame, L.; Maglionico, M.; Lavrnić, S.; Gandolfi, C. Impact of Combined Sewer Overflows on Water Quality of Rural Canals in Agro-Urban Environments. In Proceedings of the 18th Annual Meeting of the Asia Oceania Geosciences Society, Singapore, 1–6 August 2021. [Google Scholar]
  11. Soriano, L.; Rubió, J. Impacts of combined sewer overflows on surface water bodies. The case study of the Ebro River in Zaragoza city. J. Clean. Prod. 2019, 226, 1–5. [Google Scholar] [CrossRef]
  12. Stirrup, M.; Bonin, R.; Hudoba, J.; Parisotto, J.; Jacob, S. Planning, Design, Construction and Performance of the Royal Avenue CSO Storage Tank in Hamilton, Ontario. Proc. Water Environ. Fed. 2011, 2011, 45–70. [Google Scholar] [CrossRef]
  13. Fu, G.; Khu, S.-T.; Butler, D. Optimal distribution and control of storage tank to mitigate the impact of new developments on receiving water quality. J. Environ. Eng. 2010, 136, 335–342. [Google Scholar] [CrossRef]
  14. Field, R.; O’Connor, T. Optimization of CSO storage and treatment systems. J. Environ. Eng. 1997, 123, 269–274. [Google Scholar] [CrossRef]
  15. Zhang, P.; Cai, Y.; Wang, J. A simulation-based real-time control system for reducing urban runoff pollution through a stormwater storage tank. J. Clean. Prod. 2018, 183, 641–652. [Google Scholar] [CrossRef]
  16. Todeschini, S.; Papiri, S.; Ciaponi, C. Performance of stormwater detention tanks for urban drainage systems in northern Italy. J. Environ. Manag. 2012, 101, 33–45. [Google Scholar] [CrossRef] [PubMed]
  17. Martino, G.; De Paola, F.; Fontana, N.; Marini, G.; Ranucci, A. Pollution reduction in receivers: Storm-water tanks. J. Urban Plan. Dev. 2011, 137, 29–38. [Google Scholar] [CrossRef]
  18. Cheng, X.; Ling, Y.; Li, D.; You, X. Research on application of InfoWorksICM model in the design of combined overflow storage tank. Water Wastewater. Eng. 2019, 55, 64–67. [Google Scholar]
  19. Mantegazza, S.A.; Gallina, A.; Mambretti, S.; Lewis, C. Designing CSO storage tanks in Italy: A comparison between normative criteria and dynamic modelling methods. Urban Water J. 2010, 7, 211–216. [Google Scholar] [CrossRef]
  20. Stirrup, M.; Marchant, D. Simulation of a combined sewer overflow storage tank. J. Water Manag. Model. 2002, 208, 271–280. [Google Scholar] [CrossRef]
  21. Li, J.; Meng, G.; Che, W. On regulation, reservation and practical calculation in urban rainwater utilization. Water Wastewater. Eng. 2007, 33, 42–46. [Google Scholar]
  22. Han, D.; Bray, M. Automated Thiessen polygon generation. Water Res. 2006, 42, 28. [Google Scholar] [CrossRef]
  23. Croley, T.E., II; Hartmann, H.C. Resolving thiessen polygons. J. Hydrol. (Amst.) 1985, 76, 363–379. [Google Scholar] [CrossRef]
  24. Asuero, A.G.; Sayago, A.; González, A.G. The correlation coefficient: An overview. Crit. Rev. Anal. Chem. 2006, 36, 41–59. [Google Scholar] [CrossRef]
  25. Tsihrintzis, V.A.; Hamid, R. Runoff quality prediction from small urban catchments using SWMM. Hydrol. Process 1998, 12, 311–329. [Google Scholar] [CrossRef]
  26. Stovin, V.R.; Saul, A. Sedimentation in storage tank structures. Water Sci. Technol. 1994, 29, 363–372. [Google Scholar] [CrossRef]
  27. Llopart-Mascaró, A.; Farreny, R.; Gabarrell, X.; Rieradevall, J.; Gil, A.; Martínez, M.; Puertas, J.; Suárez, J.; del Río, H.; Paraira, M. Storm tank against combined sewer overflow: Operation strategies to minimise discharges impact to receiving waters. Urban Water J. 2015, 12, 219–228. [Google Scholar] [CrossRef]
  28. Barco, J.; Papiri, S.; Stenstrom, M.K. First flush in a combined sewer system. Chemosphere 2008, 71, 827–833. [Google Scholar] [CrossRef]
  29. Lee, J.; Bang, K.; Ketchum, L., Jr.; Choe, J.; Yu, M. First flush analysis of urban storm runoff. Sci. Total Environ. 2002, 293, 163–175. [Google Scholar] [CrossRef] [PubMed]
  30. Hathaway, J.; Tucker, R.; Spooner, J.; Hunt, W. A traditional analysis of the first flush effect for nutrients in stormwater runoff from two small urban catchments. Water Air Soil Poll. 2012, 223, 5903–5915. [Google Scholar] [CrossRef]
  31. Piro, P.; Carbone, M.; Garofalo, G. Distributed vs. concentrated storage options for controlling CSO volumes and pollutant loads. Water Pract. Technol. 2010, 5, wpt2010071. [Google Scholar] [CrossRef]
  32. Adeyinka, M.; Araoye, O.; Akpan, V.; Omole, D.; Elemile, O.O. Design of A Water Transmission and Storage System for Sustainable Reuse of Wastewater Within A University Community. IOP Conf. Ser. Mater. Sci. Eng. 2021, 107, 012146. [Google Scholar] [CrossRef]
Figure 1. Location of the large-scale storage tank (figure is from Google Maps).
Water 16 01097 g001
Figure 2. Schematic diagram of the storage tank (Except for the arrow pointing to “Inflow box culvert”, the other arrows represent the direction of water flow).
Water 16 01097 g002
Figure 3. Model calibration and validation results. (a) COD change process on 19 August 2022; (b) Water level change process on 19 August 2022; (c) COD validation result; (d) Water-level validation result.
Water 16 01097 g003
Figure 4. Contaminant concentration in interception box culvert and inlet well: (a) COD concentration in interception box culvert and inlet well; and (b) SS concentration in interception box culvert and inlet well.
Water 16 01097 g004
Figure 5. Schematic diagram of the inlet well.
Water 16 01097 g005
Figure 6. Water depth of the storage tank before water inflow.
Water 16 01097 g006
Figure 7. CSO volume and pollutant reduction rate of the storage tank.
Water 16 01097 g007
Figure 8. Runoff and pollutant reduction rate of the storage tank.
Water 16 01097 g008
Figure 9. Correlation between the decentralized storage COD control effect and the intensity of rainfall in the first hour.
Water 16 01097 g009
Table 1. Rainfall event parameters used in the simulation.
Rainfall DateAntecedent Dry Days (d)Total Rainfall Depth (mm)Rainfall Duration (min)
13 June1024.0155
22 June623.8205
26 June354.2260
5 July35.250
11 July44.235
12 July027.4160
19 July68.290
20 July04.865
28 July57.680
9 August782.8420
19 August528.2185
14 September1512.4145
Table 2. Model water-quality parameter value.
Land Use TypePollutant ParametersValue
CODSSTN
RoadMaximum buildup (kg/ha)1802206
Rate constant (/d)0.50.50.4
Wash-off coefficient (-)0.0070.0080.003
Wash-off exponent (-)1.71.81.7
RoofMaximum buildup (kg/ha)801304
Rate constant (/d)0.30.30.2
Wash-off coefficient (-)0.0050.0050.005
Wash-off exponent (-)1.61.61.6
GreenMaximum buildup (kg/ha)405010
Rate constant (/d)0.50.50.2
Wash-off coefficient (-)0.0030.0040.002
Wash-off exponent (-)1.21.21.2
Table 3. Designed and actual operation condition of WWTP in W City.
Name of WWTPDesigned Capacity
(104 m3/d)
Time of ConstructionOperation Capacity (104 m3/d)Average Operation Capacity (104 m3/d)
A20November 201514~2218
B4January 20123.5~54.25
C10April 20109.6~11.410
D5December 20063.7~5.54.6
E3September 20052~2.92.45
F2July 20051.8~2.92.35
Table 4. Practical and designed operation condition of the storage tank during typical rainfall from June to September 2022.
DatePractical Storage Volume
(104 m3)
Practical
Reduction
of COD (kg)
Practical Reduction of SS (kg)Practical Reduction of TN (kg)Designed Storage Volume
(104 m3)
Designed
Reduction
of COD (kg)
Designed Reduction
of SS (kg)
Designed Reduction of TN (kg)
13 June18.6858,67085,0602065 22.0067,44097,1202358
22 June9.5223,57035,780909 22.0049,53073,3301862
26 June6.6412,09018,980474 22.0035,61053,2401203
5 July11.0221,10025,740753 14.2227,18032,710957
11 July4.7611,04013,720391 14.5329,38035,3201006
12 July5.5667958840239 15.2714,34019,970539
19 July8.1417,44023,100641 20.9035,71046,6401294
20 July3.2063457400212 8.9012,55014,820426
28 July12.7617,00023,520637 20.4429,50038,1101031
9 August16.4053,00075,4401779 22.0066,71096,4002272
19 August7.7819,21028,450646 22.0046,95072,5501647
14 September15.9228,23036,070945 22.0035,12045,8901203
Total120.38274,490382,1009691226.26450,020626,10015,798
Table 5. Control effect of stormwater runoff of storage tank during typical rainfall from June to September 2022.
DateRunoff Discharge Volume
(104 m3)
Runoff Storage Volume (104 m3)COD Reduction (kg)SS Reduction (kg)TN Reduction (kg)
13 June33.4622.0044,31072,9501116
22 June28.4622.0033,41055,260754
26 June115.1822.0041,75070,070877
5 July09.003629551387
11 July06.702077306554
12 July46.4121.8028,27019,040193
19 July014.4610,25015,840255
20 July08.181243196824
28 July013.35838512,960202
9 August214.7622.0057,94094,1801393
19 August51.4322.0038,89064,530868
14 September2.3822.0018,11027,640509
Total492.08205.49288,264443,0166332
Table 6. Pollution control effect of stormwater runoff by decentralized storage.
DateThe Intensity of
Rainfall in the First Hour
(mm/h)
CODSS
Increased
Reduction
(kg)
Percentage of Centralized
Storage (%)
Increased
Reduction
(kg)
Percentage of
Centralized Storage (%)
13 June12.21876104.2 3385104.6
22 June10.2396101.2 670101.2
26 June14.44059109.7 8554112.2
9 August14.25429109.4 10,943111.6
19 August9.6465101.2 1087101.7
14 September2.4160100.9223100.8
Disclaimer/Publisher’s Note: The statements, opinions and data contained in all publications are solely those of the individual author(s) and contributor(s) and not of MDPI and/or the editor(s). MDPI and/or the editor(s) disclaim responsibility for any injury to people or property resulting from any ideas, methods, instructions or products referred to in the content.

