Article

Transport of Floating Plastics through the Fluvial Vector: The Impact of Riparian Zones

1
Department of Civil Engineering, Aristotle University of Thessaloniki, 54124 Thessaloniki, Greece
2
Department of Hydroscience and Engineering, Faculty of Civil Engineering, University of Zagreb, 10000 Zagreb, Croatia
3
Infrastructure and Environment Research Division, School of Engineering, University of Glasgow, Glasgow G12 8QQ, UK
4
China Construction Science and Technology Group South China Co., Ltd., Shenzhen 518118, China
*
Authors to whom correspondence should be addressed.
Water 2024, 16(8), 1098; https://doi.org/10.3390/w16081098
Submission received: 8 February 2024 / Revised: 26 March 2024 / Accepted: 9 April 2024 / Published: 11 April 2024
(This article belongs to the Special Issue Contaminants in the Water Environment)

Abstract

:
This study presents results from an experimental campaign to explore how different riparian zone characteristics may facilitate the transport or capturing of plastics floating through the fluvial system. Specifically, following field observations for the transport of plastics through fluvial vectors, a substantial number of flume experiments has been designed to assess the effect of floating macro-plastics and riparian zone characteristics. The results from flume experiments were analyzed using particle tracking velocimetry techniques to derive transport metrics (such as transport velocities) of macro-plastics of different sizes and shapes, released at five locations across a wide channel with distinct distance from the vegetated riverbank. The findings are discussed while considering the trapping mechanisms along the vegetated riverbank, which include a range of vegetation densities and arrangements, aiming to identify and quantify the degree of impact of each of the control parameters on the transport of floating plastics. The flow velocimetry records obtained at locations near and within the riverbank correlate well with the transport velocities of the floating plastics. Macro-plastic litter carried downstream away from the riverbank can have up to nine times the transport velocity, compared to those found within the riverbank. The change from a low to a high average density can result in about three times decrease in the transport velocity of floating macro-plastic litter within the riparian zone. These outcomes can help inform better practices for the management of riparian vegetation to maximize the trapping efficiency of macro-plastics, adapted to different flow conditions and river morphologies.

1. Introduction

Plastics are widely used in consumer products due to their low cost, low weight, and high durability compared to other types of materials [1]. The contamination of marine ecosystems due to plastics is a challenge that has received a lot of attention due to the significant risks it poses for the environment, marine mammals, and human health [2,3,4]. The abundance and continued accumulation of floating plastics in oceans across the globe have been growing challenges receiving increased recognition over the last decades [5,6]. It is estimated that the amount of plastic that flows into oceans each year is between 0.7 and 3.8 million tons [7]. This is a growing challenge for our consumer society, as disposable plastics that break up but do not break down are virtually used in our life on a daily basis [8]. It also signals the poor management of non-recyclable and non-recycled plastics, which eventually are not handled in a responsible manner and can be dispersed and introduced into the river network (from land via aeolian transport, as well as from untreated waste and storm water). Thus, plastics can find their way to the ocean via earth’s river systems [9,10,11]. They may be temporarily trapped as floating litter or deposited sediment in these river systems, until mobilized again during high flow and flooding events (demonstrating a significant increase of up to 14 times the average in terms of the number of microplastics) [12]. In this manner, the fluvial network becomes one of the primary pathways for the transport of plastics into the ocean [13,14,15,16]. There has been little research considering the issue of transportation of floating plastic litter along the river system, which contributes to the global challenge of environmental pollution by such persistent contaminants [17]. Thus, obtaining a better understanding of the processes affecting their fate and transport is of outmost importance and urgency [18,19].
A study by Morritt et al. [20] identified the composition of litter in the upper Thames estuary as comprising plastic bags (more than 20%) and food wrappers/containers (another 20%), as well as sanitary towels, plastic cutlery, tobacco packing/wrappers, and general plastics, which is representative of the UK’s coasts [21,22]. Gasperi et al. [23] assessed the quantity of floating litter in the river Seine. Their finding showed that plastic litter was 0.8–5.1% of the total litter in terms of weight, consisting mostly of one-off use plastic cutlery, food wrappers, and containers. Similar observations can be made for other rivers in the United Kingdom, as seen in Figure 1a,b (obtained during own field campaign). It can be clearly seen that the majority of floating plastics (food containers and wrapping) are trapped on the side of the stream, river, or canal, and within its typically vegetated banks [24,25]. Extruded Polystyrene Foam (XPS) is widely used due to its good thermal insulation properties as the primary material for food wrapping and has been studied in the past due to its potential to pollute the environment (e.g., with mercury and bacteria [26]). A study of small plastic litter abundance at Heungnam Beach (Korea), found that more than 90% comprised XPS spherules [27], which potentially originated from plastic containers that broke up during their transport from the nearby fluvial system.
This study aims to advance the understanding of the processes affecting the fate of macro-plastic litter along the fluvial vector before they reach the coast. Specifically, this experimental study focuses on the initial to intermediate transport stages where macro-plastic litter have been introduced to the freshwater system and have only started to degrade and break up into smaller fragments as they are transported along the fluvial vectors [28].
The riparian zone has been found to control the flow hydrodynamics and subsequently, the flow’s transport capacity at the vicinity and within the vegetated bank, as well as the main channel [29], having implications for the channel’s stability. Previous research put emphasis on near-bed surface dynamics. Hence, the focus of this study is to assess how different vegetation densities and arrangements may influence the transport of floating plastics, both indirectly via modifying the water surface flow field, as well as directly via blocking their downstream movement.
The objective of this study is to assess the effect of the riparian zone on the downstream advection of floating plastic and obtain a better understanding of the processes involved via the use of flow diagnostics (acoustic Doppler velocimetry) and particle tracking velocimetry techniques. The study focuses on particles ranging from “small” macro-plastics [30]—onwards termed macro-plastic litter, up to 5 cm plastics, usually termed as “large” meso-plastics. The assessment will focus on extracting qualitative observations and conducting analysis to quantify the impact of the examined control parameters (such as particle size and shape) on their transport dynamics. To this goal, a series of purpose-specific physical experiments are carried out at one of the large research flumes of the Water Engineering Lab at the University of Glasgow to examine the mechanisms of dispersion of plastic litter along the water surface of a channel with simulated riparian vegetation. Field observation supports the development of experimental set ups and confirms the behavior of macro-plastics and its interaction with vegetated banks.

2. Materials and Methods

In the following sections the description of the experimental setup (including flow conditions and the flume and test section characteristics), the experimental matrix, and protocol for the specifically designed physical experiments aiming to examine the mechanisms of dispersion of floating macro-plastic litter along the water surface of a channel with simulated riparian vegetation are offered. Details of the supporting field campaigns along a selected water course are also included.

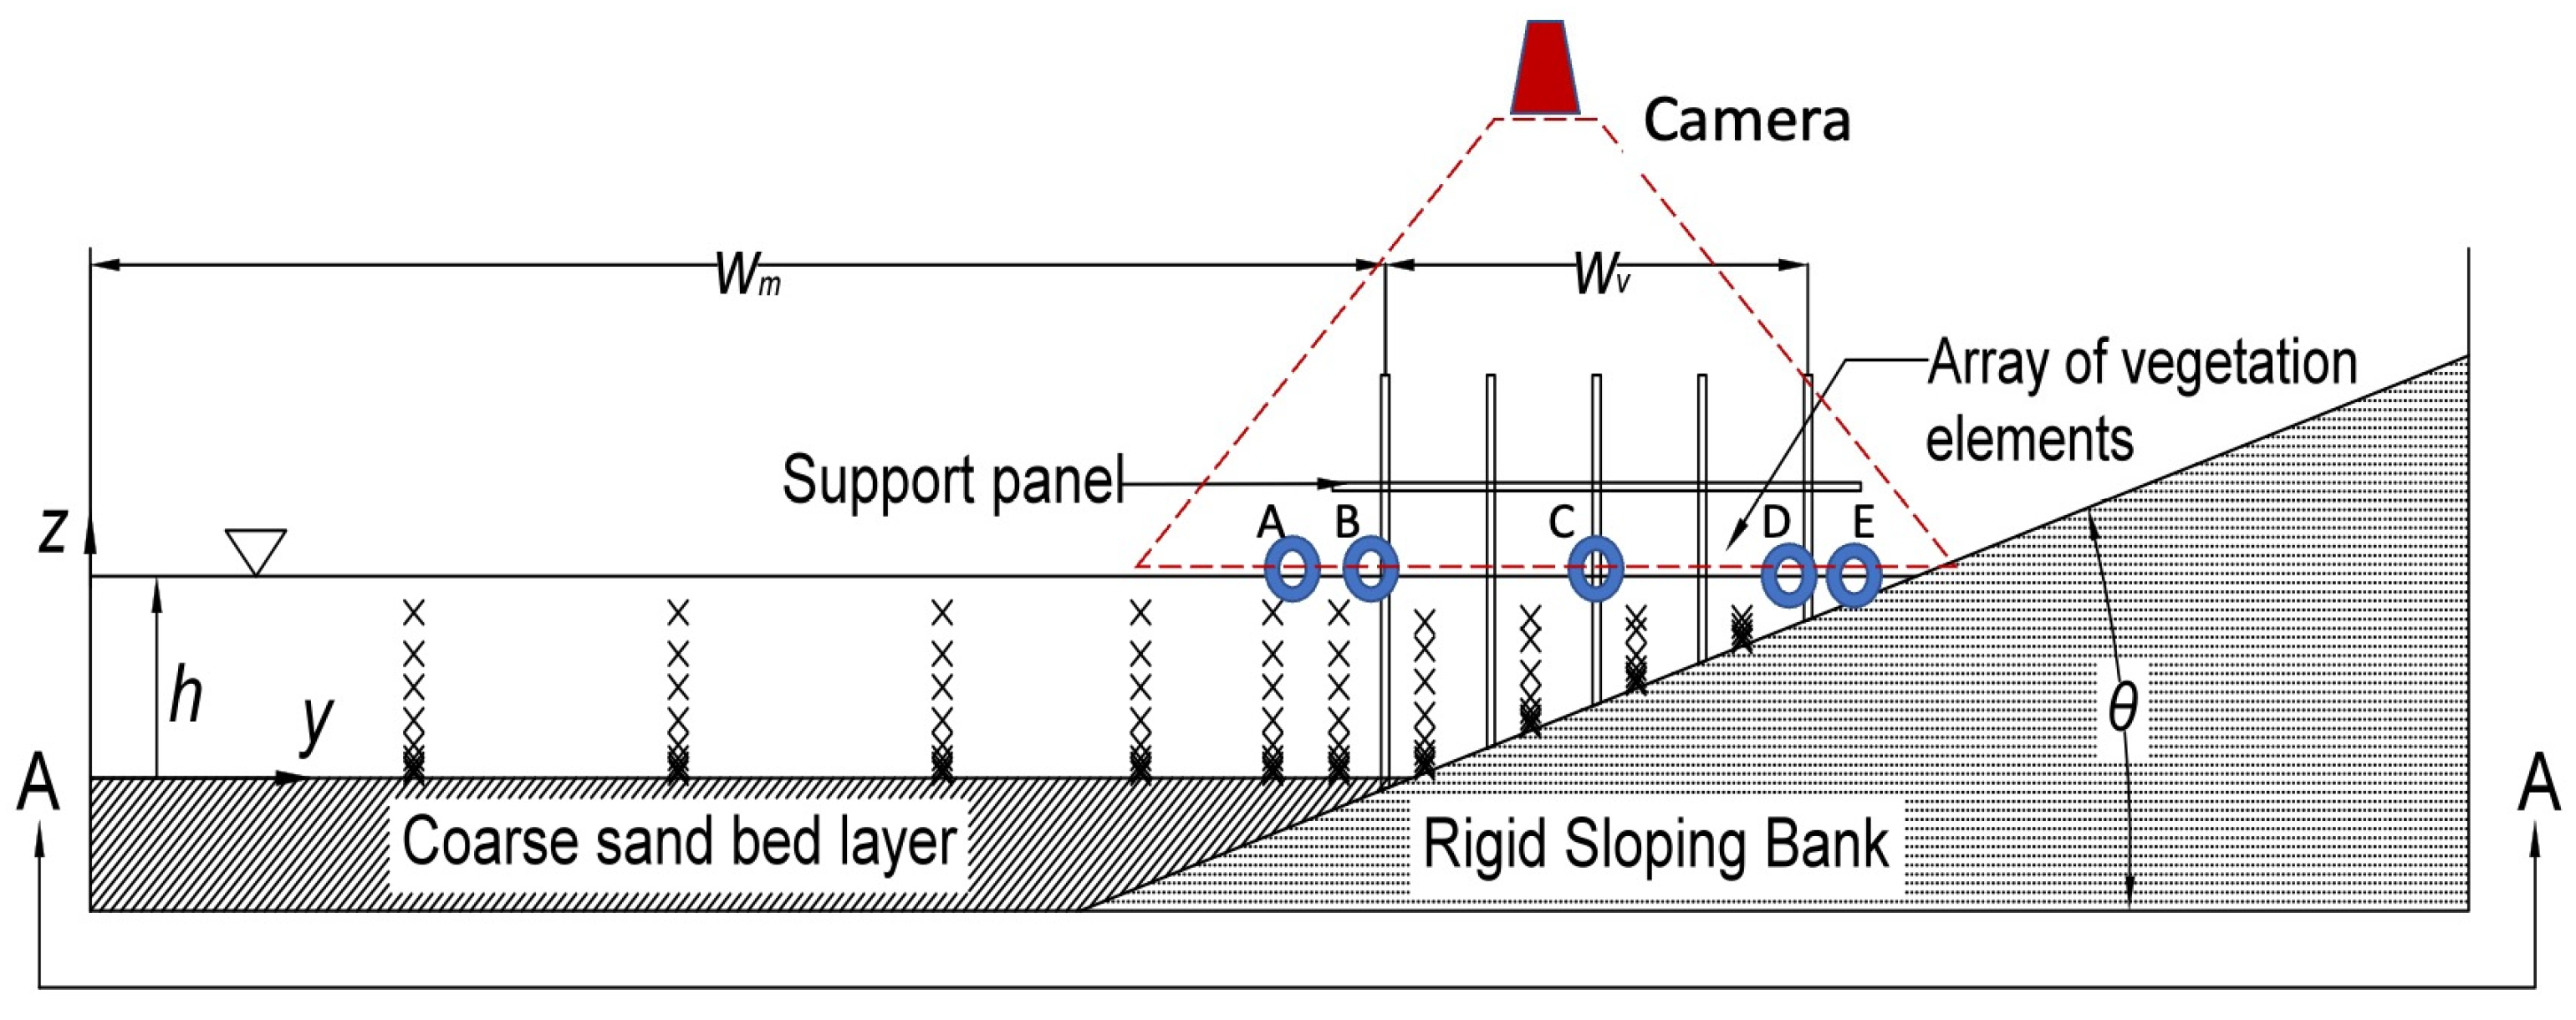
2.1. Experimental Design

The physical experiments described herein were conducted in one of the large (14 m long by 1.8 m wide) glass-walled water recirculating flume at the Water Engineering Lab of the University of Glasgow, which has flat and fixed bed and riverbank slopes to allow uniform flow conditions to develop at the test section, where the transport experiments take place. The flume has a simulated riparian zone comprising a large number of acrylic rods (of diameter, D = 6 mm), placed in a controlled manner (held in position by a suspended support panel) on the top of an inclining riverbank section (Figure 2). The stream bank was modeled by an inclined acrylic panel (of width Wv = 0.8 m), with an angle, θ = 17°, running a streamwise length of 8 m, starting a short distance downstream of the inlet section of the flume. The main channel section (of width Wm = 1 m) is layered with coarse sand of nominal diameter of about 2 mm. Flow through the section of the flume with the riparian zone was smoothed using appropriate streamlining sections. Filter layers at the inlet and outlet of the vegetated channel, comprising coarse bed material, allowed the retaining of the finer sediment comprising about 8 mm fake sediment bed.
A uniform flow depth of about 122 mm was established along the test section by means of fixing the tailgate height to a certain level. A mean flow discharge (as assessed by means of electromagnetic flow meters placed at the inflow pipes downstream of the two pumps) of Q = 8.5 × 10⁻³ m3/s was controlled via the pump inverters. Only one flow condition is tested herein, yet the flow field around and within the riparian zone, as well as at the main channel, demonstrated a strong variability, as assessed by the flow velocimetry, dependent on the riverbank vegetation density. The transect where the flow velocimetry measurements were taken was located 7.2 m from the start of the vegetated riverbank.
Flow hydraulics (flow discharge and channel characteristics such as channel width, flow depth, and bed surface roughness and slope), water surface hydrodynamics (defined by the three-dimensional character of the flow and especially riverbank vegetation), and riverbank vegetation features (such as vegetation type, stem, flexibility, and density, see for example [31]) are the main factors influencing the transport of the floating plastics (for a wide range of individual macro-plastic elements features, such as size, shape, and the material-dependent specific density). In making a choice to prioritize the design variables to be assessed in this study, the specific research objectives need be considered. Herein, the effects of riverbank vegetation densities on the transport of floating macro-plastics are considered to be important for a range of vegetation densities and macro-plastics features. In these experiments only the rod-like feature of the vegetation is seen by the flow, which may directly emulate the effects of vegetation stems or indirectly the trunk of scaled tree models, as done in [32]. The experimental matrix comprises the range of the control parameters, which are selected in such a way to allow the widest range of macro-plastics transport dynamics to be observed. The flow rate for which the experiments were conducted, was assessed from pilot lab experiments to introduce sufficient variability of the water surface dynamics across the test area of the channel cross-section near the riverbank for the range of vegetation densities assessed herein, thus introducing a wide range of macro-plastics transport dynamics. For example, pilot lab experiments (similar to [33]) helped optimally choose the flow discharge so that for the chosen smallest riverbank vegetation density and smallest size of macro-plastic elements tested herein, a measurable difference in the transport rate was still observed (higher flow discharge would result in virtually little differences of solids transport). Likewise, for the highest riverbank density and largest floating macro-plastic element, some finite amount of transport should still occur for the same flow discharge (lower flow discharge would mean all get trapped at the riverbank).
The test section ran for a length of 1 m, which was contained within the viewing area of the camera recording the transport of floating plastic litter. Five initial release locations for the plastic litter were chosen, as shown in Figure 2 (see locations A to E, denoted with symbols “o”). From left to right (looking downstream, Figure 2) the first and last release locations were at XA = 975 mm and XE = 1315 mm, while the second and fourth at the edges of the riparian zone (XB = 985 mm and XD = 1305 mm). The third location was found in the middle of the riparian zone (XC = 1145 mm). The transect of these locations was about 5 m from the start of the vegetated riverbank, so as to ensure uniform and fully developed flow conditions (as assessed from flow velocity measurements at planes along consecutive downstream locations). Pilot experiments demonstrated that the floating litter obtain over relatively short distances that span up to five to ten times their characteristic dimension, a steady transport velocity (unless their transport is disrupted by the vegetation elements), dictated by the near-water-surface flow field [34,35]. Thus, it is observed that the length of the test section is sufficient to capture (via the use of a camera, Figure 2) the complete range of transport dynamics demonstrated by the floating particles.

2.2. Experimental Matrix

The type of material, size, and shape of floating plastic litter was determined according to the findings of an initial field campaign along certain rivers and canals in Scotland (including segments of rivers Kelvin and Clyde and the Forth and Clyde Canal, e.g., see Figure 1), during which the plastic litter captured in the riparian zone were sampled. There has been an increasing number of recently published studies on the methods of sampling floating macro- and meso-plastics, which range from passive to active, also using bespoke and elaborate or expensive equipment or just sourcing information via citizen science participation projects [36,37,38,39,40,41,42]. Given the plethora of sampling procedures, the optimal sampling may depend on the location and flow conditions that are characteristic of a specific river system. Even though our sampling and subsequent design choices may well reflect local conditions, it is important to note that the results presented below are considered to be representative of the transport dynamics of meso- and macro-plastics in water surface bodies, as affected by riverbank vegetation of different densities. These observations are of course limited to the range of size and shapes of the plastics, as well as the range of riverbank densities, but even in these cases, the same framework as presented herein can be used for extracting useful information for different ranges of interest. Based on this information and focusing on the floating macro-plastics, the matrix, comprising the control parameters, for this flume experiment was determined. Given that most of the sampled macro-plastics were made of XPS fragments, combinations of two shapes (circular and rectangular) and 3 sizes per shape, with their maximum dimension ranging from 2 to 4 cm, were selected, as shown in Figure 3.
Using the vegetation density per unit meter, defined as λ = D/xi2, where xi is the distance between each rod and D is the simulated rigid vegetation element (acrylic rod, distributed by RS components©, London, UK) diameter [36], riparian vegetation was configured in 2 different riparian densities from low to high (λ = 0.9 to 1.9 m−1, respectively). For each of these two average macroscopic densities, 3 different patterns for the placements of vegetation elements (one regular and two randomly spaced arrangements exhibiting low or high variability of the local density, as shown in Figure 4) were employed to aid in identifying the effect of the spatial variability on the transport mechanics of floating plastic litter. The regular configuration resulted in a linear arrangement for the low vegetation density case while a staggered arrangement was seen for the high-density case.
For each of the above six riverbank vegetation configurations, each of the six floating plastic elements was released from each of the five different locations upstream (A to E, as shown in Figure 2), and the experiment was repeated three times for each combination, resulting in a total of 540 individual experimental flume runs.
To allow conducting trajectory analysis for the downstream transport of the plastic litter, a camera (Sony FDR-X1000V, with ZEISS Tessar lens, manufactured in Wuxi City, Jiangsu Province, China) recording at 120 fps offering a wide-angle top view of the test section was appropriately placed above the flume. The camera was looking down at the center of the test section along axis Z and perpendicular to the plane of the riverbed (XY).

2.2.1. Trajectory Analysis of Floating Macro-Plastics

At first, the videos were assessed qualitatively to identify a wide range of dynamics and any potential issues with the analysis proposed below. At this stage, focus was given on assessing mechanisms enhancing the mobilization or trapping of the floating plastics along or within the riverbank. A collage of overlaid pictures taken at equidistant temporal instances, focusing on the first stage of transport, and outlining the location of one of the circular floating plastics, is shown in Figure 5. For example, it may be observed (as is particularly usual for plastics released within the riverbank) that the instantaneous transport velocity of floating plastics along the longitudinal as well as lateral direction, may change (Figure 5). This may be because of the influence of three-dimensional flow structures upwelling onto the water surface and carrying the plastic in this direction. Also, for denser (locally or on average) configurations, the flow transporting the floating plastic can interact with the patch of vegetation, or in other cases the plastic can directly interact with individual vegetation elements (rods) within the riparian zone. Such observations allow a better comprehension of the dynamics of transport of floating plastics and facilitate the interpretation of the results obtained.
For the follow-up stage of quantitative analysis, a number of accessible software exist (such as freeware ImageJ) that allow us to conduct analysis of the trajectories of the floating plastic litter. However, there exists no readily automated routine for conducting this analysis, as there are a lot of time-consuming video and image post-processing procedures that are required.
For the present study, each video was first split into its constituent frames, which were then imported into appropriate image processing software (here Adobe Photoshop© version 19 was used), for correcting the parallax effect (removing geometric distortion) of the wide-angle lens. Once this was done, the range of selected images was fed manually into the particle tracking velocimetry software (ImageJ version 1.52i) for extracting the trajectories and from these, the mean transport distances and velocities. In this manner, a variety of transport metrics were obtained (including maximum local transport velocities along the longitudinal and lateral directions, umax,X and umax,Y, and time to trapping) as well as the trapping location (to identify if there is any persistence), allowing us to extract the dependence of these features to the control parameters (primarily the size of the litter and the riparian vegetation density and configuration). Considering the total time for each trial, capped to a maximum duration for the cases the particle was entrapped within the vegetation patch, the bulk transport velocities along the longitudinal and lateral direction, UX and UY, were estimated.

2.2.2. Acoustic Doppler Velocimetry

The flow field near the water surface is the primary forcing mechanism for the downstream advection of the macro-plastic litter. In order to understand how the changing arrangements of riparian zones affect the flow field, a flow diagnostics campaign was pursued along a representative cross-section of the flume. To that goal, acoustic Doppler velocimetry was used across a very dense measurement grid comprising a few thousands of measurement locations (seen as white dots in Figure 6), capturing the whole flow field along the ZY plane. While there is no obvious mean flow effect for the various arrangements (linear or staggered versus low and high-density variability), it can be clearly seen that the bulk flow at the main channel is increasing with vegetation density (compare low and high-density cases in Figure 6). Likewise, the flow through the riparian zone is clearly reduced for the high density compared to the case of low vegetation density.
This may result in a higher transport efficiency of floating plastics near location A (closer to the main channel) for the case of high density. On the contrary, for high densities, plastic litter found within the riparian zone are expected to be transported at a slower rate, while also having a greater probability of getting trapped (until potentially a higher flow event, e.g., during a flood, can again mobilize them).

2.3. Field Campaigns

A series of field campaigns were conducted to collect real-world data related to plastic pollution in water courses. These campaigns permitted the categorization of the presence of different plastic sources and the analysis of how the vegetation patches located on the riverbanks acted as retention areas. Field surveys were carried out along the River Kelvin and the Forth and Clyde Canal in Glasgow, UK. These surveys permitted to identify the presence of multiple plastic sources, varying in size and density. These macro-plastics were found to be buoyant given its relatively low density and therefore were categorized under the floating plastics source. The site surveys along the Canal (Figure 1) highlighted the interaction of riverbank vegetation with these floating elements and confirmed its importance in trapping and retaining plastics in water courses. Field trips at the River Kelvin also presented a different source of macro-plastics in the water course that is not related to food containers and wrappers but to existing outdoors infrastructure (Figure 7). These plastics were also found to be floatable and of similar size to the plastics used in the flume experiments.

3. Results and Discussion

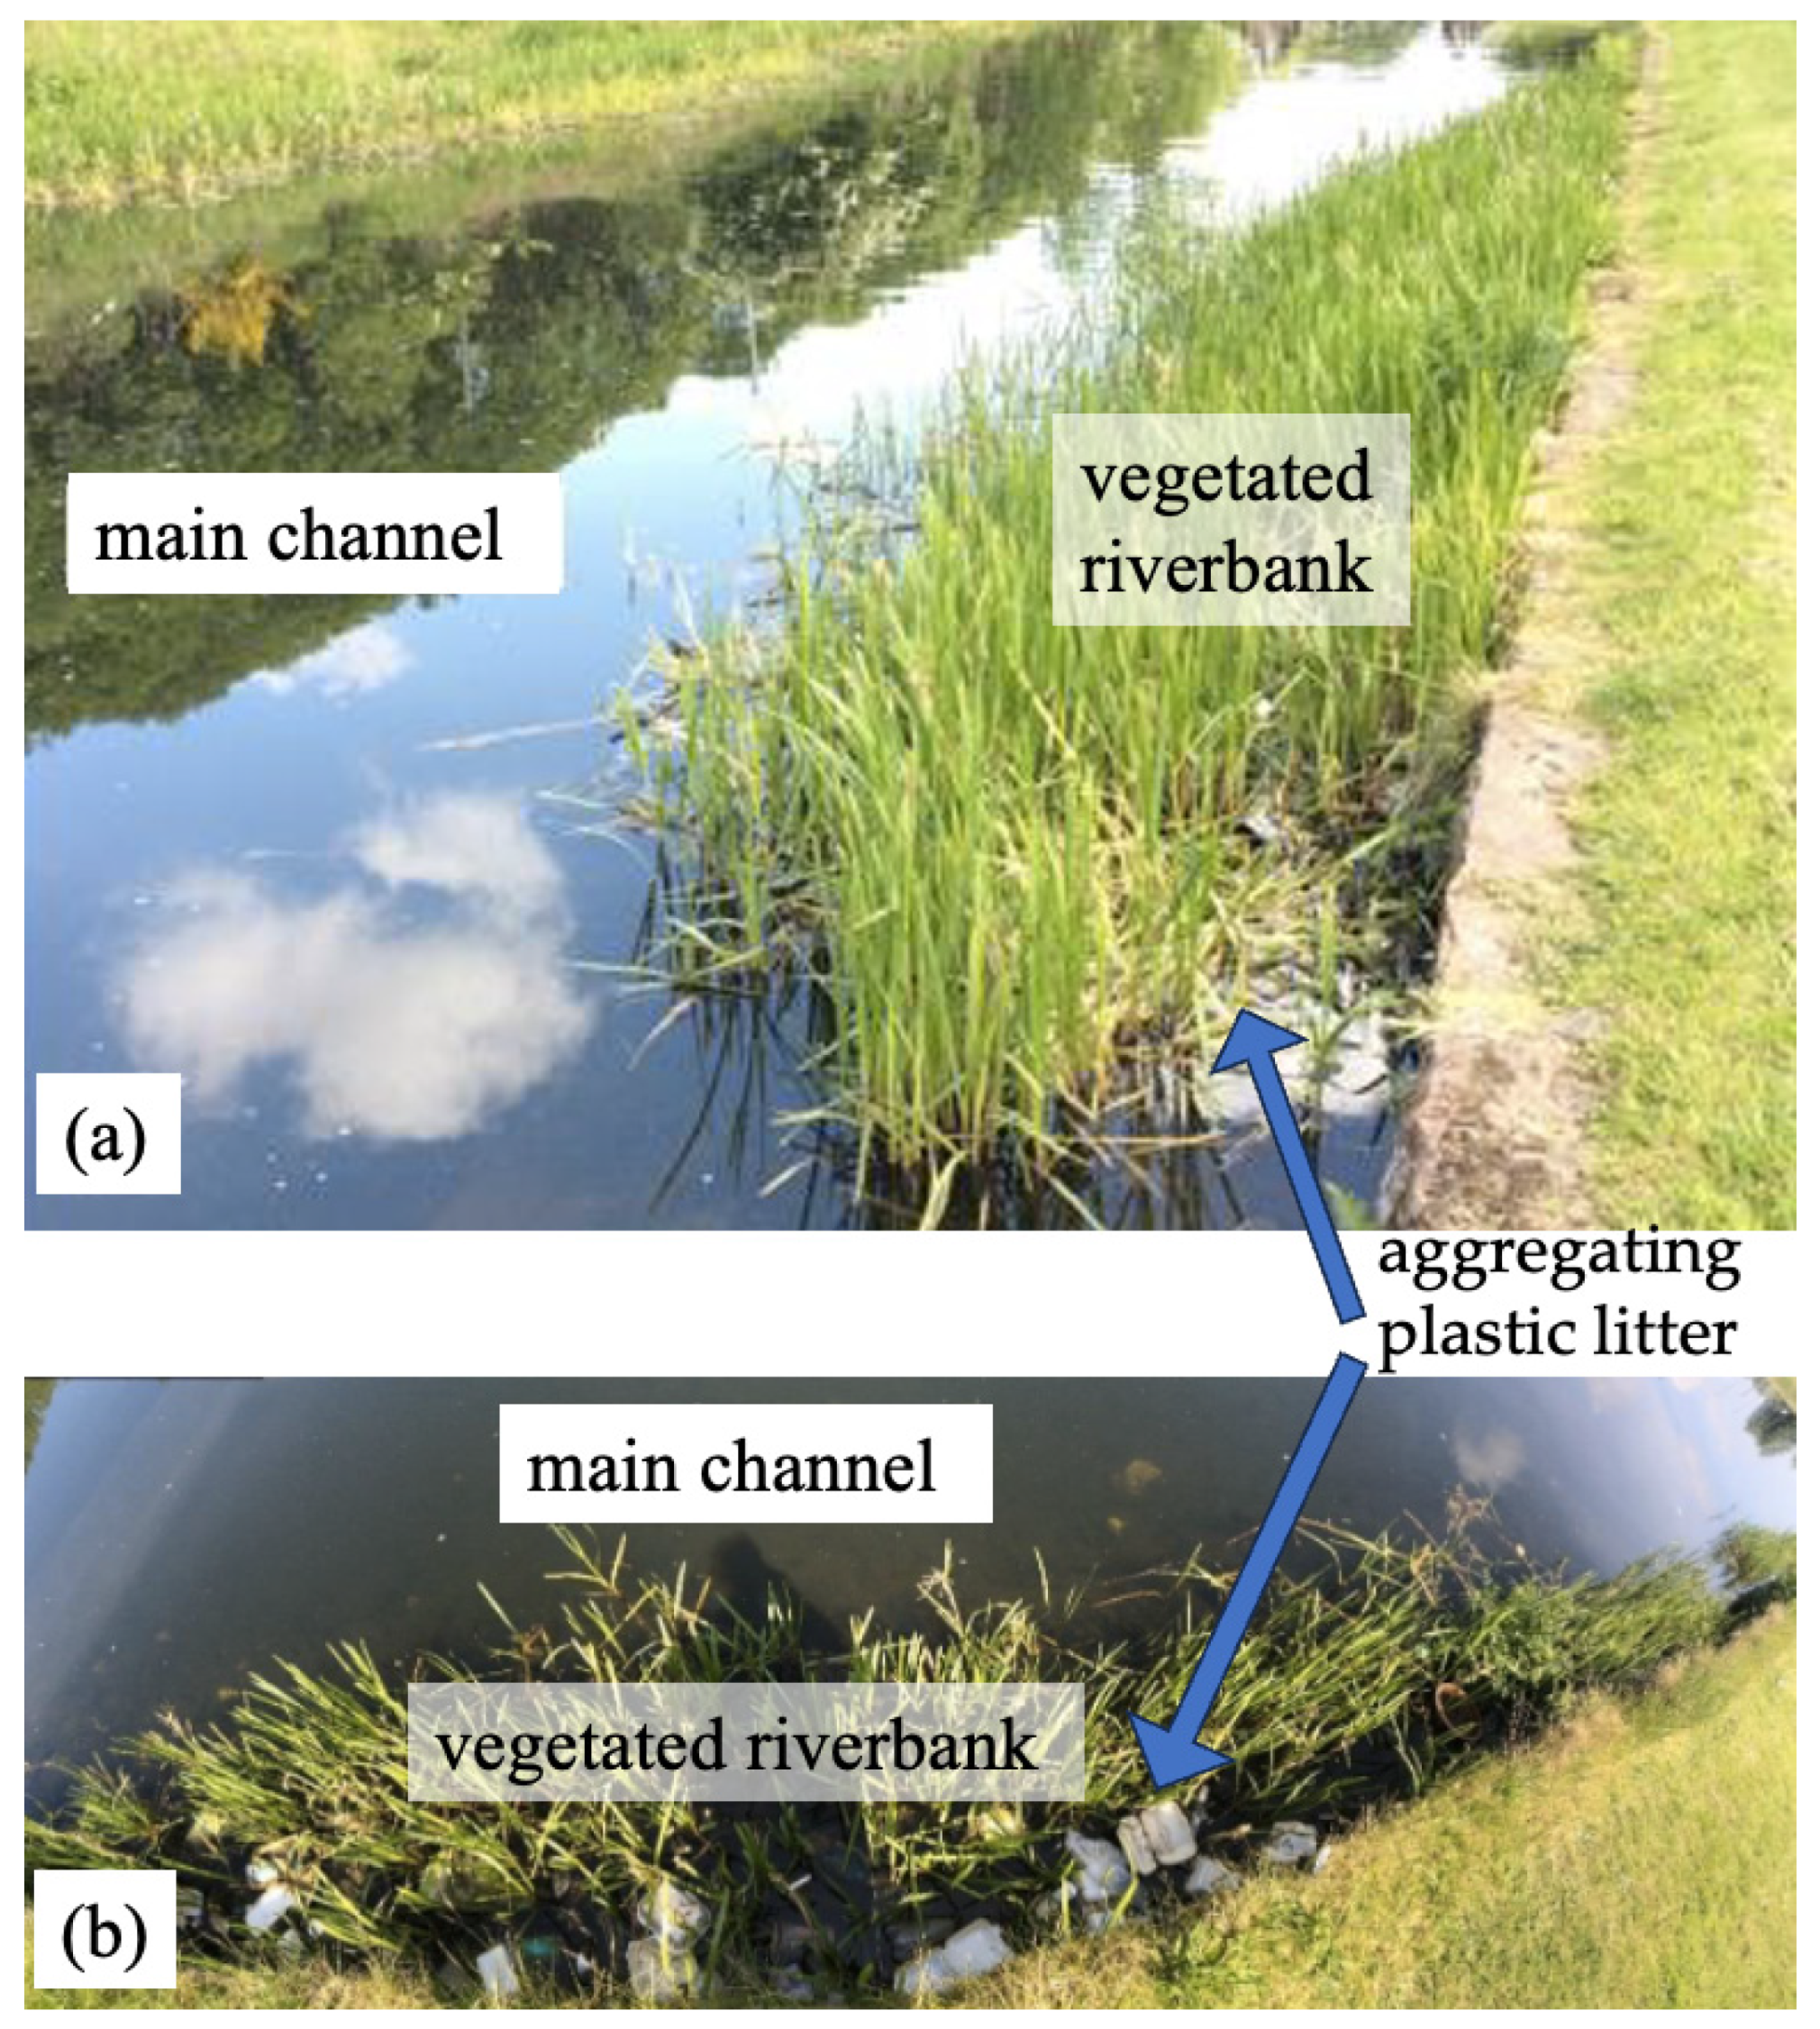
3.1. Qualitative Description of Transport Mechanics

A qualitative description of the transport mechanics of macro-plastic litter by means of direct observation of the visual material obtained will aid in obtaining a better comprehension of the wide range of litter–flow–vegetation dynamic interactions. Firstly, there exist the cases where the plastics are fully transported downstream, following a straight or slightly curved path. These are in general the cases where the plastics are released near the main channel (e.g., location A), where the downstream flow velocity at the water surface is much greater compared to the riverbank (Figure 8). On the contrary, the trajectories of plastic litter, released within the vegetated riverbank (locations B, D, and particularly C) may exhibit a wide range of interactions directly bouncing off or getting trapped by individual vegetation elements or indirectly via the modification of the flow field in the vicinity of the vegetation elements or their patch. Thus, it may be expected that the rate of rotation as well as the lateral advection may be greater for the cases of litter transported at the main channel compared to those within the vegetated riverbank.
In certain cases, the litter are seen to be momentarily captured at the upstream face of the vegetation element and twitching until an approaching flow structure may result in its episodic sweep downstream (similar to transport near the bed surface [43,44]). For smaller litter and high vegetation patch densities, it may be observed that the slowly transported plastic is captured downstream the vegetation element (e.g., at the recirculation region where the mean flow velocity is almost zero). It is expected that this effect will be greater as the size of the recirculation region, which scales with the vegetation element, is of the same order as the size of the plastic litter. There is the case where plastic litter could also be stuck between two or more vegetation elements if the distance between the vegetation elements is smaller than the maximum dimension of the plastic litter.

3.2. Transport Velocity

Herein, the rate of transport of floating macro-plastics of various characteristic shapes and sizes along a riverbank vegetated at different representative densities and arrangements is analyzed and quantified. In addition to improving our understanding of transport processes, such information can be used to calibrate numerical models towards improving their performance, e.g., [45].

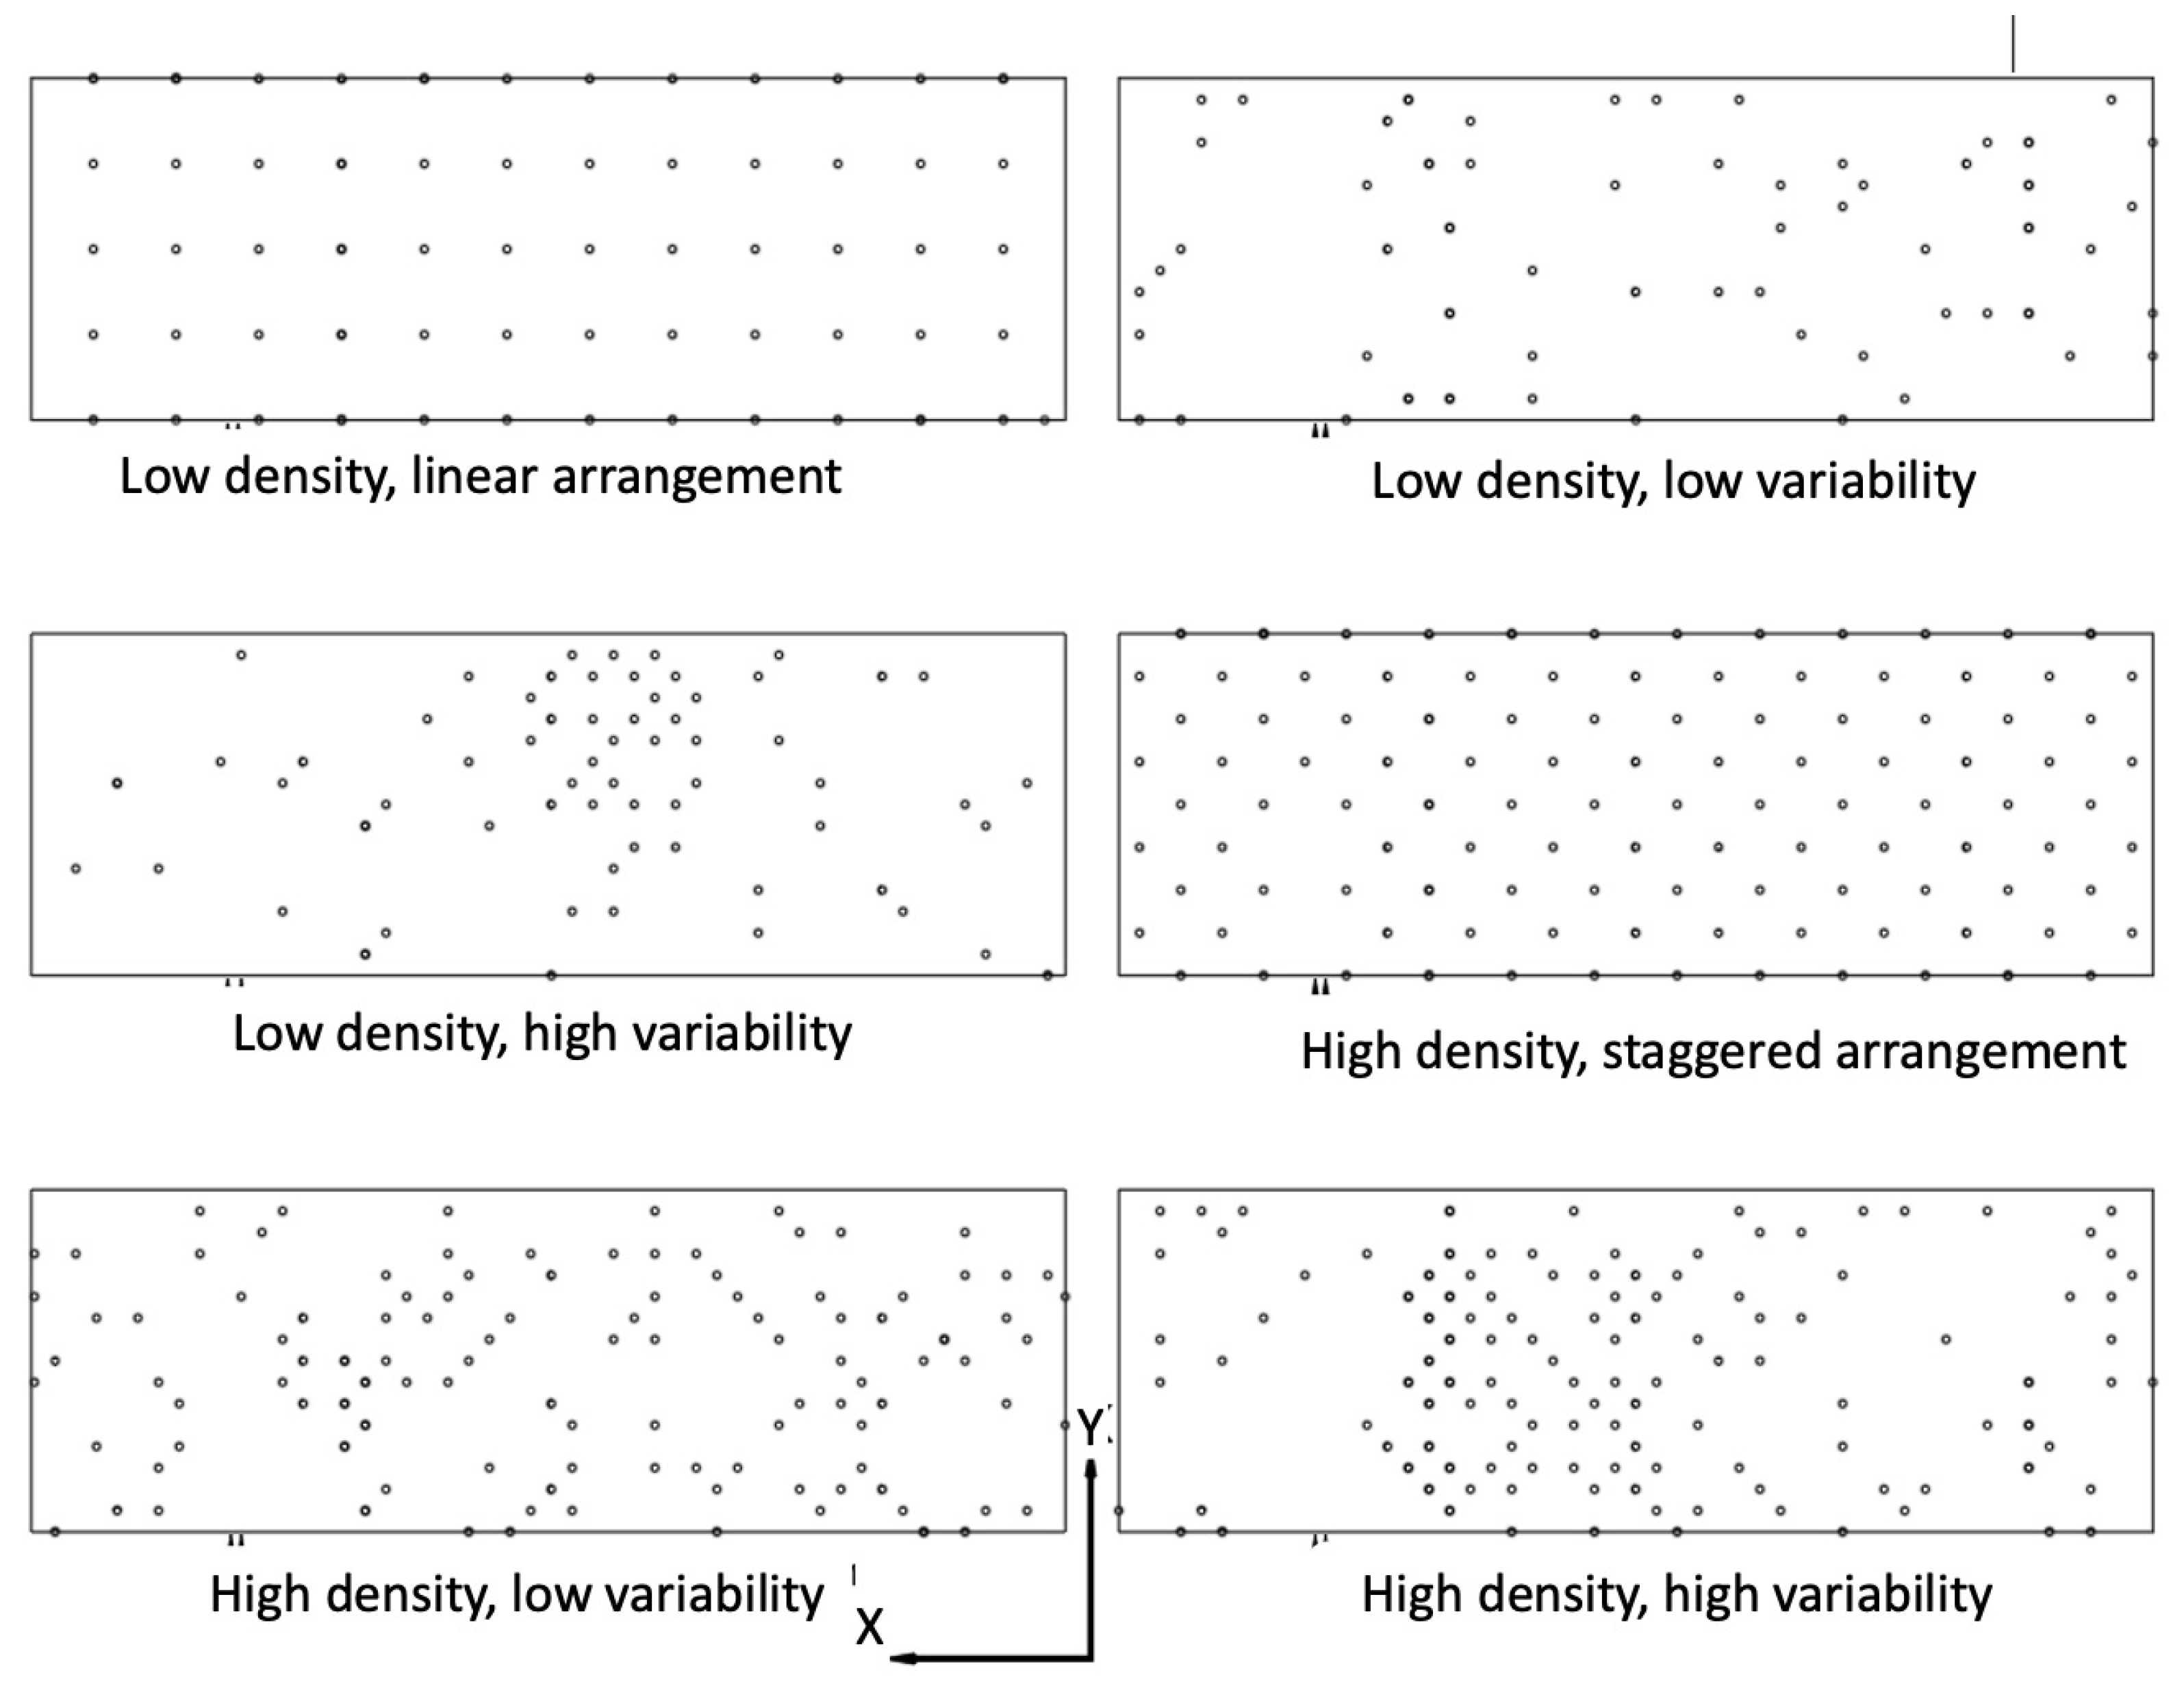
3.2.1. Effect of Riparian Vegetation Density and Arrangement

The analysis of trajectory data from all experiments indicates that increased riverbank vegetation density does not affect the efficiency of transport of floating plastics with any statistical significance. For example, the maximum longitudinal and lateral velocity of the litter, umax,X and umax,Y which remain about 2.6 cm/s and 0.56 cm/s, respectively, do not demonstrate any consistent variability for the different arrangements (Figure 8). The same holds true for UX, UY with even smaller variability, at 1.2 cm/s and 0.1 cm/sec (Figure 8).

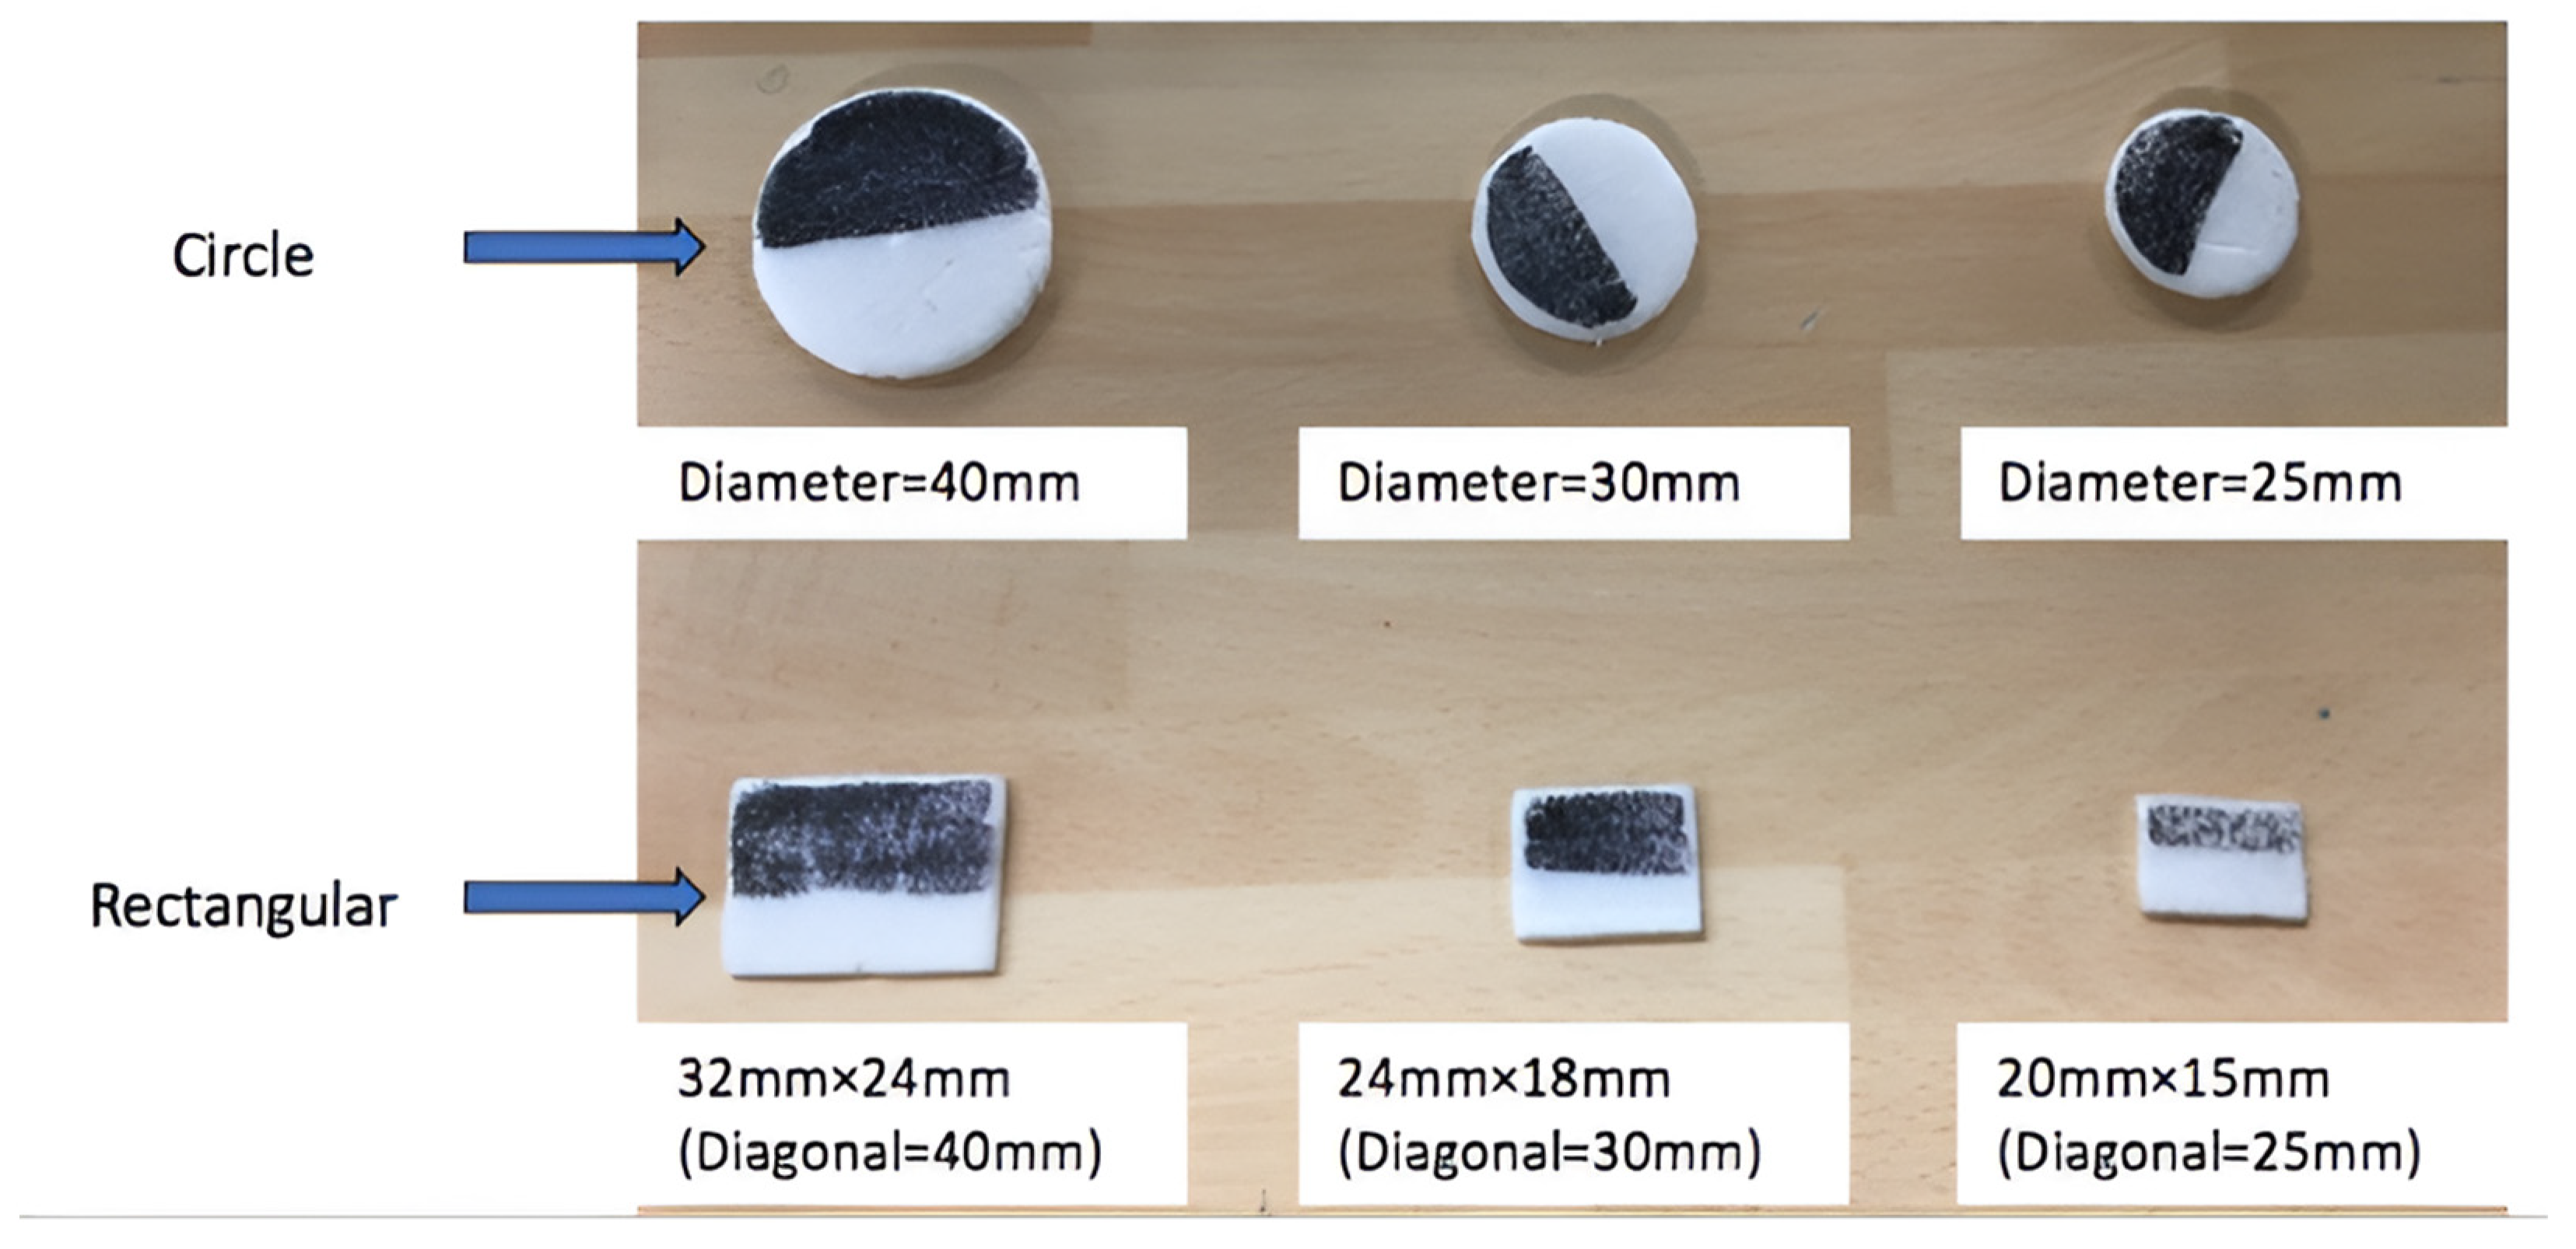
3.2.2. Effect of Size and Shape

Overall, size and shape did not appear to have a significant effect on the transport velocities. Specifically, when comparing the results for circular and rectangular shape, the local and mean streamwise and lateral transport speed was relatively invariant at umax,X = 2.5 cm/s, UX = 1.3 cm/s and UY = 0.14 cm/s (Figure 9a). However, for the lateral local transport velocities, with an overall mean value of umax,Y = 0.6 cm/s, a reduction of about 30% and 13% was observed for the circular- and rectangular-shaped litter, as the vegetation density increases from λ = 0.9 m−1 to λ = 1.9 m−1, respectively (Figure 9a). Figure 9b illustrates that the size of floating macro-plastics has no significant impact on the fate of transport (for the assessed sizes and ratio of litter maximum dimension to the average spacing of vegetation elements comprising the riparian zone).

3.2.3. Effect of Release Location

As floating litter are advected downstream with the flow, they can be found at different locations across the open channel (considering the three-dimensional nature of macroscopic flow structures motions, due to which litter will experience a level of spatio-temporally varying lateral hydrodynamic forcing). As it is expected that at the main channel the floating particle will act as a tracer to the water surface flow, this study focused on the transport of litter in the vicinity or within the riparian zone.
Indeed, past field studies have shown that floating particles (such as eco-foam chips [46]) can be used for assessing the water surface flow field and two-dimensional flow structures (e.g., via large scale particle image velocimetry), under the assumption they act as tracers to the flow [47,48,49].
Figure 10 showcases the various transport velocities the floating litter has for the different release locations and vegetation densities. Comparing the velocities of the floating plastics with the near-water-surface flow velocities (Figure 6), for the corresponding locations, clearly demonstrates that the assumption that the macro-plastics acts as tracers to the local flow is valid. As the water surface velocity is location dependent (Figure 6), it is reasonable to consider that the release location will directly control the velocity with which the plastic litter is transported. For example, for both the low and high vegetation density, the transport velocity of the plastics will reduce significantly as the location changes from the shear region near the main channel, with UX about 3.1 and 3.5 cm/s (for location A), to about 0.3 and 0.1 cm/s (for locations B to D), respectively. Particularly, for locations B to D within the riverbank, for the high-density vegetation, streamwise flow velocity at the near-surface region is about 50% smaller compared to the low vegetation density. This results in the plastics’ velocity getting up to two times higher for the case of low vegetation density, compared to the high vegetation density.
While the plastics are slowing down within the vegetated riverbank for increasing vegetation densities (λ = 0.9 m−1 to 1.9 m−1), the opposite happens for the release location (A) near the main channel, where plastic transport mean streamwise velocity can increase by about 13% (following the same trend, as shown in Figure 6), while the local variation can decrease by about 5%. The plastic litter that are carried downstream away from the riverbank (location A) can have a manyfold (9-fold for λ = 0.9 m−1, or 30 times for λ = 1.9 m−1) increase on the transport velocity, compared to those found within the riverbank. The change from a low to a high average density can result in about three times decrease in the transport velocity of floating litter within the riparian zone.

3.3. Rate of Rotation

Vegetation density and the size and shape of plastic litter influences its rotation rate for the assessed distance travelled (largely clockwise on average). On average, for the low vegetation densities (λ = 0.9 m−1) the rotation was 41 degrees for circular-shaped litter, while it was about half (22 degrees) for rectangular. For the high vegetation density (λ = 1.9 m−1) the degree of rotation dropped fourfold for the circular litter (10 degrees) and at about 16 degrees for the rectangular. For the high density, the litter size mattered more, as the rotation increased from 5 degrees for small (2.5 cm) to 14 degrees for medium size (3 cm) and 22 degrees for the large litter (4 cm). The same increasing trend for the degree of rotation with size was observed for the low vegetation density but with a much smaller variation, from about 30 to 33 degrees. The degree of rotation is greater for the higher vegetation density (90 compared to 72 degrees) if the plastic litter is close to the main channel (location A).

3.4. Implications for Fluvial Storage

Most of the plastic litter will be eventually captured (more than about 90%) if found at the vicinity or within the riparian zone for λ = 0.9 m−1. It is certain that all plastic litter (for the cases examined herein) will get captured for the vegetation density of λ = 1.9 m−1. Thus, it is apparent that a vegetation density of λ > 1 m−1, may be considered as a threshold value for the effective capturing of macro-plastic litter (2.5 cm < D < 5 cm). The probability that plastic litter found at a distance 2–3 times their size away from the riparian zone will get captured within the riparian zone is reduced from 35% to 26% as the density increases from λ = 0.9 m−1 to 1.9 m−1. Overall, the probability that plastic litter is captured within the riparian zone is the same for both densities at about 69%. The identification of macro-plastic litter capturing location can be used as a basis for the deployment of river-cleaning measures such as rotating screen drums [50] to improve their efficiency.
Changing the flow discharge rate would generate an even greater range of variability, which for small changes is expected to scale with plastics transport rates. A study dedicated to the effects of substantial changes in flow discharge can be pursued in the near future but has to address complexities with the three-way interaction of the flow field, vegetation elements, and floating plastics. For combinations of flows and types of vegetation that are flexible, additional mechanisms of trapping and releasing plastics, that have been discussed here can be observed and must be accounted for.
Even though the direct observations of this idealized experimental study may be limited by the range of the parameters employed herein (such as shape and size of plastics, steady flow conditions, as well as riverbank vegetation density), these are still useful in capturing the full range of plastic transport dynamics. Flume experiments, while controlled and replicable, often simplify the conditions found in natural river systems. To bridge this gap, it is crucial to scale up the findings by incorporating factors such as varying flow rates (including unsteady flow conditions, and those representing high flooding conditions), river morphology, and the presence of natural and anthropogenic obstacles that can affect plastic transport and accumulation. There exists strong interest in expanding the range of these observations both experimentally and in the field, by adopting the presented framework to such studies, towards a more holistic approach, obtaining a more comprehensive understanding of the involved processes and eventually developing models that more accurately reflect the retention and release mechanisms of plastics in diverse riverine environments, by incorporating the role of turbulence and their interaction with vegetation. Additionally, these models should be validated with field data from different types of river systems to ensure their applicability and broader capacity to represent a range of such river systems. By integrating detailed flume experiment results with robust modeling and field validation, researchers can develop a comprehensive understanding of floating plastic transport dynamics that can be applied to manage and mitigate plastic pollution in riverine environments across the earth’s surface.

4. Conclusions

Plastic litter, continuously accumulating on our coasts, estuaries, seas, and oceans, is persistent and has an extended lifespan, threatening both the natural environment and human health. This study aims to shed light on the mechanics of transport or entrapment of floating plastic litter in the receiving fluvial systems and assess the role the riparian zones may play in controlling these. To this goal, a series of detailed flow diagnostic measurements were acquired across a flume with a vegetated riverbank and videos of floating plastics transport experiments were analyzed with particle tracking velocimetry, for a range of densities and configurations, representative of natural riparian zones. This experimental campaign resulted in the generation of a first experimental data set to help provide initial insights into the transport mechanics by which floating macro-plastics are transported into the oceans, as well as a novel method for systematically studying such transport processes for a wider range of control parameters. Additionally, a series of field campaigns were conducted to assess the behavior of floating plastics in selected water courses, with particular focus on vegetated banks and to support the description of plastic materials commonly found in water courses in the UK.
The qualitative description of the range of motions and dynamic interactions between the plastics–flow–riparian zone can help better understand the processes affecting the spatio-temporal variation of the transport (including capture and release processes for a range of flow events). Via conducting appropriate laboratory scale experiments under various well controlled conditions, representative of the processes present for studying the fluvial transport of plastic litter, the impacts of their characteristics (e.g., size, shape, and density) as well as the features of the riparian zone were assessed. The major findings demonstrate that there exists no variation for the shape and size of the particles with any strong statistical significance. The same holds true for the different arrangements of vegetation (with low or high local densities), which implies that for the conditions tested here, the controlling parameter is the mean (macroscopic) vegetation density. This is a useful observation, as traditionally physical models of riparian vegetation comprise uniformly arranged vegetation in the environmental hydraulics literature. The control parameter with the most significant impact in this study is the location where the litter is transported downstream. This parameter is important as it defines the region where the litter is found in the water surface during their transport and directly relates to the local flow field, which eventually controls the velocity with which the litter (acting like a tracer to the flow) are advected downstream. It is seen that the unobstructed release locations, particularly near the main channel, have higher flow velocities compared to the locations where flow is slowed down due to the riverbank vegetation.
It is also found that a riparian zone with average density λ > 1 m−1 may allow the capture of all macro-plastic litter. Thus, riverbank restoration and revegetation may help stabilize the riverbank against erosion, but also can act as a means for storage of plastics along the fluvial vector, which may have profound implications for ecological restoration. However, more studies are needed to identify the controls for transport or capture of a wider range of prevalent floating plastics, and to assess the degree to which the riparian zone contributes to exporting or fluvial storage, under a wider range of flow conditions and considering a wider range for the ratio of average spacing of vegetation elements to the plastic litter size. Studying and obtaining a better understanding of the mechanisms contributing to the fate of plastic litter is therefore important in helping to inform environmental risk assessment, policymaking, improved treatment, and proactively devise methods to reduce their abundance and inform new designs towards their entrapment to prevent them from entering the ocean through fluvial vectors.

Author Contributions

Conceptualization, M.V., G.G. and D.L.; methodology, M.V.; validation, G.G. and G.L. formal analysis, M.V., D.L. and G.G.; investigation, M.V., D.L. and G.L.; resources, M.V. and D.L.; data curation, D.L.; writing—original draft preparation, M.V. and D.L.; writing—review and editing, M.V., G.G. and G.L.; visualization, M.V. and D.L.; supervision, M.V.; project administration, M.V.; funding acquisition, M.V. and G.G. All authors have read and agreed to the published version of the manuscript.

Funding

This work was supported by the Newton Fund and the British Council (E046-2017-01) and the Croatian Science Foundation (R3PEAT, UIP-2019-04-4046).

Data Availability Statement

The original contributions presented in the study are included in the article, further inquiries can be directed to the corresponding author/s.

Acknowledgments

The authors want to acknowledge the help and support of the University of Glasgow Water Engineering laboratory technician, Timothy Montgomery, as well as postgraduate research students Tsz Hin Aldus Ian, Wassim Hage Chehade, and Jokha Khalid Al Hinai.

Conflicts of Interest

Author Da Liu was employed by the company China Construction Science and Technology Group South China. The remaining authors declare that the research was conducted in the absence of any commercial or financial relationships that could be construed as a potential conflict of interest.

References

  1. Zulkernain, N.H.; Gani, P.; Chuck Chuan, N.; Uvarajan, T. Utilisation of plastic waste as aggregate in construction materials: A review. Constr. Build. Mater. 2021, 296, 123669. [Google Scholar] [CrossRef]
  2. Nelms, S.E.; Galloway, T.S.; Godley, B.J.; Jarvis, D.S.; Lindeque, P.K. Investigating microplastic trophic transfer in marine top predators. Environ. Pollut. 2018, 238, 999–1007. [Google Scholar] [CrossRef] [PubMed]
  3. Cole, M.; Lindeque, P.K.; Halsband, C.; Galloway, T.S. Microplastics as contaminants in the marine environment: A review. Mar. Pollut. Bull. 2011, 62, 2588–2597. [Google Scholar] [CrossRef] [PubMed]
  4. Carney Almroth, B.M.; Åström, L.; Roslund, S.; Petersson, H.; Johansson, M.; Persson, N.-K. Quantifying shedding of synthetic fibers from textiles; a source of microplastics released into the environment. Environ. Sci. Pollut. Res. 2018, 25, 1191–1199. [Google Scholar] [CrossRef] [PubMed]
  5. Blair, R.M.; Waldron, S.; Phoenix, V.; Gauchotte-Lindsay, C. Micro- and Nanoplastic Pollution of Freshwater and Wastewater Treatment Systems. Springer Sci. Rev. 2017, 5, 19–30. [Google Scholar] [CrossRef]
  6. Schmaltz, E.; Melvin, E.C.; Diana, Z.; Gunady, E.F.; Rittschof, D.; Somarelli, J.A.; Virdin, J.; Dunphy-Daly, M.M. Plastic pollution solutions: Emerging technologies to prevent and collect marine plastic pollution. Environ. Int. 2020, 144, 106067. [Google Scholar] [CrossRef]
  7. Zhang, Y.; Wu, P.; Xu, R.; Wang, X.; Lei, L.; Schartup, A.T.; Peng, Y.; Pang, Q.; Wang, X.; Mai, L.; et al. Plastic waste discharge to the global ocean constrained by seawater observations. Nat. Commun. 2023, 14, 1372. [Google Scholar] [CrossRef] [PubMed]
  8. Talbot, R.; Chang, H. Microplastics in freshwater: A global review of factors affecting spatial and temporal variations. Environ. Pollut. 2022, 292, 118393. [Google Scholar] [CrossRef]
  9. Suaria, G.; Avio, C.G.; Mineo, A.; Lattin, G.L.; Magaldi, M.G.; Belmonte, G.; Moore, C.J.; Regoli, F.; Aliani, S. The Mediterranean Plastic Soup: Synthetic polymers in Mediterranean surface waters. Sci. Rep. 2016, 6, 37551. [Google Scholar] [CrossRef]
  10. Lebreton, L.; van der Zwet, J.; Damsteeg, J.-W.; Slat, B.; Andrady, A.; Reisser, J. River plastic emissions to the world’s oceans. Nat. Commun. 2017, 8, 15611. [Google Scholar] [CrossRef]
  11. Range, D.; Scherer, C.; Stock, F.; Ternes, T.A.; Hoffmann, T.O. Hydro-geomorphic perspectives on microplastic distribution in freshwater river systems: A critical review. Water Res. 2023, 245, 120567. [Google Scholar] [CrossRef] [PubMed]
  12. Gündoğdu, S.; Çevik, C.; Ayat, B.; Aydoğan, B.; Karaca, S. How microplastics quantities increase with flood events? An example from Mersin Bay NE Levantine coast of Turkey. Environ. Pollut. 2018, 239, 342–350. [Google Scholar] [CrossRef] [PubMed]
  13. Meijer, L.J.J.; van Emmerik, T.; van der Ent, R.; Schmidt, C.; Lebreton, L. More than 1000 rivers account for 80% of global riverine plastic emissions into the ocean. Sci. Adv. 2021, 7, eaaz5803. [Google Scholar] [CrossRef] [PubMed]
  14. Schmidt, C.; Krauth‚, T.; Wagner, S. Export of Plastic Debris by Rivers into the Sea. Environ. Sci. Technol. 2017, 51, 12246–12253. [Google Scholar] [CrossRef] [PubMed]
  15. Valero, D.; Belay, B.S.; Moreno-Rodenas, A.; Kramer, M.; Franca, M.J. The key role of surface tension in the transport and quantification of plastic pollution in rivers. Water Res. 2022, 226, 119078. [Google Scholar] [CrossRef] [PubMed]
  16. Lofty, J.; Valero, D.; Wilson, C.A.M.E.; Franca, M.J.; Ouro, P. Microplastic and natural sediment in bed load saltation: Material does not dictate the fate. Water Res. 2023, 243, 120329. [Google Scholar] [CrossRef] [PubMed]
  17. van Emmerik, T.; Strady, E.; Kieu-Le, T.-C.; Nguyen, L.; Gratiot, N. Seasonality of riverine macroplastic transport. Sci. Rep. 2019, 9, 13549. [Google Scholar] [CrossRef] [PubMed]
  18. Horton, A.A.; Walton, A.; Spurgeon, D.J.; Lahive, E.; Svendsen, C. Microplastics in freshwater and terrestrial environments: Evaluating the current understanding to identify the knowledge gaps and future research priorities. Sci. Total Environ. 2017, 586, 127–141. [Google Scholar] [CrossRef]
  19. Sutherland, B.R.; DiBenedetto, M.; Kaminski, A.; van den Bremer, T. Fluid dynamics challenges in predicting plastic pollution transport in the ocean: A perspective. Phys. Rev. Fluids 2023, 8, 070701. [Google Scholar] [CrossRef]
  20. Morritt, D.; Stefanoudis, P.V.; Pearce, D.; Crimmen, O.A.; Clark, P.F. Plastic in the Thames: A river runs through it. Mar. Pollut. Bull. 2014, 78, 196–200. [Google Scholar] [CrossRef] [PubMed]
  21. Nelms, S.E.; Coombes, C.; Foster, L.C.; Galloway, T.S.; Godley, B.J.; Lindeque, P.K.; Witt, M.J. Marine anthropogenic litter on British beaches: A 10-year nationwide assessment using citizen science data. Sci. Total Environ. 2017, 579, 1399–1409. [Google Scholar] [CrossRef]
  22. Horton, A.A.; Svendsen, C.; Williams, R.J.; Spurgeon, D.J.; Lahive, E. Large microplastic particles in sediments of tributaries of the River Thames, UK—Abundance, sources and methods for effective quantification. Mar. Pollut. Bull. 2017, 114, 218–226. [Google Scholar] [CrossRef]
  23. Gasperi, J.; Dris, R.; Bonin, T.; Rocher, V.; Tassin, B. Assessment of floating plastic debris in surface water along the Seine River. Environ. Pollut. 2014, 195, 163–166. [Google Scholar] [CrossRef] [PubMed]
  24. van Emmerik, T.; Roebroek, C.; De Winter, W.; Vriend, P.; Boonstra, M.; Hougee, M. Riverbank macrolitter in the Dutch Rhine–Meuse delta. Environ. Res. Lett. 2020, 15, 104087. [Google Scholar] [CrossRef]
  25. van Emmerik, T.; Vriend, P.; Roebroek, J. An Evaluation of the River-OSPAR Method for Quantifying Macrolitter on Dutch Riverbanks; Wageningen University: Wageningen, The Netherlands, 2008; p. 86. [Google Scholar] [CrossRef]
  26. Graca, B.; Bełdowska, M.; Wrzesień, P.; Zgrundo, A. Styrofoam debris as a potential carrier of mercury within ecosystems. Environ. Sci. Pollut. Res. 2014, 21, 2263–2271. [Google Scholar] [CrossRef] [PubMed]
  27. Heo, N.W.; Hong, S.H.; Han, G.M.; Hong, S.; Lee, J.; Song, Y.K.; Jang, M.; Shim, W.J. Distribution of small plastic debris in cross-section and high strandline on Heungnam beach, South Korea. Ocean Sci. J. 2013, 48, 225–233. [Google Scholar] [CrossRef]
  28. Maes, T.; Van der Meulen, M.D.; Devriese, L.I.; Leslie, H.A.; Huvet, A.; Frère, L.; Robbens, J.; Vethaak, A.D. Microplastics Baseline Surveys at the Water Surface and in Sediments of the North-East Atlantic. Front. Mar. Sci. 2017, 4, 135. [Google Scholar] [CrossRef]
  29. Liu, D.; Valyrakis, M.; Williams, R.J. Flow Hydrodynamics across Open Channel Flows with Riparian Zones: Implications for Riverbank Stability. Water 2017, 9, 720. [Google Scholar] [CrossRef]
  30. Eriksen, M.; Lebreton, L.; Carson, H.S.; Thiel, M.; Moore, C.J.; Borerro, J.C.; Galgani, F.; Ryan, P.G.; Reisser, J. Plastic Pollution in the World’s Oceans: More than 5 Trillion Plastic Pieces Weighing over 250,000 Tons Afloat at Sea. PLoS ONE 2014, 9, e111913. [Google Scholar] [CrossRef]
  31. Yagci, O.; Celik, F.; Kitsikoudis, V.; Ozgur Kirca, V.S.; Hodoglu, C.; Valyrakis, M.; Duran, Z.; Kaya, S. Scour patterns around individual vegetation elements. Adv. Water Resour. 2016, 97, 251–265. [Google Scholar] [CrossRef]
  32. Valyrakis, M.; Liu, D.; Turker, U.; Yagci, O. The role of increasing riverbank vegetation density on flow dynamics across an asymmetrical channel. Environ. Fluid Mech. 2021, 21, 643–666. [Google Scholar] [CrossRef]
  33. Xu, Y.; Valyrakis, M.; Gilja, G.; Michalis, P.; Yagci, O.; Przyborowski, L. Assessing riverbed surface destabilization risk downstream isolated vegetation elements. Water 2022, 14, 2880. [Google Scholar] [CrossRef]
  34. Valyrakis, M.; Al Hinai, J.K.; Liu, D. Transport of floating plastics along a channel with a vegetated riverbank. In Proceedings of the 12th International Symposium on Ecohydraulics ISE 2018, Tokyo, Japan, 19–24 August 2018. [Google Scholar]
  35. Nepf, H.M. Drag, turbulence, and diffusion in flow through emergent vegetation. Water Resour. Res. 1999, 35, 479–489. [Google Scholar] [CrossRef]
  36. Abeynayaka, A.; Kojima, F.; Miwa, Y.; Ito, N.; Nihei, Y.; Fukunaga, Y.; Yashima, Y.; Itsubo, N. Rapid Sampling of Suspended and Floating Microplastics in Challenging Riverine and Coastal Water Environments in Japan. Water 2020, 12, 1903. [Google Scholar] [CrossRef]
  37. Pasquier, G.; Doyen, P.; Carlesi, N.; Amara, R. An innovative approach for microplastic sampling in all surface water bodies using an aquatic drone. Heliyon 2022, 8, e11662. [Google Scholar] [CrossRef] [PubMed]
  38. Campanale, C.; Savino, I.; Pojar, I.; Massarelli, C.; Uricchio, V.F. A Practical Overview of Methodologies for Sampling and Analysis of Microplastics in Riverine Environments. Sustainability 2020, 12, 6755. [Google Scholar] [CrossRef]
  39. van Emmerik, T.; Schwarz, A. Plastic debris in rivers. WIREs Water 2020, 7, e1398. [Google Scholar] [CrossRef]
  40. de Lange, S.I.; Mellink, Y.; Vriend, P.; Tasseron, P.F.; Begemann, F.; Hauk, R.; Aalderink, H.; Hamers, E.; Jansson, P.; Joosse, N.; et al. Sample size requirements for riverbank macrolitter characterization. Front. Water 2023, 4, 1085285. [Google Scholar] [CrossRef]
  41. Chowdhury, Z.; Yokota, K.; Nguyen, M.N.; Inoue, T. Bank Accumulation of Macroplastic Samples in a Farmland River in Japan. Water Air Soil Pollut. 2023, 12, 234. [Google Scholar] [CrossRef]
  42. Cowger, W.; Markley, L.A.T.; Moore, S.; Gray, A.B.; Upadhyay, K.; Koelmans, A.A. How many microplastics do you need to (sub)sample? Ecotoxicol. Environ. Saf. 2024, 275, 116243. [Google Scholar] [CrossRef]
  43. Valyrakis, M.; Diplas, P.; Dancey, C.L. Entrainment of coarse grains in turbulent flows: An extreme value theory approach. Water Resour. Res. 2011, 47, W09512. [Google Scholar] [CrossRef]
  44. Valyrakis, M.; Diplas, P.; Dancey, C.L. Entrainment of coarse particles in turbulent flows: An energy approach. J. Geophys. Res. Earth Surf. 2013, 118, 42–53. [Google Scholar] [CrossRef]
  45. Courtene-Jones, W.; Quinn, B.; Gary, S.F.; Mogg, A.O.M.; Narayanaswamy, B.E. Microplastic pollution identified in deep-sea water and ingested by benthic invertebrates in the Rockall Trough, North Atlantic Ocean. Environ. Pollut. 2017, 231, 271–280. [Google Scholar] [CrossRef]
  46. Jodeau, M.; Hauet, A.; Paquier, A.; Le Coz, J.; Dramais, G. Application and evaluation of LS-PIV technique for the monitoring of river surface velocities in high flow conditions. Flow Meas. Instrum. 2008, 19, 117–127. [Google Scholar] [CrossRef]
  47. Gunawan, B.; Sun, X.; Sterling, M.; Shiono, K.; Tsubaki, R.; Rameshwaran, P.; Knight, D.W.; Chandler, J.H.; Tang, X.; Fujita, I. The application of LS-PIV to a small irregular river for inbank and overbank flows. Flow Meas. Instrum. 2012, 24, 1–12. [Google Scholar] [CrossRef]
  48. Lewis, Q.W.; Rhoads, B.L. Resolving two-dimensional flow structure in rivers using large-scale particle image velocimetry: An example from a stream confluence. Water Resour. Res. 2015, 51, 7977–7994. [Google Scholar] [CrossRef]
  49. Laxague, N.J.M.; Özgökmen, T.M.; Haus, B.K.; Novelli, G.; Shcherbina, A.; Sutherland, P.; Guigand, C.M.; Lund, B.; Mehta, S.; Alday, M.; et al. Observations of Near-Surface Current Shear Help Describe Oceanic Oil and Plastic Transport. Geophys. Res. Lett. 2018, 45, 245–249. [Google Scholar] [CrossRef]
  50. Fuchs, Y.; Scherbaum, S.; Huber, R.; Rüther, N.; Hartlieb, A. Removing Plastic Waste from Rivers: A Prototype-Scale Experimental Study on a Novel River-Cleaning Concept. Water 2024, 16, 248. [Google Scholar] [CrossRef]
Figure 1. Forth and Clyde Canal, showing (a) downstream view of the canal’s cross-section including the main channel and vegetated riverbank and (b) top view of the canal’s riparian zone retaining plastic litter (notice food containers and wrappers made of XPS plastic).
Water 16 01098 g001
Figure 2. Upstream cross-section of the channel test section showing the stable main channel and inclined vegetated riverbank. Also shown is a subset of the measurement locations for the acoustic Doppler velocimetry (with symbol “x”) and the locations where the plastic litter was initially released (blue circle). The flow direction is along the X axis, perpendicular to the ZY plane (into the page). The open blue circles (A to E) show the projection of the floating plastic elements release location to the illustrated test cross-section.
Water 16 01098 g002
Figure 3. Comparison of the size and shape of the 6 floating macro-plastic fragments used in the experiments. Each half of the plastic fragments surface is white or dark colored, to allow assessing their rate of rotation as they transverse along the riverbank.
Water 16 01098 g003
Figure 4. Demonstration of the regular and random (low and high variability of layout non-uniformity) riverbank vegetation arrangements for the assessed mean vegetation densities (linear low-density arrangement of λ = 0.9 m−1 and staggered high-density configuration of λ = 1.9 m−1). The flow direction is along the X axis. The open circles pinpoint the location of the rigid riverbank vegetation elements, to better comprehend the vegetation density non-uniformity.
Water 16 01098 g004
Figure 5. Demonstration of the procedure to obtain part of the trajectory of a downstream-advected plastic litter, in the form of a composite picture comprising subsequent overlaid frames, to demonstrate the change in location of the transported plastic element (outlined with the light blue filled circle).
Water 16 01098 g005
Figure 6. Contour plots of the mean flow velocity field along a cross-section of the flume at the test section (including measurements both at the main channel and the riverbank) for the range of riparian vegetation densities and configurations examined. The high density of riparian vegetation results in a demonstrably higher fast-flowing cross-sectional area at the main channel (see section outlined with the dashed rectangle), as well as a more slow flow and transport at the riverbank through the riparian vegetation (see sections outlined with the dotted rectangles).
Water 16 01098 g006
Figure 7. (a) Plastic elements from worn-out paint of lighting poles, (b) these poles sit next to River Kelvin, at Kelvingrove Park, Glasgow, UK, and can potentially contribute to the plastic discharge in the water course, front (c) and reverse (d) of a sample of a maximum length of 40 mm.
Water 16 01098 g007
Figure 8. The effect of riparian vegetation densities and arrangements on floating macro-plastic transport velocities.
Water 16 01098 g008
Figure 9. Floating macro-plastic transport velocities for the assessed riparian vegetation densities and different (a) shapes and (b) sizes.
Water 16 01098 g009
Figure 10. The effect of release location (from A to E) on floating macro-plastic transport velocities for the assessed riparian vegetation densities.
Water 16 01098 g010
Disclaimer/Publisher’s Note: The statements, opinions and data contained in all publications are solely those of the individual author(s) and contributor(s) and not of MDPI and/or the editor(s). MDPI and/or the editor(s) disclaim responsibility for any injury to people or property resulting from any ideas, methods, instructions or products referred to in the content.

