Abstract
One of the crucial challenges of our time is climate change. The consequences of rising sea levels and drought greatly impact water resources, potentially worsening seawater intrusion. Characterizing coastal aquifers is an essential step in devising strategies to address these phenomena. Seawater intrusion poses a critical socio-economic and environmental issue in the coastal plain of Muravera, southeastern Sardinia (Italy). This coastal plain is an important agricultural area in Sardinia, and the health of the crops is compromised by the increasing salinization of shallow groundwater. To enhance our understanding of the hydrogeological conceptual model, which is essential for a sustainable resource management system, hydrogeological investigations were conducted and complemented by the chemical and multi-isotopic analyses of groundwater. The main objectives of this study were to identify groundwater recharge areas, understand salinization mechanisms and trace the evolution of water chemistry. Within this framework, a monthly survey monitoring piezometric level and electrical conductivity was carried out for one year. This survey was integrated with chemical and isotope analyses, including δ18OH2O and δ2HH2O, δ11B, δ18OSO4, δ34SSO4, and 87Sr/86Sr. Hydrochemistry analysis results revealed the occurrence of seawater–freshwater mixing, extending up to 4 km inland. H2O isotope analysis confirmed the mixing processes and indicated the meteoric origin of recharge waters for both shallow and semi-confined aquifers. The strontium isotopes ratio facilitated the identification of four main groundwater flow paths, confirmed by the SIAR model. The results of this combined hydrogeological–geochemical–isotopic survey provide essential elements for the future implementation of an integrated and sustainable management system. These findings enable interventions to slow the process of seawater intrusion and meet the economic needs for the development of local communities.
1. Introduction
Seawater intrusion (SI) is a global phenomenon that occurs in many coastal aquifers and is increasing dramatically. Researchers worldwide have extensively discussed this phenomenon due to its significant impact on water resource depletion [1,2,3,4]. The combination of rising sea levels resulting from climate change, coupled with severe over-exploitation and the mismanagement of water, exacerbates these effects. In the Mediterranean area, a continuous increase in the salinization of coastal regions, in terms of both the number and size of affected areas, has been observed to varying extents [5]. In Sardinia (Italy), climate projections indicate that the region will experience a general increase in temperatures, both in average and extreme values, as well as a reduction in annual precipitation. Additionally, there will be a higher intensity and frequency of extreme weather events, including heatwaves leading to droughts and heavy rainfall events [6,7]. These factors can dramatically decrease recharge to aquifers and lead to an increase in withdrawals, potentially exacerbating the widespread and severe problem of seawater intrusion across Sardinia.
The only viable approach to address this issue is through the development of sustainable groundwater management systems. To achieve this, a comprehensive understanding of the spatial distribution of groundwater (both fresh and salt), flow paths, and the source of recharge is essential. Accurate characterization enables the consideration of all variables, facilitating the envisioning of appropriate scenarios for future actions and addressing both environmental and economic–social interests. Recent studies in the literature demonstrate the valuable contribution of implementing a geochemical and multi-isotopic approach in describing and recognizing sources, processes, and complexities within an aquifer system [8,9,10,11]. Strontium, boron, oxygen, and hydrogen isotopes have been successfully used to investigate the sources and processes of salinization in Recife (Brazil) [12] and Morocco [13], providing important insights for water management systems. Additionally, several studies employing geochemical and multi-isotopic analyses to define seawater intrusion are documented in [14,15]. Among these, [16] geochemical and isotopic indicators have been utilized to assess the characteristics of salinized seepage in an underground oil storage cavern (in Yeosu, Republic of Korea).
An emblematic case study concerning seawater intrusion issues is the coastal aquifer of Muravera on the southeast cost of Sardinia (Italy) (Figure 1). In this coastal plain, water supply for the socio-economic development of local communities has always relied on groundwater extraction. Over time, seawater has progressively invaded the inland areas. The salinization of surface- and groundwater and land traditionally used for agriculture has resulted in several environmental, economic, and social issues [17]. In this context, the development of an integrated and sustainable groundwater management system is crucial to satisfy human demand for water, both for drinking and irrigation purposes, while respecting the environmental equilibrium.


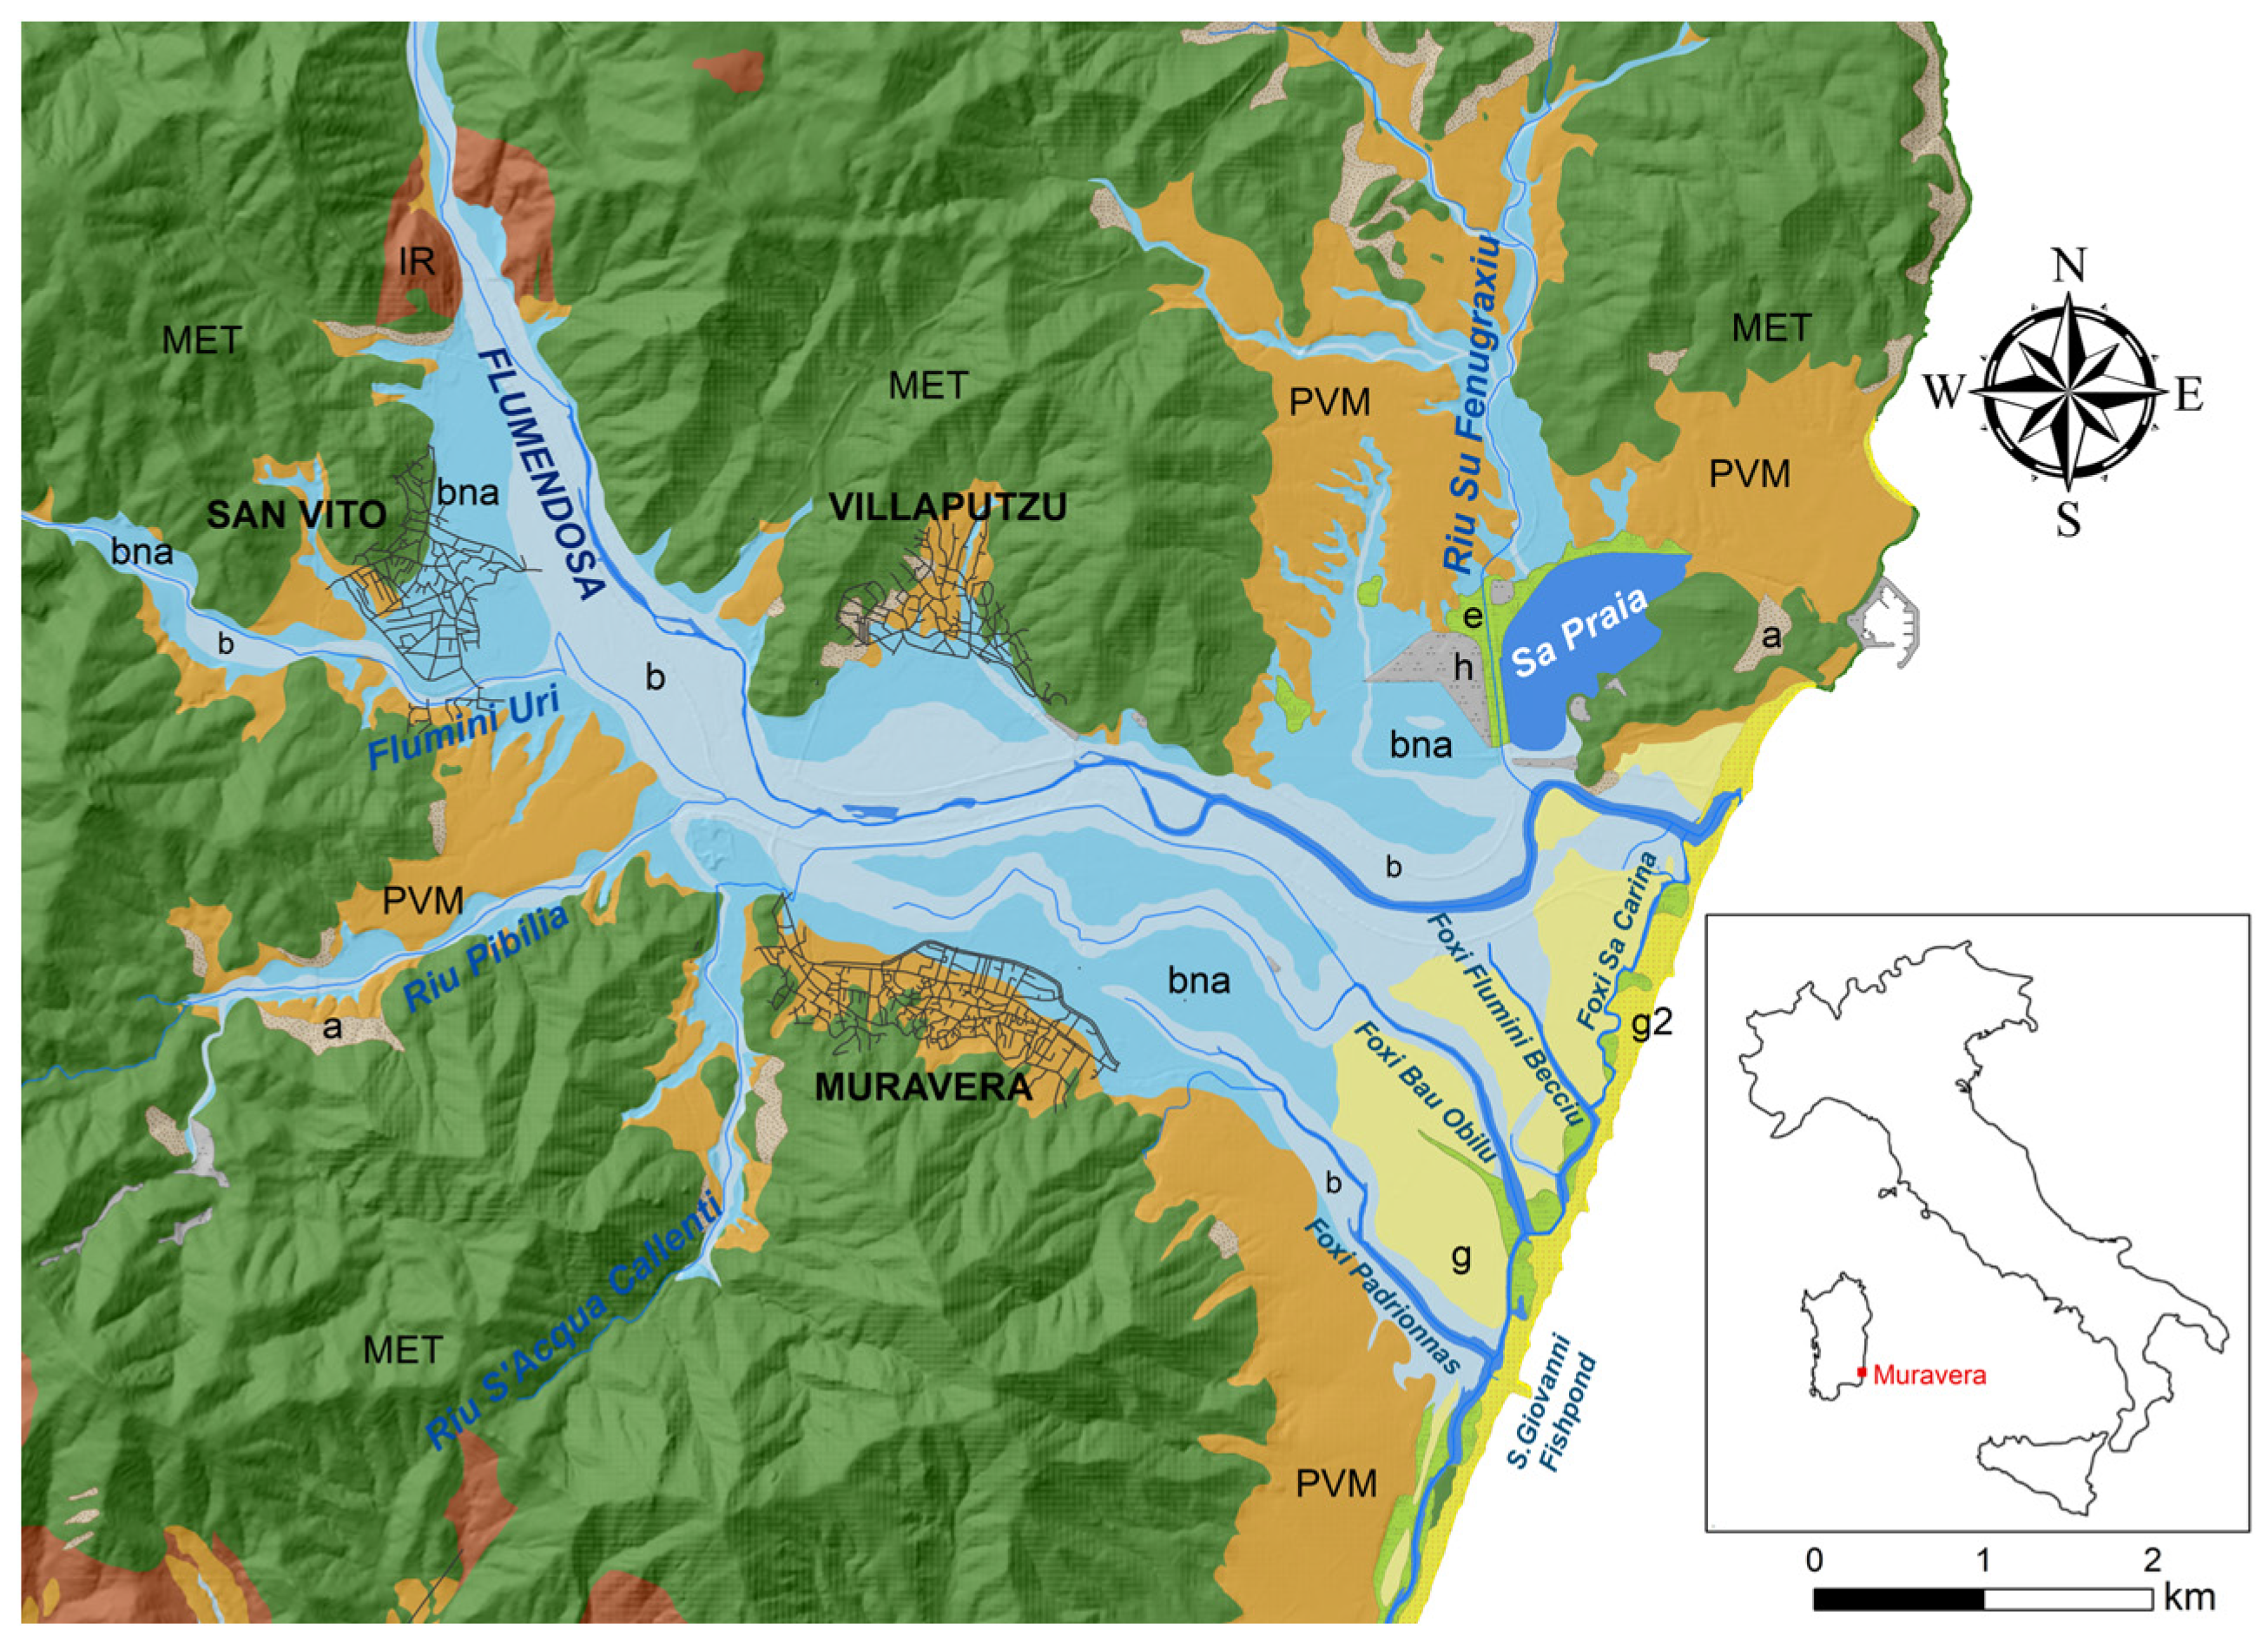
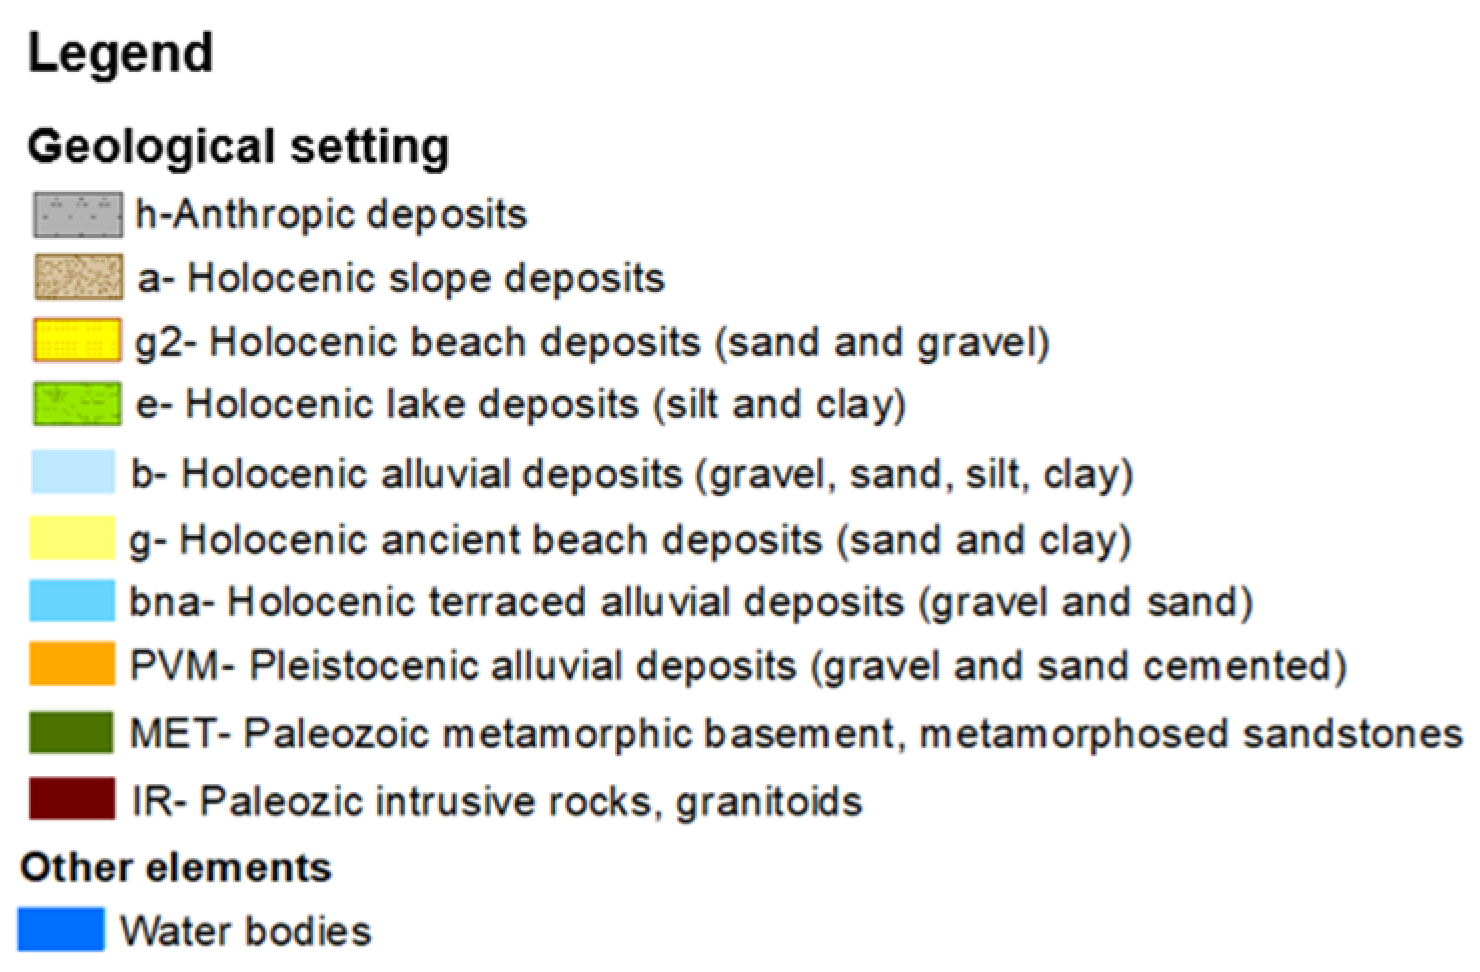
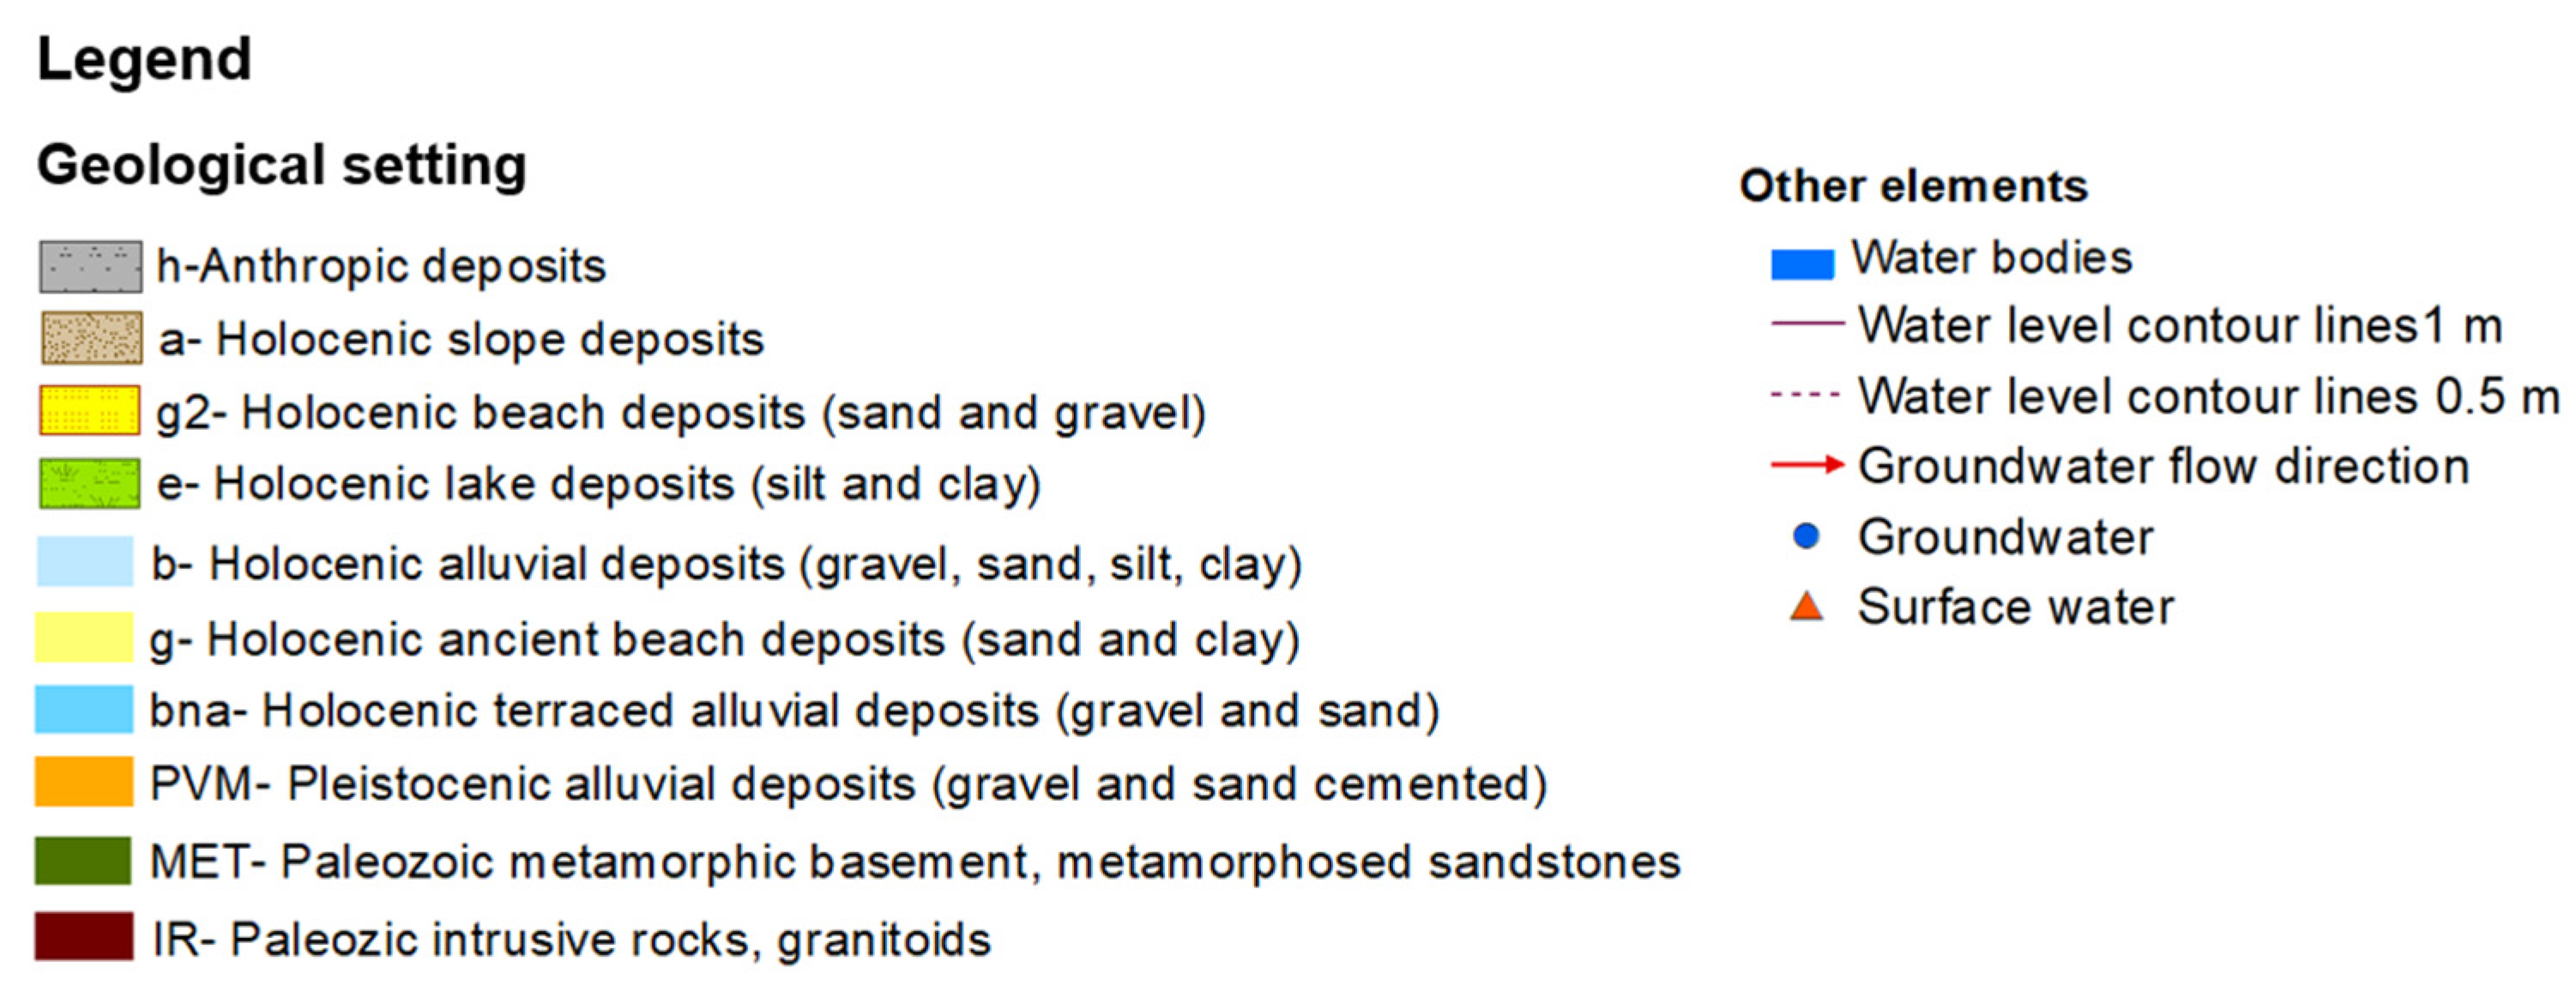
Figure 1.
Geological map of the Muravera Plain from www.SardegnaGeoportale.it (accessed on 13 March 2024).
Due to the geological complexity of the plain and the intrusion of seawater, numerous hydrogeological, geological, and geophysical studies have been carried out since 1970 [18,19,20,21,22,23,24,25,26,27]. Despite the large number of investigations, many aspects remain unclear.
Through a multidisciplinary approach, this work aims to provide a methodology to (1) offer information about flow pathways, surface- and groundwater interactions, and all other possible recharge sources, including potential recharge from a sewage treatment plant’s discharge to the alluvial aquifer through the surface channel where it is discharged; and (2) trace the evolution of water chemistry and salinization mechanisms, focusing on groundwater residence time.
The applied approach involved monthly monitoring campaigns to define piezometric trends and identify variations in chemical and physical parameters throughout an entire year. Additionally, water sampling for chemical and multi-isotopic analysis was performed. This methodology allows us to recognize recharge sources, flow pathways, surface- and groundwater interactions, and residence times. All these details are important for a comprehensive understanding of the system under study, helping to define salinization processes [13,28], contributing to designing intervention measures, and developing an integrated and sustainable groundwater management system.
2. Materials and Methods
2.1. Study Area
The Muravera Plain is located on the southeastern coast of Sardinia (Italy) and spans an area of 39 square kilometers. Annual rainfall in the plain varies between 200 and 1100 mm, with a prolonged drought period and an average annual temperature of approximately 18 °C. Within the plain, there are over 400 hectares of citrus groves and 227 hectares of rice fields, which represent a culturally significant aspect of the socio-economic development of the area. Moreover, during summertime, when water demand rises due to irrigation and tourism, uncontrolled groundwater exploitation occurs. An estimate of withdrawals indicates that more than 4 Mm3 of groundwater are extracted annually, against an estimated zenithal recharge varying from approximately 2 to about 4 Mm3 per year [29,30], emphasizing the necessity to establish a water balance. Despite being crossed by the Flumendosa River (the second longest river in Sardinia, 122 km), the plain faces challenges due to several dams along its watershed, leading to a reduction in runoff water to the plain and an as-yet unquantified recharge to the groundwater. Several torrential tributaries, including the Flumini Uri, Rio Pibilia, Riu Mannu, and Riu de Su Fenugraxiu, flow into the Flumendosa within the plain area. Furthermore, the inland area behind the coastline is characterized by the presence of the abandoned arms of the river (known as Foxi) and the Sa Praia Pond (Figure 1), both of which have become salinized due to a direct opening to the sea for aquaculture activities.
From a geological point of view, the plain area is mostly represented by Holocene alluvial deposits related to the ancient-to-actual activity of the Flumendosa River; Pleistocene continental deposits widely outcrop along the southern border of the plain and within the main tributaries’ valleys (i.e., Riu Pibilia, Flumini Uri and Riu Su Fenugraxiu). The plain is surrounded by hilly reliefs where low-grade metamorphic rocks of the Sardinian Paleozoic basement mainly outcrop.
A high-productivity porous aquifer is hosted within the Holocene alluvium, which reaches a maximum thickness of 50 m; the aquifer is mostly phreatic in the western part of the plain, while moving eastward, the occurrence of silt and clay deposit intercalations, with variable extension and thickness, produce the local confinement of the aquifer [30]. Low-productivity aquifers are hosted within the Pleistocene alluvial deposits (gravel and sand cemented) and the metamorphic basement and can contribute to the lateral recharge of the alluvial aquifer.
2.2. Hydrogeological Surveys and Geochemical Campaigns
The hydrogeological monitoring activities were carried out between June 2020 and May 2021 to encompass an entire year and observe possible seasonal variations. These activities involved the monthly measurement of piezometric heads and the main physical-chemical parameters, namely electrical conductivity (EC), pH, and temperature, at approximately 80 points, including both surface- and groundwaters (Figure 2a). As some of these points included private wells, which were not always accessible, during certain campaigns, specific points were either not monitored or replaced by nearby points with similar characteristics. Two geochemical campaigns were conducted, one at the turn of September and October 2020 and one in June 2022. Sampling was typically performed in the dynamic parameter-stabilized mode following the low-flow methodology [31]. At selected sites, both static and dynamic sampling were conducted. Water samples were filtered in situ through polycarbonate filters with an all-plastic filtration assembly (Sartorius Stedim Biotech GmbH, Geottinger, Germany) at 0.22 µm for major ions and isotopes and at 0.45 µm for metals. After filtration, samples for metal analyses were acidified with 1% HNO3 (68% Suprapur, Carlo Erba reagents srl Cornaredo (MI), Cornaredo, Italy), while those for δ34SSO4 δ18OSO4, were acidified with HCl (35% Suprapur Carlo Erba, 2 mL in 1 L of sample). At each sampling site, measurements were taken for temperature (Checktemp Dip, Hanna instruments©, Woonsocket, RI, USA), pH (Thermo scientificTM OrionTM, Ross pH electrode, Waltham, MA, USA), Eh (oxidation-reduction potential, Thermo scientificTM OrionTM), alkalinity (AF microdosimeter, AFGTC, San Giuliano Terme (PI), Italy), dissolved oxygen (Oxygen Kit, Carlo Erba Idrimeter), and conductivity (Cond 315i WTW GmbH, Weilheim, Germany). The Eh was measured using a platinum electrode, and the value was corrected against Zobell’s solution [32]. Alkalinity was determined by acidimetric titration using methyl orange (as an indicator, Merck KGaA, Darmstadt, Germany) and expressed as bicarbonate ion (HCO3−), as CO32− was consistently undetectable, and the contribution of non-carbonate species was negligible.

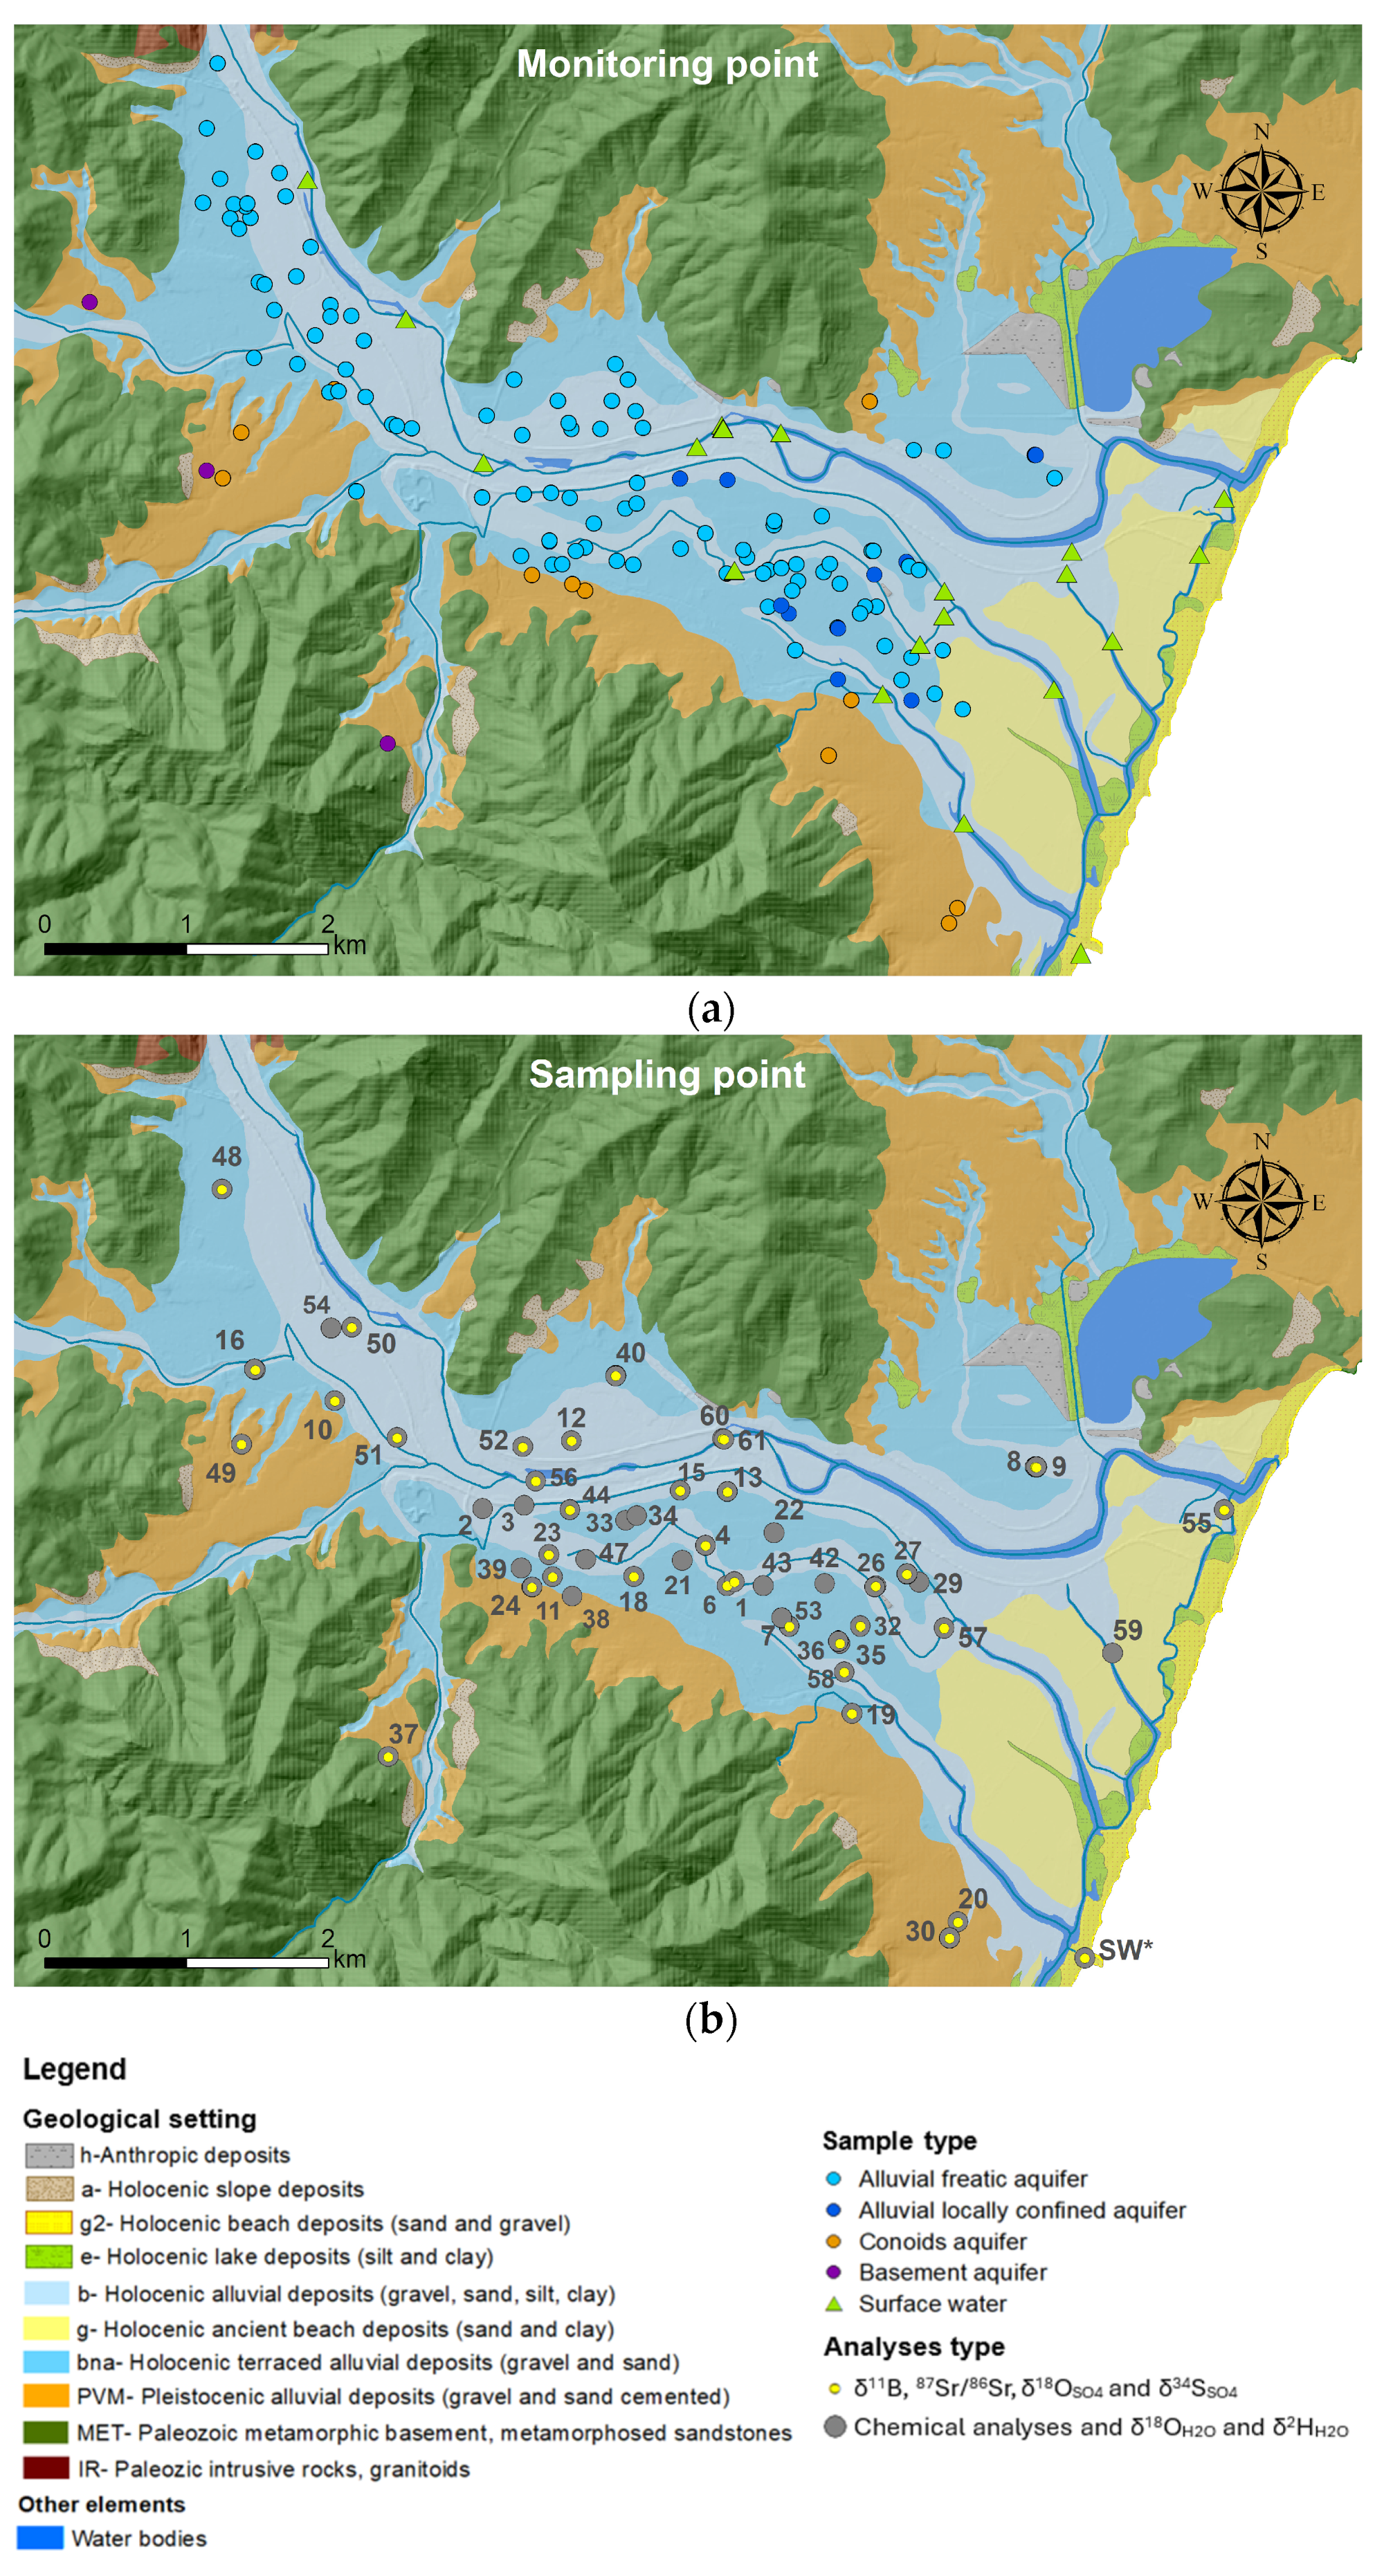
Figure 2.
Location of points monitored for one year of monthly hydrogeological surveys (a) and points sampled during the two campaigns for geochemical and isotope characterization (b).
Based on the geometry of the Muravera aquifer [30], the possible sources of recharging (like rivers and lateral aquifer), and results from the hydrogeological monitoring, a total of 53 water points were selected for geochemical and isotope investigations in 2020, comprising the following:
- A total of 44 groundwater samples were collected from various aquifers: 30 from the alluvial phreatic aquifer, 10 from the alluvial semiconfined aquifer, 1 from the metamorphic basement, and 4 from the Pleistocene alluvial aquifer. The latter were selected to identify potential sources of lateral recharge to the plain.
- A total of 9 surface water samples, including 7 from the Flumendosa River and the Foxi, 1 from the mouth of the S. Giovanni fishpond (where lagoon waters mix with seawater, named SW*), and 1 from the discharge of the urban sewage treatment plant (sample 1). The latter was collected to assess possible recharge to the alluvial aquifer.
A total of 15 points were sampled in 2022, 13 of which had already been sampled in both 2020 and 2022, with 6 of these being sampled both statically and dynamically (points 7, 8, 9, 26, 36, and 44), resulting in a total of 74 samples.
All the samples underwent analysis for chemicals and δ18OH2O and δ2HH2O analyses (Figure 2b).
Additionally, δ11B, δ18OSO4 and δ34SSO4, and 87Sr/86Sr were analyzed at 38 selected water sampling points (Figure 2):
- In total, 30 groundwater samples were collected from the Holocene alluvial phreatic and semi-confined aquifers (25 samples), Pleistocene alluvial aquifer (4 samples), and metamorphic basement (1 sample).
- In total, 8 surface water samples were collected from the Flumendosa River (6 samples), the discharge of the sewage treatment plant (1 sample), and the SW* (1 sample).
Details on analytical methods and laboratories are shown in Table 1. For δ34SSO4 and δ18OSO4 analyses, dissolved SO42− was precipitated as BaSO4 by adding BaCl2·2H2O after acidifying the sample with HCl and boiling it to prevent BaCO3 precipitation, following standard methods [33].

Table 1.
Methodologies used for the analyses. ICP-OES (Optical Emission Spectrometry); IC (Ionic Chromatography), ICP-MS (Mass Spectrometry), MC-ICP-MS (Multiple Collector Inductively Coupled Plasma Mass Spectrometry), EA-IRMS (Elemental Analyzer Isotope Ratio Mass Spectrometry) and High Temperature Conversion EA-IRMS (TC-EA-IRMS).
To ensure high analytical quality, nearly all chemical elements, including major ions and those crucial for defining seawater intrusion processes, such as boron, strontium, and bromine, were determined using multiple techniques. The analytical goodness of the performed analyses was assessed through the ionic balance, precision, and accuracy. The ionic balance consistently fell within the range of ±5%; both precision and accuracy were estimated at 15% or better, using randomly duplicate samples and a standard reference solution (EnviroMAT™ EP-L-3, Baie D’Urfé, Quebec, QC, Canada). For the strontium isotope, values were adjusted based on the measured mean value for the SRM NIST 987 standard (Gaithersburg, MD, USA) with reference to the 87Sr/86Sr value of 0.710248 [34]. The effect of instrumental fractionation on the 11B/10B ratio of the samples was corrected using the bracketing method (sequence: blank-standard-blank-sample-blank-standard-blank). Analytical errors, calculated from randomly duplicate samples or using international and internal laboratory standards, were as follows: 0.1‰ for δ2H, 0.05‰ for δ18OH2O, 2 × 10⁻⁵‰ for 87Sr/86Sr; 0.05‰ for δ11B, 0.2‰ for δ34SSO4, and 0.5‰ for δ18OSO4. Isotopic results were expressed in terms of δ [35] relative to the international standard Vienna Standard Mean Oceanic Water (V-SMOW) for δ2H, δ18OH2O, δ18OSO4; the Vienna Canyon Diablo Troilite (V-CDT) for δ34S; and NBS951 for δ11B.
3. Results and Discussion
3.1. Hydrogeological Survey
In the alluvial aquifer, piezometric heads gently decreased from approximately 8 m asl in the north-western part of the plain towards the sea with a medium gradient of 1‰. In the Pleistocene alluvial aquifer, the hydraulic gradient is much steeper (13‰) and reached values of 18 m asl (Figure 3).
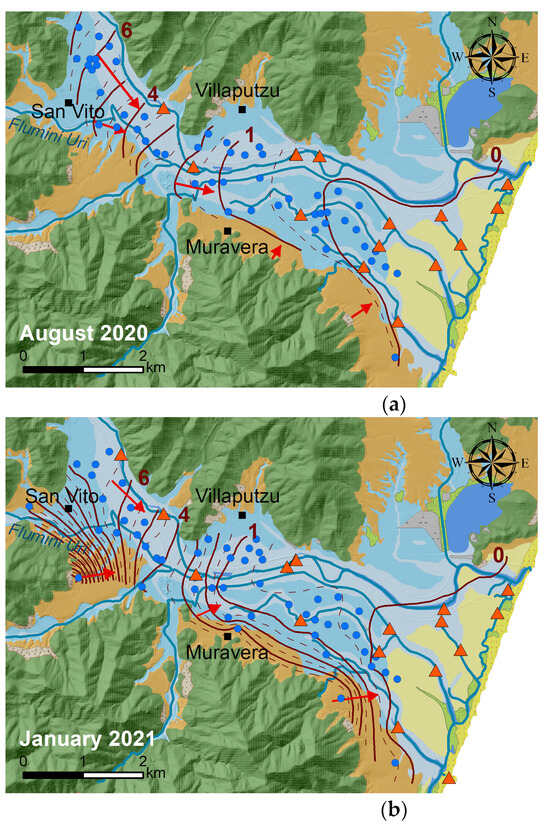
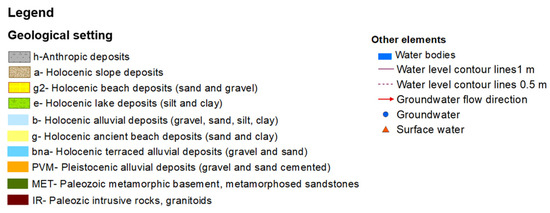
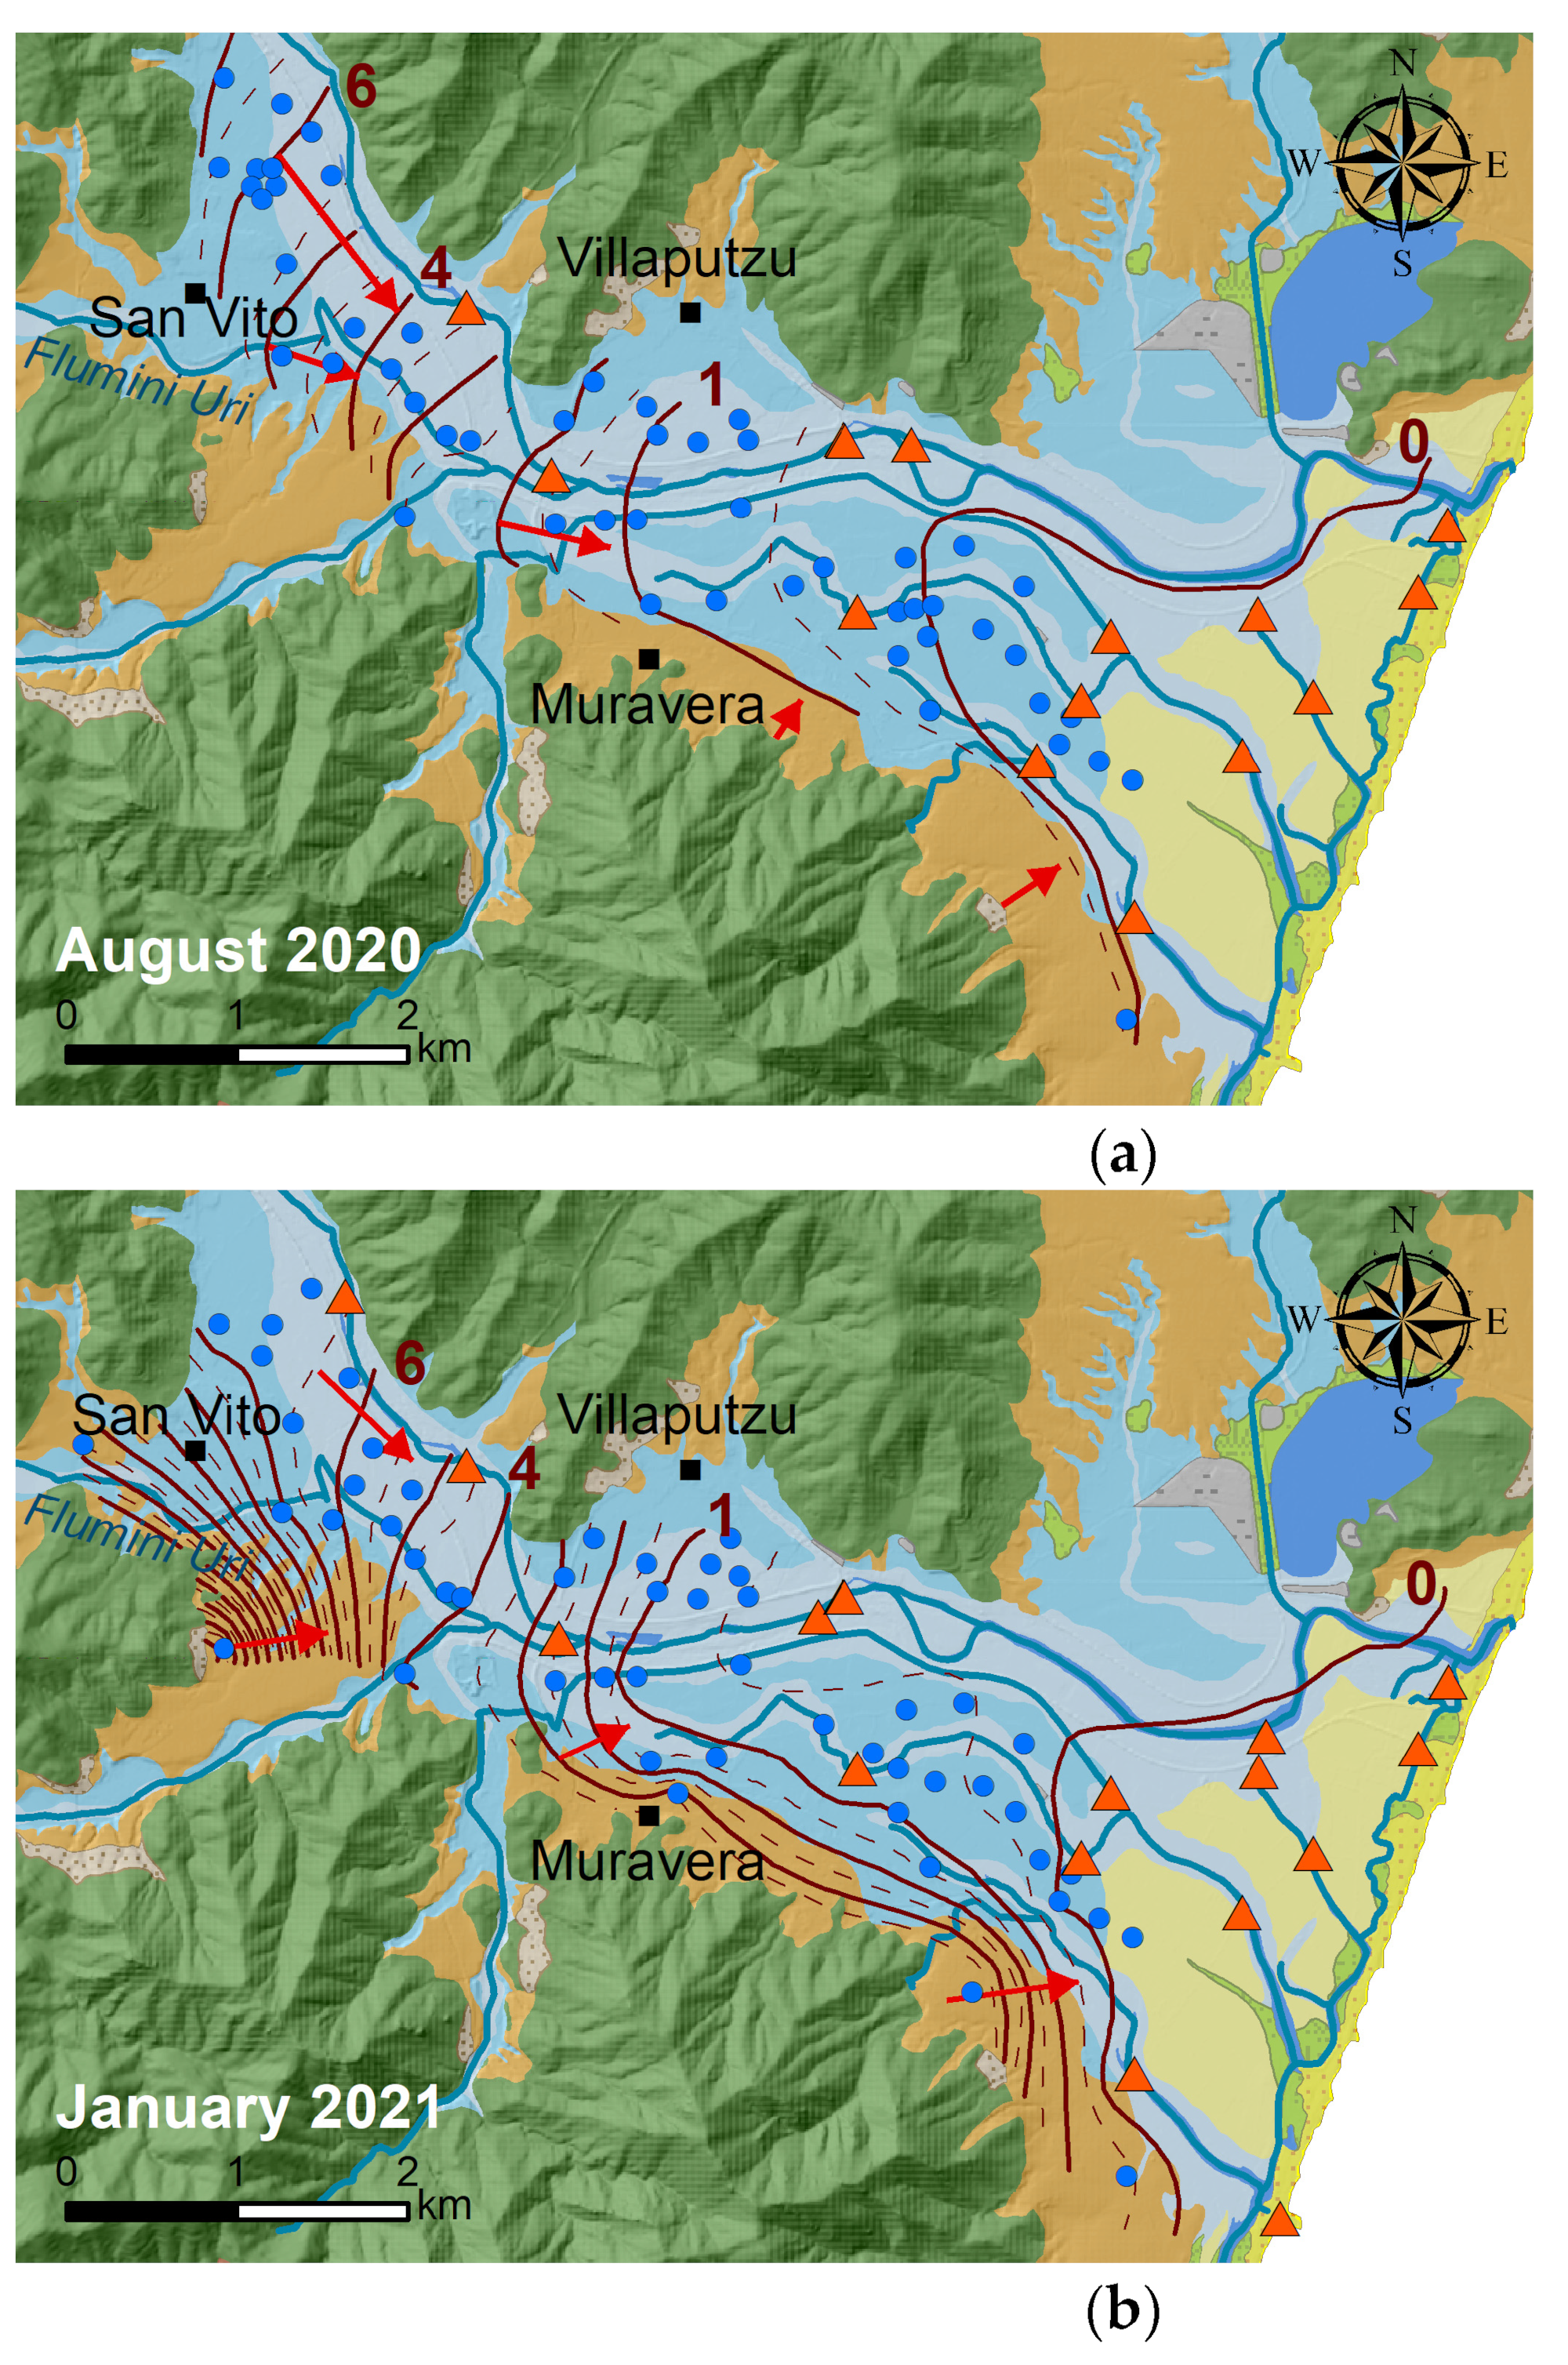
Figure 3.
Comparison of piezometric contour lines in the summer ((a), August 2020) and winter ((b), January 2021). The numbers in the figure represent the piezometric level in m a.s.l.
Interactions between the Flumendosa River and groundwater vary along the plain. Figure 3 shows that in the north-western part, the Flumendosa River is drained by the aquifer, while in the central part of the plain, downstream of Villaputzu village, the trend is reversed, and the aquifer is drained by the Flumendosa River. Recharge from the Flumini Uri River to the aquifer is also observed. The water table’s zero level is approximately 2 km from the inland shoreline during the winter. In the summer, the piezometric head decreases by about 1.5 m across the entire plain, and the zero level moves inland by about 1 km.
In groundwater, the EC varies from a value of 0.2 mS/cm approximately 8 km inland, near Flumini Uri River (refer to Figure 4), to a maximum value of 23 mS/cm close to the coastline. Along the Flumendosa River, EC in the surface water increases from about 0.6 mS/cm upstream, close to the San Vito village, to 17 mS/cm downstream at the river mouth. Near the coast, the conductivity of surface water significantly increases, distinguishing itself from groundwater. Surface waters exhibit much higher EC values compared to groundwater, ranging from 54 mS/cm at the fishpond (SW*) to about 30 mS/cm in the Foxi channels and Sa Praia Pond. Small seasonal variations in EC values were observed for both surface- and groundwater (Figure 4).
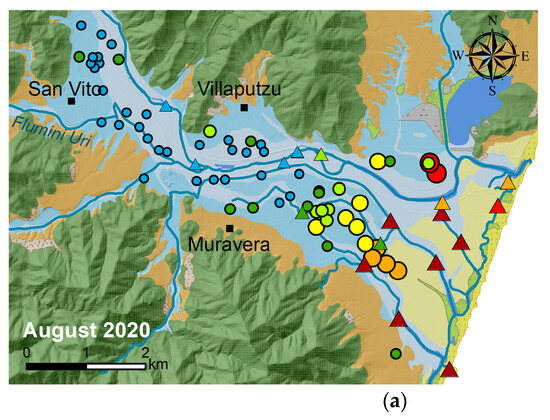
Figure 4.
Comparison between EC values measured at monitoring points in August 2020 (a) and January 2021 (b).
3.2. Water Chemistry
All the samples were classified according to the Piper diagram presented in Figure 5.
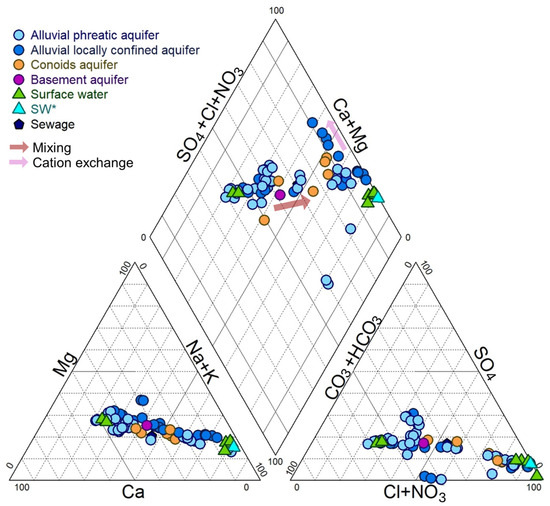
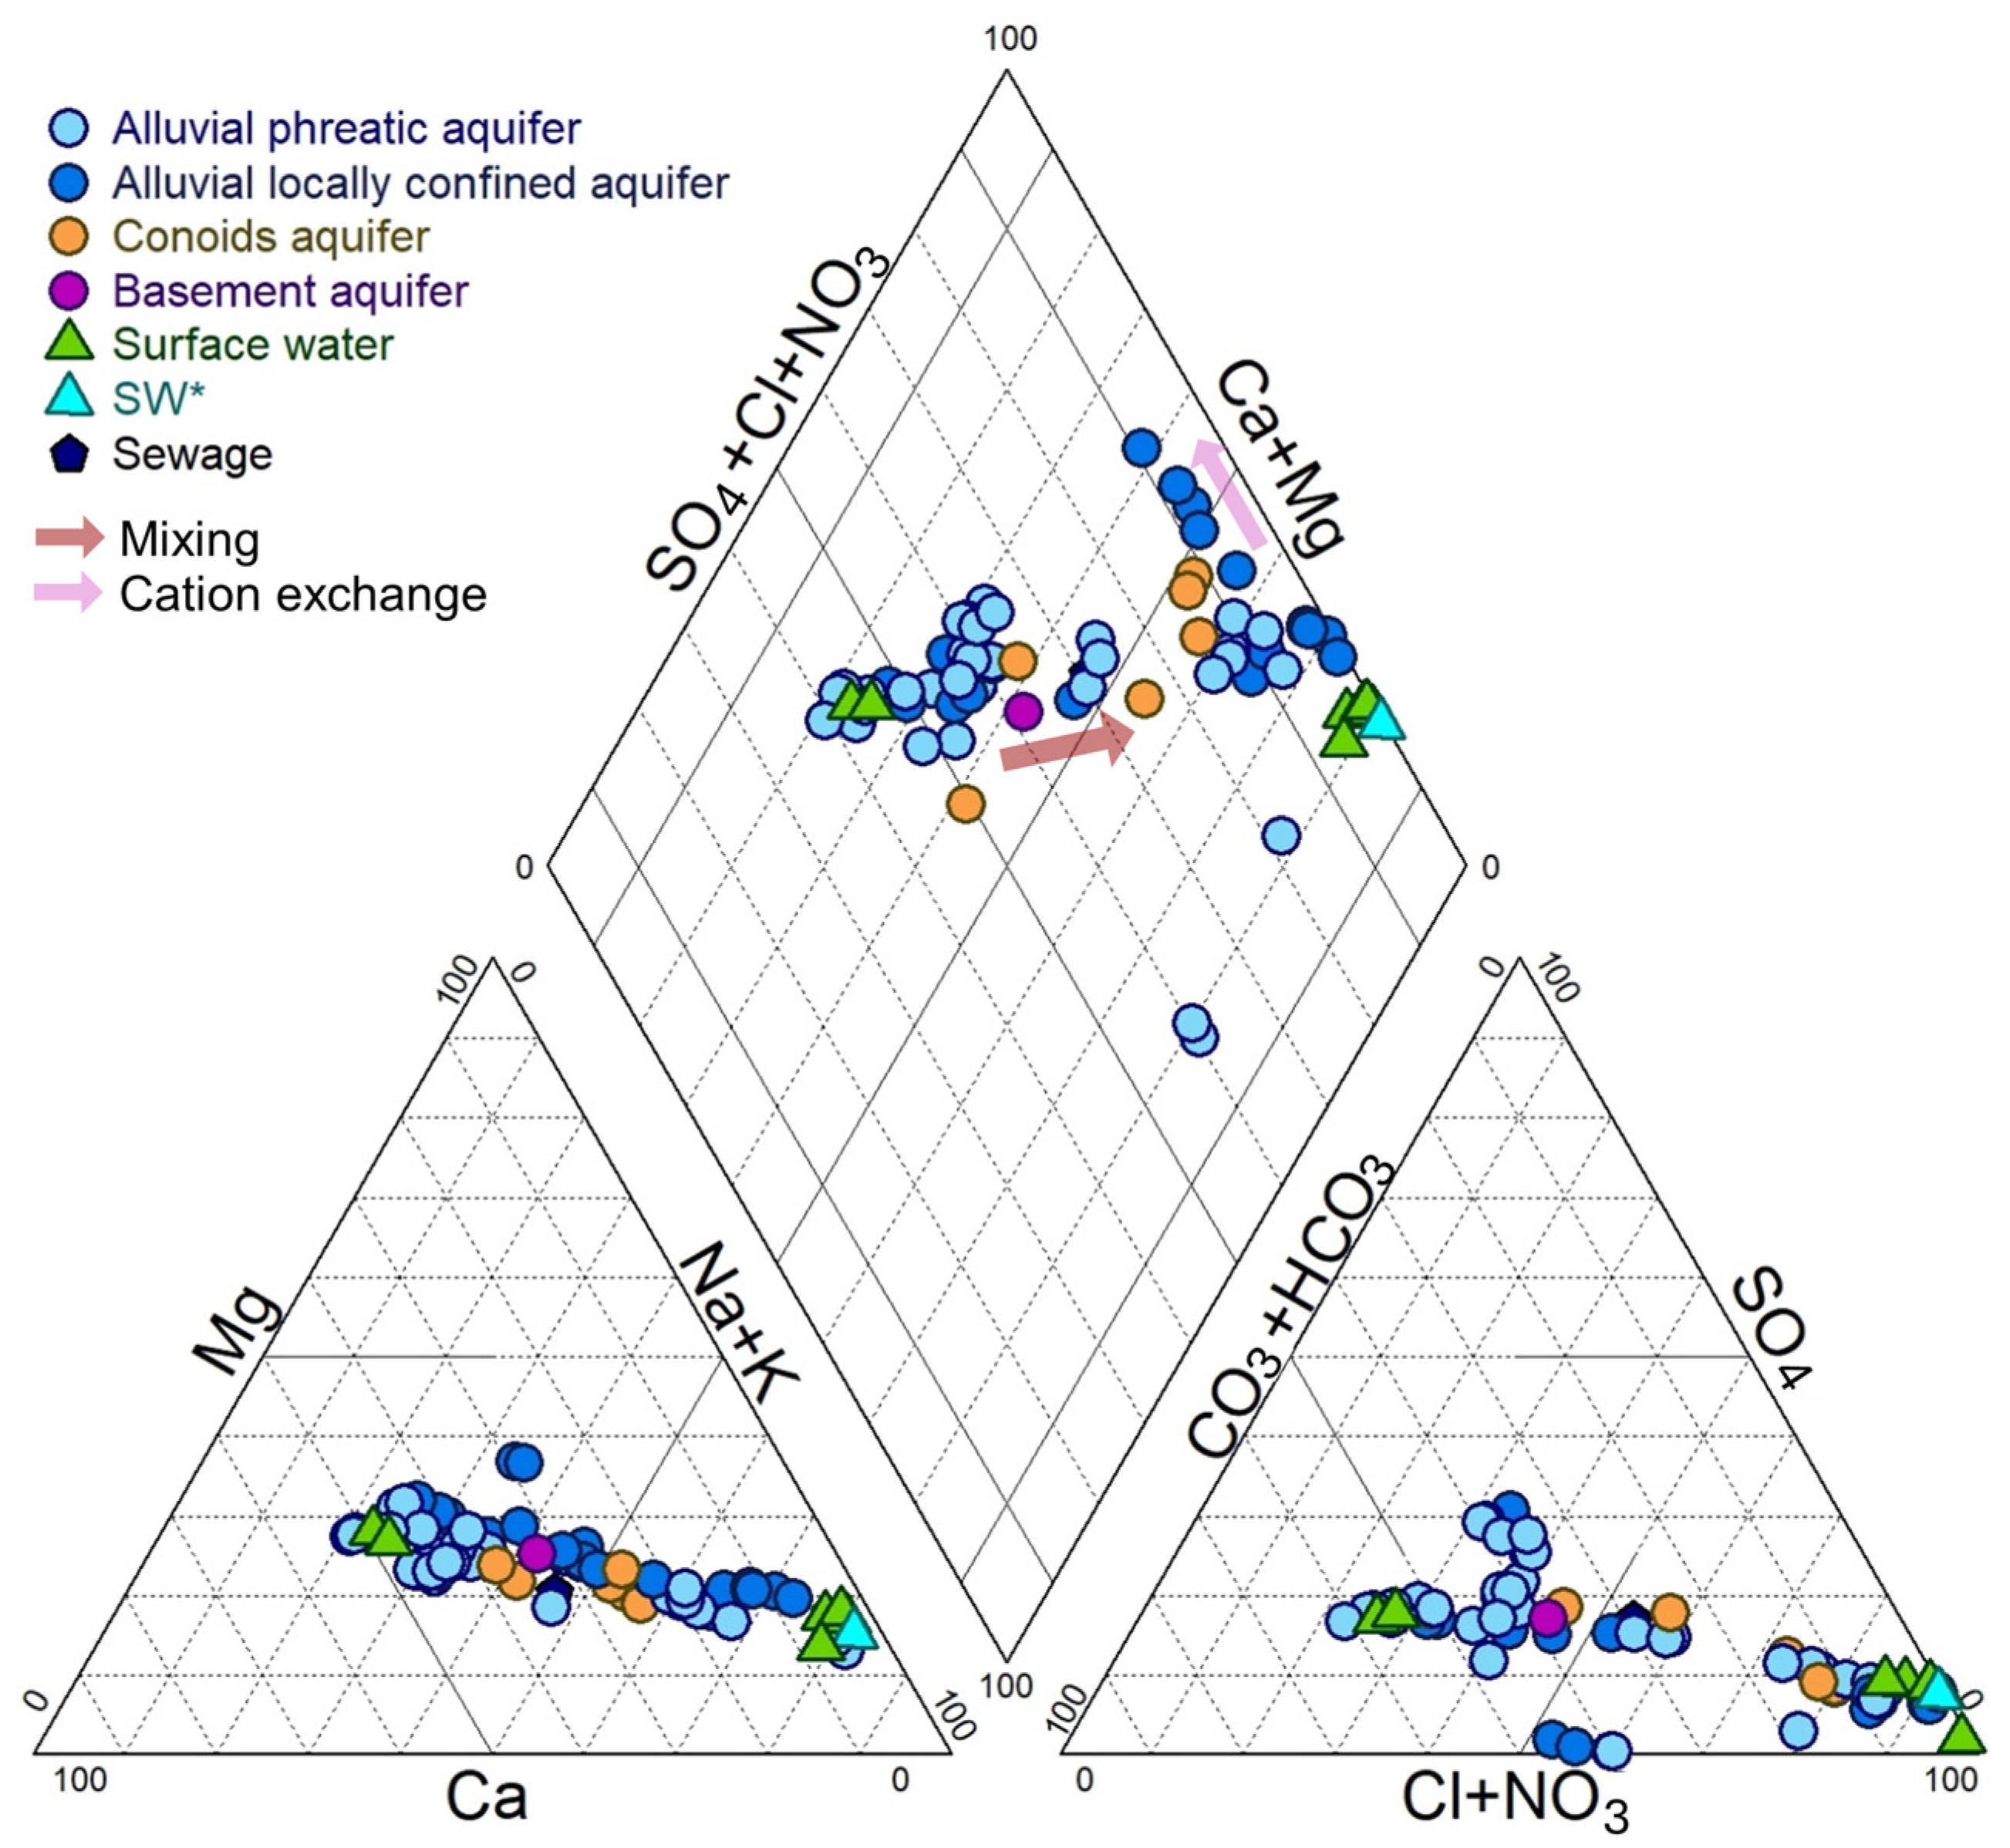
Figure 5.
Piper diagram for the collected water samples in September/October 2020 and June 2022. (SW* S. Giovanni fishpond where lagoon waters mix with seawater).
The water chemistry of the Muravera Plain is regulated by different processes distinctive of saline intrusion (e.g., cation exchange, mixing). The more saline waters exhibited a sodium-chloride to calcium-chloride composition, while the less saline waters showed a bicarbonate-calcium to bicarbonate-calcium chloride character, with a weak sulfate contribution. Based on the chemical composition and the EC values of the samples, three groups of water were identified:
- Group 1: Very salty waters: waters with Na-Cl composition and EC values higher than 10 mS/cm, indicating significant salinization processes.
- Group 2: Brackish waters: groundwater samples with a Na-Cl composition and EC ranging from 2 to 10 mS/cm. These samples were collected approximately 2 to 4 km from the coast.
- Group 3: Freshwater: waters with an HCO3-Ca composition and EC values lower than 0.8 mS/cm.
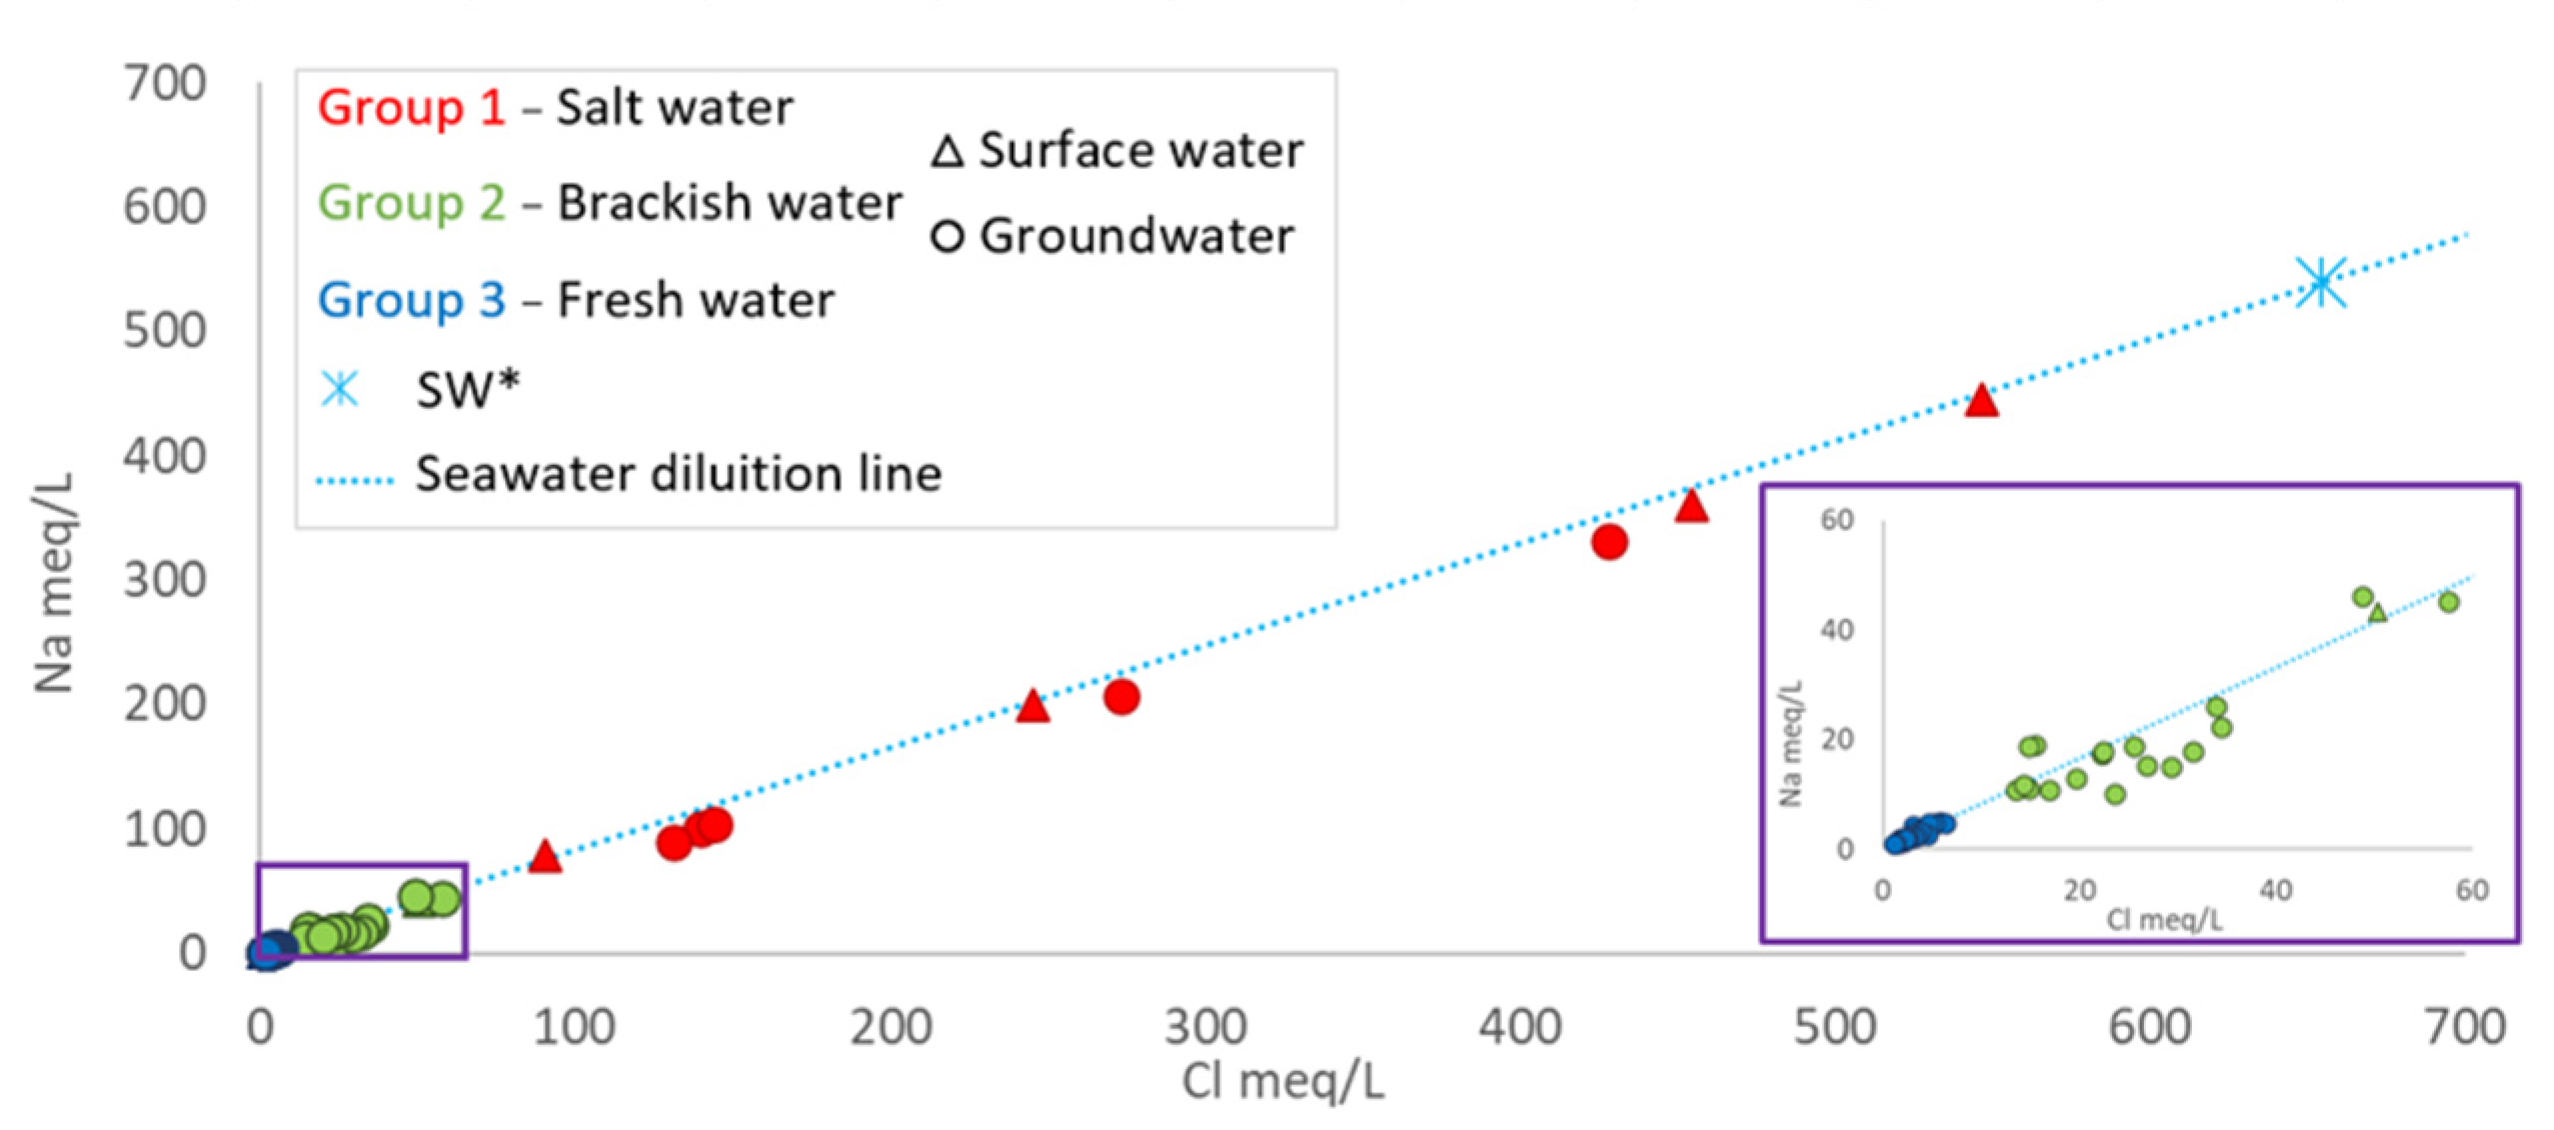
The summary statistics of selected elements for samples considered in this study are reported in Table 2 and in Table S1. The groundwater pH generally tended to be neutral, ranging from slightly acidic in freshwater to slightly alkaline in saline and brackish waters. Surface waters typically exhibited a higher alkaline pH, except when influenced by fresh groundwater, which can result in a slight acidity (i.e., sample 56). The redox potential and dissolved oxygen levels in surface waters indicated oxidation to transitional conditions, reflecting an oxygenated environment. Conversely, groundwater often exhibits more reducing conditions, especially in deep wells. Regarding chemical components, most of the samples exhibited a Na-Cl ratio that closely resembled that of seawater (Figure 6). However, the brackish waters (Group 2) deviated from this trend, appearing more dispersed around the seawater dilution line, implying a secondary process in addition to simple binary mixing.
Table 2.
Summary statistics for samples collected in the Muravera plain.
Seawater intrusion into the aquifer can result in Na depletion due to cation exchange [36,37] while freshening and/or calcite dissolution can control Ca enrichment. Carbonate dissolution may occur in a mixing zone despite both the freshwater and seawater end members being saturated with carbonates [38]. All the waters considered in this study were found to be undersaturated with respect to gypsum. Almost all of the Group 1 samples were undersaturated in calcite, while Group 2 samples were undersaturated in samples collected from the Pleistocene alluvial aquifer and shallow wells but were at equilibrium or oversaturated in deep wells. Group 3 was consistently oversaturated with respect to calcite.

Figure 6.
Na vs. Cl. The seawater dilution line is derived from the chemical composition of local Sardinian seawater [39]. (SW*, S. Giovanni fishpond, where lagoon waters mix with seawater).
Figure 6.
Na vs. Cl. The seawater dilution line is derived from the chemical composition of local Sardinian seawater [39]. (SW*, S. Giovanni fishpond, where lagoon waters mix with seawater).
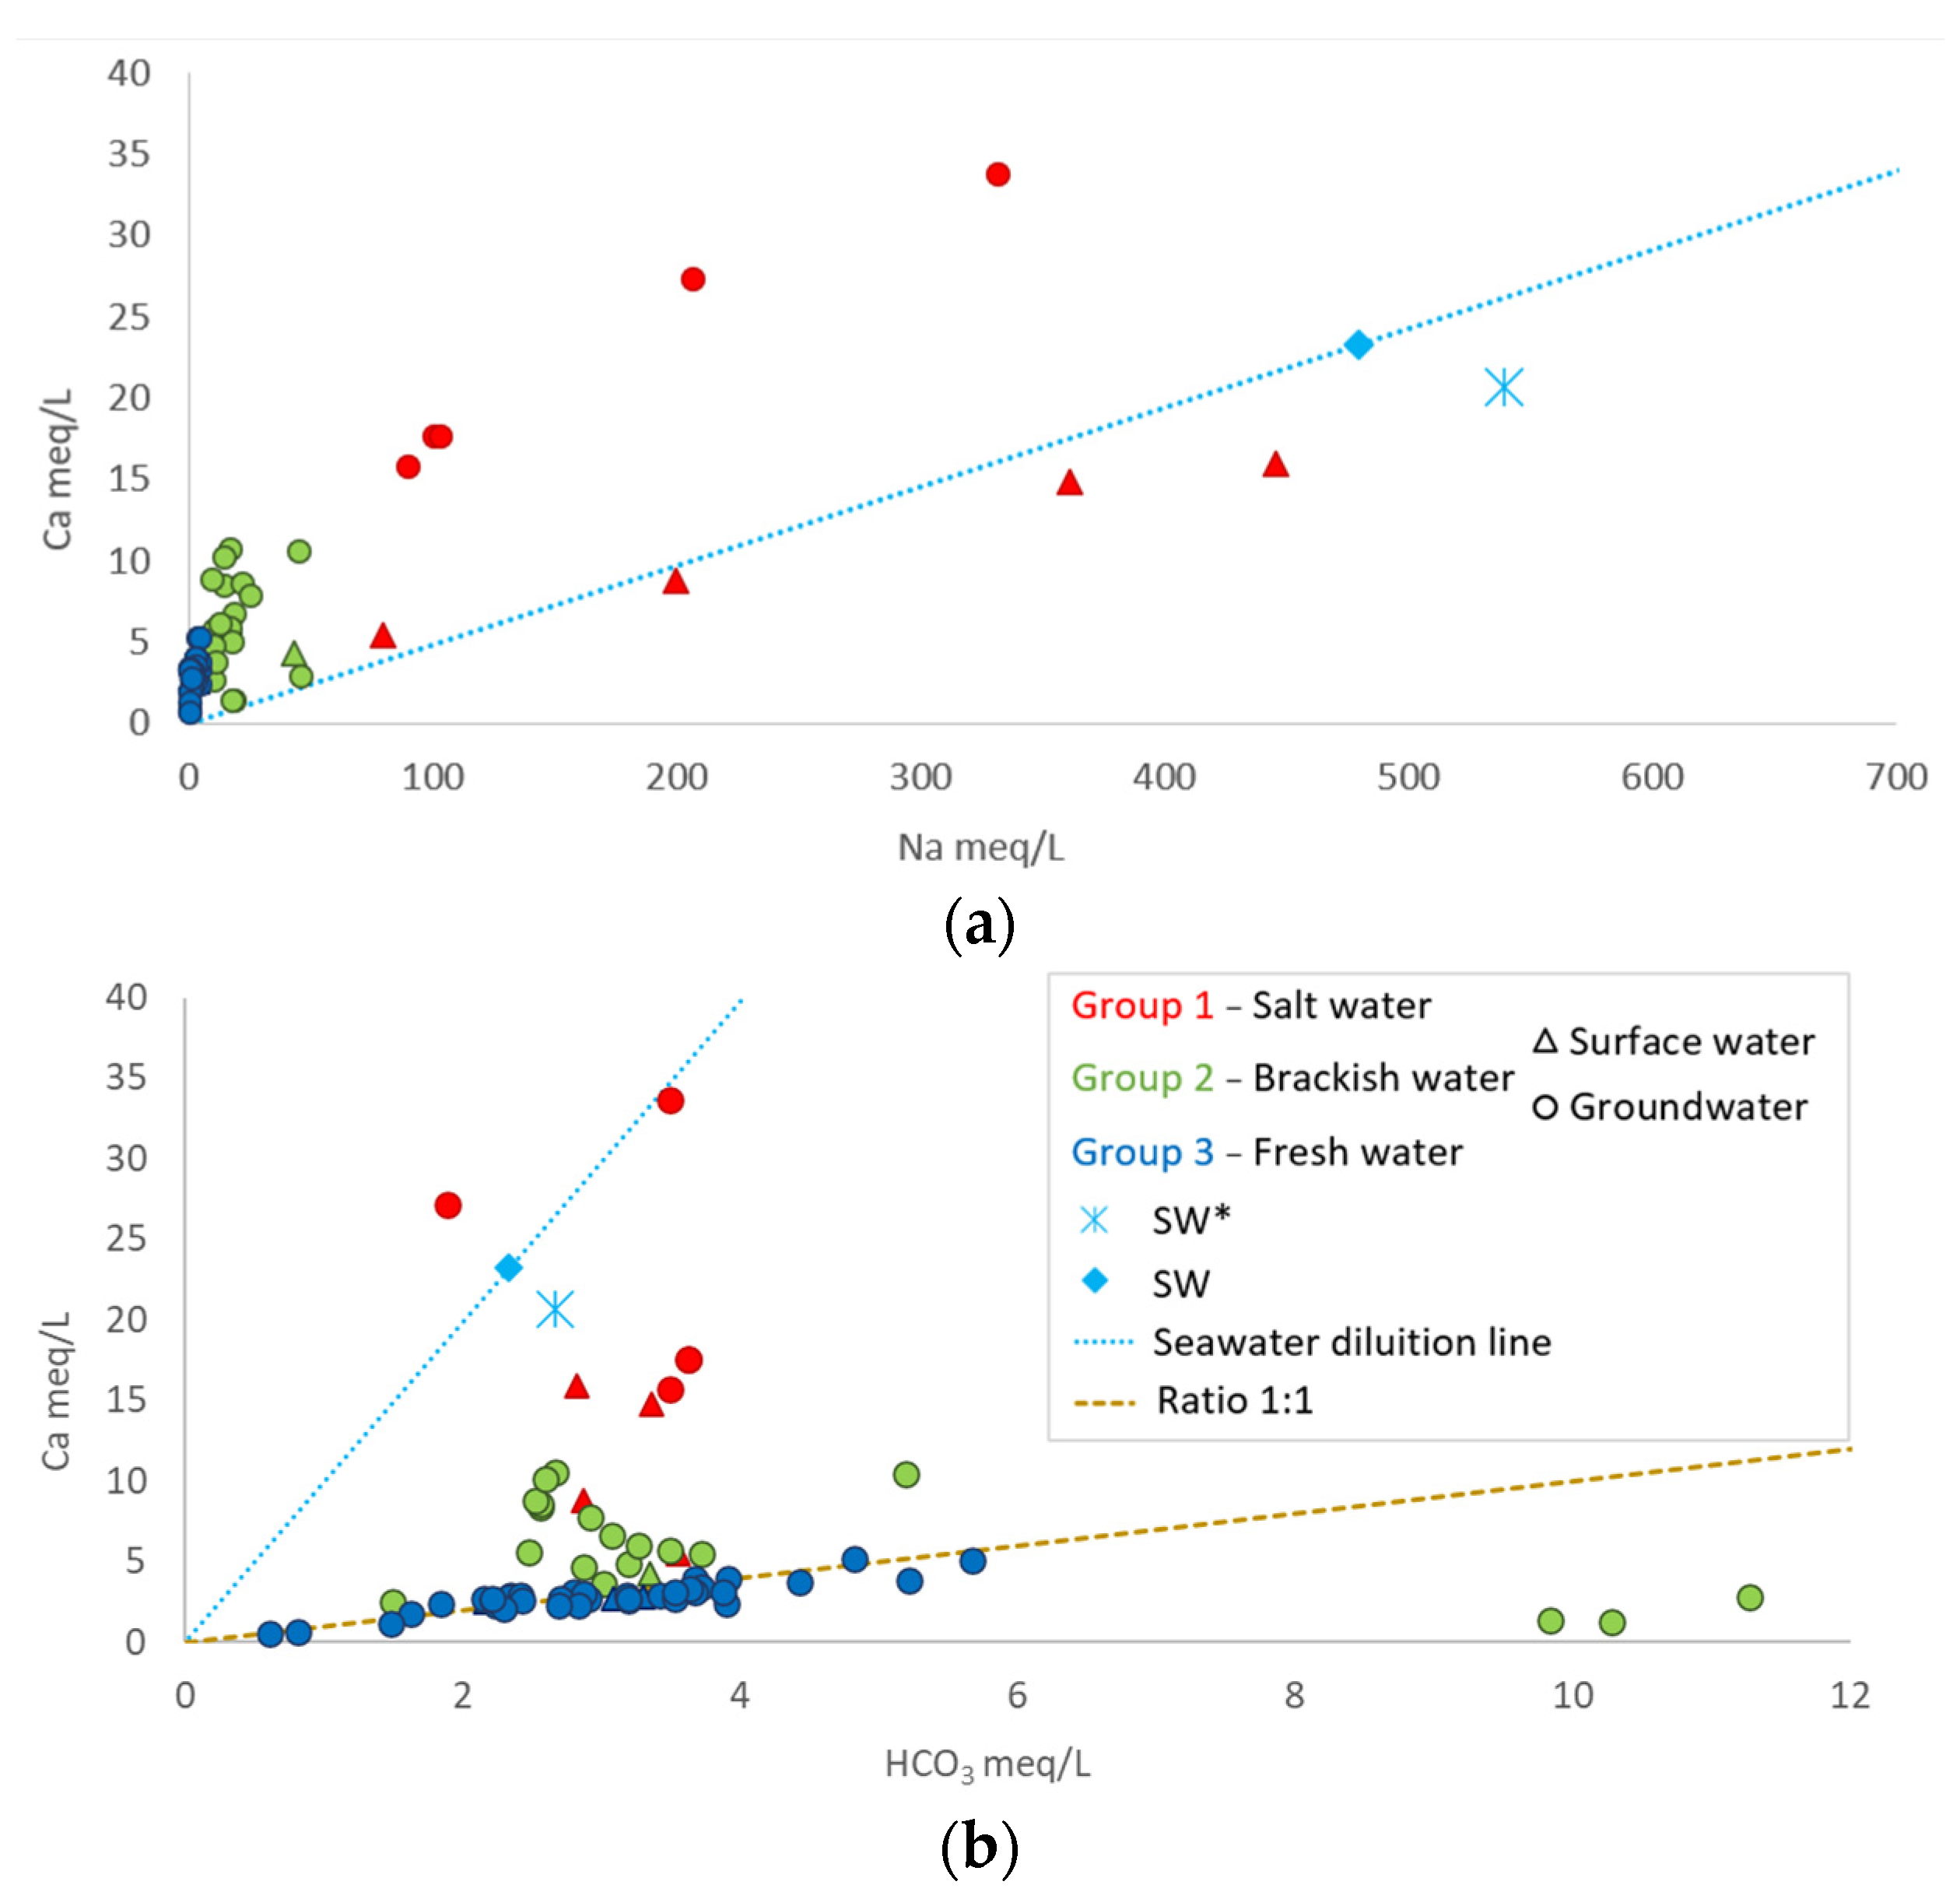
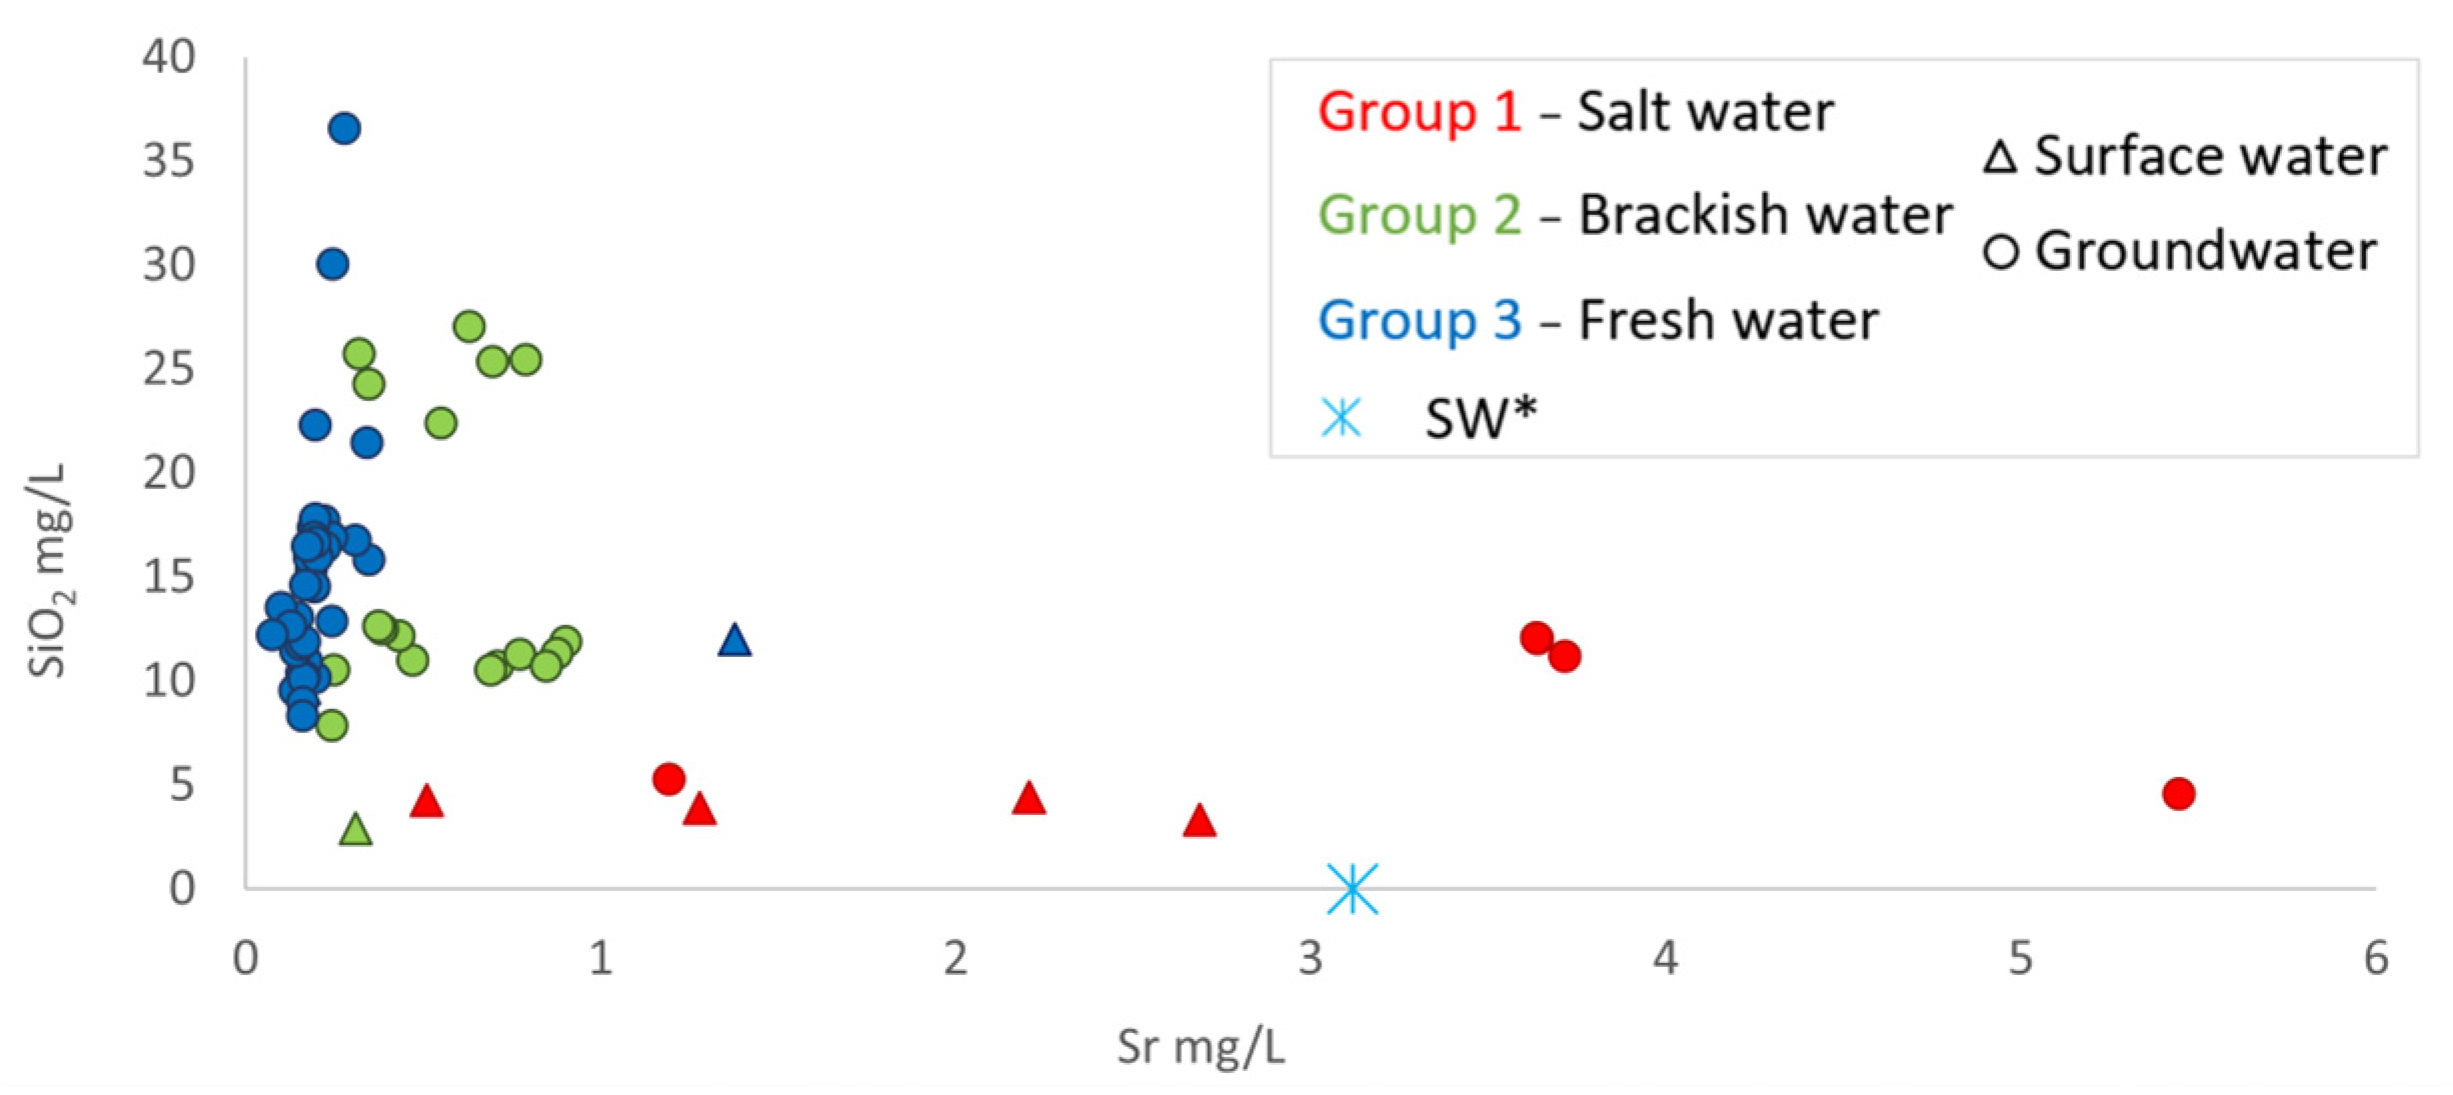
The same processes are evident in the Ca vs. Na graph (Figure 7a), where different trends are recognized. The first trend is observed in surface water, where increasing salinity (Group 1, in red in Figure 7) leads to an increase in the Na/Ca ratio compared to the seawater dilution line. Both the Foxi surface water (Group 1) and SW* sample follow this trend, indicating a simple mixing process. On the other hand, the groundwater of Group 1 follows a different trend, with a lower Na/Ca compared to seawater. This behavior may be attributed to the Ca-Na cation exchange processes, resulting from water interactions with the clayey matrix of the aquifer and facilitated by long interaction times. The SiO2 vs. Sr graph in Figure 8, in fact, shows that groundwater samples in Group 1 have higher concentrations of both strontium and silica than seawater, which can be explained by prolonged water–rock interaction times. The groundwater for Group 2 and Group 3 had relatively consistent sodium concentrations, while calcium concentrations increased more rapidly. In freshwater samples (Group 3), the equivalent Ca-HCO3 ratio was very close to one, suggesting that calcite may be the source of Ca in these waters. However, for saline and brackish waters, HCO3 concentrations appeared to be controlled, highlighting the occurrence of exchange processes (Figure 7b).
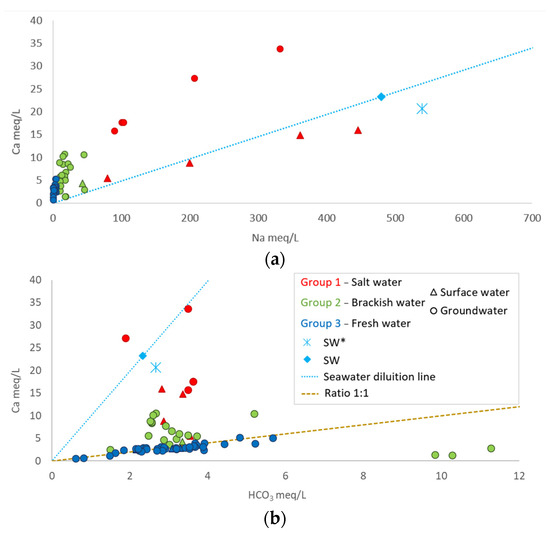
Figure 7.
(a): Ca vs. Na; (b): Ca vs. HCO3 (SW: Sardinian local seawater from [39]; SW*, S. Giovanni fishpond where lagoon waters mix with seawater).

Figure 8.
SiO2 vs. Sr (SW*, S. Giovanni fishpond where lagoon waters mix with seawater).
3.3. Isotopic Composition
Stables isotopes in the groundwater system (Table 3) vary between −7.3 and 1.4‰ for δ18O and between −42.3 and −8‰ for δ2H. Surface waters show values ranging from −5.5 e 0.15 and −30 δ18O and 1.0 for δ2H. The SW* sample presents a δ18O = 0.9‰ and δ2H = 6.5‰, reflecting a slight evaporation from the local seawater signature (δ18O = 0.6 and δ2H 4‰, [40]), which is in agreement with other Mediterranean lagoon values [37,41]. According to the δ18O—δ2H isotopes data shown in Figure 9, most of the samples follow the SIMWL (Southern Italy Meteoric Water Line [42]) and the GMWL (Global Meteoric Water Line [43]), proving the meteoric origin of the recharging water. Some samples in Group 1 have isotopic values that can be correlated with a mixing process between freshwater and lagoon water (namely SW*).
Table 3.
Results of isotope analyses; USD—urban sewage treatment plant discharges; gw—groundwater, sw—surface water.
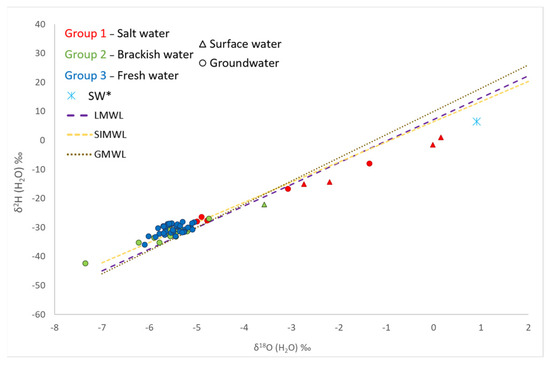
Figure 9.
δ2HH2O vs. δ18OH2O.
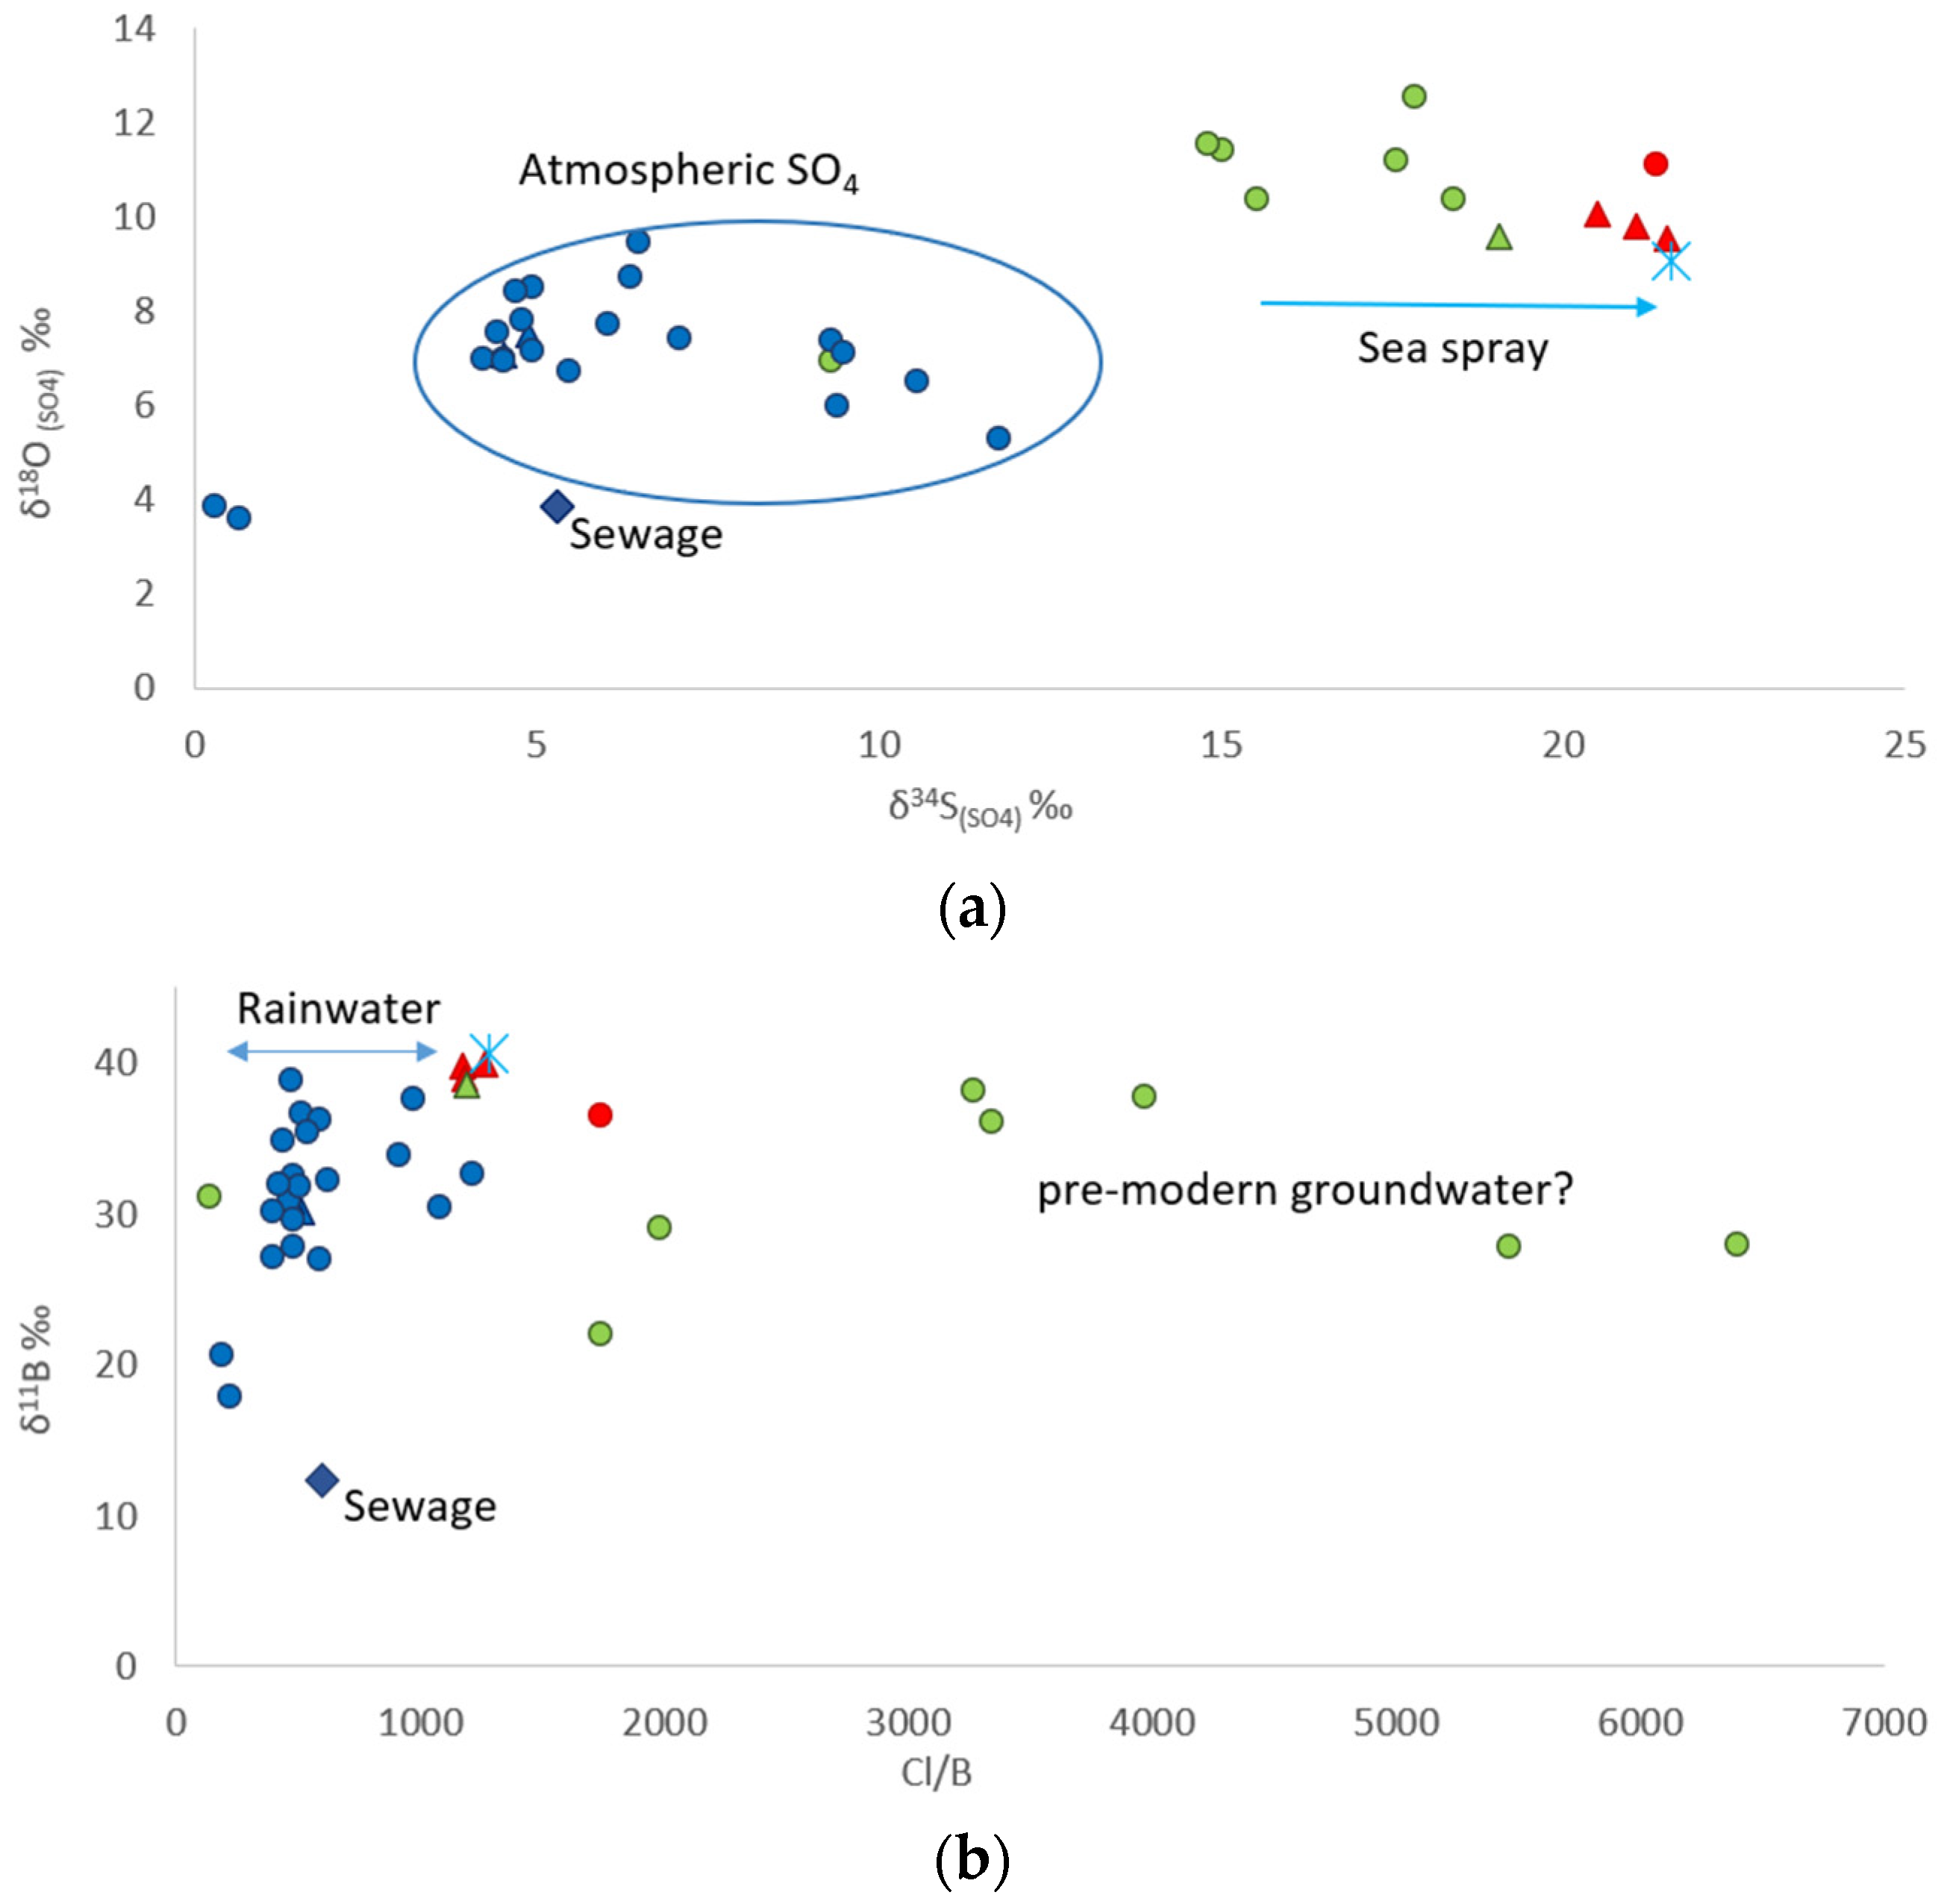
The predominantly meteoric origin of the water, as well as the salinization processes due to seawater intrusion, were confirmed by the isotopic results of sulfate (Figure 10a) and boron (Figure 10b). The following two main groupings were observed: one aligned with a meteoric-type sulfate origin, and a second group appeared to align toward the seawater isotopic signature, consistent with seawater intrusion processes [44].

Figure 10.
(a): δ18OSO4 vs. δ34SSO4, (b): δ11B vs. Cl/B. Legend is presented in Figure 9.
The δ11B ranges from 12.30‰ in the water sample from the sewage treatment plant (Figure 10b) to 40.65‰ in sample SW*. The isotopic composition of boron confirms what has been described so far in Figure 10b. Some samples have higher Cl/B ratios than seawater with δ11B near 40‰. In this case, salinization could result from mixing with less young groundwater that has evaporated and evolved, leading to higher Cl/B ratios [45].
Moreover, according to the δ11B and δ18OSO4 and δ34SSO4, a possible significant recharge from the sewage treatment plant to the alluvial aquifer was ruled out.
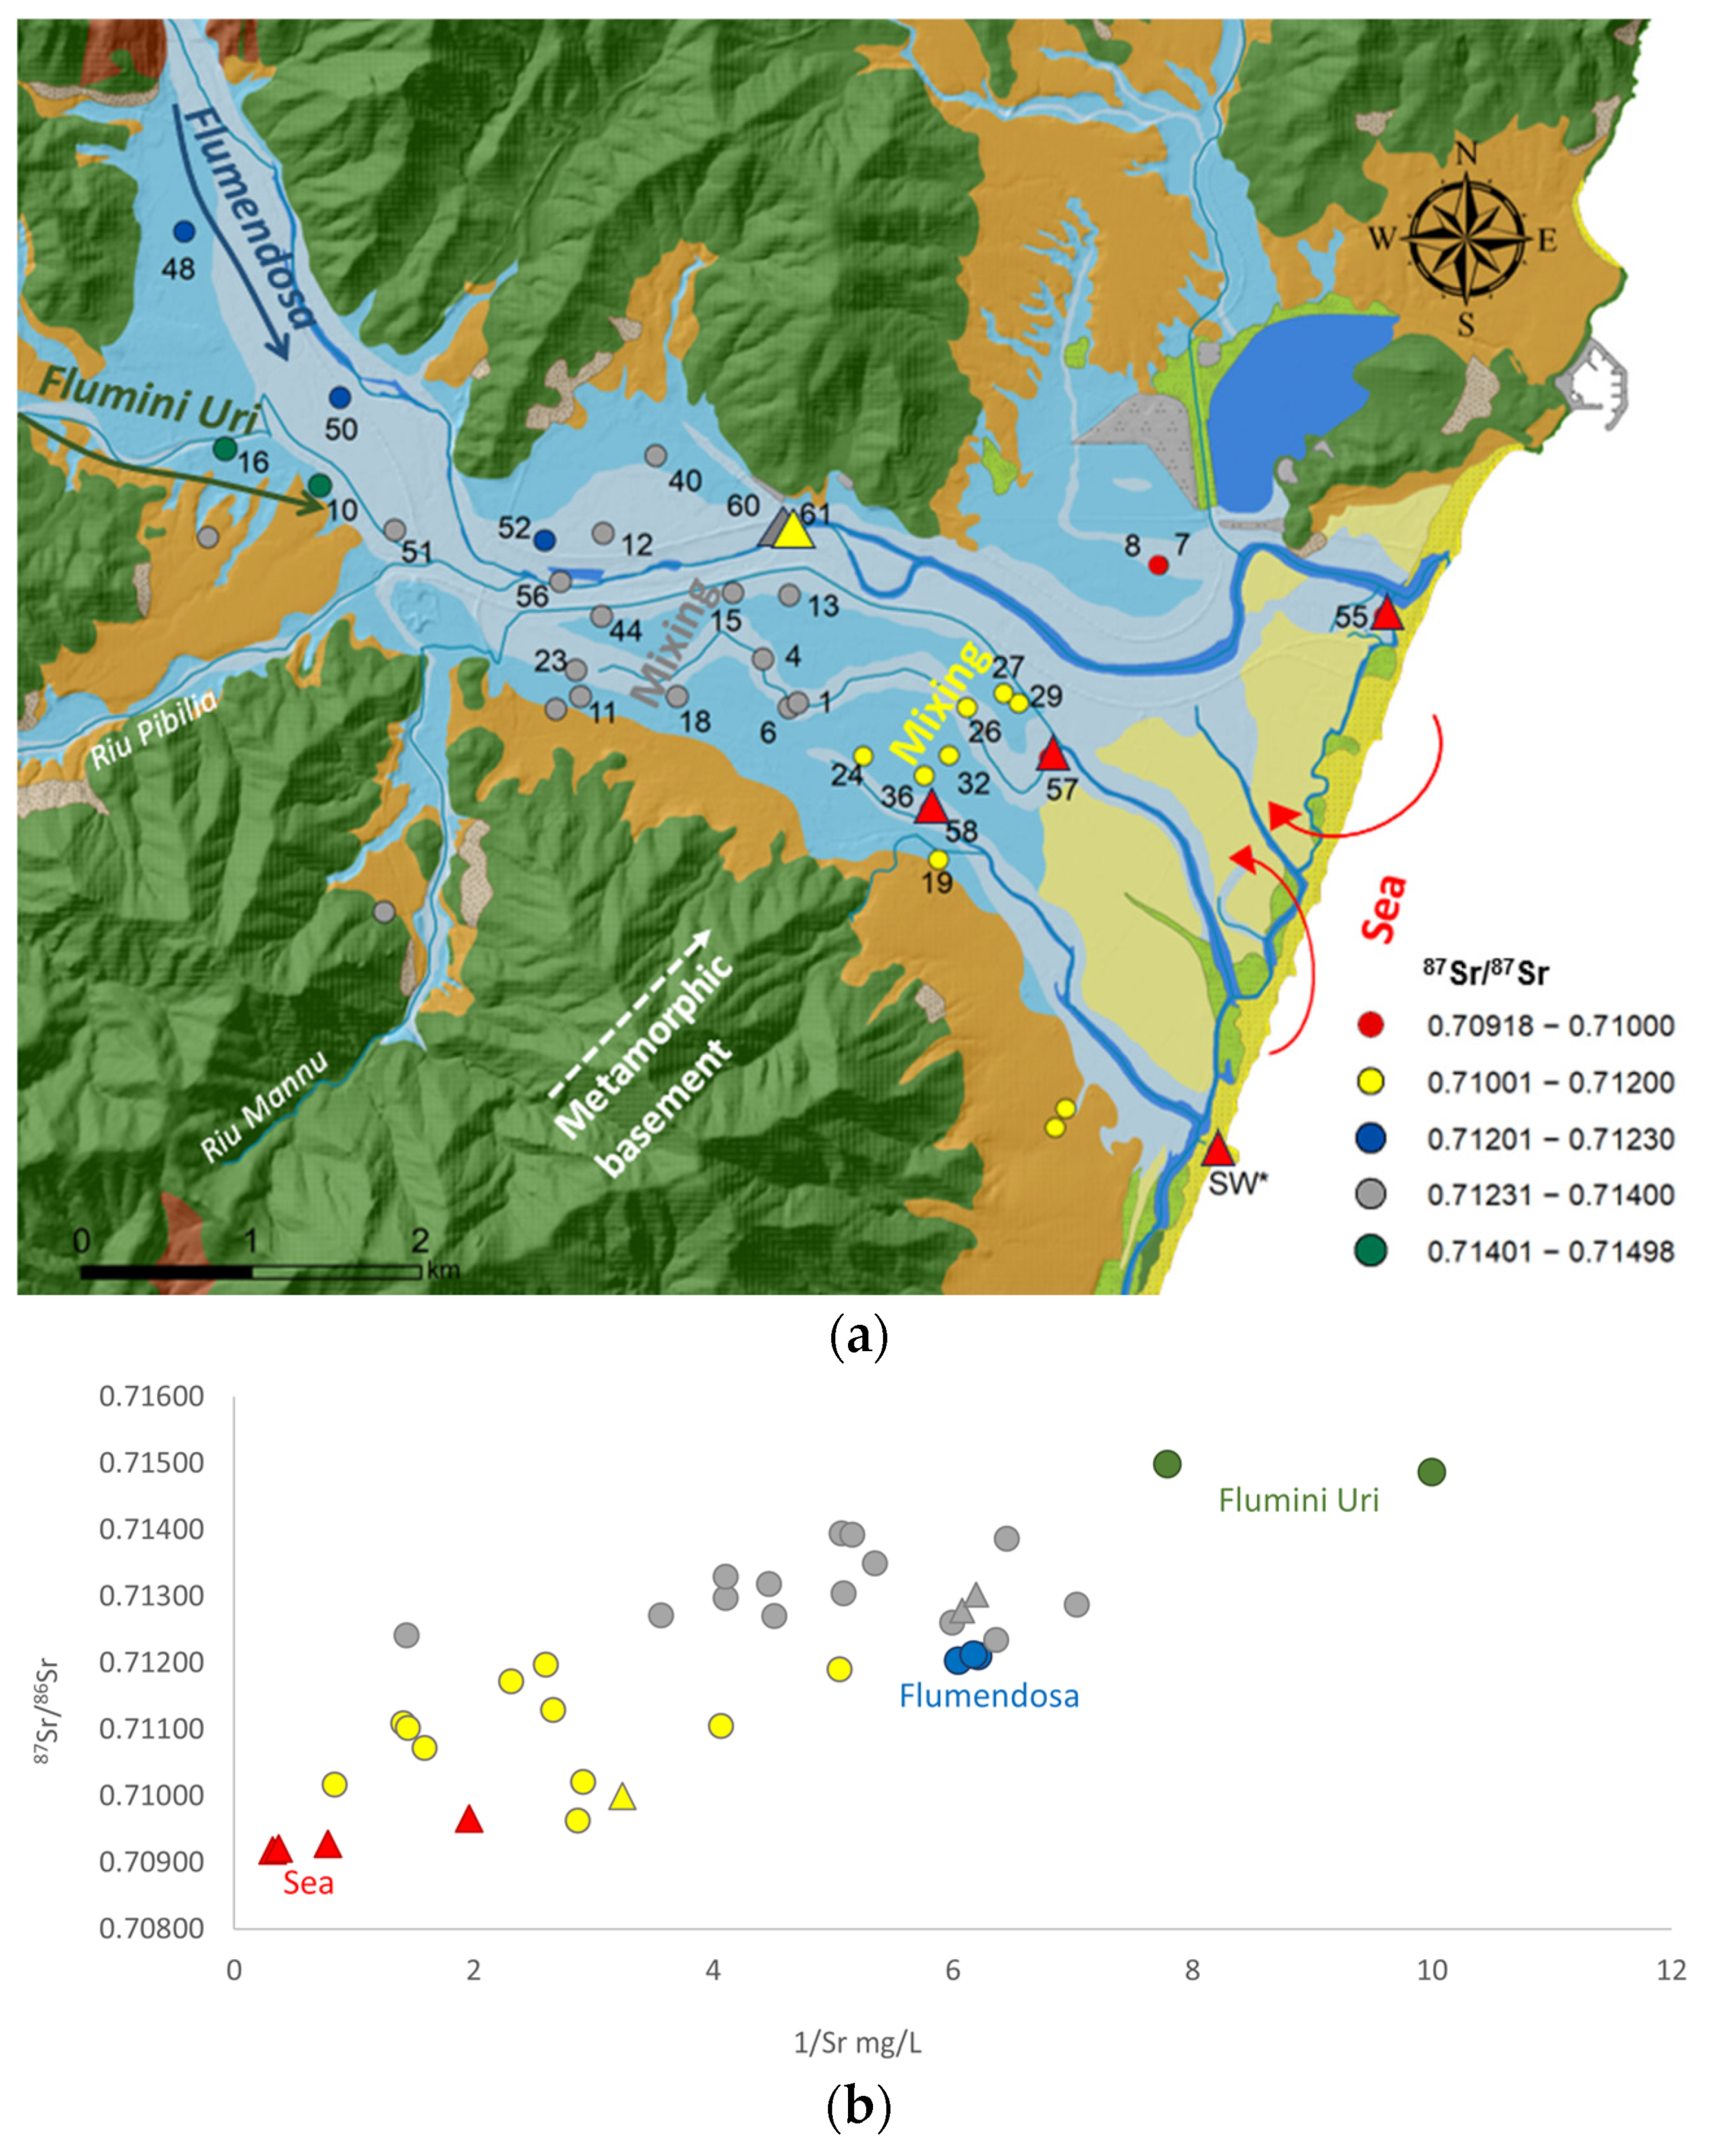
The 87Sr/86Sr values exhibit a clear spatial variation (Figure 11a), showing a decreasing trend from the inner part of the plain towards the sea. This trend can be interpreted as the mixing of waters from different watersheds feeding the plain, providing a valuable recharge contribution compared to the zenithal one. This interpretation is supported by the linear correlation between 87Sr/86Sr values and the inverse of the Sr concentration (Figure 11b), indicating the progressive input of groundwater recharge from areas draining the San Vito Sandstone formation (namely Uri area), which has higher 87Sr/86Sr values (sample n. 16) overlapping with inputs derived from the Flumendosa watershed (sample n. 48), where carbonate formations are more extensive. The weak dispersion of the samples around the regression line suggests that contributions to recharge could come from multiple end members: Uri-type, seawater-type, and Flumendosa-type. This evidence is consistent with a previous study [46] conducted on surface waters in the area, which identified the Flumini Uri as the primary contributor to Flumendosa with an indicative contribution of 10% by weight for the tributary [46].

Figure 11.
Interpretation of strontium isotopic values. Three different principal end members of the identified flow paths can be observed (for geological legend, refer to Figure 1). (a) spatialization of isotopic values classified according to the recognized pathways. (b) correlation between 87Sr/86Sr vs. 1/Sr indicating mixing processes among end-members.
As we moved the downgradient towards the coastal area, 87Sr/86Sr values tended to decrease, suggesting the significant contribution of seawater due to seawater intrusion. In fact, waters with the lowest isotopic values, below 0.71000, were predominantly found near the coast and could be attributed to strontium of seawater origin (in red in Figure 11).
An attempt to quantify recharge contributions from the above-identified end members (samples 16, 48, and SW*) was made by applying the Bayesian mixing model implemented in the SIAR (Stable Isotope Analysis in R) package [47,48] using the free language for statistical computing “R” [49]. The isotopic composition relative to 87Sr/86Sr; δ11B, δ34SSO4 in the identified end members were included simultaneously in the mixing model. The Bayesian statistical models calculated confidence intervals for source apportionment while taking into account the uncertainty arising from the input [50,51,52,53]. This statistical model allows for the joint evaluation of multiple isotopes to define the recharge source contributions for each analyzed sample on a probabilistic basis, thereby reducing uncertainties. The simulation results are shown in Figure 12, outlining how water from different sources contributes to the groundwater system in the study area, with variations in composition and characteristics along its flow path through the aquifer.
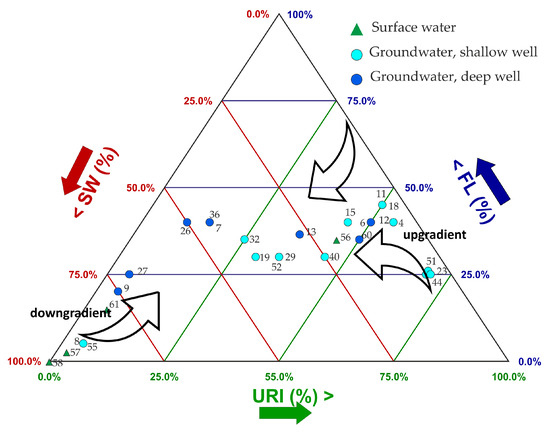
Figure 12.
Contribution of different end members, URI (Uri-type), FL (Flumendosa-type), and SW (seawater-type), according to the Bayesian mixing model SIAR simulation.
The simulations indicate that, as water moves from the upgradient in the recharge area at the mouth of the Flumini Uri in the plain through the aquifer towards Muravera village, it tends to pick up components characteristic of the Flumendosa River. Near the Foxi area, the two components gradually decrease in favor of the seawater component. In this area of the plain, the Flumendosa River discharges into groundwater. However, downstream of sample 61, the river waters become saline, especially in the summer season, when there is limited runoff from upstream sources. This increased salinity contributes to the overall marine component in the groundwater, as the saline river water mixes with the groundwater in the final stretch of its course.
4. Conclusions
In this paper, the coastal area of Muravera in southeastern Sardinia was chosen as a pilot site for the application of a multidisciplinary investigative methodology aimed at identifying and quantifying the factors influencing seawater intrusion in the plain. After establishing that the zenithal recharge alone is insufficient to meet all withdrawals in the plain, our methodology primarily focused on assessing lateral recharges from adjacent aquifers, with direct recharges from rivers crossing the plain and additional recharges from an urban wastewater treatment plant discharging into a channel.
The applied approach involved monthly monitoring campaigns to define piezometric trends and identify variations in chemical and physical parameters throughout an entire year. This information, combined with knowledge of the geometrical relationship between aquifers in the plain, allowed us to design water sampling for chemical and multi-isotopic analysis.
Monitoring data and geochemical results revealed a seawater edge extending about approximately 4 km inland from the coastline. Most water samples exhibited a sodium chloride composition, and the cation exchange processes recognized in samples near the Foxi or along the coastline confirmed the occurrence of seawater–freshwater mixing. There were no substantial differences in the geochemistry of waters from different aquifers, and the main variable parameter was chloride, which varied according to the distance from the coastline.
The results of δ18OH2O and δ2HH2O, δ11B, and δ34SSO4 indicated that meteoric water is the primary source of recharge and corroborate seawater–freshwater mixing processes. Strontium isotopic results provide valuable insights into the main flow path to the plain, which is further supported by piezometric trends, including the contribution from Flumendosa and Flumini Uri discharges into groundwater and seawater intrusion. The potential lateral contribution from the metamorphic basement and the Pleistocene alluvial aquifer were not excluded. Boron and sulfate isotopes ruled out sewage treatment plant discharge as a source of recharge to the alluvial aquifer.
The analysis of the boron isotope, B/Cl ratio, and binary graphs (especially SiO2 vs. Sr and Na vs. Ca) suggest that certain brackish waters in the alluvial aquifer undergo very long water–rock interaction times, indicative of highly evolved groundwater. This could be interpreted with mixing processes with pre-modern seawater.
This comprehensive approach significantly enhances understanding of the studied system by identifying primary flow paths and recharge sources, which are crucial for informed decision-making regarding artificial recharge, a reduction in withdrawals, or stream management. Groundwater, particularly saline groundwater with an extended water–rock interaction time, may indicate slow recharge rates or a premodern seawater component, which is essential for addressing seawater intrusion.
Furthermore, these findings could also facilitate the calibration of a coupled numerical groundwater flow and solute transport model, which is essential for groundwater management in the context of climate change.
Overall, these results underscore the effectiveness of a holistic hydrogeological, geochemical, and isotopic approach to gain a better understanding of how to manage water effectively for safe and sustainable use. Given the important contribution made by the application of this approach, it can be easily replicated in other areas with similar contexts and problems.
Supplementary Materials
The following supporting information can be downloaded at: https://www.mdpi.com/article/10.3390/w16081106/s1, Table S1: Physical–chemical parameters and concentration of major and selected minor components dissolved in groundwater and surface water.
Author Contributions
Conceptualization, S.D.P., R.C., M.C.P. and C.A.; Methodology, S.D.P.; M.C.P., R.C., C.A., R.B., R.W., F.L. and F.P.; Validation, S.D.P., C.A., M.C.P. and R.B.; Formal Analysis, R.B.; Investigation, S.D.P., M.C.P., C.A., R.B., F.L. and F.P.; Resources, S.D.P., R.C., R.B. and F.P.; Data Curation, S.D.P., M.C.P., C.A. and R.B.; Writing—Original Draft Preparation, M.C.P., S.D.P. and C.A.; Writing—Review and Editing, S.D.P., M.C.P., R.C., C.A, R.B., R.W., F.L. and F.P.; Visualization, S.D.P., M.C.P., C.A. and R.B.; Supervision, S.D.P., C.A. and R.C.; Project Administration, S.D.P.; Funding Acquisition, S.D.P. and R.C. All authors have read and agreed to the published version of the manuscript.
Funding
Authors acknowledge the partial financial support under the National Recovery and Resilience Plan (NRRP), Mission 4 Component 2 Investment 1.5—Call for tender No. 3277 published on 30 December 2021 by the Italian Ministry of University and Research (MUR) funded by the European Union—NextGenerationEU. Project Code ECS0000038—Project Title eINS Ecosystem of Innovation for Next Generation Sardinia—CUP F53C22000430001—Grant Assignment Decree No. 1056 adopted on 23 June 2022 by the Italian Ministry of University and Research (MUR), and the partial financial support under the Agreement POA FSC 2014–2020—16.12.2019 among the ex MATTM—DGSTA and River Basin Authority (AdB) of Sardinia—Service for the protection and management of water resources, water services, and drought management—Regional Agency of the River basin district of Sardinia, Action 2.3.1 “Interventions to improve the quality of water bodies”, CUP F72G16000000001. The authors also acknowledge the Fulbright Specialist program (Project ID: FSP-P008493) for partially funding the Richard Wanty trip to Sardinia.
Data Availability Statement
The raw data supporting the conclusions of this article will be made available by the authors on request.
Acknowledgments
The authors acknowledge Mario Lorrai, Maurizio Testa, and Paolo Botti for their continuous support and their constructive suggestions. The authors thank Fabrizio Piscedda for his help during field activities and all the Muravera population for providing information and opening their homes to allow authors to conduct in situ measurements and sampling.
Conflicts of Interest
The authors declare no conflicts of interest.
References
- Cao, T.; Han, D.; Song, X. Past, Present, and Future of Global Seawater Intrusion Research: A Bibliometric Analysis. J. Hydrol. 2021, 603, 126844. [Google Scholar] [CrossRef]
- Post, V.E.A. Fresh and Saline Groundwater Interaction in Coastal Aquifers: Is Our Technology Ready for the Problems Ahead? Hydrogeol. J. 2005, 13, 120–123. [Google Scholar] [CrossRef]
- Barlow, P.M.; Reichard, E.G. Saltwater Intrusion in Coastal Regions of North America. Hydrogeol. J. 2010, 18, 247–260. [Google Scholar] [CrossRef]
- Mastrocicco, M.; Busico, G.; Colombani, N.; Vigliotti, M.; Ruberti, D. Modelling Actual and Future Seawater Intrusion in the Variconi Coastal Wetland (Italy) Due to Climate and Landscape Changes. Water 2019, 11, 1502. [Google Scholar] [CrossRef]
- INEA. Valutazione del Rischio di Salinizzazione dei Suoli e di Intrusione Marina Nelle Aree Costiere delle Regioni Meridionali in Relazione agli usi Irrigui; Napoli, R., Vanino, S., Eds.; INEA Istituto Nazionale di Economia Agraria: Rome, Italy, 2011. [Google Scholar]
- Perra, E.; Viola, F.; Deidda, R.; Caracciolo, D.; Paniconi, C.; Langousis, A. Hydrologic Impacts of Surface Elevation and Spatial Resolution in Statistical Correction Approaches: Case Study of Flumendosa Basin, Italy. J. Hydrol. Eng. 2020, 25, 05020032. [Google Scholar] [CrossRef]
- Marras, P.A.; Lima, D.C.A.; Soares, P.M.M.; Cardoso, R.M.; Medas, D.; Dore, E.; De Giudici, G. Future Precipitation in a Mediterranean Island and Streamflow Changes for a Small Basin Using EURO-CORDEX Regional Climate Simulations and the SWAT Model. J. Hydrol. 2021, 603, 127025. [Google Scholar] [CrossRef]
- Vengosh, A.; Kloppmann, W.; Marei, A.; Livshitz, Y.; Gutierrez, A.; Banna, M.; Guerrot, C.; Pankratov, I.; Raanan, H. Sources of Salinity and Boron in the Gaza Strip: Natural Contaminant Flow in the Southern Mediterranean Coastal Aquifer. Water Resour. Res. 2005, 41, 2004WR003344. [Google Scholar] [CrossRef]
- Caschetto, M.; Colombani, N.; Mastrocicco, M.; Petitta, M.; Aravena, R. Nitrogen and Sulphur Cycling in the Saline Coastal Aquifer of Ferrara, Italy. A Multi-Isotope Approach. Appl. Geochem. 2017, 76, 88–98. [Google Scholar] [CrossRef]
- Pennisi, M.; Bianchini, G.; Muti, A.; Kloppmann, W.; Gonfiantini, R. Behaviour of Boron and Strontium Isotopes in Groundwater–Aquifer Interactions in the Cornia Plain (Tuscany, Italy). Appl. Geochem. 2006, 21, 1169–1183. [Google Scholar] [CrossRef]
- Yamanaka, M.; Kumagai, Y. Sulfur Isotope Constraint on the Provenance of Salinity in a Confined Aquifer System of the Southwestern Nobi Plain, Central Japan. J. Hydrol. 2006, 325, 35–55. [Google Scholar] [CrossRef]
- Cary, L. Origins and Processes of Groundwater Salinization in the Urban Coastal Aquifers of Recife (Pernambuco, Brazil): A Multi-Isotope Approach. Sci. Total Environ. 2015, 530–531, 411–429. [Google Scholar] [CrossRef] [PubMed]
- Bouchaou, L.; Michelot, J.L.; Vengosh, A.; Hsissou, Y.; Qurtobi, M.; Gaye, C.B.; Bullen, T.D.; Zuppi, G.M. Application of Multiple Isotopic and Geochemical Tracers for Investigation of Recharge, Salinization, and Residence Time of Water in the Souss–Massa Aquifer, Southwest of Morocco. J. Hydrol. 2008, 352, 267–287. [Google Scholar] [CrossRef]
- Werner, A.D.; Bakker, M.; Post, V.E.A.; Vandenbohede, A.; Lu, C.; Ataie-Ashtiani, B.; Simmons, C.T.; Barry, D.A. Seawater Intrusion Processes, Investigation and Management: Recent Advances and Future Challenges. Adv. Water Resour. 2013, 51, 3–26. [Google Scholar] [CrossRef]
- Jeen, S.-W.; Kang, J.; Jung, H.; Lee, J. Review of Seawater Intrusion in Western Coastal Regions of South Korea. Water 2021, 13, 761. [Google Scholar] [CrossRef]
- Lim, J.-W.; Lee, E.; Moon, H.S.; Lee, K.-K. Integrated Investigation of Seawater Intrusion around Oil Storage Caverns in a Coastal Fractured Aquifer Using Hydrogeochemical and Isotopic Data. J. Hydrol. 2013, 486, 202–210. [Google Scholar] [CrossRef]
- Castrignanò, A.; Buttafuoco, G.; Puddu, R. Multi-Scale Assessment of the Risk of Soil Salinization in an Area of South-Eastern Sardinia (Italy). Precis. Agric. 2008, 9, 17–31. [Google Scholar] [CrossRef]
- Aru, A. Nota illustrativa alla carta pedologica della Bassa Valle del Flumendosa con particolare riferimento ai suoli salsi di Muravera e Villaputzu (Cagliari); Centro Regionale Agrario Sperimentale: Cagliari, Italy, 1970; p. 41. Available online: https://www.igmi.org/carte-antiche/generali_italia/++theme++igm/immagini_antiche/biblioteca/B0004679.jpg (accessed on 13 March 2024).
- Barbieri, G.; Barrocu, G.; Poledrini, C.; Uras, G. Salt Intrusion Phenomena in the South-East Coast of Sardinia. In Geologia Applicata e Idrogeologia. Proceedings of the 8th Salt Water Intrusion Meeting; Cotecchia V.: Bari, Italy, 1983; Volume 18, Parte II; pp. 315–323. [Google Scholar]
- Barbieri, G. Hydrogeological and Geophysical Investigation for the Evalutation of Salt Intrusion Phenomena in Sardinia. 9th Salw Intr Meet Delfi. 1986, pp. 659–670. Available online: http://www.swim-site.nl/pdf/swim09/swim09_Barbieri_etal.pdf (accessed on 13 March 2024).
- Careddu, M.B. Studio Della Contaminazione Di Acquiferi Costieri, Mediante Metodi Geofisici—Applicazione Alla Piana Di Muravera (Sardegna SE). Master’s Thesis, Università degli Studi di Cagliari, Cagliari, Italy, 1985. [Google Scholar]
- Pilia, I. Studio idrogeologico della piana del Flumendosa (Sarrabus orientale). Master’s Thesis, Università degli Studi di Cagliari, Cagliari, Italy, 2002. [Google Scholar]
- Deidda, G.P.; Ranieri, G.; Uras, G.; Cosentino, P.; Martorana, R. Geophysical Investigations in the Flumendosa River Delta, Sardinia (Italy)—Seismic Reflection Imaging. Geophysics 2006, 71, B121–B128. [Google Scholar] [CrossRef]
- Balia, R.; Viezzoli, A. Integrated Interpretation If IP and TEM Data for Salinity Monitoring of Aquifers and Soil in the Coastal Area of Muravera (Sardinia, Italy). Boll. Geofis. Teor. Appl. 2015, 56, 31–42. [Google Scholar] [CrossRef]
- Ardau, F. Studio dei Fenomeni di Salinazione delle Acque Sotterranee Nella Piana di Muravera (Sardegna Sud-Orientale). Doctoral Thesis, Università degli Studi di Cagliari, Cagliari, Italy, 1995. [Google Scholar]
- Ardau, F.; Barbieri, G. Aquifer Configuration and Possible Causes of Salination in the Muravera Plain (SE Sardinia, Italy). Proceedings of 16th Salt Water Intrusion Meeting, Miedzyzdroje-Wo lin Island, Poland, 12–15 June 2000; pp. 11–18. [Google Scholar]
- Ardau, F.; Gavaudò, E. Recent Developments in Hydrogeological and Geophysical Research in the Muravera Coastal Plain (SE Sardinia, Italy). In Proceedings of the 17th 456 Salt Water Intrusion Meeting, Delft, The Netherlands, 6–10 May 2002. [Google Scholar]
- Da Pelo, S.; Ghiglieri, G.; Buttau, C.; Biddau, R.; Cuzzocrea, C.; Funedda, A.; Carletti, A.; Vacca, S.; Cidu, R. Coupling 3D Hydrogeological Modelling and Geochemical Mapping for an Innovative Approach to Support Management of Aquifers. Ital. J. Eng. Geol. Environ. 2017, 1, 39–49. [Google Scholar] [CrossRef]
- Porru, M.C.; Da Pelo, S.; Westenbroek, S.; Vacca, A.; Loi, A.; Melis, M.T.; Pirellas, A.; Buttau, C.; Arras, C.; Vacca, S.; et al. A Methodological Approach for the Effective Infiltration Assessment in a Coastal Groundwater. Ital. J. Eng. Geol. Environ. 2021, 1, 183–193. [Google Scholar] [CrossRef]
- Arras, C.; (Department of Chemical and Geological Sciences, University of Cagliari, Monserrato (CA), Italy); Buttau, C.; (Department of Chemical and Geological Sciences, University of Cagliari, Monserrato (CA), Italy); Loi, A.; (Department of Chemical and Geological Sciences, University of Cagliari, Monserrato (CA), Italy); Funedda, A.; (Department of Chemical and Geological Sciences, University of Cagliari, Monserrato (CA), Italy); Lotti, F.; (Symple S.r.l.—Kataclima Srl Società Benefit, Vetralla (VT), Italy); Lorrai, M.; (Autonomous Region of Sardinia, Water Resources Protection and Management Service, Supervision of Water Services and Drought Management, Cagliari, Italy); Testa, M.; (Regional Environmental Protection Agency of Sardinia, ARPA Sardegna, Cagliari, Italy); Botti, P.; (Autonomous Region of Sardinia, Water Resources Protection and Management Service, Supervision of Water Services and Drought Management, Cagliari, Italy); Ghiglieri, G.; (Department of Chemical and Geological Sciences, University of Cagliari, Monserrato (CA), Italy); Da Pelo, S.; (Department of Chemical and Geological Sciences, University of Cagliari, Monserrato (CA), Italy). CIS 1111 Detritico Alluvionale Plio-Quaternario di Muravera: Approfondimenti Sito-Specifici di Carattere Geologico e Idrogeologico e Modellazione Numerica; Report: Approfondimenti idrogeologici funzionali alla valutazione dello stato quantitativo dei corpi idrici sotterranei del Distretto Idrografico della Sardegna, nell’ambito dell’aggiornamento del Piano di Gestione del Distretto Idrografico della Sardegna; DSCG—ADIS_STGRI. Unpublished work. 2022. (In Italian) [Google Scholar]
- Puls, R.W.; Barcelona, M.J. Low-Flow (Minimal Drawdown) Ground-Water Sampling Procedures. Available online: https://www.epa.gov/remedytech/low-flow-minimal-drawdown-ground-water-sampling-procedures (accessed on 26 March 2024).
- Nordstrom, D.K. Thermochemical Redox Equilibria of ZoBell’s Solution. Geochim. Cosmochim. Acta 1977, 41, 1835–1841. [Google Scholar] [CrossRef]
- Pittalis, D.; Carrey, R.; Da Pelo, S.; Carletti, A.; Biddau, R.; Cidu, R.; Celico, F.; Soler, A.; Ghiglieri, G. Hydrogeological and Multi-Isotopic Approach to Define Nitrate Pollution and Denitrification Processes in a Coastal Aquifer (Sardinia, Italy). Hydrogeol. J. 2018, 26, 2021–2040. [Google Scholar] [CrossRef]
- McArthur, J.M.; Howarth, R.J.; Bailey, T.R. Strontium Isotope Stratigraphy: LOWESS Version 3: Best Fit to the Marine Sr-Isotope Curve for 0–509 Ma and Accompanying Look-up Table for Deriving Numerical Age. J. Geol. 2001, 109, 155–170. [Google Scholar] [CrossRef]
- Coplen, T.B. Guidelines and Recommended Terms for Expression of Stable-Isotope-Ratio and Gas-Ratio Measurement Results. Rapid Commun. Mass Spectrom. 2011, 25, 2538–2560. [Google Scholar] [CrossRef] [PubMed]
- Appelo, C.A.J.; Postma, D. Geochemistry, Groundwater and Pollution, 2nd ed.; CRC Press: London, UK, 2005. [Google Scholar] [CrossRef]
- Petelet-Giraud, E.; Négrel, P.; Aunay, B.; Ladouche, B.; Bailly-Comte, V.; Guerrot, C.; Flehoc, C.; Pezard, P.; Lofi, J.; Dörfliger, N. Coastal Groundwater Salinization: Focus on the Vertical Variability in a Multi-Layered Aquifer through a Multi-Isotope Fingerprinting (Roussillon Basin, France). Sci. Total Environ. 2016, 566–567, 398–415. [Google Scholar] [CrossRef] [PubMed]
- Habtemichael, Y.T.; Fuentes, H.R. Hydrogeochemical Analysis of Processes Through Modeling of Seawater Intrusion Impacts in Biscayne Aquifer Water Quality, USA. Aquat. Geochem. 2016, 22, 197–209. [Google Scholar] [CrossRef]
- Cherchi, A.; Da Pelo, S.; Ibba, A.; Mana, D.; Buosi, C.; Floris, N. Benthic Foraminifera Response and Geochemical Characterization of the Coastal Environment Surrounding the Polluted Industrial Area of Portovesme (South-Western Sardinia, Italy). Mar. Pollut. Bull. 2009, 59, 281–296. [Google Scholar] [CrossRef] [PubMed]
- Cidu, R.; Biagini, C.; Fanfani, L. Mine Closure at Monteponi (Italy): Effect of the Cessation of Dewatering on the Quality of Shallow Groundwater. Appl. Geochem. 2001, 16, 489–502. [Google Scholar] [CrossRef]
- Re, V.; Sacchi, E.; Martin-Bordes, J.L.; Aureli, A.; El Hamouti, N.; Bouchnan, R.; Zuppi, G.M. Processes Affecting Groundwater Quality in Arid Zones: The Case of the Bou-Areg Coastal Aquifer (North Morocco). Appl. Geochem. 2013, 34, 181–198. [Google Scholar] [CrossRef]
- Giustini, F.; Brilli, M.; Patera, A. Mapping Oxygen Stable Isotopes of Precipitation in Italy. J. Hydrol. Reg. Stud. 2016, 8, 162–181. [Google Scholar] [CrossRef]
- Craig, H. Isotopic Variations in Meteoric Waters. Science 1961, 133, 1702–1703. [Google Scholar] [CrossRef]
- Dogramaci, S.S.; Herczeg, A.L.; Schi, S.L.; Bone, Y. Controls on d34S and d18O of Dissolved Sulfate in Aquifers of the Murray Basin, Australia and Their Use as Indicators of Flow Processes. Appl. Geochem. 2001, 16, 475–488. [Google Scholar] [CrossRef]
- Cary, L.; Casanova, J.; Gaaloul, N.; Guerrot, C. Combining Boron Isotopes and Carbamazepine to Trace Sewage in Salinized Groundwater: A Case Study in Cap Bon, Tunisia. Appl. Geochem. 2013, 34, 126–139. [Google Scholar] [CrossRef]
- Cidu, R.; Caboi, R.; Biddau, R.; Petrini, R.; Slejko, F.; Flora, O.; Stenni, B.; Aiuppa, A.; Parello, F. Caratterizzazione Idrogeochimica ed Isotopica e Valutazione della Qualità delle Acque Superficiali e Sotterranee Campionate nel Foglio 549 Muravera. In Geochemical Baseline of Italy; Ottonello, G., Ed.; Pacini Editore: Pisa, Italy, 2007. [Google Scholar]
- Parnell, A.C.; Inger, R.; Bearhop, S.; Jackson, A.L. Source Partitioning Using Stable Isotopes: Coping with Too Much Variation. PLoS ONE 2010, 5, e9672. [Google Scholar] [CrossRef] [PubMed]
- Parnell, A.C.; Phillips, D.L.; Bearhop, S.; Semmens, B.X.; Ward, E.J.; Moore, J.W.; Jackson, A.L.; Grey, J.; Kelly, D.J.; Inger, R. Bayesian Stable Isotope Mixing Models. Environmetrics 2013, 24, 387–399. [Google Scholar] [CrossRef]
- R Core Team. R: A Language and Environment for Statistical Computing; R Foundation for Statistical Computing: Vienna, Austria, 2013; Available online: http://www.R-project.org/ (accessed on 13 March 2024).
- Ju, Y.; Mahlknecht, J.; Lee, K.-K.; Kaown, D. Bayesian Approach for Simultaneous Recognition of Contaminant Sources in Groundwater and Surface-Water Resources. Curr. Opin. Environ. Sci. Health 2022, 25, 100321. [Google Scholar] [CrossRef]
- Jung, H.; Kim, Y.S.; Yoo, J.; Park, B.; Lee, J. Seasonal Variations in Stable Nitrate Isotopes Combined with Stable Water Isotopes in a Wastewater Treatment Plant: Implications for Nitrogen Sources and Transformation. J. Hydrol. 2021, 599, 126488. [Google Scholar] [CrossRef]
- Biddau, R.; Dore, E.; Da Pelo, S.; Lorrai, M.; Botti, P.; Testa, M.; Cidu, R. Geochemistry, Stable Isotopes and Statistic Tools to Estimate Threshold and Source of Nitrate in Groundwater (Sardinia, Italy). Water Res. 2023, 232, 119663. [Google Scholar] [CrossRef] [PubMed]
- Torres-Martínez, J.A.; Mora, A.; Mahlknecht, J.; Daesslé, L.W.; Cervantes-Avilés, P.A.; Ledesma-Ruiz, R. Estimation of Nitrate Pollution Sources and Transformations in Groundwater of an Intensive Livestock-Agricultural Area (Comarca Lagunera), Combining Major Ions, Stable Isotopes and MixSIAR Model. Environ. Pollut. 2021, 269, 115445. [Google Scholar] [CrossRef]


Disclaimer/Publisher’s Note: The statements, opinions and data contained in all publications are solely those of the individual author(s) and contributor(s) and not of MDPI and/or the editor(s). MDPI and/or the editor(s) disclaim responsibility for any injury to people or property resulting from any ideas, methods, instructions or products referred to in the content. |
© 2024 by the authors. Licensee MDPI, Basel, Switzerland. This article is an open access article distributed under the terms and conditions of the Creative Commons Attribution (CC BY) license (https://creativecommons.org/licenses/by/4.0/).