Article

Diversity of Macrophytes and Macroinvertebrates in Different Types of Standing Waters in the Drava Field

Department of Biology, Biotechnical Faculty, University of Ljubljana, Jamnikarjeva 101, 1000 Ljubljana, Slovenia
*
Author to whom correspondence should be addressed.
Water 2024, 16(8), 1130; https://doi.org/10.3390/w16081130
Submission received: 14 March 2024 / Revised: 9 April 2024 / Accepted: 11 April 2024 / Published: 16 April 2024
(This article belongs to the Special Issue Biodiversity of Freshwater Ecosystems: Monitoring and Conservation)

Abstract

:
The diversity of macrophytes and macroinvertebrates in small standing waters of different origins and characteristics was investigated. This survey covered 19 ponds in the Drava field in northeastern Slovenia. The influence of the macrophytes on the macroinvertebrates was investigated and the main environmental factors that had the most significant influence on the composition of the two communities were identified. Sixty-seven taxa of macrophytes and seventy-three families of macroinvertebrates were identified. We found that a diverse macrophyte community has a positive effect on the macroinvertebrate community. In contrast, the dominance of a single macrophyte species has a strong negative influence on the richness of the macroinvertebrate community. The taxonomic richness and abundance of the macroinvertebrate community in the natural ponds was statistically significantly higher than that in artificial ponds. The significant differences in the environmental characteristics between the natural and artificial ponds, such as the macrophyte cover, conductivity, and riparian zone width, may account for these differences. Our study suggests that a greater diversity of macrophyte and macroinvertebrate communities in natural ponds is enabled by abundant but diverse macrophyte cover, low phosphorus content, and wide riparian zones, which require appropriate management of ponds and their catchments.

1. Introduction

Ponds are small and shallow, natural or artificial water bodies that are permanent or temporary. Several researchers limit the surface area of a pond up to 2 hectares [1,2]. De Meester et al. [3] suggest a wider definition—a maximum surface size between 1 and 5 ha—and claim that the exact limit of their surface size is artificial and counterproductive to views on the structure and functioning of these systems. Ponds and similar small lentic waterbodies are classified as wetlands according to the definitions of the Ramsar Convention, as well as by Davidson and Finlayson [4]. Such a status is of the utmost importance from a management and protection perspective, considering that wetlands are among the most vulnerable and heavily impacted habitats [5]. Ponds and other small freshwater bodies are under severe anthropogenic threat due to changed land use and agricultural intensification, draining, pollution, eutrophication, fish stocking, and mismanagement [6].
Ponds are complex habitats that support a high biodiversity of macrophytes, macroinvertebrates, and other organisms and provide important ecosystem services globally [6,7]. At a regional level, ponds significantly contribute to freshwater biodiversity. Because of their higher complexity as habitats, ponds host considerably more species and more unique and rare species than many other water body types [1,5,8,9,10].
Man-made or artificial ponds have been created for different purposes and have later become valuable habitats after their primary function is abandoned (e.g., clay pits, gravel pits). However, today, they often compensate for the loss and degradation of wetlands and can function as a refuge for endangered species [8,11]. Artificial ponds are often designed to mimic natural ecosystems but may have different physical and chemical characteristics that can affect the diversity and abundance of macrophytes and macroinvertebrates [5,12]. Artificial ponds increase landscape connectivity and regional biodiversity [12,13,14]. Understanding the differences and similarities between natural and artificial ponds can provide valuable insights into how freshwater ecosystems respond to environmental changes and management practices.
Macrophytes and macroinvertebrates play a crucial role in natural processes in lentic waters [15]. Macrophytes play an important role in energy flow and nutrient cycling through the uptake of dissolved nutrients, especially phosphorus and nitrogen [16]. The oxygen produced during photosynthesis in the submerged plants
Enables aeration of the water and, thus, the faster decomposition of organic matter. On the other hand, macrophytes can also contribute to the eutrophication of the system, as nutrients are released after their decay. A lack of oxygen can have a negative effect on other organisms in the water. Even at a high abundance, the macrophytes can have an adverse effect on aquatic biota during the night or other poor light conditions, when they are net oxygen consumers. Macrophytes stabilize the sediment and reduce turbidity. Silt, clay, and particulate organic matter accumulate in dense stands of macrophytes [16]. Macrophytes influence bottom life by inputting macrophyte-derived detritus [17] and provide additional microhabitats and higher complexity in the littoral zone that supports the macroinvertebrate community. It was found out that habitats colonized especially by branched and dissected macrophyte growth forms, provide food and microhabitats for a large number of macroinvertebrates [17]. Macroinvertebrates connect the processes of primary production and the input of allochthonous substances and are, at the same time, the most important predators in small lentic waterbodies. They act as decomposers and top predators and also serve as important bioindicators of water quality [18]. They differ greatly in their ecology, which is reflected in a very diverse community of macroinvertebrates [19,20,21]. However, macroinvertebrates are influenced by various physical, chemical, and biotic factors that affect their abundance and diversity. Their influence may be directly related to physical disturbance or indirectly through the prevalence of macrophytes. It is known that the diversity of macroinvertebrate taxa decreases with increasing human pressure, such as the eutrophication of water bodies [22]. Higher levels of chlorophyll a have a negative effect on water transparency [23,24], which directly affects the macrophytes and, consequently, the macroinvertebrates.
In recent decades, there has been a decrease in the diversity of aquatic taxa, leading to increasingly uniform communities. Many species have become rare, vulnerable, or endangered, and their distribution has been drastically changed. Local extinctions of indigenous taxa sensitive to changes in environmental conditions and eutrophication have resulted in their replacement by synanthropic, disturbance-tolerant taxa [7,16].
Many studies have examined pond diversity and environmental conditions, but only a few have focused explicitly on comparing macrophyte and macroinvertebrate communities between ponds of different origins and their characteristics [2,10,17]. The impact of macrophytes on macroinvertebrates is an important area of research, as it can help us understand how changes in macrophyte communities, whether natural or human-induced, can affect the composition and diversity of macroinvertebrate communities.
The structure of the water vegetation, and its horizontal and vertical heterogeneity, respectively, significantly impact the macroinvertebrate community with a higher complexity of habitats [10,25,26], which is reflected in a greater number of microhabitats per unit area. Different microhabitats can provide alternative resources for macroinvertebrates [26,27]. The complexity of vegetated habitat has two main effects: reduced predation and more available surface area for organisms to colonize. Some more mobile organisms (Coleoptera, Ephemeroptera, Odonata, Hemiptera) have the greatest diversity and abundance within macrophyte stands [25]. Vegetation also contributes to changes in abundance and quality of food and water quality through decomposition [26]. Several studies have shown that macroinvertebrate distribution is predominantly determined by the vegetation type [17,28] and, more importantly, by the architecture or growth form of the dominant macrophytes. Thus, the highly branched growth form of macrophytes with many lateral shoots provides more food resources and microhabitats, supporting larger numbers of macroinvertebrates than macrophytes with uniform undissected stalks and leaves [17].
This study aimed to identify the effect of various environmental parameters that drive the taxonomic richness and biodiversity of macrophyte and macroinvertebrate communities in selected ponds. One of our aims was also to determine the effects of macrophytes on the macroinvertebrate community. We hypothesize that macrophyte and macroinvertebrate diversity is higher in natural ponds (oxbow lakes) than in artificial ponds (mainly clay pits). One of our goals was also to provide suggestions for management and restoration activities at these waterbodies.

2. Materials and Methods
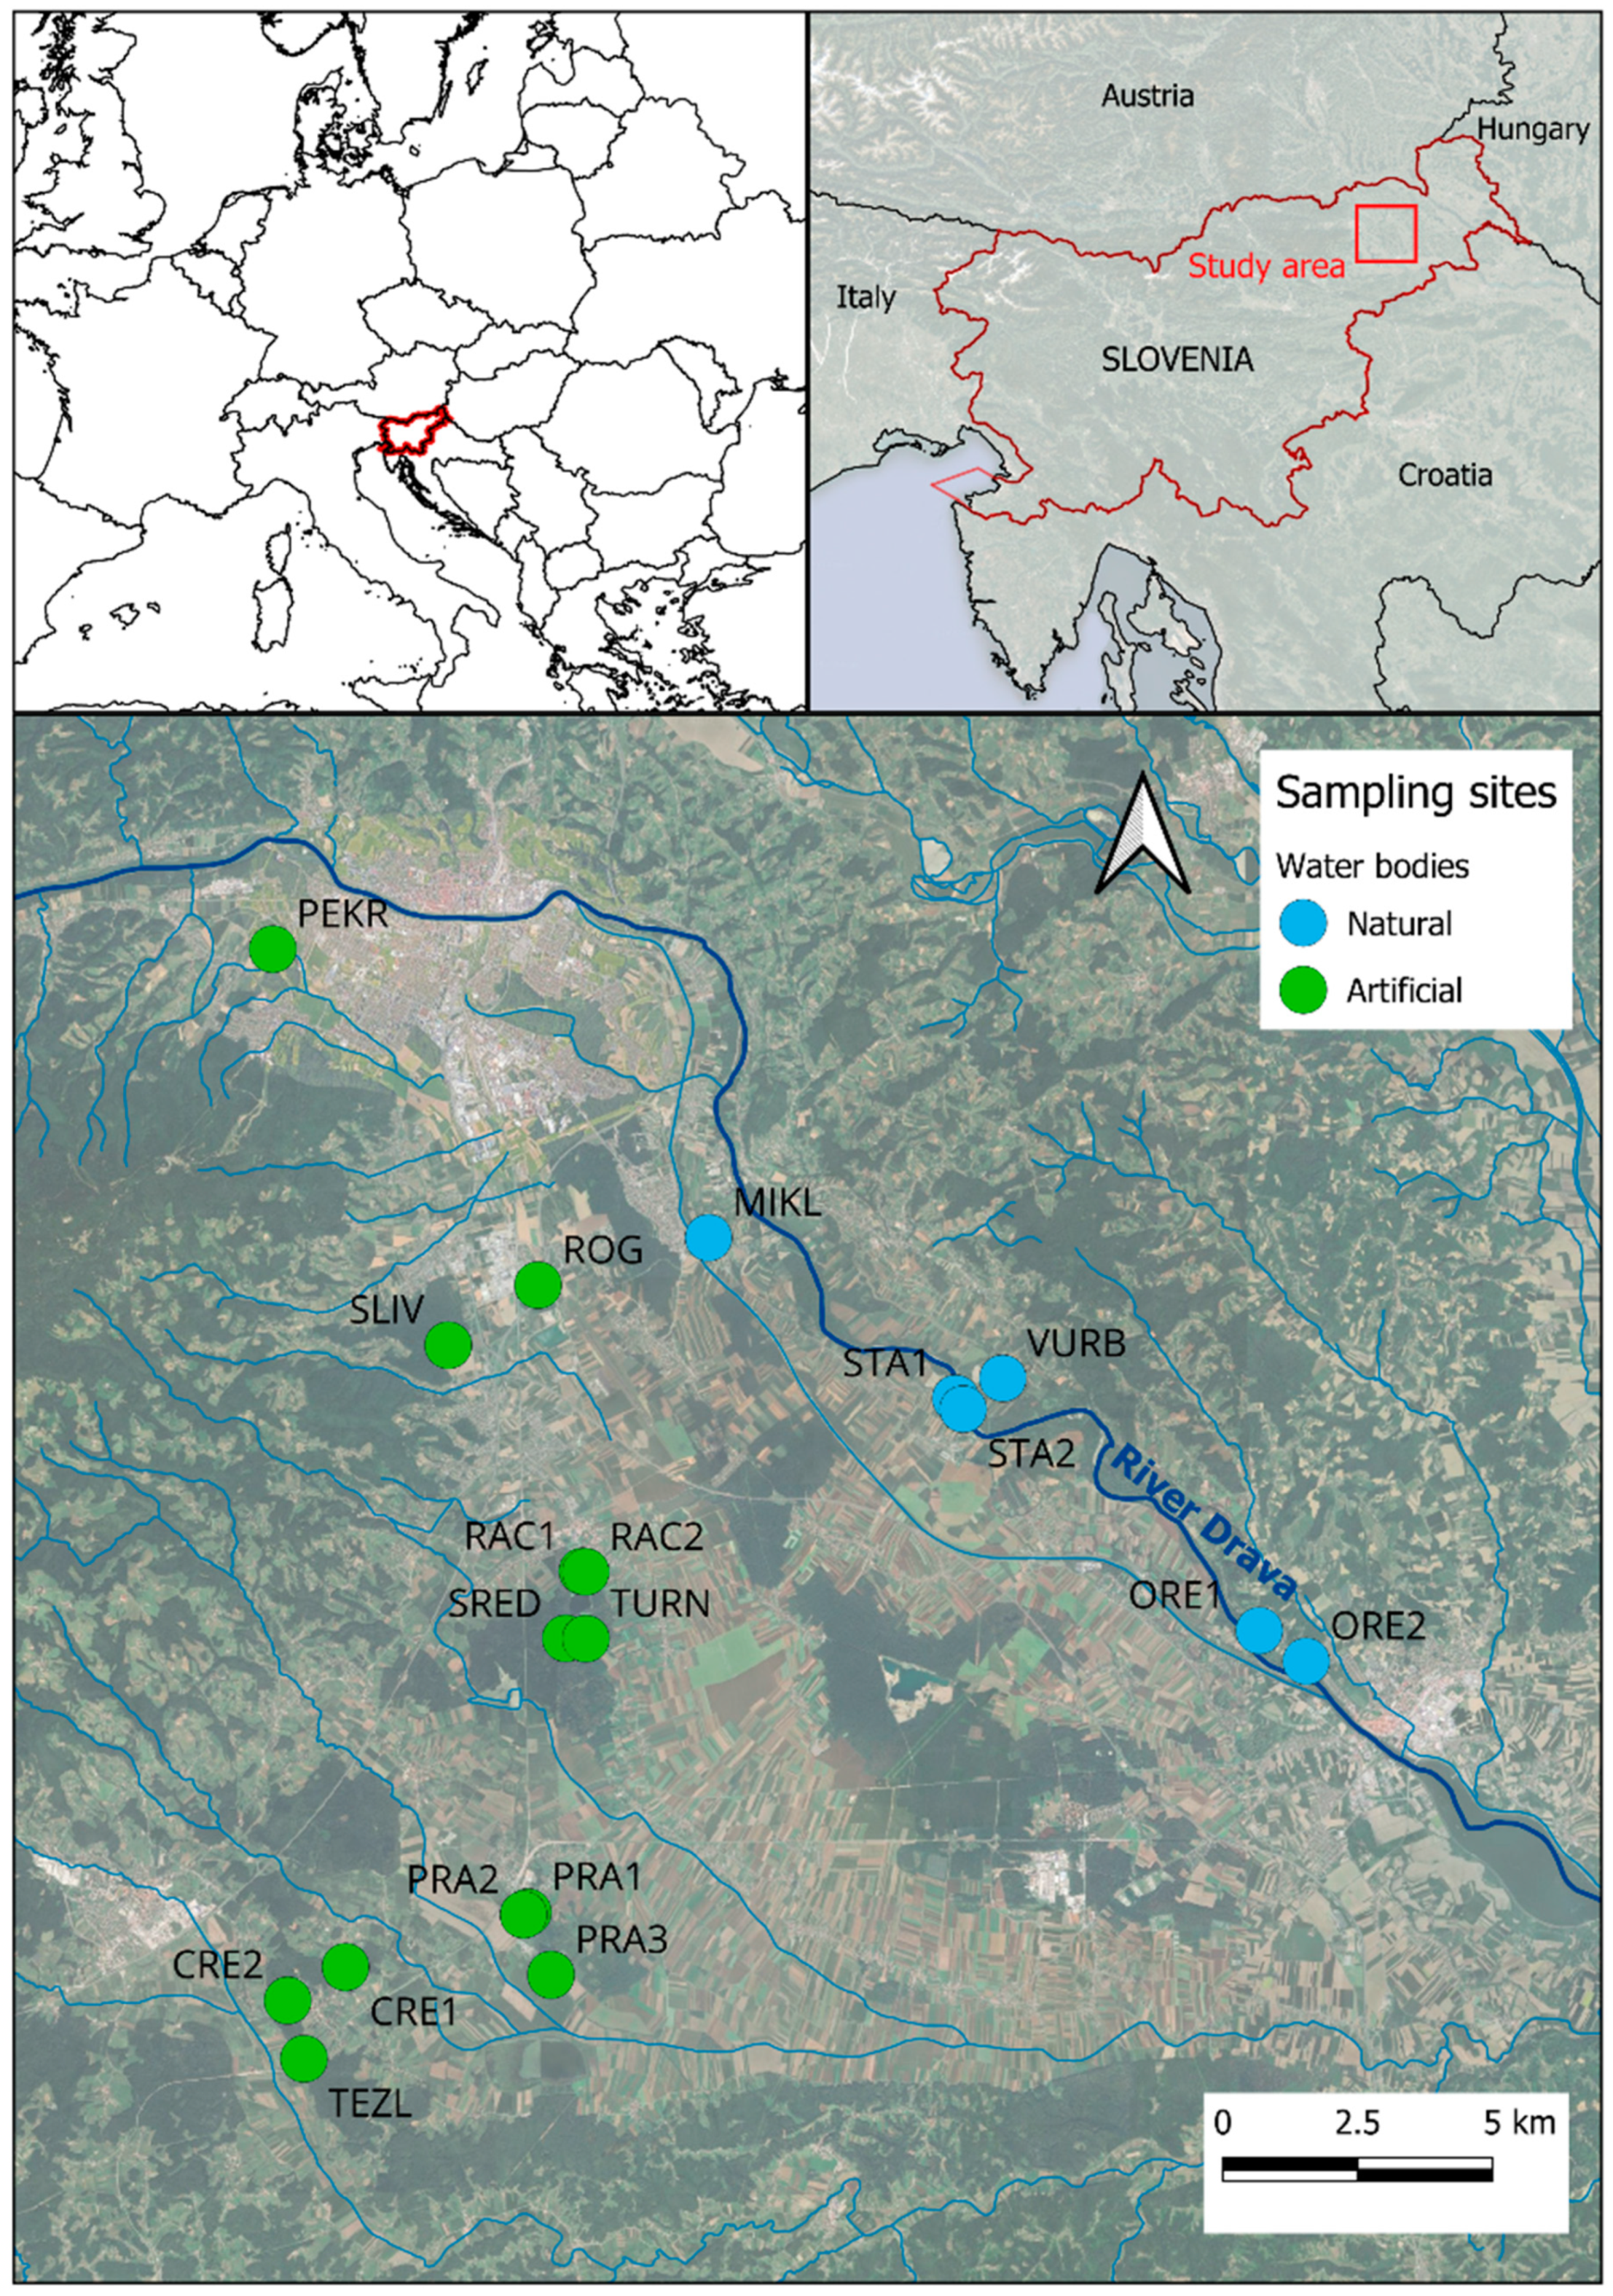
2.1. Study Area

This research was performed within the Drava field lowland area, which covers around 300 km2 in NE Slovenia. The prevailing land use of the area is intensively cultivated agricultural land [29]. The plain consists of terraces shaped by the Drava River, where fluvial sediments are deposited on the flat land, creating the geological structure. From the foothill of the Pohorje mountains towards the Drava River, there is a clear transition from loamy or clay-rich soils, deposited by numerous streams draining the slopes of the Pohorje mountains, to the thick gravel deposits in the eastern part of the plain, which are the result of the sedimentation processes of the Drava River.
The Drava field is known for its extensive pools of groundwater. Streams, which flow mainly from the slopes of the Pohorje, sink in the area of thick gravel deposits and become enriched with dissolved minerals. Groundwater is exposed to pollution, especially from fertilizers, since the majority of these areas on gravel deposits have been converted to arable land. On the lowest terraces in some places, the water reappears in the form of springs [30], e.g., Miklavž, Starše, etc.
Nineteen water bodies of different origins, with different characteristics and succession stages, were selected; six are natural, and thirteen are artificial ponds. The pond size ranged from 0.09 ha to 20.91 ha (mean 2.28 ha). The altitude of the ponds varied between 232 and 289 m above sea level. The studied natural ponds were originally oxbows, but due to the diversion of a great proportion of the Drava River’s flow to an artificial channel supplying the water to a hydro-power plant, they are no longer functioning as oxbows in an active floodplain. These water bodies are limited to lower terraces along the Drava River (Figure 1) (Miklavž, Orešje, Starše, Vurberk) and are fed by groundwater. The artificial ponds include abandoned clay pits, gravel pits, and fish ponds.

2.2. Field Surveys

The fieldwork was carried out in August and September 2021. At all sample sites, the species diversity of macrophytes and their cover values in percentages were estimated. The survey of macrophytes and macroinvertebrates was carried out on a selected transect 6 m wide and reached 3 m into the water body. In this zone, we recorded all the macrophyte species present. We used a broader definition of macrophytes, which includes submerged and floating-leaved aquatic plants (hydrophytes), as well as wetland plants (helophytes or emergent macrophytes). The majority of the macrophytes were identified at the species level.
Figure 1. Map of the position of Slovenia within Europe (upper left), study area within Slovenia (upper right) and sampling sites on the Drava field.
Water 16 01130 g001
Macroinvertebrates were sampled using the modified PLOCH method described in Oertli et al. [31]. Instead of sampling at the bottom and land–water interface, as they suggest, we sampled from the macrophyte stands only, as this was the aim of our study. Each of the sub-samples was taken on different types of macrophytes (e.g., the first on emergent plants and the second among submerged and natant species) to cover as large a spectrum of organisms as possible, since different taxa of macroinvertebrates stay on different taxa of plants. If submerged macrophytes were absent, the entire time interval was used for emergent macrophytes. Macroinvertebrates were sampled for 60 s with a hand net with a 25 × 25 cm frame size, with openings of 0.5 × 0.5 mm. Two subsamples were collected within one sampling transect: one from the stand of submerged macrophytes and one from the helophytes. Each subsample was collected within 30 s intervals from a 25 × 50 cm plot. Macroinvertebrate samples were fixed in 80% ethanol and stored until the analysis in the laboratory. Determination at the family level was performed with the help of determination keys in Tachet et al. [32]. The abundance of each taxon was expressed as the share of individuals counted in the sample.
Measurements of selected physical, chemical, and hydromorphological factors and evaluation of the catchment’s characteristics were also performed. Firstly, the assessment of substrate was performed, and cover values of each size category of substrate (%) were estimated. Types and proportions of inorganic and organic substrate (%) were surveyed according to classification by AQEM (2002). Biotic parameters were also estimated: cover of the pond surface with tree canopies (%), total cover of macrophytes (%), and cover of filamentous algae (%).
Characteristics of the catchment area around each pond were surveyed, such as the number of habitat types adjacent to the pond, within 10 m, and within 50 m from the water edge. Moreover, the intensity of land use was assessed within the 200 m area around the pond and was estimated on a five-degree scale: 5 = infrastructure objects and intensive agriculture (arable land) represent at least 80% of the land; 4 = objects and intensive agriculture represent 60 and 80% of land use; 3 = partly intensive agriculture land (40 to 60%), partly grassland/forest; 2 = intensively cultivated land represent 20 to 40% of the area; 1 = permanent grassland/forest represent at least 80% of the contribution area. The slope of the bottom (gentle slope, steep, very steep) and current water level (low, medium, high) were measured; the width of the riparian zone was evaluated with values 1–3 (<1 m, 1 < x < 5 m and >5 m); the slope of the bank was evaluated with values 1–4 (gentle slope, moderate slope, very steep slope, enforced bank). The surface areas of the ponds were calculated from the satellite images [29].
Measurements of chemical and physical characteristics of the water were performed twice, once in August with the multimeter PCD 650 (EUTECH, Singapore) and once in September with a multimeter AP—7000 (Aquaread, Broadstairs, UK). pH, water temperature (°C), conductivity (µS/cm), TDS (mg/L), oxygen concentration (mg/L), and saturation (%) were measured with both the multimeter (PCD 650, EUTECH) and the multiparameter meter (AP—7000, Aquaread) at approximately 10 cm depth. We also measured turbidity (NTU), ammonium (mg/L), nitrates (mg/L), chlorophyll a (μg/L), and Cyanobacterial phycocyanin BGA-PC (number of cells/mL) and CDOM (μg/L). The turbidity of the water was measured with a Secchi disc as well. Water depth was measured to calculate the coefficient water depth/Secchi depth.
Water samples were taken and analyzed in the laboratory, where the concentration of nitrate and orthophosphate were measured. Nitrates were determined using the sodium salicylate method. Extinction values were measured using a spectrophotometer (HACH Lange LT 200, Düsseldorf, Germany). Phosphates were determined using cuvette tests (LCK549) and a spectrophotometer manufactured by HACH-Lange.

2.3. Data Analyses

The taxonomic richness of the macrophyte community was assessed by counting the number of species on the selected sample plot. In some cases, where we were not able to determine the species, the genus level was used. The richness of the macroinvertebrate community was measured by determining and counting the number of families in the samples and the number of higher taxa such as order and subclass. The heterogeneity or diversity of both macrophytes and macroinvertebrates was calculated using the Shannon–Wiener (S-W) diversity index, Margalef (Mrg) diversity index, and dominance index (D). In the case of macrophytes, cover values were utilized, whereas, for macroinvertebrates, the number of families and higher taxa were considered. Additionally, the abundance of the macroinvertebrate community was also determined.
Correlations between environmental factors, diversity indices, and the structure of macrophyte and macroinvertebrate communities were calculated. The analysis was performed with R [33] and PAST programs [34]. Some data (shoreline width, number of habitat types, etc.) were non-normally distributed, so we used Spearman’s correlation coefficients (rs).
Direct gradient analyses were used to determine which environmental factors significantly influence the structure of surveyed communities. Detrended correspondence analysis (DCA) was performed with the matrices of macrophyte and macroinvertebrate data. This analysis revealed whether the gradients in the matrix of taxa are linear or unimodal, and which direct gradient analysis to use in further analyses. If the eigenvalue for the first axis was 0.4 or more and the gradient length exceeded 3 standard deviations [35], we used canonical correspondence analysis (CCA). An interactive forward selection analysis was conducted using the software package CANOCO version 5 [36] to identify the primary influence of environmental variables on macrophyte and macroinvertebrate communities and to explore the relationships between these communities. Forward selection of variables was conducted with 499 permutations. Only those variables with a statistically significant effect (p < 0.05) were considered. Ordination diagrams were generated based on the results of the CCA analysis. To mitigate the potential influence of rare species in our samples, macroinvertebrate species present in fewer than three samples and macrophyte species occurring in only one site were excluded from the analysis. We used transformation log10 (x + 1) for abundance data of macroinvertebrates.
To assess the importance of variables strongly correlated with macroinvertebrate diversity at the family level, we used Generalized Linear Models (GLMs) in R. To verify the appropriateness of the selected models with the chosen distribution, the residuals were examined using the Dharma package. Firstly, a GLM was used to analyze the relationship between the number of accompanying species and pond type. Secondly, a GLM was utilized to compare the diversity of macrophytes (MF) and macroinvertebrates (MI), with predictors, including macrophyte species richness and macrophyte dominance index. The dominance index is calculated as the proportion of the two most common species at a site compared to the rest of the species present. In the final analysis, conductivity, a variable strongly correlated with the MI community, was employed as the main predictor. Additionally, an interaction term was included in this analysis.

3. Results

The mean values of the selected environmental factors in both types of ponds are shown in Table 1. The conductivity in the natural ponds was significantly higher compared to that in the artificial ponds. The natural ponds also exhibited higher concentrations of nitrates but lower concentrations of orthophosphate. The width of the riparian zone vegetation was significantly higher in the natural ponds, while the cover of algae and intensity of the land use was more or less similar in both types of ponds. The higher Secchi depth in the artificial ponds indicated greater transparency than in the natural ponds. The artificial ponds had a higher percentage of finer substrates such as clay and sand.
We recorded 67 macrophyte taxa and 73 macroinvertebrate families belonging to 18 higher taxa (order, subclass, or class). The highest number of macrophyte taxa observed at a single location was 20, while the lowest recorded species count was 5 (Table 2). Regarding macroinvertebrate families, the maximum number at a single location was 38, whereas the minimum was 10. The macroinvertebrate samples contained 452.4 individuals on average; three samples exceeded 1000 individuals.
Among the plant species, Myriophyllum spicatum was found in most locations, while Typha latifolia dominated the largest total area among all the water bodies (Table 2). In regard to the MI community, the highest number of individuals belonged to Ephemeroptera (1946), Diptera (1246), Odonata (1224), and Isopoda (1181) among the higher macroinvertebrate taxa. Diptera, Ephemeroptera, Heteroptera, and Odonata were present at all the sampled locations. At the level of families, Baetidae and Chironomidae were the MI families found in all the studied water bodies. Baetidae was also the most abundant among all the families, with 1694 individuals.
One-third or 23 of the macrophyte species co-occurred in both types of ponds, among which the species that exceeded the average value of 1% per pond were Ceratophyllum demersum, Lemna minor, Myriophyllum spicatum, Myriophyllum verticillatum, Phragmites australis, Typha latifolia, and Utricularia australis. Two-thirds or 49 of the MI families co-occurred in both types of ponds, among which the families that exceeded the average value of two individuals per pond were Physidae, Planorbidae, Haplotaxidae, Hydrachnidia, Baetidae, Caenidae, Gerridae, Pleidae, Coenagrionidae, Polycentropodidae, Chironomidae, Culicidae, and Stratiomyidae.

3.1. Diversity Patterns in Natural and Artificial Ponds

The pond type has a strong influence on the MI diversity. The differences in the macroinvertebrate families, higher taxa, abundance, and macrophyte taxa between both types of ponds are presented in Table 3.
There was no significant difference in the diversity of the macrophytes between the natural and artificial ponds (Table 3). The mean number of the macrophyte taxa is 10.4 in the artificial and 10.8 in the natural ponds. The artificial ponds exhibited a higher standard error due to a large difference between the maximum and minimum values, but the mean values of both groups were very close. On the other hand, a significant difference between the two types of ponds was observed regarding the macroinvertebrate diversity on a family level. The mean value was 28.3 in the natural ponds and 16.1 in the artificial ponds, with a smaller standard error observed (Table 3).
Furthermore, a significant difference was found between the two types of ponds regarding the higher taxa of macroinvertebrates, with a mean of 11.7 families in the natural and 8.0 in the artificial ponds (Table 3). A similar difference was observed in the macroinvertebrate abundance, with a mean value of 890 individuals in the natural ponds and 220 individuals in the artificial ponds.

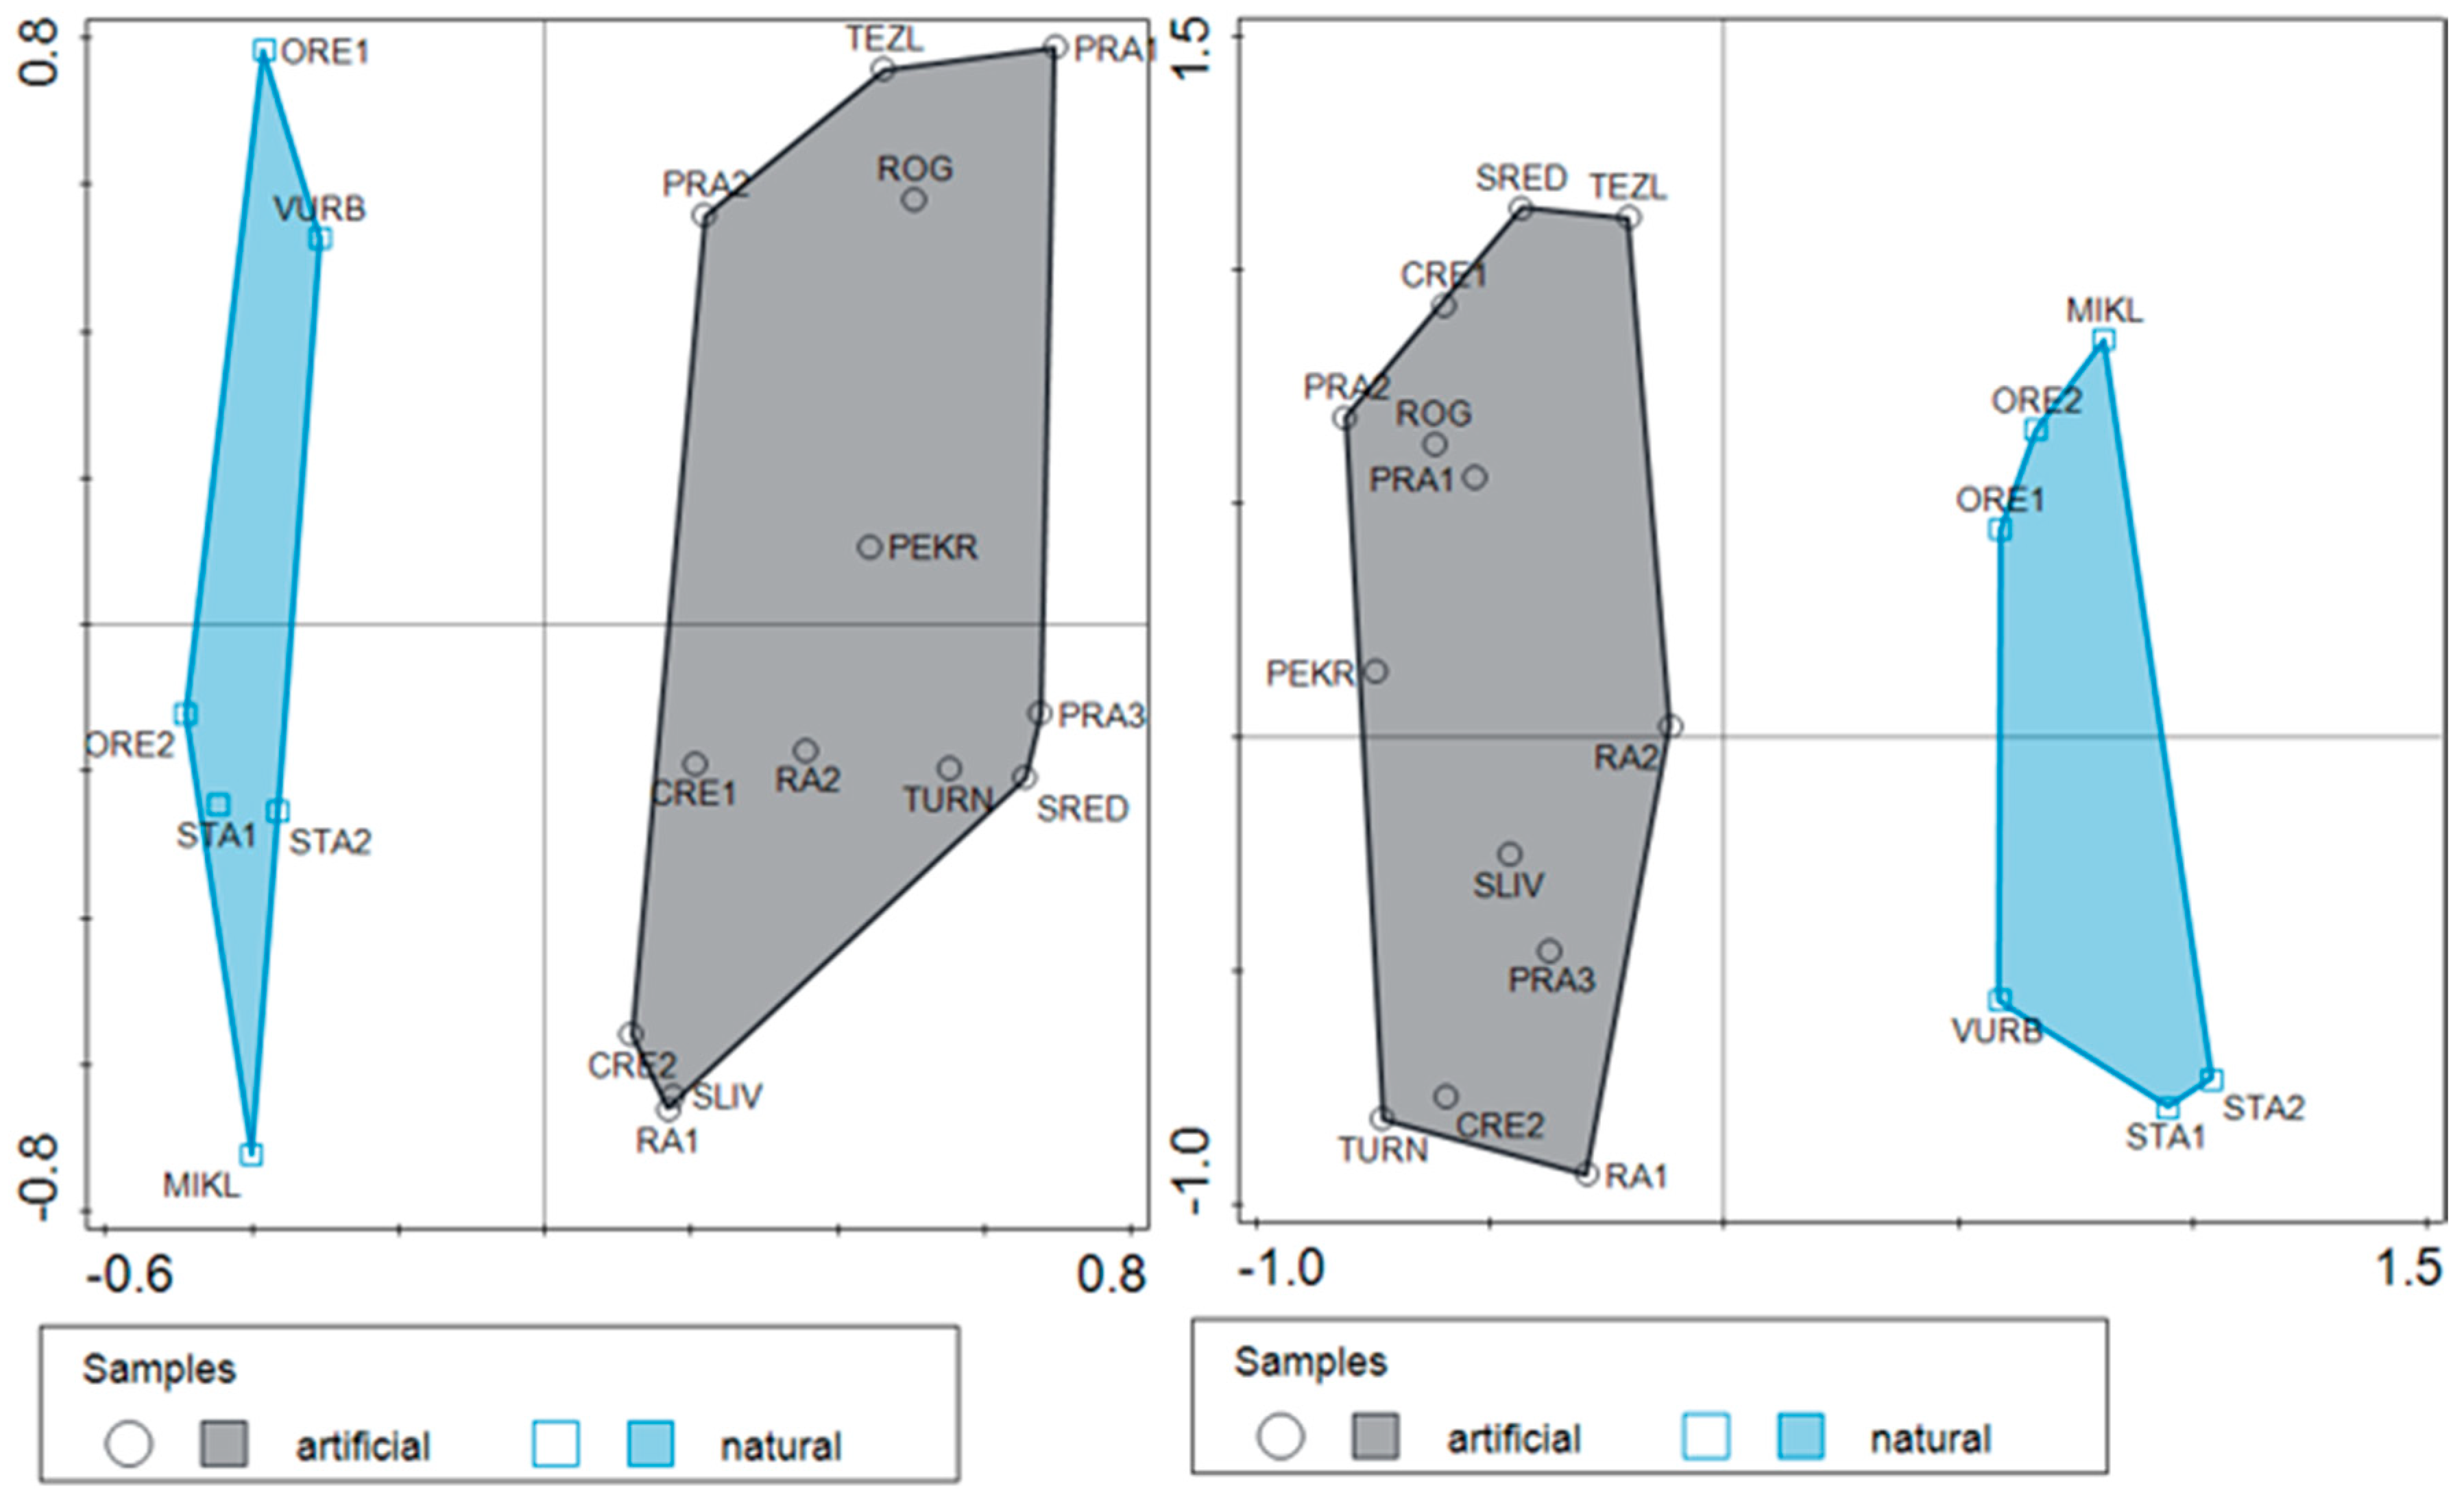
3.2. Differentiation in the Taxonomic Composition of Communities in the Artificial and Natural Ponds

The data of the macrophyte and macroinvertebrate communities were categorized by the pond type variable, aiming to compare the communities between the natural and artificial ponds (Figure 2). The communities in the natural and artificial ponds exhibit substantial differences in taxa composition. Certain taxa clearly prefer one type of pond over the other; for instance, MI families such as Leptoceridae, Asellidae, Erpobdellidae, Enchytraeidae, and Sphaeriidae are strongly associated with natural ponds. Conversely, families such as Hydrophilidae, Veliidae, Scirtidae, Ephydridae, and Ecnomidae show a preference for artificial ponds. Similarly, many macrophyte species are more commonly found in artificial ponds, while others are predominantly present in natural ponds. Notable examples include Carex elata, Elodea nuttallii, Sparganium erectum agg., and others, which exhibit a preference for natural ponds.

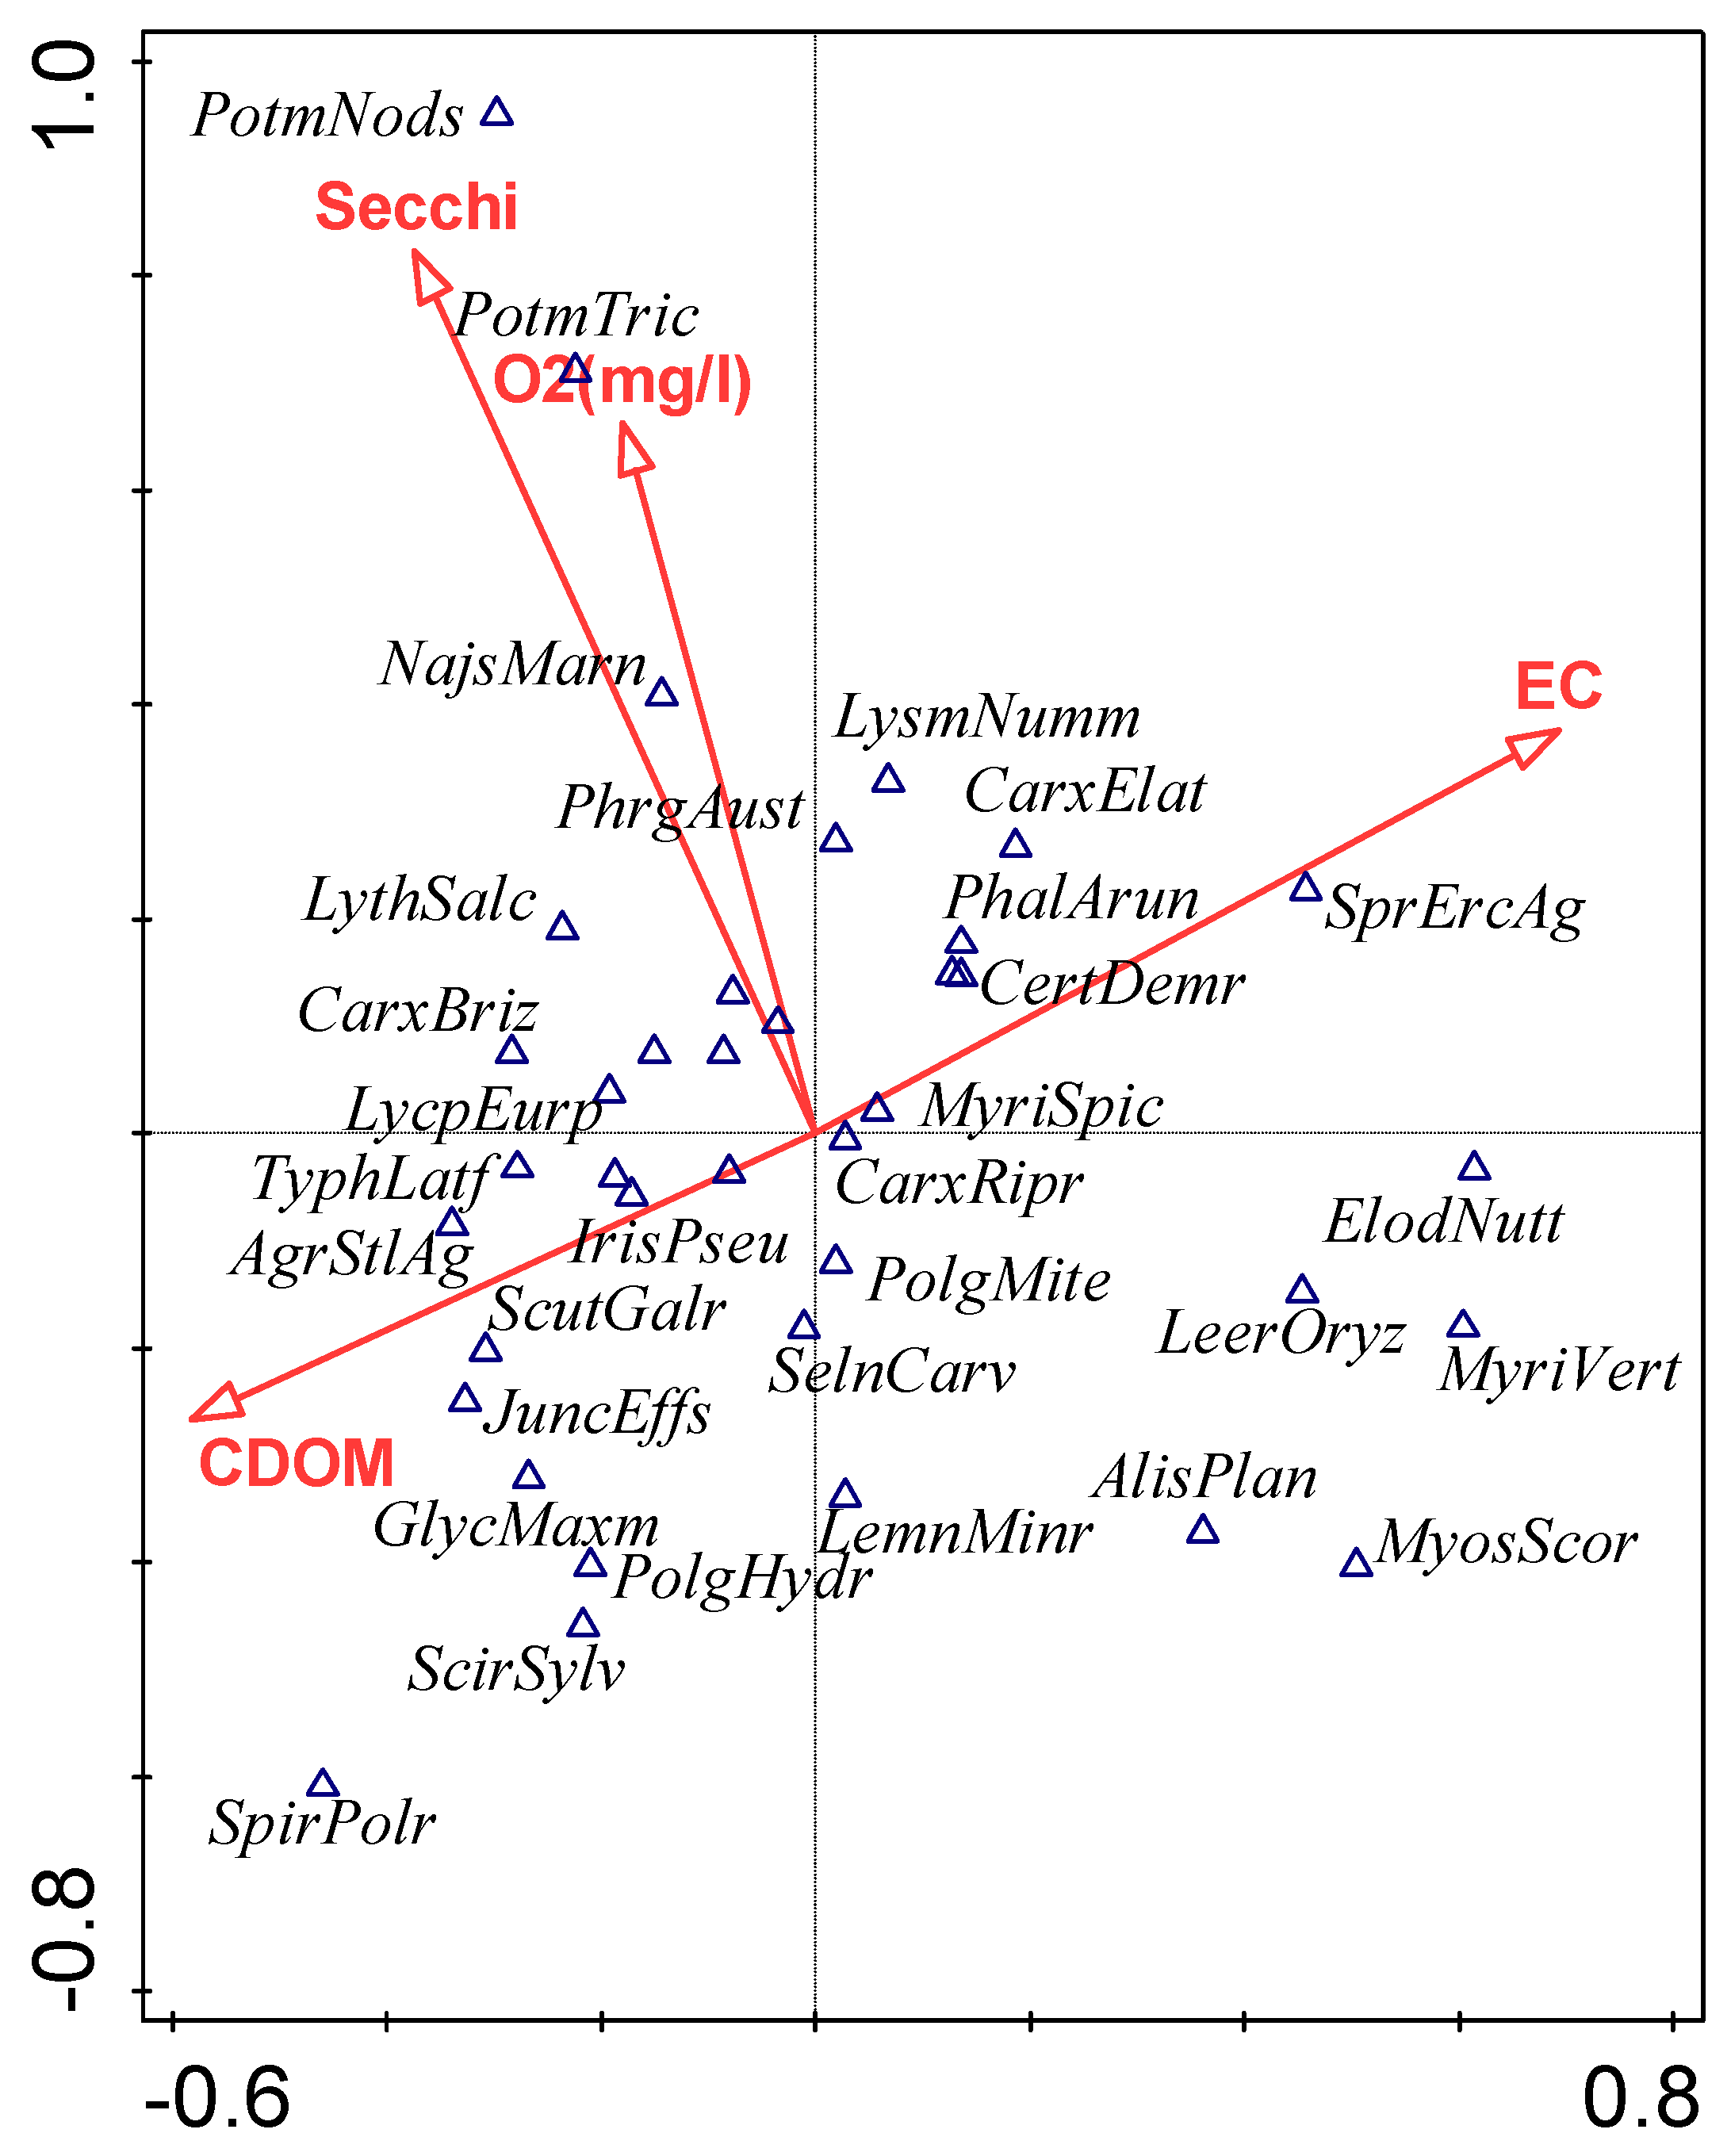
3.3. Influence of Environmental Factors on Macrophyte Community Composition

Figure 3 presents which environmental factors statistically significantly influence the composition of the macrophyte community. Four factors, such as the water transparency (Secchi depth), conductivity, concentration of O2, and concentration of colored dissolved organic matter (CDOM), were found to have a statistically significant influence on the composition of the macrophyte communities, together accounting for 33.1% of the variability. The Secchi depth and conductivity explained 8.9% of the variability (p = 0.012, and p = 0.006). The CDOM accounts for 8.0% of the variability (p = 0.024), while the concentration of O2 explains 7.3% of the community’s variability (p = 0.042). Potamogeton nodosus, Potamogeton trichoides, and, to a lesser extent, Najas marina exhibited strong correlations with the Secchi depth and O2 variables. Additionally, it was observed that Sparganium erectum agg. was associated with higher values of conductivity, while most other species exhibited the opposite relationship. Figure 3 also shows that the gradient of the CDOM is in the opposite direction to that of the EC and both exert an influence on the distribution of a few plant species. Specifically, Spirodela polyrhiza, Scirpus sylvaticus, and Glyceria maxima were associated with higher values of CDOM.

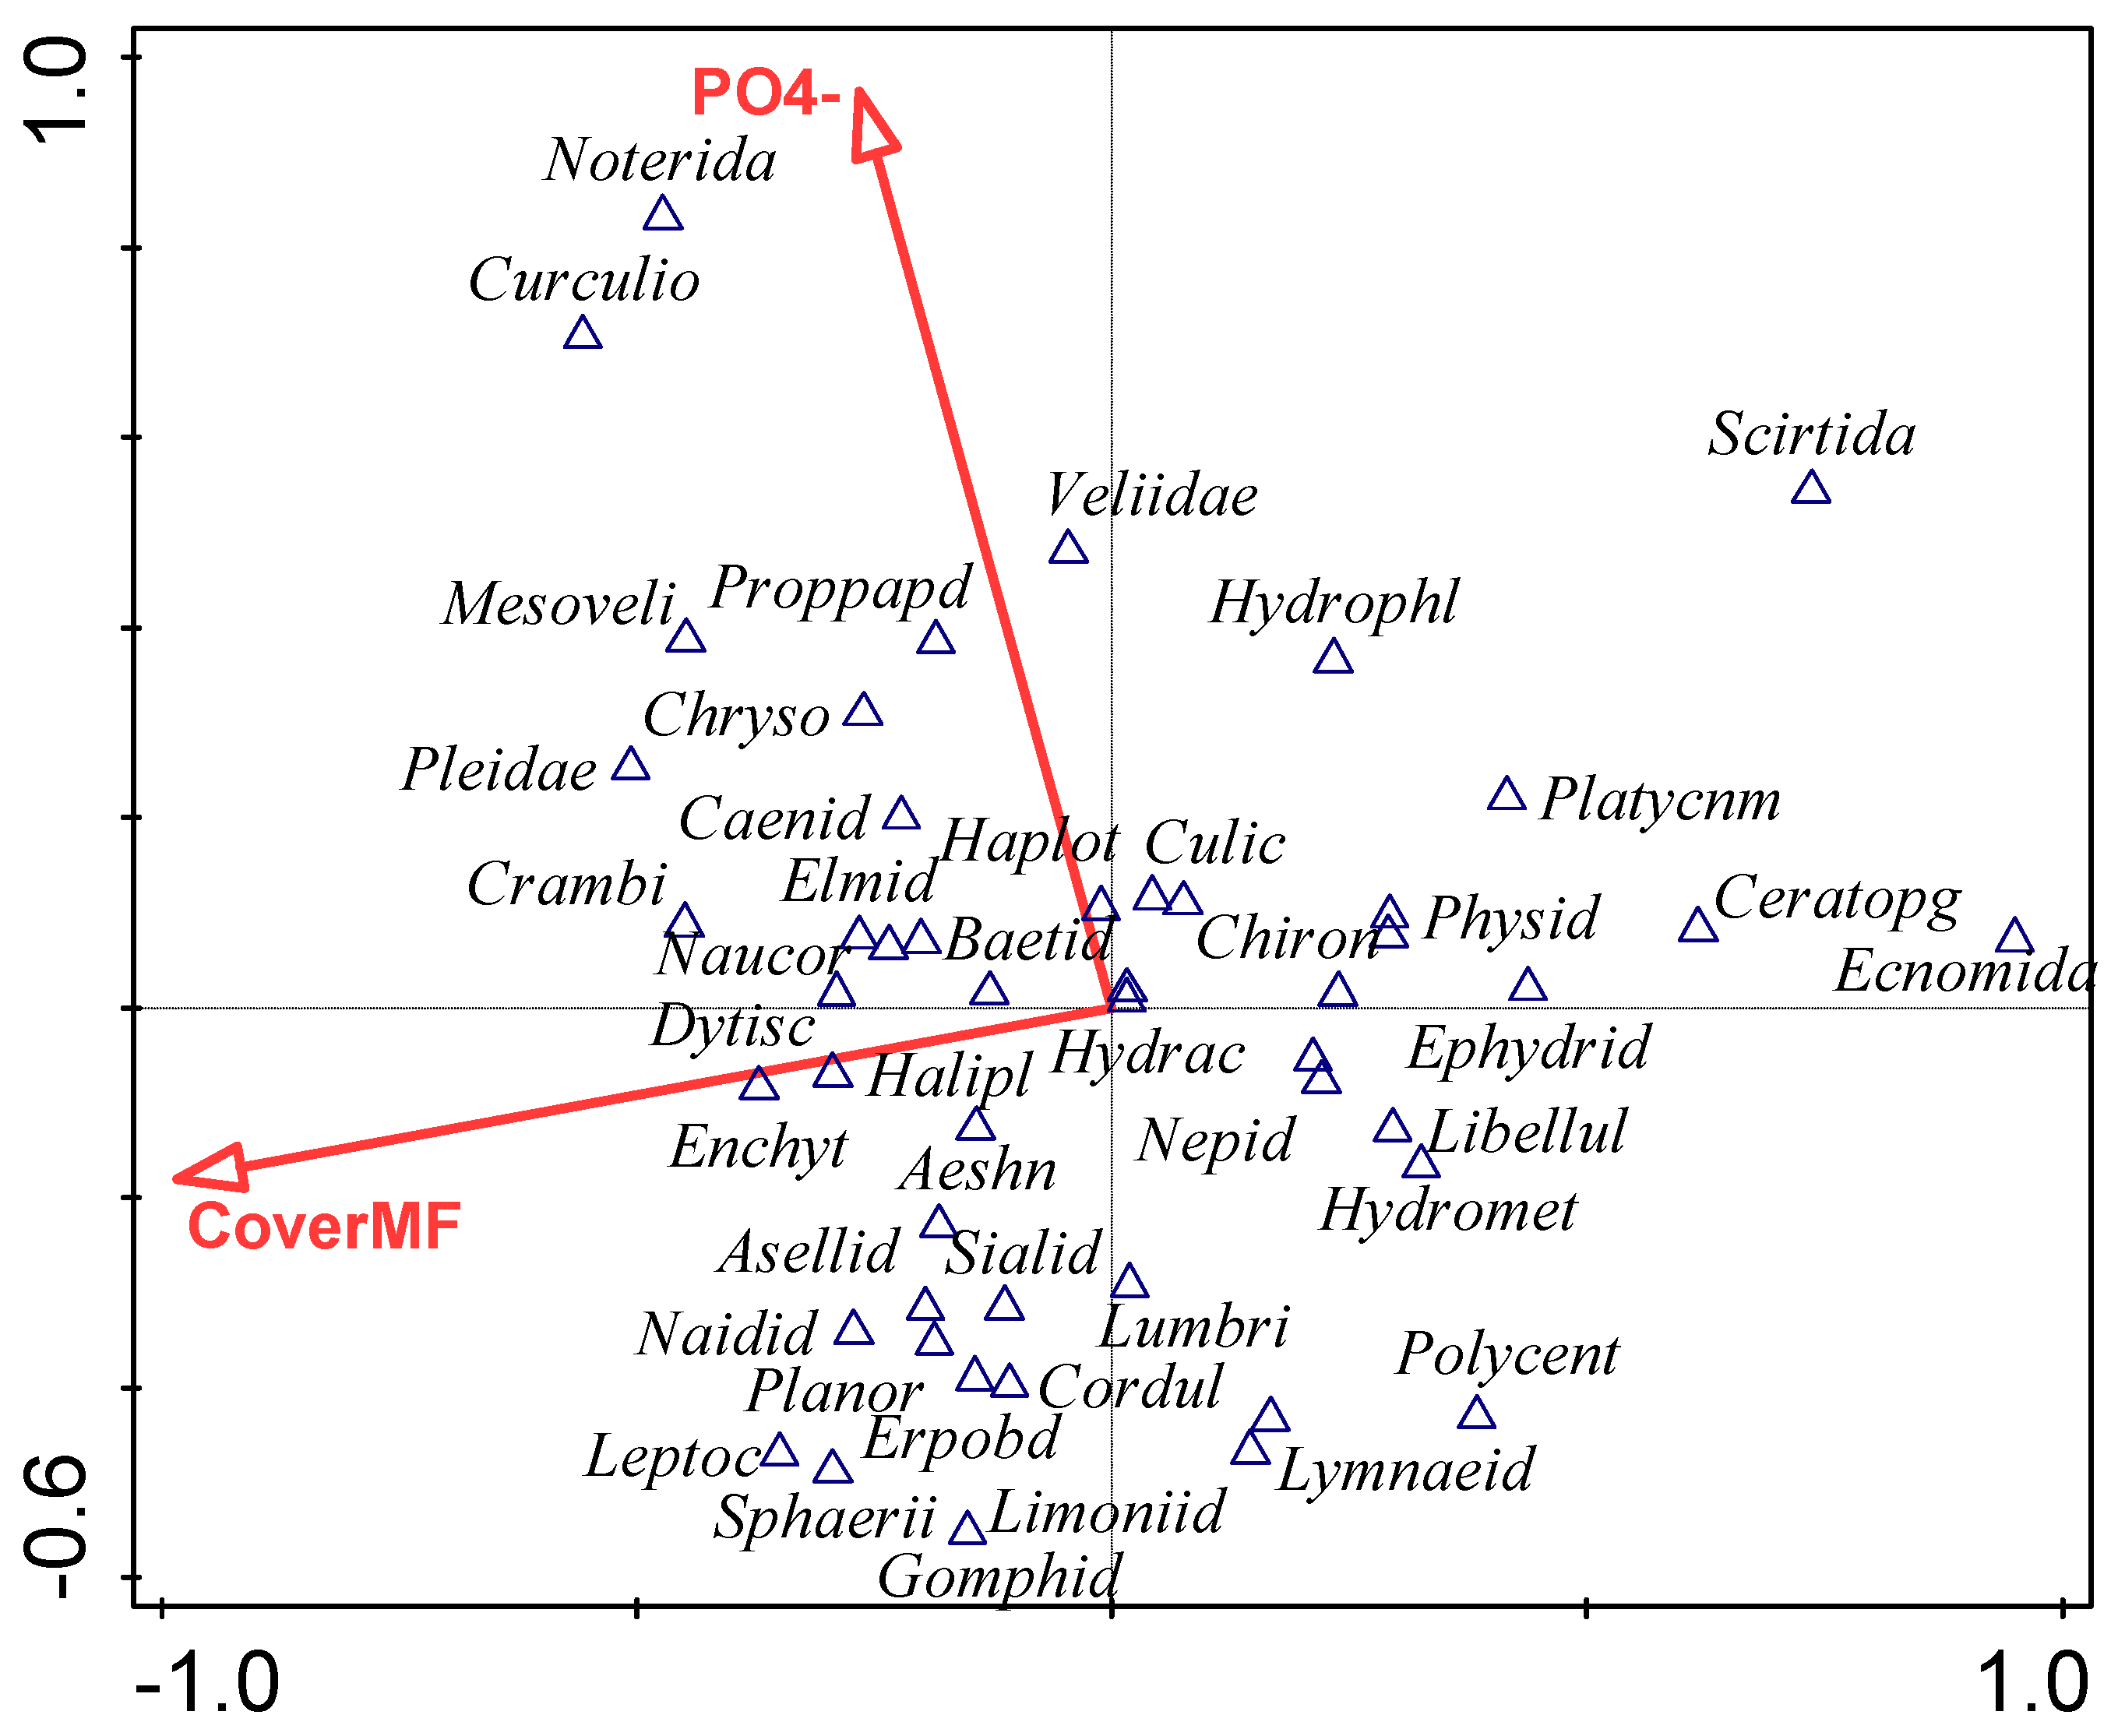
3.4. Influence of Environmental Factors on Macroinvertebrate Community

The concentration of orthophosphate (PO43−) and the macrophyte coverage were the only factors that significantly influenced the composition of the macroinvertebrate community. Together, they explained 19.8% of the variability of the community (Figure 4). The coverage of the macrophytes accounted for 11.0% (p = 0.004) of the variation. The families Scirtidae and Ecnomidae exhibited the highest abundance in ponds with very low macrophyte cover. The concentration of PO43− had a less significant impact on the macroinvertebrate community compared to the macrophyte coverage, explaining 8.6% (p = 0.042) of the variation. However, certain taxa showed a strong correlation with this variable. For instance, the family Noteridae strongly preferred PO43− with the highest abundance in one pond in Rače, in the RAC1 pond, where its concentration was 220 µg/L. These results suggested a preference among many taxa for higher macrophyte coverage and lower concentrations of PO43−. Additionally, the measurements of the CDOM, riparian zone width, and water temperature also emerged as important factors in the analysis.

3.5. Influence of Environmental Factors on the Diversity of Macroinvertebrate Community

The results of the Spearman correlation analyses revealed that there was no significant correlation between the macrophyte and macroinvertebrate taxonomic richness. In the case of the Shannon–Wiener diversity index calculated on the basis of the macrophyte community, the correlation with the number of macroinvertebrate families was statistically significant. However, the correlation was much stronger when the dominance index was used. The GLM analysis explored the impact of environmental factors on the diversity of the macroinvertebrate community. The results revealed a significant influence of the macrophyte dominance index, and specifically, we found that the dominance of macrophytes had a significant negative effect on the diversity of the macroinvertebrate community (p = 0.0108) (see Figure 5).
Figure 5 displays the relationship between the dominance index of the macrophytes and the number of macroinvertebrate families. Figure 5 reveals a clear inverse relationship between the dominance index of the macrophytes (macrophyte dominance index) and the number of MI families. As the dominance index increases, the diversity of the macroinvertebrates decreases. This relationship was also one of the two highly significant correlations between the diversity indices of both studied communities (Table 4).

3.6. Influence of Macrophyte Taxa on the Macroinvertebrate Communities

Among the macrophytes, Lythrum salicaria, Carex riparia, Elodea nuttallii, and Phalaris arundinacea were found to have a statistically significant influence on the macroinvertebrate communities, collectively accounting for 33.8% of the variability in the community.
The abundance of Lythrum salicaria was found to be the most important, explaining 9.8% of the community variation (p = 0.008). A strong preference for abundant Lythrum salicaria was observed for Scirtidae, Ecnomidae, Ephydridae, and Ceratopogonidae. Carex riparia explained 9.7% of the community variation (p = 0.01) and was preferred by Gomphidae, Limoniidae, Corduliidae, Leptoceridae, and Crambidae. Elodea nuttallii accounted for 7.4% of the variation in the community (p = 0.02), with the mussel family Sphaeriidae showing a particular affinity. The family Sphaeriidae was exclusively found in the natural oxbows, which also applies to the invasive alien species Elodea nuttallii. Phalaris arundinacea had less impact on the macroinvertebrate community variation, explaining 6.9% of it (p = 0.044). The gastropod families Lymnaeidae and Planorbidae showed a relatively strong affinity with this macrophyte.

4. Discussion

The results revealed that diverse aquatic environments provide habitats for numerous taxa of aquatic macrophytes and macroinvertebrates. Sixty-seven taxa of macrophytes were recorded in 19 water bodies. Such a high biodiversity of water bodies in agricultural landscapes has been reported in many similar studies [5,8,9]. Some of the recorded macrophyte species are rare in Slovenia, such as Utricularia australis and Najas marina, rendering their discovery of considerable importance.
The number of macroinvertebrate families recorded (73) was high as well. The most abundant taxa were Ephemeroptera, Diptera, Odonata, and Isopoda (Table 2), which is similar to the results in Ruhi et al. [11], who report that the most abundant taxa were Ephemeroptera, Heteroptera, and Diptera.

4.1. Diversity Patterns in Natural and Artificial Ponds

The differences in the diversity of the macroinvertebrates between the natural and artificial ponds were statistically significant, while there was no significant difference in the macrophyte diversity (Table 3). The number of macrophyte species in the natural ponds was closely clustered around the mean value, while it was variable in the artificial ponds, where the highest (14) and the lowest (5) numbers of macrophytes were recorded among all the sites. These variations in the artificial ponds can be attributed to different management practices. While most natural ponds were left to succession, some artificial ponds were subjected to intensive management, including vegetation cutting, bottom deepening, and creating steep banks. Svitok et al. [14] report that natural ponds harbor almost double the number of macrophyte species compared to artificial ponds, which generally have steeper banks, while natural ponds tend to be shallower with gently sloping banks [5,14] positively influencing macrophyte cover, species richness, and diversity.
The number of macroinvertebrate families and higher taxa and their abundance were significantly higher in the natural ponds (Table 3). All the artificial ponds, except one, were situated on clay and loam, while the bottom of the natural ponds predominantly consisted of gravel, pebbles, and sand [30], which is likely to influence their conditions. The significantly higher macrophyte cover in the natural ponds (Table 3) is one of the most important factors determining the higher diversity of the MI in the natural water bodies. The conductivity was also significantly higher in the natural than artificial ponds, which aligns with Walker et al. [17].

4.2. Different Taxonomic Composition of Communities in the Artificial and Natural Ponds

Apparent differences in the taxonomic composition of both studied communities can be observed between the natural and artificial ponds (Figure 2). Certain plant taxa exhibited clear preferences for one type of the ponds, such as Lythrum salicaria, Najas marina, Juncus effusus, Glyceria maxima, Spirodela polyrhiza, which were found exclusively in the artificial ponds. Conversely, Carex elata and Elodea nuttallii were only present in the natural ponds. Regarding the macroinvertebrate families, Sphaeriidae and Leptoceridae were exclusively found in the natural ponds, while Gomphidae, Asellidae, and Enchytraeidae clearly preferred the natural ponds. On the other hand, the family Scirtidae was present in the artificial ponds only, along with Hydrophilidae, Noteridae, Veliidae, and Ecnomidae, which showed a preference for this type of pond.
Specific environmental conditions could lead to these taxonomic differences, as many environmental factors differ between these types of ponds (Table 1). Among them, the more diverse sediment (higher percentage of pebbles, gravel, and CPOM), the higher conductivity, lower PO43− concentration, and a higher percentage of macrophyte cover in the natural ponds could be the reasons for the differences in their taxonomic composition.

4.3. Influence of Environmental Factors on Macrophyte Community Composition

Four factors, including the Secchi depth (transparency), conductivity, concentration of O2, and concentration of colored dissolved organic matter (CDOM), were found to have a statistically significant influence on the composition of the macrophyte community (Figure 3), together accounting for 33.1% of its variability. It has also been found in ponds in Wales that the macrophyte richness is significantly related to conductivity and also to pH, shade, and vegetated area [37].
Water transparency is often reported as an important factor determining the macrophyte community composition, as greater transparency is usually accompanied by higher species richness [2,14,38,39], particularly in the case of submerged macrophytes. Species such as Potamogeton trichoides, P. nodosus, and Najas marina were found in ponds with a high water transparency and oxygen concentration. Ibelings et al. [40] claim that high transparency, which improves light conditions for submerged macrophytes, can be achieved only with high macrophyte coverage and low TP. Reduced water transparency may result from an elevated inflow of allochthonous material or the activity of benthivorous fish [15], such as common carp, which may uproot submerged vegetation during spawning and while foraging for benthic invertebrates [41].
In ponds with lower oxygen concentrations, we recorded a higher abundance of species from the Lemnaceae family, such as Spirodela polyrhiza and Lemna minor (Figure 3). Floating macrophytes creating shade negatively affect the O2 concentration in the water, as they hinder the growth of submerged plants that release oxygen into the water [42].
Consistent with our results, Lukacs et al. [39] reported conductivity as one of the most important factors structuring the macrophyte community in lakes. Certain taxa such as Sparganium erectum agg., Carex elata, Phalaris arundinacea, Ceratophyllum demersum, and Elodea nuttallii were mainly found in the natural water bodies, where the conductivity was higher. Some species are restricted to water bodies with lower conductivity, as they are not tolerant to high nutrient levels, which has also been reported by [43], who claim that certain species cannot withstand conductivity levels higher than 300 µS/cm.

4.4. Influence of Environmental Factors on Macroinvertebrate Community Composition

Orthophosphate and the coverage of macrophytes significantly influenced the structure and variability of the macroinvertebrate community (Figure 4). Many studies have pointed out that the macrophyte coverage and concentration of phosphorus determine the variability of the macroinvertebrate community [2,17,44]. Dense vegetation offers a higher complexity of habitats with many shelters and diverse food sources. It can also reduce the foraging efficiency of fish [28].
Many taxa preferred sites with a lower concentration of orthophosphate and a higher proportion of macrophytes, such as Leptoceridae, Sphaeriidae, and Gomphidae (Figure 4). On the contrary, Scirtidae and Ecnomidae preferred ponds with less vegetation. The family Scirtidae can be found in plant detritus and leaf litter, where their larvae feed [45]. Beetles of the families Noteridae and Curculionidae were found in habitats with higher orthophosphate concentrations. Runoff from agricultural land could have increased these concentrations. Angelibert [46] documented phosphorus accumulation in sediments, particularly in areas with a high amount of submerged plant biomass, which enhances phosphorus release from sediments under anoxic conditions [46,47].

4.5. Influence of Environmental Factors on the Diversity of Macroinvertebrate Community

The correlation analyses revealed that conductivity significantly correlated with the number of macroinvertebrate families and their abundance. Many authors have reported conductivity as one of the most critical factors influencing macroinvertebrate diversity and abundance [11,17,48]. The overall effect on the macroinvertebrate diversity could result from complex interactions between different species and their responses to conductivity, which is used as a proxy for nutrient loads [49]. However, we could not confirm such correlations on the basis of our results.
The high concentrations of nitrates and conductivity but lower temperatures of the water in ponds close to the Drava River (Table 1) are most likely a result of groundwater inflows [30], in which water from arable land infiltrates and enriches the groundwater feeding this group of ponds. Stefanidis [49] also reported the possible importance of surfaces draining from the cultivated area. Our results suggest that land use at a distance of 200 m from a habitat edge has a nonsignificant impact on macroinvertebrate richness, so it is likely that the 200 m contributing area is not as important as the groundwater flow, since it supplies water from a greater distance.
In contrast to our hypothesis, we did not observe any statistically significant relationship between the macrophyte and macroinvertebrate taxonomic richness. On the other hand, we found a significant influence of macrophyte coverage and heterogeneity on the number of macroinvertebrate families. This differs from a study conducted in karst ponds, which emphasized that the macrophyte diversity had a greater impact on the macroinvertebrate diversity than the macrophyte coverage [10].
The GLM analysis revealed a significant negative effect of the macrophyte dominance index on the macroinvertebrate diversity (Figure 5). The dominance of one or two species reduces the habitat complexity, suggesting that the higher dominance of specific macrophyte species creates less favorable conditions for a diverse macroinvertebrate community. Species such as Typha latifolia, Phragmites australis, and Spirodela polyrhiza were dominant in certain ponds. The most extreme example was observed in the TURN pond, where Spirodela polyrhiza covered 80% of the water surface, along with Lemna minor, creating harsh conditions for other aquatic organisms. A decrease in invertebrate diversity during the later stages of succession when emergent macrophytes become dominant was reported by Angelibert [46] and Cereghino et al. [8].

4.6. Influence of Macrophyte Taxa on the Macroinvertebrate Communities

Taxa such as Lythrum salicaria, Carex riparia, Elodea nuttallii, and Phalaris arundinacea were found to have a significant impact on the structure of the macroinvertebrate community. These four species together account for 33.8% of the variability in the community. It was found that the Ceratophyllum and Elodea habitats support the greatest number of macroinvertebrates within a small eutrophic pond [17].
Lythrum salicaria was recorded in the artificial ponds only. Macroinvertebrate families, notably Scirtidae, Ecnomidae, Ceratopogonidae, Platycnemidae, and Ephydridae, primarily associated with this pond type, exhibit strong correlations with L. salicaria, which is used by insects to complete their life cycle, transforming from larvae to adults through pupation. This includes dipterans like Ceratopogonidae and Ephydridae [20] and coleopterans such as Scirtidae [45].
Corduliidae, Gomphidae, and Limoniidae strongly prefer sites with C. riparia. Its habitus probably represents a suitable place to hide and enables them to catch prey, and also helps their latest larval instars to leave the water environment. Remsburg [50] reported that sites with Carex, Typha, or Iris covering more of the shoreline had higher densities of Gomphidae exuviae.
E. nuttallii seems to be a preferred microhabitat for the family Sphaeriidae, of which the genus Pisidium is well known to climb up these macrophytes. The same seems to be the case with leeches from the Erpobdellidae family and snails from the family Planorbidae and Lymnaeidae. Submerged plants contribute to the increased available habitat surface, thereby enhancing the diversity and abundance of macroinvertebrate communities [20,51]. This is even more evident for highly branched and dissected macrophyte growth forms [17]. It was recently reported that alien macrophyte impacts are not only negative [52,53] but they could also provide a niche to many invertebrate families. However, they can also negatively affect native vegetation. P. arundinacea had a negligible impact on macroinvertebrate community variation. The results highlight that vegetation structure plays a more pivotal role in shaping macrofauna communities than a mere association with specific plant species [17].

4.7. Monitoring and Management

The presence of invasive alien species in the studied natural ponds, such as Elodea nuttallii, raises concerns, as the abundance of invasive species can significantly influence the community structure of other organisms [11]. Our results revealed that E. nuttalli was one of the four macrophyte species which significantly shaped the structure of the MI community. In our previous research [54], we realized that the mentioned, as well as other IAS, did not negatively influence the diversity of macrophyte communities in a group of these waterbodies situated on the floodplain along the Drava River. However, E. nuttallii is a highly competitive species known for its rapid spread [16], so continuous monitoring is strongly recommended.
The proper management of the ponds is pivotal for maintaining diverse aquatic ecosystems. Our research underscores a substantial contrast between ponds subject to intensive management and those with minimal human impact regarding macrophyte and macroinvertebrate communities. Intensive management, such as the removal of aquatic plants and riparian vegetation, dredging, and altering the littoral steepness, should be avoided to maintain high macrophyte and macroinvertebrate diversity. On the other hand, the expansion of one dominant species should be prevented as well to avoid the unification of the ponds. According to the results of our research and data from the literature, it is clear that there is hardly a single management policy that maintains the biodiversity of all groups of organisms [37]. We advise moderate management practices, such as the removal of woody vegetation or the partial removal of monospecific emergent vegetation, to prevent the overgrowth and unification of ponds, which aligns with the intermediate-intensity or moderate-intensity management described by Grime [55].
Regarding pond monitoring and technological advances, Hill et al. [52] recently emphasized the use of molecular tools like eDNA, DNA metabarcoding, and advances in remote sensing, unmanned aerial vehicles, and biostatistics.

5. Conclusions

Diverse macrophyte and macroinvertebrate communities were found in the Drava field. Our results revealed significant negative correlations between the taxonomic richness of macroinvertebrates and the macrophyte dominance index. High macroinvertebrate diversity tends to exist in ponds without a pronounced dominance of a single macrophyte species or with a low total cover of macrophytes. In addition, our study has unveiled a variety of factors that influence the diversity and structure of the macroinvertebrate community, such as the pond type, conductivity, type of substrate in the ponds, and others. The diversity of macrophytes contributes to habitat complexity and provides hiding places and food sources. We also found a significant difference in the diversity, abundance, and taxonomic composition of macrophyte and macroinvertebrate communities between the natural and artificial ponds. Our results reveal that specific environmental factors are of significant importance for both communities. Different factors determined the diversity and variability of the macrophyte and macroinvertebrate communities, indicating the need to monitor both communities. It would be useful to study the influence of different growth forms of macrophytes on the composition of aquatic invertebrates. It would be useful to include the response of functional forms of invertebrates to macrophyte composition. In further research, we will focus more on invasive alien species and include more water bodies for more reliable conclusions. It would be necessary to provide a reliable scientific basis for pond management.

Author Contributions

Conceptualization, I.Z. and M.G.; methodology, I.Z. and M.G.; validation, Ž.T., I.Z., and M.G.; formal analysis, Ž.T.; investigation, Ž.T., I.Z., and M.G.; data curation, Ž.T.; writing—original draft preparation, Ž.T.; writing—review and editing, I.Z. and M.G.; visualization, Ž.T. and I.Z.; supervision, I.Z. and M.G.; funding acquisition, M.G. All authors have read and agreed to the published version of the manuscript.

Funding

We give thanks to the Slovenian Research Agency for supporting this research within the core research funding ‘Biology of Plants’, Grant Nr. P1-0212.

Data Availability Statement

Data can be provided upon reasonable request.

Acknowledgments

The authors thank Matej Holcar for their help in the field and in the laboratory.

Conflicts of Interest

The authors declare no conflicts of interest.

References

  1. Williams, P.; Whitfield, M.; Biggs, J.; Bray, S.; Fox, G.; Nicolet, P.; Sear, D. Comparative biodiversity of rivers, streams, ditches and ponds in an agricultural landscape in Southern England. Biol. Conserv. 2004, 115, 329–341. [Google Scholar] [CrossRef]
  2. Hassal, C.; Hollinshead, J.; Hull, A. Environmental correlates of plant and invertebrate species richness in ponds. Biodivers. Conserv. 2011, 20, 3189–3222. [Google Scholar] [CrossRef]
  3. De Meester, L.; Declerck, S.; Stoks, R.; Louette, G.; Van De Meutter, F.; De Bie, T.; Michels, E.; Brendonck, L. Ponds and pools as model systems in conservation biology, ecology and evolutionary biology. Aquat. Conserv. Mar. Freshw. Ecosyst. 2005, 15, 715–725. [Google Scholar] [CrossRef]
  4. Davidson, N.C.; Finlayson, C.M. Extent, regional distribution and changes in area of different classes of wetland. Mar. Freshw. Res. 2018, 69, 1525–1533. [Google Scholar] [CrossRef]
  5. Bubíková, K.; Hrivnák, R. Artificial ponds in Central Europe do not fall behind the natural ponds in terms of macrophyte diversity. Knowl. Manag. Aquat. Ecosyst. 2018, 419, 8. [Google Scholar] [CrossRef]
  6. Soomets, E.; Rannap, R.; Lõhmus, A. Patterns of assemblage structure indicate a broader conservation potential of focal amphibians for pond management. PLoS ONE 2016, 11, e0160012. [Google Scholar]
  7. Hill, M.J.; Biggs, J.; Thornhill, I.; Briers, R.A.; Ledger, M.; Gledhill, D.G.; Wood, P.J.; Hassall, C. Community heterogeneity of aquatic macroinvertebrates in urban ponds at a multi-city scale. Landsc. Ecol. 2018, 33, 389–405. [Google Scholar] [CrossRef]
  8. Cereghino, R.; Ruggiero, A.; Marty, P.; Angelibert, S. Biodiversity and distribution patterns of freshwater invertebrates in farm ponds of a south-western French agricultural landscape. Hydrobiologia 2008, 597, 43–51. [Google Scholar] [CrossRef]
  9. Davies, B.R.; Biggs, J.; Williams, P.J.; Lee, J.T.; Thompson, S. A comparison of the catchment sizes of rivers, streams, ponds, ditches and lakes: Implications for protecting aquatic biodiversity in an agricultural landscape. Hydrobiologia 2008, 597, 7–17. [Google Scholar] [CrossRef]
  10. Zelnik, I.; Gregorič, N.; Tratnik, A. Diversity of macroinvertebrates positively correlates with diversity of macrophytes in karst ponds. Ecol. Engin. 2018, 117, 96–103. [Google Scholar] [CrossRef]
  11. Ruhi, A.; Boix, D.; Sala, J.; Gascon, S.; Quintana, X.D. Spatial and temporal patterns of pioneer macrofauna in recently created ponds: Taxonomic and functional approaches. Hydrobiologia 2009, 634, 137–151. [Google Scholar] [CrossRef]
  12. Reyne, M.; Nolan, M.; McGuiggan, H.; Aubry, A.; Emmerson, M.; Marnell, F.; Reid, N. Artificial agri-environment scheme ponds do not replicate natural environments despite higher aquatic and terrestrial invertebrate richness and abundance. J. Appl. Ecol. 2020, 58, 304–314. [Google Scholar] [CrossRef]
  13. Zelnik, I.; Potisek, M.; Gaberščik, A. Environmental conditions and macrophytes of Karst ponds. Pol. J. Environ. Stud. 2012, 21, 1911–1920. [Google Scholar]
  14. Svitok, M.; Hrivnák, R.; Kochjarová, J.; Oťaheľová, H.; Paľove-Balang, P. Environmental thresholds and predictors of macrophyte species richness in aquatic habitats in central Europe. Folia Geobot. 2015, 51, 227–238. [Google Scholar] [CrossRef]
  15. Misteli, B.; Pannard, A.; Labat, F.; Fosso, L.K.; Baso, N.C.; Harpenslager, S.F.; Motitsoe, S.N.; Thiebaut, G.; Piscart, C. How Invasive Macrophytes Affect Macroinvertebrate Assemblages and Sampling Efficiency: Results from a Multinational Survey. Limnologica 2022, 96, 125998. [Google Scholar] [CrossRef]
  16. Germ, M. Biologija Vodnih Rastlin: Učbenik; Samozaložba: Ljubljana, Slovenia, 2013; 72p. [Google Scholar]
  17. Walker, P.D.; Wijnhoven, S.; van der Velde, G. Macrophyte presence and growth form influence macroinvertebrate community structure. Aquat. Bot. 2013, 104, 80–87. [Google Scholar] [CrossRef]
  18. Orozco-González, C.E.; Ocasio-Torres, M.E. Aquatic Macroinvertebrates as Bioindicators of Water Quality: A Study of an Ecosystem Regulation Service in a Tropical River. Ecologies 2023, 4, 209–228. [Google Scholar] [CrossRef]
  19. Kagalou, I.; Economidis, G.; Leonardos, I.; Papaloukas, C. Assessment of a Mediterranean shallow lentic ecosystem (Lake Pamvotis, Greece) using benthic community diversity: Response to environmental parameters. Limnologica 2006, 36, 269–278. [Google Scholar] [CrossRef]
  20. Bazzanti, M.; Coccia, C.; Dowgiallo, M.G. Microdistribution of macroinvertebrates in a temporary pond of Central Italy: Taxonomic and functional analyses. Limnologica 2010, 40, 291–299. [Google Scholar] [CrossRef]
  21. Moss, B.; Stephen, D.; Alvarez, C.; Becares, E.; van de Bund, W.; Collings, S.E.; van Donk, E.; de Eyto, E.; Feldmann, T.; Fernandez-Alaez, C.; et al. The determination of ecological status in shallow lakes—A tested system (ECOFRAME) for implementation of the European Water Framework Directive. Aquat. Conserv. Mar. Freshw. Ecosyst. 2003, 13, 507–549. [Google Scholar] [CrossRef]
  22. Trigal, C.; Garcia-Criado, F.; Fernandez-Alaez, C. Towards a multimetric index for ecological assessment of Mediterranean flatland ponds: The use of macroinvertebrates as bioindicators. Hydrobiologia 2009, 618, 109–123. [Google Scholar] [CrossRef]
  23. Sand–Jensen, K.; Riis, T.; Vestergaard, O.; Larsen, S.E. Macrophyte decline in Danish lakes and streams over the past 100 years. J. Ecol. 2000, 88, 1030–1040. [Google Scholar] [CrossRef]
  24. Stendera, S.; Adrian, R.; Bonada, N.; Canedo–Arguelles, M.; Hugueny, B.; Januschke, K.; Pletterbauer, F.; Hering, D. Drivers and stressors of freshwater biodiversity patterns across different ecosystems and scales: A review. Hydrobiologia 2012, 696, 1–28. [Google Scholar] [CrossRef]
  25. Della Bella, V.; Bazzanti, M.; Chiarotti, F. Macroinvertebrate diversity and conservation status of Mediterranean ponds in Italy: Water permanence and mesohabitat influence. Aquat. Conserv. Mar. Freshw. Ecosyst. 2005, 15, 583–600. [Google Scholar] [CrossRef]
  26. Burdett, A.S.; Watts, R.J. Modifying living space: An experimental study of the influences of vegetation on aquatic invertebrate community structure. Hydrobiologia 2009, 618, 161–173. [Google Scholar] [CrossRef]
  27. Milesi, S.V.; Dolédec, S.; Melo, A.S. Substrate heterogeneity influences the trait composition of stream insect communities: An experimental in situ study. Freshw. Sci. 2016, 35, 1321–1329. [Google Scholar] [CrossRef]
  28. Rennie, M.D.; Jackson, L.J. The Influence of Habitat Complexity on Littoral Invertebrate Distributions: Patterns Differ in Shallow Prairie Lakes with and without Fish; NRC Research Press: Ottawa, ON, Canada, 2005; pp. 2088–2099. [Google Scholar]
  29. Environment Agency of Slovenia. Atlas Okolja. Available online: https://gis.arso.gov.si/atlasokolja/default.aspx (accessed on 15 December 2022).
  30. Svetina, J.; Prestor, J.; Kopač, I. Hidrogeologija Stanja Izvirov v Stražunskem Gozdu in Določitev Napajalnega Zaledja Potoka/Kanala; Geological Institute of Slovenia: Maribor, Slovenia, 2020. [Google Scholar]
  31. Oertli, B.; Auderset Joye, D.; Castella, E.; Juge, R.; Lehmann, A.; Lachavanne, J.-B. PLOCH: A standardized method for sampling and assessing the biodiversity in ponds. Aquat. Conserv. Mar. Freshw. Ecosyst. 2005, 15, 665–679. [Google Scholar] [CrossRef]
  32. Tachet, H.; Richoux, P.; Bournaud, M.; Usseglio-Polatera, P. Invertebres d’eau Douce: Systématique, Biologie, Écologie; CNRS: Paris, France, 2010; 607p. [Google Scholar]
  33. R Team. R: A Language and Environment for Statistical Computing; R Foundation for Statistical Computing: Vienna, Austria, 2018. [Google Scholar]
  34. Hammer, Ø.; Harper, D.A.T.; Ryan, P.D. PAST: Paleontological statistics sfotware package for education and data analysis. Paleontol. Electr. 2001, 4, 1–9. [Google Scholar]
  35. Braak, C.T.; Verdonschot, P.F.M. Canonical correspondence analysis and relate multivariate methods in aquatic ecology. Aquatic Sci. 2005, 57, 255–289. [Google Scholar] [CrossRef]
  36. Smilauer, P.; Lepš, J. Multivariate Analysis of Ecological Data using CANOCO 5, 2nd ed.; Cambridge University Press: Cambridge, UK, 2014. [Google Scholar]
  37. Gee, J.H.R.; Smith, B.D.; Lee, K.M.; Griffiths, S.W. The ecological basis of freshwater pond management for biodiversity. Aquat. Conserv. Mar. Freshw. Ecosyst. 1997, 7, 91–104. [Google Scholar] [CrossRef]
  38. Akasaka, M.; Takamura, N.; Mitsuhashi, T.; Kadono, Y. Effects of land use on aquatic macrophyte diversity and water quality of ponds. Freshw. Biol. 2010, 55, 902–922. [Google Scholar] [CrossRef]
  39. Lukács, B.A.; Tóthmérész, B.; Borics, G.; Várbíró, G.; Juhász, P.; Kiss, B.; Müller, Z.; G-Tóth, L.; Eros, T. Macrophyte diversity of lakes in the Pannon Ecoregion (Hungary). Limnologica 2015, 53, 74–83. [Google Scholar] [CrossRef]
  40. Ibelings, B.W.; Portielje, R.; Lammens, E.H.H.R.; Noordhuis, R.; van den Berg, M.S.; Joosse, W.; Meijer, M.L. Resilience of Alternative Stable States during the Recovery of Shallow Lakes from Eutrophication Lake Veluwe as a Case Study. Ecosystems 2007, 10, 4–16. [Google Scholar] [CrossRef]
  41. Francová, K.; Šumberová, K.; Janauer, G.A.; Adámek, Z. Effects of fish farming on macrophytes in temperate carp ponds. Aquacult. Internat. 2019, 27, 413–436. [Google Scholar] [CrossRef]
  42. Caraco, N.; Cole, J.; Findlay, S.; Wigand, C. Vascular Plants as Engineers of Oxygen in Aquatic Systems. BioScience 2006, 56, 219–225. [Google Scholar] [CrossRef]
  43. Papastergiadou, E.; Babalonas, D. The relationships between hydrochemical environmental factors and the aquatic macrophytic vegetation in stagnant and slow flowing waters II. Evaluation of plant associations indicative value. Archiv. Hydrobiol. 1993, 90, 475–491. [Google Scholar]
  44. Heino, J. Lentic macroinvertebrate assemblage structure along gradients in spatial heterogeneity, habitat size and water chemistry. Hydrobiologia 2000, 418, 229–242. [Google Scholar] [CrossRef]
  45. Boukal, D.S.; Boukal, M.; Fifaček, M.; Hajek, J.; Klečka, J.; Skalicky, S.; Štasny, J.; Travniček, D. Catalogue of water beetles of the Czech Republic. Klapalekiana 2007, 43, 1–289. [Google Scholar]
  46. Angélibert, S.; Marty, P.; Céréghino, R.; Giani, N. Seasonal variations in the physical and chemical characteristics of ponds: Implications for biodiversity conservation. Aquat. Conserv. Mar. Freshw. Ecosyst. 2004, 14, 439–456. [Google Scholar] [CrossRef]
  47. Watts, J.C. The effect of organic matter on sedimentary phosphorus release in Australian reservoir. Hydrobiologia 2000, 431, 13–25. [Google Scholar] [CrossRef]
  48. Rezende, R.; Santos, A.M.; Henke-Oliveira, C.; Gonçalves, J.F., Jr. Effect of spatial and environmental factors on a benthic macroinvertebrate community. Zoologia 2014, 31, 426–434. [Google Scholar] [CrossRef]
  49. Stefanidis, K.; Kostara, K.; Papastergiadou, E. Implications of Human Activities, Land Use Changes and Climate Variability in Mediterranean Lakes of Greece. Water 2016, 8, 483. [Google Scholar] [CrossRef]
  50. Remsburg, A. Relative Influence of Prior Life Stages and Habitat Variables on Dragonfly (Odonata: Gomphidae) Densities among Lake Sites. Diversity 2011, 3, 200–216. [Google Scholar] [CrossRef]
  51. Kolar, V.; Boukal, D. Habitat preferences of the endangered diving beetle Graphoderus bilineatus: Implications for conservation management. Insect Conserv. Divers. 2020, 13, 480–494. [Google Scholar] [CrossRef]
  52. Hill, M.J.; Greaves, H.M.; Sayer, C.D.; Hassall, C.; Milin, M.; Milner, V.S.; Marazzi, L.; Hall, R.; Harper, L.R.; Thornhill, I.; et al. Pond ecology and conservation: Research priorities and knowledge gaps. Ecosphere 2021, 12, e03853. [Google Scholar] [CrossRef]
  53. Tasker, S.J.L.; Foggo, A.; Bilton, D.T. Quantifying the ecological impacts of alien aquatic macrophytes: A global meta-analysis of effects on fish, macroinvertebrate and macrophyte assemblages. Freshw. Biol. 2022, 67, 1847–1860. [Google Scholar] [CrossRef]
  54. Zelnik, I.; Germ, M.; Kuhar, U.; Gaberščik, A. Waterbodies in the Floodplain of the Drava River Host Species-Rich Macrophyte Communities despite Elodea Invasions. Diversity 2022, 14, 870. [Google Scholar] [CrossRef]
  55. Grime, J. Competitive exclusion in herbaceous vegetation. Nature 1973, 242, 344–347. [Google Scholar] [CrossRef]
Figure 2. Ordination diagrams obtained with DCA on the base of the compositions of macroinvertebrate (left) and macrophyte (right) communities show clear differences in their structures in artificial ponds (gray polygons) and natural ponds (blue polygons). Abbreviated names of the ponds are listed in Table 2.
Water 16 01130 g002
Figure 3. Ordination diagram based on CCA, displaying the impact of environmental factors on the macrophyte community composition. AgrStAg—Agrostis stolonifera agg., AlisPlan—Alisma plantago-aquatica, CarxBriz—Carex brizoides, CarxElat—Carex elata, CarxRipr—Carex riparia, CertDemr—Ceratophyllum demersum, ElofNutt—Elodea nuttalli, GlycMaxm—Glyceria maxima, IrisPseu—Iris pseudacorus, JuncEffs—Juncus effusus, LeerOryz—Leersia oryzoides, LemnMinr—Lemna minor, LycpEurp—Lycopus europaeus, LysmNumm—Lysimachia nummularia, LythSalc—Lythrum salicaria, MyosScor—Myosotis scorpioides, MyriSpic—Myriophyllum spicatum, MyriVert—Myriophyllum verticilatum, NajsMarn—Najas marina, PhalArun—Phalaris arundiancea, PhrgAust—Phragmites australis, PolgHydr—Polygonum hydrolapathum, PolgMite—Polygonum mite, PotmNods—Potamogeton nodosus, PotmTrich—P. trichoides, ScirSylv—Scirpus sylvaticus, ScutGalr—Scutellaria galericulata, SelnCarv—Selinum carvifolia, SpirPolr—Spirodela polyrhiza, SprErcAg—Sparganium erectum agg., TyphLatf—Typha latifolia.
Water 16 01130 g003
Figure 4. Ordination diagram based on CCA, depicting the impact of environmental factors on the macroinvertebrate community. Abbreviated names of the families: Aeshn—Aeshnidae, Asellid—Asellidae, Baetid—Baetidae, Caenid—Caenidae, Ceratopg—Ceratopogonidae, Chiron—Chironomidae, Chryso—Chrysomellidae, Cordul—Cordulidae, Crambi—Crambidae, Culic—Culicidae, Curculio—Curculionidae, Dytisc—Dytiscidae, Ecnomida—Ecnomidae, Elmid—Elmidae, Enchyt—Enchytridae, Ephydrid—Ephydridae, Erpobd—Erpobdellidae, Gomphid—Gomphidae, Halipl—Haliplidae, Haplot—Haplotaxidae, Hydrac—Hydracarina, Hydromet—Hydrometridae, Hydrophl—Hydrophilidae, Leptoc—Leptoceridae, Libellul—Libellulidae, Limoniid—Limoniidae, Lumbri—Lumbriculidae, Lymnaeid—Lymnaeidae, Mesoveli—Mesoveliidae, Naidid—Naididae, Naucor—Naucoridae, Nepid—Nepidae, Noterida—Noteridae, Physid—Physidae, Planor—Planorbidae, Platycnm—Platycnemidae, Polycent—Polycentropodidae, Proppapd—Proppapidae, Scirtida—Scirtidae, Sialid—Sialidae, Sphaerii—Sphaeriidae.
Water 16 01130 g004
Figure 5. Relationship between macrophyte dominance index and number of macroinvertebrate families. The plot includes data points and a regression line with standard error (SE) displayed as dark gray area.
Water 16 01130 g005
Table 1. The mean values and standard errors of selected environmental factors in both types of ponds (pond type). Significant differences were calculated with Student’s t-test. The presented variables include EC—conductivity, NO3—nitrate concentration, PO43−—orthophosphate concentration, algae cover, macrophyte cover, transparency as Secchi depth, BGA-PC—density of cyanobacterial population, CDOM—colored dissolved organic matter, CPOM/FPOM—coarse/fine particulate organic matter.
Pond TypeNatural Artificial
Average SEpAverage SE
EC (µS/cm)418±510.006207±24
Temperature of water (°C)19.2±1.00.00224.2±0.6
Saturation with O2 [%]59±13n.s.77±13
[O2] (mg/L)5.4±1.2n.s.6.5±1.0
[NO3] (mg/L)1.4±0.9n.s.0.3±0.2
[PO43−] (mg/L)41±120.01797±18
BGA-PC (Cells/mL)6323±3441n.s.22,341±9114
[CDOM] (µg/L)38±20n.s.73±9
Secchi depth (cm)31±9n.s.42±6
Canopies above water [%]38±11n.s.31±9
No. of HT adjacent to pond1.8±0.3n.s.1.7±0.2
No. of HT within 50 m5.0±0.3n.s.4.4±0.3
Clay, sand (<0.2 cm) [%]56±120.05686±6
Gravel (0.2–2 cm) [%]13±4n.s.10±5
Pebbles (2–6 cm) [%]13±4n.s.3±3
CPOM [%]42±10n.s.23±4
FPOM [%]75±40.01348±9
Filamentous algae [%]8.3±2.8n.s.9.2±2.2
Width of riparian zone (1–3)3.0±0.00.0001.8±0.2
Water surface (ha)0.70±0.13n.s.3.0±1.6
Land use intensity2.8±0.4n.s.3.1±0.4
Table 2. List of the most common taxa in the surveyed ponds and data about the number (No) of specific taxa within. The most common macrophytes are given in percentage cover per transect, while the most common higher taxa of macroinvertebrates, as well as the families, are given as the number of individuals in the samples.
TAXACRE1CRE2 MIKLORE1ORE2PEKRPRA1PRA2PRA3RAC1RAC2ROGSLIVSREDSTA1STA2TEZLTURNVURB
Typha latifolia0600100100606500000002030
Phragmites australis200525300000003504000300
Myriophyllum spicatum0050012055355100151501015
Ceratophyllum demersum00020150000025000000030
No. of macrophytes:614149141211869209199910669
Ephemeroptera524244556912239638644017832711539149
Diptera23448604526236471309918482572150831562
Isopoda0015260020003007763170051
Odonata211037019648127428463871109611325107
No. of higher MI taxa:861212138910678108711129810
Baetidae42417325381123933572351482270154146
Asellidae0015260020003007763170051
Chironomidae144412121723338130164161560107791145
Coenagrionidae20103191914610142444347110559122598
No. of MI families:13102634292315191015202215103034172017
No. of individuals:5218135673163840275921535985642329516311951104217233498
Table 3. The average values and standard errors (SEs) of selected environmental factors in both types of ponds (pond type). Significant differences were calculated with Student’s t-tests. MF—macrophytes, S-W DI—Shannon–Wiener diversity index, MI—macroinvertebrates.
Pond TypeNatural Artificial
Average SEpAverage SE
Number of MF_taxa10.8±1.0n.s.10.4±1.3
Total cover of all MF [%]108±20.00669±12
MF_Dominance index [%]20.0±1.40.00533.0±4.0
S-W DI_MF1.87±0.060.0401.57±0.1
Margalef DI_MF 2.10±0.22n.s.2.35±0.3
Simpson DI_MF0.80±0.00.0050.67±0.0
Evenness_MF0.61±0.03n.s.0.52±0.0
Total abundance of MI890±1500.005220±51
Number of MI_fam28.3±2.60.00316.1±1.3
S-W DI_MI fam1.89±0.14n.s.1.80±0.1
Margalef DI_MI_fam 4.06±0.350.0313.02±0.2
Number of_MI_h.taxa11.7±0.4<0.0018.0±0.4
S-W DI_MI_h.taxa1.60±0.07n.s.1.40±0.1
Margalef DI_MI_h.taxa1.59±0.06n.s.1.44±0.1
Table 4. Spearman correlation coefficients between diversity indices calculated for macrophyte (MF) and macroinvertebrate (MI) communities. Statistically significant correlations are displayed only: *—p < 0.05, **—p < 0.01, n.s.—not significant.
TaxonIndexNumber of MF_taxaMargalef_MFS-W DI_MFMF_Dominance Index
Number of MI_famn.s.n.s.0.564 *−0.613 **
Total abundance of MIn.s.n.s.n.s.−0.460 *
Number of_MI_h.taxan.s.n.s.0.538 *−0.666 **
Margalef DI_MI famn.s.n.s.n.s.−0.505 *
S-W DI_MI famn.s.n.s.n.s.n.s.
Dominance of MI_fam.n.s.n.s.n.s.n.s.
Margalef DI_MI_h.taxan.s.n.s.n.s.n.s.
S-W DI_MI_h.taxan.s.n.s.n.s.n.s.
Dominance of MI h.taxan.s.n.s.n.s.n.s.
Disclaimer/Publisher’s Note: The statements, opinions and data contained in all publications are solely those of the individual author(s) and contributor(s) and not of MDPI and/or the editor(s). MDPI and/or the editor(s) disclaim responsibility for any injury to people or property resulting from any ideas, methods, instructions or products referred to in the content.

