Article

Geochemical Assessment of the Evolution of Groundwater under the Impact of Seawater Intrusion in the Mannar District of Sri Lanka

1
Research Center for Eco-Environmental Sciences, Chinese Academy of Sciences, Beijing 100085, China
2
University of Chinese Academy of Sciences, Beijing 100049, China
3
China-Sri Lanka Joint Research and Demonstration Center for Water Technology, Ministry of Water Supply, Meewathura, Peradeniya 20400, Sri Lanka
4
National Water Supply and Drainage Board, Katugastota 20800, Sri Lanka
5
Institute of Environment and Health, Jianghan University, Wuhan 430056, China
*
Authors to whom correspondence should be addressed.
These authors contributed equally to this work.
Water 2024, 16(8), 1137; https://doi.org/10.3390/w16081137
Submission received: 10 March 2024 / Revised: 29 March 2024 / Accepted: 9 April 2024 / Published: 17 April 2024
(This article belongs to the Section Oceans and Coastal Zones)

Abstract

:
Groundwater is an important drinking water resource in the coastal regions of island countries and has suffered from heavy seawater intrusion. However, the areas specifically affected by seawater intrusion and their groundwater hydrogeochemical compositions and evolution processes remain unclear. This study analyzed the hydrogeochemical compositions, water quality, and evolution processes of groundwater in the Mannar district, Sri Lanka, during the dry season. A total of 56 samples were collected from shallow wells and tube wells across the region, and about 64.28% of groundwater samples had good quality (WQI < 100). Geochemical compositions and water quality parameters had a high level in the north and south mainland regions, where they severely suffered from seawater intrusion with a high content of Cl and Na+. The geochemical compositions of groundwater in the Mannar district were predominantly affected by rock weathering and/or evaporation processes. Cl-Na and HCO3-Ca facies were the main hydrochemical types, and the corresponding ions were mainly from silicate and halite dissolution. The reverse cation exchange process mainly occurred in seawater intrusion areas. The study highlights the impacts of seawater intrusion on the hydrogeochemical compositions and evolution processes in Mannar region groundwater, which will enhance the understanding of the local water quality and seawater intrusion situation and aid in protecting drinking water safety by routinely monitoring the groundwater quality and implementing targeted desalination techniques in the key areas.

1. Introduction

Groundwater serves as a vital freshwater source for domestic, drinking, and agricultural purposes in numerous regions worldwide. However, the quality and accessibility of groundwater reserves are being heavily impacted by both natural factors and anthropogenic activities [1]. Natural factors, such as climate variations [2], mineral dissolution and precipitation, exchange reactions, seasonal rainfall distribution asymmetry, chemical weathering in various rock formations [3], and interactions between soil/rock and groundwater during flow and recharge [4], as well as seawater intrusion [5], play a crucial role in shaping groundwater quality. Conversely, anthropogenic activities include urbanization, agricultural practices [6], industrial pollution, groundwater overextraction [7], and waste disposal [8]. Seawater intrusion is considered the most important factor that affects the hydrogeochemistry and quality of groundwater in coastal areas [9], which also often face severe freshwater shortages. Seawater intrusion affects the groundwater in coastal regions mainly through rock–water interactions [10], freshwater mixing [11], and geochemical reactions [12], leading to elevated levels of dissolved ions in coastal aquifer freshwater and a decrease in freshwater availability [13]. Seawater intrusion is anticipated to aggravate in some cases, like overgroundwater extraction [14], tectonic activity [15], global warming [16], and sea level rise [17].
Besides the direct influence on freshwater compositions, seawater intrusion significantly affects the natural evolution processes of groundwater in coastal aquifers and furthers the groundwater geochemistry. The interaction between seawater and freshwater alters aquifer geochemical conditions [18], mineral composition [19], seawater infiltration rate [19], and water residence time [20], as well as the consequent diverse chemical reactions. For example, the elevated salinity in groundwater led to a change in ionic strength and redox conditions due to the dissolution of gypsum and halite and the subsequent release of sulfate and chloride ions [19], resulting in increased concentrations of specific chemical species in groundwater [21]. Therefore, it is essential to reveal the complex processes and mechanisms of groundwater evolution in coastal areas suffering from seawater intrusion.
Seawater intrusion and its influence on groundwater evolution are particularly serious in tropical equatorial regions, where most rain falls in a few months each year and coastal aquifers are rich in highly porous sedimentary rocks [22]. The high temperature in these regions leads to intense evapotranspiration and impacts the overall groundwater balance in the aquifer, which is more serious during prolonged dry spells [23]. The highly porous sedimentary rocks favor the flow of seawater into the aquifer with high groundwater recharge rates [24,25]. The sea level rise caused by tidal forces and global warming further aggravates the seawater intrusion. In the South Asian region, a 0.1-m sea level rise promoted seawater intrusion with a decrease in freshwater aquifer thickness from 25 to 10 m [26,27]. Unfortunately, the groundwater geochemistry and quality impacted by seawater intrusion are still insufficiently investigated in developing countries in tropical equatorial regions, greatly hindering the understanding of groundwater in coastal regions and its effect on human health.
Sri Lanka, located in the Indian Ocean, is a tropical-equatorial country and a water-related vulnerability hotspot [28]. The country is particularly susceptible to seawater intrusion due to its coastal geography, sea level fluctuation, and equatorial climates [20,24,29,30]. The northern and northwestern regions of Sri Lanka feature permeable coastal aquifers that are composed of a Miocene limestone belt and the overlain unconsolidated deposits of sand and sandy clays [31]. During the dry season, the region experiences minimal rainfall and semi-arid conditions, leading to reduced groundwater recharge and severe water scarcity [32,33]. These features accelerate the seawater intrusion and its influence on groundwater quality. Therefore, this study investigates the geochemical characteristics and evolution processes of groundwater in the Mannar district, located in the northwestern region of Sri Lanka. To this end, shallow and tube well groundwater samples were collected in the middle of the dry season (May 2022), when intense seawater intrusion is anticipated to occur. Their water quality parameters and the contents of major compositions were analyzed. The groundwater evolution processes and primary impact factors were then identified. This work will provide insights for the evolution process of groundwater in tropical equatorial regions and basis support for groundwater quality management.

2. Experimental Section

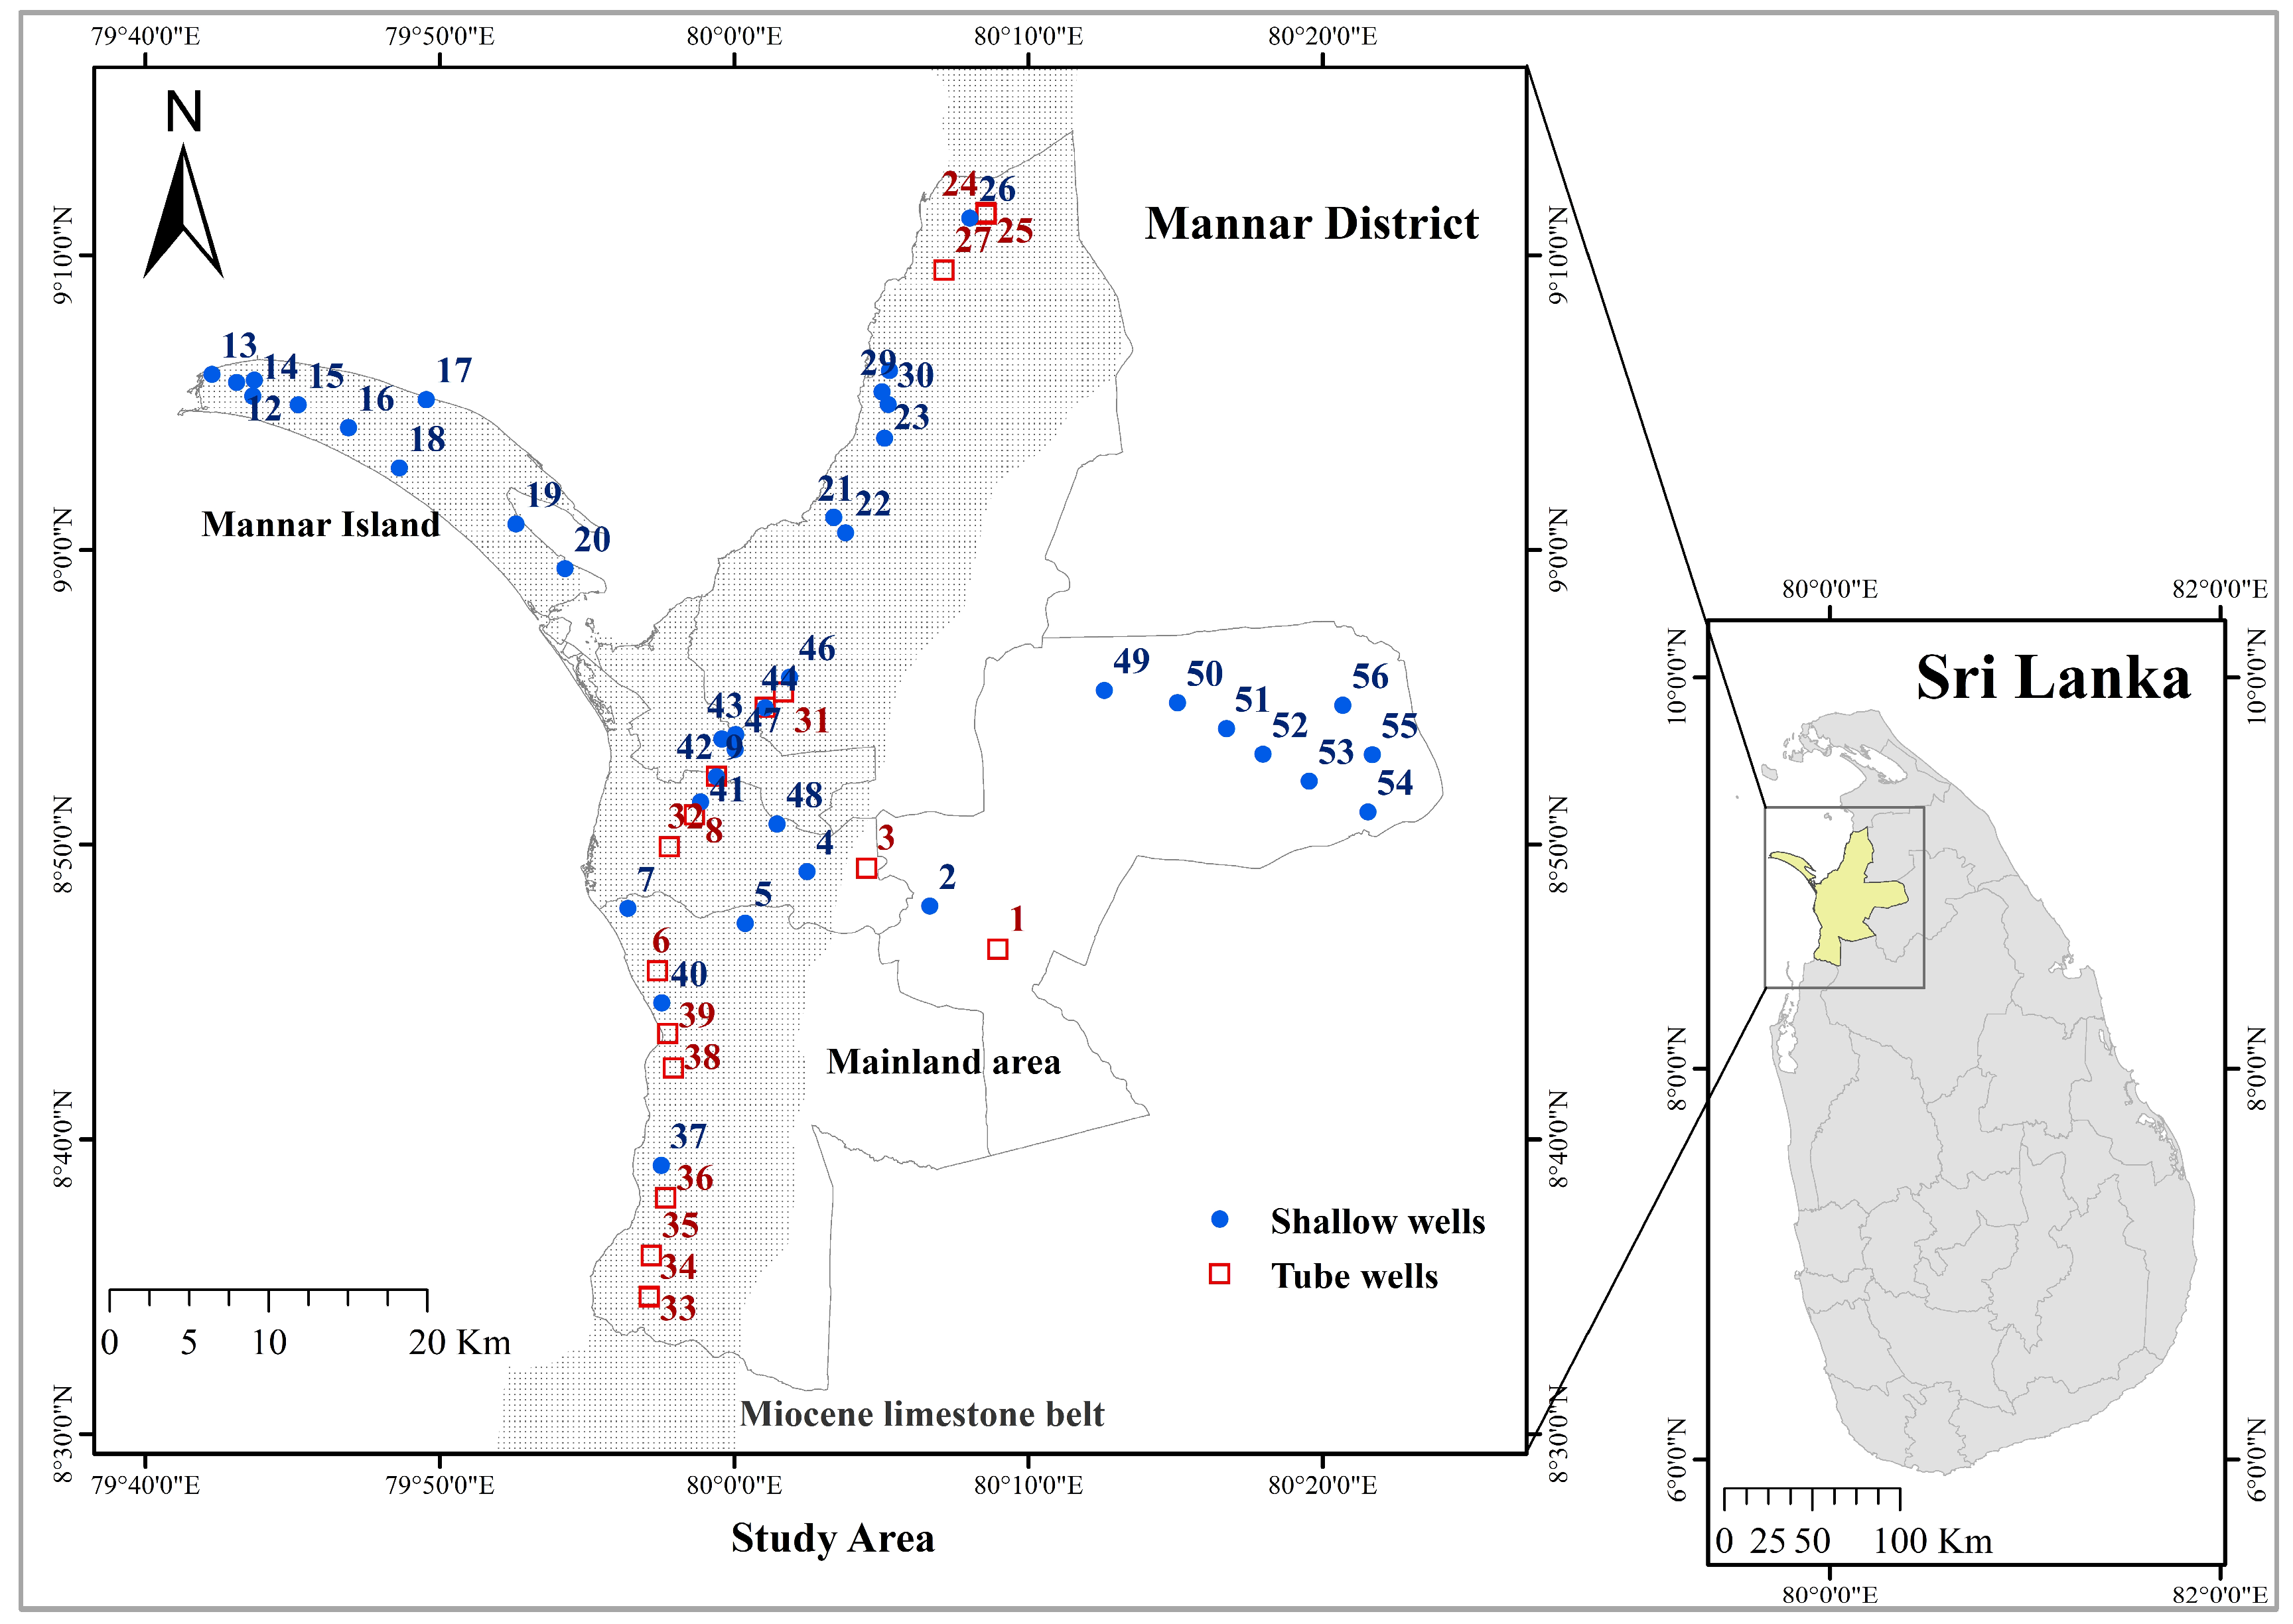
2.1. Study Area and Data Collection

The Mannar district (8°52′ N, 80°4′ E) is situated on the northwestern coast of Sri Lanka (Figure 1). It spans an approximate area of 1996 km2 and is characterized as one of the driest regions in Sri Lanka, with an average annual rainfall of 975 mm/year and evapotranspiration of 2135 mm/year, falling within a semi-arid climate zone. The rainfall, together with several other recharge components, balances the evaporation loss, including groundwater inflow, surface runoff, recharge from underground flow connections, contributions from coastal limestone aquifers, and water from potential recharge sources like the Giant Tank and Malwathu Oya [34]. The temperature in the region ranges from 23 °C to 35 °C. The population in the district is comparatively low, and the main livelihood activities are agriculture, fishing, and animal husbandry. These activities, plus the high evaporation rates, are the major environmental stressors on the groundwater resources in the area. The Mannar district consists of both an island part and a mainland area (Figure 1). The underlying geological formation primarily consists of Miocene limestone and Quaternary deposits (Figure S1a) [35]. The limestone is composed of sedimentary limestone and sandstone formations. The sedimentary limestone is highly faulted, causing the aquifer to be separated into a series of isolated blocks and groundwater basins. The limestone beds are overlain by unconsolidated Quaternary deposits (Figure S1a) [35], including red earth, yellow–brown sands, dune and beach sands, and lagoonal deposits. The island’s geology comprises a Miocene limestone basement and the overlain Holocene wind-blown dune sand (Figure S1b) [29,36].

2.2. Sample Collections and Measurements

Sampling was conducted in the dry season (May 2022), and a total of 56 groundwater samples (17 tube wells and 39 shallow wells) were collected in the Mannar district (Figure 1). A total of 2 L of groundwater was collected and transferred into polypropylene bottles, which were pre-rinsed with 10% (v/v) hydrochloric acid and then with deionized water. Physicochemical parameters such as pH, temperature, electrical conductivity (EC), total dissolved solids (TDS), and dissolved oxygen (DO) were measured in the field by using portable test kits (Eutech 01X099414, Thermo Scientific Eutech 01X099414 Inc., Waltham, MA, USA).
The physicochemical analyses of water samples were carried out at the China–Sri Lanka Joint Research and Demonstration Center for Water Technology, Ministry of Water Supply, Peradeniya. The water samples were filtered with a 0.45 µm filter membrane before conducting geochemical characterization. Inorganic cations (Ca2+, Mg2+, Na+, and K+) were measured using inductively coupled plasma optical emission spectrometry (PerkinElmer, Optima 8300, Waltham, MA, USA). Inorganic anions (F, Cl, Br, NO3, and SO42−) were measured using ion chromatography (Eco IC, Metrohm, Herisau, Switzerland) equipped with an ion chromatogram pack column (ion exchange resin) and a conductivity detector. The total alkalinity was determined by H2SO4 (0.01 N) titration with methyl orange as the indicator. Dissolved organic carbon (DOC) was analyzed using a TOC analyzer (MULTI N/C 2100, Analytik-jena, Jena, Germany).

2.3. Water Quality Index (WQI) and Seawater Mixing Index (SMI) Calculations

WQI is a numeric indicator employed to indicate the overall water quality in a given area [37]. Here, WQI was calculated by referencing Hameed et al. (2010) [38], which incorporated twelve parameters with assigned weights. These parameters include pH, EC, DO, TDS, alkalinity, Na+, Ca2+, Mg2+, F, Cl, SO42, and NO3. The calculation of the WQI first needed to normalize the weights of each parameter (wi) (Table S2) based on Equation (1) to obtain the relative weight (Wi):
W i = w i i n w i
Then, twelve parameters (Ci) were standardized based on the threshold value set that was provided by the World Health Organization [39] (Si), and the partial WQI score (Qi) of each parameter was calculated as Equation (2). WQI was finally obtained according to Equation (3).
Q i = C i S i   ×   100
WQI = i = 1 m W i Q i
The calculated WQI was categorized into five levels: excellent water (WQI: <50), good water (WQI: 50–100), poor water (WQI: 100–200), very poor water (WQI: 200–300), and unsuitable water (WQI: >300).
SMI, first introduced by Park et al. (2005), is a valuable index for analyzing the mixing potential of groundwater and seawater [24,40,41]. SMI is determined based on the concentrations of four key ions in seawater, i.e., Na+, Mg2+, Cl, and SO42. The SMI calculation is shown in Equation (4).
SMI = a   ×   C Na T Na + b   ×   C Mg T Mg + c   ×   C Cl T Cl + d   ×   C SO 4 T SO 4
where a, b, c, and d represent the relative fraction of Na+, Mg2+, Cl, and SO42 in seawater with values of 0.31, 0.04, 0.57, and 0.08 [40], C represents the concentration of the key ions in terms of mg/L, and T represents the regional threshold values for specific ions and is determined by cumulative probability curves (Figure S2) [42]. SMI above 1 indicates the presence of seawater intrusion [42].

2.4. Data Analysis

Statistical analysis plots were generated using Grapher 20 software, and spatial interpolation maps for groundwater parameters were drawn using Arc GIS (version 10.5) software with the inverse distance-weighted interpolation technique [43].

2.5. Evolution Mechanisms of Groundwater

Three diagrams were used to reveal the evolution processes and mechanisms of groundwater in Mannar district, i.e., a Gibbs diagram [44], a Piper diagram [45], and a hydrochemical facies evolution diagram (HFE-D) [46]. The Gibbs diagram is useful for understanding the sources that control groundwater chemistry. It consists of three main regions: rock interaction, evaporation, and precipitation. Both the Piper diagram and HFE-D provide insights into the hydrochemical types of groundwater and highlight the roles of carbonate dissolution and recharge processes in shaping the groundwater composition. HFE-D offers a detailed view of chemical evolution through the interpretation of cation and anion percentage changes, making it suitable for identifying seawater intrusion and freshening stages [46,47,48,49]. In the intrusion phase, seawater infiltrates into the aquifer freshwater, which leads to the release of Ca2+ and the adsorption of Na+ ions through a reverse exchange process (R1) [50]. In the freshening process, a saline aquifer is replenished with fresh water abundant in calcium bicarbonate (R2), which results in the direct ion exchange [50] and transformation of the aquifer from an intrusion state to a freshening state.
R1: Na + + Ca (Mg)-[clay] → Ca2+ (Mg2+) + [clay]-Na (reverse cation exchange)
R2: Ca2+ (Mg2+) + Na-[clay] → Na+ + [clay]-Ca (Mg) (direct cation exchange)
The HFE-D categorizes four distinct heteropic facies: Na-Cl for seawater, Ca-HCO3 for natural freshwater, Ca-Cl for salinized water with reverse cation exchange, and Na-HCO3 for salinized water with direct cation exchange. In the intrusion and freshening domains, distinct sub-stages can be discerned by tracing the changes in salinity (%Cl).
The chloro-alkaline indices (CAI), introduced by Schoeller (1965) [51], are represented by Equations (5) and (6) (with all ions stated in meq/L).
CAI-I = Cl N a + + K + Cl
CAI-II = Cl N a + + K + HCO 3 + SO 4 2 + CO 3 2 + NO 3
The positive CAI indicates a reverse cation exchange reaction, i.e., Na+ and K+ in the groundwater are exchanged with Ca2+ and Mg2+ in the rocks. Conversely, the negative CAI indicates a cation–anion exchange reaction, where Ca2+ and Mg2+ in the groundwater are exchanged with Na+ and K+ in the rocks, particularly occurring under a chloro-alkaline disequilibrium condition.

3. Results and Discussion

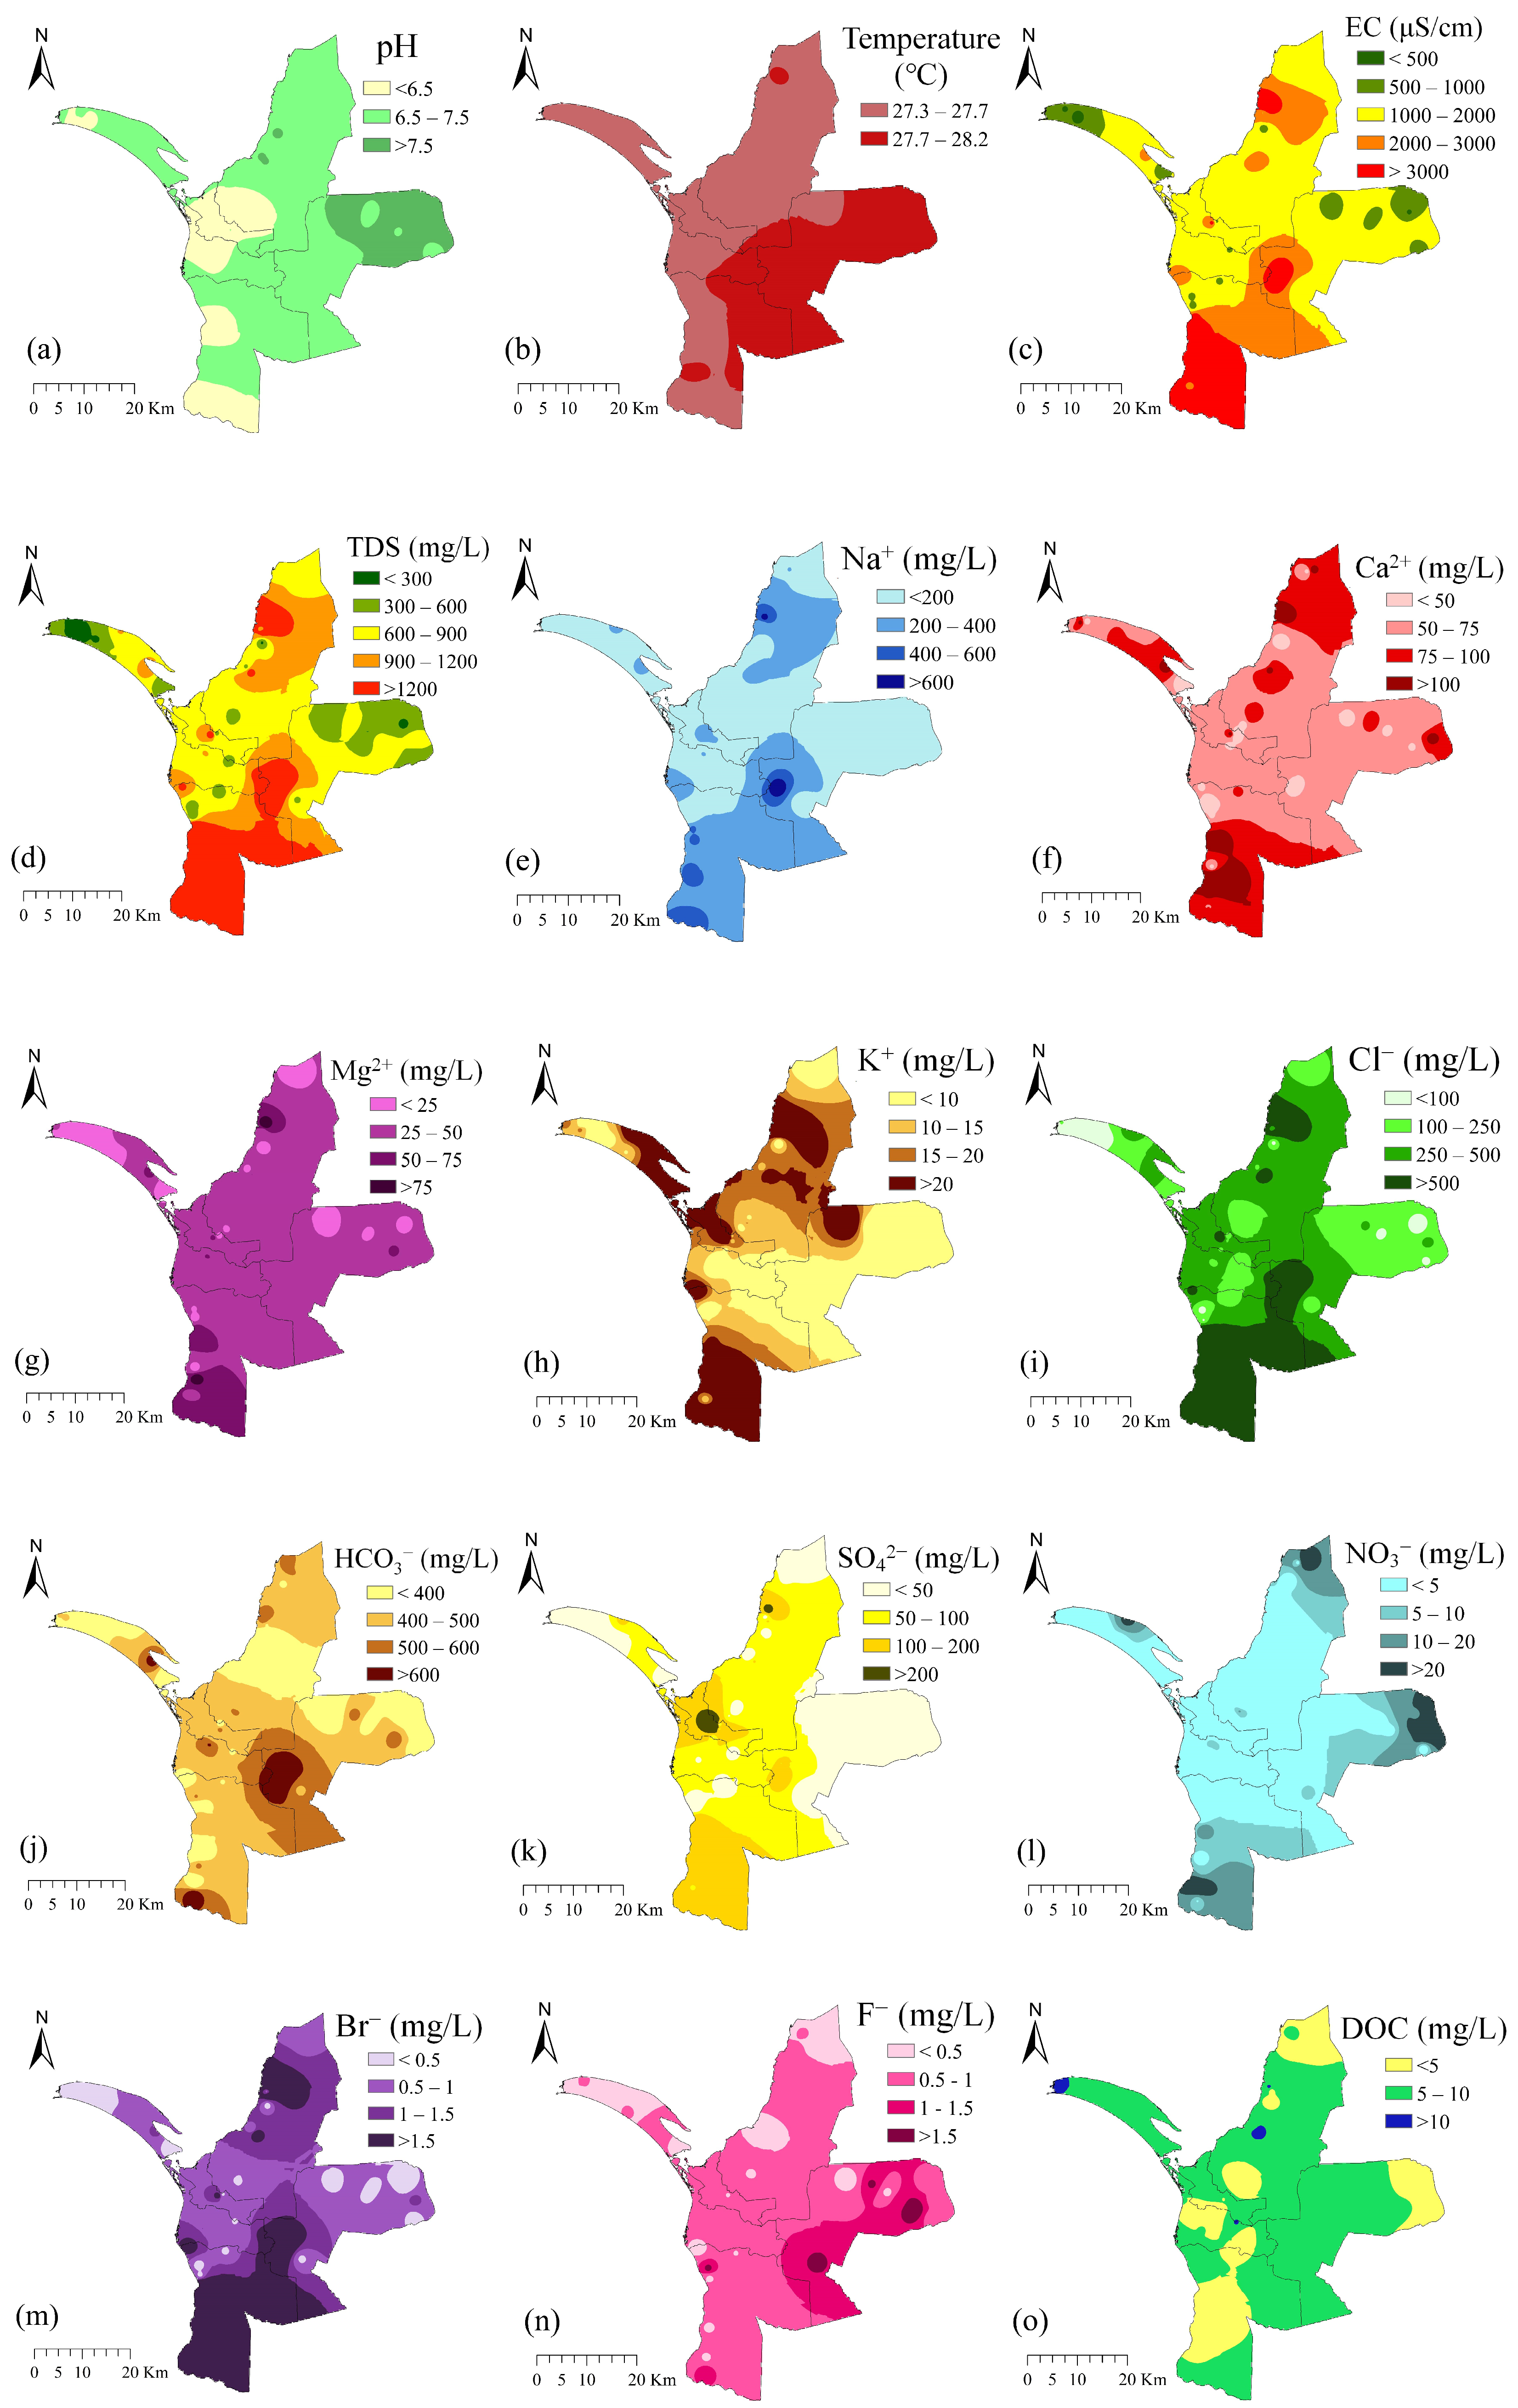
3.1. Groundwater Geochemical Characteristics
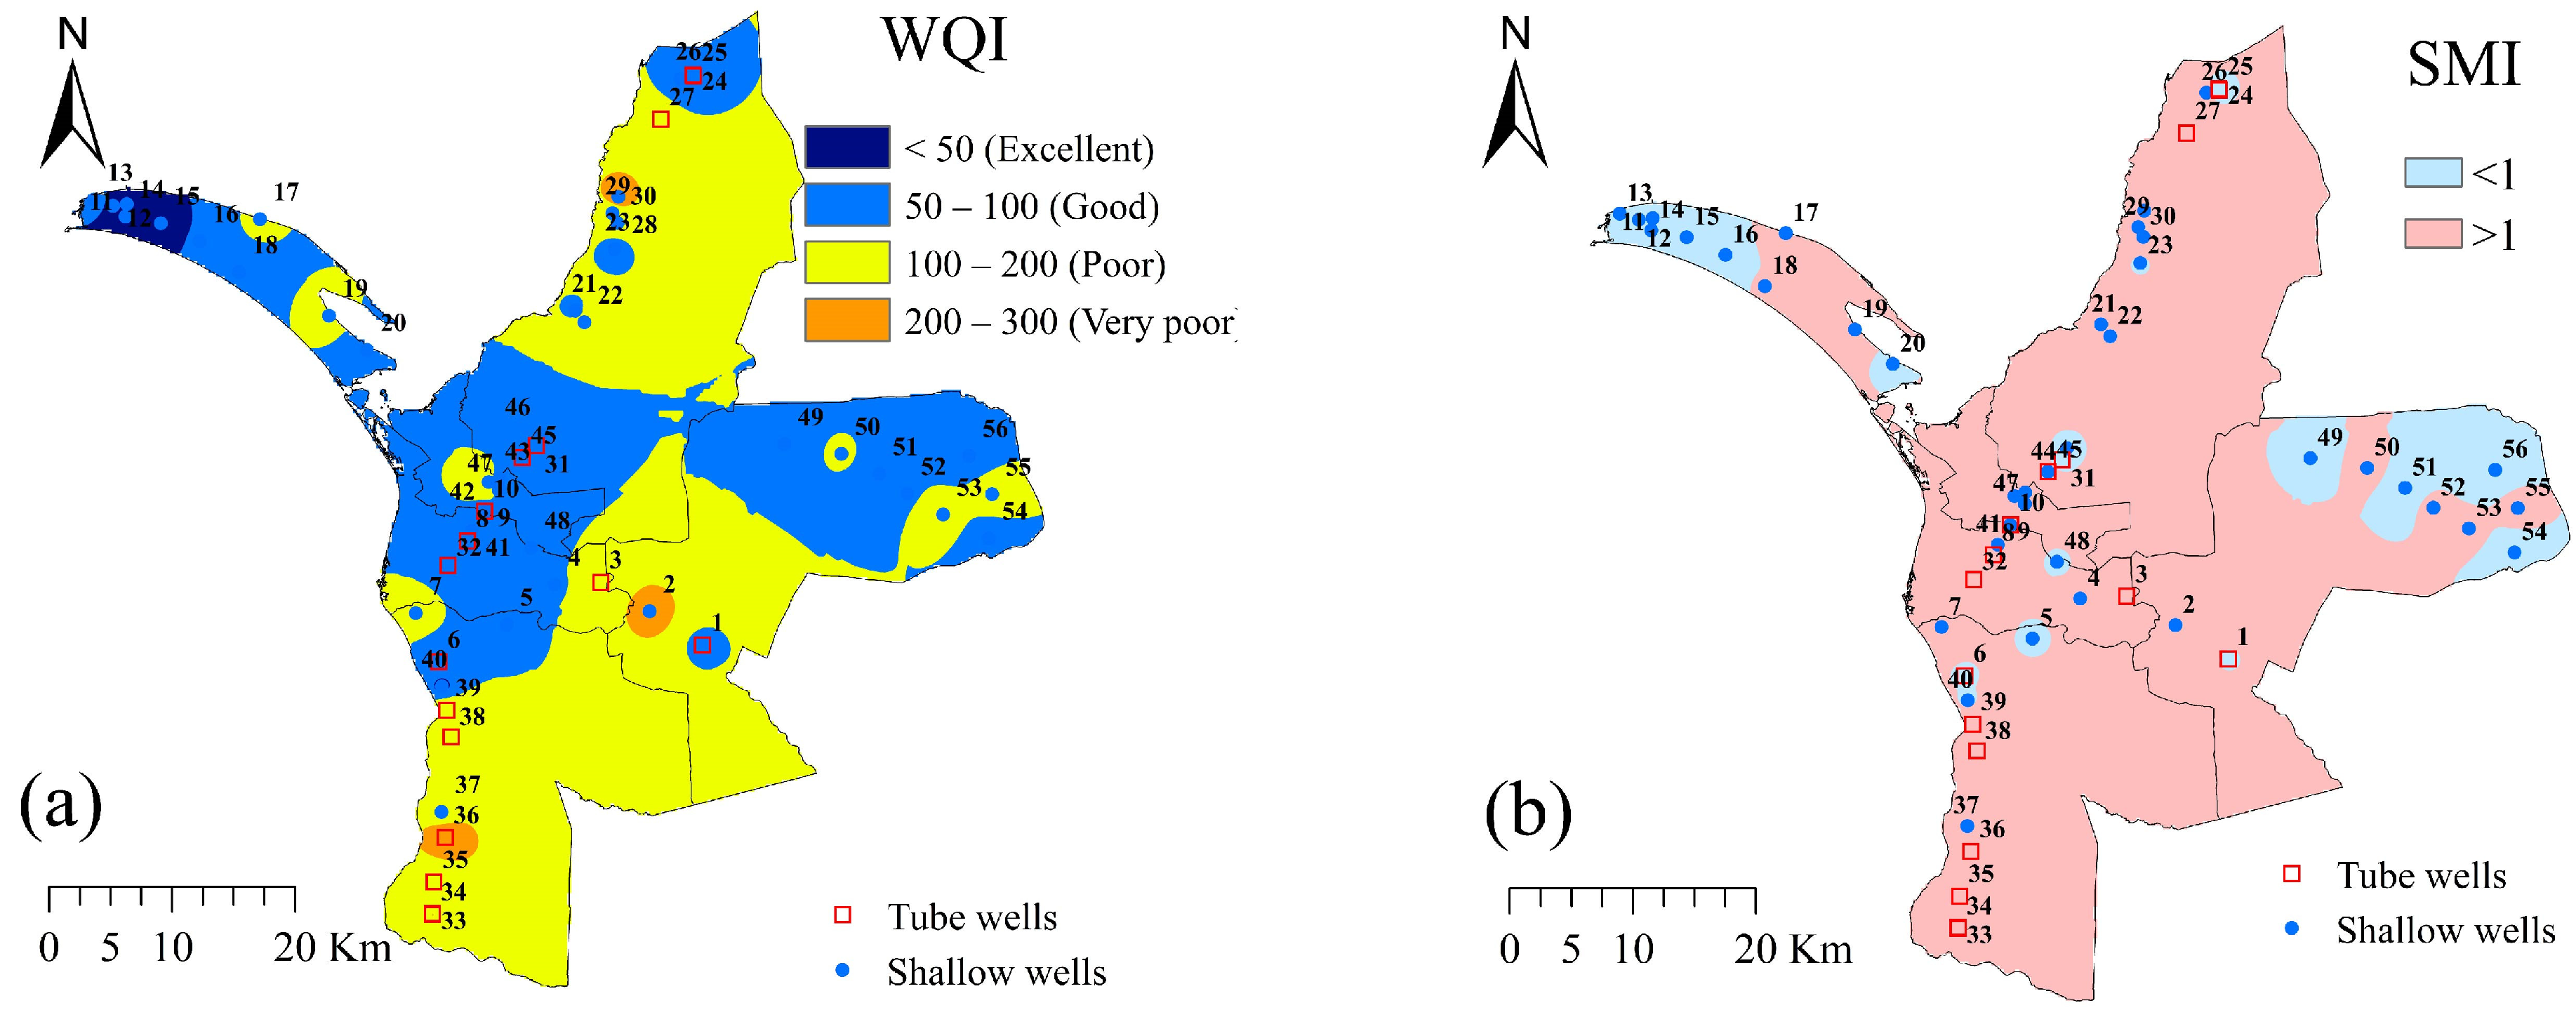
The chemical compositions of groundwater samples from shallow and tube wells in the Mannar district are shown in Table 1 and Table S1. The groundwater in the study area exhibited a pH range of 5.89 to 7.97. Shallow wells showed a mean pH of 6.97, indicating near-neutral conditions that are likely related to carbonate mineral dissolution. Tube wells had a mean pH of 6.48, suggesting slight acidity that is possibly caused by the long geological contact with minerals and organic matter in deeper aquifers. In the Mannar district, shallow wells exhibited an average electrical conductivity (EC) of 1548.23 μS/cm, while tube wells showed a higher value of 2336.24 μS/cm. This difference possibly suggests that seawater intrusion resulted in elevated conductivity levels in coastal groundwater [52]. TDS is a fundamental parameter of water quality, and groundwater could be categorized as fresh water with TDS < 1 g/L and brackish water with TDS between 1 g/L and 3 g/L. Groundwater from shallow wells and tube wells in the Mannar district had an average TDS of 773.79 mg/L and 1168.35 mg/L, indicating that it mainly belonged to freshwater and brackish water. The higher TH (total hardness) [53] in tube wells (389.81 mg/L) than TH in shallow wells (291.00 mg/L) was consistent with TDS levels. The average value of EC, TDS, and TH surpassed the limits set by the World Health Organization (WHO) and the Sri Lanka Standards (SLS) for portable drinking water (Table S1), possibly suggesting the presence of seawater intrusion, evaporation, and weathering processes in the Mannar district. The DOC of shallow well groundwater (6.64 mg C/L) was obviously higher than that of tube well groundwater (3.93 mg C/L), possibly implying a limited input of exogenous dissolved organic matter [54].
The mean concentrations of HCO3, Cl, Na+, SO42−, Ca2+, Mg2+, K+, NO3, Br, and F ions in the shallow wells were 405.48, 301.77, 162.20, 70.91, 65.09, 31.20, 16.21, 4.92, 0.93, and 0.64 mg/L and 492.59, 505.24, 234.12, 78.43, 83.63, 43.95, 13.02, 10.56, 1.75, and 0.79 mg/L in the tube wells, respectively. This indicated the much higher content of major ions in tube well groundwater. It should be noted that the average concentrations of Na+, Cl, Ca2+, and HCO3 surpassed the limits set by WHO and SLS for portable drinking water (Table S1). Based on the spatial distribution maps of geochemical characteristics (Figure 2), except for HCO3, F, and DOC, most geochemical features, including other ions, EC, and TDS, had a similar distribution pattern. This manifested a low level of these features in most island areas and the central mainland and a high level in the north and south mainland regions. The overall level of EC, TDS, and major ions was higher in the south mainland regions than that in the north regions. TDS, Na+, Cl, Br, F, and HCO3 had a high level in the south and southeast mainland regions, while NO3 and F showed a high level in the east surface regions, which were closed to the Anuradhapura district [55]. This research by Hu et al. (2013) [55] indicated that the presence of NO3 in the Anuradhapura district is primarily anthropogenic, e.g., from fertilizers [8]. The lower pH in tube wells, the higher EC and TDS levels in both shallow and tube wells, and the elevated concentrations of major ions such as Cl, Na+, and SO42− in tube wells suggested the introduction of marine salts into the groundwater due to seawater intrusion in the Mannar district. Additionally, the higher coefficient of variation for specific ions in shallow wells suggests greater variability, potentially indicating the impact of localized seawater intrusion points.

3.2. WQI and SMI

Based on the WQI data of groundwater in shallow and tube wells, 69.23% of shallow well groundwater and 52.94% of tube well groundwater in the Mannar area had excellent and good water quality (WQI < 100). This suggests that a portion of the groundwater still had poor and even worse water quality, which needed further treatment before drinking. The mean WQI of shallow and tube well groundwater was 100.12 and 127.03, respectively (Table 1), indicating a better water quality of groundwater from shallow wells than that from tube wells. The spatial distribution of WQI reveals that most islands, as well as the western and eastern mainland areas, exhibited higher-quality groundwater compared to other regions in the Mannar district (Figure 3a). The WQI had a similar distribution pattern with EC, TDS, Na+, F, and Cl, indicating their great role in groundwater quality in the Mannar region.
The regional threshold value of SMI was determined to be 104 mg/L for Na+, 27 mg/L for Mg2+, 170 mg/L for Cl, and 45 mg/L for SO42–, respectively. The SMI of groundwater ranged from 0.05 to 7.91, with an average value of 1.67 in shallow wells, and 0.51 to 6.82, with an average value of 2.60 in tube wells. Around 51.28% and 70.58% of groundwater samples in shallow wells and tube wells had an SMI of >1. These results indicate that many groundwaters might have undergone a certain degree of seawater intrusion, with tube well groundwater experiencing a heavier seawater intrusion than shallow well groundwater (Figure S2). The spatial distribution of SMI (Figure 3b) suggests that most regions besides the east mainland region and west island region were influenced by seawater mixing. Despite that, there was no direct relationship between WQI and SMI.

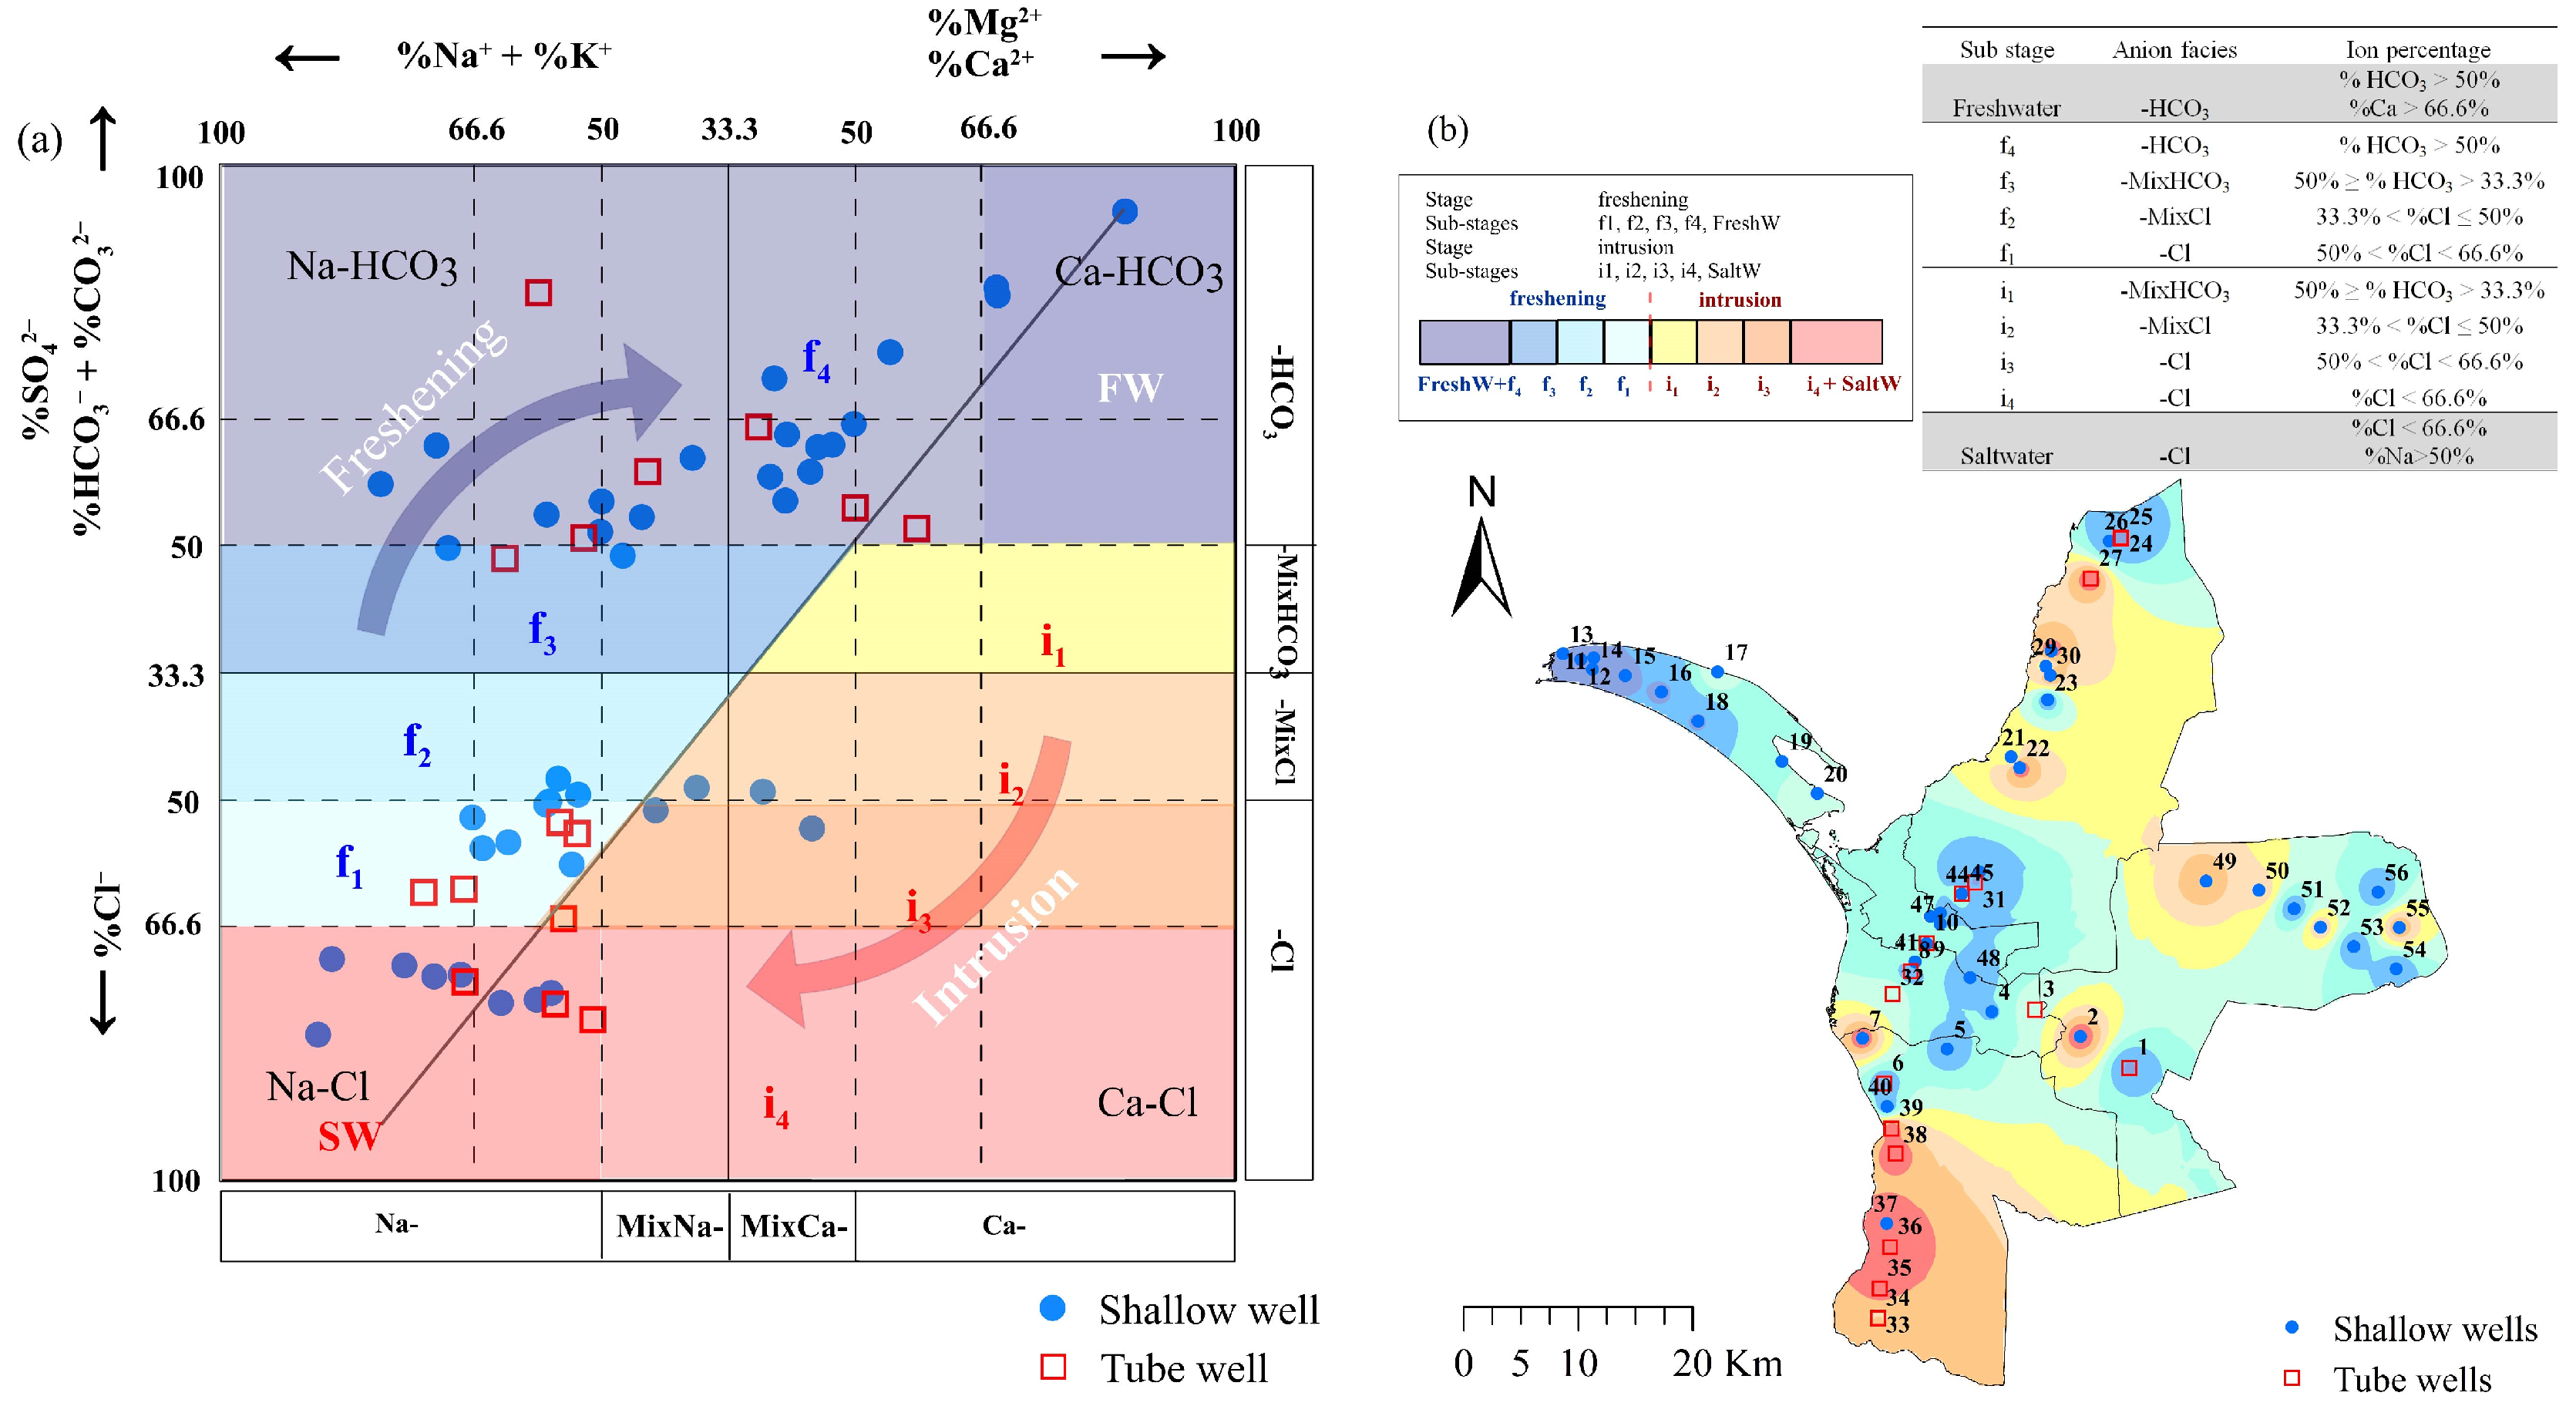
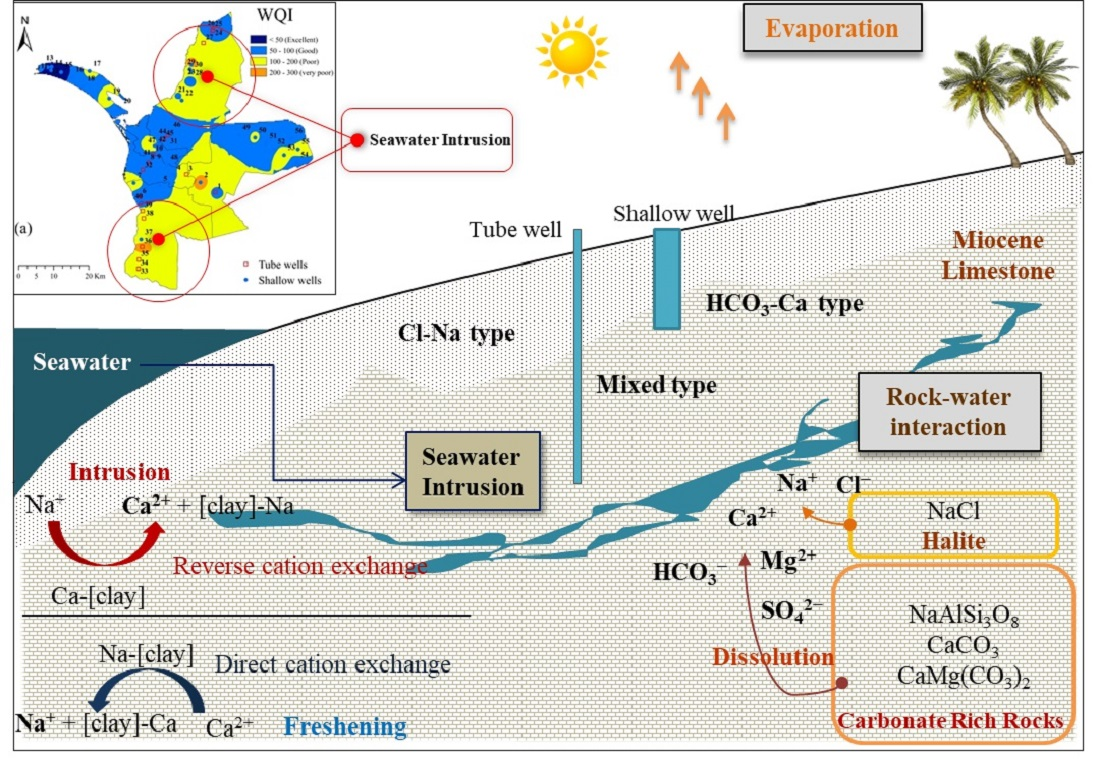
3.3. Groundwater Evolution Process and Mechanism

A Gibbs diagram (Figure 4) showed that c(Na+)/c(Na+ + Ca2+) and c(Cl)/c(Cl + HCO3) of shallow groundwater were 0.06~0.95 (average 0.60) and 0.03~0.83 (average 0.37) and 0.34~0.90 (average 0.70) and 0.08~0.80 (average 0.47) of tube well groundwater, respectively. All the groundwater samples were distributed in the rock weathering-evaporative crystallization area, indicating the predominant influence of rock weathering and/or evaporation processes on the geochemical composition of groundwater. A small number of groundwater samples fell outside the boundaries of the Gibbs plots, and this might have arisen from anthropogenic activities or intense cation exchange [56]. The overall TDS and c(Na+)/c(Na+ + Ca2+) of tube well groundwater were slightly higher than those of shallow well groundwater, possibly suggesting the susceptibility of seawater intrusion to tube well groundwater. In contrast, shallow well groundwater salt mainly originated from mineral weathering and was also affected by evaporation crystallization [57]. Unlike the rock weathering and/or evaporation processes, the precipitation had little effect on TDS, (c(Na+)/c(Na+ + Ca2+), and c(Cl)/c(Cl + HCO3), which could be attributed to the semi-arid climate during the dry season. End-member diagrams are used to distinguish the water interaction type with carbonate, silicates, and evaporite rocks [58]. Figure 4c,d showed that most groundwater in the Mannar area was located in and around the silicate dominance, indicating that silicate weathering (R3) was the predominant source of solutes for groundwater in the area, and evaporite and carbonate dissolution processes played a minor role in the geochemical compositions of groundwater in the Mannar district.
R3: 2NaAlSi3O8 + 2CO2 + 11H2O → Al2Si2O5(OH)4 + 4H4SiO4 + 2Na+ + 2HCO3

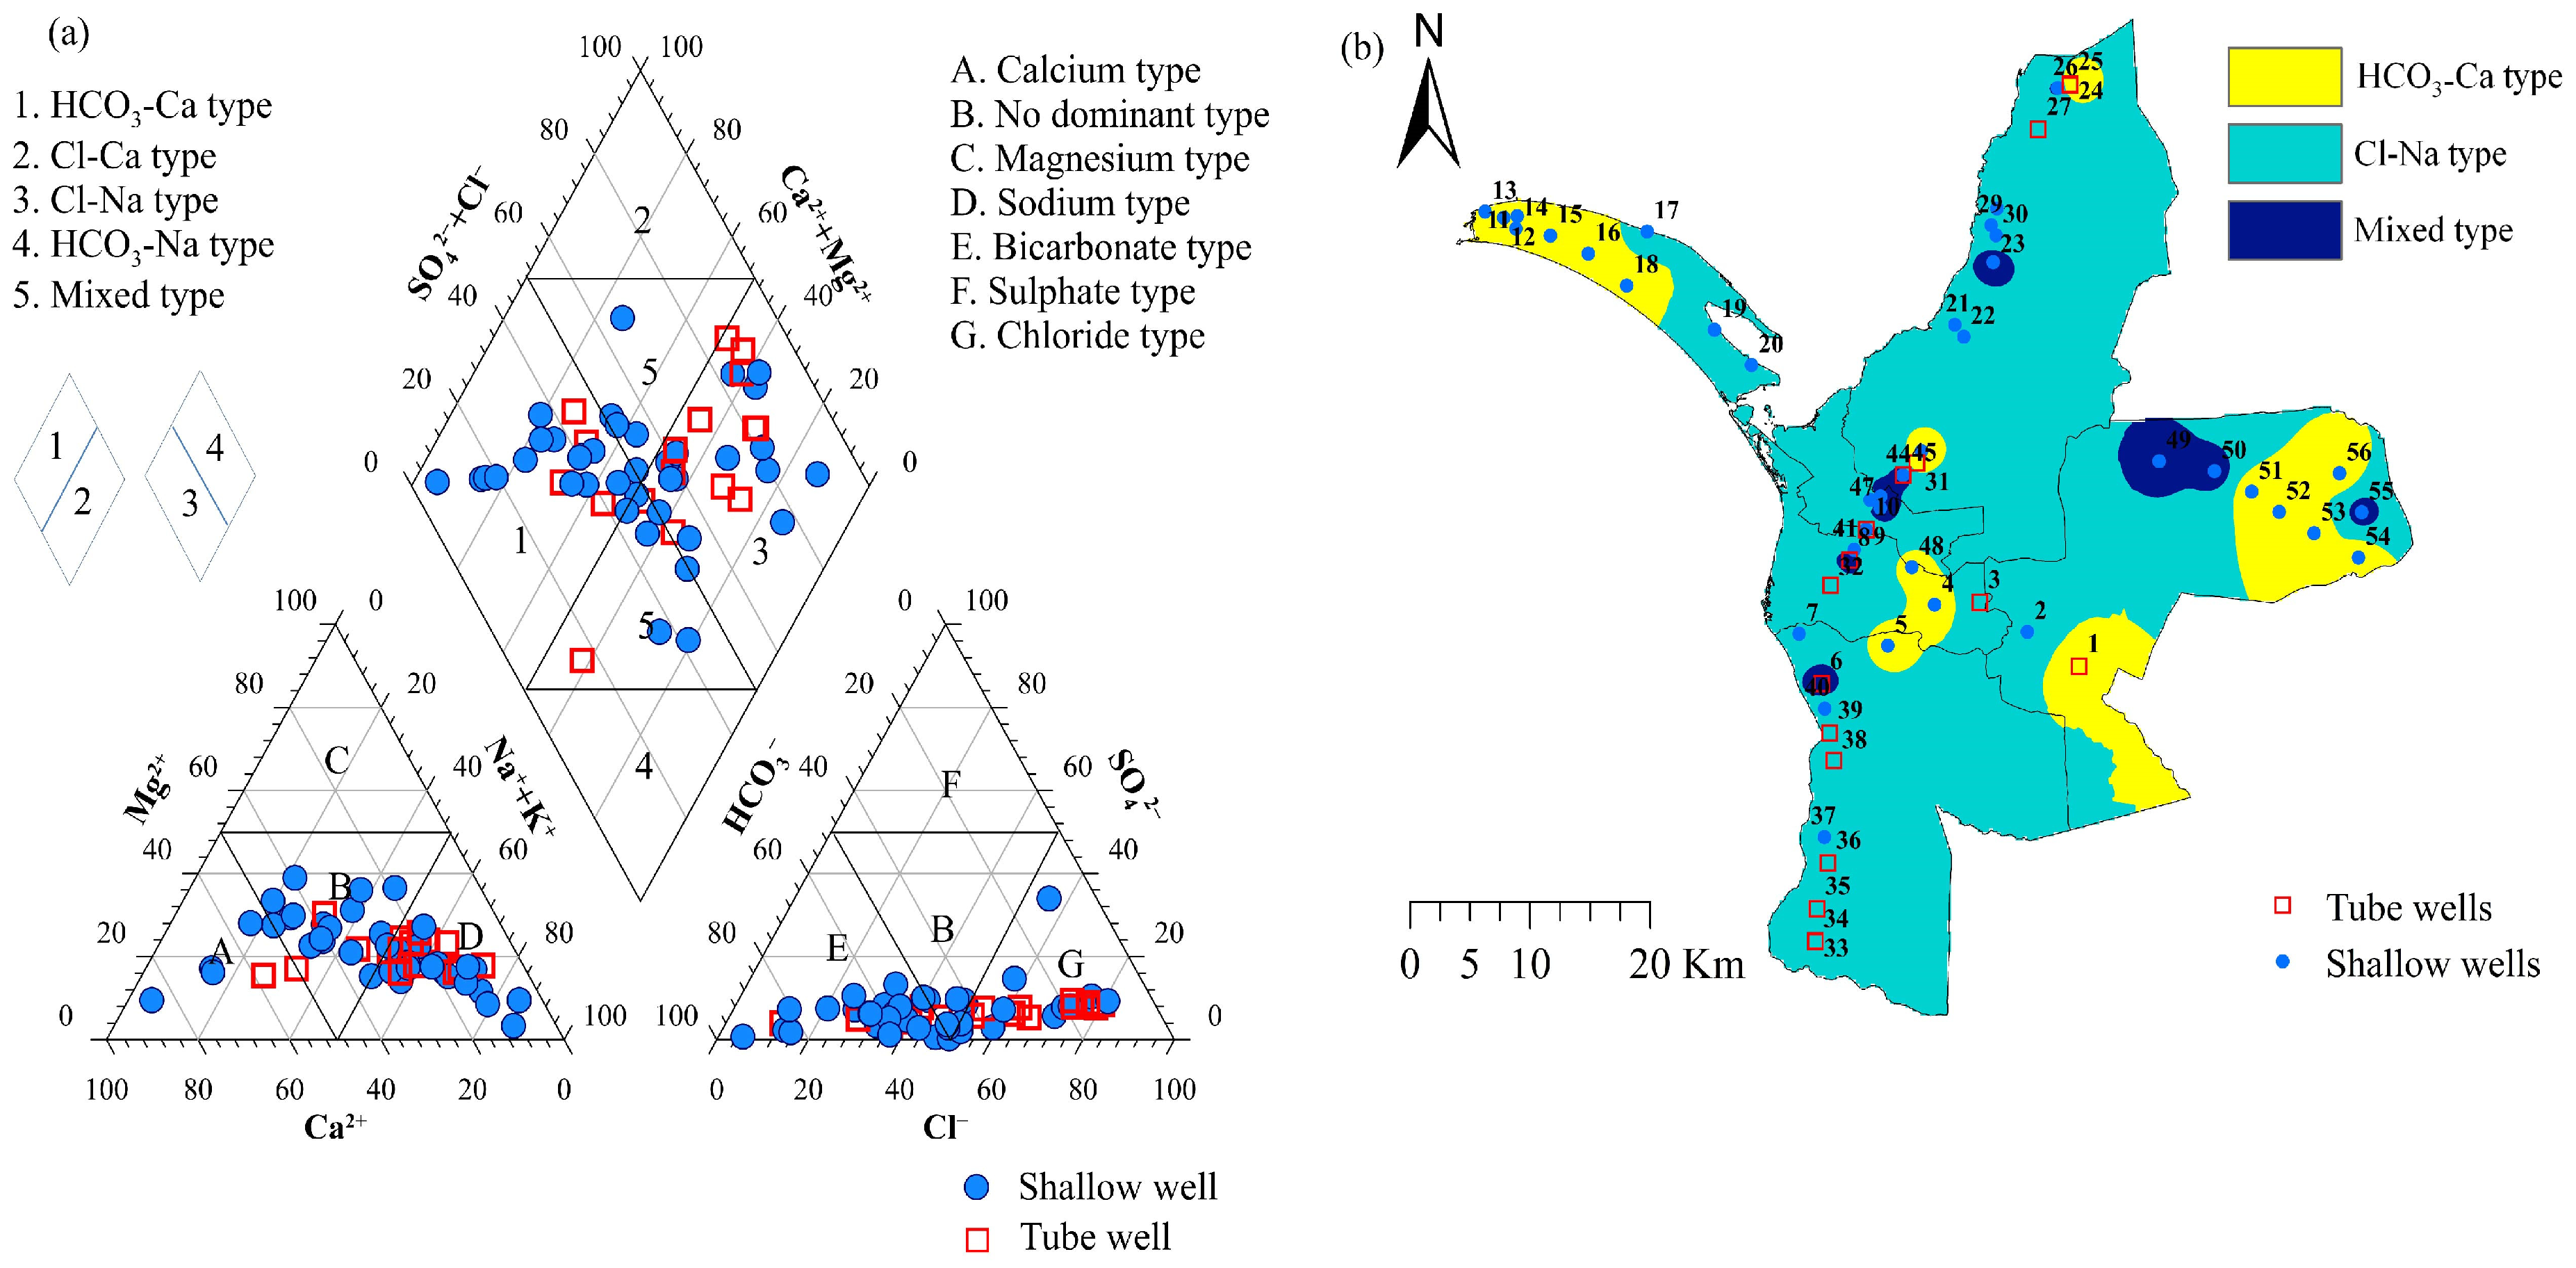
3.4. Hydrochemical Types in Groundwater

A Piper diagram (Figure 5a) showed that Cl-Na- and HCO3-Ca-type water facies were the main two hydrochemical types in the study area. Specifically, the HCO3-Ca type, Cl-Na type, and mixed type accounted for 41.02%, 38.46%, and 20.51% for shallow well groundwater and 23.53%, 58.82%, and 17.64% for tube well groundwater. The Cl-Na type reflects the dominance of Na+ and Cl ions and is indicative of seawater influence or arid conditions.
About 44.64% of shallow groundwater in the Mannar district was Cl-Na type (Figure 6), which was more evident for tube well groundwater (58.82%). The Cl-Na-type groundwater was mainly distributed in the northern and southern inland areas, and the majority had a high concentration of Cl and Na+. The left deviation of c(Cl)/c(Na+) to 1 mainly occurred in the area with high content of Cl and Na+ (Figure S4a). This indicates that the concentrations of Cl and Na+ were higher in the groundwater suffering from seawater intrusion than those from halite dissolution. Around 46.15% of shallow well samples and 71.43% of tube well samples had c(Cl)/c(Na+) values lower than the seawater value (1.17), also suggesting the potential mixing of seawater with freshwater [19]. In combination with Figure 2, the areas suffering from seawater intrusion are mainly located in the northern and southern mainland areas. A positive value of both CAI-I and CAI-II was also observed for these groundwaters (Figure S4d), indicating the occurrence of the reverse cation exchange between Na+ and K+ in groundwater with Ca2+/Mg2+ from aquifer materials [59]. These results implied that the high content of Cl and Na+ in groundwater might be from intrusive seawater and favorable for reverse cation exchange [10], leading to a decrease in Na+/K+ and an increase in Ca2+/Mg2+.
HCO3-Ca-type water facies are mainly distributed in the western island and the east and southeast mainland areas (Figure 5b). It has been reported that Ca2+, Mg2+, and HCO3 were mainly from the dissolution of carbonates from carbonate-rich rocks such as limestone (Reactions R4 and R5, Figure 4) [60,61], which were also abundant in the above areas. The sampling points belonging to the HCO3-Ca type usually had a low content of Cl and Na+ (Figure S4a), indicting the little effect of seawater intrusion on these areas. Most HCO3-Ca-type groundwater had c(HCO3)/c(Ca2+) in the range of 1 to 2 and c(HCO3)/c(Ca2+ + Mg2+) close to 1 (Figure S4b,c), implying that these ions mainly come from the dissolution of silicate, gypsum, and limestone.
R4: CaCO3 + CO2 + H2O → Ca2+ + 2HCO3
R5: Ca.Mg(CO3)2 + 2CO2 + 2H2O → Ca2+ + Mg2+ + 4HCO3
Approximately 17.86% of the groundwater samples were mixed-type water facies and were mainly distributed in the middle of the inland area and the east part of the district. Groundwater chemistry was jointly affected by the dissolution of mineral rocks, seawater intrusion, and ion exchange processes [62].

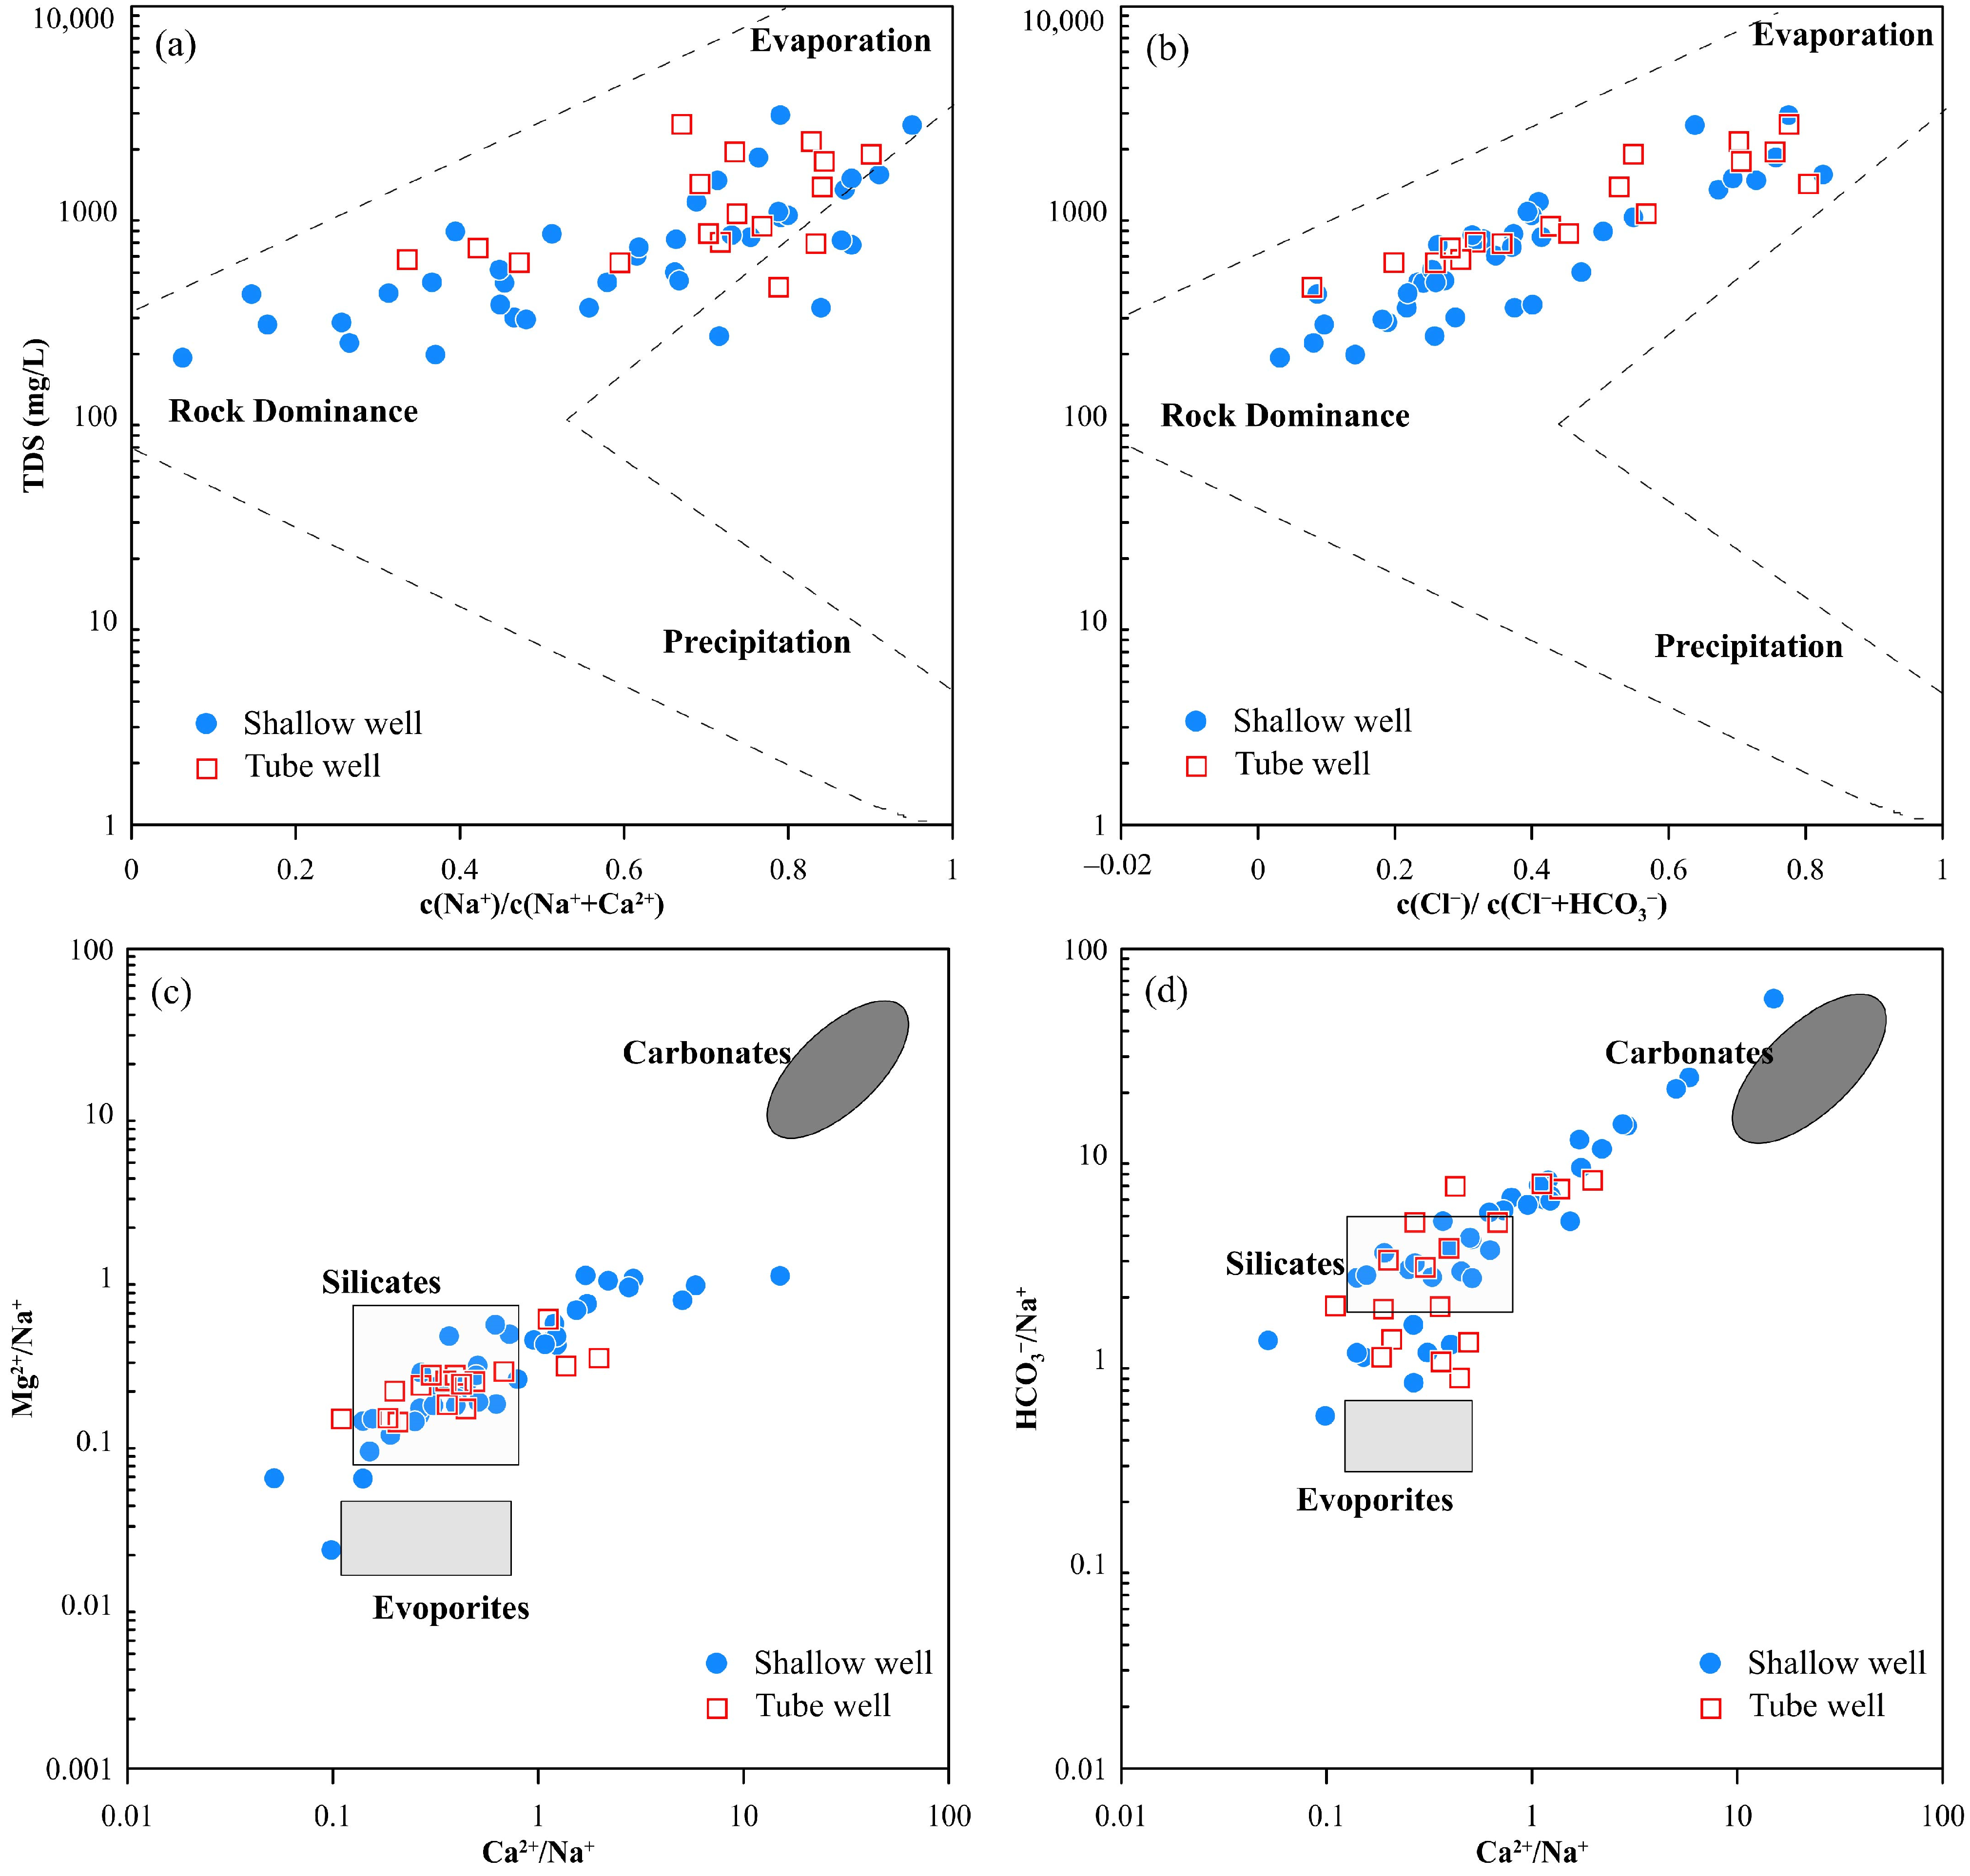
3.5. Chemical Evolution of Groundwater

The more detailed distribution of hydrochemical facies for shallow and tube well groundwater was presented using the HFE-Diagram (Figure 6a). As shown in Figure 6a, the freshening sub-stage consisting of f1, f2, f3, f4, and FW is located within the FwI phase, marked by the curved arrow on the upper left. Conversely, the intrusion phase is depicted in the opposite sector of the diagram, with the SwI sub-stages (i1, i2, i3, i4, and SW). For the shallow well groundwater, nine sub-stages of hydrochemical facies were identified (Table S3), with freshening and intrusion phases accounting for 74.36% and 25.64%, respectively, while for the tube well groundwater, seven sub-stages of hydrochemical facies were identified, with freshening and intrusion phases accounting for 64.71% and 35.29%, respectively.
Generally, the intrusion phase mainly occurred on the southern and northern mainlands of the Manna district (Figure 6b). The color from light to dark indicated the evolutionary processes and impacting degree of seawater intrusion, i.e., started from inland distal intrusion facies, MixNaMixCl, MixCaMixCl, gradually evolved to sub-stages of MixCaCl and MixNaCl, and finally became Na-Cl, which represented the final mixture and tendency of the groundwater components similar to the seawater (Figure 6a). The area belonging to the intrusion phase was involved in the seawater intrusion and reverse cation exchange processes, which contributed to the increasing salinity of groundwater. The reverse cation exchange process led to the conversion of Na-Cl groundwater into Ca-Cl groundwater as seawater intrusion progressed with an adequate supply of Ca2+ in sandy aquifer minerals. Most regions in the Mannar district, including the island section and central and eastern mainland areas, were associated with the freshening phase (Figure 6b), further indicating the major contribution of Na+ and Cl from the halite dissolution and of HCO3 from the silicate dissolution. As a mineral mainly composed of sodium chloride, halite usually presents in geological formations such as salt domes, salt pans, or salt marshes, and its dissolution process, thus, has an important impact on the concentration of Na+ and Cl. In the areas with relatively higher HCO3 and Ca2+, the direct exchange processes (R2) also made a contribution to the Na+ and K+; however, this process might only play a minor role due to the small portion of HCO3-Ca-type groundwater in the Mannar district.

4. Conclusions

In summary, this study explored the geochemical compositions and evolution processes of groundwater in the Mannar district of Sri Lanka. HCO3, Cl, Na+, SO42−, Ca2+, Mg2+, K+, NO3, Br, and F were the main ions in the groundwater, and their concentrations were higher in the groundwater of tube wells than shallow wells. Approximately 64.28% of the groundwater samples had good quality based on a WQI value below 100. Seawater intrusion had a significant impact on 51.28% of shallow well groundwater and 70.58% of tube well groundwater. It should be noted that groundwater suffering from seawater intrusion does not mean poor water quality due to the calculation difference between SMI and WQI. The geochemical composition of groundwater in the Mannar district was predominantly influenced by the processes of rock weathering and/or evaporation. The dissolution of halite and silicate mainly formed the geochemical types of groundwater, with HCO3-Ca type, Cl-Na type, and mixed type accounting for 41.02%, 38.46%, and 20.51% of shallow well groundwater and 23.53%, 58.82%, and 17.64% of tube well groundwater. Seawater intrusion primarily affected the northern and southern mainland regions, leading to elevated levels of Cl, Na+, and other main ions, which, in turn, triggered a reverse cation exchange process. Nine and seven sub-stages of hydrochemical facies, as well as the contribution of freshening and seawater intrusion phases, were revealed for shallow and tube well groundwater. HCO3-Ca and Cl-Na facies accounted for 74.36% and 64.71% of freshening phases, as well as 25.64% and 35.29% of intrusion phases for shallow well and tube well groundwaters, respectively. These findings emphasize the significant impact of seawater intrusion on the geochemical compositions and evolution processes of groundwater in a typically tropical region and will contribute to the effective management and treatment of groundwater resources in a sustainable manner, such as alleviating seawater intrusion, routinely monitoring the groundwater quality, and implementing targeted desalination techniques.

Supplementary Materials

The following supporting information can be downloaded at https://www.mdpi.com/article/10.3390/w16081137/s1, Figure S1: East-West geological schematic cross sections of (a) deep confined aquifer basin system of Mannar mainland and (b) sandy aquifer systems of Mannar Island; Figure S2: Cumulative probability (%) for calculating the threshold value of critical parameters (Na+, Mg2+, Cl, SO42−); Figure S3: SMI values of groundwater in the Mannar district; Figure S4: Hydrochemical relationships between ions. Orange, green, and purple colors represent HCO3-Ca type, Cl-Na type, and mixed type, respectively. Solid and hollow points correspond to shallow well and tube well groundwater, respectively. (a) Cl vs. Na+. (b) HCO3 vs. Ca2+. (c) HCO3 vs. (Ca2+ + Mg2+). (d) Chloro-alkaline index diagram CAI II vs. CAI I; Table S1: Statistics of groundwater geochemical compositions; Table S2: Relative weight of chemical parameters with threshold values; Table S3: Sub-stages (in %) in freshening and intrusion phases.

Author Contributions

All authors contributed to the study’s conception and design. S.A. and Y.W. (Yunwen Wang) drafted the manuscript, performed data analysis, and prepared figures and maps. S.I. and I.Y. assisted with the sample collection S.K.W. and J.L. conducted the investigation, developed the methodology, and carried out the validation. Z.H. and Y.W. (Yuansong Wei) were responsible for project administration, supervision, as well as the writing, review, and editing of the manuscript. All authors have read and agreed to the published version of the manuscript.

Funding

The authors would like to acknowledge the financial support from the National Natural Science Foundation of China (22176199), the Joint Research Program of National Natural Science Foundation of China and National Science Foundation of Sri Lanka (NSFC-NSF SL) (21861142020), the Programme of the Comprehensive Studies on Sri Lanka (059GJHZ2023104MI), the Research Center for Eco-Environmental Science (RCEES-TDZ-2021-14), the Alliance of International Science Organizations Collaborative Research Program (ANSO-CR-KP-2020-05), the Program of China–Sri Lanka Joint Research and Demonstration Center for Water Technology, the China–Sri Lanka Joint Center for Education and Research, the Chinese Academy of Sciences (CAS), and the Alliance of International Science Organizations (ANSO) Scholarship for Young Talents (MSc) (series No. 2020-140).

Data Availability Statement

Data is contained within the article or Supplementary Materials.

Acknowledgments

We would like to thank the staffs and people of China-Sri Lanka Joint Research and Demonstration Center for Water Technology who supported the sample collection. Anonymous reviewers were greatly appreciated for their constructive comments, which helped in improving the quality of the article.

Conflicts of Interest

The authors declare no conflict of interest.

References

  1. Kumar, P.; Biswas, A.; Banerjee, S. Spatio-temporal variability of seawater mixing in the coastal aquifers based on hydrogeochemical fingerprinting and statistical modeling. J. Environ. Manag. 2023, 346, 118937. [Google Scholar] [CrossRef]
  2. Puntoriero, M.L.; Cirelli, A.F.; Volpedo, A.V. Geochemical mechanisms controlling the chemical composition of groundwater and surface water in the southwest of the Pampean plain (Argentina). J. Geochem. Explor. 2015, 150, 64–72. [Google Scholar] [CrossRef]
  3. Varol, S.; Davraz, A. Evaluation of the groundwater quality with WQI (Water Quality Index) and multivariate analysis: A case study of the Tefenni plain (Burdur/Turkey). Environ. Earth Sci. 2015, 73, 1725–1744. [Google Scholar] [CrossRef]
  4. Ghesquière, O.; Walter, J.; Chesnaux, R.; Rouleau, A. Scenarios of groundwater chemical evolution in a region of the Canadian Shield based on multivariate statistical analysis. J. Hydrol. Reg. Stud. 2015, 4, 246–266. [Google Scholar] [CrossRef]
  5. Gopinath, S.; Srinivasamoorthy, K.; Prakash, R.; Saravanan, K.; Karunanidhi, D. Hydrogeochemistry of Groundwater From Tamil Nadu and Pondicherry Coastal Aquifers, South India: Implication for Chemical Characteristics and Sea Water Intrusion. In GIS and Geostatistical Techniques for Groundwater Science; Elsevier: Amsterdam, The Netherlands, 2019; pp. 237–249. [Google Scholar] [CrossRef]
  6. Pastén-Zapata, E.; Ledesma-Ruiz, R.; Harter, T.; Ramírez, A.I.; Mahlknecht, J. Assessment of sources and fate of nitrate in shallow groundwater of an agricultural area by using a multi-tracer approach. Sci. Total Environ. 2014, 470–471, 855–864. [Google Scholar] [CrossRef]
  7. Wurl, J.; Imaz-Lamadrid, M.A.; Mendez-Rodriguez, L.C.; Hernández-Morales, P. Hydrochemical Indicator Analysis of Seawater Intrusion into Coastal Aquifers of Semiarid Areas. Resources 2023, 12, 47. [Google Scholar] [CrossRef]
  8. Torres-Martínez, J.A.; Mora, A.; Knappett, P.S.K.; Ornelas-Soto, N.; Mahlknecht, J. Tracking nitrate and sulfate sources in groundwater of an urbanized valley using a multi-tracer approach combined with a Bayesian isotope mixing model. Water Res. 2020, 182, 115962. [Google Scholar] [CrossRef]
  9. Carol, E.; Kruse, E.; Mas-Pla, J. Hydrochemical and isotopical evidence of ground water salinization processes on the coastal plain of Samborombón Bay, Argentina Eleonora. J. Hydrol. 2009, 365, 335–345. [Google Scholar] [CrossRef]
  10. Cary, L.; Petelet-Giraud, E.; Bertrand, G.; Kloppmann, W.; Aquilina, L.; Martins, V.; Hirata, R.; Montenegro, S.; Pauwels, H.; Chatton, E.; et al. Origins and processes of groundwater salinization in the urban coastal aquifers of Recife (Pernambuco, Brazil): A multi-isotope approach. Sci. Total Environ. 2015, 530–531, 411–429. [Google Scholar] [CrossRef]
  11. Khaska, M.; La Salle, C.L.G.; Lancelot, J.; Mohamad, A.; Verdoux, P.; Noret, A.; Simler, R.; ASTER Team. Origin of groundwater salinity (current seawater vs. saline deep water) in a coastal karst aquifer based on Sr and Cl isotopes. Case study of the La Clape massif (southern France). Appl. Geochem. 2013, 37, 212–227. [Google Scholar] [CrossRef]
  12. Sola, F.; Vallejos, A.; Daniele, L.; Pulido-Bosch, A. Identification of a Holocene aquifer-lagoon system using hydrogeochemical data. Quat. Res. 2014, 82, 121–131. [Google Scholar] [CrossRef]
  13. Barlow, P.M.; Reichard, E.G. L’intrusion d’eau salée dans les régions côtières d’Amérique du Nord. Hydrogeol. J. 2010, 18, 247–260. [Google Scholar] [CrossRef]
  14. Mongelli, G.; Monni, S.; Oggiano, G.; Paternoster, M.; Sinisi, R. Tracing groundwater salinization processes in coastal aquifers: A hydrogeochemical and isotopic approach in the Na-Cl brackish waters of northwestern Sardinia, Italy. Hydrol. Earth Syst. Sci. 2013, 17, 2917–2928. [Google Scholar] [CrossRef]
  15. Arango-Galván, C.; Prol-Ledesma, R.M.; Torres-Vera, M.A. Geothermal prospects in the Baja California Peninsula. Geothermics 2015, 55, 39–57. [Google Scholar] [CrossRef]
  16. Ketabchi, H.; Mahmoodzadeh, D.; Ataie-Ashtiani, B.; Simmons, C.T. Sea-level rise impacts on seawater intrusion in coastal aquifers: Review and integration. J. Hydrol. 2016, 535, 235–255. [Google Scholar] [CrossRef]
  17. Klassen, J.; Allen, D.M. Assessing the risk of saltwater intrusion in coastal aquifers. J. Hydrol. 2017, 551, 730–745. [Google Scholar] [CrossRef]
  18. Rao, V.V.S.G.; Rao, G.T.; Surinaidu, L.; Mahesh, J.; Rao, S.T.M.; Rao, B.M. Assessment of geochemical processes occurring in groundwaters in the coastal alluvial aquifer. Environ. Monit. Assess. 2013, 185, 8259–8272. [Google Scholar] [CrossRef]
  19. Mohanty, A.K.; Rao, V.V.S.G. Hydrogeochemical, seawater intrusion and oxygen isotope studies on a coastal region in the Puri District of Odisha, India. Catena 2019, 172, 558–571. [Google Scholar] [CrossRef]
  20. Chandrajith, R.; Chaturangani, D.; Abeykoon, S.; Barth, J.A.; van Geldern, R.; Edirisinghe, E.A.N.V.; Dissanayake, C.B. Quantification of groundwater–seawater interaction in a coastal sandy aquifer system: A study from Panama, Sri Lanka. Environ. Earth Sci. 2014, 72, 867–877. [Google Scholar] [CrossRef]
  21. Moore, W.S.; Joye, S.B. Saltwater Intrusion and Submarine Groundwater Discharge: Acceleration of Biogeochemical Reactions in Changing Coastal Aquifers. Front. Earth Sci. 2021, 9, 600710. [Google Scholar] [CrossRef]
  22. Holding, S.; Allen, D.M. From days to decades: Numerical modelling of freshwater lens response to climate change stressors on small low-lying islands. Hydrol. Earth Syst. Sci. 2015, 19, 933–949. [Google Scholar] [CrossRef]
  23. Li, S.; Wang, G.; Sun, S.; Hagan DF, T.; Chen, T.; Dolman, H.; Liu, Y. Long-term changes in evapotranspiration over China and attribution to climatic drivers during 1980–2010. J. Hydrol. 2021, 595, 126037. [Google Scholar] [CrossRef]
  24. Chandrajith, R.; Bandara, U.G.C.; Diyabalanage, S.; Senaratne, S.; Barth, J.A.C. Application of Water Quality Index as a vulnerability indicator to determine seawater intrusion in unconsolidated sedimentary aquifers in a tropical coastal region of Sri Lanka. Groundw. Sustain. Dev. 2022, 19, 100831. [Google Scholar] [CrossRef]
  25. Chandrajith, R.; Diyabalanage, S.; Premathilake, K.M.; Hanke, C.; Van Geldern, R.; Barth, J.A.C. Science of the Total Environment Controls of evaporative irrigation return fl ows in comparison to seawater intrusion in coastal karstic aquifers in northern Sri Lanka: Evidence from solutes and stable isotopes. Sci. Total Environ. 2016, 548–549, 421–428. [Google Scholar] [CrossRef]
  26. Kundzewicz, Z.W.; Mata, L.J.; Arnell, N.W.; Döll, P.; Jimenez, B.; Miller, K.; Oki, T.; Şen, Z.; Shiklomanov, I. The implications of projected climate change for freshwater resources and their management. Hydrol. Sci. J. 2008, 53, 3–10. [Google Scholar] [CrossRef]
  27. Kundzewicz, Z.W.; Döll, P. Will groundwater ease freshwater stress under climate change? Hydrol. Sci. J. 2009, 54, 665–675. [Google Scholar] [CrossRef]
  28. Filho, W.L. Handbook of Climate Change Adaptation; Springer: Berlin/Heidelberg, Germany, 2015. [Google Scholar] [CrossRef]
  29. Bandara, U.G.C.; Diyabalanage, S.; Hanke, C.; van Geldern, R.; Barth, J.A.C.; Chandrajith, R. Arsenic-rich shallow groundwater in sandy aquifer systems buffered by rising carbonate waters: A geochemical case study from Mannar Island, Sri Lanka. Sci. Total Environ. 2018, 633, 1352–1359. [Google Scholar] [CrossRef]
  30. Jayathunga, K.; Diyabalanage, S.; Frank, A.H.; Chandrajith, R.; Barth, J.A.C. Influences of seawater intrusion and anthropogenic activities on shallow coastal aquifers in Sri Lanka: Evidence from hydrogeochemical and stable isotope data. Environ. Sci. Pollut. Res. 2020, 27, 23002–23014. [Google Scholar] [CrossRef]
  31. Cooray, P.G. An Introduction to the Geology of Sri Lanka (Ceylon), 2nd ed.; Cambridge University Press: Cambridge, UK, 1984. [Google Scholar]
  32. Rajendram, D.K. An Assessment of Drought in Mannar District, Sri Lanka. Int. J. Humanit. Appl. Soc. Sci. 2019, 11, 1–13. [Google Scholar] [CrossRef]
  33. Chandrasekara, S.S.K.; Pathmarajah, S.; Obeysekera, J.; Vithanage, M. Water Scarcity—A Concealed Phenomenon in Sri Lanka: A Mini Review. ACS ES&T Water 2023, 3, 1454–1462. [Google Scholar] [CrossRef]
  34. Bastiaanssen, W.G.M.; Chandrapala, L. Water balance variability across Sri Lanka for assessing agricultural and environmental water use. Agric. Water Manag. 2003, 58, 171–192. [Google Scholar] [CrossRef]
  35. Davies, J.; Selvarathnam, R. The Groundwater Resources of the Murunkan Area; North-West Land Water Resources Development Project Sri Lanka; Water Resources Board, Groundwater Division: Colombo, Sri Lanka, 1982. [Google Scholar]
  36. Panabokke, C.R.; Perera, A.P.G.R.L. Groundwater Resources of Sri Lanka; Water Resources Board: Colombo, Sri Lanka, 2005. [Google Scholar]
  37. Alexakis, D.E. Linking dpsir model and water quality indices to achieve sustainable development goals in groundwater resources. Hydrology 2021, 8, 90. [Google Scholar] [CrossRef]
  38. Alobaidy, A.H.M.J.; Abid, H.S.; Maulood, B.K. Application of Water Quality Index for Assessment of Dokan Lake Ecosystem, Kurdistan Region, Iraq. J. Water Resour. Prot. 2010, 2, 792–798. [Google Scholar] [CrossRef]
  39. WHO. Guidelines for Drinking-Water Quality, 4th ed.; WHO: Geneva, Switzerland, 2011; pp. 398–403. [Google Scholar]
  40. Aladejana, J.A.; Kalin, R.M.; Sentenac, P.; Hassan, I. Groundwater quality index as a hydrochemical tool for monitoring saltwater intrusion into coastal freshwater aquifer of Eastern Dahomey Basin, Southwestern Nigeria. Groundw. Sustain. Dev. 2021, 13, 100568. [Google Scholar] [CrossRef]
  41. Kanagaraj, G.; Elango, L.; Sridhar, S.G.D.; Gowrisankar, G. Hydrogeochemical processes and influence of seawater intrusion in coastal aquifers south of Chennai, Tamil Nadu, India. Environ. Sci. Pollut. Res. 2018, 25, 8989–9011. [Google Scholar] [CrossRef]
  42. Park, S.C.; Yun, S.T.; Chae, G.T.; Yoo, I.S.; Shin, K.S.; Heo, C.H.; Lee, S.K. Regional hydrochemical study on salinization of coastal aquifers, western coastal area of South Korea. J. Hydrol. 2005, 313, 182–194. [Google Scholar] [CrossRef]
  43. Indika, S.; Hu, D.; Wei, Y.; Yapabandara, I.; Cooray, T.; Makehelwala, M.; Jinadasa, K.B.S.N.; Weragoda, S.K.; Weerasooriya, R.; Pang, Z. Spatiotemporal Variation of Groundwater Quality in North Central Province, Sri Lanka. ACS ES&T Water 2023, 3, 1687–1698. [Google Scholar] [CrossRef]
  44. Gibbs, R.J. Mechanisms Controlling World Water Chemistr. Am. Assoc. Adv. Sci. 2012, 170, 32. [Google Scholar]
  45. Piper, A.M. A graphic procedure in the geochemical interpretation of water-analyses. Eos Trans. Am. Geophys. Union 1944, 25, 914–928. [Google Scholar]
  46. Giménez-Forcada, E. Space/time development of seawater intrusion: A study case in Vinaroz coastal plain (Eastern Spain) using HFE-Diagram, and spatial distribution of hydrochemical facies. J. Hydrol. 2014, 517, 617–627. [Google Scholar] [CrossRef]
  47. Giménez-forcada, E. Dynamic of Seawater Interface using Hydrochemical Facies Evolution Diagram (HFE-D). Groundwater 2010, 48, 212–216. [Google Scholar] [CrossRef] [PubMed]
  48. Bahir, M.; Ouazar, D.; Ouhamdouch, S.; Zouari, K. Groundwater for Sustainable Development Assessment of groundwater mineralization of alluvial coastal aquifer of essaouira basin (Morocco) using the hydrochemical facies evolution diagram (HFE-Diagram). Groundw. Sustain. Dev. 2020, 11, 100487. [Google Scholar] [CrossRef]
  49. Giménez-Forcada, E. Use of the Hydrochemical Facies Diagram (HFE-D) for the evaluation of salinization by seawater intrusion in the coastal Oropesa Plain: Comparative analysis with the coastal Vinaroz Plain, Spain. HydroResearch 2019, 2, 76–84. [Google Scholar] [CrossRef]
  50. Appelo, C.A.J.; Geirnaert, W. Processes accompanying the intrusion of salt water. Geol. Appl. Idrogeol. 1983, 18, 29–40. [Google Scholar]
  51. Tyagi, S.; Sarma, K. Qualitative assessment, geochemical characterization and corrosion-scaling potential of groundwater resources in Ghaziabad district of Uttar Pradesh, India. Groundw. Sustain. Dev. 2020, 10, 100370. [Google Scholar] [CrossRef]
  52. Costall, A.R.; Harris, B.D.; Teo, B.; Schaa, R.; Wagner, F.M.; Pigois, J.P. Groundwater Throughflow and Seawater Intrusion in High Quality Coastal Aquifers. Sci. Rep. 2020, 10, 9866. [Google Scholar] [CrossRef] [PubMed]
  53. Sawyer, C.N. Chemistry for Sanitary Engineers; McGraw-Hill: New York, NY, USA, 1967. [Google Scholar]
  54. Nebbioso, A.; Piccolo, A. Molecular characterization of dissolved organic matter (DOM): A critical review. Anal. Bioanal. Chem. 2013, 405, 109–124. [Google Scholar] [CrossRef] [PubMed]
  55. Hu, D.; Indika, S.; Makehelwala, M.; Titus, C.O.O.R.A.Y.; Zhu, L.; Pang, Z.; Zhong, H.; Weragoda, S.K.; Jinadasa, K.B.S.N.; Weerasooriya, R.; et al. Chemical characteristics and water stability evaluation of groundwater in the CKDu Zone of Sri Lanka. J. Environ. Sci. 2023; 1001-0742, in press. [Google Scholar] [CrossRef]
  56. Miao, Q.; Li, X.; Xu, Y.; Liu, C.; Xie, R.; Lv, Z. Chemical characteristics of groundwater and source identification in a coastal city. PLoS ONE 2021, 16, e0256360. [Google Scholar] [CrossRef]
  57. He, X.; Wu, J.; He, S. Hydrochemical characteristics and quality evaluation of groundwater in terms of health risks in Luohe aquifer in Wuqi County of the Chinese Loess Plateau, northwest China. Hum. Ecol. Risk Assess. 2019, 25, 32–51. [Google Scholar] [CrossRef]
  58. Gaillardet, J.; Dupre, B.; Louvat, P.; Allegre, C.J. Global silicate weathering and CO2 consumption rates deduced from the chemistry of large rivers. Chem. Geol. 1999, 159, 3–30. [Google Scholar] [CrossRef]
  59. Gugulothu, S.; Subbarao, N.; Das, R.; Dhakate, R. Geochemical evaluation of groundwater and suitability of groundwater quality for irrigation purpose in an agricultural region of South India. Appl. Water Sci. 2022, 12, 142. [Google Scholar] [CrossRef]
  60. Li, P.; Zhang, Y.; Yang, N.; Jing, L.; Yu, P. Major ion chemistry and quality assessment of groundwater in and around a mountainous tourist town of China. Expo. Health 2016, 8, 239–252. [Google Scholar] [CrossRef]
  61. Li, P.; Wu, J.; Qian, H. Hydrogeochemistry and quality assessment of shallow groundwater in the southern part of the yellow river alluvial plain (Zhongwei section), Northwest China. Earth Sci. Res. J. 2015, 18, 27–38. [Google Scholar] [CrossRef]
  62. Kumar, P.; Biswas, A.; Banerjee, S.; Rathore, S.; Rana, V.; Ram, K.; Acharya, T. Integrating magnetic susceptibility, hydrogeochemical, and isotopic data to assess the seawater invasion in coastal aquifers of Digha, West Bengal, India. Environ. Sci. Pollut. Res. 2022, 29, 23474–23503. [Google Scholar] [CrossRef] [PubMed]
Figure 1. Study area and sampling points, including 39 shallow wells (blue points) and 17 tube wells (red points).
Water 16 01137 g001
Figure 2. Distribution map of groundwater geochemical compositions. (a) pH, (b) temperature, (c) EC, (d) TDS, (e) Na+, (f) Ca2+, (g) Mg2+, (h) K+, (i) Cl, (j) HCO3, (k) SO42−, (l) NO3, (m) Br, (n) F, and (o) DOC.
Water 16 01137 g002
Figure 3. Distribution map of groundwater quality (a) and SMI (b) in the Mannar district.
Water 16 01137 g003
Figure 4. Gibbs (a,b) and end-member diagrams (c,d) of groundwater in the Mannar district.
Water 16 01137 g004
Figure 5. Piper diagram (a) and spatial distribution (b) of groundwater types.
Water 16 01137 g005
Figure 6. HFE-D of groundwater in the Mannar district. (a) Main hydrochemical facies and sub-stages for intrusion and freshening phases (modified from Giménez-forcada, E., 2019) [49]. (b) Distribution map of facies.
Water 16 01137 g006
Table 1. Statistical analysis of geochemical characteristics.
ParametersUnitShallow WellTube Well
RangeMean ± SDCVRangeMean ± SDCV
pH 5.92–7.976.97 ± 0.550.085.89–7.156.48 ± 0.400.06
Temperature°C27.30–28.2027.63 ± 0.180.0127.50–28.1027.68 ± 0.160.01
ECµS/cm384.00–5910.001548.23 ± 1249.070.81847.00–5310.002336.24 ± 1360.390.58
TDSmg/L192.00–2950.00773.79 ± 624.130.81424.00–2650.001168.35 ± 680.170.58
Na+mg/L4.77–797.00162.20 ± 178.901.1057.62–482.60234.12 ± 156.830.67
K+mg/L0.29–68.0116.21 ± 16.951.050.95–39.7113.02 ± 11.580.89
Mg2+mg/L4.85–111.5531.20 ± 20.600.6614.43–100.3743.95 ± 21.980.50
Ca2+mg/L17.54–187.8365.09 ± 33.810.5227.57–215.2383.63 ± 48.070.57
HCO3mg/L190.32–980.88405.48 ± 160.650.40190.32–790.56492.59 ± 121.010.25
Fmg/L0.14–2.480.64 ± 0.440.680.29–1.730.79 ± 0.430.54
Clmg/L7.38–1530.96301.77 ± 368.191.2235.80–1494.38505.24 ± 430.860.85
Brmg/L0–5.160.93 ± 1.111.200.15–5.501.75 ± 1.570.90
NO3mg/L0–85.604.92 ± 14.232.890–61.0210.56 ± 16.641.58
SO42−mg/L0.99–906.7070.91 ± 148.152.0915.74–200.2078.43 ± 61.520.78
THmg/L84.81–928.36291.00 ± 155.460.53128.27–950.75389.81 ± 192.970.50
DOCmg/L0.59–15.166.64 ± 3.190.481.26–9.153.93 ± 2.550.65
WQI 29.01–306.54100.12 ± 61.890.6269.98–278.38127.03 ± 61.910.49
SMI 0.05–7.911.67 ± 1.951.170.51–6.822.60 ± 2.020.78
Notes: EC—electrical conductivity; TDS—total dissolved solids; TH—total hardness; DOC—dissolved organic carbon; WQI—water quality index; SMI—seawater mixing index; SD—standard deviation; CV—coefficient of variation.
Disclaimer/Publisher’s Note: The statements, opinions and data contained in all publications are solely those of the individual author(s) and contributor(s) and not of MDPI and/or the editor(s). MDPI and/or the editor(s) disclaim responsibility for any injury to people or property resulting from any ideas, methods, instructions or products referred to in the content.

