Abstract
With the acceleration of urbanization and due to the impact of climate warming, economic losses caused by urban waterlogging have become increasingly severe. To reduce urban waterlogging losses under the constraints of limited economic and time resources, it is essential to identify key waterlogging-prone areas for focused governance. Previous studies have often overlooked the spatial heterogeneity in the distribution of value and risk. Therefore, identifying the spatial distribution of land value and risk, and analyzing their spatial overlay effects, is crucial. This study constructs a “Waterlogging-Value-Loss” spatial analysis framework based on the hydrological and value attributes of land use. By developing a 1D–2D coupled hydrodynamic model, the study determines waterlogging risk distributions for different return periods. Combining these results with disaster loss curves, it evaluates land-use values and employs the bivariate local Moran’s I index to comprehensively assess waterlogging risk and land value, thereby identifying key areas. Finally, the SHAP method is used to quantify the contribution of water depth and value to waterlogging losses, and a Birch-K-means combined clustering algorithm is applied to identify dominant factors at the street scale. Using the central urban area of Beijing as a case study, the results reveal significant spatial heterogeneity in the distribution of urban waterlogging risks and values. Compared to traditional assessment methods that only consider waterlogging risk, the bivariate spatial correlation analysis method places greater emphasis on high-value areas, while reducing excessive attention to low-value, high-risk areas, significantly improving the accuracy of identifying key waterlogging-prone areas. Furthermore, the Birch-K-means combined clustering algorithm classifies streets into three types based on dominant factors of loss: water depth-dominated (W), value-dominated (V), and combined-dominated (WV). The study finds that as the return period increases, the dominant factors for 22.23% of streets change, with the proportion of W-type streets rising from 29% to 38%. This study provides a novel analytical framework that enhances the precision of urban flood prevention and disaster mitigation efforts. It helps decision-makers formulate more effective measures to prevent and reduce urban waterlogging disasters.
1. Introduction
Urban stormwater drainage systems serve as critical infrastructure for urban flood control and waterlogging mitigation, ensuring the safe operation of cities [1]. However, with the continuous advancement of urbanization, significant changes in land use have occurred, including a substantial increase in impervious surfaces and a severe reduction in natural water storage space [2]. Global warming has triggered extreme rainfall events, while outdated drainage systems fail to meet the requirements for “rapid drainage”, collectively leading to frequent urban waterlogging disasters, which pose significant threats to urban economies, lives, and property [3,4]. In 2005, Hurricane Katrina caused over 1500 deaths and displaced 400,000 people in New Orleans, with estimated losses reaching USD 125 billion [5]. In China, from 1990 to 2021, the total area affected by flooding and waterlogging disasters amounted to 6,811,688 km2, resulting in direct economic losses of CNY 5081.303 billion [6]. Notably, the “7·21” Beijing rainstorm in 2012 caused the collapse of at least 8200 buildings, with direct losses amounting to CNY 11.64 billion [7]. At the same time, with the rapid development of urban economies, the value of fixed assets, such as buildings and infrastructure, has risen sharply, often exhibiting significant spatial heterogeneity. When waterlogging occurs in high-value built-up areas, it tends to cause substantial economic losses, posing serious threats to urban safety and operations [8]. Therefore, effectively identifying waterlogging risks and the spatial distribution of property values, assessing their spatial overlay effects, and reducing urban waterlogging disaster losses have become urgent issues to address.
With the continuous intensification of urbanization, the impacts of urban waterlogging are becoming increasingly severe. Conducting risk assessments of waterlogging is of critical importance for urban flood prevention planning and construction, as well as for the development of disaster response mechanisms. Various hydrological and hydrodynamic models, such as SWMM, Mike Urban, InfoWorks ICM, and Itf, have been used by scholars to numerically simulate the complex processes from urban rainfall to drainage system responses [9,10,11,12]. Ji utilized the ICM model to simulate the spatial distribution of urban waterlogging based on various climatic scenarios, analyzing the influence of climate change on urban flood risk [13], while Zhang applied the SWMM model to simulate changes in water quantity and quality based on various rainfall scenarios in Ruyang County [14]. Haq identified inundation areas by integrating remote sensing (RS) imagery with GIS-based geospatial analysis techniques [15]. In contrast to drainage-network-based simulations that analyze waterlogging scenarios over different rainfall return periods, other researchers have focused on waterlogging risk zoning. These studies often rely on historical disaster data and indicator system methods to determine the distribution of waterlogging risk areas. For instance, Wang evaluated the spatial distribution of comprehensive waterlogging risks based on different scenarios by integrating indicators such as economic, social, and geographical factors [16]. Chen identified 14 flood-triggering indicators using disaster, vulnerability, and resilience indices and developed flood waterlogging risk maps based on an improved AHP-EW method [17]. Li assessed urban risk based on four aspects—disaster-causing factors, disaster-prone environments, disaster-bearing bodies, and disaster prevention and mitigation capacity—and classifying risks into five levels and identifying the characteristics of flood-prone areas [18].
However, these studies on urban waterlogging have downplayed the economic attributes of waterlogging disaster events. To quantify the economic losses caused by waterlogging, some scholars have thoroughly explored the economic value of different land-use types within urban areas, aiming to accurately assess the impacts and losses caused by waterlogging. Banba et al. incorporated land use into flood risk assessments, making significant contributions to urban management and planning practices [19,20,21]. Huizinga et al. developed damage curves for seven land-use categories—residential, commercial, industrial, transportation, infrastructure, and agriculture—to compare differences in flood loss assessments across countries [22]. Jongman et al. evaluated the impact of land-use types on losses by comparing various waterlogging loss models [23]. Although existing studies have made certain progress in the research on urban waterlogging risk or land value, they often focus on either water depth or the value of the land alone, with insufficient attention being paid to the spatial overlay effects of water depth and land value. This may lead to excessive attention being paid to high-risk, low-value areas during waterlogging events, while high-value, low-risk areas might not receive adequate rescue support due to limited resources. Therefore, only by comprehensively evaluating urban waterlogging risk and land value can key areas be accurately identified.
To scientifically analyze the spatial relationship between urban waterlogging risks and land value, and to identify key areas, bivariate spatial correlation analysis is introduced. This theory was initially applied primarily in the field of epidemiology [24], where it was used to study the spatial relationships between disease incidence and environmental factors. In recent years, it has gradually been applied in other fields such as ecology. For example, Peng used Moran’s Index to identify the spatial relationship between green ecology and financial development, revealing the complex spatial links between the two [25]. Similarly, Wu analyzed the relationship between urban impervious surfaces and land surface temperatures, identifying key areas for targeted artificial watering to reduce temperatures [26]. These examples effectively demonstrate that bivariate spatial correlation analysis can be used to identify key areas. By relying on this method to determine areas of focus, it is possible to reduce the level of attention focused on high-risk but low-value areas and achieve precise targeting for disaster prevention and mitigation. Decision-making and resource allocation for urban waterlogging prevention must consider multiple conditions. Not only is it necessary to identify key areas, but it is also critical to determine the dominant factors contributing to waterlogging losses, thereby establishing differentiated governance mechanisms. Such comprehensive analysis helps to minimize waterlogging losses to the greatest extent possible under resource constraints. Therefore, identifying the dominant factors driving waterlogging losses is also crucial.
Quantifying the relative contribution of each factor is a critical step in identifying the dominant factors driving waterlogging losses. Many scholars have used various methods for contribution analysis. For example, Qin collected data through a combination of online surveys and questionnaires and used mathematical statistical methods to identify content and product contributions, explaining user contribution mechanisms [27]. Compared to traditional survey methods, machine learning provides a predictive approach that requires less data. Liu, through an improved principal component analysis (PCA) method, analyzed the contributions of eight heavy metals to soil pollution in Lintong District, identifying Cr and Pb as the main pollutants [28]. Liang used random forests to explore the possible driving factors of heatwave changes across different regions of China and their contributions, and found that urbanization is the dominant factor in the northeast, the eastern arid zone, and on the Qinghai–Tibet Plateau, while climate change dominates in Central China, North China, and in the southern regions of the country [29]. Similarly, Liu applied SHAP (Shapley Additive Explanations) to determine that rainfall has a greater limiting effect on wet deposition than air pollution concentration [30]. These methods have all been proven effective, and SHAP, in particular, is widely used because it can calculate the contribution value of each feature for individual instances. Therefore, this study adopts SHAP to quantify the contributions of various factors.
Clustering can be defined as a method of organizing data objects into groups and is considered one of the classic problems in machine learning and statistics [31]. K-means is one of the most popular unsupervised learning algorithms used in clustering, but it is highly sensitive to the choice of initial conditions, and the results largely depend on the selection of the initial cluster centers. Sinaga identified the shortcomings of the K-means algorithm and proposed a new unsupervised K-means (U-K-means) clustering algorithm, which can automatically determine the optimal number of clusters without requiring any initializations or parameter selection [32]. Liu combined Bayesian theory with the K-means algorithm, resulting in an approach that is more interpretable than traditional methods [33]. Huang proposed an improved K-means algorithm for time series data, such as TSK-means, which effectively utilizes the intrinsic subspace information of time series datasets to enhance clustering performance [34]. Kaur introduced a hybrid clustering method combining K-means and Birch. This algorithm first uses a hierarchical clustering algorithm to generate a tree, which produces a large number of clusters when applied to a dataset. Then, it applies the K-means partitioning algorithm to refine the clustering, reducing the number of clusters while achieving higher accuracy and a lower sum-of-squares error [35]. Due to the higher accuracy and smaller sum-of-squares error achieved by the Birch-K-means hybrid algorithm, this study adopts the Birch-K-means combined algorithm for clustering analysis to identify the dominant factors of different streets over various return periods.
Urban waterlogging risk assessment is a complex issue, and existing studies have not fully considered the spatial overlay effects of waterlogging and land value. They have also insufficiently emphasized the dominant factors influencing waterlogging losses. Therefore, in this study, we propose a “Waterlogging-Value-Loss” spatial analysis framework aimed at identifying key waterlogging areas through bivariate spatial correlation analysis, while clarifying the relative contributions of waterlogging and land value using machine learning. First, we use the ICM model to generate waterlogging risk maps and evaluate land use based on damage–loss curves. Through the bivariate local Moran’s I, we analyze the spatial overlay characteristics of waterlogging and value to identify key focus areas, ensuring the accuracy of disaster prevention and mitigation zones. Then, we quantify direct economic losses based on waterlogging results and damage–loss curves, using SHAP to evaluate the contributions of waterlogging and land value to economic losses. Finally, we apply a combined Birch-K-means clustering algorithm to analyze and identify the dominant factors for different streets over varying recurrence periods. This framework provides a reference for precise urban disaster prevention and mitigation, supporting the establishment of differentiated waterlogging management mechanisms.
2. Materials and Methods
2.1. Research Framework
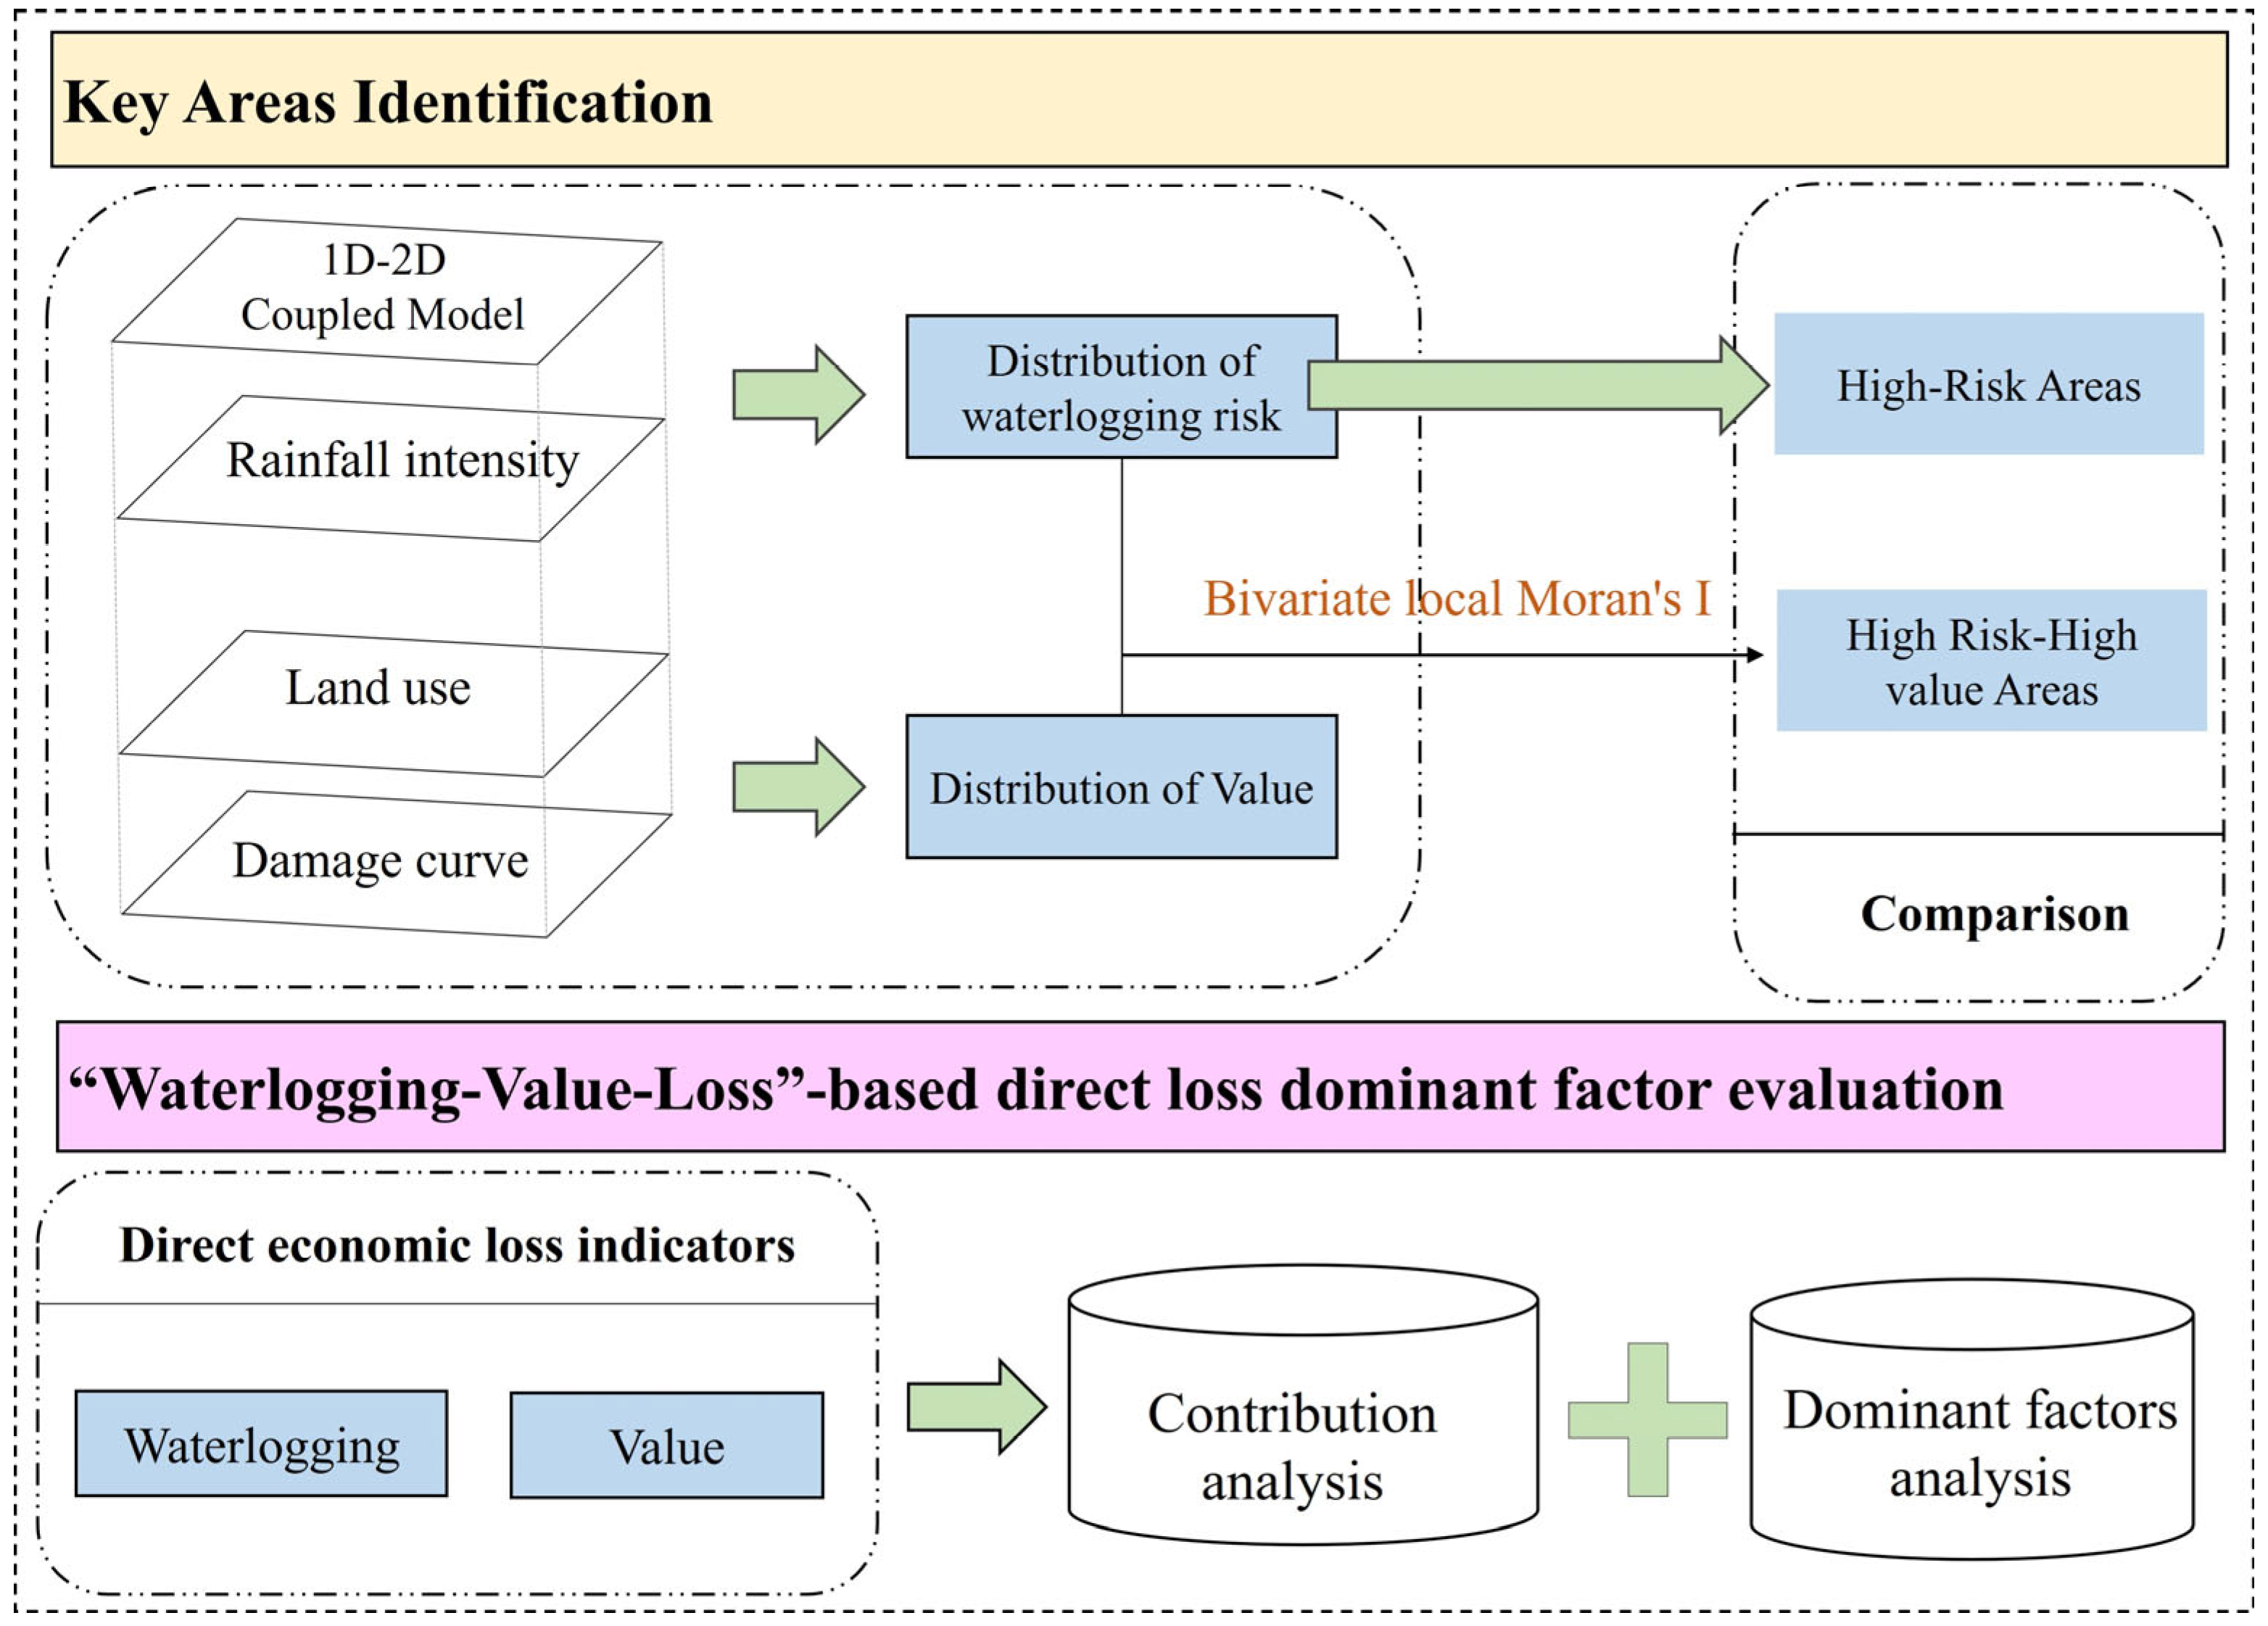
With the rapid development of urbanization, factors such as reduced infiltration capacity and increased rainfall have led to delayed drainage, making urban waterlogging increasingly severe. Urbanization is also accompanied by the excessive concentration of people and property, resulting in more severe economic losses being caused by waterlogging, which poses a significant threat to people’s lives and property. Land use, as a spatial carrier, determines the type of surface cover in a region. Different types of surface cover have unique hydrological and property value attributes. Therefore, identifying the relationship between waterlogging, land-use types, and waterlogging losses is particularly important. This study first uses the dual hydrological–value attributes of land use as a research foundation to identify the coupled distribution of waterlogging and property value, analyze their spatial overlay effects, and calculate waterlogging losses. The interaction between waterlogging and land use value generates waterlogging losses. Using SHAP (Shapley Additive Explanations) theory, the contributions of waterlogging and land value to urban waterlogging losses are quantified, and the dominant factors causing waterlogging disasters are determined, providing scientific evidence for disaster prevention and mitigation.
This study begins by inputting factors such as rainfall and topography into the ICM model to construct a 1D–2D hydrological and hydrodynamic coupled model, simulating the distribution of urban waterlogging. The severity of waterlogging is classified, and waterlogging risk maps are generated. Next, using a method that combines the integral approach with flood damage curves, the economic losses per unit of land are quantified. This allows for the evaluation of the economic vulnerability of different land-use types and the creation of an urban land value distribution map. Finally, the bivariate local Moran’s I method is applied to identify the spatial clustering effects of waterlogging and property value. These clusters are categorized into five types: high-risk–high-value, high-risk–low-value, low-risk–high-value, low-risk–low-value, and non-significant areas. The high-risk–high-value areas are identified as key areas of focus.
The direct economic losses caused by waterlogging are jointly determined by waterlogging and the value of surface cover. To gain an in-depth understanding of the formation mechanism and spatial differentiation characteristics of urban waterlogging losses in Beijing, this study employs SHAP to reveal the contribution of each factor to the losses. Based on the Birch-K-means combined algorithm, clustering analysis is conducted to identify the dominant factor for each category, thereby establishing differentiated governance mechanisms and providing scientific evidence for reducing waterlogging disaster losses. The research framework is illustrated in Figure 1.
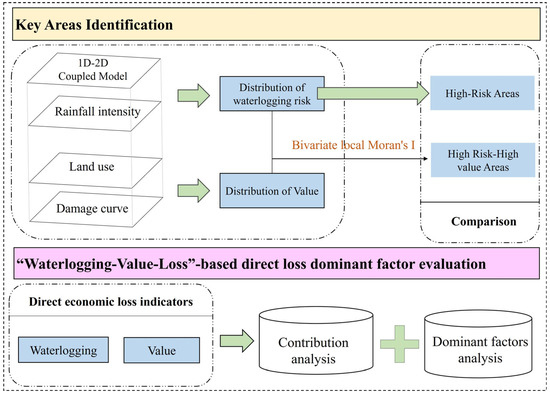
Figure 1.
Research framework.
2.2. Study Area
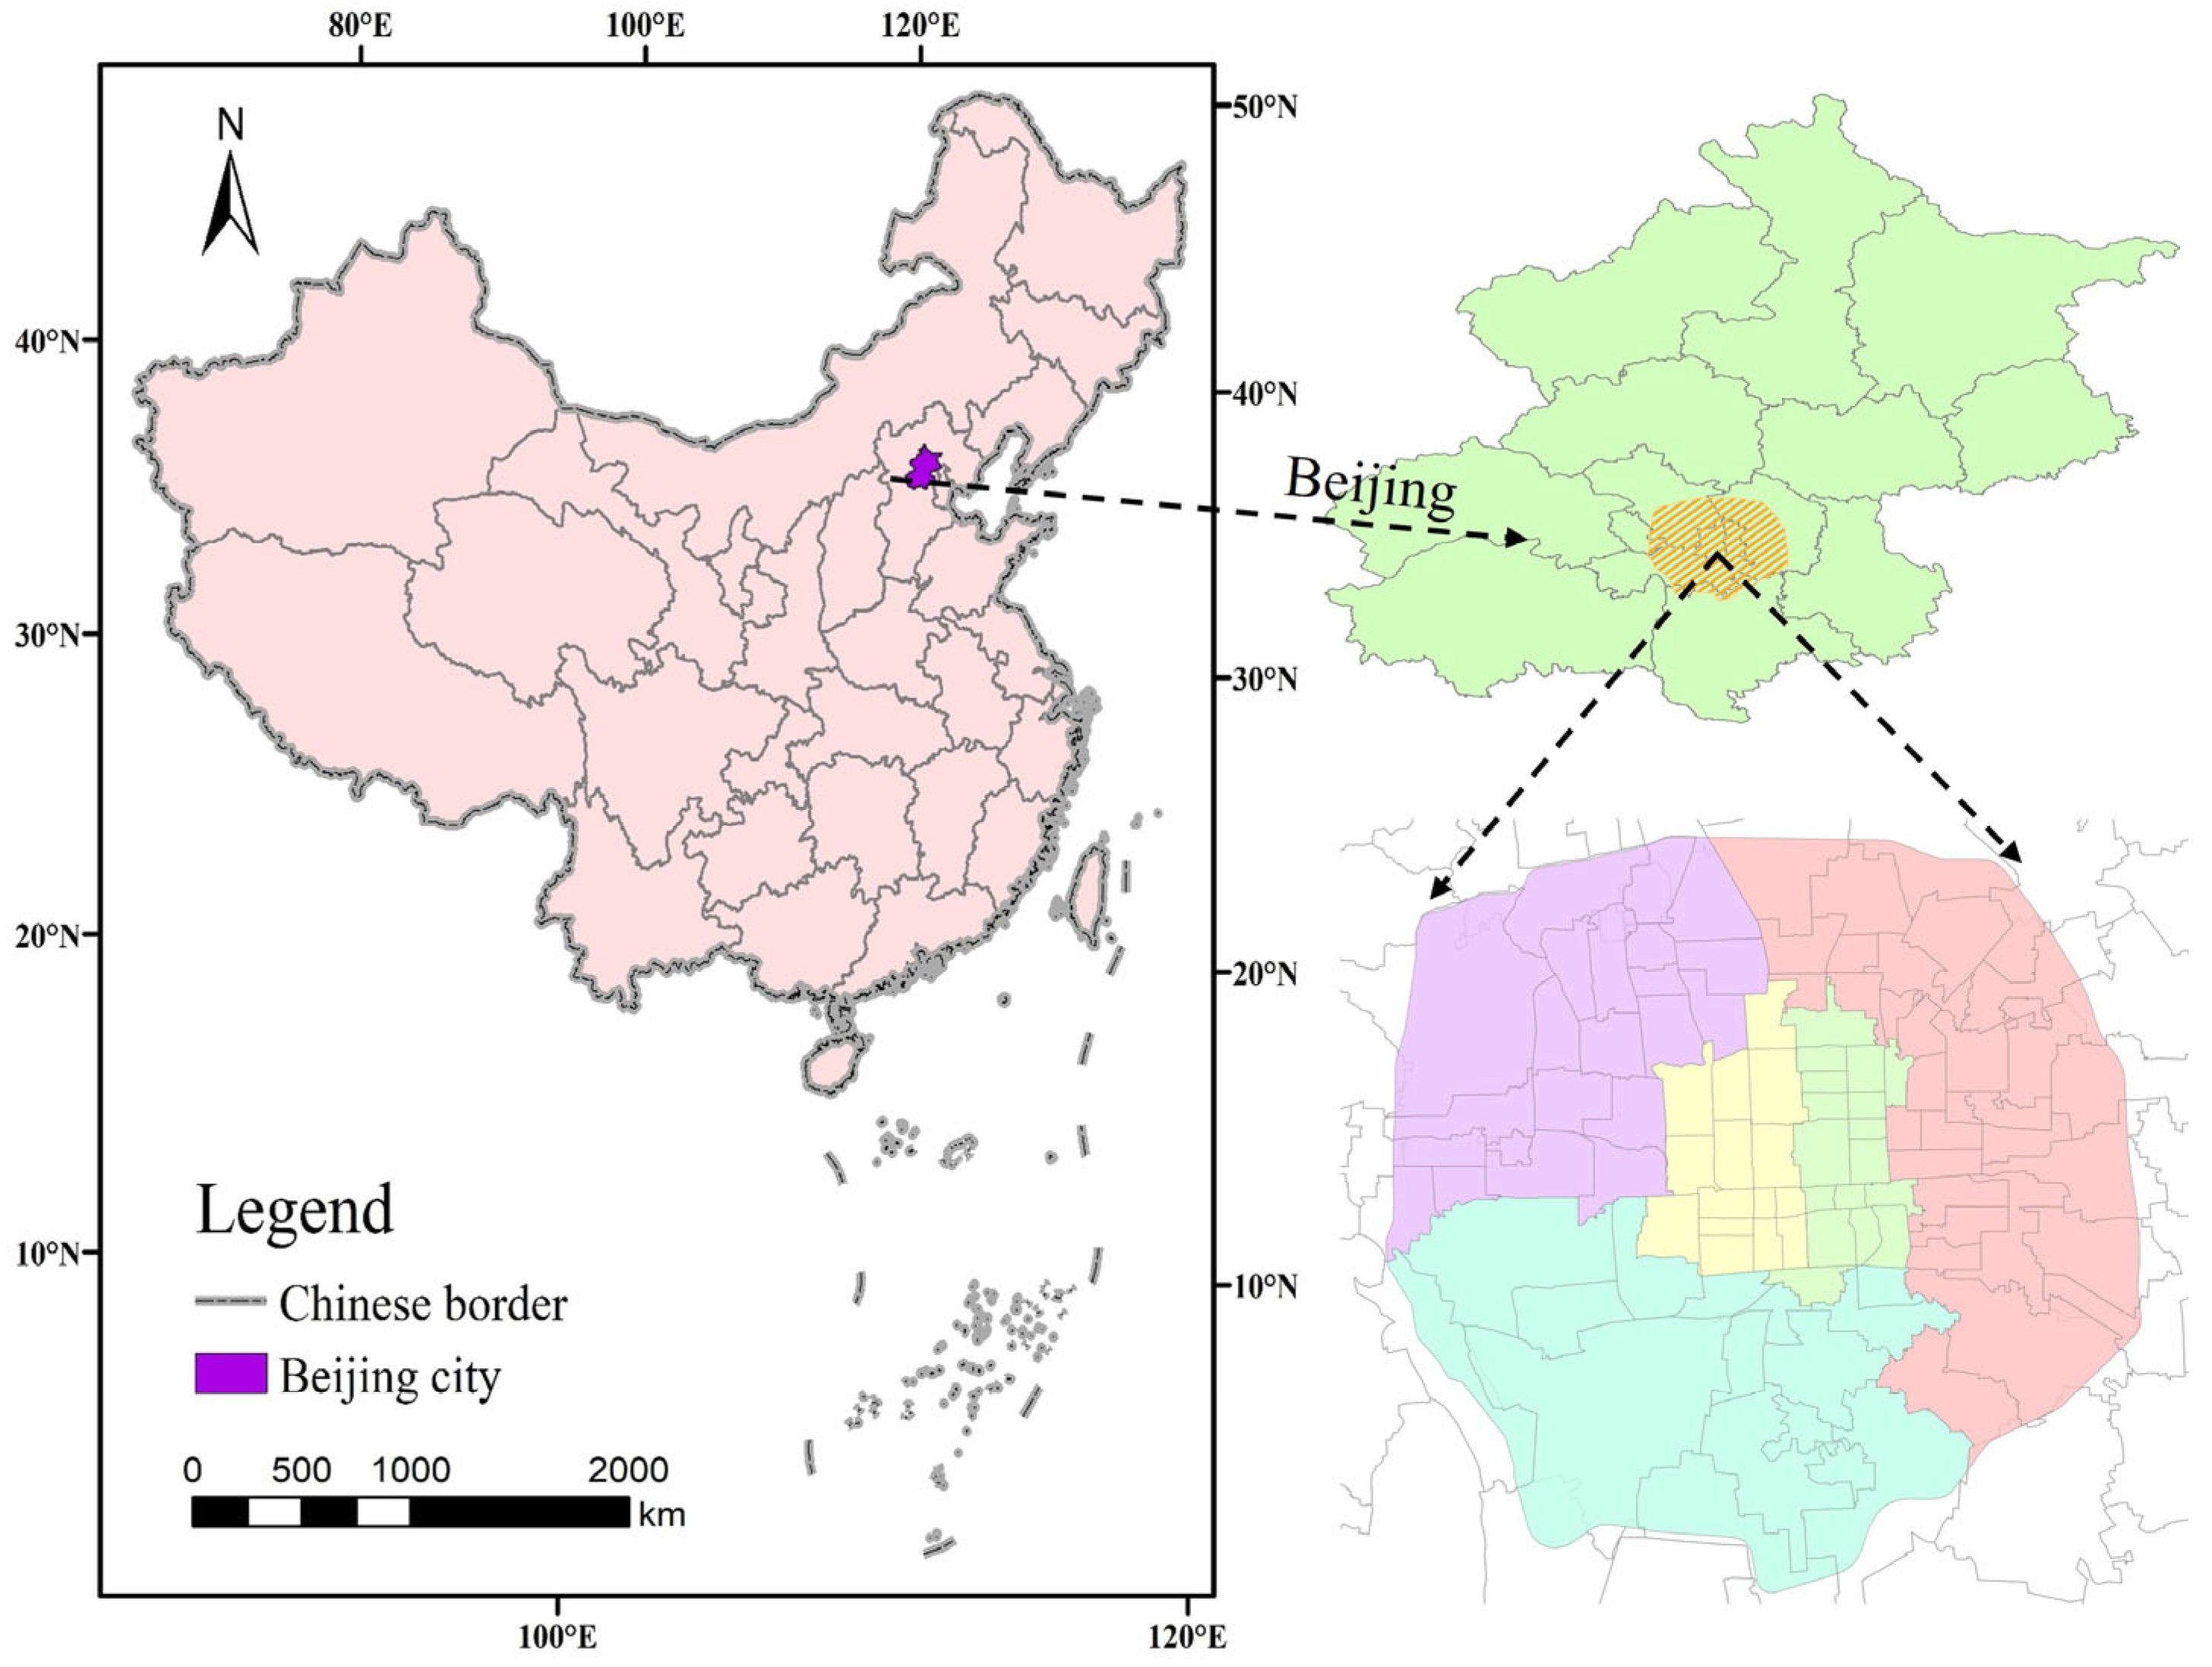
Beijing is located in the northwest of the North China Plain, with terrain sloping from west to east. Major rivers flowing through the area include the Yongding River and the North Canal. It belongs to a temperate monsoon climate zone. As one of China’s economic, political, and cultural centers, Beijing is highly urbanized and densely populated, making it particularly susceptible to flood losses. During the catastrophic “7·21” rainstorm in 2012, approximately 86% of the city experienced rainfall exceeding 100 mm, with the maximum rainfall reaching as high as 541 mm, resulting in economic losses of about CNY 16 billion [36,37]. Therefore, this study selects Beijing’s central urban area, covering a total area of 668.35 km2, as the research region (Figure 2). The study aims to identify waterlogging risk zones and propose zoned governance strategies to enhance the city’s resilience against waterlogging risks and reduce associated losses.
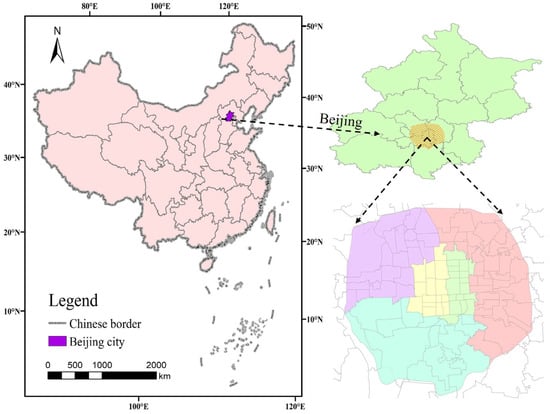
Figure 2.
Study area location.
2.3. Urban Waterlogging Model Construction
In calculating waterlogging, scholars have used various modeling software packages, such as ICM [11], SWMM-Itf [12], and SWMM-TELEMAC-2D [38], to construct urban waterlogging models. Among these, the 1D–2D coupled model can accurately simulate stormwater systems and surface runoff. Therefore, this study adopts a 1D–2D coupled model to analyze urban waterlogging. The data used in this study were all provided by Beijing’s planning department, including pipeline network data, 10 m × 10 m DEM, and land-use data.
2.3.1. Model Construction
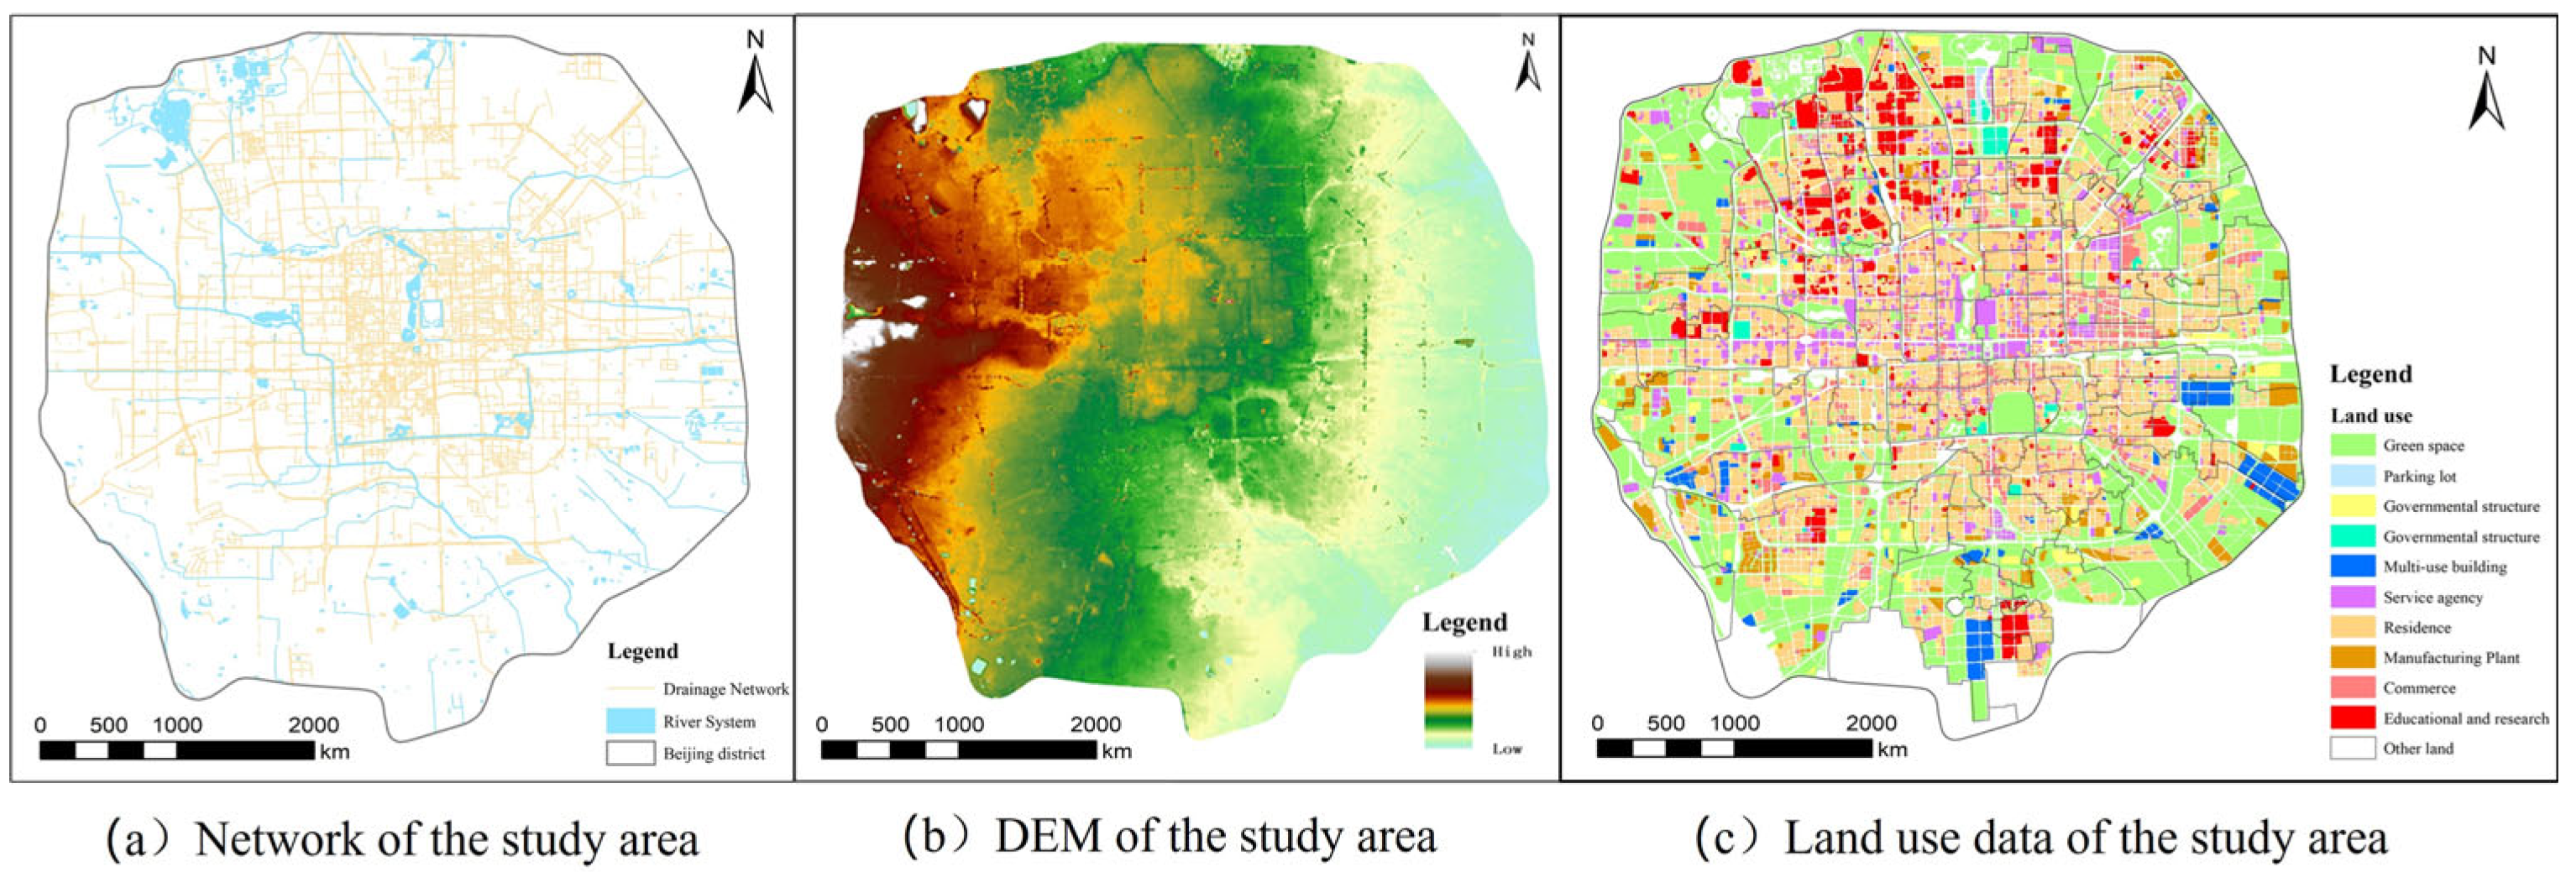
First, a 1D model of Beijing was constructed using the ICM model combined with pipeline network data. This model includes 62,959 pipelines with a total length of 2092.97 km, 1098 outlets, and 66,634 manholes, as shown in Figure 3a. Next, based on the land-use data shown in Figure 3c, runoff generation and concentration parameters for sub-catchments were extracted. The land-use data were classified into categories such as roads, educational and research land, green spaces, and water systems. Then, elevation information was obtained using DEM data (Figure 3b), and 2D grids were delineated for surface simulation. Finally, the 2D surface overland flow model was coupled with the 1D pipeline network model to construct a 1D–2D coupled waterlogging model.
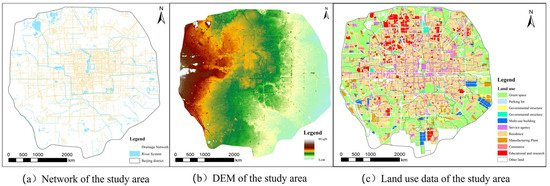
Figure 3.
Distribution maps of network, DEM, and land use.
2.3.2. Model Accuracy Verification
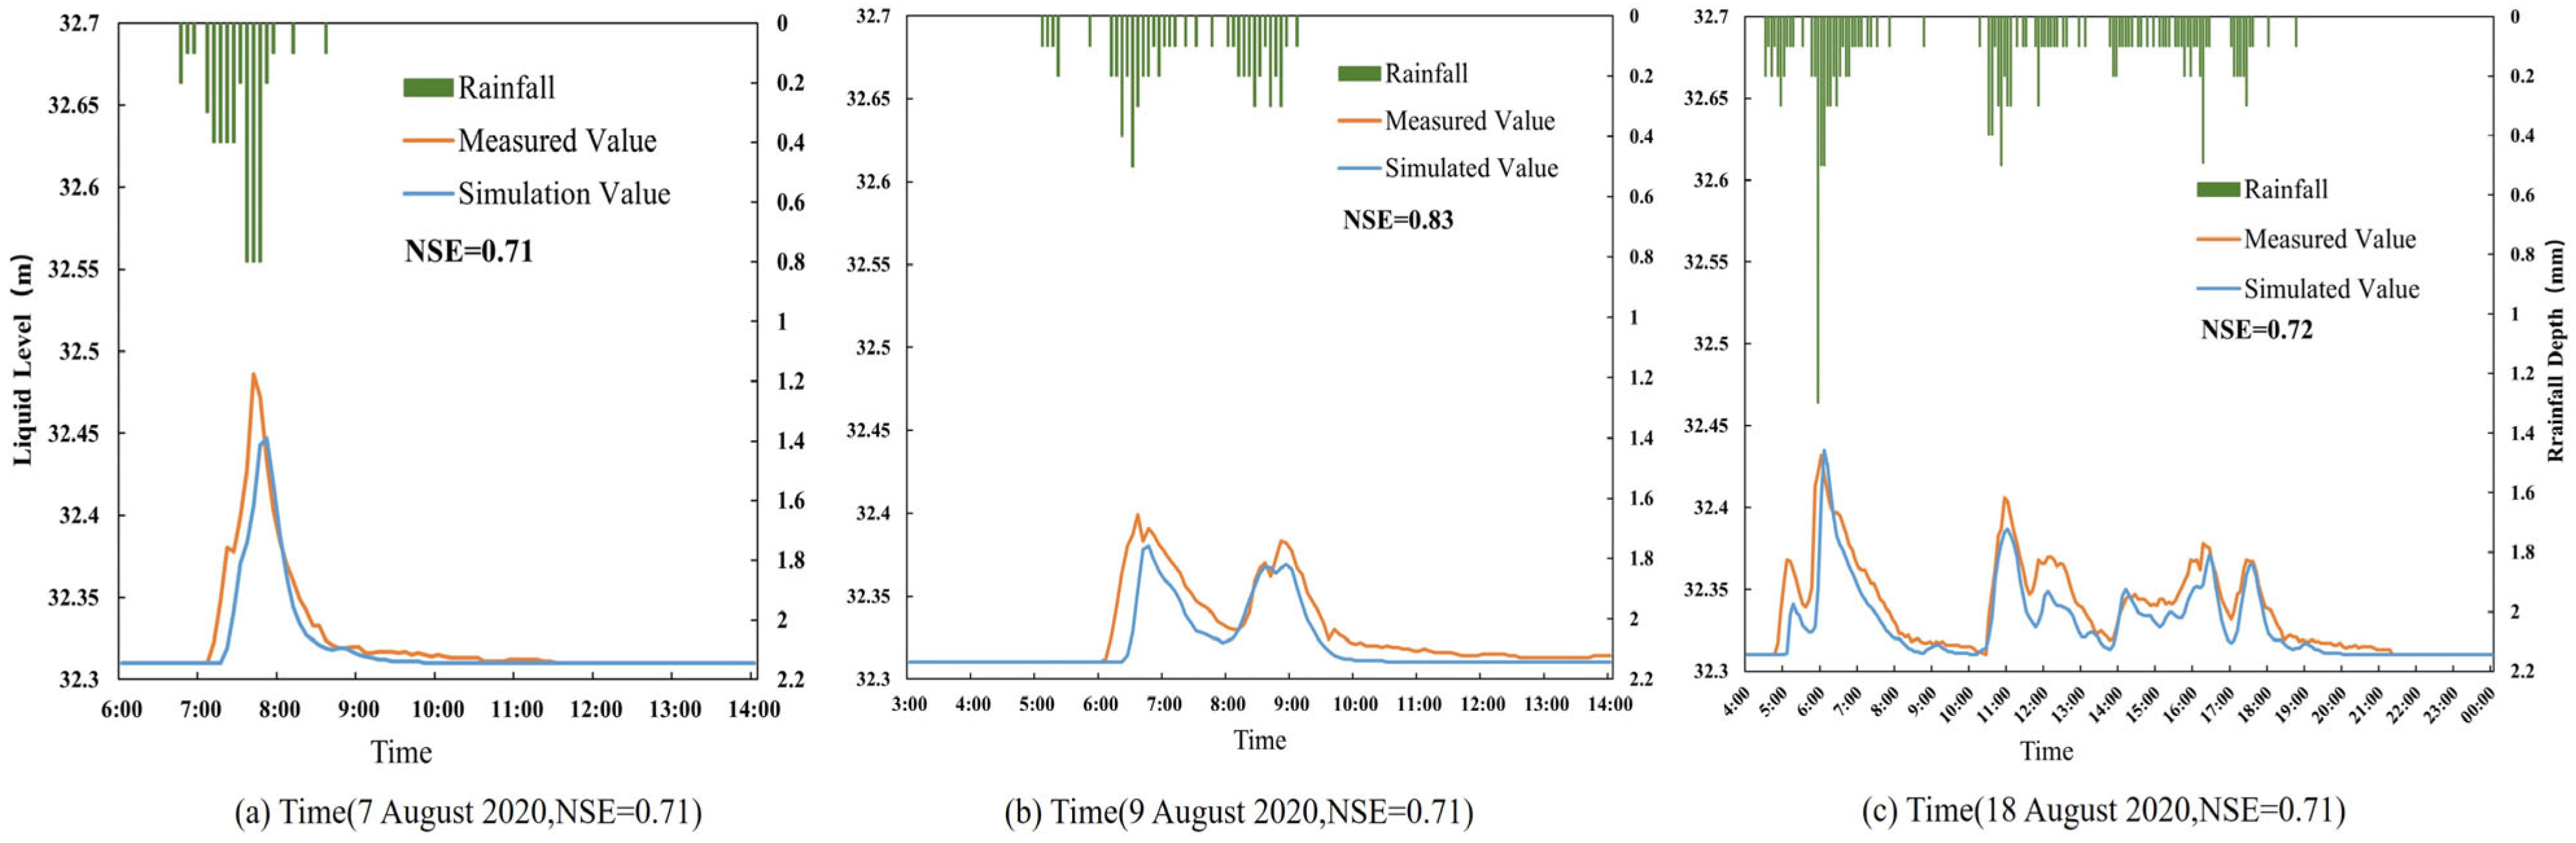
To ensure the rationality and reliability of the model for different rainfall events, it is necessary to validate the surface runoff generation and concentration parameters. In this study, three complete real rainfall events from 7 August 2020, 9 August 2020, and 18 August 2020 were selected for simulation. The Nash–Sutcliffe Efficiency Coefficient (NSE) is commonly used to calibrate and validate the accuracy of the model. Generally, an NSE value greater than 0.7 is considered to indicate a model with good simulation performance [39].
In the formula, represents the simulated value at time (m3/s); represents the observed data at time (m3/s); and represents the average of the observed data (m3/s).
The comparison between the observed water levels and the simulated values is shown in Figure 4. The NSE values for all three rainfall events exceeded 0.7, indicating that the calibration of the model parameters is reasonable and that the model is suitable for subsequent simulations.
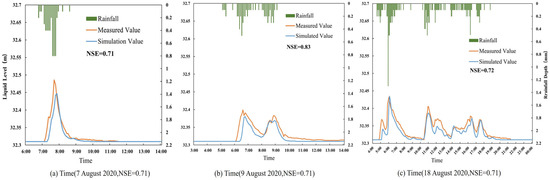
Figure 4.
Calibration results of model parameters and validation results of rainfall runoff process: (a) 7 August 2020 rainfall event; (b) 9 August 2020 rainfall event; and (c) 18 August 2020 rainfall event.
2.3.3. Design Rainfall Scenarios
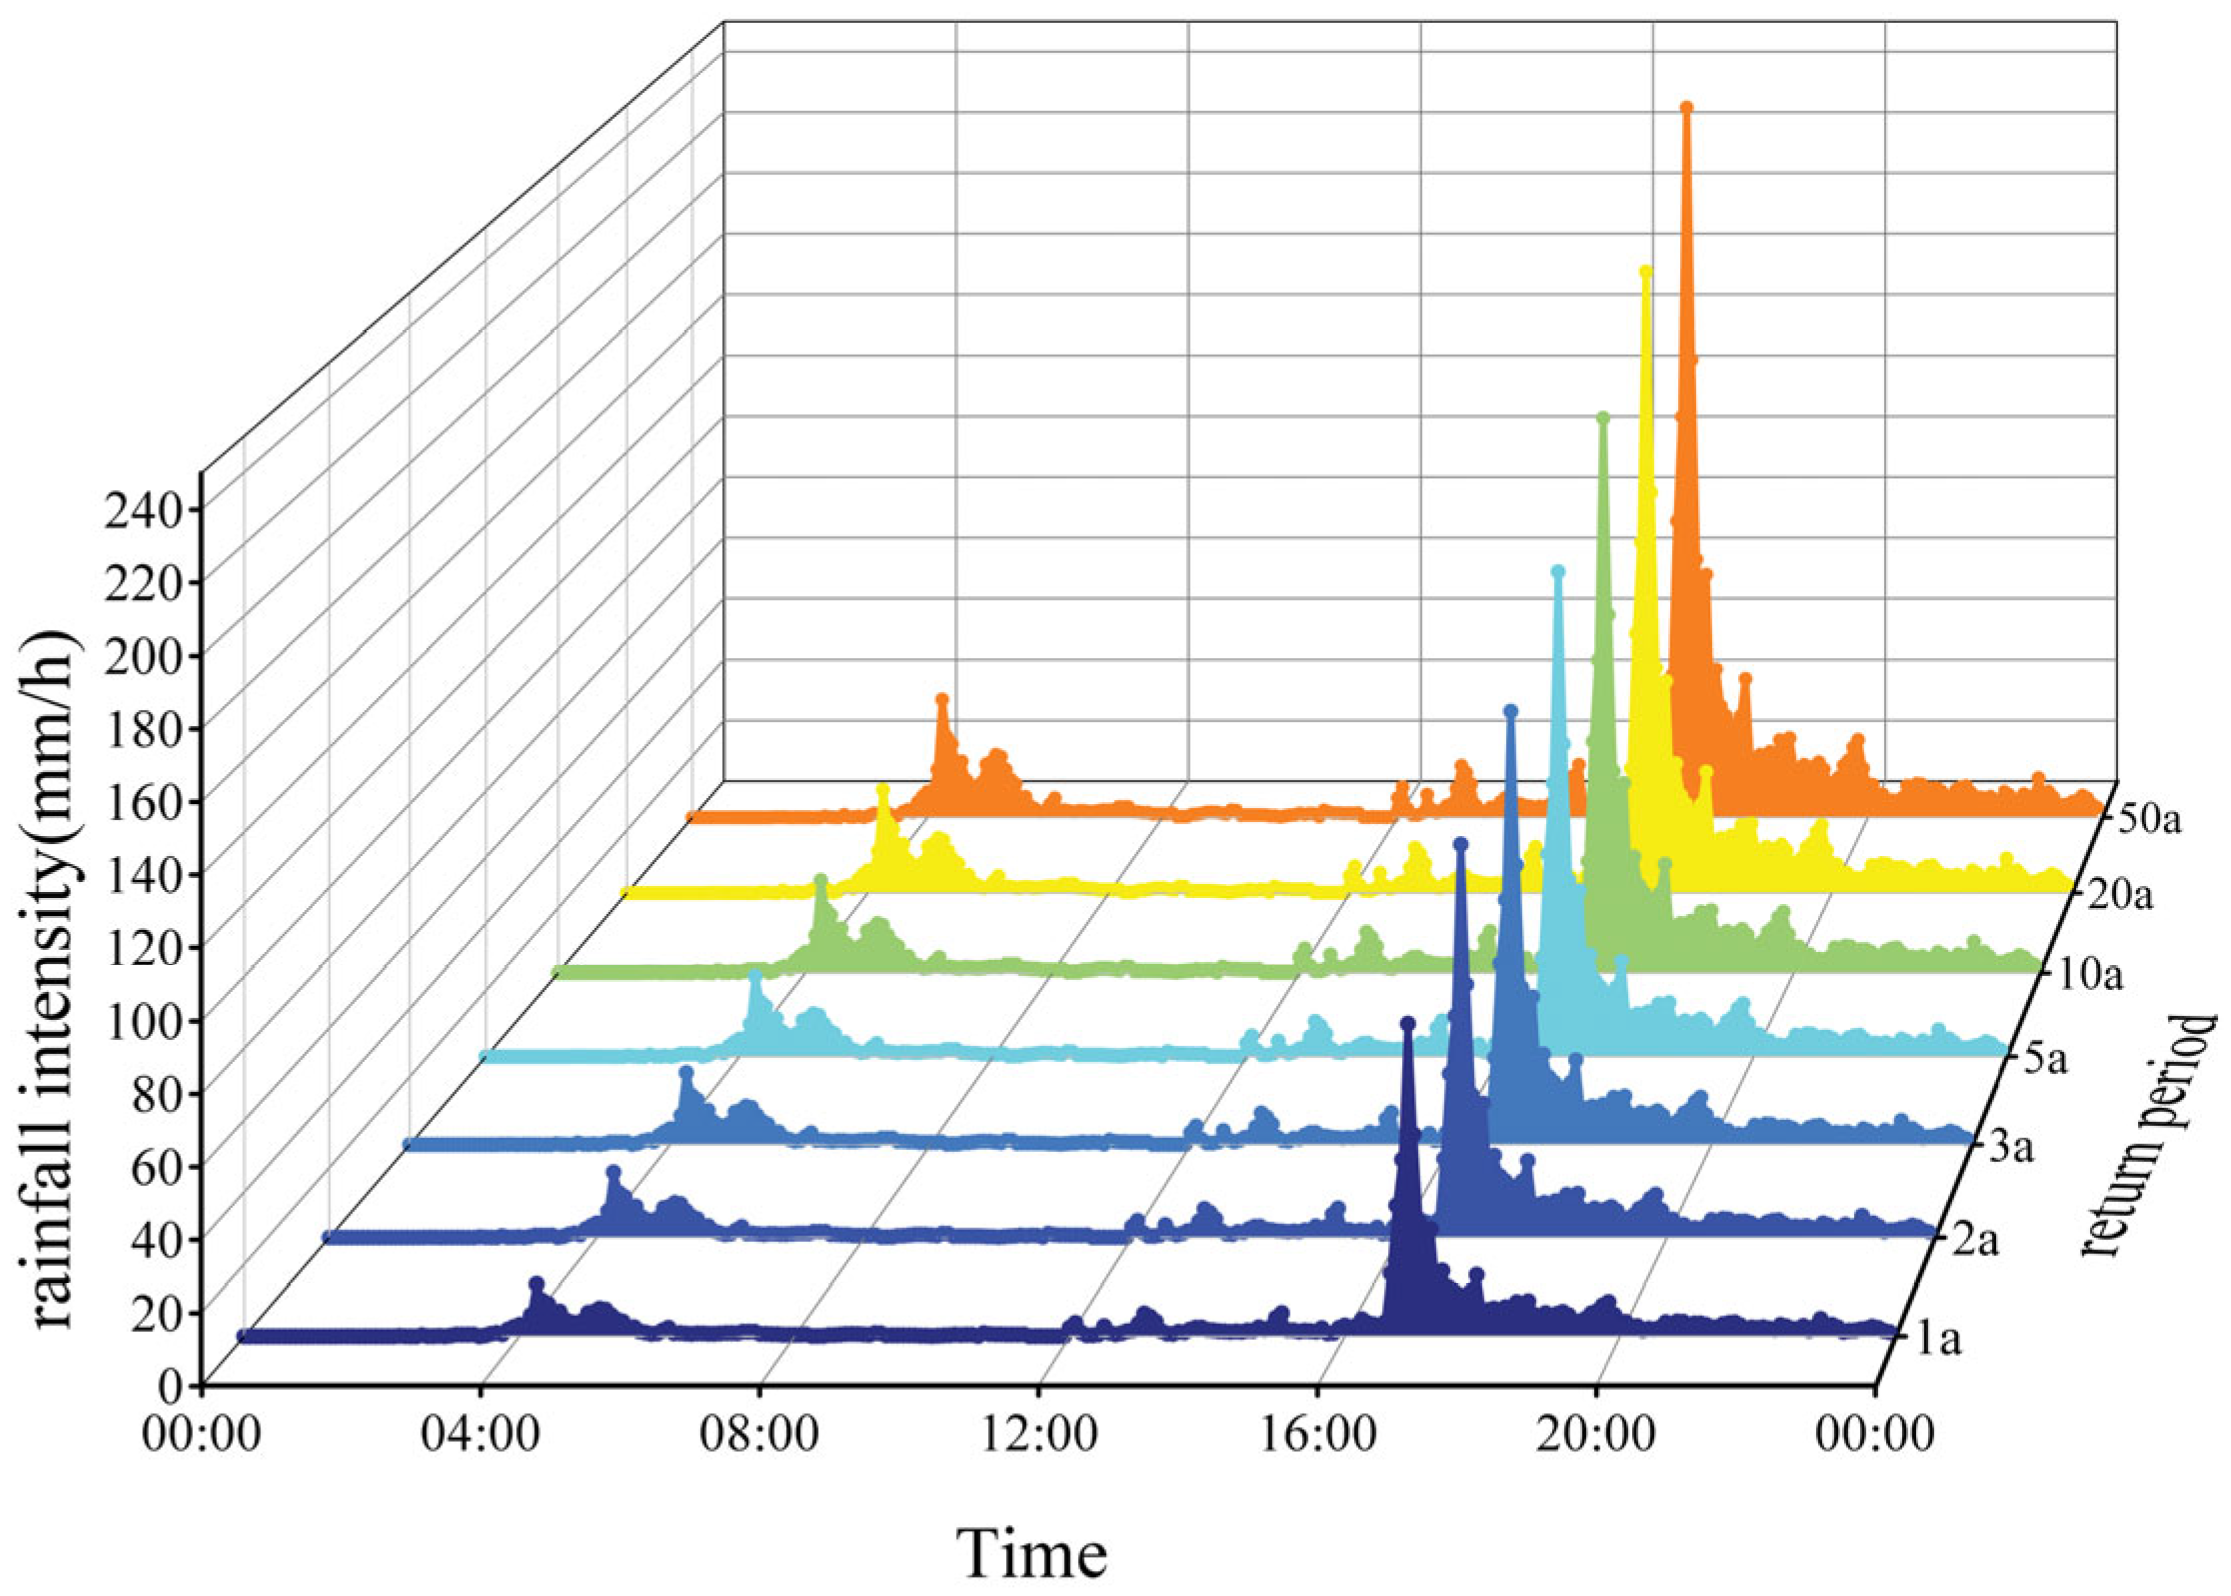
Long-duration rainfall allows for a more comprehensive and integrated consideration of the entire rainfall process, reflecting the evolution of rainfall. Therefore, long-duration rainfall was selected as the model’s input rainfall. Based on the “Technical Specification for Construction and Application of Mathematical Model of Urban Flooding Prevention and Control System” (DB11/T 2074-2022) [40], the design rainfall was determined using the Chicago rainfall pattern with a 24-h duration and a 5-min interval (Figure 5). Using the coupled model, waterlogging events were simulated over 7 recurrence periods: 1-year (1a), 2-year (2a), 3-year (3a), 5-year (5a), 10-year (10a), 20-year (20a), and 50-year (50a). The results include the waterlogging depth and its spatial distribution across the study area.
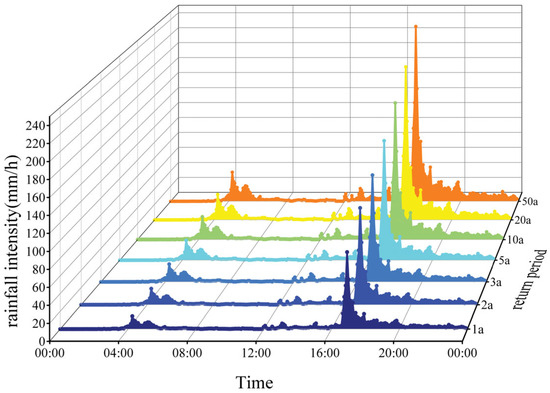
Figure 5.
Long-duration (24 h) design storm intensity for 1~50 year events.
2.4. Land Use Value Assessment Based on the Integration Method
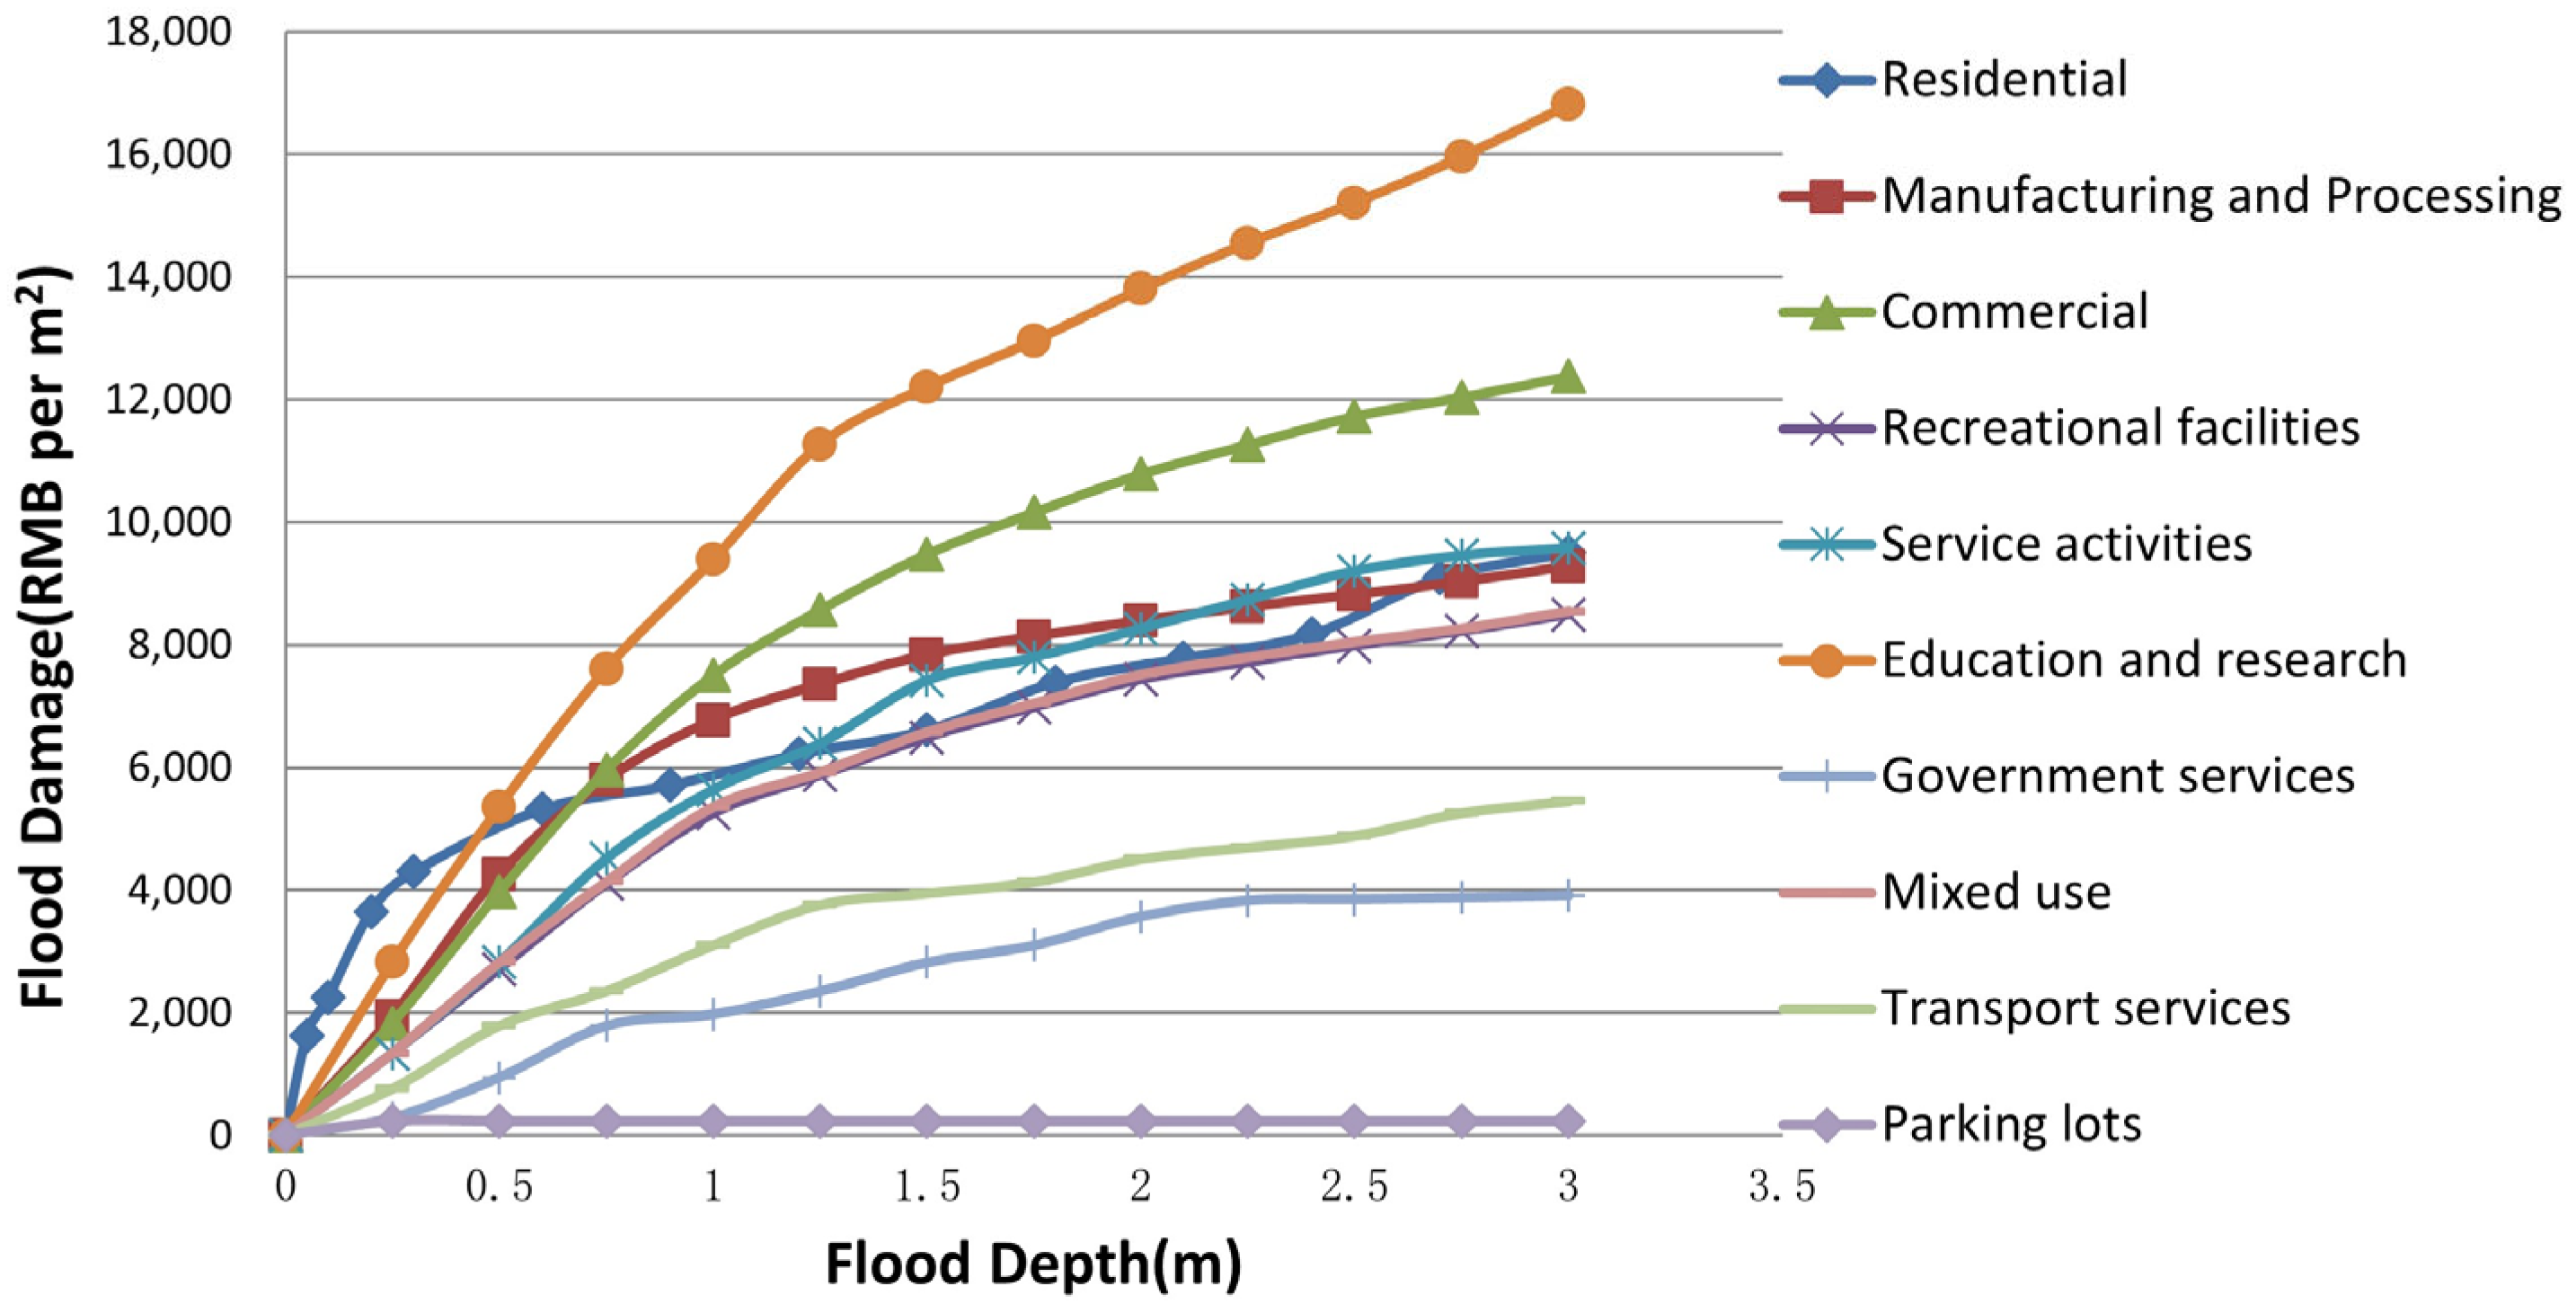
The damage curve describes the relationship between flood characteristics and loss rates, revealing the losses for each property type based on varying disaster intensities. It reflects the proportional increase in losses as disaster intensity increases [41]. Although vulnerability curves may vary across regions, the trend of loss rates with changes in inundation depth is generally similar. Therefore, this study uses flood damage curves for different land-use types provided by the local planning department to determine the loss rates corresponding to various inundation depths (Figure 6). The evaluation involves 10 types of land use: residential areas, processing and manufacturing industries, commercial areas, recreational spaces, service activities, educational and research facilities, administrative institutions, parking lots, multi-purpose buildings, and transportation facilities. By applying these damage curves, the losses caused by waterlogging for different water depths for each land-use type can be quantitatively assessed.
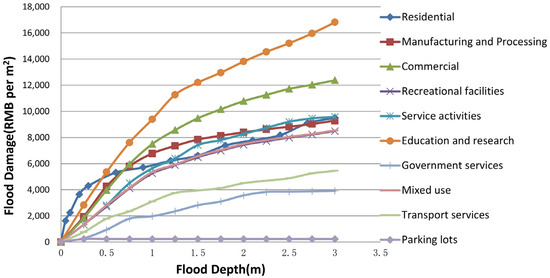
Figure 6.
Depth–damage curves.
The integration method is a fundamental approach in mathematical analysis and is used to calculate the cumulative sum and variation in functions. By combining the damage curve with the integration method, the losses for different land-use types based on varying disaster intensities can be calculated, and their comprehensive value can be further evaluated. A higher value indicates greater vulnerability. The basic steps are as follows: first, calculate the losses for each land-use type based on the fitted formula of the damage curve; then, normalize the losses of different land-use types to represent the economic vulnerability of each land-use type.
In the formula, represents the losses of different land-use types; represents the minimum loss among the ten land-use types; represents the maximum loss among the ten land-use types; and represents the economic vulnerability of the land-use type.
2.5. Local Spatial Autocorrelation Analysis Based on Local Moran’s I
Each attribute of urban waterlogging risk and land-use value has its unique spatial distribution, but both distributions are associated with land-use types and exhibit certain spatial correlations. The bivariate local Moran’s I is used to analyze the local spatial correlation between two variables, with a value range of [−1, 1]. Positive spatial autocorrelation indicates that nearby regions have similar variable values, such as high values clustering with high values or low values clustering with low values. Negative spatial autocorrelation indicates that high values are adjacent to low values. No spatial autocorrelation indicates a random distribution of high and low values. In this study, a local Moran’s I correlation analysis is conducted to reveal the local spatial clustering characteristics of waterlogging risk and land-use value. This analysis identifies high-risk and high-value urban areas. The formula is as follows:
In the formula, represents the local bivariate Moran’s I index for a given geographic unit ; and represent the values of two variables for geographic unit ; and are the mean values of variables and across all geographic units; is an element of the spatial weight matrix, representing the spatial relationship between geographic units and , typically determined by adjacency or distance; and represents the sum of spatial weights for all neighboring units of geographic unit .
In this study, the waterlogging data simulated by the ICM model are used as the attribute value input, and an analysis is conducted with the values of adjacent land-use types. This evaluates the spatial clustering results and identifies key areas of concern.
2.6. Contribution Analysis
Waterlogging, as a direct manifestation of urban flooding, reflects the physical intensity of the disaster, while value represents the economic attributes of the exposed elements, and is directly related to the quantification of losses. This analysis framework, based on the “hazard-exposed elements” concept, not only simplifies complex causal relationships and enhances the interpretability of the model but also relies on relatively reliable data for these two factors, making it highly practical. Although urban flooding losses may be influenced by many other factors, these two core indicators already reflect a significant portion of those influences to some extent. Therefore, this study focuses on the impact of waterlogging and land value as the two core factors impacting the direct losses caused by urban flooding.
2.6.1. Urban Flooding Loss Analysis
This study uses the depth–damage curve as a typical disaster loss curve to calculate the direct economic losses caused by urban flooding inundation depth. First, the land-use shapefile layer is intersected with the inundation-simulation shapefile layer in ArcGIS to determine the submerged area and depth for each land-use type. Next, according to the depth–damage curve shown in Figure 6, the unit-area-loss values for different land-use types based on various inundation depths are determined. Finally, the direct economic losses from urban flooding in Beijing based on different design rainfall scenarios are calculated using Equation (7).
In the formula, represents the inundation-simulation layer based on different design rainfall return period scenarios; represents the distribution layer of the ten land-use types; represents the loss value of land-use type at an inundation depth of d; represents the inundation depth of grid cell ; represents the area of land-use type within grid cell ; and represents the direct economic losses from urban flooding over different design rainfall return periods.
2.6.2. Relative Contribution Analysis Based on Shapley Value
The SHAP (Shapley Additive Explanations, SHAP) method is derived from the Shapley value in cooperative game theory. It calculates the marginal contribution of each feature to the model’s prediction and provides interpretability for individual predictions. Unlike traditional importance algorithms, which primarily focus on analyzing feature importance at the global population level, the SHAP method calculates the contribution value of features for each individual instance. The Shapley value is calculated using the following formula:
In the formula, represents the Shapley value of feature , indicating the contribution of feature to the model’s prediction; denotes the number of features; refers to the set of all features in the model; indicates a subset of features that does not include feature ; represents the prediction value when feature is included in subset ; and represents the prediction value when feature is excluded from subset .
Based on the Shapley value, the relative marginal contribution between features is further calculated.
In the formula, represents the Shapley value of feature ; represents the Shapley value of feature ; and represents the relative marginal contribution rate of feature .
2.6.3. Dominant Factor Analysis Based on the Birch-K-Means Combined Algorithm
SHAP explains the contribution results of each feature factor but struggles to clearly identify the dominant factors of direct economic losses based on the same rainfall scenario. To gain a deeper understanding of regional loss characteristic differences, this study uses the Birch-K-means combined clustering method to solve this issue. This method, as an unsupervised learning approach, divides objects into different clusters based on their characteristics, ensuring high similarity within clusters and significant differences between clusters. First, the Birch algorithm is used to recursively insert each data point from the root node downward. Based on the minimum Euclidean distance, the nearest node is located, and the category utility is evaluated to determine whether the node can absorb the data point. This process constructs a CF (Clustering Feature) tree, completing hierarchical data compression and preliminary clustering. Subsequently, the quality of the preliminary subclusters generated by Birch is evaluated using the silhouette coefficient and the Davies–Bouldin index. Based on the evaluation results and practical requirements, the number of clusters and radius parameters are adjusted accordingly. Finally, the subclusters generated by Birch are used as the initial input for the K-means algorithm, which further refines the clustering by iteratively optimizing the cluster center positions to produce the final clustering results.
In the K-means clustering process, this study uses the elbow method. The core idea of this method is that as the number of clusters, k, increases, the degree of aggregation within each cluster gradually improves, causing the sum of squared errors (SSE) to naturally decrease. When the k value reaches the actual number of clusters, the reduction in SSE decreases sharply and then levels off as k continues to increase. A smaller SSE indicates that points within a cluster are closer to the centroid, resulting in higher clustering quality.
In the formula, represents the sum of squared errors within the cluster; is the assumed current number of clusters; represents cluster ; is a sample point in cluster ; and is the centroid of cluster .
3. Results
3.1. Urban Waterlogging Risk and Value Analysis
3.1.1. Urban Waterlogging Risk Analysis
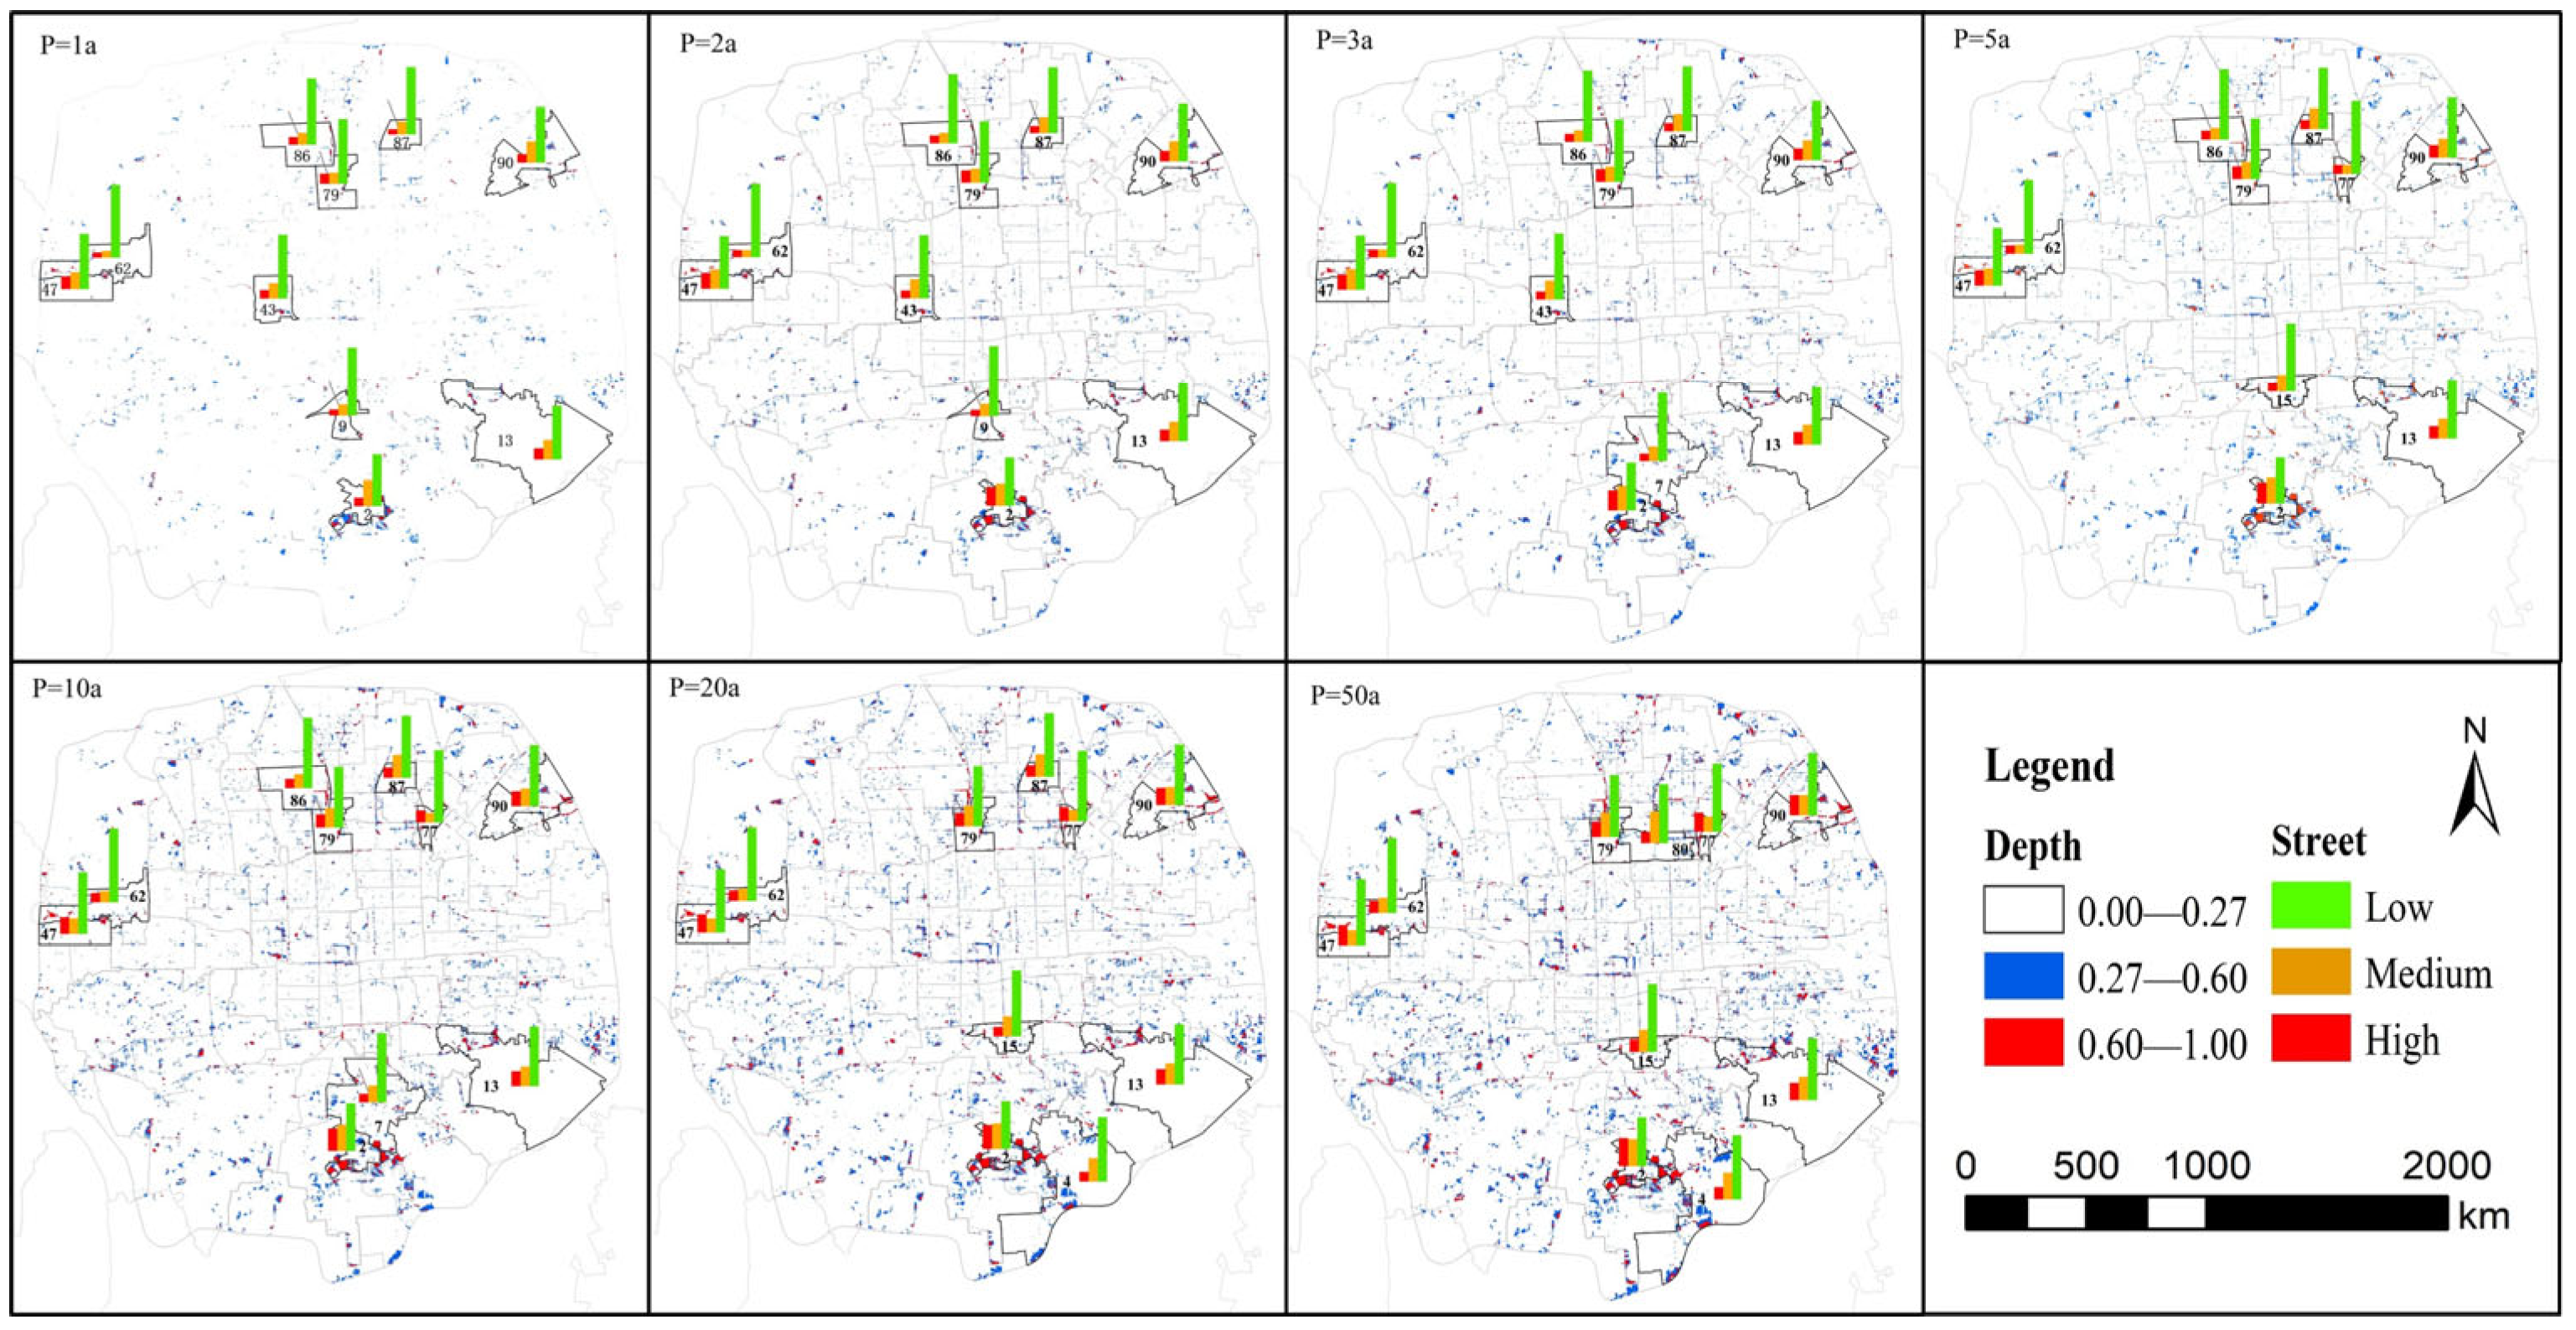
Rainfall data, drainage network data, DEM data, and land-use data were input into the ICM to construct an urban waterlogging model, resulting in waterlogging simulation outcomes for the central urban area of Beijing. According to the Technical Code for Urban Flooding Prevention and Control (GB 51222-2017) [42], waterlogging depths are categorized into three levels: mild waterlogging as 0–27 cm, moderate waterlogging as 27–60 cm, and severe waterlogging as over 60 cm [43]. Areas with severe waterlogging are classified as Level 1 key areas (DH). The maximum water depth at different time periods was extracted, and the results are shown in Figure 7. From the waterlogging depth and spatial distribution, it is evident that the study area exhibits significant spatial heterogeneity. In areas within the Second Ring Road, such as Chaoyangmen, Jingshan, and Tianqiao streets, where the drainage network is densely distributed, waterlogging is minimal, primarily posing low risks. However, in areas outside the Fourth Ring Road, such as Tianmulin Road, Shibalidian, Jiangtai, and Heyi streets, where the drainage network is relatively sparse, severe waterlogging occurs, and the risk of waterlogging is significantly higher. Considering that the areas between the Fourth and Fifth Ring Roads in Beijing host numerous transportation, commercial, and other facilities, immediate action must be taken to mitigate the risk of urban surface flooding, alleviate travel pressures, and avoid loss of life and damage to property caused by extreme rainfall events. A bar chart illustrates the top ten streets with the highest waterlogging risk during 1-year to 50-year return periods (ranked by the size of the DH area). Heyi, Laoshan, Deshengmen, Jiangtai, Tianmulin Road, and Shibalidian streets consistently exhibit severe waterlogging risks across all return periods. In contrast, Xiluoyuan, Xiaoguan, and Yuetan streets show relatively higher waterlogging risks during short return periods but gradually fall in the rankings as the return period increases. On the other hand, Yongdingmenwai and Jiugong towns exhibit the opposite trend, indicating significant differences in the sensitivity of different streets to waterlogging.
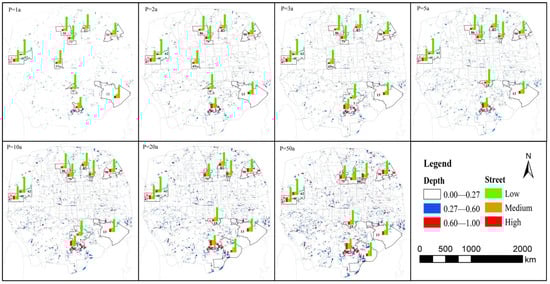
Figure 7.
Distribution of waterlogging risk over different return periods. Notes: Heyi (2), Jiugong (4), Xiluoyuan (9), Shibali (13), Yongdingmenwai (15), Yuetan (43), Laoshan (47), Tiancunlu (62), Deshengmen (79), Xiaoguanjie (87), and Jiangtai (90).
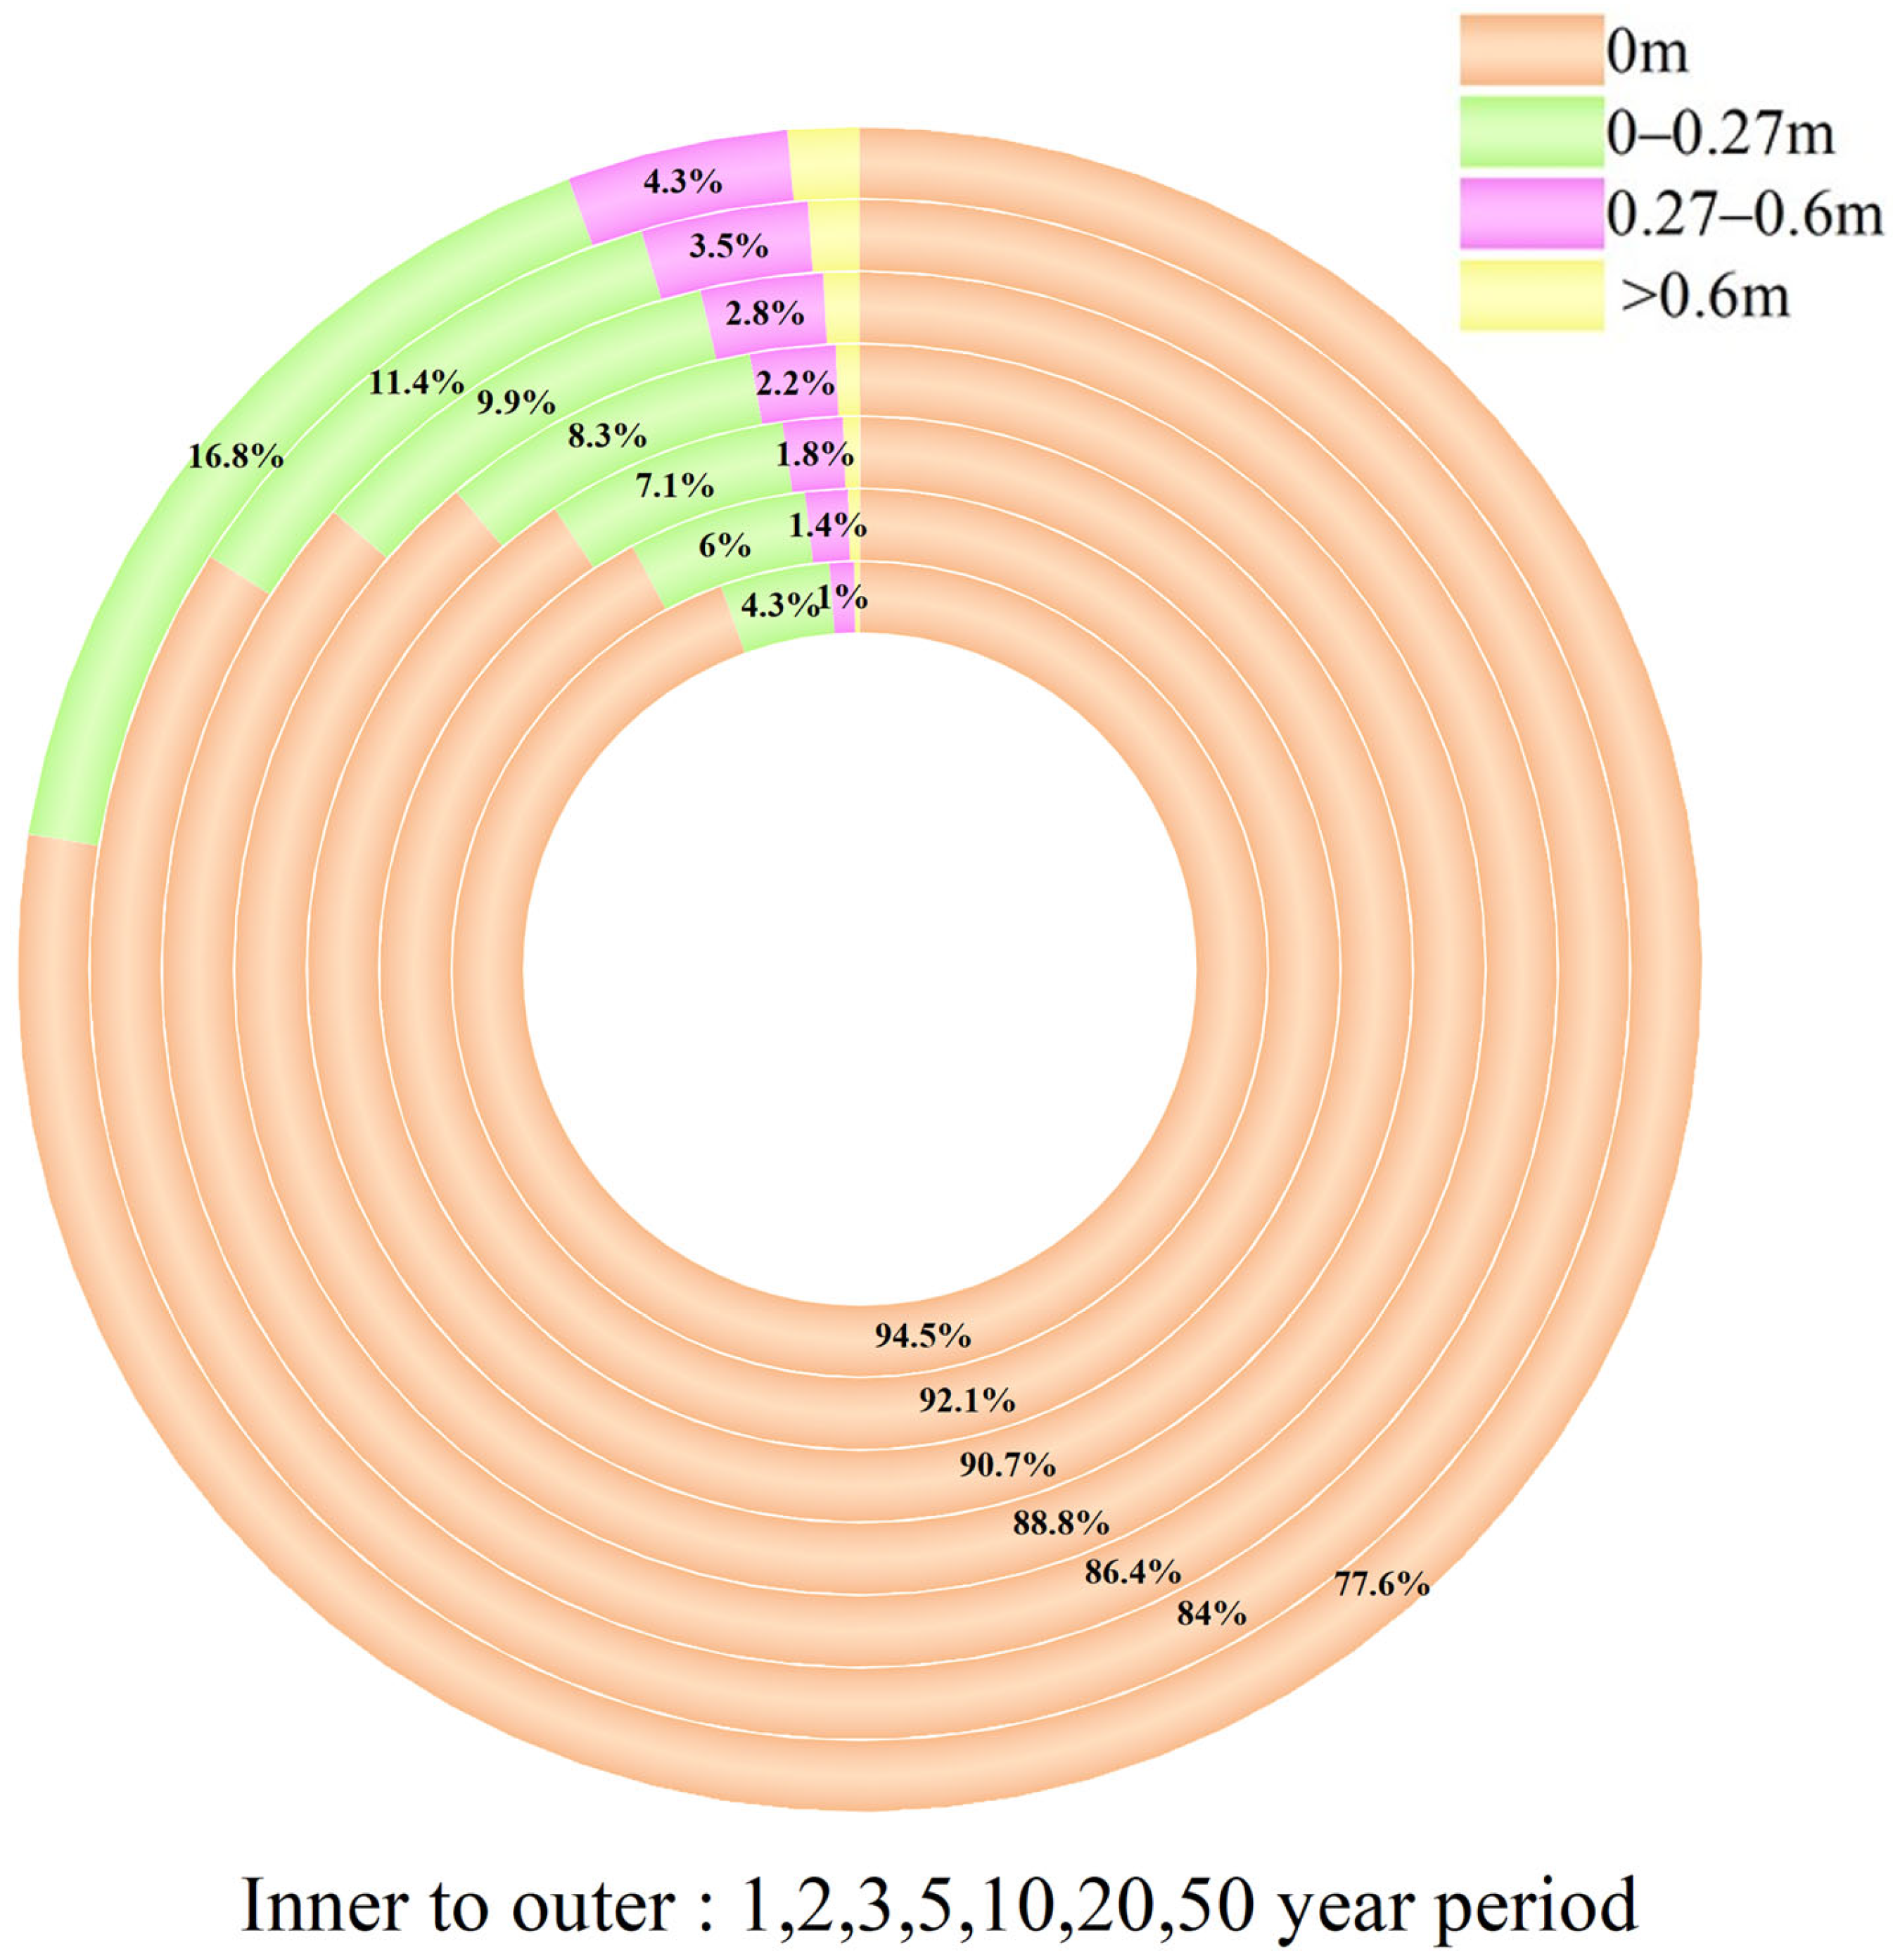
The distribution of waterlogging risk was summarized and classified based on rainfall return periods. As the return period increases, the waterlogged area continuously expands outward from the initial center, with risks intensifying. The statistical results for waterlogged areas for different return periods are shown in Figure 8. During a 1-year return period rainfall event, the waterlogged area is 37.02 km2, of which only 1.54 km2 is classified as high risk, accounting for approximately 4.16% of the waterlogged area and 0.2% of the total study area. When the rainfall return period increases to 50 years, the waterlogged area expands to 149.96 km2, with the high-risk area increasing by approximately six times compared to the area predicted for the 1-year return period. Consequently, the probability of risk hazards caused by waterlogging rises significantly.
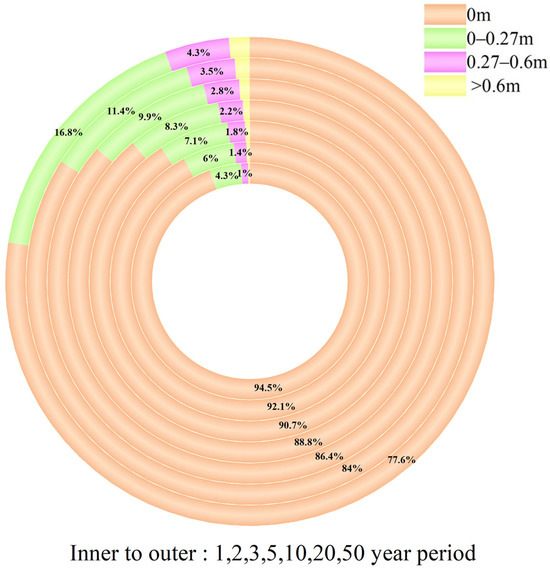
Figure 8.
Proportion of inundated area over different return periods.
3.1.2. Value Analysis of Land Use
Based on the fitting of waterlogging disaster loss curves, the average loss values for different land-use types after being waterlogged were calculated to evaluate the value of each type of land. It is important to note that, when conducting value assessments, the safety of human lives should be prioritized. Therefore, this study uses the average loss at a water depth of 2 m as the statistical cutoff value [8]. The results are shown in Table 1.

Table 1.
Depth–damage functions of ten property types in Beijing.
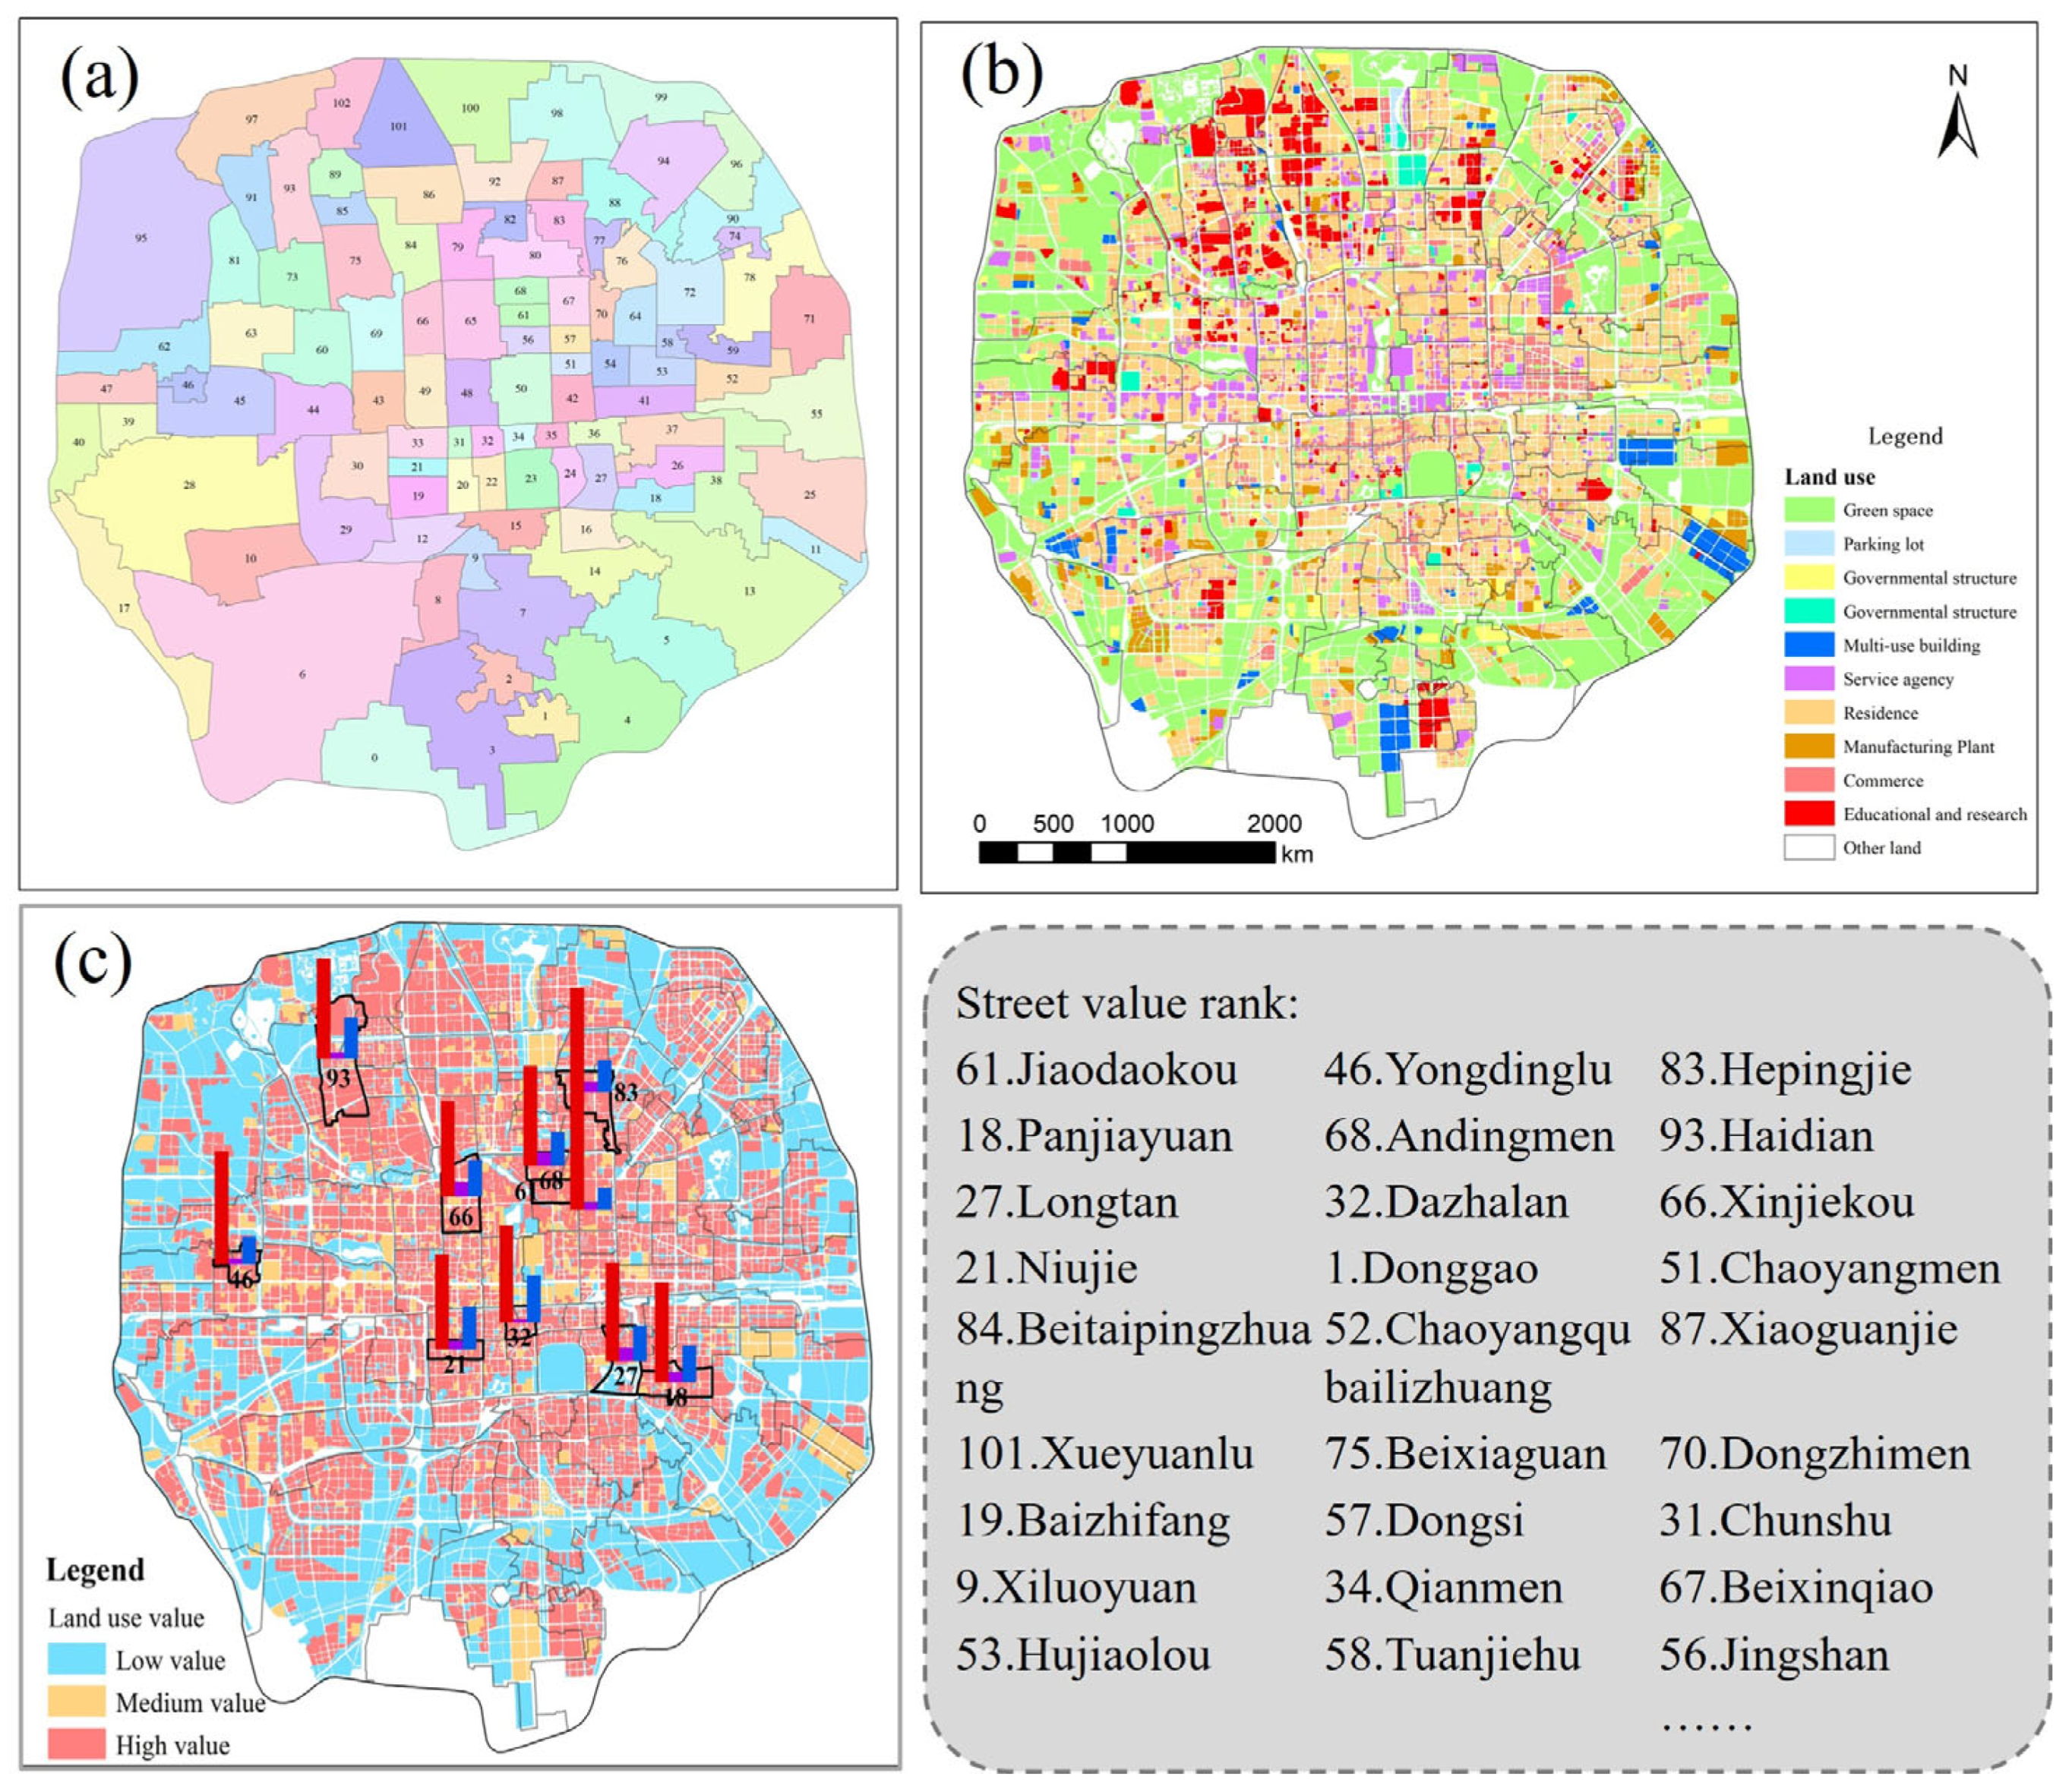
Based on the distribution characteristics of land use, the average loss values for each land-use type were assigned to individual grid cells. Using the natural breaks method, the final results were categorized into low-, medium-, and high-value groups to achieve optimal classification. The grouping results are shown in Figure 9, which reveals that high-value areas are primarily concentrated within the Fourth Ring Road. The bar chart in the figure presents the statistical results for the top ten streets ranked by land-use value. Red, purple, and dark blue represent high (H), medium (M), and low (L) land-use values, respectively. Among them, over 70% of the areas in Heping Street and Jiaodaokou Street are covered by high-value land-use types. It is worth noting that the streets ranked in the top ten for waterlogging risk do not exhibit high-value attributes. Instead, the high-value areas within the Third Ring Road show a spatial distribution pattern that closely resembles areas with lower waterlogging risks.
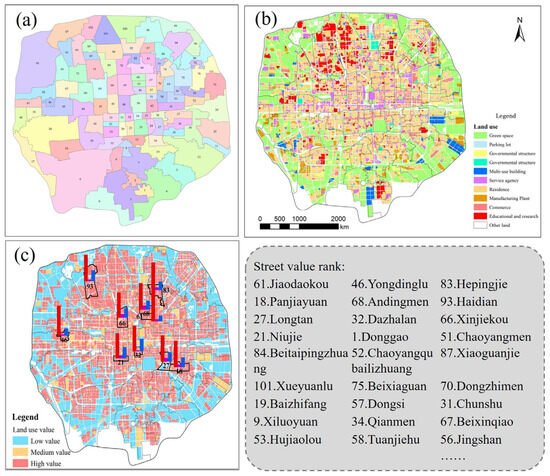
Figure 9.
Distribution of land value: (a) study area; (b) land use data of study area; (c) Distribution of land use.
3.2. Analysis of the Spatial Overlap Between Urban Waterlogging Risk and Land Value
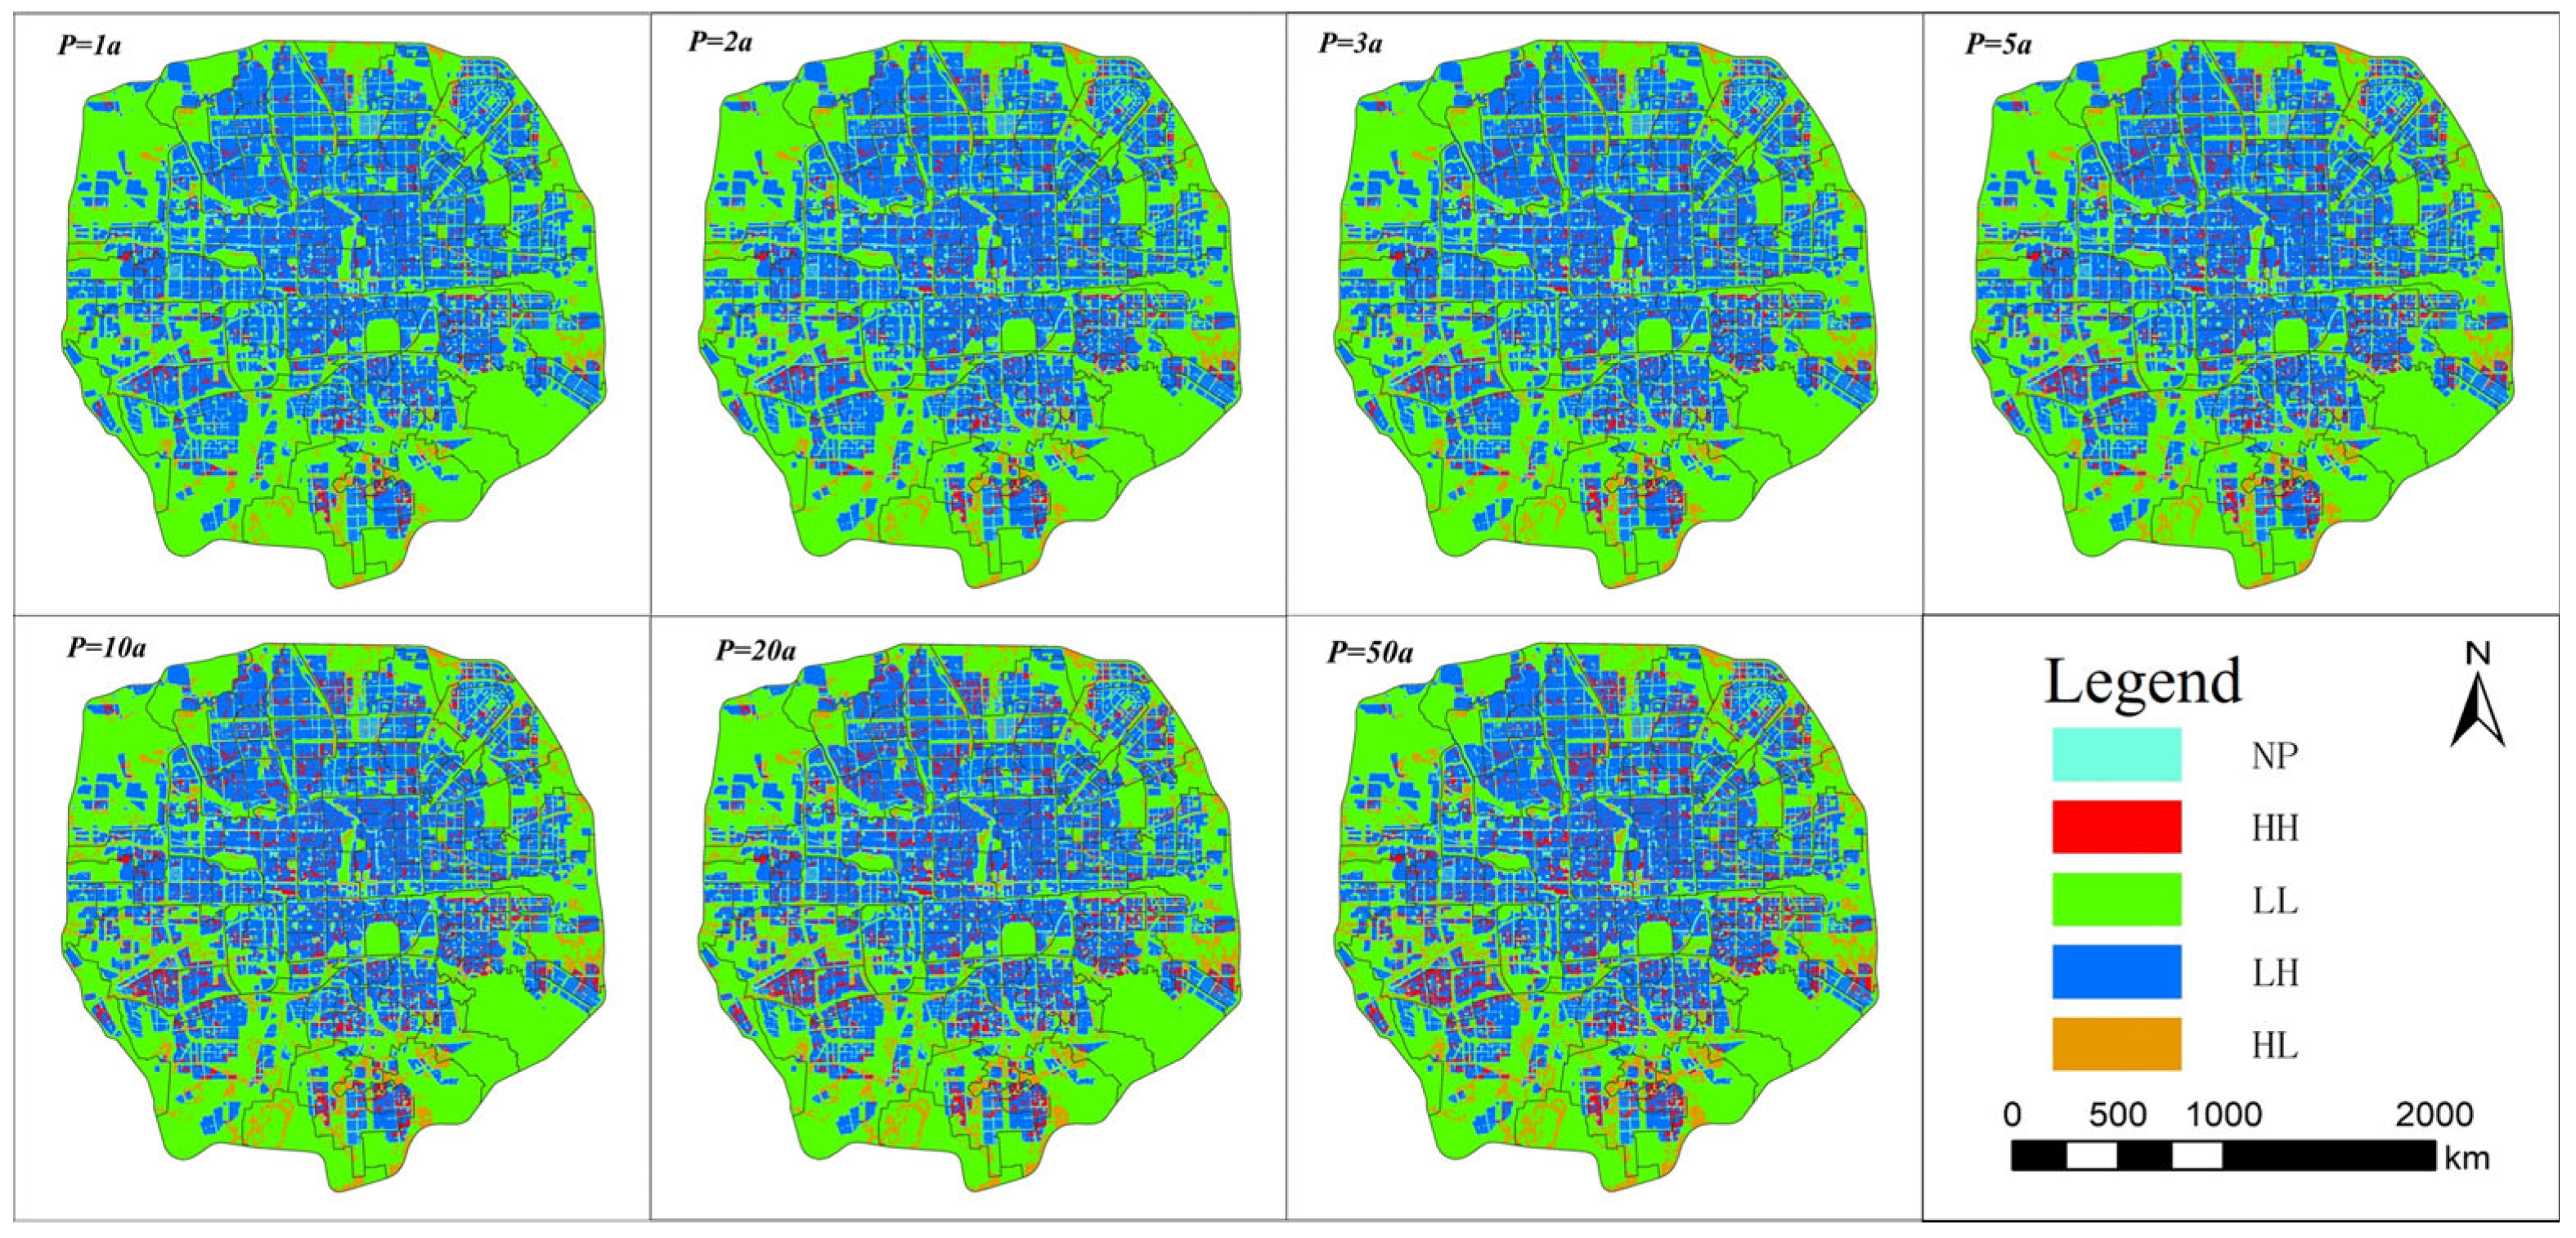
Identifying the key areas of urban risk concentration is crucial for risk management and disaster prevention and mitigation. To understand the spatial coupling relationship between waterlogging risk and land value, this study further identifies priority areas for disaster prevention and mitigation. Using the bivariate local Moran’s I module in GeoDa software version 1.16, a neighborhood matrix was constructed to classify grid cells into five categories: high-risk–high-value (HH), high-risk–low-value (HL), low-risk–high-value (LH), low-risk–low-value (LL), and non-significant areas (NP), as shown in Figure 10. The high-risk–high-value (HH) areas represent the regions with the highest probability of property loss, and these areas require particular attention and designation as Secondary Key Areas (MH). A large number of grids were classified as low-risk–high-value (LH), and are mainly located in the central and northeastern parts of the study area. In contrast, high-risk–high-value (HH) areas are relatively scattered, with a higher concentration in Fengtai District.
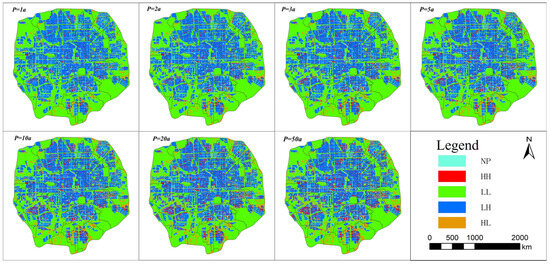
Figure 10.
Distribution map of bivariate spatial autocorrelation of urban value–risk.
Figure 11 illustrates the comparison of key areas identified by two methods based on different rainfall return periods, with overlapping areas defined as RH. The results show that, based on the 1-year rainfall scenario, the key areas identified by the two classification methods are MH (3.03 km2) and DH (1.54 km2). Compared to DH, MH increases by 100%, but the overlapping area, RH, is only 0.42 km2. As the return period increases, the proportion of RH shows an upward trend, but significant differences between the results of the two methods remain. This indicates a clear discrepancy in the analysis of priority areas. Further analysis reveals that the DH–RH area is primarily composed of green spaces. Due to the single disaster-bearing characteristics and functional attributes of green spaces, even under high waterlogging risk, they do not result in significant economic losses. Therefore, the priority level for controlling waterlogging in green spaces can be appropriately reduced in urban waterlogging emergency responses. In contrast, the MH–RH area mainly includes residential and industrial land, reflecting that the current control system needs to increase its focus on these two types of land use.
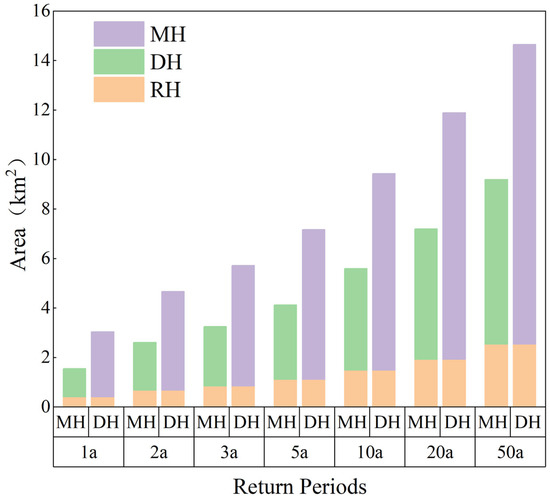
Figure 11.
Comparative analysis of key areas over different return periods.
3.3. Contribution Analysis
The spatial overlap of waterlogging and land value not only helps to identify priority areas but also leads to waterlogging-related losses. Based on disaster loss curves, this study calculates the distribution of waterlogging losses across different streets over various rainfall return periods. Waterlogging losses are used to further analyze the spatial overlap effects between waterlogging and land value. On this basis, the SHAP (Shapley Additive Explanations) theory is applied to analyze the composition of waterlogging losses, quantifying the contributions of waterlogging and land value. To better understand the differences in regional loss characteristics, the contribution results for waterlogging and value, obtained through the SHAP method, are further analyzed using a Birch-K-means combined clustering analysis approach. This method classifies the study area into distinct types based on similar mechanisms of loss formation. The findings provide a scientific basis for cities to formulate differentiated disaster prevention and mitigation measures tailored to the characteristics of each region.
3.3.1. Waterlogging Loss Analysis
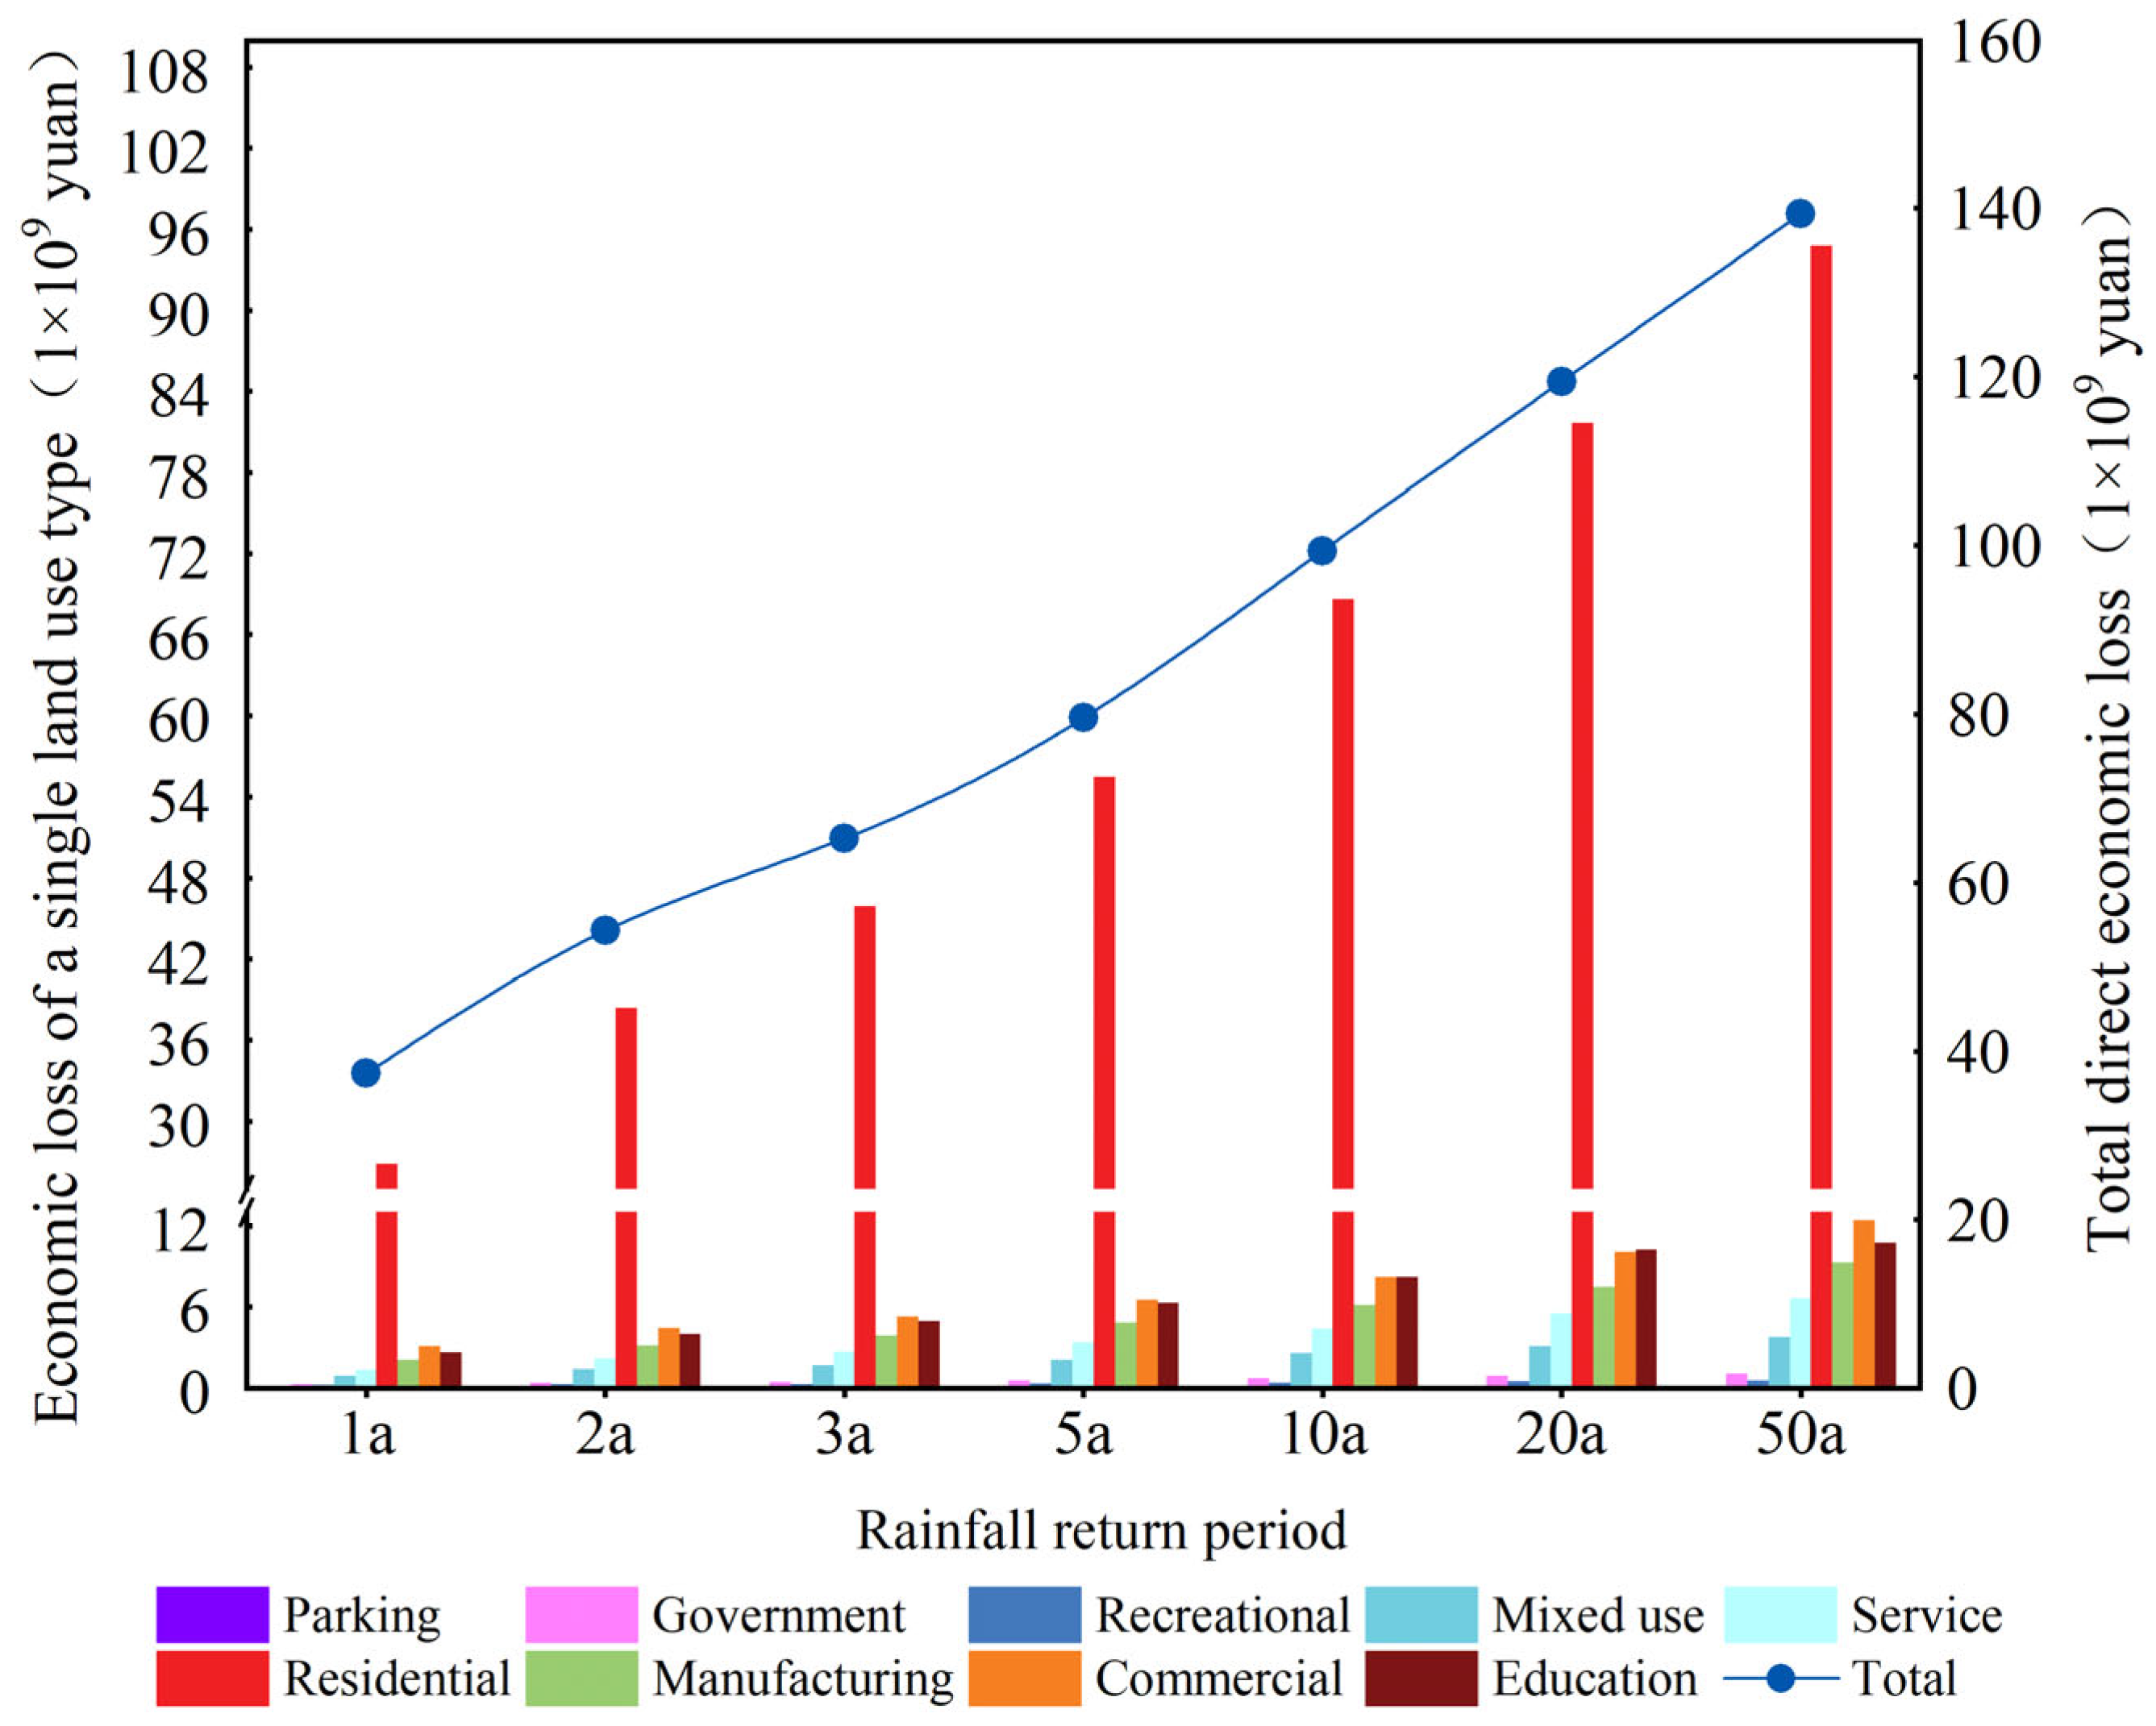
Based on the disaster loss curves, the waterlogging losses over different rainfall return periods were calculated (Figure 12). Based on the 1-year rainfall return period scenario, the direct economic losses caused by urban waterlogging amounted to CNY 37.3 billion. Based on the 50-year rainfall return period scenario, the direct economic losses reached CNY 139.3 billion, showing a growth of 373.5%. Residential land incurred the highest direct economic losses, accounting for 68.1% to 71.9% of the total. This was followed by commercial land and educational/research land, which accounted for 8.2% to 8.9% and 7.0% to 8.6%, respectively. Residential, commercial, and educational/research land consistently dominate in terms of total losses, reflecting their critical role in urban waterlogging loss assessments.
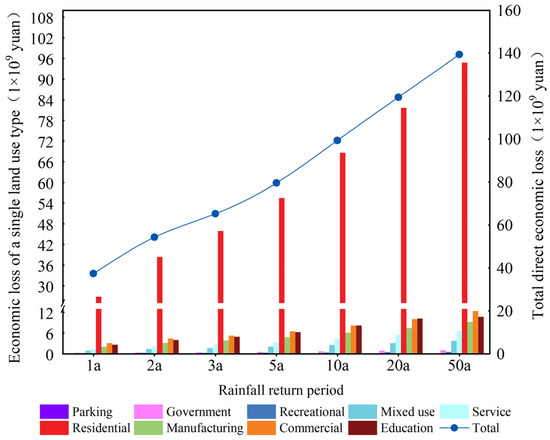
Figure 12.
Direct economic losses for different sectors.
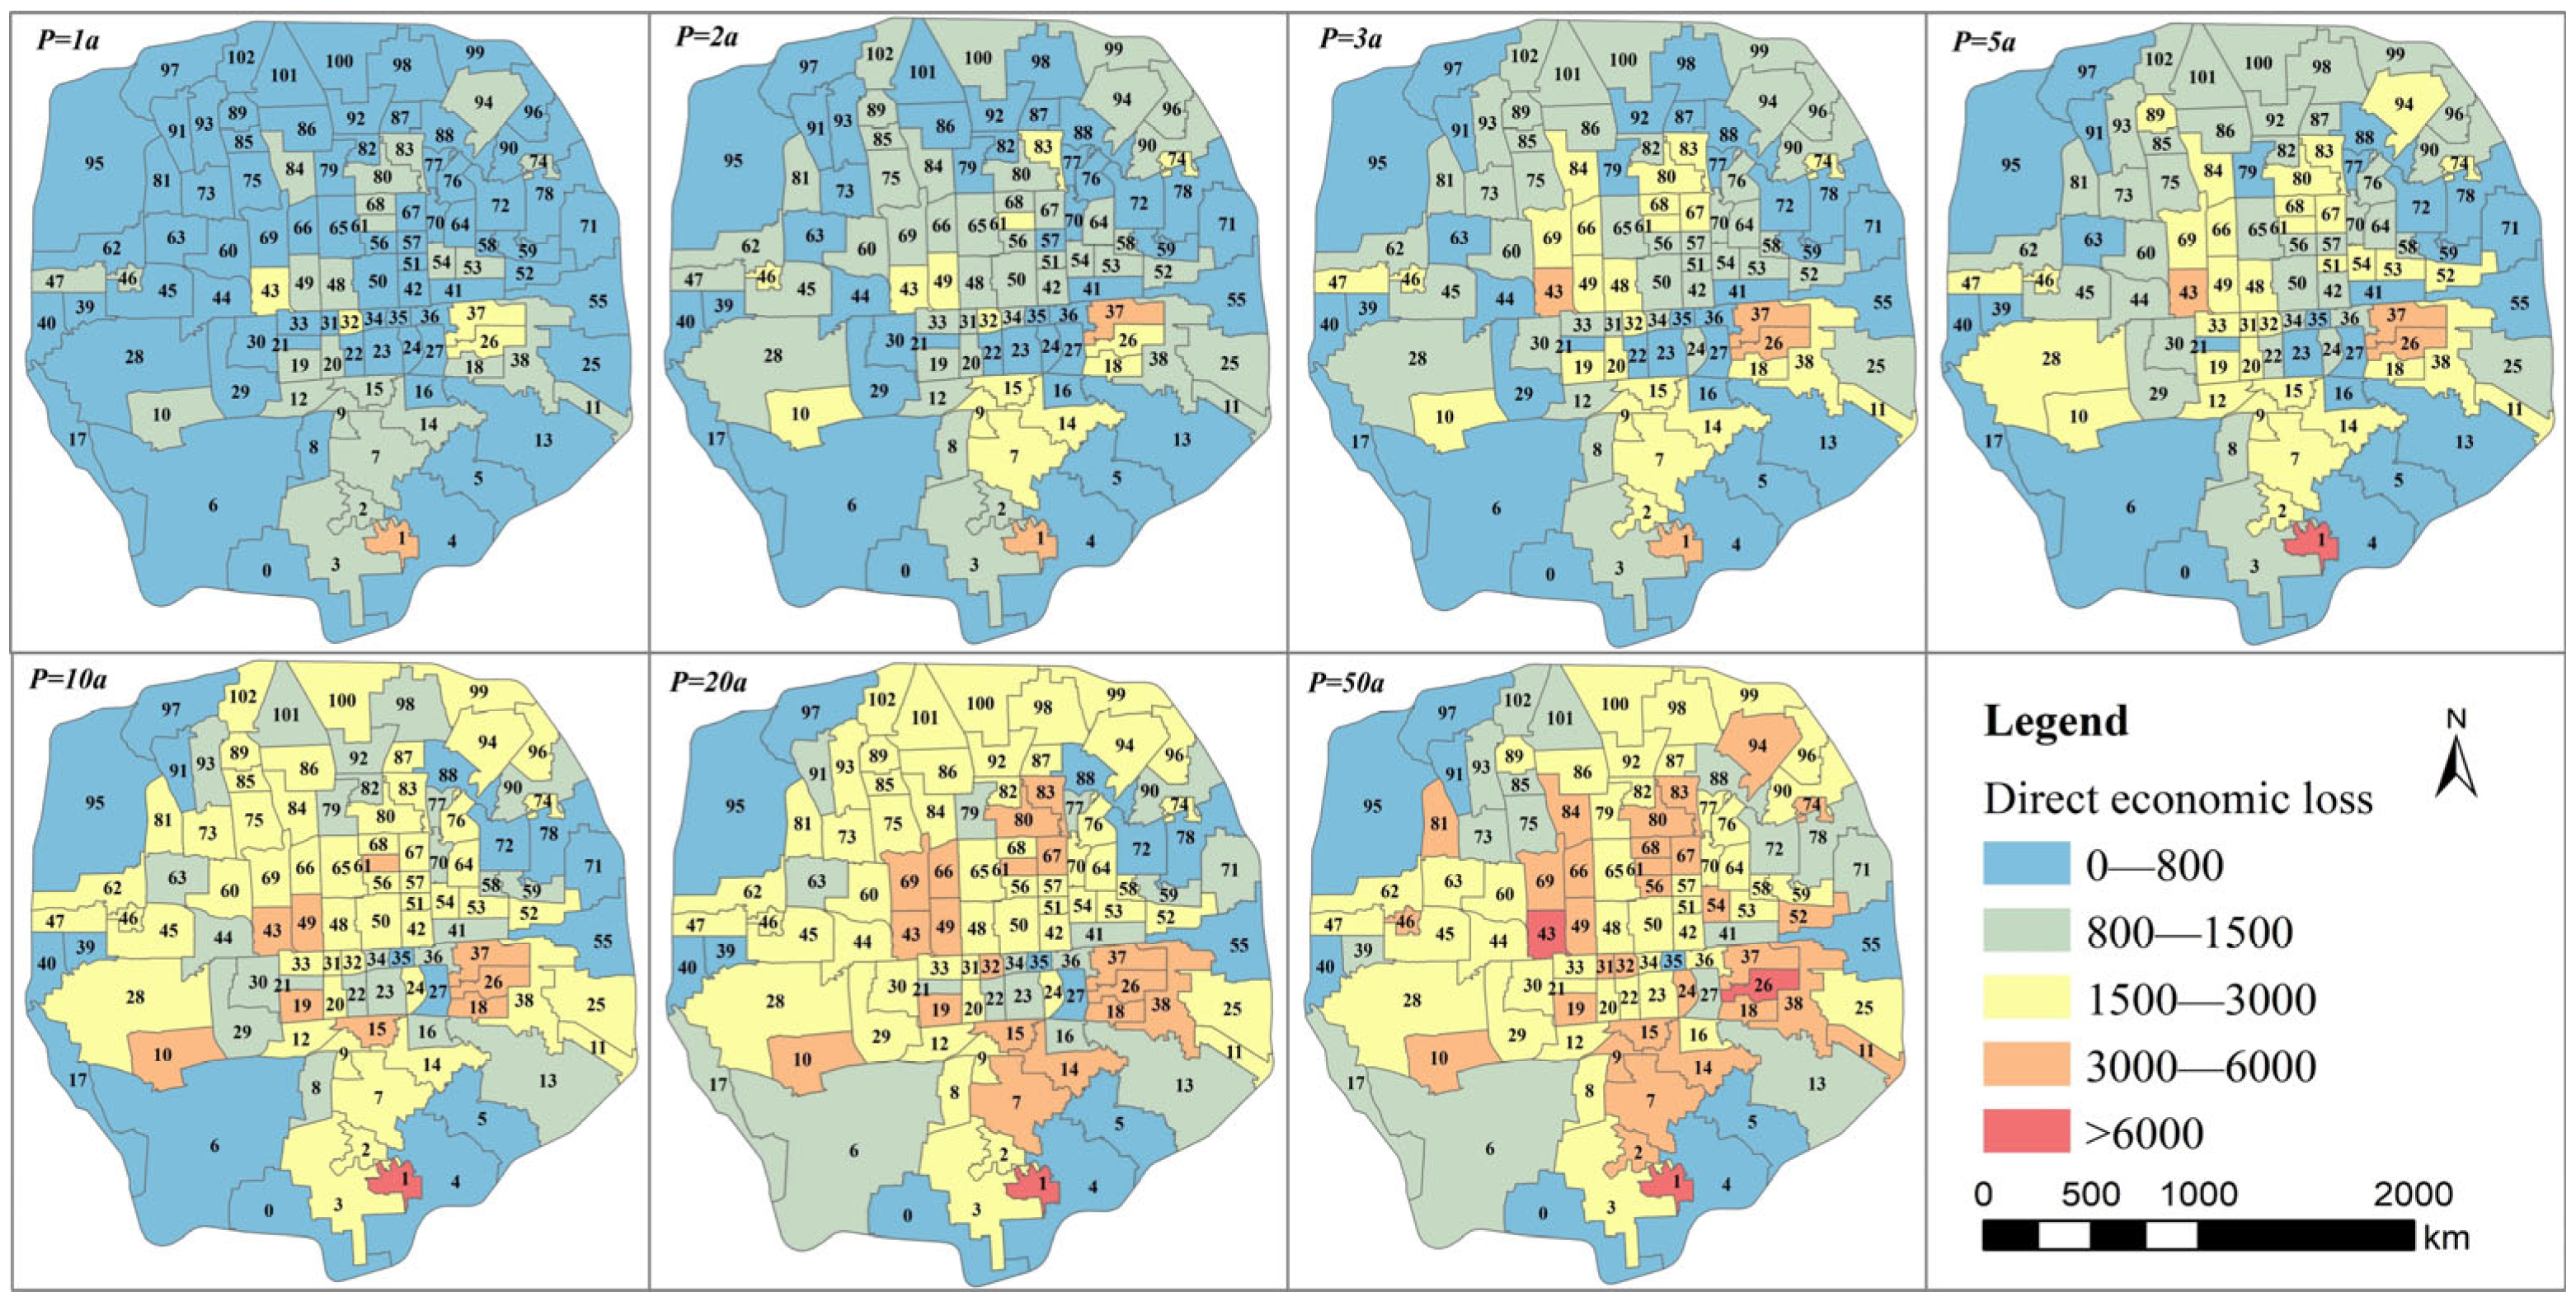
Based on the seven rainfall scenarios, streets experienced varying degrees of direct economic losses. A clear spatial distribution trend was observed: losses were smallest in the northern region and larger in the southern region (Figure 13). The Lugouqiao Street (28) in Fengtai District recorded the highest direct economic losses from waterlogging, with an average loss of CNY 17,567/m2. Similarly, Shuangjing Street (37) in Chaoyang District, as well as Nanyuan Street (3) and Dahongmen Street (7) in Fengtai District, also suffered significant direct economic losses. These four streets together accounted for 15.3% of the total direct economic losses.

Figure 13.
The distribution of direct economic losses among the subdistricts.
3.3.2. Dominant Factor Analysis
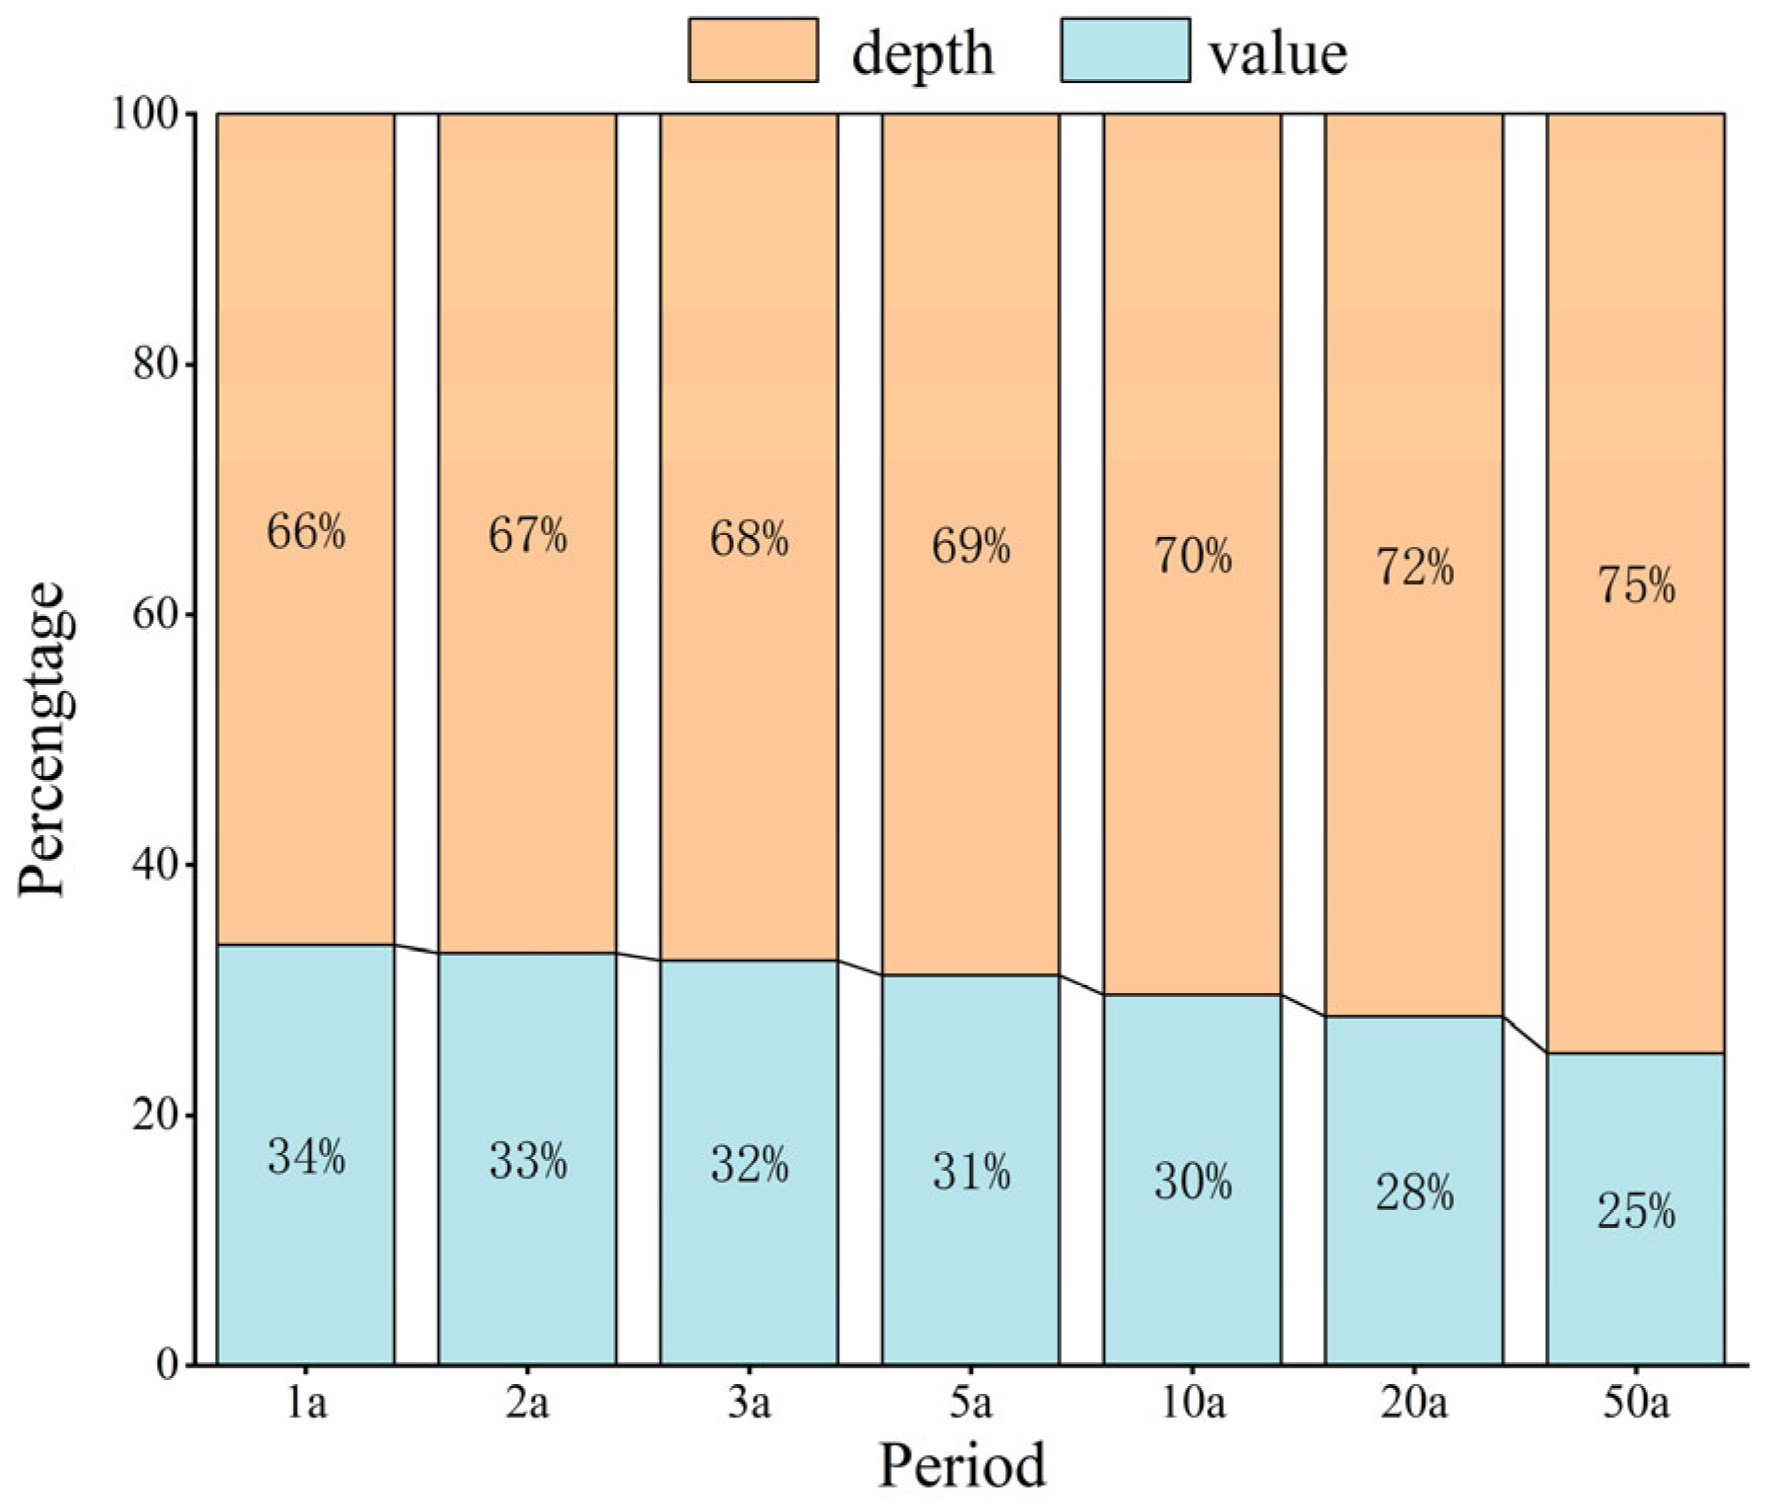
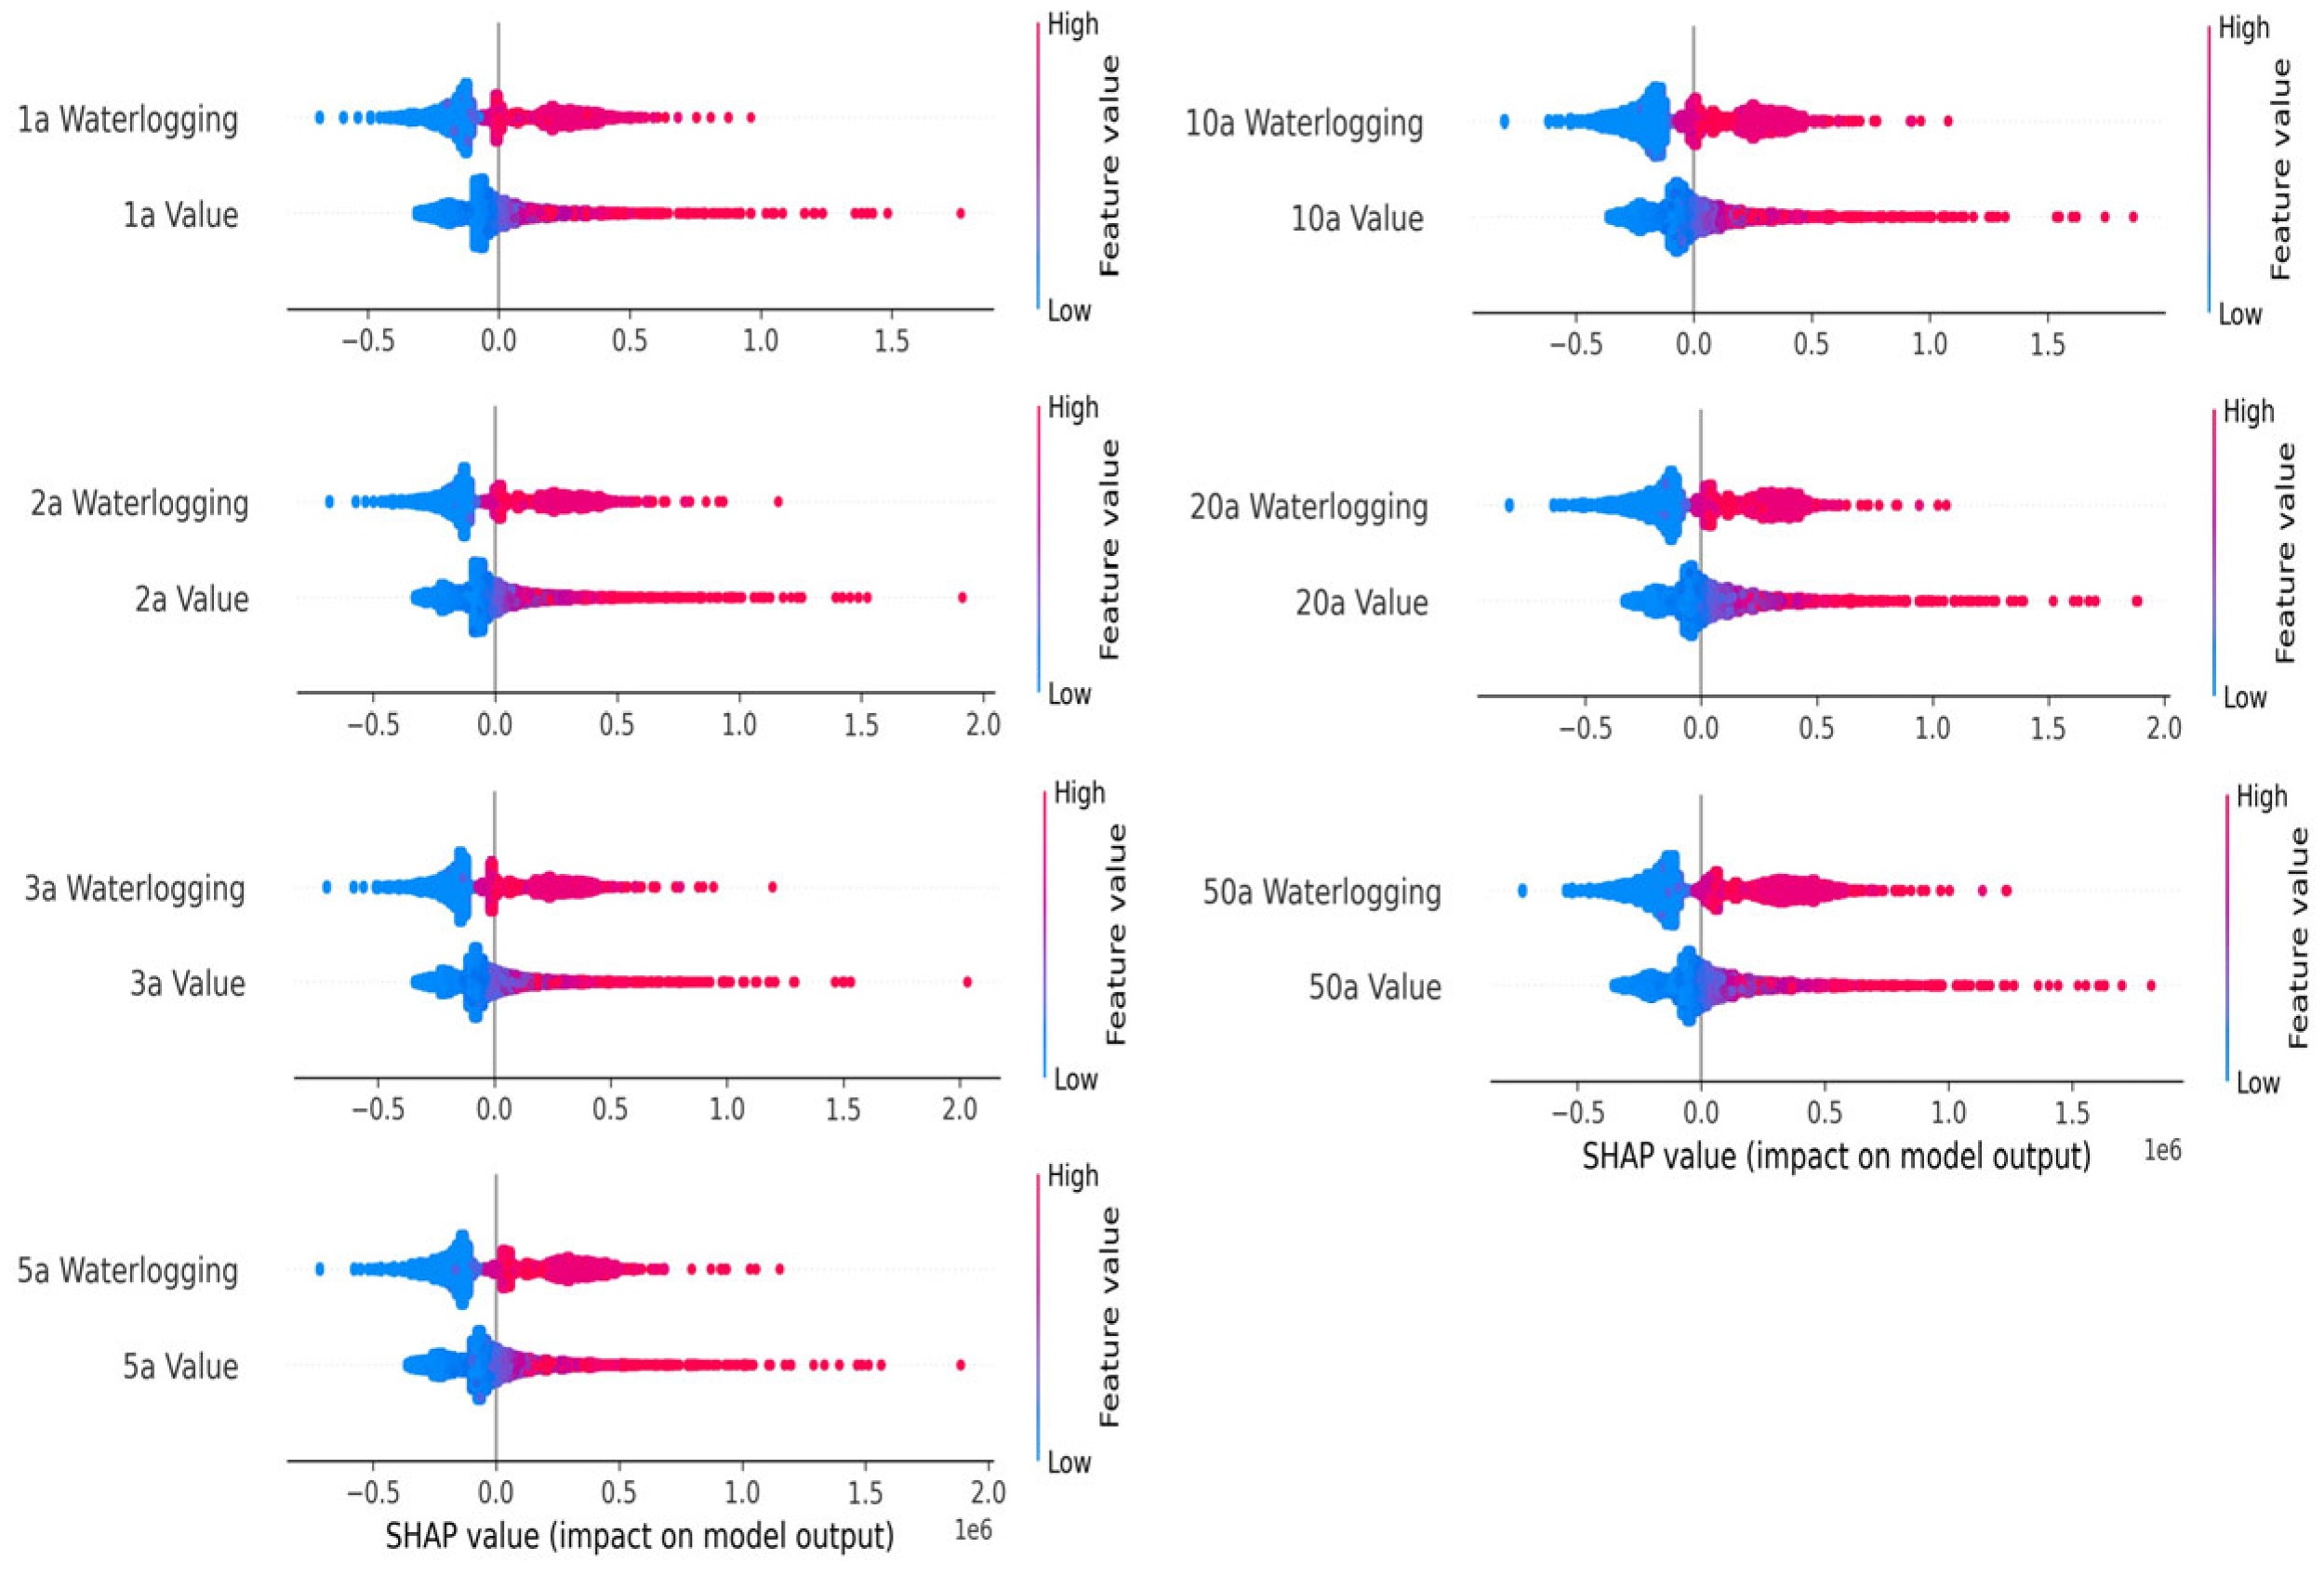
Using the SHAP framework described in Section 2.6.2, the global and local interpretations of waterlogging losses were conducted to quantitatively reveal the relative contributions of water depth and land value to urban waterlogging losses. As shown in Figure 14, over the 1-year return period, water depth contributed approximately 66% to the losses. This contribution gradually increased with longer return periods, reaching about 75% over the 50-year return period. Conversely, the contribution of land value decreased from 34% to about 25% over the same period. This indicates that as the return period increases, the relative importance of water depth gradually grows, while the relative importance of land value diminishes. As shown in Figure 15, the contribution of waterlogging is more widely distributed compared to value, and its impact exhibits a bipolar effect: when waterlogging is low, it suppresses the occurrence of losses; whereas, when waterlogging is high, it significantly promotes the occurrence of losses. Although value shows a suppressive effect at low values and a promoting effect at high values, both high and low values are concentrated near 0, indicating that its impact on losses is relatively minor. This could be because waterlogging is the direct driving factor for losses, while value only serves as a secondary factor that amplifies or mitigates the impact of waterlogging.

Figure 14.
Global contribution (mean) over different return periods.
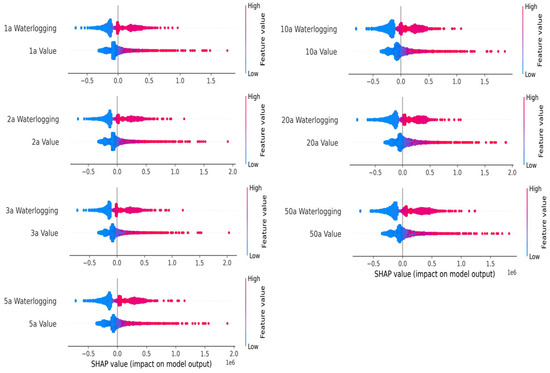
Figure 15.
SHAP summary plot.
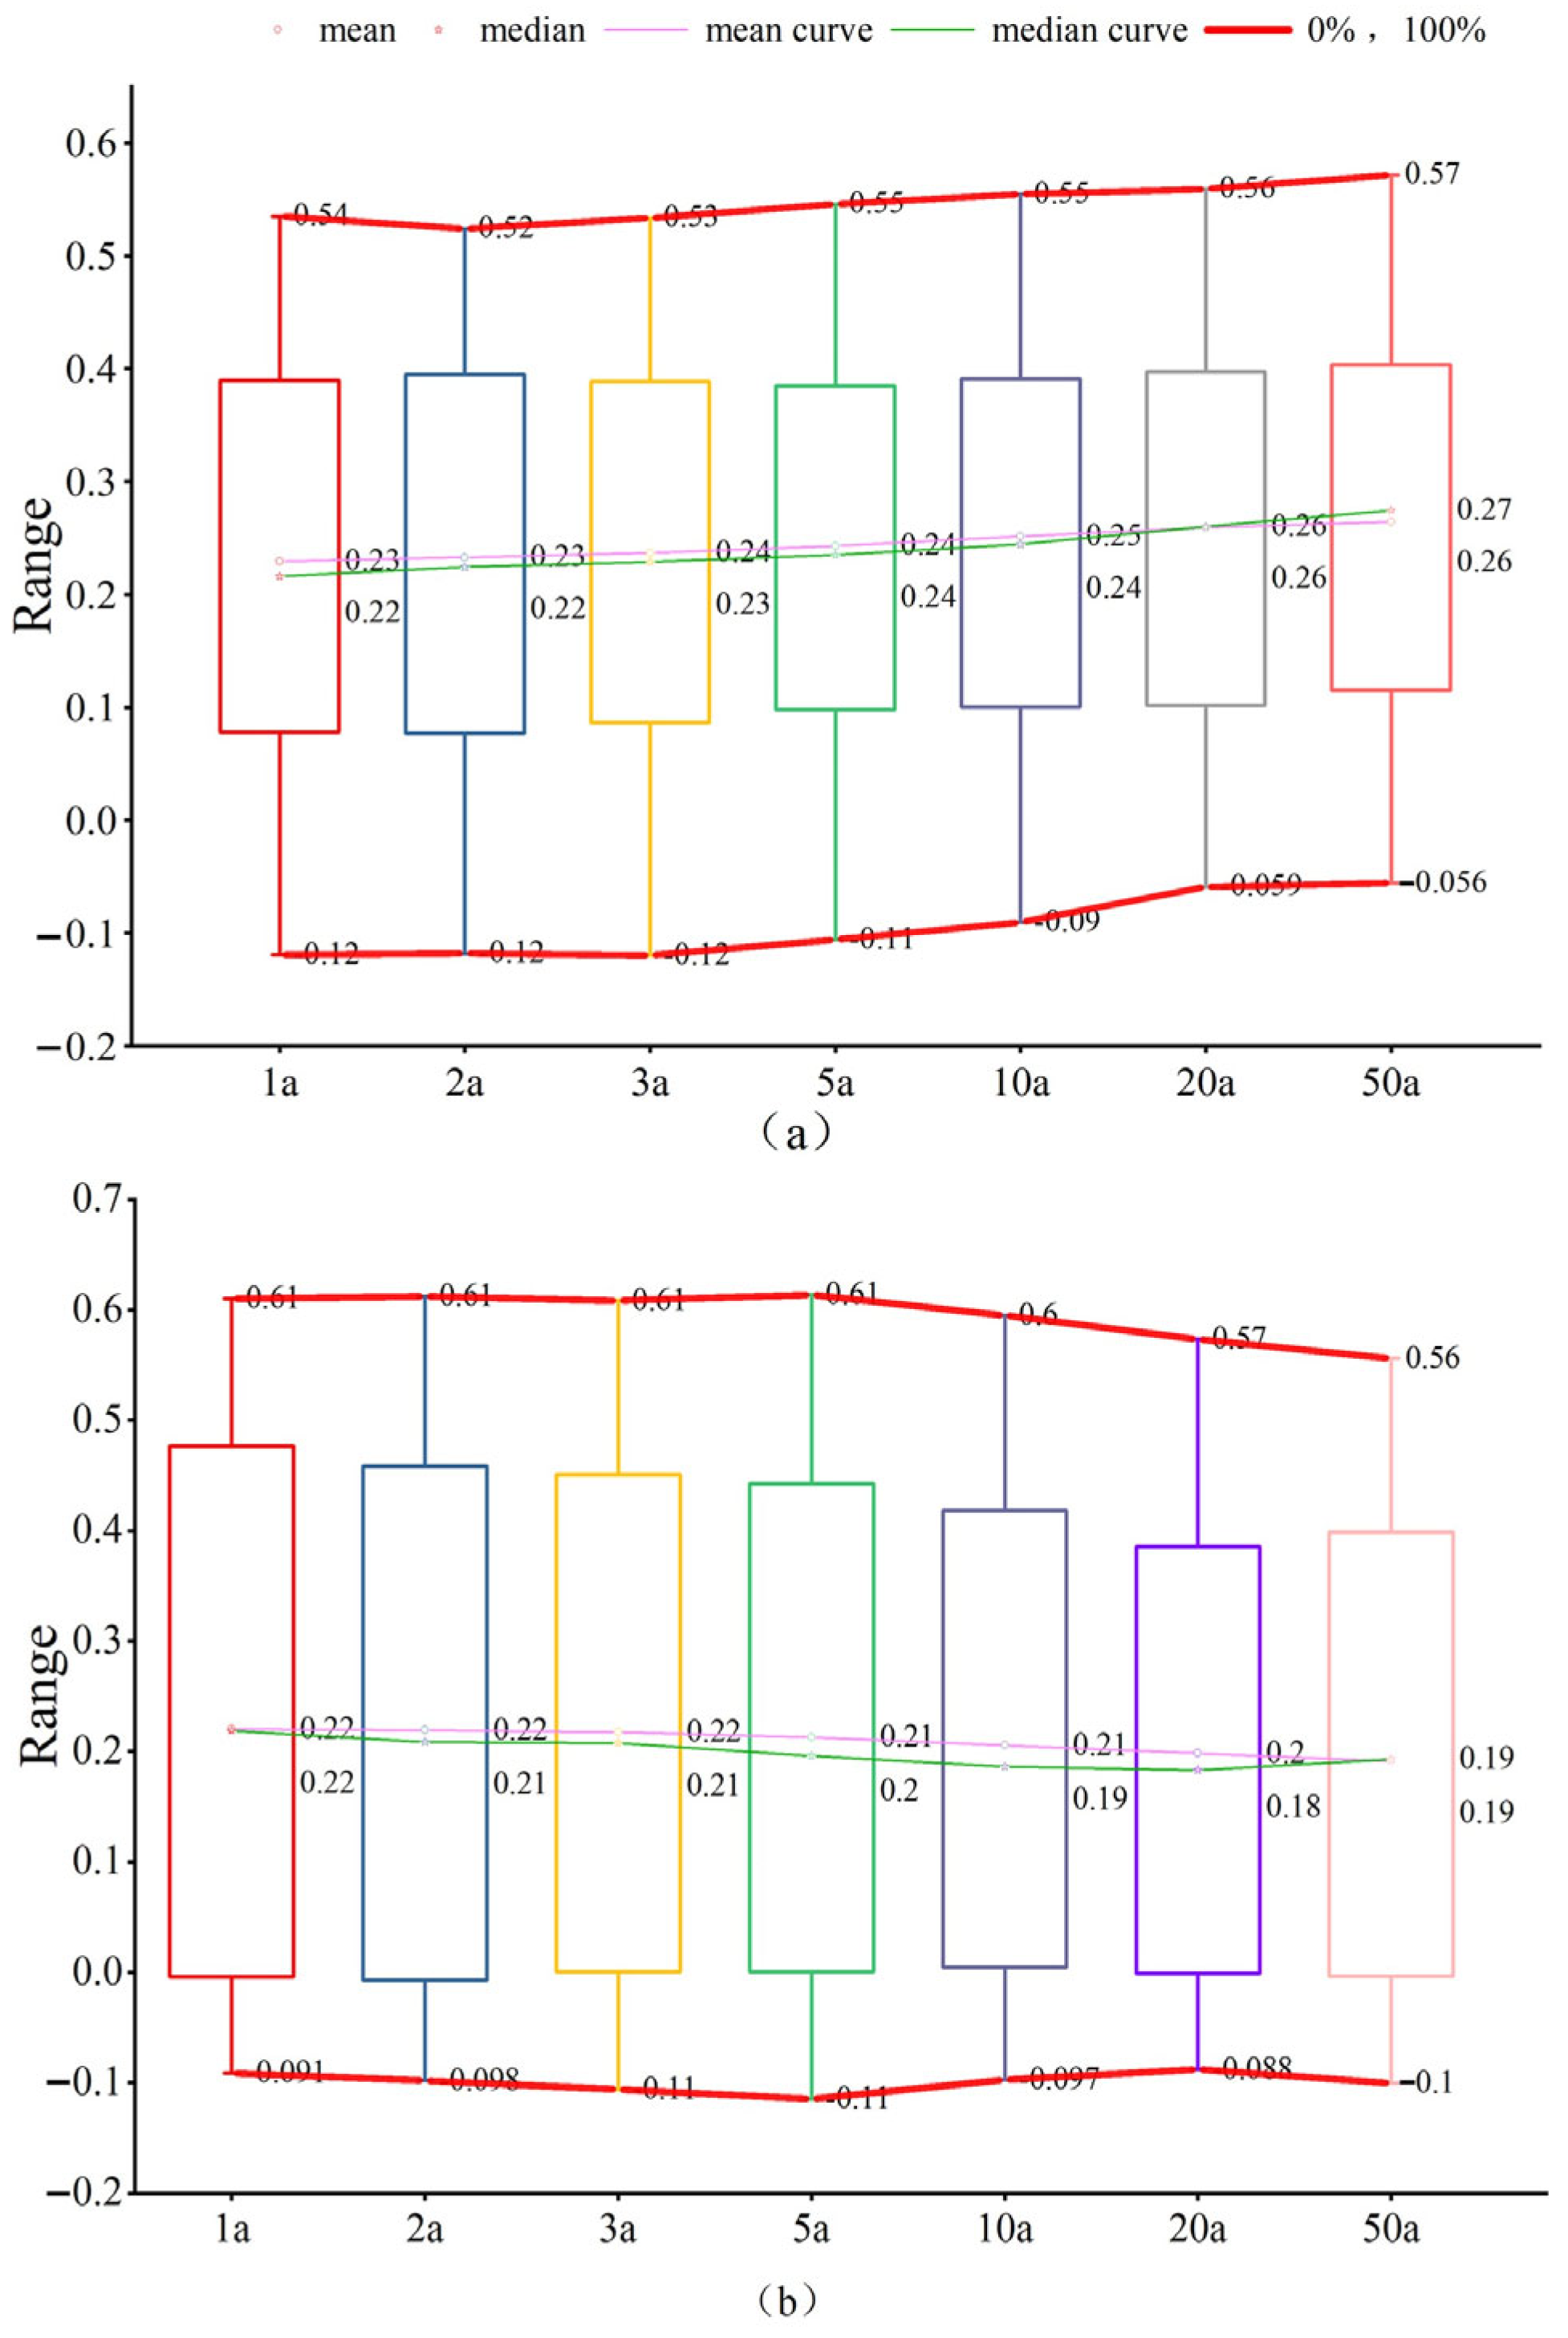
Figure 16 illustrates the local explanation results for water depth and land value contributions to waterlogging losses across different streets over various return periods. It is evident that the contributions of these two factors to waterlogging losses exhibit distinct variation characteristics with changes in return periods. Over lower return periods, the average contributions of water depth and value factors are relatively similar. However, as the return period increases, the difference between these two factors gradually widens. The contribution of water depth shows an upward trend with longer return periods, increasing from an average of 0.23 over the 1-year return period to 0.26 over the 50-year return period. Conversely, the contribution of land value decreases as the return period increases, dropping from 0.22 over the 1-year return period to 0.19 over the 50-year return period. In terms of fluctuation characteristics, the range of variation for water depth contributions remains relatively stable across different return periods, with minimal changes in the upper and lower boundaries. On the other hand, the fluctuation range of land value contributions demonstrates a notable convergence trend as the return period increases, with significantly reduced variability at longer return periods. It is worth noting that certain streets, such as Heyi, Lugu, Xihongmen, Chaoyangmen, Jiaodaokou, and Yongding Road (2, 40, 0, 51, 61, and 46), show negative SHAP values. This indicates that the distribution of water depth or asset value in these areas has a mitigating effect on waterlogging losses.
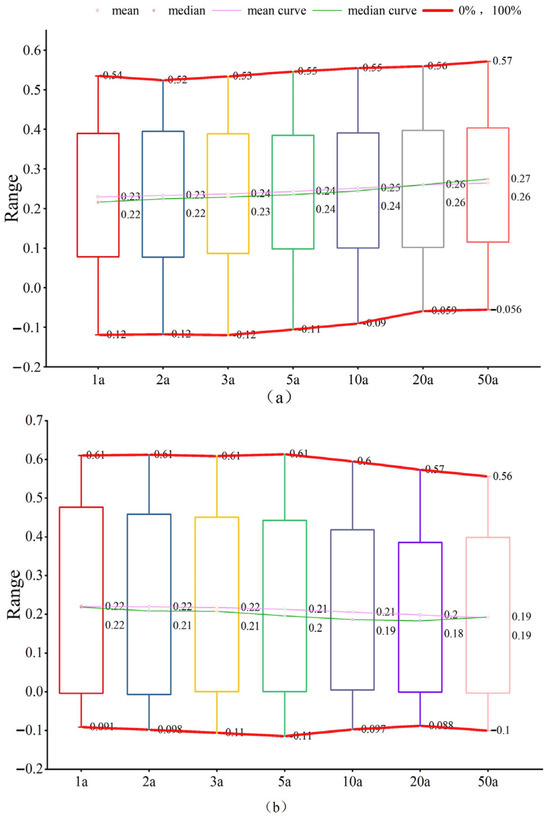
Figure 16.
Local contribution over different return periods: (a) waterlogging and (b) value.
3.3.3. Clustering Analysis
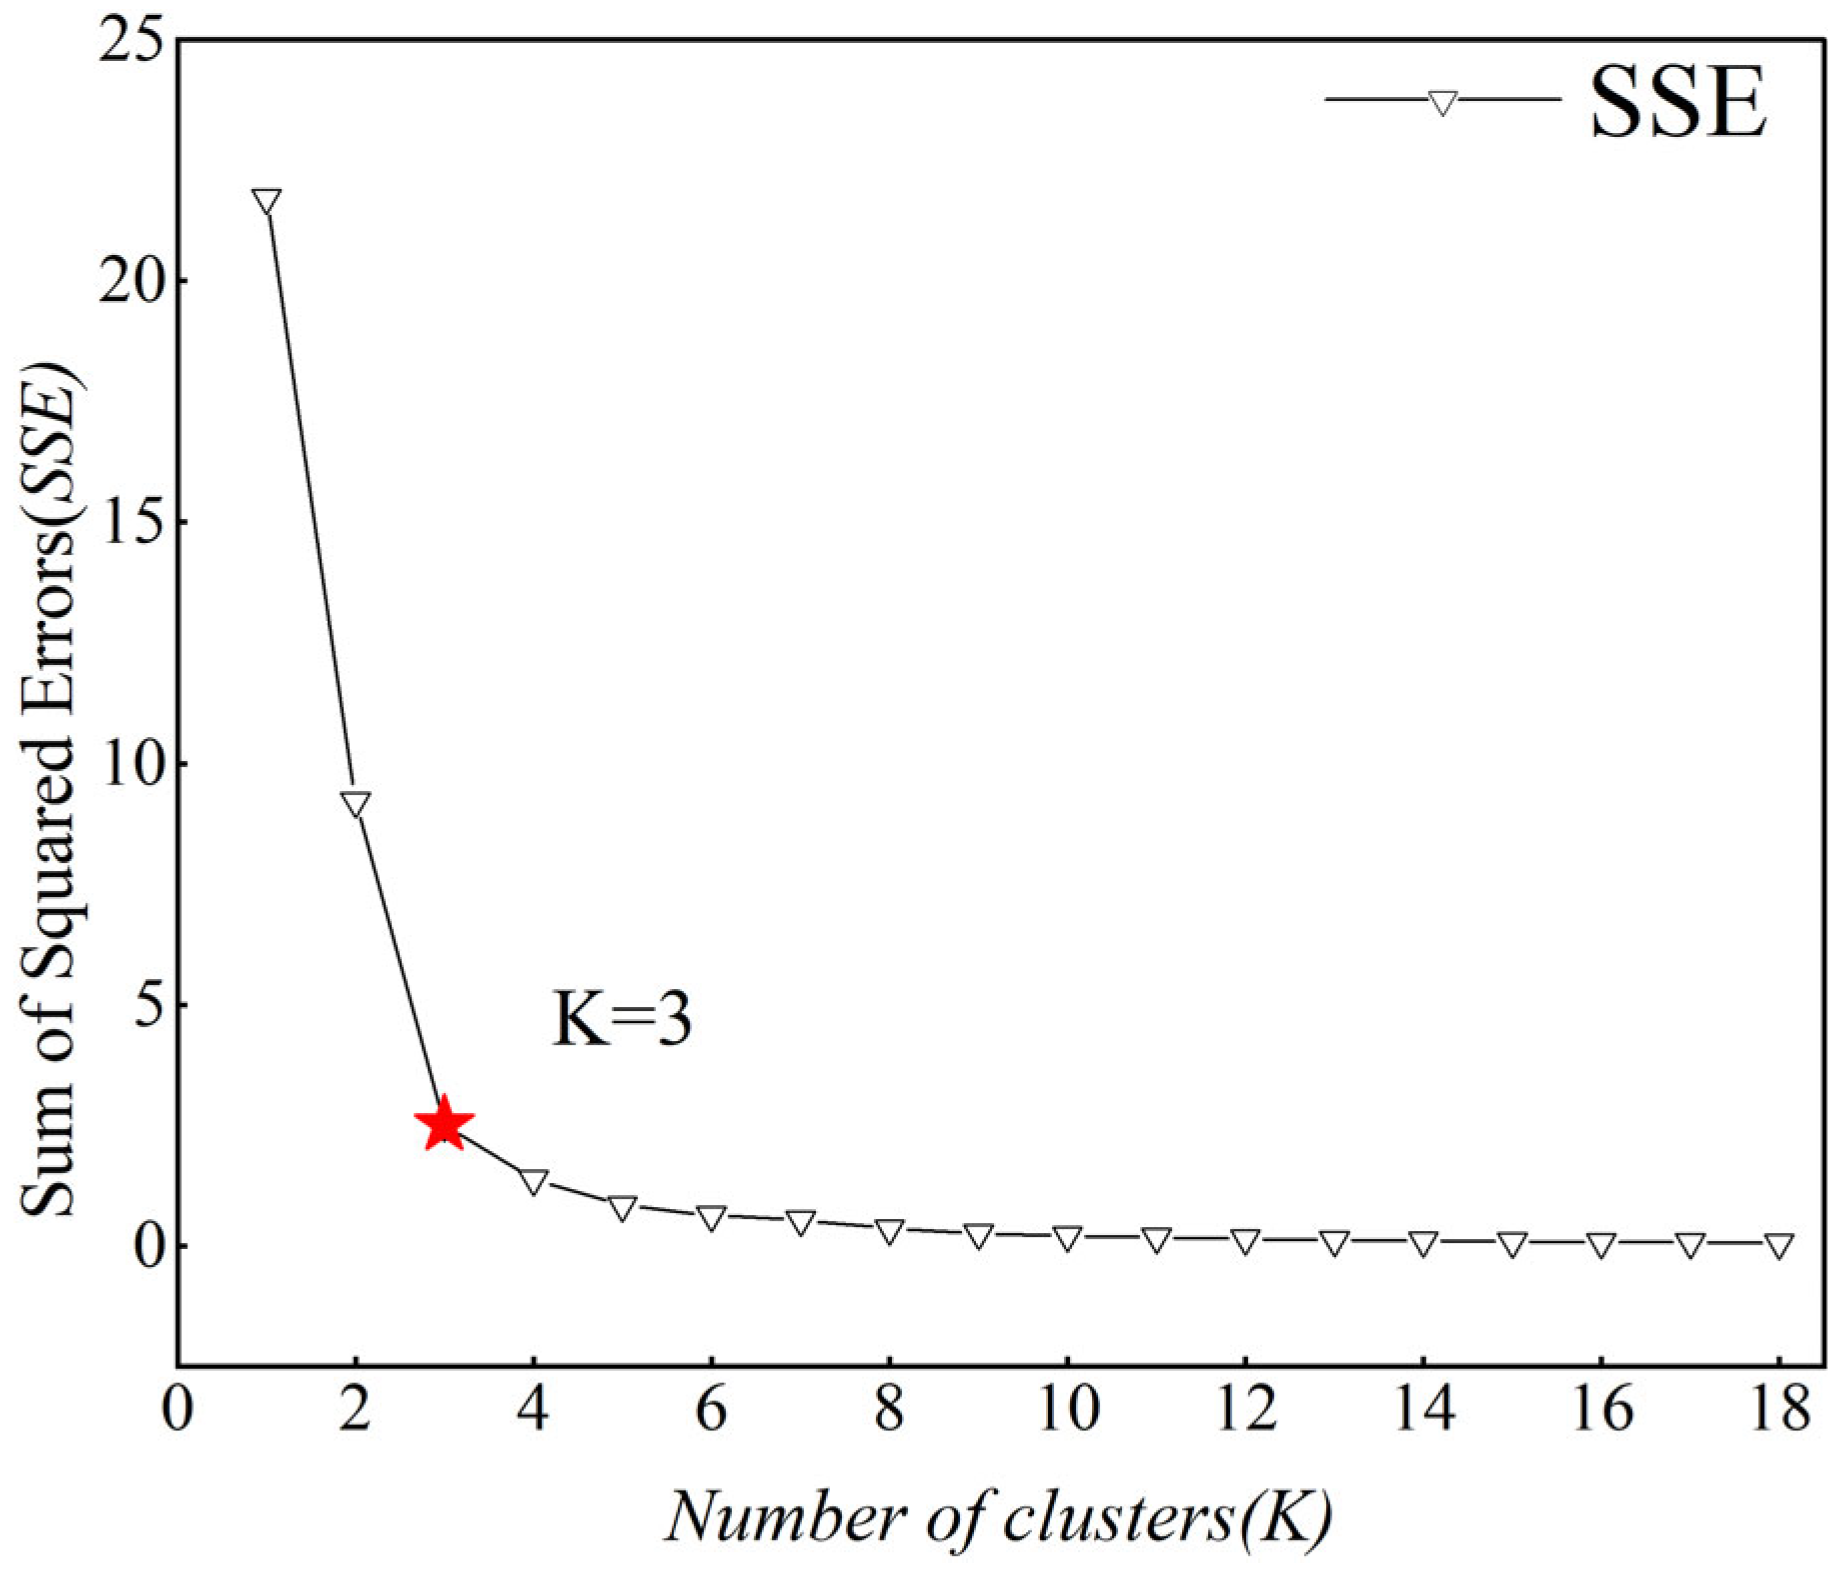
Based on the local contribution values of water depth and land value obtained via SHAP, a K-means clustering analysis was conducted on the streets within the study area. Using the elbow method to examine the trend of SSE (Sum of Squared Errors) with varying cluster numbers (k), as shown in Figure 17, an inflection point was identified at k = 3. This indicates that the combination of water depth and land value contributions in the study area can be reasonably divided into three types: water-strongly dominant type (W), water–value-jointly dominant type (WV), and value-strongly dominant type (V). The W-type is characterized by water depth contributing significantly more than other factors, while the V-type shows the opposite pattern, with land value playing a more dominant role.
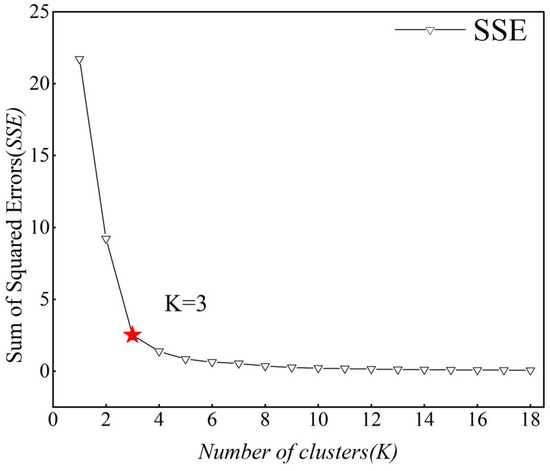
Figure 17.
Elbow curve.
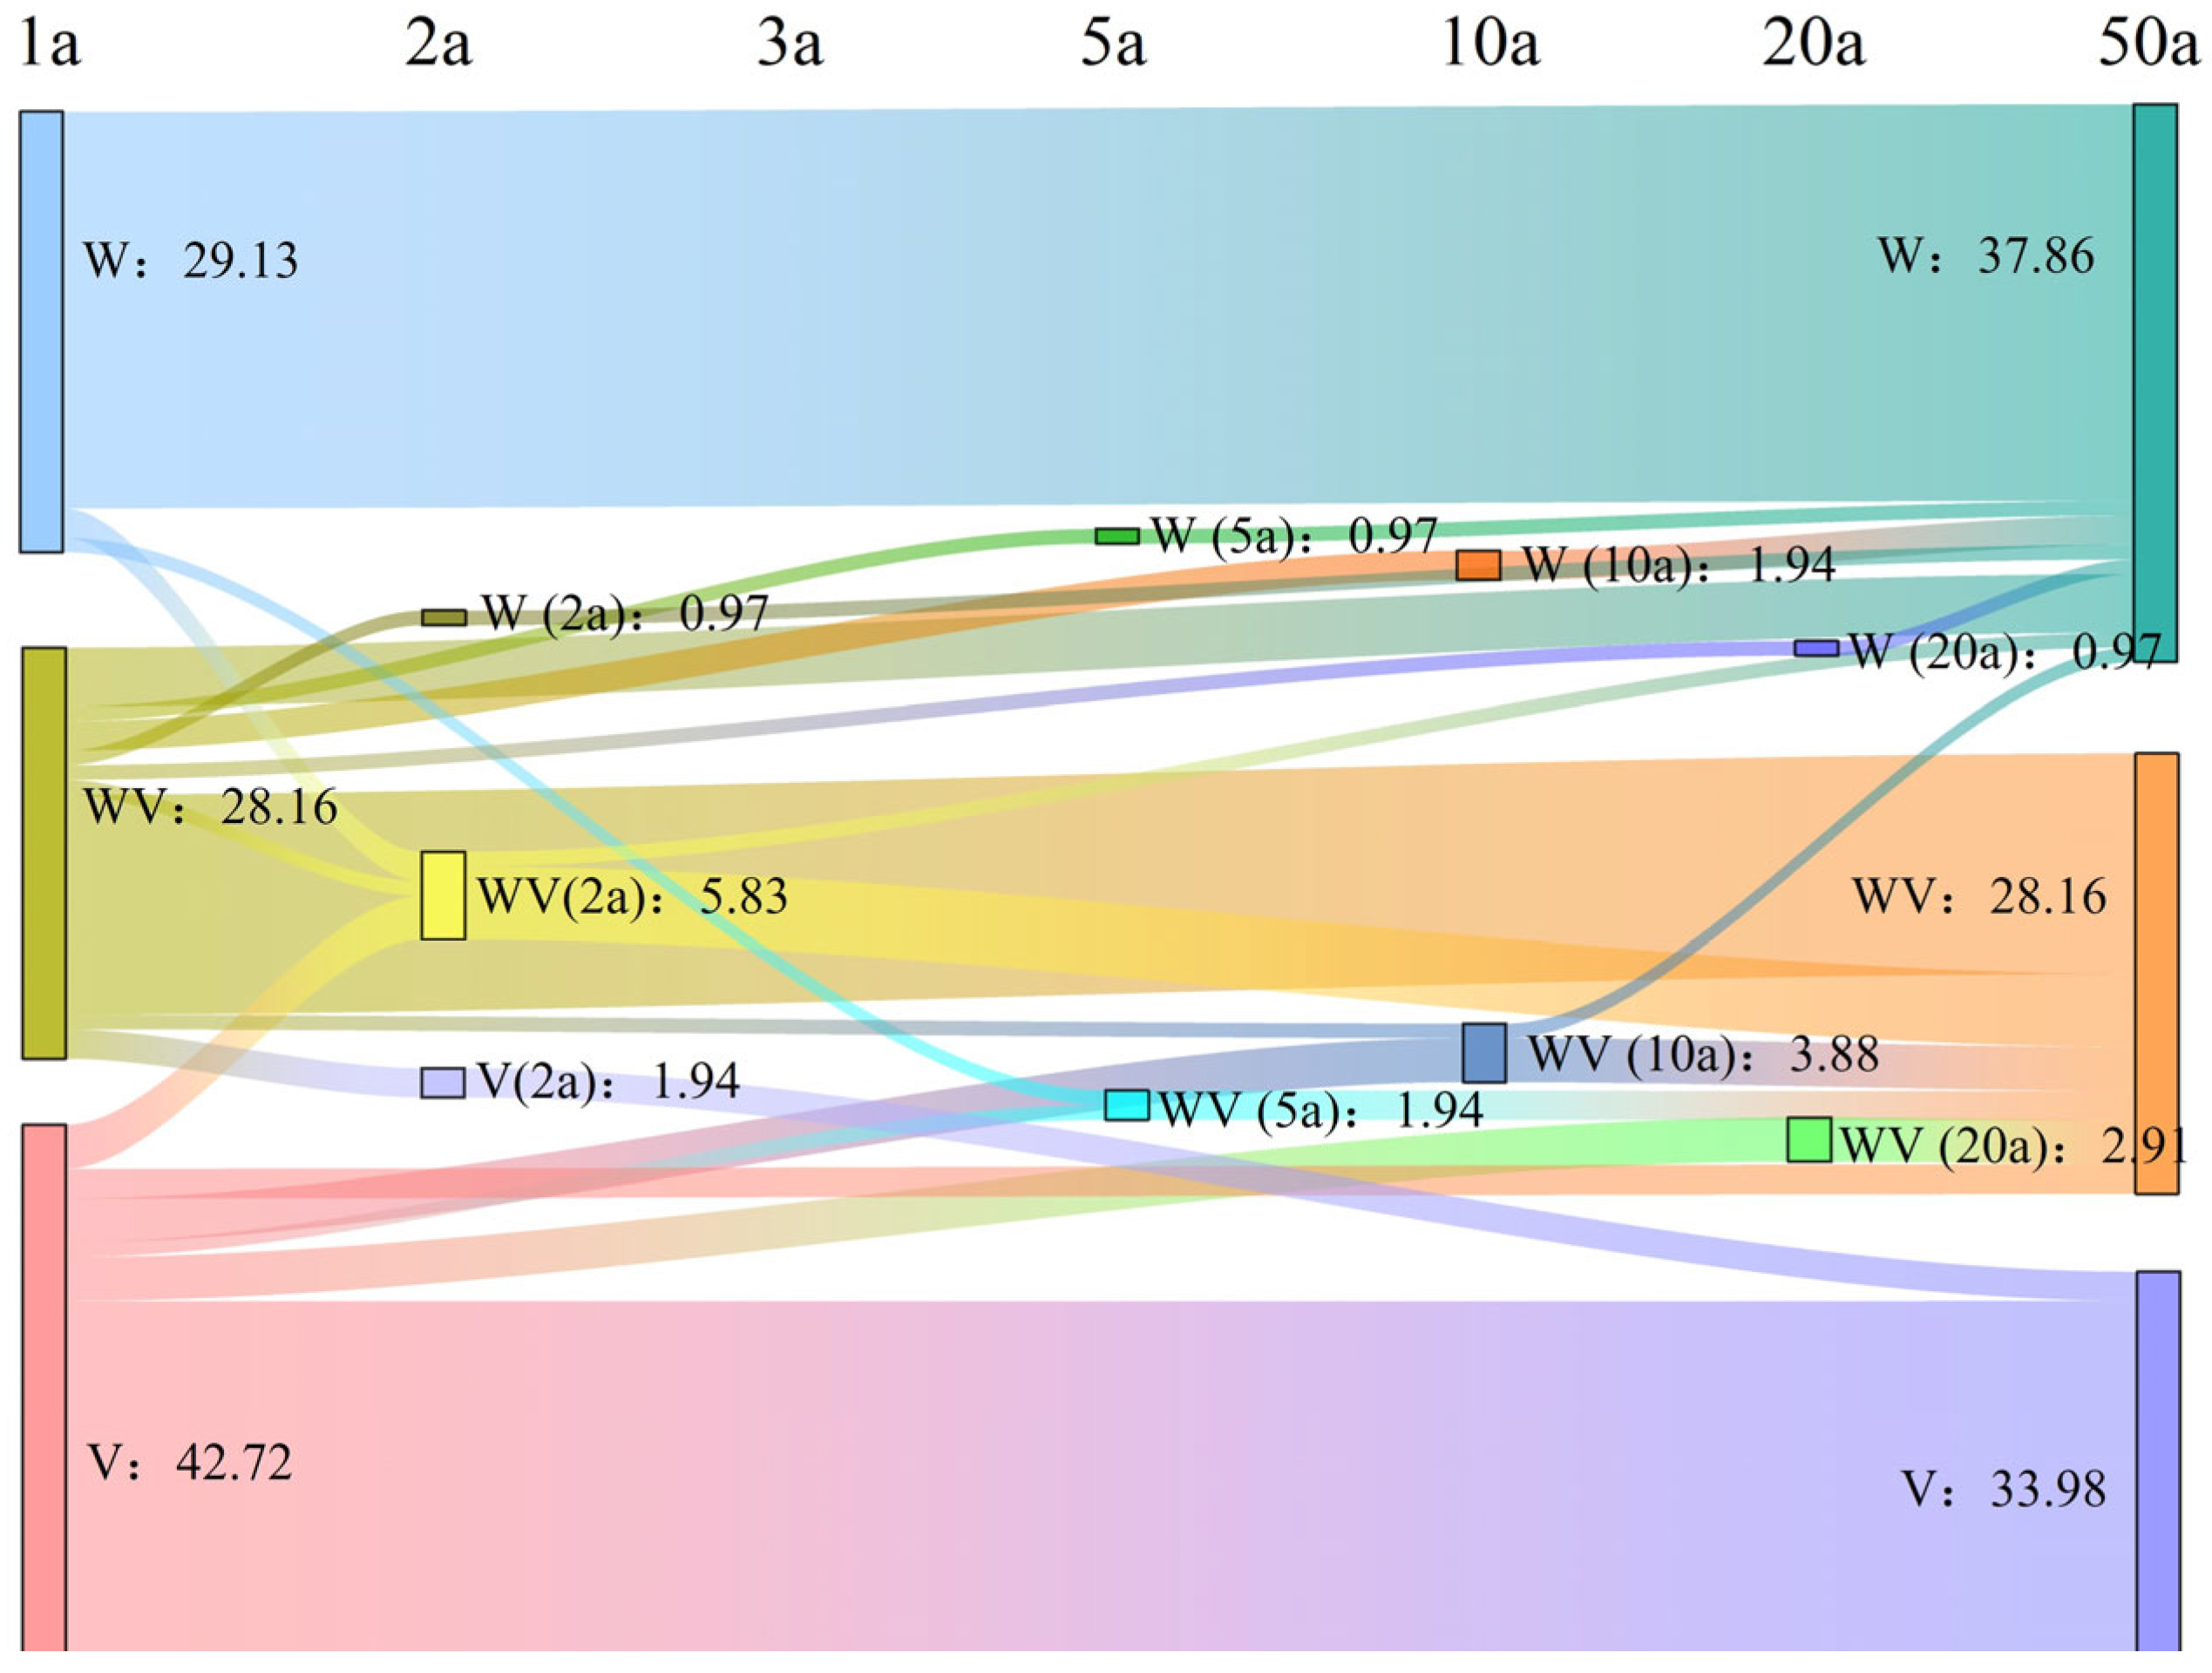
Figure 18 provides a detailed depiction of the clustering results and distribution of streets in the study area over different return periods. It can be clearly observed that over the 1-year return period, V-type streets account for the largest proportion, making up 43% of the total streets in the study area, while WV-type and W-type streets are roughly equal in proportion. As the return period increases, some streets in the study area undergo type migration. Notably, by the end of the 50-year return period, W-type streets represent 38% of the total streets, becoming the most prevalent type. Type migration mainly occurs by the end of the 2-year, 10-year, and 50-year return periods, with the most significant migration observed at the end of the 2-year return period, while no migration is observed at the end of the 3-year return period. Notes: WV(2a) indicates that a street transitions to the WV-type from either W-type or V-type at the end of the 2-year return period. Similarly, V(2a) or W(2a) indicates a transition to the respective type at the end of the 2-year return period.
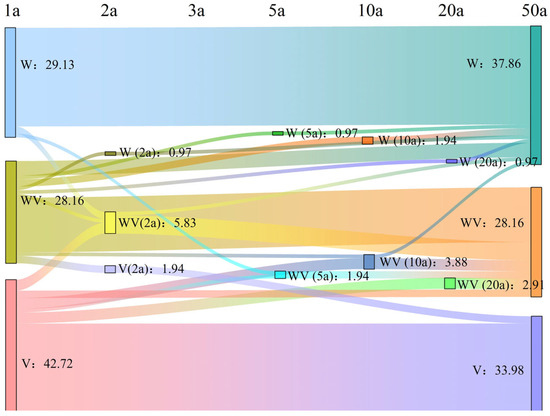
Figure 18.
Street-type migration diagram.
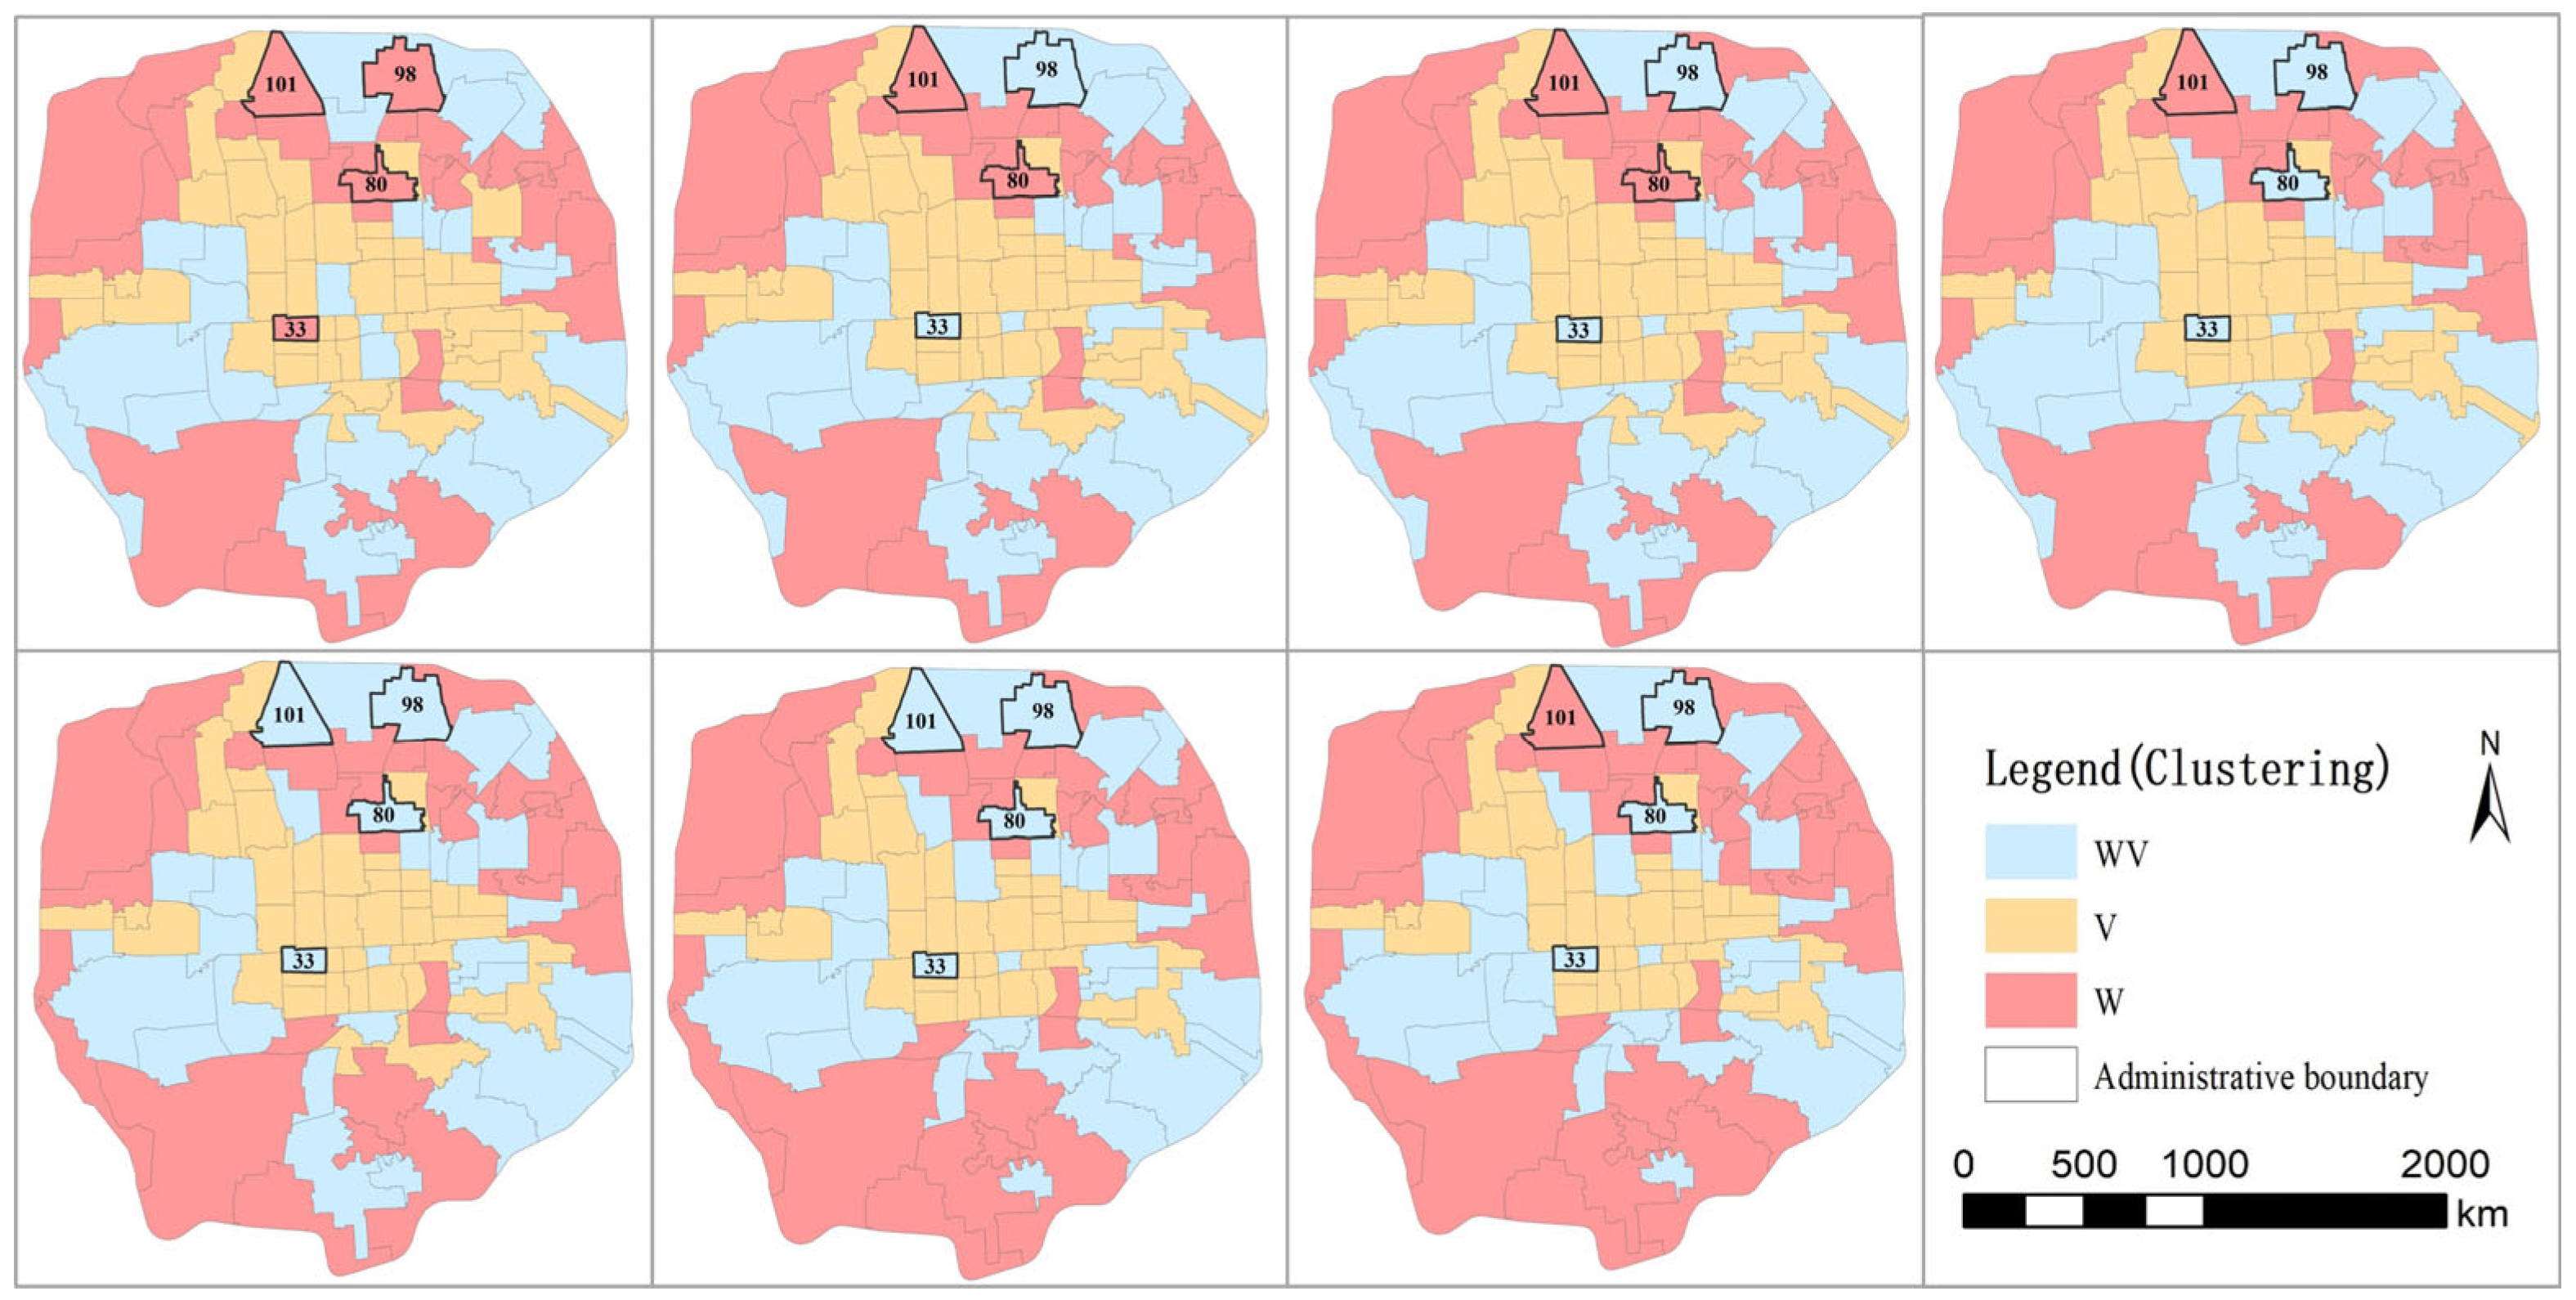
Figure 19 illustrates the spatial distribution characteristics of the clustering results for streets in the study area over different return periods. It is clear that W-type streets are primarily concentrated in the central parts of the study area, while the V-type streets are mainly located on the outskirts. Due to differences in the spatial distribution of drainage networks and land use across streets, the relationship between water depth contribution and rainfall return period is not always linear. For instance, in streets such as Hepingli and Datun, the water depth contribution decreases as the return period increases.

Figure 19.
Spatial distribution of street clusters over different return periods. Notes: Guanganmennei (33), Hepingli (80), Datun (98), and Xueyuanlu (101).
4. Discussion
4.1. Spatial Coupling Characteristics of Waterlogging, Value, and Loss
Urban waterlogging risk refers to the likelihood of waterlogging occurring in urban areas and its potential destructiveness. As urbanization accelerates, the problem of urban waterlogging has become increasingly severe. As a social hub, cities face significant threats to the safety of people’s lives and property due to waterlogging. Therefore, it is essential not only to focus on the risk of waterlogging but also to evaluate its potential impact on property. By overlaying analyses of waterlogging risk and property value, key areas requiring attention for waterlogging can be identified.
The results of the bivariate Moran’s correlation analysis (Figure 10) reveal significant spatial heterogeneity between waterlogging risk and value in the study area, with the dominant pattern being LH-type distribution. This phenomenon is likely closely related to Beijing’s urban planning, where high-value land, including commercial, educational, residential, and industrial areas, is concentrated in the central and northeastern parts of the study area. In these regions, the increasing building density has resulted in a significant expansion of impervious surfaces, reducing surface infiltration capacity. However, thanks to higher drainage network construction standards and well-developed infrastructure, waterlogging risks have been effectively mitigated. As a result, a spatial distribution pattern dominated by “high value–low waterlogging” has emerged. In contrast, the outer areas of the study region are primarily characterized by an LL-type distribution. These areas generally have lower building density and development intensity. Although their infrastructure is less advanced compared to the central districts, the relatively high green space coverage has effectively reduced waterlogging risks. Additionally, HH-type distribution, which represents the key focus of flood prevention efforts, is present in certain parts of the study area. This highlights the need for a comprehensive approach to enhance flood resilience in these regions.
Figure 11 clearly visualizes that the key risk areas identified by considering both value and waterlogging differ significantly from those identified solely based on waterlogging. DH–MH areas are predominantly green spaces with water storage functions, where even an increase in waterlogging risk would not result in significant economic losses. In contrast, MH–RH areas are primarily high-value areas of land, where disasters could lead to substantial losses. This indicates that focusing solely on waterlogging when identifying key areas may overemphasize some non-critical regions while neglecting high-value priority areas. Such an approach could result in incorrect rescue prioritization, inefficient resource allocation, inadequate risk control, and limited disaster prevention and mitigation outcomes. Therefore, incorporating value factors into the identification system for key waterlogging areas can significantly enhance the precision of disaster prevention and mitigation management. In addition, the “Waterlogging-Value-Loss” assessment framework proposed in this study can comprehensively account for the spatial coupling relationship between waterlogging and value, clarifying the relative contribution rates of waterlogging and value to losses. This method is highly versatile; by simply replacing data such as pipe networks, land use, and DEM, and incorporating local damage–loss curves, it can be adapted to different cities or regions. Thus, it provides a valuable reference for disaster prevention and mitigation in other areas.
4.2. Analysis of Factors Influencing Urban Waterlogging Losses
Identifying the significant factors affecting urban waterlogging losses and uncovering the dominant factors for different streets is crucial for developing effective prevention and mitigation strategies. Using the Birch-K-means combined algorithm for clustering analysis of streets, it was found that over low return periods, the streets are predominantly of the V-type. As the return period increases, the proportion of V-type streets gradually decreases, while the proportion of W-type streets rises, eventually becoming dominant—with an increase from 29% over a 1-year return period to 38% over a 50-year return period. This indicates that the influence of waterlogging factors on urban waterlogging losses gradually increases, while the influence of value factors decreases. This pattern can be attributed to the following: during low return periods, when rainfall intensity is relatively low, the drainage system can function effectively, reducing the risk of urban waterlogging. In such scenarios, urban waterlogging losses are primarily regulated by the distribution of socio-economic value. However, as the return period increases, the cumulative effects of hydrological processes become more pronounced, leading to severe overloading of drainage systems. Consequently, waterlogging becomes the dominant factor influencing urban waterlogging losses. As shown in Figure 15 and Figure 16, compared to the value factor, the waterlogging factor exhibits more pronounced polarization characteristics. With the increase in return periods, the waterlogging factor demonstrates relatively stable fluctuation patterns, with its mean, median, maximum, and minimum values steadily increasing as the return period grows. Meanwhile, the differences in waterlogging contributions among different streets remain within a relatively fixed range. In contrast, the distribution of the value factor is narrower, and its fluctuation range shows a clear convergence trend as the return period increases. Particularly over high return period conditions, its fluctuation amplitude decreases significantly. This phenomenon further indicates that as the return period increases, the waterlogging factor gradually replaces the value factor as the key determinant of urban waterlogging losses. These findings provide important scientific evidence for formulating more precise and effective strategies for urban waterlogging prevention and mitigation.
Through the analysis of the clustering results (Figure 18), it is evident that 77.77% of streets do not undergo type migration as the return period increases. These streets exhibit strong stability and low sensitivity to changes in return period. However, 18.40% of streets experience type migration with increasing return periods. Among these, 17.47% of streets show a gradual increase in waterlogging contribution as the return period grows. It is worth noting that 3.83% of streets exhibit a contrary pattern, where waterlogging contribution decreases with an increase in the return period. Examples include streets in Datun and Ganjiakou, where this anomalous behavior may be attributed to unique topographical conditions, the layout of drainage systems, or specific patterns of land use. These exceptions highlight the need for targeted monitoring and in-depth research to better understand the underlying causes. This is essential for ensuring the precision and effectiveness of flood prevention and mitigation measures in these areas.
4.3. Urban Disaster Prevention and Mitigation Strategies Based on Risk and Value
Urban waterlogging not only disrupts residents’ daily lives but also causes significant economic losses. To enhance urban flood prevention and mitigation capacity, it is essential to thoroughly analyze the spatial relationship between waterlogging risk and urban value and develop more effective strategies. Based on the findings of this study, the following two targeted recommendations are proposed:
- (1)
- This study, based on the spatial coupling relationship between urban value and waterlogging risk, categorizes urban waterlogging risk into five types, prioritizing high-risk, high-value lands. Although these lands account for only 1.5% of the affected areas, they contribute to 35% of flood losses. To mitigate risks in these areas, it is necessary to strengthen infrastructure development by adding new branch pipelines and constructing reservoirs to enhance drainage and storage capacity, reducing sewer overflow. Simultaneously, optimize spatial layout by transforming underutilized spaces into landscaped green areas, such as designing sunken plazas in commercial districts. For low-waterlogging, high-value areas, proactive flood prevention measures are essential, including issuing flood warnings, protecting or relocating critical assets, and safeguarding entrances to basements and underground parking lots. In high-waterlogging, low-value lands, measures should be tailored to different land-use types. For instance, the development of parks and green spaces should be restricted to enhance their stormwater ecological functions.
- (2)
- Based on the spatial distribution characteristics of waterlogging losses at the street scale and the clustering results, differentiated prevention and control strategies should be developed. For waterlogging-dominated streets, priority should be given to enhancing the drainage network capacity and adding decentralized storage facilities. For value-dominated streets, the focus should be on strengthening asset protection systems and improving insurance mechanisms. For waterlogging-value co-dominated streets, systematic governance should be carried out in conjunction with regional characteristics to improve disaster prevention and mitigation efficiency. It is worth noting that for streets prone to type migration with increasing return periods, a dynamic monitoring and evaluation system should be established to adjust prevention and control measures in a timely manner.
5. Conclusions
This study proposes a “Waterlogging-Value-Loss” spatial analysis framework applicable to urban waterlogging risk assessment. By identifying key focus areas and determining the dominant factors for each street over different return periods, the framework enhances the precision of urban flood prevention and mitigation efforts while establishing a differentiated management mechanism. Using the central urban area of Beijing as the study region, a bivariate spatial correlation analysis was employed to comprehensively consider value and waterlogging risks, thereby identifying key focus areas. By integrating SHAP and the Birch-K-means clustering algorithm, the dominant factors for each street over different return periods were explored, leading to several key conclusions:
- (1)
- The urban waterlogging coupling model can effectively identify areas at risk of waterlogging and, when combined with disaster loss curves, can quantitatively assess the economic losses caused by waterlogging. The study reveals that waterlogging hotspots are primarily concentrated in areas outside the Fourth Ring Road with sparse drainage networks. As the rainfall return period increases, waterlogging depth gradually rises, and the affected area expands from 5.5% to 22.4%. Economic losses also grow from CNY 3.73 billion to CNY 13.93 billion, with the most significant losses occurring in educational and research land, commercial land, and residential land.
- (2)
- The use of bivariate spatial correlation analysis has significantly improved the accuracy of identifying key areas of concern for urban waterlogging. The spatial distribution of urban waterlogging risk and value exhibits significant heterogeneity, characterized by relatively lower waterlogging risks in areas with higher value. By comprehensively considering both value and risk, it is possible to more precisely identify priority areas. Based on the 1-year return period scenario, 66% of the areas identified as key concern zones based solely on waterlogging risk were overlooked in the bivariate spatial correlation analysis. On the other hand, 2.61 km2 of areas, due to their higher land-use value, were prioritized in the results of the bivariate spatial correlation analysis.
- (3)
- The “Waterlogging-Value-Loss” assessment framework effectively reveals the changing characteristics of the relative contributions of water depth and value to waterlogging losses. The study found that as the return period increases, the relative contribution of water depth rises from 66% to 75%, while the relative contribution of value gradually decreases. Additionally, the dominant factors of loss across different streets also change with the return period, with 22.23% of streets experiencing a shift in factor type, demonstrating a clear temporal transition characteristic. For example, the proportion of W-type streets decreased from 43% to 34%, while the proportion of V-type streets increased from 29% to 38%. This dynamic nature requires that prevention and control measures be tailored to regional characteristics and return periods to enhance the precision and effectiveness of disaster prevention and mitigation efforts.
Author Contributions
Conceptualization, S.Z., J.Z. and Y.D.; formal analysis, S.Z.; funding acquisition, J.Z. and H.W.; investigation, H.W.; methodology, S.Z.; resources, Y.D.; validation, J.Z.; and writing—original draft, S.Z. All authors have read and agreed to the published version of the manuscript.
Funding
This research was funded by the Beijing Natural Science Foundation, grant number: 8242003, the Major Science and Technology Innovation Pilot Project for Water Resources Protection and Integrated-Saving Utilization in the Yellow River Basin of Inner Mongolia Autonomous Region, grant number: 2023JBGS0007, and the National Natural Science Foundation of China General Project, grant number: 72373011.
Data Availability Statement
The data presented in this study are available on request from the corresponding author.
Conflicts of Interest
The authors declare no conflicts of interest.
References
- Chocat, B.; Ashley, R.; Marsalek, J.; Matos, M.R.; Rauch, W.; Schilling, W.; Urbonas, B. Toward the Sustainable Management of Urban Storm-Water. Indoor Built Environ. 2007, 16, 273–285. [Google Scholar] [CrossRef]
- Güneralp, B.; Reba, M.; Hales, B.U.; Wentz, E.A.; Seto, K.C. Trends in Urban Land Expansion, Density, and Land Transitions from 1970 to 2010: A Global Synthesis. Environ. Res. Lett. 2020, 15, 044015. [Google Scholar] [CrossRef]
- Sun, S.; Zhai, J.; Li, Y.; Huang, D.; Wang, G. Urban Waterlogging Risk Assessment in Well-Developed Region of Eastern China. Phys. Chem. Earth Parts ABC 2020, 115, 102824. [Google Scholar] [CrossRef]
- Su, X.; Shao, W.; Liu, J.; Jiang, Y.; Wang, K. Dynamic Assessment of the Impact of Flood Disaster on Economy and Population under Extreme Rainstorm Events. Remote Sens. 2021, 13, 3924. [Google Scholar] [CrossRef]
- Lewis, J.A.; Zipperer, W.C.; Ernstson, H.; Bernik, B.; Hazen, R.; Elmqvist, T.; Blum, M.J. Socioecological Disparities in New Orleans Following Hurricane Katrina. Ecosphere 2017, 8, e01922. [Google Scholar] [CrossRef]
- Compilation Group of China Flood and Drought Disaster Prevention Bulletin. Summary of China Flood and Drought Disaster Prevention Bulletin 2020. China Flood Drought Manag. 2021, 31, 26–32. [Google Scholar]
- Sun, R.; An, D.; Lu, W.; Shi, Y.; Wang, L.; Zhang, C.; Zhang, P.; Qi, H.; Wang, Q. Impacts of a Flash Flood on Drinking Water Quality: Case Study of Areas Most Affected by the 2012 Beijing Flood. Heliyon 2016, 2, e00071. [Google Scholar] [CrossRef]
- Yang, M.; Mohammad Yusoff, W.F.; Mohamed, M.F.; Jiao, S.; Dai, Y. Flood Economic Vulnerability and Risk Assessment at the Urban Mesoscale Based on Land Use: A Case Study in Changsha, China. J. Environ. Manag. 2024, 351, 119798. [Google Scholar] [CrossRef] [PubMed]
- Wang, S.; Jiang, R.; Yang, M.; Xie, J.; Wang, Y.; Li, W. Urban Rainstorm and Waterlogging Scenario Simulation Based on SWMM under Changing Environment. Environ. Sci. Pollut. Res. 2023, 30, 123351–123367. [Google Scholar] [CrossRef] [PubMed]
- Tan, K.M.; Seow, W.K.; Wang, C.L.; Kew, H.J.; Parasuraman, S.B. Evaluation of Performance of Active, Beautiful and Clean (ABC) on Stormwater Runoff Management Using MIKE URBAN: A Case Study in a Residential Estate in Singapore. Urban Water J. 2019, 16, 156–162. [Google Scholar] [CrossRef]
- Yang, H.; Tong, X.; Gou, D. Study on the Waterlogging Operation Effects of InfoWorks ICM Dispatching Strategies. E3S Web Conf. 2021, 228, 01009. [Google Scholar] [CrossRef]
- Guo, W.; Zhai, M.; Lei, X.; Huang, H.; Long, Y.; Li, S. Two-Dimensional Hydrodynamic Simulation of the Effect of Stormwater Inlet Blockage on Urban Waterlogging. Water 2024, 16, 2029. [Google Scholar] [CrossRef]
- Ji, X.; Dong, W.; Wang, W.; Dai, X.; Huang, H. Impacts of Climate Change on Extreme Precipitation Events and Urban Waterlogging: A Case Study of Beijing. Nat. Hazards Rev. 2024, 25, 05023014. [Google Scholar] [CrossRef]
- Zhang, X.; Chen, P.; Dai, S.; Han, Y.; Chang, X. Urban HydroConnect: Harnessing SWMM for Dynamic Waterway Management Assessment. Water Resour. Manag. 2024, 38, 4473–4498. [Google Scholar] [CrossRef]
- Haq, M.; Akhtar, M.; Muhammad, S.; Paras, S.; Rahmatullah, J. Techniques of Remote Sensing and GIS for Flood Monitoring and Damage Assessment: A Case Study of Sindh Province, Pakistan. Egypt. J. Remote Sens. Space Sci. 2012, 15, 135–141. [Google Scholar] [CrossRef]
- Wang, Y.; Zhang, Q.; Lin, K.; Liu, Z.; Liang, Y.; Liu, Y.; Li, C. A Novel Framework for Urban Flood Risk Assessment: Multiple Perspectives and Causal Analysis. Water Res. 2024, 256, 121591. [Google Scholar] [CrossRef] [PubMed]
- Chen, Y.; Wang, D.; Zhang, L.; Guo, H.; Ma, J.; Gao, W. Flood Risk Assessment of Wuhan, China, Using a Multi-Criteria Analysis Model with the Improved AHP-Entropy Method. Environ. Sci. Pollut. Res. 2023, 30, 96001–96018. [Google Scholar] [CrossRef] [PubMed]
- Li, J.; Zheng, A.; Guo, W.; Bandyopadhyay, N.; Zhang, Y.; Wang, Q. Urban Flood Risk Assessment Based on DBSCAN and K-Means Clustering Algorithm. Geomat. Nat. Hazards Risk 2023, 14, 2250527. [Google Scholar] [CrossRef]
- Yoshida, Y.; Banba, M. Flood Disaster Mitigation Measures Through Land Use Management in the UK and France. In Land Use Management in Disaster Risk Reduction: Practice and Cases from a Global Perspective; Banba, M., Shaw, R., Eds.; Springer: Tokyo, Japan, 2017; pp. 405–448. ISBN 978-4-431-56442-3. [Google Scholar]
- King, D.; Gurtner, Y.; Firdaus, A.; Harwood, S.; Cottrell, A. Land Use Planning for Disaster Risk Reduction and Climate Change Adaptation: Operationalizing Policy and Legislation at Local Levels. Int. J. Disaster Resil. Built Environ. 2016, 7, 158–172. [Google Scholar] [CrossRef]
- Adnan, M.S.G.; Abdullah, A.Y.M.; Dewan, A.; Hall, J.W. The Effects of Changing Land Use and Flood Hazard on Poverty in Coastal Bangladesh. Land Use Policy 2020, 99, 104868. [Google Scholar] [CrossRef]
- European Commission; Joint Research Centre. Global Flood Depth-Damage Functions: Methodology and the Database with Guidelines; European Commission: Luxembourg, 2016. [Google Scholar]
- Jongman, B.; Kreibich, H.; Apel, H.; Barredo, J.I.; Bates, P.D.; Feyen, L.; Gericke, A.; Neal, J.; Aerts, J.C.J.H.; Ward, P.J. Comparative Flood Damage Model Assessment: Towards a European Approach. Nat. Hazards Earth Syst. Sci. 2012, 12, 3733–3752. [Google Scholar] [CrossRef]
- Strauss, R.; Pfeifer, C.; Ulmer, H.; Mu, V. Spatial Analysis of Percutaneous Transluminal Coronary Angioplasty (PTCA) in Austria. Eur. J. Epidemiol. 1999, 15, 451–459. [Google Scholar] [CrossRef]
- Peng, B.; Zhang, X.; Elahi, E.; Wan, A. Evolution of Spatial–Temporal Characteristics and Financial Development as an Influencing Factor of Green Ecology. Environ. Dev. Sustain. 2022, 24, 789–809. [Google Scholar] [CrossRef]
- Wu, X.; Li, B.; Li, M.; Guo, M.; Zang, S.; Zhang, S. Examining the Relationship Between Spatial Configurations of Urban Impervious Surfaces and Land Surface Temperature. Chin. Geogr. Sci. 2019, 29, 568–578. [Google Scholar] [CrossRef]
- Qin, M.; Zhu, W.; Pan, J.; Li, S.; Qiu, S. Research on the Formation Mechanism of Product Contribution in Online Product Communities: Content Contribution as a Mediating Variable. Aslib J. Inf. Manag. 2024, 76, 329–352. [Google Scholar] [CrossRef]
- Liu, J.; Kang, H.; Tao, W.; Li, H.; He, D.; Ma, L.; Tang, H.; Wu, S.; Yang, K.; Li, X. A Spatial Distribution—Principal Component Analysis (SD-PCA) Model to Assess Pollution of Heavy Metals in Soil. Sci. Total Environ. 2023, 859, 160112. [Google Scholar] [CrossRef]
- Liang, L.; Yu, L.; Wang, Z. Identifying the Dominant Impact Factors and Their Contributions to Heatwave Events over Mainland China. Sci. Total Environ. 2022, 848, 157527. [Google Scholar] [CrossRef] [PubMed]
- Ryu, Y.-H.; Min, S.-K. Leveraging Physics-Based and Explainable Machine Learning Approaches to Quantify the Relative Contributions of Rain and Air Pollutants to Wet Deposition. Sci. Total Environ. 2024, 931, 172980. [Google Scholar] [CrossRef]
- Wang, X.; Bai, Y. The Global Minmax K-Means Algorithm. SpringerPlus 2016, 5, 1665. [Google Scholar] [CrossRef] [PubMed]
- Sinaga, K.P.; Yang, M.-S. Unsupervised K-Means Clustering Algorithm. IEEE Access 2020, 8, 80716–80727. [Google Scholar] [CrossRef]
- Liu, Y.; Li, B. Bayesian Hierarchical K-Means Clustering. Intell. Data Anal. 2020, 24, 977–992. [Google Scholar] [CrossRef]
- Huang, X.; Ye, Y.; Xiong, L.; Lau, R.Y.K.; Jiang, N.; Wang, S. Time Series k-Means: A New k-Means Type Smooth Subspace Clustering for Time Series Data. Inf. Sci. 2016, 367–368, 1–13. [Google Scholar] [CrossRef]
- Kaur, J.; Singh, H. Performance Evaluation of a Novel Hybrid Clustering Algorithm Using Birch and K-Means. In Proceedings of the 2015 Annual IEEE India Conference (INDICON), New Delhi, India, 17–20 December 2015; IEEE: Piscataway, NJ, USA, 2015; pp. 1–6. [Google Scholar]
- Jiang, X.; Yuan, H.; Xue, M.; Chen, X.; Tan, X. Analysis of a Heavy Rainfall Event over Beijing during 21–22 July 2012 Based on High Resolution Model Analyses and Forecasts. J. Meteorol. Res. 2014, 28, 199–212. [Google Scholar] [CrossRef]
- Xie, Y.; Xing, J.; Shi, J.; Dou, Y.; Lei, Y. Impacts of Radiance Data Assimilation on the Beijing 7.21 Heavy Rainfall. Atmos. Res. 2016, 169, 318–330. [Google Scholar] [CrossRef]
- Yang, W.; Zheng, C.; Jiang, X.; Wang, H.; Lian, J.; Hu, D.; Zheng, A. Study on Urban Flood Simulation Based on a Novel Model of SWTM Coupling D8 Flow Direction and Backflow Effect. J. Hydrol. 2023, 621, 129608. [Google Scholar] [CrossRef]
- Lin, F.; Chen, X.; Yao, H. Evaluating the Use of Nash-Sutcliffe Efficiency Coefficient in Goodness-of-Fit Measures for Daily Runoff Simulation with SWAT. J. Hydrol. Eng. 2017, 22, 05017023. [Google Scholar] [CrossRef]
- DB11/T 2074–2022; Technical Specification for Construction and Application of Mathematical Model of Urban Flooding Prevention and Control System. Beijing Municipal Commission of Planning and Natural Resources; Beijing Municipal Bureau of Market Supervision and Administration: Beijing, China, 2022.
- Wu, Z.; Lv, H.; Meng, Y.; Guan, X.; Zang, Y. The Determination of Flood Damage Curve in Areas Lacking Disaster Data Based on the Optimization Principle of Variation Coefficient and Beta Distribution. Sci. Total Environ. 2021, 750, 142277. [Google Scholar] [CrossRef]
- GB 51222-2017; Technical Code for Urban Flooding Prevention and Control. Ministry of Housing and Urban-Rural Development: Beijing, China, 2017.
- Liu, K.; Wang, S.; Chen, B.; Wang, H. Quantifying the Direct and Indirect Impacts of Urban Waterlogging Using Input–output Analysis. J. Environ. Manag. 2024, 352, 120068. [Google Scholar] [CrossRef]

Disclaimer/Publisher’s Note: The statements, opinions and data contained in all publications are solely those of the individual author(s) and contributor(s) and not of MDPI and/or the editor(s). MDPI and/or the editor(s) disclaim responsibility for any injury to people or property resulting from any ideas, methods, instructions or products referred to in the content. |
© 2025 by the authors. Licensee MDPI, Basel, Switzerland. This article is an open access article distributed under the terms and conditions of the Creative Commons Attribution (CC BY) license (https://creativecommons.org/licenses/by/4.0/).