Article

137Cs-Based Assessment of Soil Erosion Rates in a Morphologically Diverse Catchment with Varying Soil Types and Vegetation Cover: Relationship with Soil Properties and RUSLE Model Predictions

1
“VINČA” Institute of Nuclear Sciences, National Institute of the Republic of Serbia, University of Belgrade, Mike Petrovića Alasa 12-14, 11351 Belgrade, Serbia
2
Faculty of Geography, University of Belgrade, Studentski Trg 3, 11000 Belgrade, Serbia
3
Faculty of Sciences and Mathematics, Department of Geography, University of Niš, Višegradska 33, 18000 Niš, Serbia
4
Faculty of Agriculture, University of Belgrade, Nemanjina 6, 11080 Belgrade, Serbia
*
Author to whom correspondence should be addressed.
Water 2025, 17(4), 526; https://doi.org/10.3390/w17040526
Submission received: 10 January 2025 / Revised: 4 February 2025 / Accepted: 6 February 2025 / Published: 12 February 2025

Abstract

:
This study assessed soil erosion intensity and soil properties across the Crveni Potok catchment in Serbia, a region of diverse morphology, geology, pedology, and vegetation. Soil samples were collected using a regular grid approach to identify the underlying factors contributing to erosion and the most vulnerable areas. Based on 137Cs activities and the profile distribution (PD) model, severe erosion (>10 t ha−1 y−1) was predicted at nearly 60% of the studied locations. The highest mean erosion rates were detected for the lowest altitude range (300–450 m), Rendzic Leptosol soil, and grass-covered areas. A significant negative correlation was found between the erosion rates, soil organic matter, and indicators of soil structural stability (OC/clay ratio and St), indicating that the PD model successfully identifies vulnerable sites. The PD and RUSLE (revised universal soil loss equation) models provide relatively similar mean erosion rates (14.7 t ha⁻1 y⁻1 vs. 12.7 t ha⁻1 y⁻1) but significantly different median values (13.1 t ha−1 y−1 vs. 5.5 t ha−1 y−1). The model comparison revealed a positive trend. The observed inconsistencies were interpreted by the models’ spatiotemporal frameworks and RUSLE’s sensitivity to input data quality. Land use stands out as a significant factor modifying the variance of erosion rate, highlighting the importance of land management practices in mitigating erosion.

1. Introduction

Erosion is a natural process caused by water, wind, ice, and gravity, which gradually remove surface soil and parent rock material. Various factors, including topography, land cover, soil properties, rainfall, runoff, and agricultural practices, influence the vulnerability to erosion [1,2]. Soil erosion is a major global environmental issue that impacts water resources, biodiversity, carbon storage, and ecosystems [3,4]. Removal of the fertile soil layer rich in organic matter disrupts biogeochemical cycles of carbon, nitrogen, and phosphorus [5]. It affects sediment transport and off-site accumulation, harming crop yields, water quality, and ecosystem sustainability [6].
The consequences of erosion extend beyond the loss of soil fertility; they also lead to changes in soil properties through the selective mobilization and redistribution of its components [7,8,9] and can be a factor driving variability in these properties [10,11,12,13,14]. Therefore, establishing a relationship between erosion rates, soil properties, and soil quality indicators is essential for understanding the impact of soil erosion.
Currently, the global rate of soil loss exceeds the rate of soil formation, and as a result, many soils are now categorized as fair, poor, or very poor [15]. Soil degradation, primarily caused by deforestation and the expansion of arable land, has increased by 2.5% worldwide in the last two decades [16,17]. It is estimated that almost one-third of the soil resources have degraded globally, and the number could go up to 90% in the next 25 years [15]. At the European Union (EU) level, a quarter of the total soil resources is degraded above the proposed sustainable threshold (2 t ha−1 y−1), and over 6% of the agricultural land has undergone severe erosion (11 t ha−1 y−1), which in turn has caused a loss of over 1 billion EUR due to diminished productivity [18]. Water erosion is particularly prevalent, affecting 24% of EU land [19].
To address ongoing challenges [20], researchers and policymakers struggle to improve soil redistribution assessment and control tools. Various direct and indirect techniques are used to quantify erosion rates. Direct field-based methods like plot measurements [21], erosion pins [22], sediment traps [23,24,25], and tracer techniques [26,27,28] provide valuable data but can be labor-intensive and time-consuming and may lack resolution and variability, leading to uncertainty in data. Semi-quantitative methods, which assess erosion magnitude [29,30,31,32], may also be insufficient due to a lack of precision. On the other hand, indirect methods relying on remote sensing and geographic information systems (GISs) cover large areas and monitor changes over time [33,34], but their accuracy depends on proper calibration. Commonly used erosion models, such as the universal soil loss equation (USLE) [35] and its revised version (RUSLE) [36], estimate erosion rates based on factors like rainfall and soil type but rely on data that may be unavailable or have insufficient resolution. These models are cost-effective for large areas but may lack precision and fail to capture local variations. Given that each method has its trade-offs in terms of accuracy, scale (spatial and temporal), cost, data requirements, and expertise, choosing the most suitable one is contingent on specific objectives and available resources.
Fallout radionuclides, particularly 137Cs from nuclear tests and disasters, are helpful in quantifying soil redistribution rates across different soil types [37]. Conversion models for cultivated and uncultivated soils are used to estimate the average annual erosion and deposition rates at the sampling location based on the difference in 137Cs inventory between the sampled site and a nearby stable, undisturbed reference site that has not been affected by erosion or deposition. Measurements of 137Cs offer advantages over traditional methods by providing spatially distributed estimates and reflecting medium-term erosion history (past 50 years). This retrospective erosion data can be gathered from a single visit without significant disruption to the landscape, thus avoiding costly and time-consuming monitoring surveys [38]. Additionally, once historical insight into overall past erosion is established, short-term erosion processes can be monitored through 137Cs concentrations by periodically or occasionally sampling soil at the exact locations. Despite challenges stemming from fallout variability, such as deposition differences due to vegetation, land cover, and microrelief [39,40], careful site selection can mitigate these issues, allowing 137Cs to remain valuable for developing management practices.
The simultaneous use of various methods and techniques helps to address their limitations and drawbacks, thereby reducing the risk of significant errors in assessing erosion and sedimentation rates. For instance, measurements of 137Cs in soil have been employed to validate different methods for soil erosion assessment, calibrate and validate soil erosion models [41,42], and evaluate the relative contributions of various erosion processes within the study area [43].
The present study is set to evaluate soil erosion rates across the challenging landscape of the Crveni Potok catchment in Serbia. Despite the high vulnerability of soil to erosion, Serbia has yet to establish an adequate system for collecting and processing erosion data at the national level. As a result, information on soil erosion in Serbia is missing from relevant European databases, such as the European Soil Data Centre, that monitor European soil conditions. Erosion caused by wind and water affects approximately 86% of Serbia’s territory [44]. The country’s southeastern part, where the study area is located, has been identified as most severely impacted by water erosion. The Crveni Potok catchment is selected based on the following essential features: large production of sediments due to frequent destructive torrential floods, significant spatial and temporal variability of eroded sediments in water, significant variability of factors that control erosion on the small area, diverse land use and land cover, and heterogeneous geological, soil, and geomorphological properties. Previous research, which utilized remote sensing and nuclear techniques, identified two types of soil erosion in the catchment: linear rill/gully and sheet erosion. Additionally, the 137Cs inventories revealed that sheet erosion was more intense than rill erosion [45,46].
This study’s objective was to deepen the understanding of the combined effects of multiple factors on soil erosion in the Crveni Potok catchment. To achieve this, soil samples were collected throughout the catchment using a regular grid approach. The following methodological steps were employed: (i) assessing soil erosion rates using measurements of fallout radionuclide 137Cs, (ii) analyzing the relationships between the 137Cs-derived erosion rates and factors such as physiographic characteristics, soil physico-chemical properties, and indicators of soil structure stability, and (iii) comparing the 137Cs-based soil erosion estimates with those derived from the RUSLE model. By exploring the sources of discrepancies between estimates obtained by these two models and aligning the predicted erosion intensities with field observations and actual soil conditions, the research aims to contribute to a better interpretation and understanding of erosion modeling outputs in future applications across complex landscapes.

2. Materials and Methods

2.1. Study Area and Sampling Approach

The studied terrains in the Crveni Potok catchment are located in the foothills between the western slopes of the Svrljiške mountains in the east and Debeli Del in the west. The Crveni Potok catchment is part of the Malčanska River Basin, a right tributary of the Nišava River, the largest right tributary of the Južna Morava (Figure 1). In geotectonic and morphostructural terms, the studied area belongs to the Carpatho-Balkanides [47].
In the Crveni Potok catchment and the Malčanska River Basin, the dominant initial forms of relief are hilly and undulating structures of different morphology and height. The Crveni Potok catchment covers an area of about 8 km2. It is elevated at an altitude of over 700 m and was formed due to long-term geotectonic and sedimentary processes. The height difference between the highest and lowest points of the Crveni Potok catchment is 445 m. The lowest point is at the confluence of the Crveni Potok and the Malčanska River at 284 m above sea level, and the highest point is located on the northern catchment at 729 m above sea level [45].
Sedimentation of materials, interruptions in sedimentation, or phases of transgression, regression, and lithification dominantly influenced a stratigraphic column in the northern part where red sandstones and residual clays dominate. In the northernmost part of the Crveni Potok catchment, red sandstones of Permian age (Upper Paleozoic) are widespread, made of granular quartz and mica with iron oxides (limonite), which give it a reddish color, while the binding material is clay. The central part of the catchment has the most widespread Mesozoic sandstones and siltstones, and in the lower parts, there are Miocene lake sediments and Quaternary deposits (alluvium) [48]. Pliocene and Quaternary deposits of sand, gravel, clay, gravel–sandy sediment, and conglomerates are present along the main course of Crveni Potok. Quaternary alluvial deposits have accumulated at its confluence.
In the lower parts of the Crveni Potok catchment, redeposited/diluvial/colluvial soils are dominant, and residual soils dominate its upper and higher parts. The dominant soil types are acidic and humus-silicate brown to brown-red soils on red sandstones, lithosol on sandstone, and Haplic Cambisol formed on Permian sandstones. These soils retain some physicochemical characteristics of the parent substrate on which they were formed. Soils formed on red sandstones are susceptible to erosion processes. In the middle and lower parts of the Crveni Potok catchment, carbonate brownish Vertisols on lake sediments, Distric Cambisols on smaller areas, and Calcomelansol on limestone dominate [49]. Leptosol is characterized by a shallow depth of soil for the development of the root system of dendroflora. Due to insufficient soil depth and nutrient accessibility, Leptosol prevents the development of the root system of most cultivated plants. The depth of the humus horizon of the soil in the Crveni Potok catchment varies from 1 to 3 cm, depending on the slope of the terrain, vegetation, and exposure to pluvial processes. Systematic sampling has determined that, at higher altitudes, the soil cover is shallower and in an earlier stage of formation. The soils have a powdery to fine-grained loamy texture with small skeletal fragments.
The complex geological structure of the Crveni Potok catchment generates various geomorphological forms. This catchment’s physiographic predisposition and biogeography have caused the formation of gullies, and recent morphological forms arose due to the anthropogenic impact on the indigenous forest cover and grass associations. The formation of gullies is indirectly related to agrotechnical measures and overgrazing in the period after World War II until the end of the 1980s. Agricultural land use has exceeded the capacity for natural regeneration of pastures and arable land, resulting in torrential flows during periods of increased rainfall intensity and, in the following phase, the formation of gullies. Today, slower soil erosion processes occur in forest gullies. Factors that have influenced the slowdown of soil erosion are as follows: (i) the regressive phase of erosion; (ii) the erosion process has already removed the surface layer of weakly bound soil; (iii) soils now affected by erosion contain a significant percentage of mechanical clay fraction; (iv) cut forest vegetation (barren) has been partially restored with pseudo-forest vegetation; and (v) rainy periods are shorter due to regional climate changes.
The dominant vegetation types in the Crveni Potok catchment are grass formations and sapling forests of low ecological value. Grass associations are mainly found in areas where deforestation has been significant in the recent past. This type of vegetation has a limited effect on preventing water erosion. Today, these areas consist of meadows interspersed with deciduous trees and shrubs. The edification species is the Balkan sessile oak (Quercus dalechampii), but the white hornbeam (Carpinus betulus) and the black pine (Pinus nigra) are also present in mosaic form. The distribution of pseudo-forest vegetation inherent in trees grown from seeds is significant. In locations where several oak trees have been identified, the roots are branched and firmly attached to the parent soil. In locations with several trees with branched roots, soil erosion and the development of gullies is slowed down.
The nearest meteorological station is Niš, about 11 km from the Crveni Potok catchment. Deviations of meteorological elements in the Crveni Potok catchment from the values recorded at the meteorological station in Niš are minimal. The most important meteorological element for the erosion process is precipitation. According to Đokić, the predicted average annual precipitation is between 632 mm in the lower parts of the river catchment and 861 mm in its highest parts [50]. Although the amount of precipitation is not large, other factors also affect the occurrence of erosion and the formation of gullies in the Crveni Potok catchment. In addition to the amount of precipitation, its annual distribution, intensity, slope of the topographic surface, length of the slope, type of soil, grain size composition, water-holding capacity of the soil, water permeability and capillarity, water capacity and evaporation capacity, soil vulnerability, plant cover, saturation of the ground layer with water vapor, and air aridity are also important for the studied area.
The method for collecting data, whether through individual or multiple transects or a regular grid, depends on the study’s objectives. While 137Cs measurements along transects are useful for steep, relatively short, and regular slopes, the grid approach is preferred for landscapes with more complex topography [51]. Determining a reliable reference inventory is a critical step in the applying the 137Cs technique. To achieve this, a targeted sampling strategy was developed to identify a suitable reference site. The reference site was selected based on its proximity to the study area, absence of slope, lack of soil erosion or deposition, undisturbed soil conditions, and sparse vegetation cover. A cylinder corer with a 10 cm diameter was utilized to collect soil samples. The depth distribution of 137Cs was analyzed by dividing the soil cores into 5 cm intervals extending to a maximum depth of 20 cm. In this study the 137Cs inventories from 12 sampling points at the reference site in the northern part of the basin were used to account for the microscale spatial variability of this radionuclide, as reported by Đokić et al. [45].
In total, soil samples were collected at 34 locations following a 500 m grid as a general guideline, each extracted using a cylinder corer with a 10 cm diameter to a depth of up to 20 cm. However, the sampling locations in the grid were slightly adjusted to account for key factors influencing erosion intensity, including terrain topography, slope, soil type, geology, climatic conditions, and vegetation (Figure 1). These adjustments ensured that the selected points more accurately represented the variability and dynamics of erosion processes in the study area.

2.2. Soil Analysis

Topsoil samples, up to 20 cm in depth, were air-dried at room temperature. Stones, larger organic matter, and other non-soil materials were handpicked and disposed of. Such samples were subsequently sieved to obtain a fraction up to 2 mm appropriate for gamma-ray spectrometry. Activity concentrations of 137Cs in the soil samples were measured using a gamma-ray spectrometer (Baltic Scientific Instruments, Riga, Latvia) with a high-purity germanium (HPGe) detector of 65% relative efficiency and 1.74 keV energy resolution for 60Co at 1.33 MeV. The efficiency calibration was conducted before measuring soil samples, utilizing a mixed calibration source containing licensed reference materials. During this process the same geometry was maintained, ensuring quality assurance throughout. The measurements were taken over a live time of 7200 s, which resulted in a counting error of up to 10% for the radionuclide of interest, 137Cs. Data processing was performed using the SpectraLine (LSRM, Moscow, Russia) 1.6 software [52]. The activity concentrations of 137Cs were determined from the gamma-ray line at 661.6 keV and were then converted into inventories (Bq m−2) based on the soil bulk density.
Standard procedures were followed to conduct physicochemical analyses, including determining particle size distribution (coarse sand: 2.00–0.20 mm; fine sand: 0.20–0.05 mm; silt: 0.05–0.002 mm; and clay: <0.002 mm) (ISO 11277:1998(E)) [53], soil pH in water (ISO 10390:2021) [54], and electrical conductivity (ISO 11265:1994(E)) [55]. The water content (moisture) in air-dried soil samples was determined at 105 °C, following the ISO 11465:1993 [56]. The organic carbon (OC) and total nitrogen (N) content were determined by ISO 10694:2005 [57] and ISO 11261:2005 [58], respectively. The soil samples were analyzed for Al, Fe, Ca, Mg, K, and Mn content. Given the diversity of soil types, the metals included are among the most abundant in the soil and are linked to soil mineral composition. Thus, establishing the relationships between their content, other soil properties, and erosion rates helps understand soil type’s effects on erosion vulnerability. Samples were digested in aqua regia (SRPS ISO 11466:2004) [59], and metal concentration measurements were conducted using inductively coupled plasma-optical emission spectrometry (ICP-OES) on the Avio 200 instrument (Perkin Elmer, Waltham, MA, USA) according to ISO 22036:2024 [60].
The indicators of soil structure stability (OC/clay ratio and St) were calculated based on the results from the investigated locations. The physical properties of soil, such as water retention capacity and clay dispersibility, are better understood through the interaction between OC and clay content rather than by analyzing these characteristics individually [61]. Additionally, the susceptibility of soil to structural disintegration, referred to as St, was evaluated based on organomineral complexes, which are defined as soil organic matter (SOM) bound to the fine fractions of both silt and clay, calculated as follows [62]:
S t % = S O M C l a y + S i l t × 100
In Equation (1), a Van Bemmelen factor of 1.724 is used to convert the OC content into the SOM content.

2.3. Erosion Assessment Methods

Two models are used to estimate soil erosion rates in the investigated area: the profile distribution (PD) model and the revised universal soil loss equation (RUSLE) model. The details of the models and input parameters used in this study are given below.

2.3.1. The Profile Distribution (PD) Model

The PD model developed by Walling and He is widely applied to obtain assessments of soil redistribution (both erosion and deposition) rates based on the 137Cs inventories in uncultivated soils [63]. In the study area, a notable part of the 137Cs fallout input occurred after the 1986 Chernobyl disaster. Namely, it was found that only around one-fifth of the measured soils’ 137Cs inventories do not account for the Chernobyl-induced fallout activity [64,65,66]. On the other hand, there was no notable contribution to the total 137Cs inventory in Serbia due to the Fukushima accident at the beginning of 2011 [67].
In this study, the modified PD model was applied, which includes the abovementioned factors, namely the year 1986 as a substitute for 1963, which is associated with thermonuclear bomb tests’ maximum fallout (Equation (2)), written as follows:
Y = 10 t 1986 ln 1 X 100 h 0
where Y represents the annual soil loss (t ha−1 y−1), i.e., the erosion rate (with a negative value for an eroding point, having a lesser total 137Cs inventory compared to the reference value); t indicates the sampling year (yr); X represents the relative reduction in the 137Cs inventory against the local 137Cs reference value in %; and h0 is a coefficient named the profile shape factor, which reflects the depth of penetration of 137Cs into the soil [63,68], and its value increases with the penetration depth.
The percentage reduction in the 137Cs inventory X is calculated as in Equation (3):
X = A r e f A u A r e f 100
where Aref and Au represent the total 137Cs inventory measured at the reference and the sampling point (Bq m−2), respectively.
The profile shape factor h0 is calculated by fitting the simple undisturbed soil’s exponential function below (Equation (4)) to the obtained vertical distribution profile of 137Cs at the time of sampling at the reference site [68,69]. In many cases, for the undisturbed stable soil, this profile exhibits a simple exponential decline with depth (Equation (4)), written as follows [70,71]:
A x = A 0 e x / h 0
where A(x) represents the 137Cs activity concentration at mass depth x (Bq kg−1); A(0) is the 137Cs activity concentration of the surface soil (Bq kg−1); while x represents the mass depth relative to the soil surface (kg m−2).
The deposition rate R′ may be estimated using the following relationship (Equation (5)):
R = A e x t 0 t C d ( t ) e λ ( t t ) d t = A u A r e f t 0 t C d ( t ) e λ ( t t ) d t
where Aex is defined as the excess 137Cs inventory and Cd (t′) is the 137Cs concentration of deposited sediment.

2.3.2. The Revised Universal Soil Loss Equation (RUSLE) Model

The RUSLE [35] is an empirical model used in studies worldwide to estimate erosion rates [72,73,74]. Due to its applicability in different environments and efficiency in data provision and model parameterization costs, the RUSLE is the most widely used model in soil conservation and management. The RUSLE model can be described as follows (Equation (6)):
A = R × K × L S × C × P
where A is the average annual soil loss rate (t ha−1 y−1); R is the rainfall erosivity factor (MJ mm ha−1 h−1 year−1); K is the soil erodibility factor (t ha h ha−1 MJ−1 mm−1); LS is the topographic factor (dimensionless); C is the cover management factor (dimensionless); and P is the support practice factor (dimensionless).
The numerical value assigned to the R factor quantifies the raindrop impact and accounts for the potential runoff volume and rate resulting from the rainfall [36,75]. Traditional approaches for calculating the R factor typically rely on extensive rainfall data, frequently unavailable in many areas. In the study area, the following equation (Equation (7)) provided by Đokić was used to estimate annual precipitation (P) based on altitude (H) [50]:
P = 243.06 ln H 741.19
For precipitation calculations, the advanced land observing satellite digital elevation model (ALOS DEM) was used, initially at 12.5 m resolution, resampled to 10 m. Digital elevation model (DEM) was converted from ellipsoidal heights to the EGM96 vertical datum to ensure our elevation data accurately reflects the mean sea level. The R factor was calculated according to Van et al. model (Equation (8)), written as follows [76]:
R = a P
where a factor is 1.3 and P is the annual precipitation (mm).
The K factor indicates the soil’s ability to resist erosion caused by the impact of raindrops, and the rate and volume of runoff generated for that rainfall under standardized conditions [77]. In this study, the K factor is calculated using a model developed by Williams as follows (Equations (9)–(13)) [78]:
K U S L E = f c s a n d f c l s i f o r g c f h i s a n d
f c s a n d = 0.2 + 0.3 e x p 0.256 m s ( 1 m s i l t 100 )
f c l s i = m s i l t m c + m s i l t 0.3
f o r g c = 1 0.25 o r g C o r g C + e x p 3.72 2.95 o r g C
f h i s a n d = 1 0.7 1 m s 100 1 m s 100 + e x p 5.51 + 22.9 1 m s 100
where KUSLE is the soil erodibility factor; fcsand (coarse sand factor) is function of the high coarse sand content of the soil; fcl-si (clay-to-silt ratio factor) is a function of the clay and silt of the soil; forgc (organic carbon factor) is a function of the organic carbon content of the soil; fhisand (high sand content factor) is the function of the high sand fraction content (0.05–2.00 mm diameter) in the soil ms (%, Table S2); msilt is the silt fraction content (0.002–0.05 mm diameter) (%); mc is the clay fraction content (<0.002 mm diameter) (%); and orgC is the organic carbon content (%, Table S2).
The LS factor includes the slope length factor (L) and the slope steepness factor (S). The LS factor was calculated using ALOS DEM with a resampled resolution of 10 × 10 m through the methodology proposed by Moore et al. using SAGA 7.8.2. [79]. A sink fill algorithm based on Wang and Liu was used to remove surface depressions in the digital elevation model before LS calculation [80].
The C factor reflects how different types of land cover influence the soil’s protection against erosion. The value of the C factor is directly influenced by vegetation type, its growth stage, and the percentage of ground covered by the vegetation [77]. In this study, the C factor values are assigned to all land use types based on the values cited in the literature [81]. The ESA WorldCover dataset with a 10 m resolution based on Sentinel-1 and Sentinel-2 data was used for land cover input [82]. Field observations were conducted at every sample site for cases where the classifications according to the ESA WorldCover dataset and our sampling locations differed. The C factor for sampling locations was modified based on direct observations and accurate terrain data to reflect current conditions.
The P factor is the ratio of soil loss after soil conservation measures to the amount of soil loss without any soil conservation measures [83,84].

2.4. Data Analysis

The basic statistics included the analysis of central tendency, variability, and normality. As skewness and kurtosis values indicated the data’s deviation from a normal distribution, the correlation analysis was conducted using log-transformed data. The Pearson correlation was used to examine the strength of relationships between the analyzed variables. To investigate how variations in physiographic factors (altitude, slope, geology, soil type, and land cover) impact erosion rates, a one-way Welch’s analysis of variance (ANOVA) was performed. This was followed by Games–Howell pairwise comparison tests to evaluate the differences among the means of the various groups. All statistical analyses were performed using R version 4.3.1 [85].

3. Results

3.1. Physiographic Properties of the Sampling Locations

The detailed physiographic data for each sampling location can be found in Table S1. The distribution of sampling points based on geology is as follows: 15 sites are situated on clastic Permian sediments, 11 on Miocene lacustrine sediments, 5 on Pliocene and Quaternary lacustrine sediments, and 3 on limestone. In terms of soil types, Haplic Cambisols are the most dominant, found at 15 locations, followed by Vertisols at 10 locations, Regic Anthrosols at 4 locations, Mollic Leptosols at 3 locations, and Rendzic Leptosols at 2 locations.
Vegetation cover at the sampling sites varies, with grasslands of different densities found at 16 locations, forests at 15 locations, and shrubs at 3 locations.
The slopes of the sites range from 3° to 23°, with an average of 12°. Additionally, the altitude ranges from 303 to 673 m above sea level, with an average altitude of 485 m (Table 1).

3.2. Physicochemical Properties of the Soil Samples

Table S2 encapsulates the physical and chemical properties of the soil. The soil across different locations within the Crveni Potok catchment demonstrates significant variations in the percentage composition of individual particle size fractions. The Coefficient of Variation (CV), calculated as the ratio of the standard deviation to the mean, indicates that the most notable variations occur in the clay (CV = 49.32%) and fine sand (CV = 48.66%) fractions. In the lower part of the study area, soils predominantly exhibit finer textures, such as clay and clay loam (Table S2). In contrast, the upper section is mainly characterized by silty loam, loam, and occasionally sandy loam textures. The ability of these soils to retain moisture varies widely, as evidenced by the water content measured at 105 °C, which ranges from 0.9% to 6.3%, resulting in a CV of 51.93%.
The soil pH values ranged from 4.6 to 8.6, with a CV of 18.59%. Based on the general interpretation of soil pH measured in a 1:5 soil/water ratio [86], the soil pH values in the study area can be categorized as very strongly acidic (pH 4.5–5.0; five samples), moderately acidic (pH 5.6–6.0; three samples), slightly acidic (6.1–6.5; nine samples), neutral (6.6–7.3; four samples), mildly alkaline (pH 7.4–7.8; one sample), moderately alkaline (pH 7.9–8.4; seven samples), and strongly alkaline (pH 8.5–9.0; five samples). Acidic soils, specifically Haplic Cambisol and Regic Anthrosol, were commonly found in forested areas.
Electrical conductivity (EC) values varied from 3 mS m−1 to 13 mS m−1 across different soil samples, resulting in a CV of 47.61%. Salinity rating based on the EC measurements taken at a 1:5 soil-to-water ratio and soil texture related to clay content [86] indicates that soils have very low (28 samples) and low salinity (6 samples).
The soils also showed varying levels of organic carbon (OC) and total nitrogen (N), with CVs of 36.20% for OC and 36.93% for N. The recorded OC values ranged from 0.900% to 5.027%, while N values ranged from 0.110% to 0.541%. According to the classification of OC levels in the topsoil horizon [87], most samples (30) exhibited medium levels of OC (2.0% to 6%), while three samples had low levels (1.0% to 2%), and one sample had a very low level (less than 1% OC). The OC/N ratio, which indicates organic matter turnover and nitrogen availability, fluctuated between 8.2 and 18.3 (CV = 19.16%).
In the study area, the mean concentrations of elements in the surface soil (Table 1) displayed that the most abundant ones were Fe, Ca, and Al, with mean concentrations of 30,780 mg kg−1, 23,480 mg kg−1, and 23,310 mg kg−1, respectively. Next, Mg was found at a mean concentration of 6460 mg kg−1, K at 3780 mg kg−1, and Mn at 773 mg kg−1. Iron exhibited the least variability among the selected elements (CV = 27.25%), while Ca showed the most significant variability (CV = 178.5%).

3.3. Soil Indices for Assessing Structural Quality and Susceptibility to Erosion

Aggregate stability is a relevant indicator of soil vulnerability to runoff and erosion [88]. Improved aggregation of soil particles rich in OC enhances soil structure, making it less prone to compaction and more stable in water [61]. By examining the relationship between soil organic matter and the content of fine-sized particles (clay or clay + silt) in soils with a known structural condition, including poorly structured and/or eroded ones, soils with adequate organic matter were distinguished from those that have lost their structure and are highly susceptible to erosion [62,89].
The calculated values of the indicators by location are given in Table S3. The mean OC/Clay ratio in the study area was 0.156 (Table 1). This ratio varied from 0.022 to 0.399, highlighting the complexity and diversity of soil composition and stability in the catchment, as indicated by a high coefficient of variation (CV = 70.16%).
Research has demonstrated that the OC/Clay ratio can effectively differentiate soils with varying structural quality. Values of 1/8, 1/10, and 1/13 are proposed thresholds for classifying soil structural conditions as very good, good, moderate, and degraded [61,89]. While the validity of these thresholds was challenged in a study by Johannes et al. [90], which primarily examined agricultural soils, it was confirmed that a decline in soil structure correlates with a decrease in the OC/Clay ratio, with the 1/8 ratio representing an average for soils considered to have very good structure.
Out of 34 samples from the Crveni Potok catchment, the soil at 17 locations exhibited an OC/Clay ratio greater than 1/8, indicating a very good structure. Most of these soils (13 samples) were collected in forested areas (Tables S1 and S3). In contrast, the OC/Clay ratio was lower than 1/13 at 10 grassland and one shrubland location. The results indicate the significant influence of land use on the OC/Clay ratio. Among various factors, such as land use, average annual precipitation, major soil groups, pH levels, flood risk, and topsoil depth, land use was identified as the primary factor influencing the variance of the OC/Clay ratio in the soils of England and Wales [89].
The St varied between 2.3% and 11.9% (CV = 35.4%) with a mean of 7.6. The St level of 5% was set as an empirical critical limit, below which a loss of structure leads to a great susceptibility to erosion [62]. Furthermore, St values between 5% and 7% are recommended as indicators of soil instability and heightened risk of structural decline. Conversely, soils with a St greater than 9% are not considered at immediate risk. Based on this St classification, the soil at six locations was physically degraded, 16 samples could be classified as at risk, and 12 as soils with stable structure at no immediate risk. Notably, all areas where soil has lost its structural integrity are covered with grass.

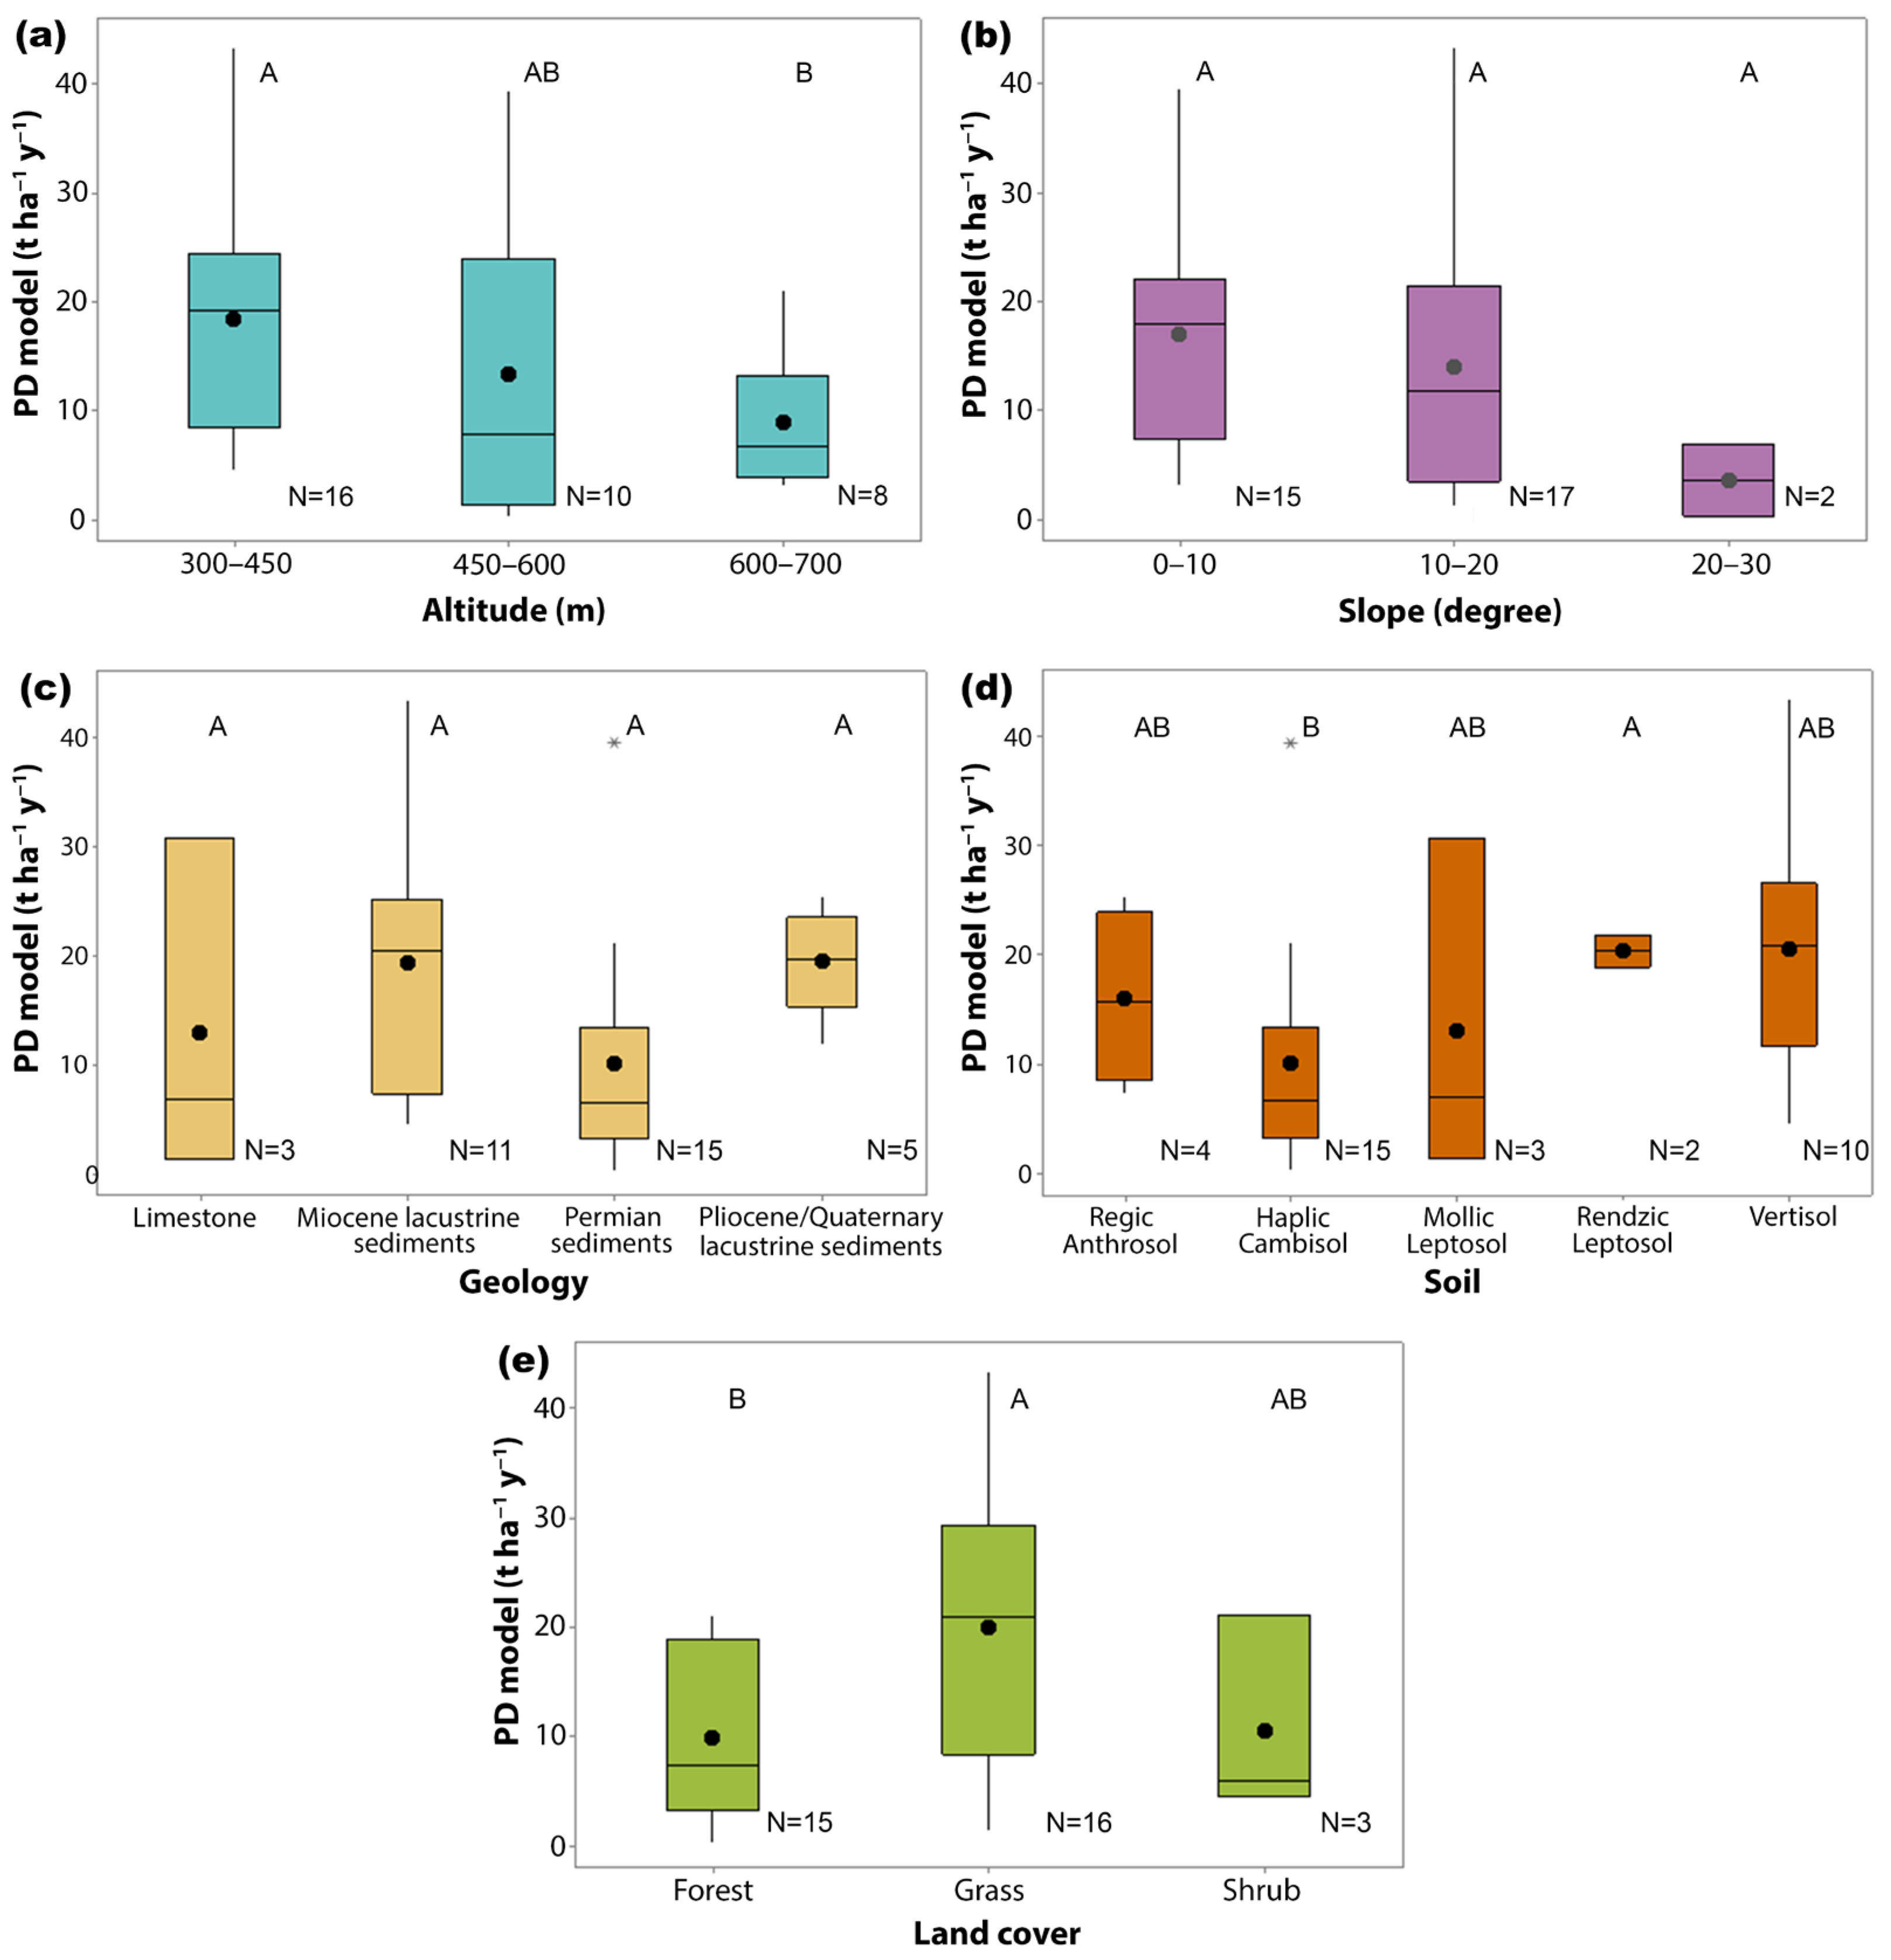
3.4. Soil Erosion Rates Estimated by the PD Model and Relationships with Physiographic Factors

The activity concentrations of 137Cs and the soil erosion rates calculated using the PD model are presented in Table S3. The mean activity of 137Cs across the study area was 15.0 Bq kg−1 (Table 1). The CV is 46.47%, indicating high variability among locations within the Crveni Potok catchment, with values ranging from 3.4 Bq kg−1 to 27.6 Bq kg−1. No signs of soil deposition were observed, as the 137Cs inventories at the investigated grid points were lower than those at the reference site [45].
Based on the measured 137Cs activities and using Equation (2), the PD model estimated erosion intensities from 0.4 to 43.3 t ha−1 y−1, with a CV of 75.75%. The mean erosion rate was found to be 14.7 t ha⁻1 y⁻1, which is slightly lower than the mean erosion rate of 16 t ha⁻1 y⁻1 reported by the same methodology in gullies located in the upper part of the study area [45,46].
In terms of erosion rate classifications used by the European Union (low: <5 t ha−1 y−1; moderate: 5–10 t ha−1 y−1; and severe: >10 t ha−1 y−1) [91], the study area included 9 locations characterized by low erosion intensity, 5 with moderate, and 20 with severe erosion intensity.
The impact of variations in physiographic factors on the erosion rates derived from the PD model was analyzed using ANOVA (Figure 2). Although erosion rates show high variability within individual classes of factors, the ANOVA test followed by a pairwise comparison test revealed some significant differences between the classes. In each panel of Figure 2, different letters (i.e., A and B) indicate groups with significantly different means. Conversely, groups that share at least one letter (e.g., A and AB and AB and B) are not significantly different from each other at the p < 0.05 significance level.
The mean values of erosion rates decreased with elevation (Figure 2a), demonstrating a significant difference between the lowest elevation range (300–450 m) and the highest range (600–700 m). Similarly, the mean erosion rate was lower for steeper slopes (20–30°) than those on slopes up to 20° (Figure 2b). However, the difference across these slope categories was not statistically significant, likely due to the limited number of data points, which makes reliable conclusions difficult.
No significant differences were observed when comparing groups with different geological compositions (Figure 2c). The lowest mean erosion rate was associated with Permian sediments. The distribution of erosion rates among different soil groups (Figure 2d) revealed that Haplic Cambisol, formed on consolidated Permian sediments, had a lower mean erosion rate than soils developed on unconsolidated sediments. The difference between the Haplic Cambisol and Rendzic Leptosol groups was significant.
Finally, the vegetation cover type at sampling locations influenced the estimated erosion rates (Figure 2e), revealing a significant difference between forested areas and grasslands. The lowest erosion rates were measured in forested areas, followed by shrublands, with the highest rates observed in locations with grassland cover. Moreover, the variability of erosion rates in forested areas was much lower than in grasslands.

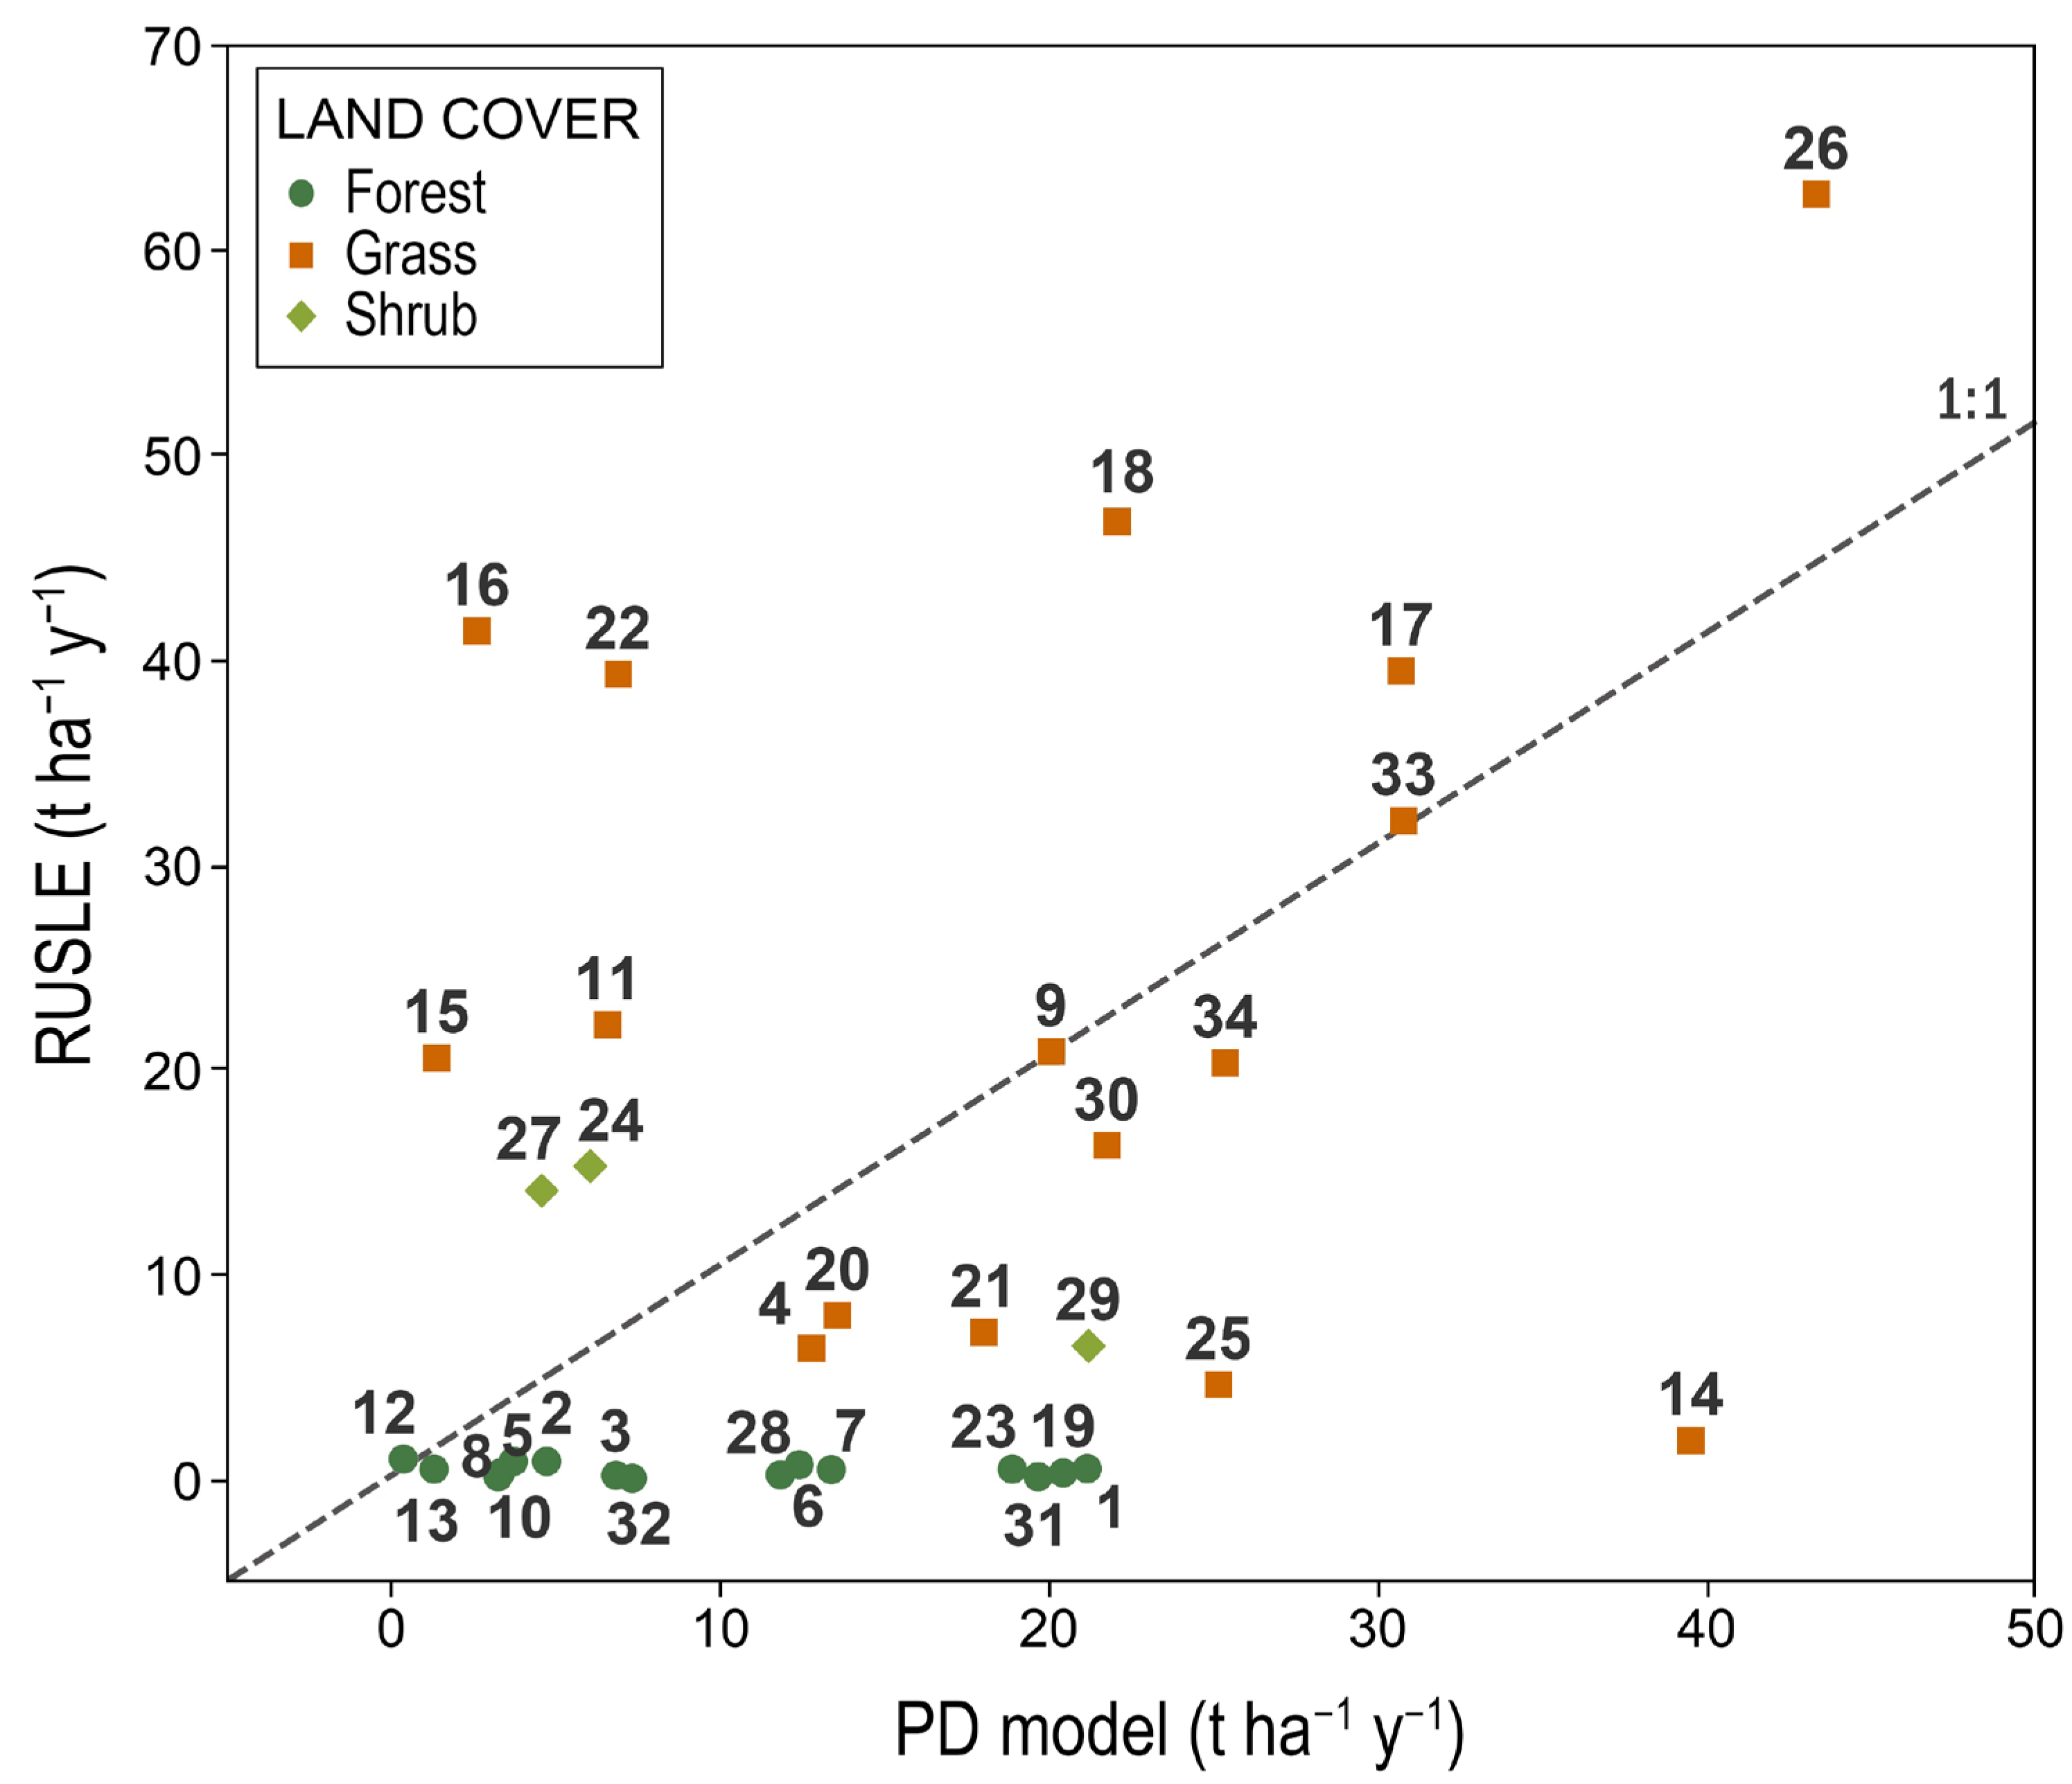
3.5. Soil Erosion Rates Estimated by the RUSLE Model

Figure 3 shows raster maps for RUSLE model factors, including rainfall erosivity (R-factor), soil erodibility (K-factor), slope length and steepness (LS-factor), cover management (C-factor), and support practices (P-factor). The P factor was set to a value of 1.0 across the entire study area based on the observation that no specific soil conservation practices are currently implemented. The resultant soil loss map, derived from integrating these factors, provides a detailed visualization of the potential soil erosion across the area. This map highlights the spatial distribution of soil loss, identifying areas with varying erosion intensities, from low to severe, and offering valuable insights for land management and soil conservation planning.
The RUSLE model predicted erosion rates at investigated locations (Table S3) ranged from 0.1 to 62.7 t ha−1 y−1, scoring a CV of 130.3% (Table 1). The mean value of 12.7 t ha−1 y−1 was close to the one predicted by the PD model (14.7 t ha−1 y−1), but the median value was significantly lower (5.5 t ha−1 y−1 vs. 13.1 t ha−1 y−1, respectively (Table 1)). Following the classification of erosion intensities [91], low-intensity erosion was anticipated at 17 locations, moderate at 4, and severe at 13 locations.

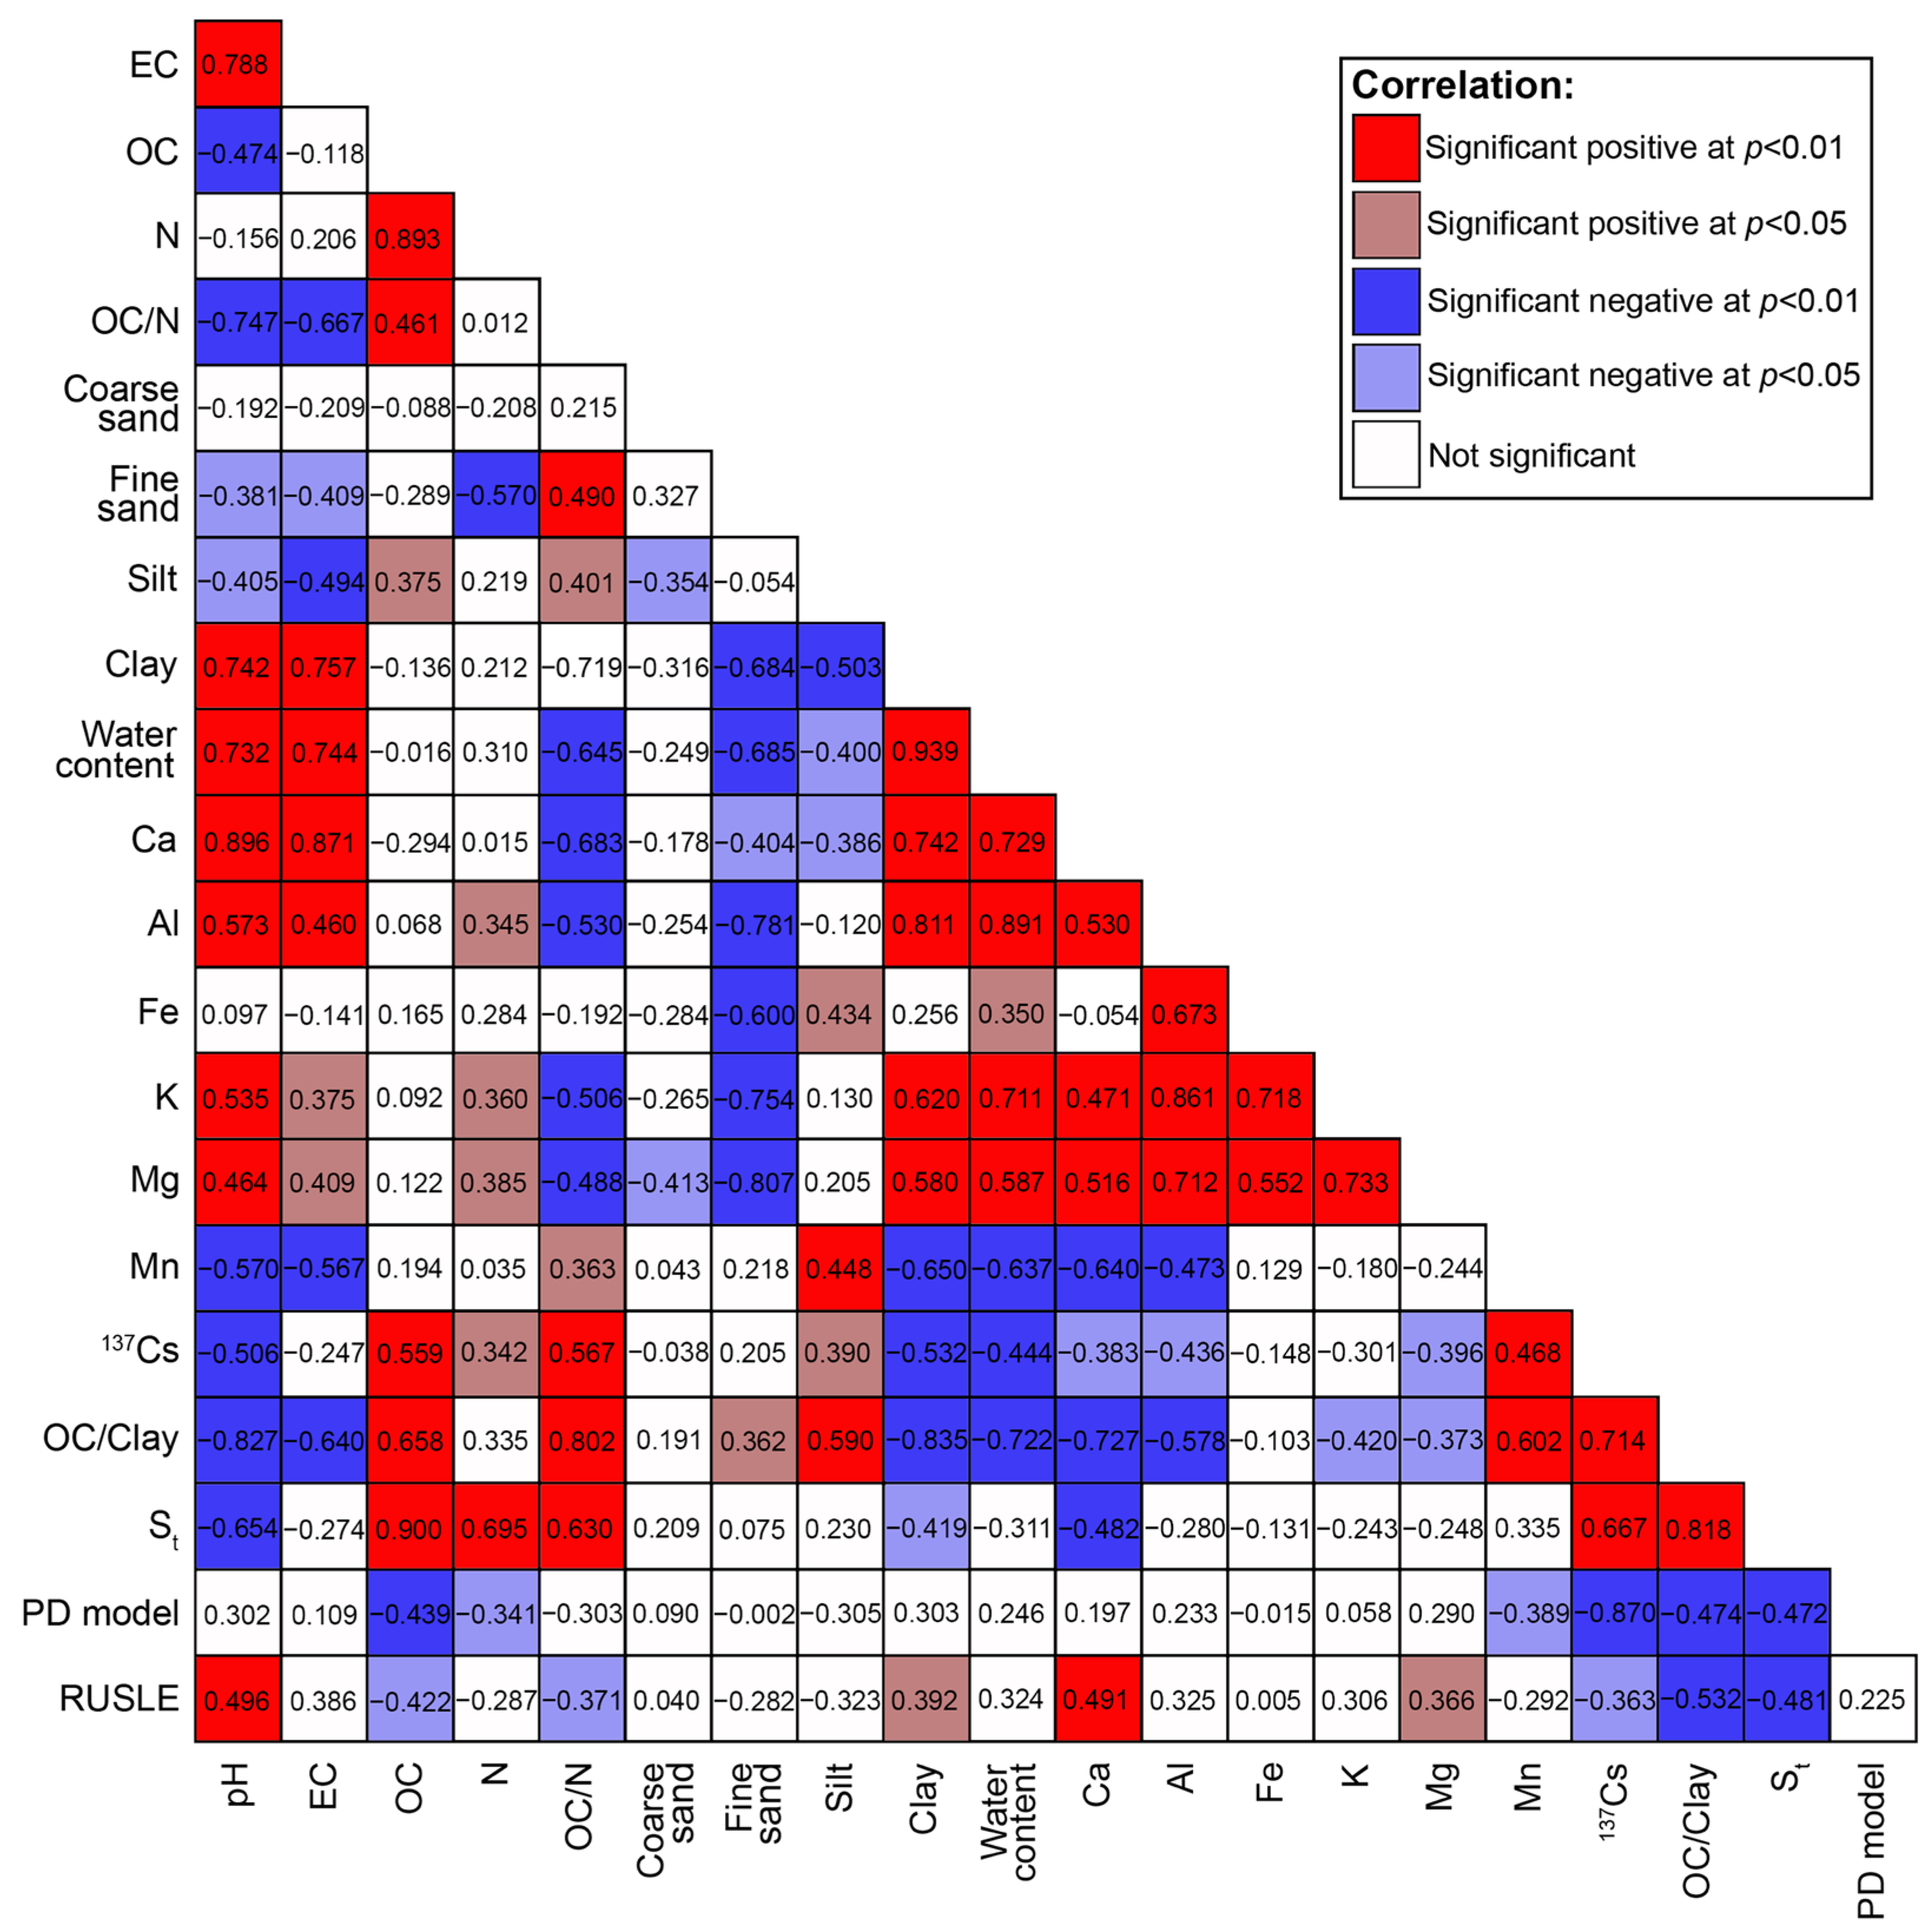
3.6. Correlation of Estimated Soil Erosion Rates with Soil Physicochemical Properties and Indicators of Soil Structural Stability

The associations between soil properties, indices of soil stability, and soil erosion rates, tested using Pearson’s correlation coefficients, are presented in Figure 4.
In the study area, the mass activities of 137Cs showed significant positive correlations with OC, N, the OC/N ratio, and the silt fraction. Additionally, there was a positive correlation between 137Cs and Mn concentration, which aligns well with the observed association between Mn-rich minerals and the silt fraction. Conversely, 137Cs activity had a significant negative correlation with clay content. This finding was reinforced by a negative correlation of 137Cs with water content and, specifically, the Al, a common element in the crystal lattice of clay minerals. Additionally, the clay fraction increased significantly with a higher Ca and Mg content and soil pH, demonstrating a high presence of clay-sized particles in carbonate-rich soil. Meanwhile, 137Cs activity concentrations were in a strong negative correlation with these parameters.
Overall, soil texture and organic matter are the primary factors influencing the concentration of 137Cs in the topsoil of the Crveni Potok catchment. The interaction between 137Cs and soil occurs primarily through cation exchange sites with varying specificity and reversibility, mainly involving organic matter and clay minerals [92]. The strong covariance of OC and 137Cs arises from similar transportation pathways during soil redistribution along the sloping terrains [93]. Positive correlations between 137Cs and OC have been detected in eroding soils across different types and land uses, including forests [94,95,96], uncultivated areas [97], abandoned farming sites [96], and certain cultivated soils [98,99,100,101]. The relationship between the activity of 137Cs and different particle size fractions is complex and influenced by specific local conditions such as soil type and structure and the extent of erosion. Studies have shown both positive correlations with clay [99] and negative correlations [38], while other research indicates a positive correlation with both silt and clay fractions [102].
Erosion rates estimated using the PD model, based on 137Cs activities, demonstrated a significant negative correlation with OC, N, and Mn content in the soil (Figure 4). Areas with high erosion rates are at risk of not only a further decline in organic matter content but also changes in the composition of OC fractions in the remaining soil. Water erosion tends to selectively increase the proportion of mineral-associated organic matter while decreasing the proportion of lighter particulate organic matter [103,104]. Moreover, a recent analysis examining how soil nitrogen concentration and composition respond to varying erosion intensities confirmed that erosion diminishes total nitrogen content in eroded areas and alters the composition of dissolved nitrogen, ultimately reducing its availability [105]. Erosion rates tended to increase with higher clay and lower silt content in the soil, but these trends were not statistically significant. Furthermore, the correlation between PD-derived erosion rates and the investigated elements’ content was not significant, except for Mn. A notable negative correlation with Mn-rich minerals seems to arise from Mn’s association with the silt fraction. Haplic Cambisol with silt and silt loam texture was characterized by notably higher Mn concentrations than soils with finer textures (Table S2). This underlines the impact of soil type on erosion intensity and supports the findings from Figure 2d.
Soil structure stability indicators displayed a significant (p < 0.01) positive correlation with 137Cs activity concentrations and, consequently, a negative correlation (p < 0.01) with the PD model estimates (Figure 4). This shows that the predictions of the PD model and the values of physicochemical indicators of soil structural quality align in identifying endangered sites. Likewise, a significant correlation has been reported between soil redistribution rates estimated by 137Cs and St in croplands within a semi-humid region [106].
In our study area, the OC/Clay ratio and the St were negatively correlated with the soil pH. Such a relationship results from higher OC and lower clay content in the upper part of the catchment, predominated by acidic forest soil (Tables S1 and S2). An increase in the OC/Clay ratio in acidic soils, particularly those with a pH below 5, has been previously observed in permanent grass and woodland areas [89].
Erosion rates estimated by RUSLE were significantly positively correlated with clay fraction and clay fraction-associated parameters pH, Ca, and Mg, while presenting negative correlations with 137Cs, OC, OC/N, OC/Clay, and St. The OC/N ratio serves as a meaningful proxy of organic matter quality and the composition of the soil microbial community [107]. Unlike particulate organic matter, mainly composed of plant residues with low N content, mineral-associated organic matter consists of low molecular weight organic compounds with higher N content [108]. The association of this fraction with minerals makes it less vulnerable to disturbance. Therefore, the significant reduction in the OC/N ratio with increased erosion intensity supports the dominance of the more stable mineral-associated organic matter over the particulate organic fraction in areas experiencing severe erosion by water.
The linear relationships observed among all examined parameters and predictive models are consistent in direction, although they vary in strength (Figure 4). The RUSLE estimates demonstrate a stronger correlation with the OC and clay content since these data were incorporated within the model. Finally, the correlation of log-normalized data for the PD and RUSLE model estimates shows a positive trend; however, it is not statistically significant at p < 0.05.

4. Discussion

Our findings are consistent with the observed intensity of erosion in semi-arid environments. The erosion rates estimated using the 137Cs method reach 39 t ha–1 yr–1 on a Mediterranean coast [109] and even 116 t ha–1 yr–1 in an agricultural area of a watershed in Turkey [110]. Considering different methods, numerous studies [109,110,111,112] have shown that higher soil erosion rates can be observed when using the 137Cs method compared to the RUSLE model. Using both methods, the highest values of erosion rates were obtained for croplands and the lowest for forested areas. However, other local factors can affect large variability in forest erosion rates [113]. In mountainous regions of Europe, the results obtained from the universal soil loss equation (USLE) are similar in magnitude to those based on 137Cs across land use types, except for hayfields and pastures lacking dwarf shrubs, where the USLE underestimated erosion intensity [114]. In contrast, erosion and sedimentation rates estimated by the USLE, RUSLE, and 137Cs were completely different in a watershed in Brazil [115].
A comparison of the PD and RUSLE model results can provide essential insights into soil erosion dynamics in our study area. Although the PD model, by definition, accounts for all types of erosion, its estimates could be compared with those from the RUSLE, focusing solely on water erosion, as water is the only erosion agent in the study area. After conducting a correlation analysis on the log-normalized data (Figure 4), the original data were analyzed to compare erosion rates obtained from both approaches in meaningful real-world units. The correlation was weakly positive (r = 0.372) and statistically significant at p < 0.03, indicating that both models identify similar erosion trends, although their quantitative outputs do not always align (Figure 5).
The comparison reveals a discrepancy in the upper area of the Crveni Potok catchment covered with forest vegetation, with the nuclear method showing predominantly higher erosion rate values. This difference arises from the two methods’ distinct temporal and spatial perspectives. Namely, the 137Cs method offers an insight into the long-term erosion rate since the Chernobyl nuclear accident in 1986, encompassing decades of varying land use and vegetation cover. Historically, the area was characterized by sparse grass and shrub vegetation, which provided limited protection against erosion and facilitated intense gully erosion, exacerbated by heavy grazing, primarily by goats [45]. Over time, natural vegetation succession led to the establishment of dense forests and thick grasslands, stabilizing the soil and significantly reducing active erosion. The gully systems, once a major contributor to sediment transport, have largely transitioned into a dormant phase. Consequently, the 137Cs method reflects the historical dynamics of soil redistribution and captures changes over time.
In contrast, the RUSLE model estimates erosion rates based on present-day land cover and vegetation (low C-factor, indicating lower vulnerability to erosion hazards), which now effectively protects the soil in most parts of the area. Despite the area’s steep slopes and substantial rainfall, the dense vegetation mitigates surface runoff and limits the detachment and transport of soil particles. This results in much lower erosion rates predicted by RUSLE, as it does not account for the historical phases of land use and erosion intensity that significantly influenced the long-term sediment budget. This comparison underscores the importance of considering historical and contemporary factors to comprehensively assess erosion dynamics and the interplay between land use, vegetation changes, and soil stability.
The limitations of the RUSLE model are evident, as it does not account for gully erosion processes [116,117,118]. This is particularly significant in the forested areas of the upper part of the Crveni Potok catchment, where gully erosion is a major contributor to overall topsoil degradation by water [46]. Due to its inability to model soil loss caused by gravity flow [119], the RUSLE model may significantly underestimate actual soil loss rates.
An exception to this common trend of RUSLE estimates is observed at two sampling locations characterized by grass vegetation rather than forest cover. At sampling location 9, the erosion rates are nearly the same (20.1 by PD and 20.9 t ha−1 y−1 by RUSLE), and at sampling location 11, the erosion rate predicted by the RUSLE method is higher (22.2 t ha−1 y−1) than that obtained from the 137Cs method (6.6 t ha−1 y−1).
In the lower part of the catchment, the 137Cs method indicates higher erosion rates at several locations (19, 23, 28, 31, and 32) covered by forest, compared to the RUSLE model. This can be explained by the proximity to human settlements, where, in the past, vegetation was sparse and often controlled by human activity. With fewer people in the area today, vegetation is gradually regrowing, including denser forest cover. At sampling locations 22 and 15, the 137Cs method indicates a significantly lower erosion rate (6.9 t ha−1 y−1 and 1.4 t ha⁻1 y⁻1) compared to the value estimated by the RUSLE model (39.3 t ha−1 y−1 and 20.6 t ha⁻1 y⁻1). The RUSLE method, considering the steep terrain and sparse vegetation, predicts a high erosion rate, which seems unrealistic due to the shallow depth, slow formation of soil on limestone, and the limited amount of soil that can be eroded. In these cases, the RUSLE method probably overestimates the erosion rate.
In grassland areas, the calculation showed mean erosion rates of 20.03 t ha−1 y−1 and 24.41 t ha−1 y−1 and the median values of 19.52 t ha−1 y−1 and 20.74 t ha−1 y−1 for the PD and the RUSLE models, respectively. Despite the agreement of mean and median values, the outputs of the two models still differed in absolute values (Figure 5).
The extreme values in erosion predictions derived from the RUSLE model can primarily be attributed to its strong association with the LS factor. The RUSLE model, which directly incorporates topographic factors into its calculations, is very sensitive to changes in slope characteristics [120], and the LS factor can overestimate soil erosion in complex topographies [121]. Similarly, there is often a lack of detailed, site-specific rainfall amount and intensity data, which are critical for calculating the rainfall erosivity (R) factor. The absence of such precise information introduces uncertainties in the model’s predictions. The observed differences in predictions obtained by PD and RUSLE models also arise from their distinct conceptual frameworks (relying on the vertical distribution of 137Cs within a soil profile related to the soil characteristics vs. an empirical model based on several external parameters that are not always field-based and/or reliable) and the estimates they provide (gross erosion rates vs. net erosion rates not considering the sediment yield).
The comparison of estimated erosion rates with soil conditions is a practical way for model verification and agreement checking [115]. Soil structure is a key factor affecting water retention and infiltration, gas exchange, soil organic matter and nutrient dynamics, root penetration, and erosion susceptibility [122]. Various mineral and organic agents contribute to soil aggregation and structure preservation. The rearrangement of particles, flocculation, and cementation are the main drivers for soil particle aggregation, facilitated by SOM, biota, clay, Fe- and Al-(hydr)oxides, and carbonates [123,124].
In our study area, both investigated models were negatively correlated with structural stability indicators (Figure 4). Lower St and OC/clay values are generally found in the lower part of the study area, which is characterized by higher erosion rates. The high clay and silt and low SOM content in this area contribute to the soil’s increased susceptibility to sealing [125]. Surface sealing and the resulting crusting are recognized as significant forms of soil degradation, primarily driving runoff and promoting inter-rill soil erosion. The formation of a thin layer at the soil surface reduces porosity and increases resistance to penetration, for which the St value serves as a valuable indicator [126]. The St shows a significant positive correlation with saturated hydraulic conductivity and a negative correlation with bulk density and penetration resistance [127].
Conversely, higher SOM levels contribute to soil stability in the upper parts. The interaction of OC with the surface of mineral particles through sorption on pedogenic oxides, clay minerals, and by co-precipitation with polyvalent cations is an effective mechanism of soil stabilization [128]. In addition, the increase in SOM content reduces susceptibility to erosion by altering pore size distribution, providing higher air-filled porosity and water-holding capacity [129]. High SOM content protects the soil aggregates by creating a hydrophobic coating and inhibits slaking and swelling, which destroys the soil structure.
Notably, both models and indicators of soil structure stability agree that location 26 is the most severely affected by erosion, where measures for soil quality and erosion control should be prioritized.
The study underscores the importance of high-resolution and precise terrain data for the accuracy of RUSLE outputs, which can be obtained through advanced non-terrestrial methods such as drone surveys or light detection and ranging (LiDAR) technology. Further study limitations stem from the inherent assumptions of the methods themselves, such as the PD model’s inability to account for the time-dependent nature of 137Cs fallout input and its post-fallout redistribution within the soil profile or the RUSLE method’s exclusion of sediment yield. However, the combined use of these methods enhances the reliability of their outputs and provides valuable information on the most vulnerable areas. Evaluating the association of PD and RUSLE outputs with soil stability indicators across different geological, hydrological, and climatic conditions in future research will enhance the reliability of the study’s initial findings.

5. Conclusions

Predictions from the PD model indicate that severe erosion impacts 20 out of 34 locations in the study area. Significant influences from elevation, soil type, and land cover have been identified. Erosion rates were negatively correlated with the content of organic matter and the soil aggregate stability indicators. This supports the model’s findings by providing evidence of actual soil conditions and vulnerability to erosion. Increased susceptibility to erosion detected in the lower part of the basin was affiliated with predominant grass and sparse shrub vegetation, clay and clay loam soils, and low organic matter content failing to effectively stabilize soil aggregates. Adopting enhanced forest management practices is essential for effectively mitigating soil erosion in this area. This includes implementing measures to prevent deforestation and actively promoting reforestation to increase organic matter levels and enhance soil stability.
The research contributes to promoting the value of the 137Cs method even over very complex terrains and the usefulness of model predictions for further assessing the combined influence of various factors on the erosion process. Comparing the results of the PD and RUSLE models proved helpful for understanding the erosion process from the distinct assumptions of the models. Furthermore, assessing soil conditions by structural stability indicators can help users and decision-makers adjust their practices and effectively direct efforts to reduce erosion intensity. Once these indicators are established, they can facilitate tracking changes in soil vulnerability over time, particularly concerning soil erosion and the effectiveness of erosion control measures.

Supplementary Materials

The following supporting information can be downloaded at https://www.mdpi.com/article/10.3390/w17040526/s1: Table S1: Coordinates of sampling locations with information on corresponding altitude, slope, geology, soil type, and land cover; Table S2: Physicochemical properties of the soil at sampling locations, including particle size distribution, water content, pH, electrical conductivity (EC), organic carbon (OC), total nitrogen (N), and concentrations of selected metals (Ca, Al, Fe, K, Mg, and Mn); Table S3: Activity concentrations of 137Cs, soil erosion rates estimated using profile distribution (PD) and revised universal soil loss equation (RUSLE) model, and soil structure stability indicators (OC/Clay and St) for each location.

Author Contributions

Conceptualization, A.Č., I.S. and S.D.; methodology, A.Č., I.S., M.M., B.G. and S.D.; validation, I.S., M.M. and S.D.; formal analysis, A.Č., I.S., M.M., M.J., B.G. and S.D.; investigation, A.Č., I.S., M.M., M.Đ. (Mrđan Đokić), M.M. and D.T.; resources, I.S., B.G. and S.D.; writing—original draft preparation, A.Č., I.S., M.M., M.Đ. (Mrđan Đokić), R.D., M.G. and S.D.; writing—review and editing, A.Č., I.S., B.G. and S.D.; visualization, I.S., M.M., M.Đ. (Mrđan Đokić), M.Đ. (Milan Đorđević) and M.J.; supervision, I.S. and S.D.; project administration, S.D.; funding acquisition, A.Č., I.S., M.Đ. (Mrđan Đokić), R.D., M.Đ. (Milan Đorđević), M.G., M.J., D.T., B.G. and S.D. All authors have read and agreed to the published version of the manuscript.

Funding

This research was supported by the Science Fund of the Republic of Serbia (grant No. 7047), Development of erosion prediction tool for sustainable soil management-Predict-Er. This paper was also supported by the Ministry of Science, Technological Development and Innovation of the Republic of Serbia (contracts 451-03-136/2025-03/200017, 451-03-137/2025-03/200124, and 451-03-137/2025-03/200116).

Data Availability Statement

The datasets generated during the current study are available upon request.

Conflicts of Interest

The authors declare no conflicts of interest. The funders had no role in the design of the study; in the collection, analyses, or interpretation of data; in the writing of the manuscript; or in the decision to publish the results.

Abbreviations

The following abbreviations are used in this manuscript:
PDProfile Distribution
USLEUniversal Soil Loss Equation
RUSLERevised Universal Soil Loss Equation
ALOS DEMAdvanced Land Observing Satellite Digital Elevation Model
CVCoefficient of Variation
SOMSoil Organic Matter
OCOrganic Carbon

References

  1. Cao, Y.; Ouyang, Z.Y.; Zheng, H.; Huang, Z.G.; Wang, X.K.; Miao, H. Effects of Forest Plantations on Rainfall Redistribution and Erosion in the Red Soil Region of Southern China. Land Degrad. Dev. 2008, 19, 321–330. [Google Scholar] [CrossRef]
  2. Kayet, N.; Pathak, K.; Chakrabarty, A.; Sahoo, S. Evaluation of Soil Loss Estimation Using the RUSLE Model and SCS-CN Method in Hillslope Mining Areas. Int. Soil Water Conserv. Res. 2018, 6, 31–42. [Google Scholar] [CrossRef]
  3. Hou, D.; Bolan, N.S.; Tsang, D.C.W.; Kirkham, M.B.; O’Connor, D. Sustainable Soil Use and Management: An Interdisciplinary and Systematic Approach. Sci. Total Environ. 2020, 729, 138961. [Google Scholar] [CrossRef] [PubMed]
  4. Quinton, J.N.; Fiener, P. Soil Erosion on Arable Land: An Unresolved Global Environmental Threat. Prog. Phys. Geogr. 2024, 48, 136–161. [Google Scholar] [CrossRef]
  5. Berhe, A.A.; Barnes, R.T.; Six, J.; Marín-Spiotta, E. Role of Soil Erosion in Biogeochemical Cycling of Essential Elements: Carbon, Nitrogen, and Phosphorus. Annu. Rev. Earth Planet. Sci. 2018, 46, 521–548. [Google Scholar] [CrossRef]
  6. Karlen, D.L.; Mausbach, M.J.; Doran, J.W.; Cline, R.G.; Harris, R.F.; Schuman, G.E. Soil Quality: A Concept, Definition, and Framework for Evaluation (A Guest Editorial). Soil Sci. Soc. Am. J. 1997, 61, 4–10. [Google Scholar] [CrossRef]
  7. Fullen, M.A. Soil Organic Matter and Erosion Processes on Arable Loamy Sand Soils in the West Midlands of England. Soil Technol. 1991, 4, 19–31. [Google Scholar] [CrossRef]
  8. Fullen, M.A.; Brandsma, R.T. Property Changes by Erosion of Loamy Sand Soils in East Shropshire, UK. Soil Technol. 1995, 8, 1–15. [Google Scholar] [CrossRef]
  9. Fullen, M.A.; Yi, Z.; Brandsma, R.T. Comparison of Soil and Sediment Properties of a Loamy Sand Soil. Soil Technol. 1997, 10, 35–45. [Google Scholar] [CrossRef]
  10. Kreznor, W.R.; Olson, K.R.; Banwart, W.L.; Johnson, D.L. Soil, Landscape, and Erosion Relationships in a Northwest Illinois Watershed. Soil Sci. Soc. Am. J. 1989, 53, 1763–1771. [Google Scholar] [CrossRef]
  11. Pennock, D.J. Chapter 7 Effects of Soil Redistribution on Soil Quality: Pedon, Landscape, and Regional Scales. Dev. Soil Sci. 1997, 25, 167–185. [Google Scholar] [CrossRef]
  12. Van Oost, K.; Govers, G.; Van Muysen, W.; Quine, T.A. Modeling Translocation and Dispersion of Soil Constituents by Tillage on Sloping Land. Soil Sci. Soc. Am. J. 2000, 64, 1733–1739. [Google Scholar] [CrossRef]
  13. Ampontuah, E.O.; Robinson, J.S.; Nortcliff, S. Assessment of Soil Particle Redistribution on Two Contrasting Cultivated Hillslopes. Geoderma 2006, 132, 324–343. [Google Scholar] [CrossRef]
  14. Pennock, D.J. New Perspectives on the Soil Erosion-Soil Quality Relationship; IAEA: Vienna, Austria, 1998. [Google Scholar]
  15. FAO and ITPS. Status of the World’s Soil Resources (SWSR)—Main Report; Food and Agriculture Organization of the United Nations and Intergovernmental Technical Panel on Soils: Rome, Italy, 2015. [Google Scholar]
  16. Borrelli, P.; Robinson, D.A.; Fleischer, L.R.; Lugato, E.; Ballabio, C.; Alewell, C.; Meusburger, K.; Modugno, S.; Schütt, B.; Ferro, V.; et al. An Assessment of the Global Impact of 21st Century Land Use Change on Soil Erosion. Nat. Commun. 2017, 8, 2013. [Google Scholar] [CrossRef] [PubMed]
  17. Pereira, P.; Barceló, D.; Panagos, P. Soil and Water Threats in a Changing Environment. Environ. Res. 2020, 186, 109501. [Google Scholar] [CrossRef]
  18. Panagos, P.; Standardi, G.; Borrelli, P.; Lugato, E.; Montanarella, L.; Bosello, F. Cost of Agricultural Productivity Loss Due to Soil Erosion in the European Union: From Direct Cost Evaluation Approaches to the Use of Macroeconomic Models. Land. Degrad. Dev. 2018, 29, 471–484. [Google Scholar] [CrossRef]
  19. Arias Navarro, C.; Baritz, R.; Jones, A.; Akca, E.; Aldrian, U.; Alewell, C.; Anzalone, E.; Arcidiacono, A.; Auclerc, A.; Aydinsakir, K.; et al. The State of Soils in Europe; Publications Office of the European Union: Luxembourg, 2024. [Google Scholar]
  20. Transforming Our World: The 2030 Agenda for Sustainable Development | Department of Economic and Social Affairs. Available online: https://sdgs.un.org/2030agenda (accessed on 29 December 2024).
  21. Boix-Fayos, C.; Martínez-Mena, M.; Arnau-Rosalén, E.; Calvo-Cases, A.; Castillo, V.; Albaladejo, J. Measuring Soil Erosion by Field Plots: Understanding the Sources of Variation. Earth Sci. Rev. 2006, 78, 267–285. [Google Scholar] [CrossRef]
  22. Kearney, S.P.; Fonte, S.J.; García, E.; Smukler, S.M. Improving the Utility of Erosion Pins: Absolute Value of Pin Height Change as an Indicator of Relative Erosion. Catena 2018, 163, 427–432. [Google Scholar] [CrossRef]
  23. Orr, B. A Rapid Method of Estimating Soil Erosion Using Trapped Sediment: A Case Study from a Forest Road on the Cumberland Plateau of Tennessee. Mt. Res. Dev. 1996, 16, 419. [Google Scholar] [CrossRef]
  24. Albert, J.; Lang, W.; Michael Aust, M.; Bolding, C.; Kevin, J.; McGuire, E.B.S. Comparing Sediment Trap Data with Erosion Models for Evaluation of Forest Haul Road Stream Crossing Approaches. Trans. ASABE 2017, 60, 393–408. [Google Scholar] [CrossRef]
  25. Wade, C.R.; Bolding, M.C.; Aust, W.M.; Iii, W.A.L.; Schilling, E.B. Schilling Comparing Sediment Trap Data with the USLE-Forest, RUSLE2, and WEPP-Road Erosion Models for Evaluation of Bladed Skid Trail BMPs. Trans. ASABE 2012, 55, 403–414. [Google Scholar] [CrossRef]
  26. Zapata, F. The Use of Environmental Radionuclides as Tracers in Soil Erosion and Sedimentation Investigations: Recent Advances and Future Developments. Soil Tillage Res. 2003, 69, 3–13. [Google Scholar] [CrossRef]
  27. Parwada, C.; Chipomho, J.; Tibugari, H. Comparison of Conventional and Artificial Fallout Radionuclide (FRNs) Methods in Assessing Soil Erosion. Sustain. Environ. 2023, 9, 2236406. [Google Scholar] [CrossRef]
  28. Guzmán, G.; Quinton, J.N.; Nearing, M.A.; Mabit, L.; Gómez, J.A. Sediment Tracers in Water Erosion Studies: Current Approaches and Challenges. J. Soils Sediments 2013, 13, 816–833. [Google Scholar] [CrossRef]
  29. Low, A.J. The Effect of Cultivation on the Structure and Other Physical Characteristics of Grassland and Arable Soils (1945–1970). J. Soil Sci. 1972, 23, 363–380. [Google Scholar] [CrossRef]
  30. Ebeid, M.M.; Lal, R.; Hall, G.F.; Miller, E. Erosion Effects on Soil Properties and Soybean Yield of a Miamian Soil in Western Ohio in a Season with below Normal Rainfall. Soil Technol. 1995, 8, 97–108. [Google Scholar] [CrossRef]
  31. Fenton, T.E.; Kazemi, M.; Lauterbach-Barrett, M.A. Erosional Impact on Organic Matter Content and Productivity of Selected Iowa Soils. Soil. Tillage Res. 2005, 81, 163–171. [Google Scholar] [CrossRef]
  32. Malo, D.D.; Schumacher, T.E.; Doolittle, J.J. Long-Term Cultivation Impacts on Selected Soil Properties in the Northern Great Plains. Soil Tillage Res. 2005, 81, 277–291. [Google Scholar] [CrossRef]
  33. Karydas, C.G.; Panagos, P.; Gitas, I.Z. A Classification of Water Erosion Models According to Their Geospatial Characteristics. Int. J. Digit. Earth 2014, 7, 229–250. [Google Scholar] [CrossRef]
  34. Panagos, P.; Borrelli, P.; Poesen, J.; Ballabio, C.; Lugato, E.; Meusburger, K.; Montanarella, L.; Alewell, C. The New Assessment of Soil Loss by Water Erosion in Europe. Environ. Sci. Policy 2015, 54, 438–447. [Google Scholar] [CrossRef]
  35. Wischmeier, W.H.; Smith, D.D. Predicting Rainfall Erosion Losses, A Guide to Conservation Planning; The USDA Agricultural Handbook No. 537; U.S. Department of Agriculture: Washington, DC, USA, 1978. [Google Scholar]
  36. Renard, K.; Foster, G.; Weesies, G.; McCool, D.; Yoder, D. Predicting Soil Erosion by Water: A Guide to Conservation Planning with the Revised Universal Soil Loss Equation (RUSLE); US Department of Agriculture, Agriculture Handbook No.703USDA; USDA: Washington, DC, USA, 1997. [Google Scholar]
  37. Mabit, L.; Benmansour, M.; Walling, D.E. Comparative Advantages and Limitations of the Fallout Radionuclides 137Cs, 210Pbex and 7Be for Assessing Soil Erosion and Sedimentation. J. Environ. Radioact. 2008, 99, 1799–1807. [Google Scholar] [CrossRef] [PubMed]
  38. Du, P.; Walling, D.E. Using 137Cs Measurements to Investigate the Influence of Erosion and Soil Redistribution on Soil Properties. Appl. Radiat. Isot. 2011, 69, 717–726. [Google Scholar] [CrossRef]
  39. Parsons, A.J.; Foster, I.D.L. What Can We Learn about Soil Erosion from the Use of 137Cs? Earth Sci. Rev. 2011, 108, 101–113. [Google Scholar] [CrossRef]
  40. Meusburger, K.; Evrard, O.; Alewell, C.; Borrelli, P.; Cinelli, G.; Ketterer, M.; Mabit, L.; Panagos, P.; van Oost, K.; Ballabio, C. Plutonium Aided Reconstruction of Caesium Atmospheric Fallout in European Topsoils. Sci. Rep. 2020, 10, 11858. [Google Scholar] [CrossRef] [PubMed]
  41. Komissarov, M.; Golosov, V.; Zhidkin, A.; Fomicheva, D.; Konoplev, A. The Cross-Verification of Different Methods for Soil Erosion Assessment of Natural and Agricultural Low Slopes in the Southern Cis-Ural Region of Russia. Land 2024, 13, 1767. [Google Scholar] [CrossRef]
  42. Walling, D.E.; He, Q.; Whelan, P.A. Using 137Cs Measurements to Validate the Application of the AGNPS and ANSWERS Erosion and Sediment Yield Models in Two Small Devon Catchments. Soil Tillage Res. 2003, 69, 27–43. [Google Scholar] [CrossRef]
  43. Konz, N.; Baenninger, D.; Konz, M.; Nearing, M.; Alewell, C. Process Identification of Soil Erosion in Steep Mountain Regions. Hydrol. Earth Syst. Sci. 2010, 14, 675–686. [Google Scholar] [CrossRef]
  44. Lazarević, R. Map Erosion SR Serbia 1: 500000. Institute of Forestry and Wood Industry of Serbia; Department of Erosion and Melioration: Belgrade, Serbia, 1983. [Google Scholar]
  45. Đokić, M.; Manić, M.; Đorđević, M.; Gocić, M.; Čupić, A.; Jović, M.; Dragović, R.; Gajić, B.; Smičiklas, I.; Dragović, S. Remote Sensing and Nuclear Techniques for High-Resolution Mapping and Quantification of Gully Erosion in the Highly Erodible Area of the Malčanska River Basin, Eastern Serbia. Environ. Res. 2023, 235, 116679. [Google Scholar] [CrossRef]
  46. Manić, M.; Đorđević, M.; Đokić, M.; Dragović, R.; Kićović, D.; Đorđević, D.; Jović, M.; Smičiklas, I.; Dragović, S. Remote Sensing and Nuclear Techniques for Soil Erosion Research in Forest Areas: Case Study of the Crveni Potok Catchment. Front. Environ. Sci. 2022, 10, 897248. [Google Scholar] [CrossRef]
  47. Menkovic, L.; Koscal, M.; Milivojevic, M.; Djokic, M. Morphostructure Relations on the Territory of the Republic of Serbia. Glas. Srp. Geogr. Drus. 2018, 98, 1–28. [Google Scholar] [CrossRef]
  48. Dimitrijević, M.; Dragić, D.; Karamata, S.; Petrović, B.; Sikošek, B.; Veselinović, D. Osnovna geološka karta 1:100 000, Tumač za list Aleksinac, K 34-20; Zavod za Geološka i Geollzička Istraživanja: Belgrade, Yugoslavia, 1980. [Google Scholar]
  49. Nikodijević, V. Soil Map of SFRY, Niš-1, 1:50,000; Secretariat for Agriculture, Forestry, and Water Management SRS: Republic Science Association SRS: Belgrade, Yugoslavia, 1979. [Google Scholar]
  50. Đokić, M.M. Nišava—Potamology Study. Ph.D. Thesis, University of Niš, Niš, Serbia, 2015. [Google Scholar]
  51. Fulajtar, E.; Mabit, L.; Renschler, C.S.; Lee, A.; Yi, Z. Use of 137 Cs for Soil Erosion Assessment; FAO: Rome, Italy, 2017. [Google Scholar]
  52. Laboratory of Spectrometry and Radiometry (LSRM), Moscow, 2019. SpectraLine (1.6). [Software]. Available online: http://lsrm.ru/en/products/detail.php?ELEMEN%20T_CODE=spectraline_1.6 (accessed on 4 January 2025).
  53. SRPS EN ISO 17892-4:2017; Geotechnical Investigation and Testing—Laboratory Testing of Soil—Part 4: Determination of Particle Size Distribution. Institute for Standardization of Republic of Serbia: Belgrade, Serbia, 2017. Available online: https://iss.rs/en/project/show/iss:proj:54602 (accessed on 1 July 2024).
  54. ISO 10390:2021; Soil, Treated Biowaste and Sludge—Determination of PH. International Organization for Standardization: Geneva, Switzerland, 2021. Available online: https://www.iso.org/standard/75243.html (accessed on 29 December 2024).
  55. ISO 11265:1994; Soil Quality—Determination of the Specific Electrical Conductivity. International Organization for Standardization: Geneva, Switzerland, 1994. Available online: https://www.iso.org/standard/19243.html (accessed on 29 December 2024).
  56. ISO 11465:1993; Soil Quality—Determination of Dry Matter and Water Content on a Mass Basis—Gravimetric Method. International Organization for Standardization: Geneva, Switzerland, 1993. Available online: https://www.iso.org/standard/20886.html (accessed on 29 December 2024).
  57. ISO 10694:1995; Soil Quality—Determination of Organic and Total Carbon after Dry Combustion (Elementary Analysis). International Organization for Standardization: Geneva, Switzerland, 1995. Available online: https://www.iso.org/standard/18782.html (accessed on 29 December 2024).
  58. ISO 11261:1995; Soil Quality—Determination of Total Nitrogen—Modified Kjeldahl Method. International Organization for Standardization: Geneva, Switzerland, 1995. Available online: https://www.iso.org/standard/19239.html (accessed on 29 December 2024).
  59. SRPS ISO 11466:2004; Soil Quality—Extraction of Trace Elements Soluble in Aqua Regia. SRPS: Institute for Standardization of Republic of Serbia: Belgrade, Serbia, 2004. Available online: https://iss.rs/en/project/show/iss:proj:16775 (accessed on 1 July 2024).
  60. ISO 22036:2024; Environmental Solid Matrices—Determination of Elements Using Inductively Coupled Plasma Optical Emission Spectrometry (ICP-OES). International Organization for Standardization: Geneva, Switzerland, 2024. Available online: https://www.iso.org/standard/82632.html (accessed on 29 December 2024).
  61. Dexter, A.R.; Richard, G.; Arrouays, D.; Czyż, E.A.; Jolivet, C.; Duval, O. Complexed Organic Matter Controls Soil Physical Properties. Geoderma 2008, 144, 620–627. [Google Scholar] [CrossRef]
  62. Pieri, C.J.M.G. Fertility of Soils; Springer Series in Physical Environment; Springer Berlin Heidelberg: Berlin/Heidelberg, Germany, 1992; Volume 10, ISBN 978-3-642-84322-8. [Google Scholar]
  63. Walling, D.E.; He, Q. Improved Models for Estimating Soil Erosion Rates from Cesium-137 Measurements. J. Environ. Qual. 1999, 28, 611–622. [Google Scholar] [CrossRef]
  64. Byrne, A.R. Radioactivity in Fungi in Slovenia, Yugoslavia, Following the Chernobyl Accident. J. Environ. Radioact. 1988, 6, 177–183. [Google Scholar] [CrossRef]
  65. Popović, D.; Spasić-Jokić, V. Consequences of the Chernobyl Disaster in the Region of the Republic of Serbia. Vojnosanit. Pregl. 2006, 63, 481–487. [Google Scholar] [CrossRef]
  66. Federal Committee for Labour, Health and Social Policy. The Level of Radioactive Contamination of Human Environment and Exposure of Population in Yugoslavia in 1986 Due to Nuclear Power Plant Disaster in Chernobyl; IAEA: Belgrade, Yugoslavia, 1987. [Google Scholar]
  67. Bikit, I.; Mrda, D.; Todorovic, N.; Nikolov, J.; Krmar, M.; Veskovic, M.; Slivka, J.; Hansman, J.; Forkapic, S.; Jovancevic, N. Airborne Radioiodine in Northern Serbia from Fukushima. J. Environ. Radioact. 2012, 114, 89–93. [Google Scholar] [CrossRef]
  68. Porto, P.; Walling, D.E.; Ferro, V. Validating the Use of Caesium-137 Measurements to Estimate Soil Erosion Rates in a Small Drainage Basin in Calabria, Southern Italy. J. Hydrol. 2001, 248, 93–108. [Google Scholar] [CrossRef]
  69. Porto, P.; Walling, D.E.; Ferro, V.; Di Stefano, C. Validating Erosion Rate Estimates Provided by Caesium-137 Measurements for Two Small Forested Catchments in Calabria, Southern Italy. Land. Degrad. Dev. 2003, 14, 389–408. [Google Scholar] [CrossRef]
  70. Xinbao, Z.; Higgitt, D.L.; Walling, D.E. A Preliminary Assessment of the Potential for Using Caesium-137 to Estimate Rates of Soil Erosion in the Loess Plateau of China. Hydrol. Sci. J. 1990, 35, 243–252. [Google Scholar] [CrossRef]
  71. Walling, D.E.; Quine, T.A. Use of Caesium-137 as a Tracer of Erosion and Sedimentation: Handbook for the Application of the Caesium-137 Technique; UK Overseas Development Administration Research Scheme R4579; IAEA: Vienna, Austria, 1993. [Google Scholar]
  72. Kumar, R.; Deshmukh, B.; Kumar, A. Using Google Earth Engine and GIS for Basin Scale Soil Erosion Risk Assessment: A Case Study of Chambal River Basin, Central India. J. Earth Syst. Sci. 2022, 131, 228. [Google Scholar] [CrossRef]
  73. Wang, H.; Zhao, H. Dynamic Changes of Soil Erosion in the Taohe River Basin Using the RUSLE Model and Google Earth Engine. Water 2020, 12, 1293. [Google Scholar] [CrossRef]
  74. Perović, V.; Životić, L.; Kadović, R.; Dordević, A.; Jaramaz, D.; Mrvić, V.; Todorović, M. Spatial Modelling of Soil Erosion Potential in a Mountainous Watershed of South-Eastern Serbia. Environ. Earth Sci. 2013, 68, 115–128. [Google Scholar] [CrossRef]
  75. Xu, Y.Q.; Shao, X.M.; Kong, X.B.; Jian, P.; Cai, Y.L. Adapting the RUSLE and GIS to Model Soil Erosion Risk in a Mountains Karst Watershed, Guizhou Province, China. Environ. Monit. Assess. 2008, 141, 275–286. [Google Scholar] [CrossRef]
  76. Van Der Knijff, J.; Jones, R.; Montanarella, L. Soil Erosion Risk Assessment in Italy; European Soil Bureau, European Commission: Brussels, Belgium, 1999. [Google Scholar]
  77. Ghosal, K.; Das Bhattacharya, S. A Review of RUSLE Model. J. Indian Soc. Remote Sens. 2020, 48, 689–707. [Google Scholar] [CrossRef]
  78. Williams, J.R. The EPIC Model, Chapter 25. In Computer Models of Watershed Hydrology; Singh, V.P., Ed.; Water Resources Publications: Highlands Ranch, CO, USA, 1995. [Google Scholar]
  79. Moore, I.D.; Grayson, R.B.; Ladson, A.R. Digital Terrain Modelling: A Review of Hydrological, Geomorphological, and Biological Applications. Hydrol. Process 1991, 5, 3–30. [Google Scholar] [CrossRef]
  80. Wang, L.; Liu, H. An Efficient Method for Identifying and Filling Surface Depressions in Digital Elevation Models for Hydrologic Analysis and Modelling. Int. J. Geogr. Inf. Sci. 2006, 20, 193–213. [Google Scholar] [CrossRef]
  81. Rozos, D.; Skilodimou, H.D.; Loupasakis, C.; Bathrellos, G.D. Application of the Revised Universal Soil Loss Equation Model on Landslide Prevention. An Example from N. Euboea (Evia) Island, Greece. Environ. Earth Sci. 2013, 70, 3255–3266. [Google Scholar] [CrossRef]
  82. Zanaga, D.; Van De Kerchove, R.; De Keersmaecker, W.; Souverijns, N.; Brockmann, C.; Quast, R.; Wevers, J.; Grosu, A.; Paccini, A.; Vergnaud, S.; et al. ESA WorldCover 10 m 2020 V100. 2021. Available online: https://zenodo.org/records/5571936 (accessed on 9 January 2025).
  83. Chen, P.; Feng, Z.; Mannan, A.; Chen, S.; Ullah, T. Assessment of Soil Loss from Land Use/Land Cover Change and Disasters in the Longmen Shan Mountains, China. Appl. Ecol. Environ. Res. 2019, 17, 11233–11247. [Google Scholar] [CrossRef]
  84. Kuok, K.K.K.; Mah, D.Y.S.; Chiu, P.C. Evaluation of C and P Factors in Universal Soil Loss Equation on Trapping Sediment: Case Study of Santubong River. J. Water Resour. Prot. 2013, 5, 1149–1154. [Google Scholar] [CrossRef]
  85. R Core Team. R A Language and Environment for Statistical Computing; R Foundation for Statistical Computing: Vienna, Austria, 2023; Available online: https://www.scirp.org/reference/referencespapers?referenceid=3582659 (accessed on 29 December 2024).
  86. Hazelton, P.; Murphy, B. Interpreting Soil Test Results, What Do All the Numbers Mean; CSIRO Publishing: Collingwood, Australia, 2007. [Google Scholar]
  87. Jones, R.J.A.; Hiederer, R.; Rusco, E.; Loveland, P.J.; Montanarella, L. The Map of Organic Carbon in Topsoils in Europe; Office for Official Publications of the European Communities: Luxembourg, 2004. [Google Scholar]
  88. Barthès, B.; Roose, E. Aggregate Stability as an Indicator of Soil Susceptibility to Runoff and Erosion; Validation at Several Levels. Catena 2002, 47, 133–149. [Google Scholar] [CrossRef]
  89. Prout, J.M.; Shepherd, K.D.; McGrath, S.P.; Kirk, G.J.D.; Haefele, S.M. What Is a Good Level of Soil Organic Matter? An Index Based on Organic Carbon to Clay Ratio. Eur. J. Soil. Sci. 2021, 72, 2493–2503. [Google Scholar] [CrossRef]
  90. Johannes, A.; Matter, A.; Schulin, R.; Weisskopf, P.; Baveye, P.C.; Boivin, P. Optimal Organic Carbon Values for Soil Structure Quality of Arable Soils. Does Clay Content Matter? Geoderma 2017, 302, 14–21. [Google Scholar] [CrossRef]
  91. Eurostat Agri-Environmental Indicator—Soil Erosion. Available online: https://ec.europa.eu/eurostat/statistics-explained/index.php?title=Agri-environmental_indicator_-_soil_erosion (accessed on 9 January 2025).
  92. Rigol, A.; Vidal, M.; Rauret, G. An Overview of the Effect of Organic Matter on Soil–Radiocaesium Interaction: Implications in Root Uptake. J. Environ. Radioact. 2002, 58, 191–216. [Google Scholar] [CrossRef]
  93. Xiaojun, N.; Xiaodan, W.; Suzhen, L.; Shixian, G.; Haijun, L. 137Cs Tracing Dynamics of Soil Erosion, Organic Carbon and Nitrogen in Sloping Farmland Converted from Original Grassland in Tibetan Plateau. Appl. Radiat. Isot. 2010, 68, 1650–1655. [Google Scholar] [CrossRef] [PubMed]
  94. Federico, R.; Paolo, P.; Katharina, K.; Axel, M.; Adele, M. Soil Biological Indicators and Caesium-137 to Estimate Soil Erosion in Areas with Different Forest System Management. Eur. J. For. Res. 2020, 139, 67–81. [Google Scholar] [CrossRef]
  95. Romeo, F.; Porto, P.; Mallamaci, C.; Muscolo, A. The Relationships between Selected Soil Properties and Caesium-137 Identify Organic Carbon, Nitrogen and Water Soluble Phenols as Indicators of Soil Erosion Processes in Different Forest Stands. J. For. Res. 2021, 32, 2589–2598. [Google Scholar] [CrossRef]
  96. Ayoubi, S.; Zhao, S.; Yousefifard, M.; Amiri, F.; Abdi, M.R.; Abbaszadeh Afshar, F. Quantification of Mid-Term Soil Redistribution in Hilly Regions under Abandoned Rainfed Farming and Oak Forest Using 137Cs Radionuclide and Magnetic Susceptibility Techniques. Catena 2024, 244, 108270. [Google Scholar] [CrossRef]
  97. Meliho, M.; Nouira, A.; Benmansour, M.; Boulmane, M.; Khattabi, A.; Mhammdi, N.; Benkdad, A. Assessment of Soil Erosion Rates in a Mediterranean Cultivated and Uncultivated Soils Using Fallout 137Cs. J. Environ. Radioact. 2019, 208–209, 106021. [Google Scholar] [CrossRef] [PubMed]
  98. Mabit, L.; Bernard, C. Relationship between Soil 137Cs Inventories and Chemical Properties in a Small Intensively Cropped Watershed. Comptes Rendus Académie Sci. Ser. IIA-Earth Planet. Sci. 1998, 327, 527–532. [Google Scholar] [CrossRef]
  99. Theocharopoulos, S.P.; Florou, H.; Walling, D.E.; Kalantzakos, H.; Christou, M.; Tountas, P.; Nikolaou, T. Soil Erosion and Deposition Rates in a Cultivated Catchment Area in Central Greece, Estimated Using the 137Cs Technique. Soil Tillage Res. 2003, 69, 153–162. [Google Scholar] [CrossRef]
  100. Mabit, L.; Chhem-Kieth, S.; Toloza, A.; Vanwalleghem, T.; Bernard, C.; Amate, J.I.; González de Molina, M.; Gómez, J.A. Radioisotopic and Physicochemical Background Indicators to Assess Soil Degradation Affecting Olive Orchards in Southern Spain. Agric. Ecosyst. Environ. 2012, 159, 70–80. [Google Scholar] [CrossRef]
  101. Li, T.; Zhang, H.; Wang, X.; Cheng, S.; Fang, H.; Liu, G.; Yuan, W. Soil Erosion Affects Variations of Soil Organic Carbon and Soil Respiration along a Slope in Northeast China. Ecol. Process 2019, 8, 28. [Google Scholar] [CrossRef]
  102. Mesrar, H.; Sadiki, A.; Faleh, A.; Quijano, L.; Gaspar, L.; Navas, A. Vertical and Lateral Distribution of Fallout 137 Cs and Soil Properties along Representative Toposequences of Central Rif, Morocco. J. Environ. Radioact. 2017, 169–170, 27–39. [Google Scholar] [CrossRef] [PubMed]
  103. Wairiu, M. Soil Organic Carbon in Relation to Cultivation and Topsoil Removal on Sloping Lands of Kolombangara, Solomon Islands. Soil Tillage Res. 2003, 70, 19–27. [Google Scholar] [CrossRef]
  104. He, Y.; Zhang, F.; Yang, M.; Li, X.; Wang, Z. Insights from Size Fractions to Interpret the Erosion-Driven Variations in Soil Organic Carbon on Black Soil Sloping Farmland, Northeast China. Agric. Ecosyst. Environ. 2023, 343, 108283. [Google Scholar] [CrossRef]
  105. Shi, J.; Zhang, Z.; Wang, Z.; Peng, Y.; Wang, X. Soil Erosion Alters the Composition of Soil Nitrogen and Induces Nitrogen Immobilization along a Sloping Agricultural Landscape. Soil Use Manag. 2024, 40, e13067. [Google Scholar] [CrossRef]
  106. Khodadadi, M.; Meusburger, K.; Mirzaei, M.; Strauss, P.; Blake, W.H.; Moghaseh, E.; Alewell, C. Spatial Cross-Correlation of Surface Soil Physicochemical Properties with Soil Erosion Estimated by Fallout Radionuclides in Croplands in a Semi-Humid Region of Iran. Catena 2024, 237, 107836. [Google Scholar] [CrossRef]
  107. Ballabio, C.; Lugato, E.; Fernández-Ugalde, O.; Orgiazzi, A.; Jones, A.; Borrelli, P.; Montanarella, L.; Panagos, P. Mapping LUCAS Topsoil Chemical Properties at European Scale Using Gaussian Process Regression. Geoderma 2019, 355, 113912. [Google Scholar] [CrossRef] [PubMed]
  108. Francesca Cotrufo, M.; Lavallee, J.M.; Zhang, Y.; Hansen, P.M.; Paustian, K.H.; Schipanski, M.; Wallenstein, M.D. In-N-Out: A Hierarchical Framework to Understand and Predict Soil Carbon Storage and Nitrogen Recycling. Glob. Chang. Biol. 2021, 27, 4465–4468. [Google Scholar] [CrossRef]
  109. Azbouche, A.; Kessaissia, A.; Hamoudi, A.; Morsli, B.; Moulla, A.S. Land Degradation Assessment Using Fallout Cesium-137 in a Coastal Mediterranean Environment (Ténès, Algeria). EuroMediterr J. Environ. Integr. 2023, 8, 55–65. [Google Scholar] [CrossRef]
  110. Saç, M.M.; Uğur, A.; Yener, G.; Özden, B. Estimates of Soil Erosion Using Cesium-137 Tracer Models. Environ. Monit. Assess. 2007, 136, 461–467. [Google Scholar] [CrossRef]
  111. Soileau, J.M.; Hajek, B.F.; Touchton, J.T. Soil Erosion and Deposition Evidence in a Small Watershed Using Fallout Cesium-137. Soil Sci. Soc. Am. J. 1990, 54, 1712–1719. [Google Scholar] [CrossRef]
  112. Turnage, K.M.; Lee, S.Y.; Foss, J.E.; Kim, K.H.; Larsen, I.L. Comparison of Soil Erosion and Deposition Rates Using Radiocesium, RUSLE, and Buried Soils in Dolines in East Tennessee. Environ. Geol. 1997, 29, 1–10. [Google Scholar] [CrossRef]
  113. Naghdi, R.; Zahedi, S.S.; Gharibreza, M.; Gholami, V.; Mirzaei, M. Measuring Soil Erosion Rates in Hyrcanian Forests: An Application of the 137Cs Method. J. Earth Syst. Sci. 2024, 133, 28. [Google Scholar] [CrossRef]
  114. Konz, N.; Schaub, M.; Prasuhn, V.; Baenninger, D.; Alewell, C. Cesium-137-Based Erosion-Rate Determination of a Steep Mountainous Region. J. Plant Nutr. Soil Sci. 2009, 172, 615–622. [Google Scholar] [CrossRef]
  115. Bacchi, O.O.S.; Reichardt, K.; Sparovek, G. Sediment Spatial Distribution Evaluated by Three Methods and Its Relation to Some Soil Properties. Soil Tillage Res. 2003, 69, 117–125. [Google Scholar] [CrossRef]
  116. Bircher, P.; Liniger, H.P.; Prasuhn, V. Comparison of Long-Term Field-Measured and RUSLE-Based Modelled Soil Loss in Switzerland. Geoderma Reg. 2022, 31, e00595. [Google Scholar] [CrossRef]
  117. Alewell, C.; Borrelli, P.; Meusburger, K.; Panagos, P. Using the USLE: Chances, Challenges and Limitations of Soil Erosion Modelling. Int. Soil Water Conserv. Res. 2019, 7, 203–225. [Google Scholar] [CrossRef]
  118. Mekonnen, E.; Kebede, A.; Asfaw, S.; Feyissa, S. Optimizing Soil Erosion Estimates of RUSLE Model by Analyzing Land Use/Cover Dynamics in Upper Awash River Basin, Central Ethiopia. Geomatics, Nat. Hazards Risk 2023, 14, 2257363. [Google Scholar] [CrossRef]
  119. Yesuph, A.Y.; Dagnew, A.B. Soil Erosion Mapping and Severity Analysis Based on RUSLE Model and Local Perception in the Beshillo Catchment of the Blue Nile Basin, Ethiopia. Environ. Syst. Res. 2019, 8, 17. [Google Scholar] [CrossRef]
  120. Perovic, V.; Jaramaz, D.; Zivotic, L.; Cakmak, D.; Mrvic, V.; Milanovic, M.; Saljnikov, E. Design and Implementation of WebGIS Technologies in Evaluation of Erosion Intensity in the Municipality of NIS (Serbia). Environ. Earth Sci. 2016, 75, 211. [Google Scholar] [CrossRef]
  121. Mejía-Parada, C.; Mora-Ruiz, V.; Vallejo-Borda, J.A.; Arrieta-Baldovino, J. Influence of LS Factor Overestimation Soil Loss on RUSLE Model for Complex Topographies. J. Indian Soc. Remote Sens. 2024, 52, 1661–1674. [Google Scholar] [CrossRef]
  122. Rabot, E.; Wiesmeier, M.; Schlüter, S.; Vogel, H.-J. Soil Structure as an Indicator of Soil Functions: A Review. Geoderma 2018, 314, 122–137. [Google Scholar] [CrossRef]
  123. Bronick, C.J.; Lal, R. Soil Structure and Management: A Review. Geoderma 2005, 124, 3–22. [Google Scholar] [CrossRef]
  124. Totsche, K.U.; Amelung, W.; Gerzabek, M.H.; Guggenberger, G.; Klumpp, E.; Knief, C.; Lehndorff, E.; Mikutta, R.; Peth, S.; Prechtel, A.; et al. Microaggregates in Soils. J. Plant Nutr. Soil Sci. 2018, 181, 104–136. [Google Scholar] [CrossRef]
  125. Udom, B.E.; Kamalu, O.J. Sealing Index, Air-Filled Porosity and Hydrological Behaviour of a Tropical Ultisol as Affected by Incidental Flooding and Soil Disturbance. Int. J. Soil Sci. 2016, 11, 79–86. [Google Scholar] [CrossRef]
  126. Valentin, C.; Bresson, L.M. Soil Crusting. In Methods of Assessment of Soil Degradation; CRC Press: Boca Raton, FL, USA, 1997; pp. 89–107. [Google Scholar]
  127. Bassouny, M. Soil Shrinkage, Sealing Index and Hydro-Physical Properties of Vertisols as Influenced by Long-Term Cultivation Systems in Northern Egypt. J. Soil Sci. Agric. Eng. 2018, 9, 173–181. [Google Scholar] [CrossRef]
  128. Wang, X.; Cammeraat, E.L.H.; Cerli, C.; Kalbitz, K. Soil Aggregation and the Stabilization of Organic Carbon as Affected by Erosion and Deposition. Soil. Biol. Biochem. 2014, 72, 55–65. [Google Scholar] [CrossRef]
  129. Carter, M.R.; Stewart, B.A. Structure and Organic Matter Storage in Agricultural Soils; Carter, M.R., Stewart, B.A., Eds.; CRC Press: Boca Raton, FL, USA, 2020; ISBN 978-100-307-556-1. [Google Scholar]
Figure 1. Geographical location of the Crveni Potok catchment with sampling sites indicated by numbers.
Water 17 00526 g001
Figure 2. Box plots showing the distribution of erosion rates estimated by the PD model based on physiographic factors: (a) altitude, (b) slope, (c) geology, (d) soil, and (e) land cover. The box frames the interquartile range; the whisker extends from the lowest to the highest value; a star symbol indicates the outliers; the horizontal line indicates the data median; the circle indicates the mean value for the group, and N is the number of samples. Groups that do not share the same letter (i.e., A and B) are significantly different (p < 0.05) based on the Games–Howell pairwise comparison tests.
Water 17 00526 g002
Figure 3. RUSLE Factor maps (ae) and RUSLE model based soil loss map (f).
Water 17 00526 g003
Figure 4. Pearson correlation coefficient (r) of soil erosion rates estimated by PD and RUSLE models, soil physicochemical properties, and indicators of soil structural stability (N = 34).
Water 17 00526 g004
Figure 5. Scatterplot of RUSLE vs. PD model estimates (original data). The numbers refer to the sampling sites.
Water 17 00526 g005
Table 1. Descriptive statistics of altitude, slope, soil physicochemical properties, soil structure stability indicators, and soil erosion rates estimated by the PD and RUSLE models (N = 34).
VariableMeanSD *CV **SkewnessKurtosisMin.MedianMax.
Topography
Altitude (m)485107.422.160.27−1.25303464673
Slope (°)125.241.890.31−0.5231123
Soil physicochemical properties
Coarse sand (%)14.46.3143.780.591.782.3014.7534.50
Fine sand (%)15.07.2948.661.432.913.714.039.7
Silt (%)43.310.5024.230.41−0.6124.840.566.4
Clay (%)27.313.4549.320.08−1.489.229.052.6
Water content (%)3.31.7151.930.14−1.420.93.16.3
pH (H2O)6.91.2718.59−0.10−1.244.66.68.6
EC (mS m−1)73.1447.610.80−0.483613
OC (%)3.0901.1236.200.04−0.930.9003.0335.027
N (%)0.2590.0936.930.951.120.1100.2320.541
OC/N11.92.2319.160.830.808.211.818.3
Ca (mg kg−1)23,48041,898178.52.546.214536770178,000
Al (mg kg−1)23,31010,16443.610.18−0.24511022,70048,300
Fe (mg kg−1)30,780838827.250.08−0.3913,20030,30046,300
K (mg kg−1)3780183148.470.14−0.9673734657510
Mg (mg kg−1)6460483174.752.065.81608527524,700
Mn (mg kg−1)773409652.980.83−0.442886041800
137Cs (Bq kg−1)15.06.9546.470.17−1.223.414.527.6
Indicators of soil structure stability
OC/Clay0.1560.10970.160.91−0.280.0220.1170.399
St (%)7.62.7135.4−0.14−0.952.37.811.9
Erosion rates (t ha−1 y−1)
PD model14.711.1575.750.750.070.413.143.3
RUSLE12.716.63130.31.431.340.15.562.7
Note(s): * Standard deviation; ** coefficient of variation.
Disclaimer/Publisher’s Note: The statements, opinions and data contained in all publications are solely those of the individual author(s) and contributor(s) and not of MDPI and/or the editor(s). MDPI and/or the editor(s) disclaim responsibility for any injury to people or property resulting from any ideas, methods, instructions or products referred to in the content.

