Article

Evaluation of Water-Richness and Risk Level of the Sandstone Aquifer in the Roof of the No. 3 Coal Seam in Hancheng Mining Area

1
School of Geology and Environment, Xi’an University of Science and Technology, Xi’an 710000, China
2
Shaanxi Tiandi Geology Co., Ltd., Xi’an 710000, China
3
Shaanxi Shanmei Hancheng Mining Co., Ltd., Hancheng 710065, China
*
Author to whom correspondence should be addressed.
Water 2025, 17(8), 1164; https://doi.org/10.3390/w17081164
Submission received: 18 February 2025 / Revised: 24 March 2025 / Accepted: 7 April 2025 / Published: 13 April 2025

Abstract

:
This study presents a precise and efficient methodology for evaluating the water-richness of the aquifer overlying the No. 3 coal seam in Hancheng Mine. A comprehensive assessment model was developed by integrating subjective and objective weighting through the sequential relationship analysis–entropy value method. This model facilitated the delineation of water-richness zones within the sandstone aquifer of the Shanxi Group associated with the No. 3 coal seam. Five key evaluation indices were selected based on the aquifer’s water-richness index: core recovery rate, thickness of water-rich sandstone, number of sand–mudstone interlayers, sandstone lithology coefficient, and the thickness ratio of brittle to plastic rock. Furthermore, an advanced evaluation model combining set pair analysis and variable fuzzy sets was established to assess the water-richness risk levels across the entire Hancheng mining area. The results reveal distinct spatial patterns in water-richness: the northeastern region exhibits strong water-richness, while the southwestern area is characterized by medium to weak water-richness over a broad expanse. Overall, the No. 3 coal seam in the Hancheng mining area is classified as having a medium risk level of water-richness.

1. Introduction

Mine water inrush has emerged as a critical safety concern that significantly impedes the sustainable development of China’s coal resources. Effective scientific management of mine water hazards has become an essential aspect of coal mine production nationwide. The hydrogeological conditions in China’s coal-bearing strata are characterized by diverse and structurally complex water-bearing media, exhibiting heterogeneous, anisotropic, and discontinuous properties, including sandstone aquifers and karst fissures. Consequently, the assessment and zoning of water-richness in aquifers have become fundamental for mine water hazard prevention and control.
Current research has made significant progress in this field. Wu Q’s “Three Maps—Double Prediction Method” stands out as a well-developed evaluation technique [1], highlighting two critical factors influencing coal seam roof water inrush: the water-richness of aquifers within the water-conducting fracture zone and the hydraulic connection between this zone and surrounding aquifers post-mining. In the Hancheng mining area, Dong F et al. conducted a comprehensive analysis of water inrush mechanisms in the No. 11 coal seam, revealing significant cation exchange effects during Ordovician limestone water inrush and its impact on groundwater ion concentrations, providing valuable insights into the hydrochemical evolution in North China’s coalfields [2]. Various methodologies have been developed for water-richness assessment. Dai G et al. established an index system using the relevant factor method, focusing on the vulnerability index method for floor water inrush prediction [3]. Niu C et al. developed a comprehensive evaluation system for the Lilou coal mine, incorporating AHP-based weighting of controlling factors such as aquifer water-richness, geological structures, and fracture development characteristics. Advanced evaluation techniques have been implemented in various mining contexts [4]. Xiao L et al. established an evaluation index system for the Jisan coal mine, incorporating ten factors including fault density and aquifer characteristics, using the AHP–CRITIC comprehensive weighting approach [5]. Ma X et al. combined water quality analysis with water-conducting fracture zone assessment in the Xinzhuang coal mine, employing both AHP and water-richness index methods [6]. Liu W et al. demonstrated the consistency between numerical simulation and EM–AHP methods in assessing water inrush risks [7]. Recent innovations include Yang L et al.’s application of optimized support vector machine methods for aquifer water-richness prediction in the Hongliulin Mine [8,9] and Cheng X et al.’s integration of fuzzy AHP and entropy weighting methods for vulnerability assessment using GIS [10]. Chen Y et al. developed a six-indicator system for water-richness evaluation under specific hydrogeological conditions in Zhaolou Coal Mine [11], while Han C et al. established a comprehensive evaluation model for the Ningdong mining area, demonstrating the superiority of set-pair analysis–variable fuzzy set coupling in reflecting evaluation levels and indicator relationships [12]. Qiu M et al. employed empirical formulas and a generalized regression neural network (GRNN) to determine the development height of water-conducting fracture zones. They proposed a combined weighting method based on the Analytic Hierarchy Process (AHP), rough set theory, and the minimum deviation method to determine the dominant controlling factors, thereby establishing a water abundance evaluation model for clastic rock aquifers [13]. Kuo W et al. utilized grey relational analysis to screen dominant controlling indicators of aquifer water abundance and developed a water abundance prediction model for sandstone aquifers by integrating principal component analysis (PCA) with a BP neural network [14]. Xue D et al. constructed a water abundance model for aquifers based on the PSO–GA–BP neural network using limited hydrogeological data. Comparative analysis showed that the PSO–GA–BP neural network model achieved higher accuracy than traditional prediction methods [15]. These diverse methodologies and case studies collectively contribute to a more comprehensive understanding and improved assessment of water-richness in coal-bearing strata, providing valuable tools for mine water hazard prevention and control in China’s complex mining environments.
Previous studies on coal mine water abundance evaluation predominantly adopted subjective–objective coupling methods, which mitigated the limitations inherent in single-method weighting approaches. However, conventional combined weighting methods treated water abundance assessment as a deterministic problem, neglecting the inherent uncertainties and inter-indicator connection degrees. To address this limitation, this study innovatively integrates sequential relation analysis–entropy weight combined weighting method for water abundance zoning evaluation with set pair analysis–variable fuzzy set methodology for risk classification. This dual-method framework holistically accounts for the relationships between indicator weights, variability, and connection degrees. By comparing water abundance zoning results with risk levels, the accuracy of coal seam roof water abundance evaluation is enhanced. The synergistic application of combined weighting and set pair analysis–fuzzy variable set theory significantly improves the accuracy, dynamic adaptability, and decision operability of coal mine roof water hazard risk assessment through dual mechanisms of weight optimization and uncertainty modeling, providing an end-to-end solution spanning from theoretical frameworks to practical implementations for water hazard prevention and control.

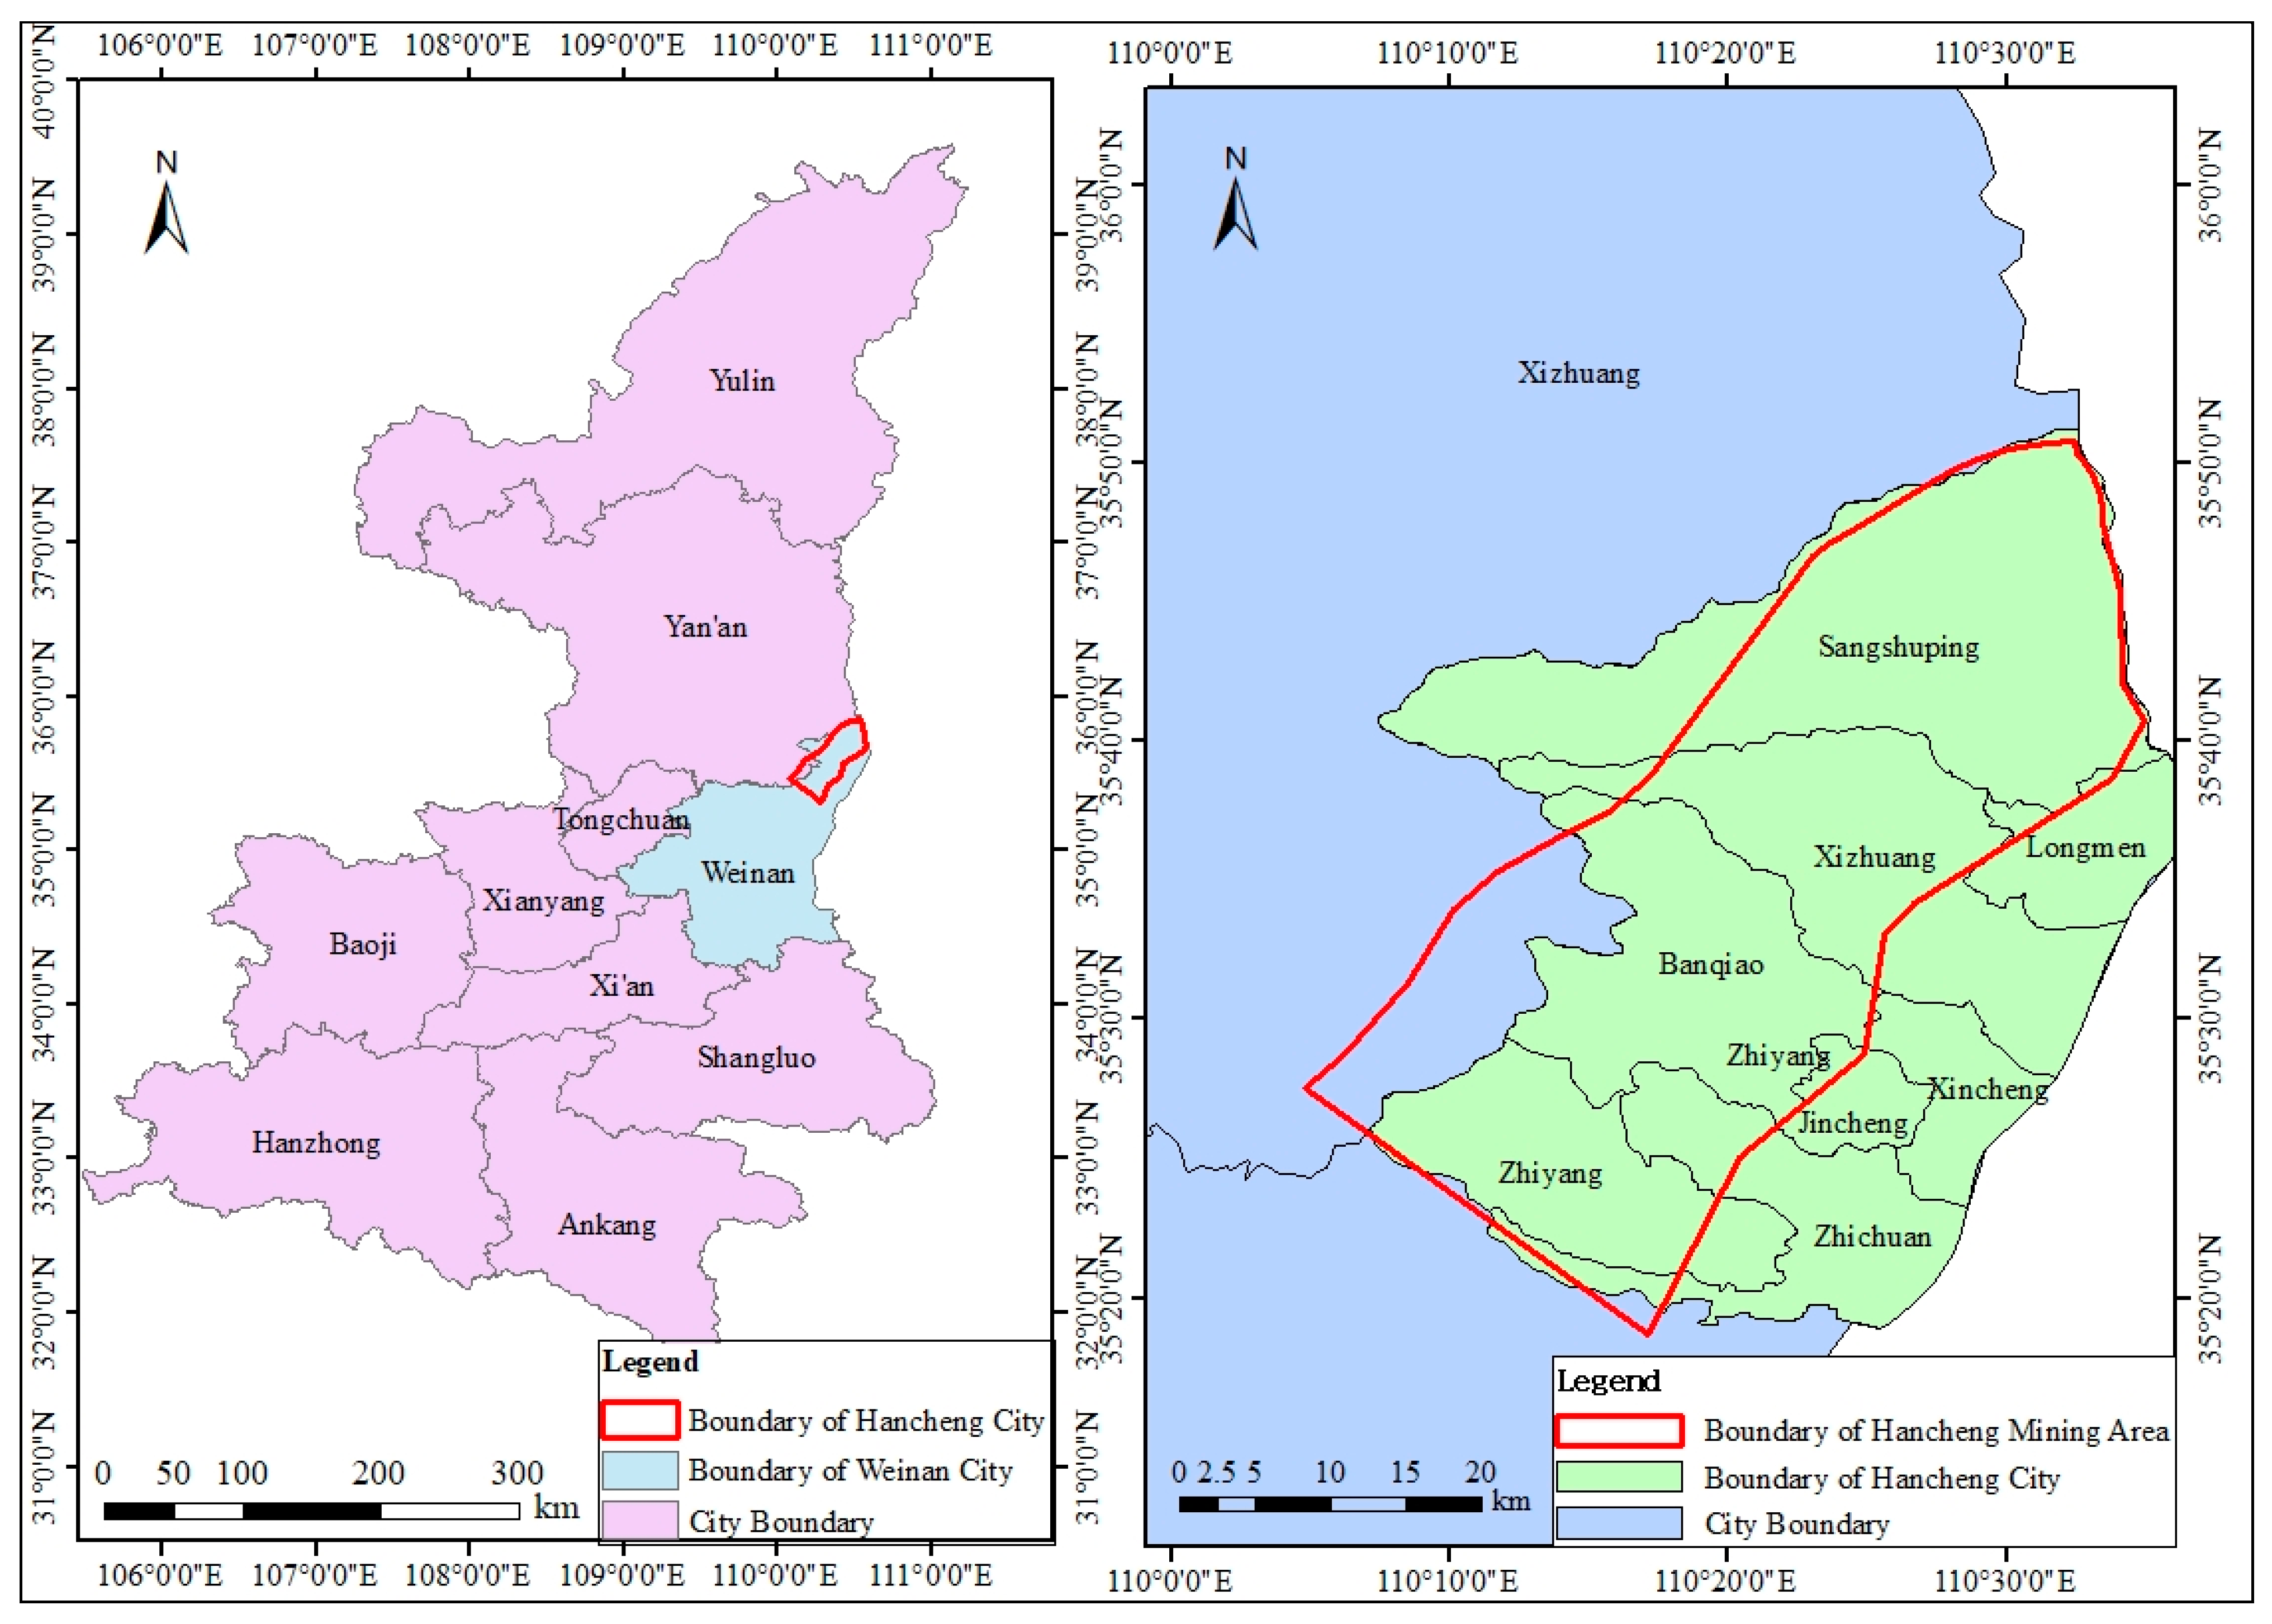
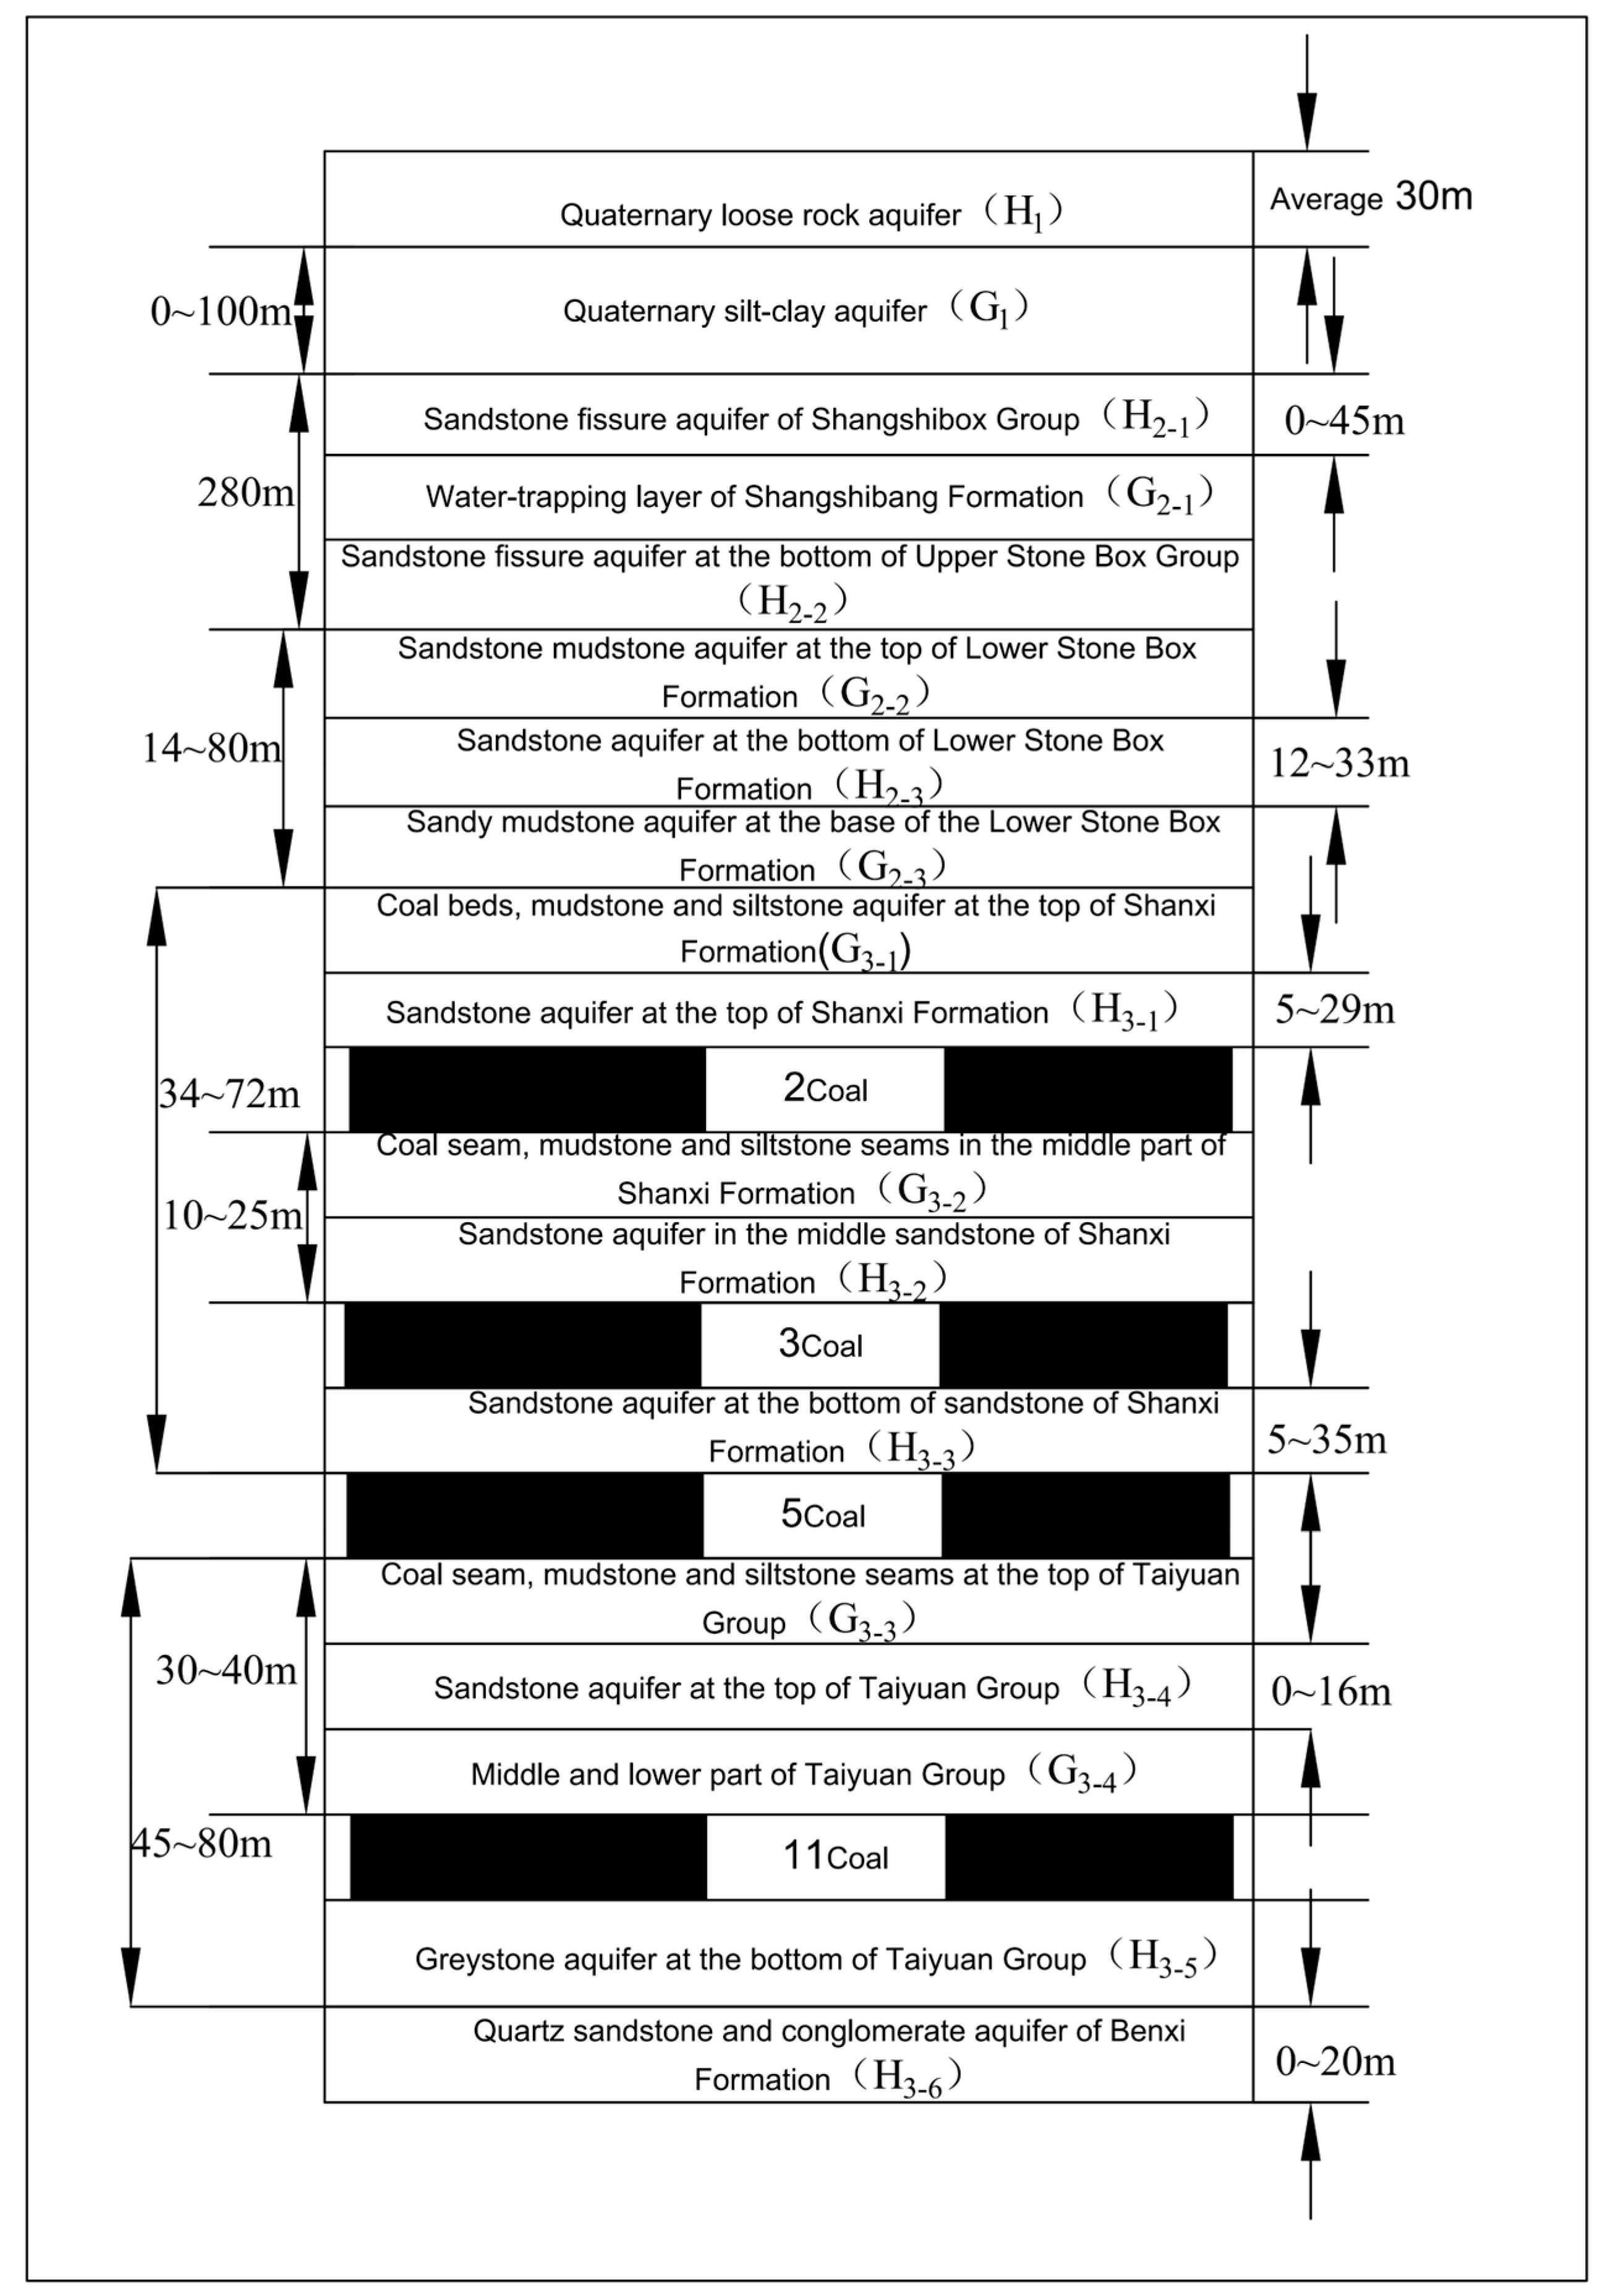
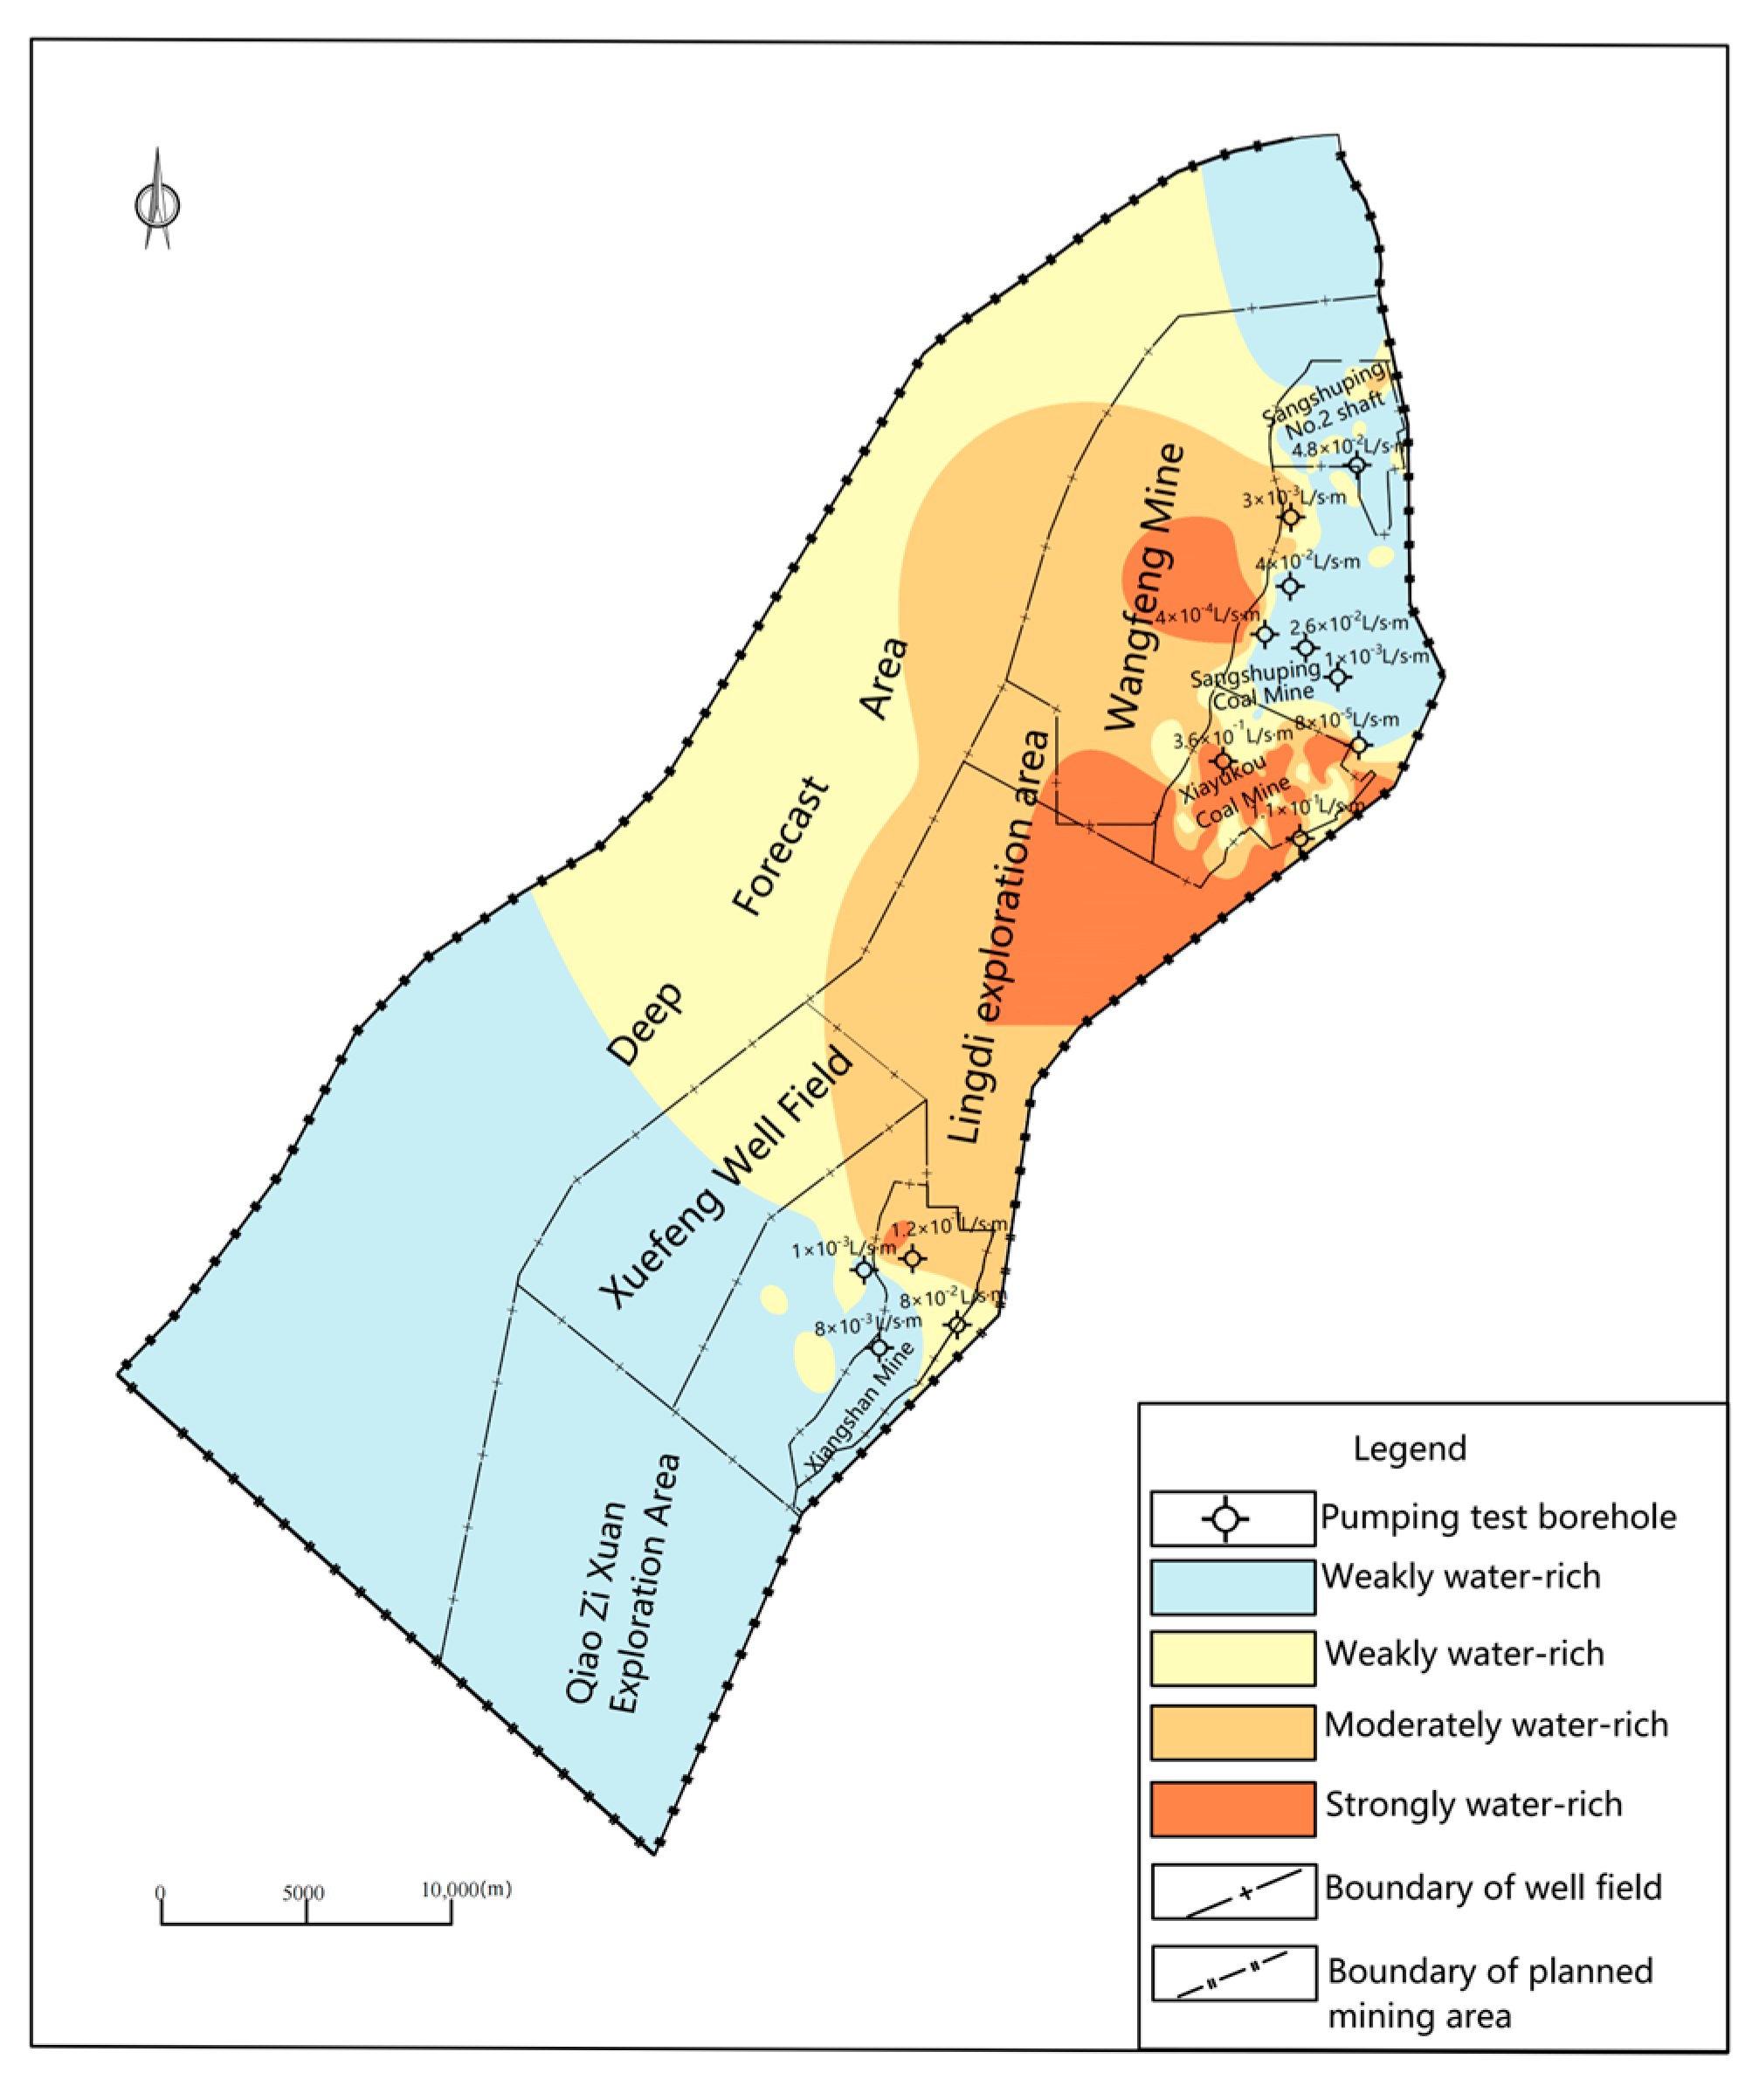
2. Overview of the Mining Area

The Hancheng mining area is situated within the Weibei Carboniferous–Permian Coal Field, administratively governed by Hancheng City in Shaanxi Province (Figure 1). The region is characterized by a predominantly hilly terrain, featuring complex topography with winding ridges and elongated valleys. The elevation varies significantly across the area, creating a diverse landscape. The mining area extends approximately 55 km in the north–south direction and 12 km in the east–west direction, encompassing a total area of 561.4 square kilometers. Geologically, the coal-bearing strata in this region primarily consist of the Taiyuan Formation and Shanxi Formation. The stratigraphic sequence, from oldest to youngest, includes the Permian (P), Triassic (T), and Quaternary (Q) periods. The complete stratigraphic profile comprises the Blossom Group (Ar4s), Huoshan Formation (Z), Cambrian System (∈1), Ordovician System (O), and Carboniferous System (C). This geological framework provides the foundation for the coal deposits in the Hancheng mining area.
The hydrogeological setting of the study area is characterized by the sandstone aquifers of the Upper and Lower Shihezi Formation and the Shanxi Formation, which constitute the primary water-bearing aquifers overlying the coal seam (Figure 2). By gathering the current pumping test data in the Hancheng mine area, it was determined that the overall water-enriched nature is weak and that the water influx per unit of the Shanxi Group’s sandstone aquifer superimposed on the coal stratum is q = 0.000084~0.45 L (s-m) with a moderately water-enriched local area. A total of 44 sandstone water surges occurred in the Hancheng mine, accounting for 29.5% of the total number of water surges, posing a certain threat to the safe production of coal mines, so it is necessary to evaluate the danger of roof water surges in the No. 3 coal seams covered by the whole area.

3. Selection of Water-Richness Indicators

This scientifically designed index system was then applied to evaluate the water-richness characteristics of both the roof and floor aquifers associated with the No. 3 coal seam in the Hancheng coal mine. The methodology provides a systematic approach for assessing water-richness by considering both the storage capacity and the hydrogeological properties of the aquifer system.
(1)
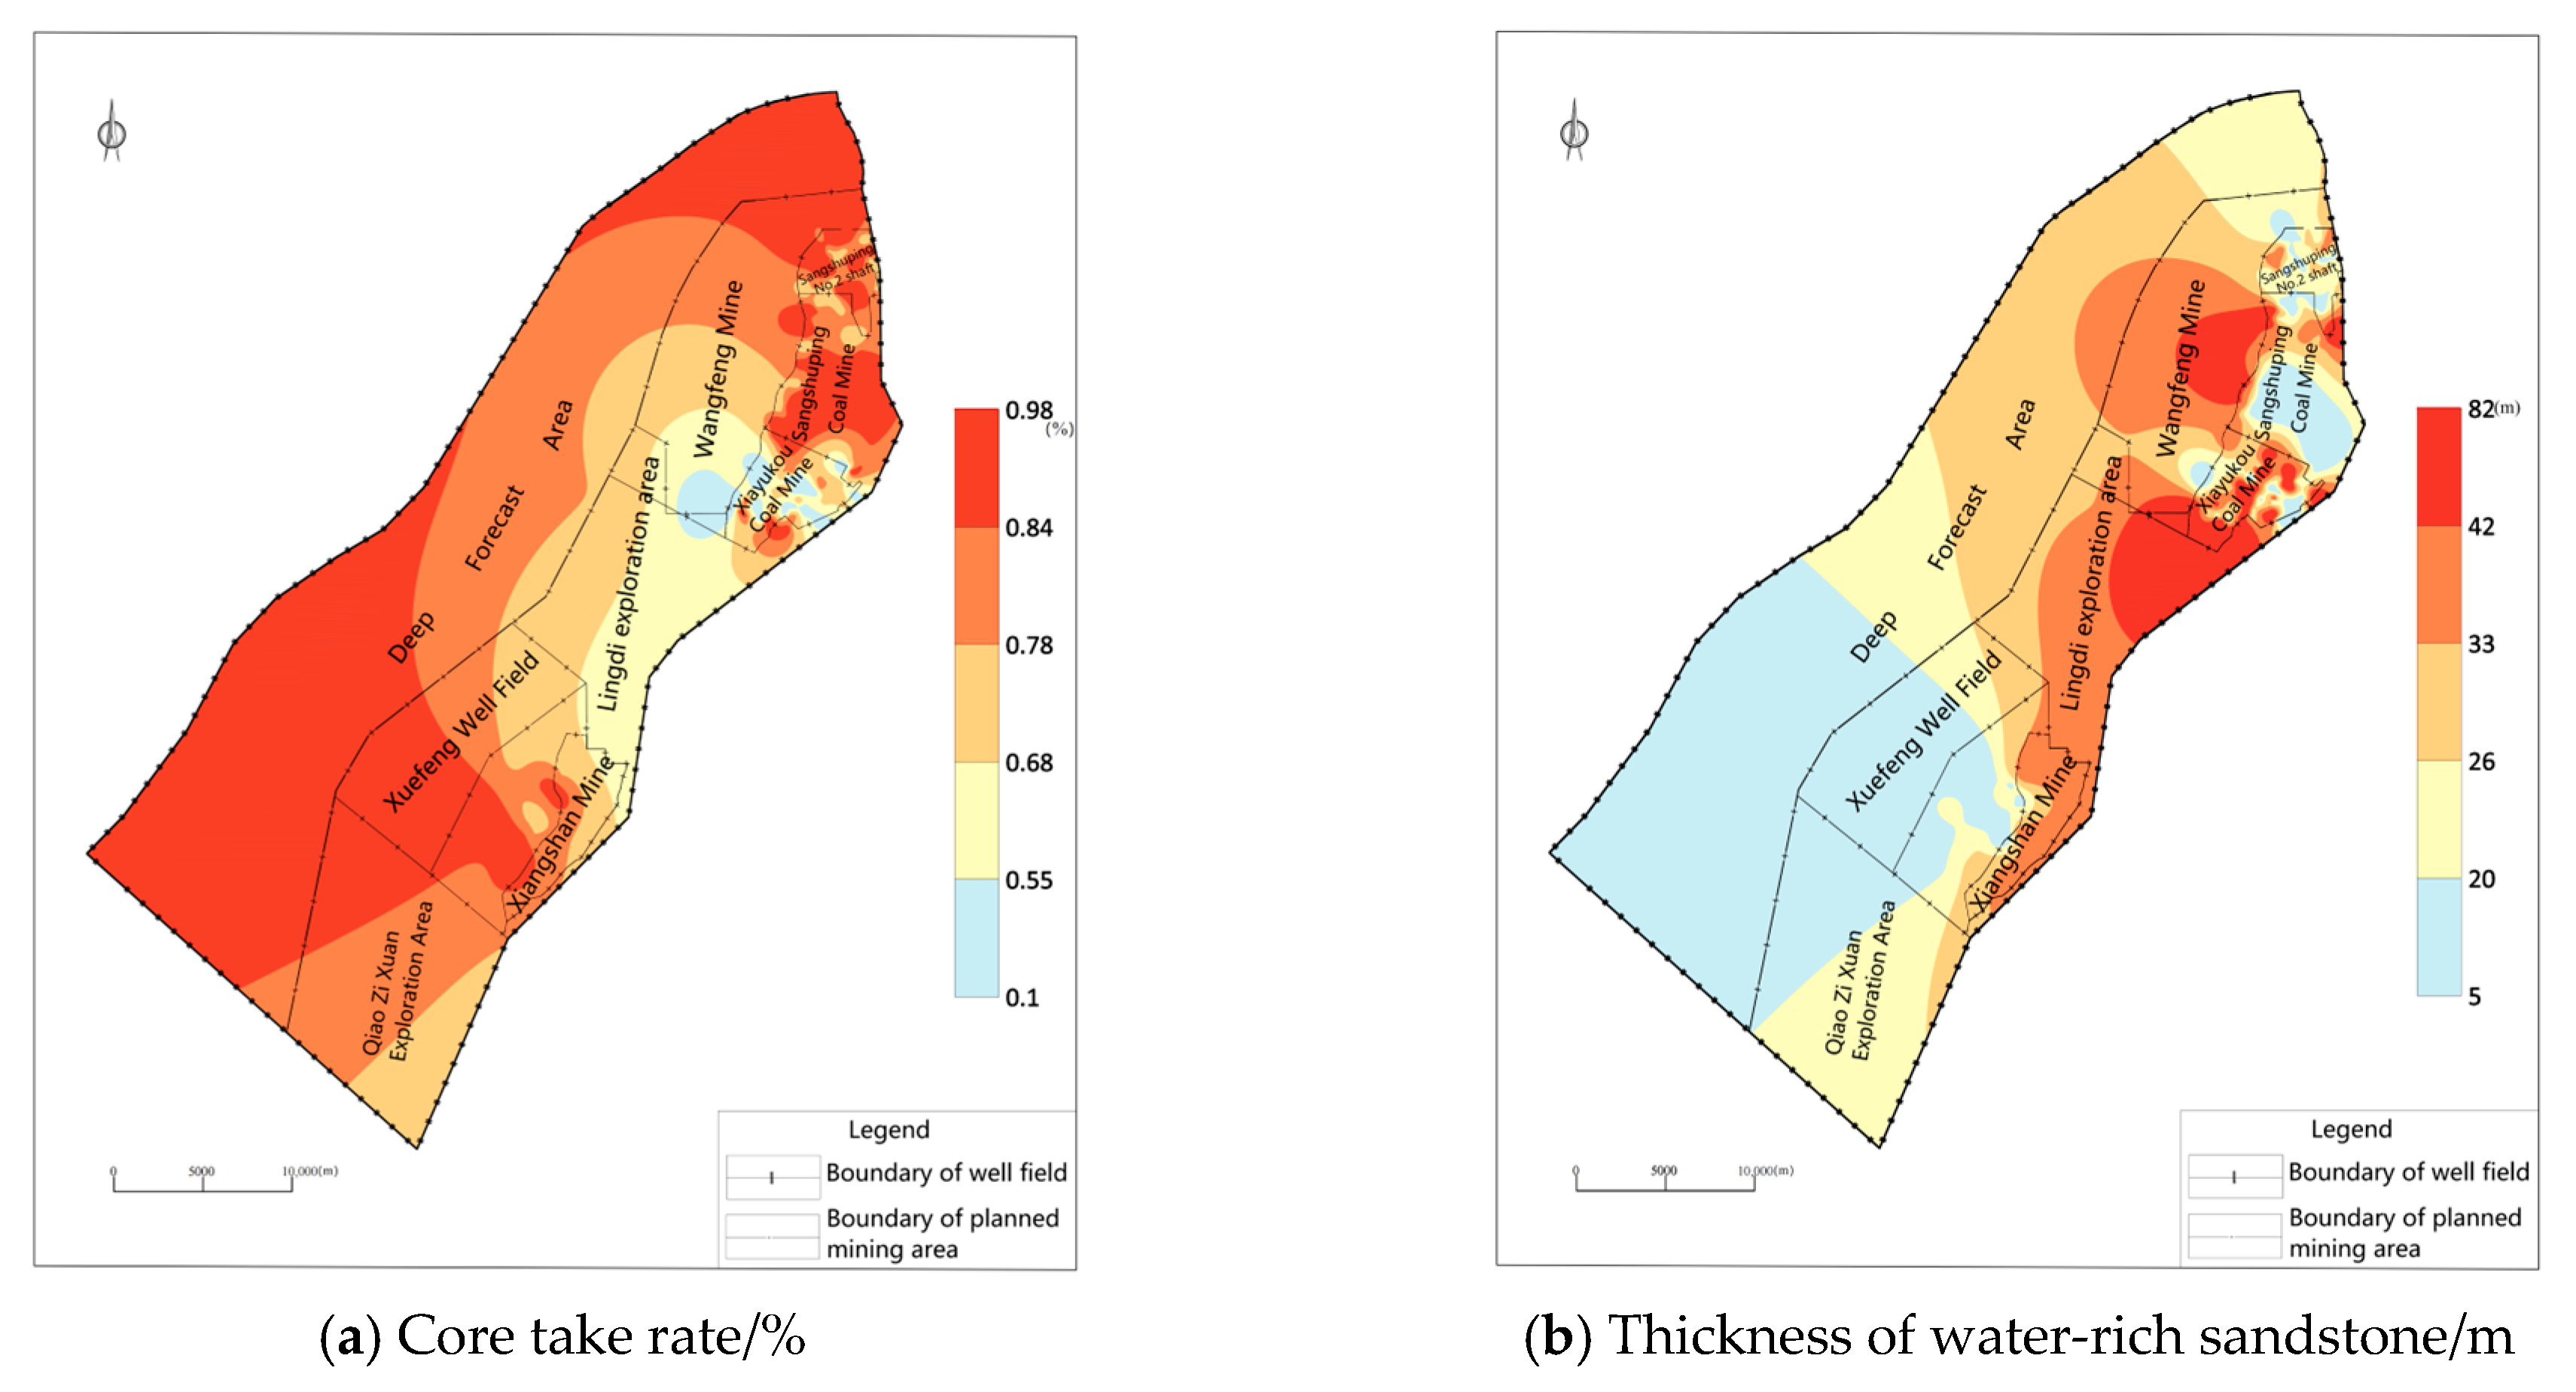
Core take rate. The rock’s integrity can be inferred from the core take rate; the lower the take rate, the more fractured the rock, the greater the water-richness, and the larger the water storage space (Figure 3a).
(2)
Water-rich sandstone equivalent thickness. As per Equation (1) (Figure 3b), the scale factor of 1, 0.8, and 0.6 indicates that coarse [16], medium, and fine sandstones, respectively, are among the water-rich sandstones.
L = a × 1 + b × 0.8 + c × 0.6
Here, L is water-rich sandstone equivalent thickness, and a, b, and c represent the thickness of coarse, medium, and fine sandstones, respectively.
(3)
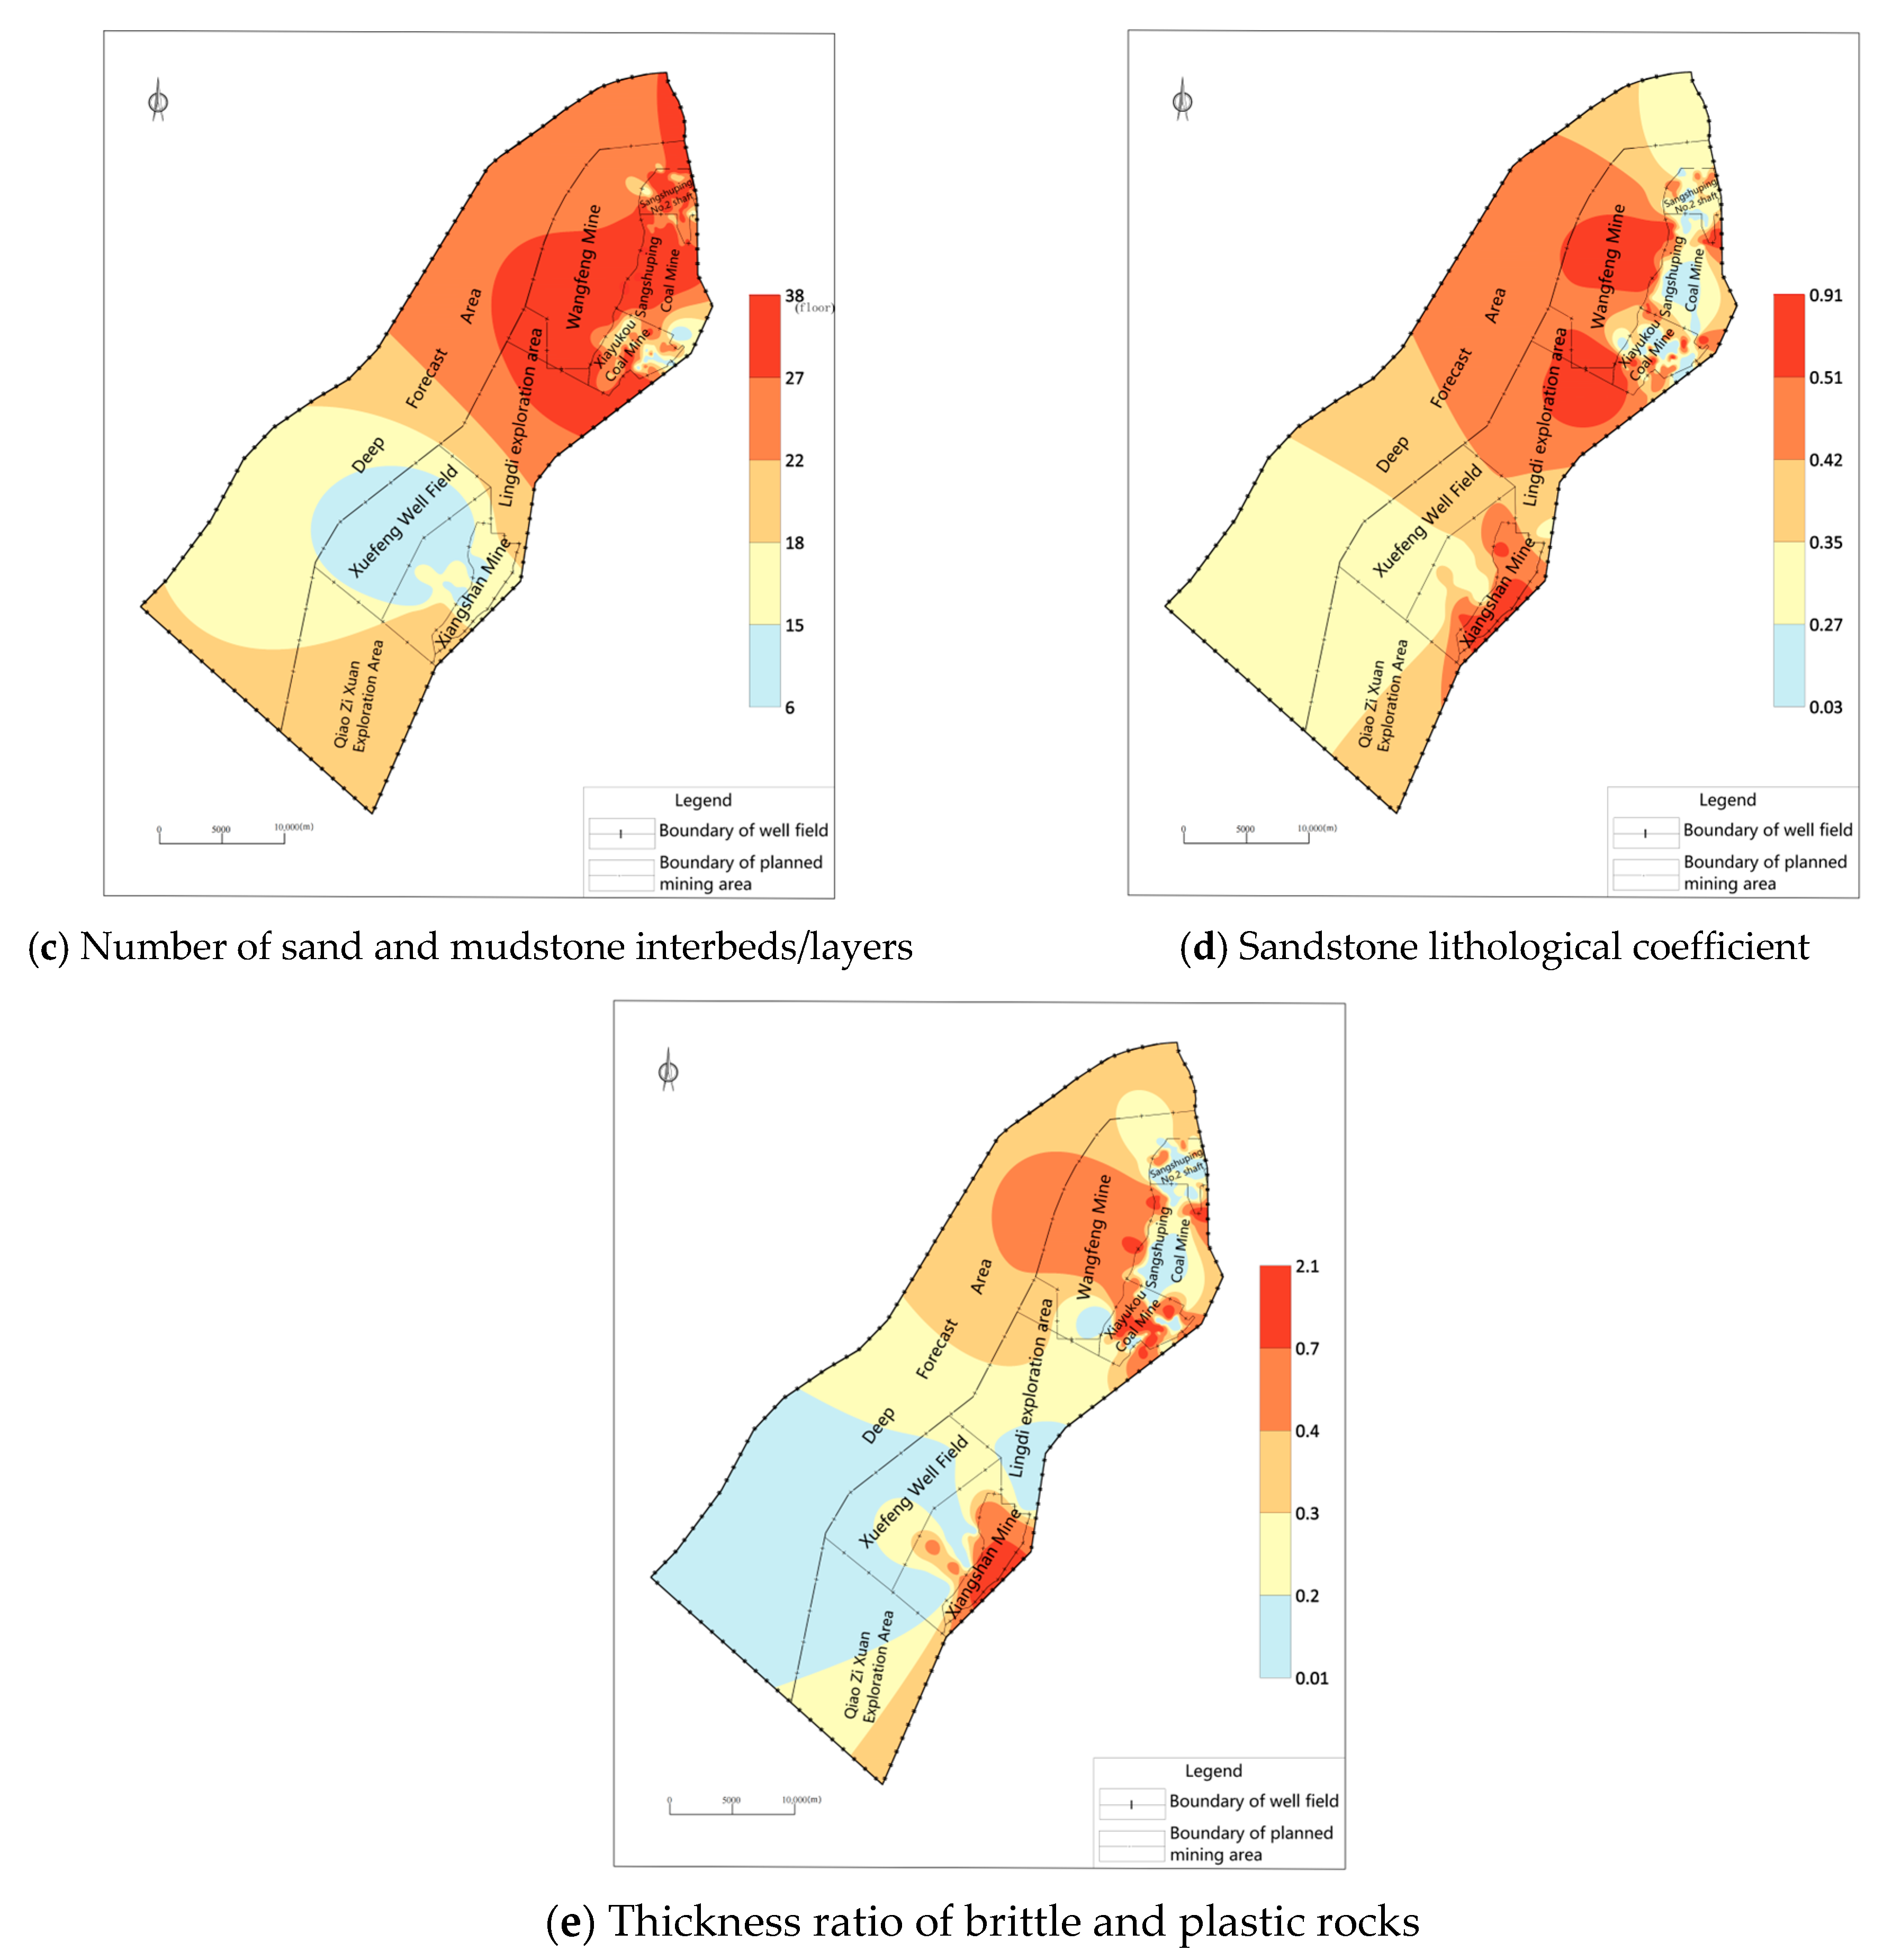
The quantity of interbedded mudstone and sandstone strata. The amount of sand and mudstone interlayers in the aquifer has an impact on the aquifer’s permeability coefficient. The permeability coefficient decreases with increasing sand and mudstone interlayer density (Figure 3c).
(4)
The lithology coefficient of sandstone. The ratio of the aquifer’s water-rich sandstone thickness to its overall thickness is known as the sandstone lithology coefficient; the greater this ratio, the more strongly the aquifer is water-rich (Figure 3d).
(5)
Brittle plastic rock thickness ratio. Sandstone and siltstone make up the majority of the brittle and plastic rock layers, respectively. When subjected to force, the rock layers exhibit varying rupture characteristics. The brittle rock will crack more when forced, increasing the water-richness of the layer (Figure 3e).

4. Evaluation of Water-Richness

4.1. Evaluation of Water-Richness Zoning Based on Ordinal Relationship Analysis–Entropy Value Method

Due to the limited number of pumping test boreholes and the small control range in the actual production process, the unit water influx can directly reflect the water richness of the aquifer [17]. However, the unit water influx has greater limitations when used alone, which can lead to inaccurate evaluation results. This time, it serves as an index to gauge the water-richness. The primary determinants of water-richness are determined by thoroughly examining the geological data of the mining region. These include the core taking rate, the thickness of the water-rich sandstone, the number of interlayers between the sandstone and mudstone, the sandstone lithology coefficient, and the thickness ratio of the brittle and plastic rock. The primary control factors were previously evaluated using the hierarchical analysis approach, the entropy weight method, and the coefficient of variation method, all of which had the drawback of being overly subjective or objective.
Thus, this time, based on an analysis and comparison of the findings from earlier research, two methods are chosen: first, the entropy value method is chosen to establish the objective weights, which can address the correlation between the data and enhance the evaluation’s accuracy. Secondly, in order to avoid the objective weighting method relying too much on sample data, poor participation, and can not reflect the evaluator’s emphasis on different factors [18,19], the order relation analysis method is selected. This method solves the problem that the analytic hierarchy process needs consistency test. In the case of sufficient indicators, the workload of the adjustment matrix can be reduced. Finally, the multiplicative synthetic normalization method is used to determine the integrated weights, and the spatial information overlay function of GIS is used to superimpose and compound the normalized data into the quantitative indicators of water richness and to establish the water richness index model. The hierarchical analysis method requires the consistency test and can reduce the workload of adjusting the matrix when there are enough indicators.

4.1.1. Model Construction Workflow

1.
Order relationship analysis method [20]
(1)
Establish the order relationship between the indicators. To do this, first ascertain the significance of the first level of indicators for the target level. For example, if indicator X1 is significant in relation to indicator X2, it will be recorded as X1 > X2, and so on to determine the ordinal relationship between the indicators.
(2)
Ascertain the relative importance of the adjacent indicators. In the indicator system, Xk−1 and Xk are adjacent indicators, and the decision maker determines the importance of the two indicators, resulting in an indicator importance ratio Rk, as shown in Table 1.
R k = W k 1 W k ,   k = n , n 1 , n 2 3
Here, the indicators Wk−1 and WK represent the importance of Xk−1 and Xk, respectively, and n is the number of indicators.
(3)
Calculate the weight coefficients. The weight coefficient of the nth indicator is Wn, which is defined and computed as follows in Equations (3) and (4).
W n = 1 + k = 2 n i = k n R i 1
W k 1 = R k W k , k = n , n 1 , n 2 , , 3 , 2 , 1
(4)
Find out how much each indicator value is weighted in relation to the target level. Wp is the weight coefficient of the pth criterion under the objective layer, Wq is the weight coefficient of the qth indicator for the pth criterion under the pth criterion, and Wpq is the weight coefficient of the qth indicator under the pth criterion layer in the total objective layer. A questionnaire poll of five experts yielded a ratio of the indicators’ importance at one level (Table 2), which was based on Table 1.
2.
Entropy value method [21,22].
By calculating the weight of each indicator based on the amount of information it provides, the entropy value approach may assess the degree of dispersion of a given indicator. Conversely, the more the weight and the type of indicators, the less the information entropy of the residuals of a single model prediction and the greater the degree of variability. The following are the precise steps:
(1)
Build the initial matrix (5), choosing n boreholes and m indications, which displays the original matrix X with m rows and n columns:
X = X ij m × n
(2)
Data standardization. The method of extreme difference is selected to remove the influence of the indicator’s outline because of the significant variations in each indicator’s data. When variables have different units or vastly varying numerical scales, standardization eliminates the impact of dimensionality and scale differences in the model, ensuring comparability across variables. Equations (6) and (7) for positive and negative indicators, respectively, will be dimensionless. The precise procedure is as follows,
x ij = x ij min x ij , , x nj max x 1 j , , x nj min x 1 j , , x nj
x ij = max x 1 j , , x nj x ij max x 1 j , , x nj min x 1 j , , x nj
where max xij is the largest value in the indicators and max xij is the smallest one.
(3)
Calculation of specific gravity Pij:
p ij = x ij i = 1 n x ij , i = 1 , , n ; j = 1 , , m
(4)
Calculate the entropy value ei
e i = K i = 1 n p ij ln p ij
where K = 1 ln ( n ) > 0 , then e j 0 .
(5)
Calculate information entropy redundancy dj:
d j = 1 e j
(6)
Calculate the weights of the indicators Wj:
W j = d j j = 1 m d j
3.
Integrated subjective and objective empowerment
The total weights of the primary control factor Ai were determined using the multiplicative synthetic normalization approach, as shown in Equation (12). Under the ith technique of assignment, the weight of the jth indicator is represented by the notation aij,
A i = i = 1 n a ij / j = 1 n i = 1 m a ij
where aij is the weight of the jth indicator under the ith assignment method.

4.1.2. Zoning Evaluation Results

According to “The Rules for Water Control in Coal Mines” (developed and issued by the State Administration of Coal Mine Safety, the rules shall come into force on 1 September 2018, henceforth referred to as the “Rules”), the water-richness of the aquifer is classified into weak, medium, strong, and very strong water richness based on the size of the unit water influx q. (Table 3). Data from aquifers pumping test results show that the greatest unit water ingress was 0.45 L/s·m, and no borehole with strong or extremely strong water-richness was discovered. The weak water-richness can be further divided into weaker water-richness (q ≤ 0.01 L/s·m) and weak water-richness (0.01 < q ≤ 0.1 L/s·m), and the medium water-richness into medium water-richness (0.1 < q ≤ 0.2 L/s·m) and stronger water-richness (0.2 < q ≤ 0.45 L/s·m). This will improve the water-richness zoning in coal mines. The water-richness index was then partitioned using the natural breakpoint method and fitted to the unit influx data; in order to make sure that the partitioning results are consistent with the unit influx data, if the gap is significant, the anomalous difference of the primary control factors should be looked into and the weights adjusted.
Based on Equation (12), the weights of the indicators are calculated as shown in Table 4.
Based on the weights of each influence index, a weighted summation method was used to construct a water-richness index model for the roof of No. 3 coal seams in the Hancheng mine area, as shown in Equation (13).
F = 0.3267 X 11 + 0.2309 X 12 + 0.0385 X 21 + 0.1262 X 22 + 0.2777 X 23
According to the calculation results of the water-richness index model, the water-richness zoning map of the No. 3 coal seam roof was drawn; then, the aquifer water-richness is categorized into weaker, weak, medium, and strong by using the natural discontinuity method.

4.1.3. Validation of Evaluation Results

The results are shown by projecting the pumping test boreholes onto the water-richness zoning map (Figure 4) and verifying the results based on the unit influx ‘q’ of each borehole. The results show that the boreholes with a unit influx of 0.36 L/s·m are located in the stronger water-richness area, while 0.121 and 0.11 L/s·m are both located in the medium water-richness area. The majority of the boreholes with a water influx of less than 0.01 L/s·m are located in the weak water-richness area, and only one of them is located in the weaker water-richness area. This demonstrates that the evaluation results are more accurate and the water-richness zoning map with weights superimposed is in line with the real situation.

4.2. Evaluation of Water-Richness Risk Level

In order to further clarify the overall water-richness risk of the No. 3 coal seam in the Hancheng mine area, this paper proposes further calculation of the comprehensive water-richness risk level of the mine area. Based on the same evaluation indexes selected for water-richness zoning, the previous paper evaluated the water-richness zoning of the top plate of three coal seams in the Hancheng mine area using a combination of sequential relationship analysis and the entropy weighting method. This paper’s evaluation thus far has the ability to intuitively reflect the water-richness of three coal seams in each mine. In order to provide a reference for the planning of the entire area in the later stage of the Hancheng mine area, this paper proposes to further calculate the comprehensive water-richness risk level of the mine area and determine the water-richness risk level of the mine area, based on the same evaluation index as the water-richness zoning.

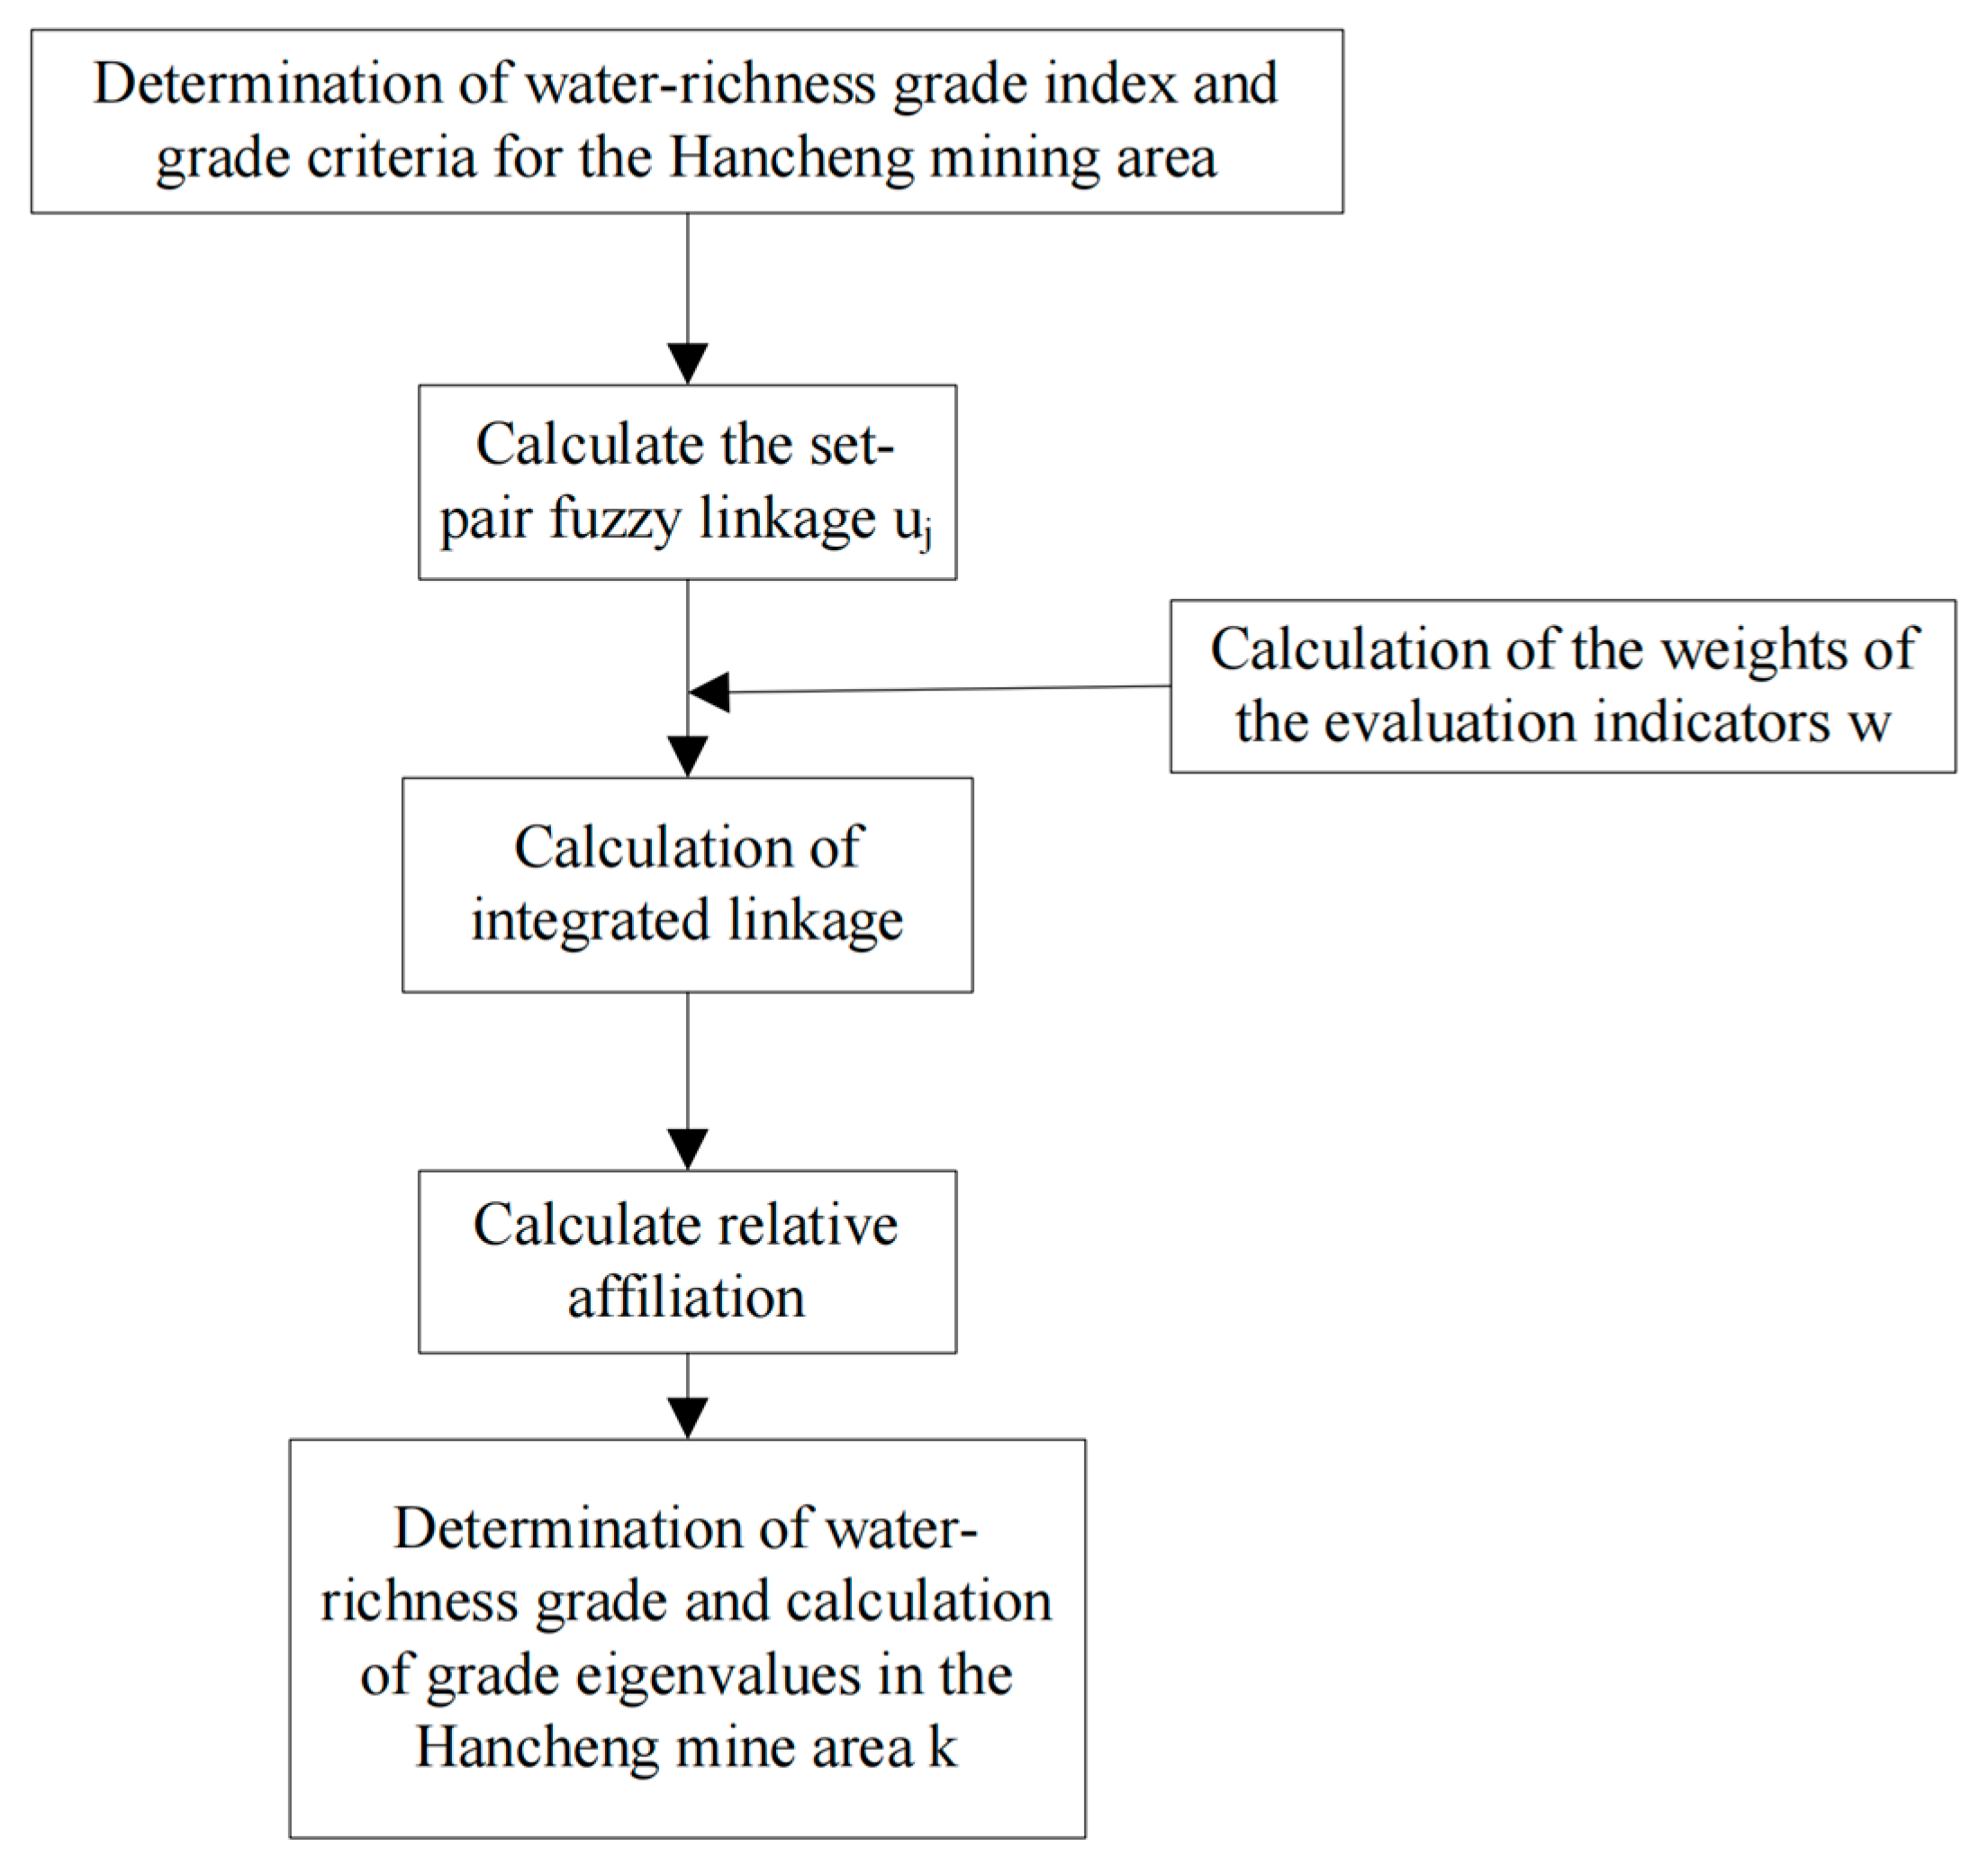
4.2.1. Theoretical Basis of Model Coupling

Zhao K [23] proposed set pair analysis as a system analysis technique for handling uncertainty resulting from fuzzy, random, mediated, and incomplete information. It is distinguished by evaluating various types of objective uncertainties and employing the degree of connectedness for dialectical analysis and mathematical processing.
The basic expression for the degree of connectedness is
u = a + bI + cJ ,
where a, b, and c [0, 1], and a + b + c = 1; a, b, and c represent the degree of congruence, degree of difference, and degree of opposition of set pairs, respectively; I and J represent the coefficients of the degree of difference and opposition, respectively, with a value interval of [−1, 1], which again indicates the difference only [24,25].
In order to streamline the evaluation process and increase the dependability of the outcomes, the paper investigates the use of the degree of relationship between roof water breakout and grade to create variable fuzzy sets [26]. The two fundamental ideas of variable fuzzy set theory are the two quantitative indices of relative affiliation and relative difference [27]. Fuzzy set theory with uncertainty is studied during mining to address the complex system problem of a roof water leak induced by coal seam mining, which has substantial uncertainty.
The relative affiliation of A with the attraction property is denoted as μA(u), and the relative affiliation of Ac with the repulsion property is denoted as μcA(u). Additionally, 0 ≤ μA(u) ≤ 1, 0 ≤ μcA(u) ≤ 1, and μA(u) + μcA(u) = 1 can be found for any element u, u ∈ U, in U, at any point on the continuous numerical axis where the relative affiliation function is located. The relative degree of difference between u and A is defined as DA(u), and when X is to the left of point P, the relative difference function is modeled as the following Equation (15).
D A x = x a P a β , x a , P x a c a β , x c , a
When x is to the right of point P, the relative difference function is modelled as follows:
D A x = x b P b β , x P , b x b d b β , x b , d
From the above opposing fuzzy concepts, μ A u + μ A c u = 1 , and relative difference function formulas for fuzzy concepts (15) and (16), relative affiliation μ A u , can be calculated, as shown in the following Equation (17).
μ A u = 1 + D A u 2

4.2.2. Risk Grading Evaluation Results

There are many uses for set pair analysis and variable fuzzy set theory, and while each has benefits and drawbacks, combining the two approaches to assess the risk of coal mine water hazards provides a more rational and scientific approach. The linkage number determined by the set pair analysis method is employed as the relative difference degree of the variable fuzzy set to create the coupling of the two in this study, which links the set pair analysis and variable fuzzy set method through the linkage number theory [28].
1.
Calculation of linkage degree
Set pairs make up the evaluation grade standard set Dk and the indicator set R, R = (r1, r2,…, rn) of the evaluation object, as per the set pair analysis–variable fuzzy set coupling (SPA-VFS) approach [29]. The determination of the linkage degree of two sets in a set pair is the key to set pair analysis, and in previous studies, the linkage measure IDO method has been widely used due to the simplicity of method application [30]. The value of the linkage degree is in the interval of [−1, 1], and the linkage measure ID technique based on linear trapezoidal change is chosen in this work to determine the linkage between the indicator score and its linkage with each evaluation grading standard set.
Experts’ score for the risk assessment index of water damage in coal mines Equations (18)–(22) illustrate how a single indicator to the five risk levels of the degree of connection is calculated based on their comprehension of the real circumstances of a coal mine. The lower the score, the better:
Indicator j to the first rank linkage degree:
μ j 1 = 1 s 0 j r j s 1 j 1 2 r j s 1 j s 2 j s 1 j s 1 j < r j s 2 j 1 s 2 j < r j s sj
Indicator j to the second rank linkage degree:
μ j 2 = 1 2 s 1 j r j s 1 j s 0 j s 0 j r j s 1 j 1 s 1 j < r j s 2 j 1 2 r j s 2 j s 3 j s 2 j s 2 j < r j s 3 j 1 s 3 j < r j s 5 j
Indicator j to the third rank linkage degree:
μ j 3 = 1 s 0 j r j s 1 j 1 2 s 2 j r j s 2 j s 1 j s 1 j < r j s 2 j 1 s 2 j < r j s 3 j 1 2 r j s 3 j s 4 j s 3 j s 3 j < r j s 4 j 1 s 4 j < r j s 5 j
Indicator j to the fourth rank linkage degree:
μ j 4 = 1 s 0 j r j s 2 j 1 2 s 3 j r j s 3 j s 2 j s 2 j < r j s 3 j 1 s 3 j < r j s 4 j 1 2 r j s 4 j s 5 j s 4 j s 4 j < r j s 5 j
Indicator j to the fifth rank linkage degree:
μ j 5 = 1 s 0 j r j s 3 j 1 2 s 4 j r j s 4 j s 3 j s 3 j < r j s 4 j 1 s 4 j < r j s 5 j
2.
Risk level standard and classification
Citing the standard for classifying risk levels in the reference [31], experts and scholars have classified the risk level into five categories(Figure 5).
According to the risk classification standard, 20 experts were selected to score each index factor based on the evaluation index and the classification standard, and the scoring of the 20 experts was weighted (Table 5) so as to eliminate the difference of single subjective cognition and improve the accuracy of the scoring results. The final weighted average result was taken as the scoring value of the risk of sudden water.
The scoring results in Table 5 show that the sandstone lithology coefficient index scores the highest value, so it has the greatest influence on the water-richness of the roof, while the number of sandstone mudstone interlayers has the smallest influence.
The steps of the evaluation are as follows in Figure 6:
Establish the set of grade evaluation standards and the evaluation indexes for the water-enrichment grade of coal seam roofs. Determine the degree of single exponential correlation between the index values and the extent of damage to the mine roof based on the degree of set fuzzy correlation. Then, combine the weights of each index factor to determine the relative difference between the samples and the grading criterion k. The relative affiliation degree of the level k to which the sample belongs is found by constructing the relative difference degree of the variable fuzzy set variables. The evaluation level for the relative affiliation degree is determined, along with the grade eigenvalues of the evaluation level. A quantitative description of the mine’s classification into a particular level and its associated risk level are provided.

4.2.3. Comprehensive Evaluation Results

Table 6 and Table 7 present the calculation results based on the eigenvalue calculation and the confidence guideline to ascertain the water-richness danger level of the Hancheng mine region.

5. Conclusions

(1)
The sandstone aquifer’s water-richness is dependent upon its connectivity and storage capacity. Five evaluation factors, including core taking rate, water-rich sandstone thickness, sand mudstone interlayer thickness, sandstone lithology coefficient, and brittle–plastic layer thickness ratio are chosen to construct the sandstone aquifer lithology influence index based on an analysis of the geological data of the mining area from the perspective of water-richness.
(2)
Based on the lithological and structural characteristics of the sandstone aquifer in the study area, an evaluation model for the water richness of the roof sandstone was established using the ordinal relationship analysis–entropy method, and the water richness of the Shanxi Formation aquifer was predicted. The relative grades of water richness and their zoning were delineated and compared with the pumping test results of the aquifer. It was determined that the water richness is strong in the northeastern part of the Hancheng mining area, moderate to weak in the southwestern part, and decreases from west to east across the mining area.
(3)
An evaluation model for the water richness of the aquifer was constructed based on the set pair analysis–variable fuzzy set evaluation method. According to the calculation results of characteristic values and the confidence criterion, it was judged that the water richness of the No. 3 coal seam roof in the Hancheng mining area is at a medium risk level. Combining the results of the comprehensive water richness evaluation model with subjective and objective weighting, the western part of the mining area has high water richness, while the northern and southern parts have low water richness. The mining company needs to strengthen precautions in the western region during coal seam mining to ensure safe extraction.

Author Contributions

Conceptualization, C.N. and L.X.; Data curation, X.X. and K.L.; Formal analysis, K.L.; Funding acquisition, L.X.; Investigation, G.D.; Methodology, X.X.; Project administration, L.X.; Resources, S.L.; Software, K.L.; Supervision, C.N.; Validation, X.X., S.L. and W.Q.; Visualization, C.N.; Writing—original draft, X.X.; Writing—review & editing, C.N., X.X. and G.D. All authors have read and agreed to the published version of the manuscript.

Funding

This research was funded by National Natural Science Foundation of China (Grant No.41807190).

Data Availability Statement

The data in this study have been explained in the article. For detailed data, please contact the first author or corresponding author.

Conflicts of Interest

Author Kai Liu was employed by the company Shaanxi Tiandi Geology Co., Ltd., authors Shoutao Luo and Wanxue Qian were employed by the company Shaanxi Shanmei Hancheng Mining Co., Ltd. The remaining authors declare that the research was conducted in the absence of any commercial or financial relationships that could be construed as a potential conflict of interest.

References

  1. Wu, Q.; Huang, X.; Dong, D.; Yin, Z.; Li, J.; Hong, Y.; Zhang, H. The “Three Maps-Double Forecast Method” for evaluating water inrush conditions in coal seam roof. J. China Coal Soc. 2000, 62–67. [Google Scholar] [CrossRef]
  2. Dong, F.; Yin, H.; Cheng, W.; Li, Y.; Qiu, M.; Zhang, C.; Tang, R.; Xu, G.; Zhang, L. Study on water inrush pattern of Ordovician limestone in North China Coalfield based on hydrochemical characteristics and evolution processes: A case study in Binhu and Wangchao Coal Mine of Shandong Province, China. J. Clean. Prod. 2022, 380, 134954. [Google Scholar] [CrossRef]
  3. Dai, G.; Xue, X.; Xu, K.; Niu, C.; Yang, T. Risk assessment of water inrush from No.11 coal seam floor in Hancheng mining area based on vulnerability index method. Coal Geol. Explor. 2017, 45, 112–117+125. [Google Scholar]
  4. Niu, C.; Tian, Q.; Xiao, L.; Xue, X.; Zhang, R.; Xu, D.; Luo, S. Principal causes of water damage in mining roofs under giant thick topsoil-lilou coal mine. Appl. Water Sci. 2024, 14, 146. [Google Scholar] [CrossRef]
  5. Xiao, L.; Li, F.; Niu, C.; Dai, G.; Qiao, Q.; Lin, C. Evaluation of Water Inrush Hazard in Coal Seam Roof Based on the AHP-CRITIC Composite Weighted Method. Energies 2022, 16, 114. [Google Scholar] [CrossRef]
  6. Ma, X.; Cheng, Z.; Cui, J.; Han, J.; Yin, C. Risk assessment of water inrush from the Jurassic Yan’an Formation No. 8 coal seam roof in the first mining area of Xinzhuang Coal Mine, Ningzheng mining area. Coal Sci. Technol. 2023, 51, 298–309. [Google Scholar]
  7. Liu, W.; Zheng, Q.; Pang, L.; Dou, W.; Meng, X. Study of roof water inrush forecasting based on EM-FAHP two-factor model. Math. Biosci. Eng. 2021, 18, 4987–5005. [Google Scholar] [CrossRef]
  8. Li, B.; Wei, T.; Liu, Z. Construction of water abundance evaluation index system for karst aquifer in coal seam roof and risk assessment of water inrush in Southwest China. J. China Coal Soc. 2022, 47, 152–159. [Google Scholar]
  9. Yang, L.; Lei, F.; Hou, E.; Lu, B.; Feng, D.; Zhao, K. Water abundance zoning of aquifer and segmented prediction of water inflow after mine drainage in working face. Coal Geol. Explor. 2023, 51, 114–123. [Google Scholar]
  10. Cheng, X.; Li, S.; Bian, K.; Yang, H.; Chang, J. Risk assessment of water inrush based on FAHP-EWM combined weighting method. Coal Mine Saf. 2024, 55, 184–193. [Google Scholar]
  11. Chen, Y.; Fan, G.; Yin, C.; Zhang, D.; Han, X. Evaluation and application of water abundance in roof of water-seepage roadway based on improved AHP-entropy weight coupling method. Coal Eng. 2023, 55, 141–146. [Google Scholar]
  12. Han, C.; Wei, J.; Xie, D.; Xu, J.; Zhang, W.; Zhao, Z. Water abundance evaluation of sandstone aquifer based on set pair analysis-variable fuzzy set coupling method: A case study of Jurassic Zhiluo Formation aquifer in Jinjiaqu Minefield, Ningdong mining area. J. China Coal Soc. 2020, 45, 2432–2443. [Google Scholar]
  13. Qiu, M.; Shao, Z.; Zhang, W.; Zheng, Y.; Yin, X.; Gai, G.; Han, Z.; Zhao, J. Water-richness evaluation method and application of clastic rock aquifer in mining seam roof. Sci. Rep. 2024, 14, 6465. [Google Scholar] [CrossRef]
  14. Kuo, W.; Li, X.; Zhang, Y.; Li, W.; Wang, Q.; Li, L. Prediction Model of Water Abundance of Weakly Cemented Sandstone Aquifer Based on Principal Component Analysis–Back Propagation Neural Network of Grey Correlation Analysis Decision Making. Water 2024, 16, 551. [Google Scholar] [CrossRef]
  15. Dai, X.; Li, X.; Zhang, Y.; Li, W.; Meng, X.; Li, L.; Han, Y. A Prediction Model of Coal Seam Roof Water Abundance Based on PSO-GA-BP Neural Network. Water 2023, 15, 4117. [Google Scholar] [CrossRef]
  16. Xiao, L.; Niu, C.; Dai, G.; Nie, W.; Zhang, H.; Gao, Y. Evaluation of water-richness of Zhiluo Formation based on water-richness structure index method. Coal Sci. Technol. 2018, 46, 207–213. [Google Scholar]
  17. Zhou, Q.; Zhang, H.; Jiao, Y.; Yu, B.; Guo, J. Risk assessment of water inrush from coal seam roof based on combined weighting method. Sci. Technol. Eng. 2022, 22, 3497–3503. [Google Scholar]
  18. Hou, E.; Yang, S.; Miao, Y.; Che, X.; Yang, L.; Lu, B.; Xie, X.; Wang, H.; Dang, B. Water abundance prediction of weathered bedrock based on Bayes discriminant analysis model. Coal Mine Saf. 2023, 54, 180–187. [Google Scholar]
  19. Li, P.; Hou, E.; Ji, Y. Water abundance evaluation of Luohe Formation aquifer based on subjective weight modified by standard deviation. China Energy Environ. Prot. 2023, 45, 25–31. [Google Scholar]
  20. Liu, J.; Yuan, X.; Liang, D.; Wang, C. Fire risk evaluation of energy storage power atstion based on G1-CRITIC combination weighting cloud model. J. Xi’an Univ. Sci. Technol. 2024, 44, 447–455. [Google Scholar]
  21. Tan, S.; Shen, Z. Safety evaluation of coal mine water penetration based on entropy method-mutation theory. J. Xi’an Univ. Sci. Technol. 2022, 42, 1064–1070. [Google Scholar]
  22. Zhang, H.; Wu, Q. Application of constant-weight vulnerability index method based on entropy method-FAHP for coal bed floor water breakage. Energy Environ. Prot. 2020, 42, 1–5+9. [Google Scholar]
  23. Zhao, K. A review of the application of set-pair analysis in system intelligent prediction. J. Intell. Syst. 2022, 17, 233–247. [Google Scholar]
  24. Pan, Q.; Zhou, R.; Wang, Y. Set-pair analysis and variable fuzzy set method for vulnerability assessment of regional water resources system. China Popul. Resour. Environ. 2016, 26, 198–202. [Google Scholar]
  25. Wang, M.; Li, L.; Jin, J. Set-pair analysis of mining building damage-variable fuzzy set comprehensive evaluation model. Coalf. Geol. Explor. 2008, 36, 39–41. [Google Scholar]
  26. Chen, S. Variable Fuzzy Set Theory and Methods for Water Resources and Flood Defence Systems. Dalian Univ. Technol. Dalian 2005, 22, 10–11, 16. [Google Scholar]
  27. Zhao, Z. Quantitative Evaluation of Geological Formations and Study on Water-Richness of Top Plate Sandstone Aquifer. Ph.D. Thesis, Shandong University of Science and Technology, Qingdao, China, 2021. [Google Scholar]
  28. Fan, J. Research on Evaluation of Sponge City Construction Based on Set-Pair Analysis-Variable Fuzzy Set Coupling. Ph.D. Thesis, Anhui University of Architecture, Hefei, China, 2018. [Google Scholar]
  29. Zhang, J. Research on Coal Mine Water Damage Risk Evaluation Based on Set-Pair Analysis-Variable Fuzzy Set Coupling. Ph.D. Thesis, Henan University of Science and Technology, Luoyang, China, 2023. [Google Scholar]
  30. Li, D. Research on Systematic Risk Evaluation Based on Generalized Set-Pair Analysis. Ph.D. Thesis, Northeastern University, Boston, MA, USA, 2010. [Google Scholar]
  31. Zhao, Y.; Wan, J. Risk evaluation of air traffic control operation based on set-pair analysis. J. Saf. Environ. 2018, 18, 871–875. [Google Scholar]
Figure 1. Geographical location map of the Hancheng mining area.
Water 17 01164 g001
Figure 2. The spatial relationship between the main coal seam and the water-bearing (diaphragm) seam.
Water 17 01164 g002
Figure 3. Evaluation of single-factor water-richness of the top plate of coal seam No. 3 in the Hancheng mine area.
Water 17 01164 g003aWater 17 01164 g003b
Figure 4. Water-richness zoning of the roof of No. 3 coal seams in the Hancheng mine area.
Water 17 01164 g004
Figure 5. Diagram of Risk Classification Standard.
Water 17 01164 g005
Figure 6. Flow chart of water-richness grades in the Hancheng mine area.
Water 17 01164 g006
Table 1. Assignment reference for RK.
Rk ValueClarification
1.0Indicators Xk−1 and Xk are equally important
1.2Indicators Xk−1 and Xk marginally important
1.4Indicators Xk−1 and Xk are clearly important
1.6Indicators Xk−1 and Xk are strongly important
1.8Extreme importance of indicators Xk−1 and Xk
1.1, 1.3, 1.5, 1.7Intermediate cases between indicator judgements
Table 2. Ranking Relationships and Ratio of Importance of Tier 1 Indicators.
MasterSerial RelationshipRatio of Importance
R
1X1 > X21.6
2X1 > X21.5
3X1 > X21.3
4X2 > X11.3
5X1 > X21.4
Table 3. Classification of the aquifer water-richness according to the ‘Rules’.
Water-Richness GradeWeakModerateStrongExtremely Strong
Unit water influx (L/s·m)≤0.10.1~11~5>5
Table 4. Combined weights of factors.
Controlling FactorsCore Take Rate (A1)Thickness of Water-Rich Sandstone (A2)Number of Sandstone-Mudstone Interbeds (A3)Sandstone Lithological Coefficient (A4)Thickness Ratio of Brittle and Plastic Rocks (A5)
Combined weight Ai0.22610.20710.26420.14850.1541
Table 5. Water hazard risk indicator scores.
Evaluation CriteriaIndicator Score
Core take rate4.1
Thickness of water-rich sandstone3.6
Number of sandstone and mudstone interlayers3.4
Sandstone lithological coefficient4.3
Thickness ratio of brittle and plastic rocks4.0
Table 6. Connectedness Calculation Results.
Evaluation IndicatorsEvaluation Level
Low RiskLow RiskMedium RiskHigher RiskHigh Risk
Core take rate−0.22610.12430.2261−0.1244−0.2261
Thickness of water-rich sandstone−0.2071−0.06950.20710.0695−0.2071
Number of sandstone-mudstone interbedded layers−0.01980.26420.0198−0.2642−0.2642
Sandstone lithological coefficient−0.01950.14850.0195−0.1485−0.1485
Thickness ratio of brittle and plastic rocks0.02220.1541−0.0222−0.1541−0.1541
Table 7. Comprehensive linkage and evaluation results.
Low RiskLower RiskMedium RiskHigher RiskHigh Risk
Composite Affiliation0.15090.10560.0987−0.1293−0.2096
Relative Affinity0.57550.55280.54940.43530.3952
Normalized Affinity0.22940.22040.21900.17360.1576
Eigenvalue2.8094
Risk RatingMedium Risk
Disclaimer/Publisher’s Note: The statements, opinions and data contained in all publications are solely those of the individual author(s) and contributor(s) and not of MDPI and/or the editor(s). MDPI and/or the editor(s) disclaim responsibility for any injury to people or property resulting from any ideas, methods, instructions or products referred to in the content.

