Abstract
This study investigates the sediment transport characteristics in the lower reservoir area of a pure pumped-storage power station (Pure-PSPS) to address the sediment abrasion issue under high sediment-laden conditions. By establishing a physical model and employing multivariate statistical analysis methods, we systematically reveal the multifactorial coupled influence mechanism of key parameters in the lower reservoir area on turbine sediment concentration (TSC), while developing a predictive TSC formula applicable to high-sediment Pure-PSPS based on sediment-carrying capacity theory and sediment mass conservation principles. The study indicates the following: (1) Under consistent basic parameters such as reservoir length, the decay rate of sediment concentration along the path from the reservoir inlet to the power station’s intake and outlet decreases to 30~80% under high inflow conditions, while under medium and low inflow conditions, the decay rate exceeds 80%. (2) The lower boundary of the median particle size adjustment range for suspended sediment gradually increases from 0.006 mm for 30- and 40-year flood recurrence intervals to 0.009 mm for an 80-year recurrence interval, and under the 80-year recurrence interval, the particle size fluctuation range converges to a high and narrow distribution of 0.009~0.011 mm. (3) The constructed linear regression model has an R2 value of 0.8. The inflow sediment concentration (standardized coefficient β = 0.36) exhibits the strongest explanatory power for the dependent variable, followed by inflow discharge (β = 0.345) and the height difference between the intake/outlet and the silted bed surface (β = 0.319). (4) By optimizing the Adomian decomposition method, dimensional analysis, and multiple regression techniques, and based on sediment-carrying capacity theory and sediment mass conservation principles, this study derived and fitted a predictive formula for TSC in high-sediment-laden Pure-PSPS environments with favorable validation results. The research not only clarifies the interactive relationship between high-sediment-laden flow and turbine sediment concentration in Pure-PSPS but also fills the methodological gap in predicting operational conditions for pure pumped-storage power stations under extreme sediment scenarios. The established regular patterns provide a scientific foundation for the design and feasibility assessment of similar Pure-PSPS projects in sediment-rich rivers.
1. Introduction
With the increasing integration of renewable energy into power grids, pure pumped-storage power stations (Pure-PSPS) have emerged as critical regulating facilities in modern power systems due to their rapid response capability and flexible energy storage characteristics [1,2,3,4]. However, in sandy river regions of arid and semi-arid areas, Pure-PSPS face unique sedimentation challenges due to frequent high-sediment-laden water exchange. Sediment deposition not only reduces effective reservoir capacity but also causes significant turbine wear, leading to efficiency losses [5,6]. The transport of fine sediment particles along reservoir flows introduces substantial errors in traditional sediment concentration prediction models, highlighting the urgent need for refined research on Pure-PSPS operational characteristics. Existing statistics [7,8,9] indicate that Pure-PSPS projects in sandy river regions of northern China suffer up to 12% efficiency loss from sediment abrasion—far higher than that of conventional hybrid pumped storage systems. Notably, when the incoming sediment concentration exceeds 30 kg/m3, Pure-PSPS exacerbates the deposition of fine sediment, a phenomenon often severely underestimated by traditional prediction models.
Current research primarily relies on three technical approaches: field observations [10], physical model tests [11], and numerical simulations [12,13,14]. Liu et al. [15] developed a one-dimensional numerical model for hybrid pumped storage power stations on sediment-laden rivers, demonstrating that adjusting sediment particle size distribution and raising reservoir water levels can effectively reduce sediment concentrations (applicable to runoff-supplemented reservoirs). Jian et al. [16] established a two-dimensional model based on MIKE21 (2014 Version) software for conventional power stations with sediment concentrations below 10 kg/m3, finding that sediment-retaining weirs could reduce sediment intake by turbines. While these studies provide effective solutions for hybrid stations, they lack consideration of high sediment concentration characteristics in Pure-PSPS reservoirs. Regarding turbulence model suitability, Montaseri et al. [17,18] experimentally verified that the RNG k-ω model yields the lowest error (less than 7%) in calculating maximum scour depth. The model, employing the finite volume method and FAVOR technique, can accurately simulate suspended sediment and bed deposition [19,20]. Wu Teng et al. [21] studied China’s Baoquan pumped storage station through physical model tests, simplifying key variables to establish a conversion coefficient between upstream reservoir and intake/outlet sediment concentrations, ultimately proposing a scenario-specific prediction model. Xi Weixian et al. [22] later built upon this framework, incorporating the distance between intake/outlet and dam as a correction factor to develop a tailored model for the Weifang pumped storage station. However, when applied to other station types or operating conditions [23], these models often fail to meet practical accuracy requirements.
Beyond currently considered parameters, key variables such as reservoir quiescent settling characteristics, reservoir length from tail to intake/outlet, and inflow discharge significantly influence sediment transport. Additionally, coupled flow–sediment–morphodynamic interactions are critical mechanisms shaping river, reservoir, and nearshore topography [24]. Sudden disturbances like landslide-generated surges can shift sediment transport from steady deposition to intense scouring [25], while periodic flow reversals may induce bed shear stress heterogeneity and reshaping akin to the Yellow River Delta [26]. Eddy-resolving models reveal [27,28] that the coevolution of turbulence structures and bed morphology may amplify erosion–deposition differentiation, directly impacting station efficiency and reservoir stability—phenomena that manifest more complexly in Pure-PSPS operations.
Existing studies also address channel-type reservoir sedimentation [29,30,31,32,33,34,35] and turbulence-induced vibrations from abrupt topographic changes [36,37,38,39,40,41]. In summary, TSC (Total Sediment Concentration) prediction for Pure-PSPS remains limited: First, numerical models predominantly rely on parameter correlations specific to single station types [42,43,44,45,46], lacking mechanistic insights into synergistic effects of key parameters like inflow discharge gradients and intake/outlet potential differences in Pure-PSPS reservoirs. Second, existing physical model experiments mostly focus on the macroscopic representation of sediment transport [47,48,49,50,51], with insufficient research on the dynamic response mechanisms of sediment-carrying capacity and the influence paths of multi-factor coupling.
To address these scientific challenges, this study constructs a physical model test system and designs multiple experimental conditions to quantitatively analyze the coupled effects of inflow sediment concentration, inflow discharge, and deposition elevation at the lower reservoir intake/outlet on TSC. By optimizing the Adomian decomposition method, dimensional analysis, and linear/nonlinear regression techniques, we establish a TSC prediction formula for Pure-PSPS in high-sediment environments, based on sediment-carrying capacity theory and sediment mass conservation principles. The findings provide a theoretical foundation for optimizing anti-sedimentation designs of Pure-PSPS in sediment-laden river regions, particularly suited for seasonal high-sediment conditions in northern China.
2. Materials and Methods
2.1. Model Design
The upper reservoir of the pumped-storage power station is situated in an erosional gully on the right flank of the main peak in Lingyunkou Valley, a tributary of the Hunhe River in Shanxi Province, China. The normal pool level of the reservoir is 2057 m above mean sea level, with a usable storage capacity of 6.37 million cubic meters. The dead water level is 2017 m, and the dead storage capacity is 130,000 cubic meters. After construction, the upper reservoir forms a closed basin, so its siltation primarily originates from the lower reservoir. The lower reservoir is situated upstream of the Lingyunkou Valley, a primary tributary of the Hun River, with a controlled watershed area of 220 square km. The normal storage level is 1389 m, and the natural storage capacity below this level is 10.91 million cubic meters. The dead water level is 1364 m, and the dead storage capacity is 4.61 million cubic meters. The long-term average sediment yield modulus of the Lingyunkou watershed is 3200 tons per square kilometer per year, with an annual suspended sediment load of 682,000 tons and a bed load of 204,000 tons. Measured hydrological and sediment data from the dedicated hydrometric station are presented in Table 1. The main flood season in the Lingyunkou Valley occurs in July and August, during which the sediment inflow accounts for over 80% of the total sediment load during the flood season.

Table 1.
Measured Sediment Discharge Results from Specialized Hydrological Stations.
The lower reservoir of the pumped storage power station has a sediment-to-capacity ratio of 15.5, which classifies it as a reservoir with severe sedimentation issues under China’s Engineering Sediment Design Standard (GB/T 50180-2018) [52], indicating rapid reservoir capacity loss due to sediment accumulation. To address the sedimentation problem, it is proposed to construct a sediment-retaining dam approximately 1.7 km upstream of the river retaining dam. The flood discharge and sediment flushing tunnel is located within the mountain on the left bank, with its entrance situated about 140 m upstream of the sediment-retaining dam and its exit approximately 400 m downstream of the river retaining dam. The intake and outlet of the power station are located about 0.5 km from the river retaining dam. The sediment-retaining dam is designed as a roller-compacted concrete gravity dam, with a design standard to prevent floodwaters from entering the energy storage reservoir during a 20-year flood event. The crest elevation of the sediment-retaining dam is 1397 m. The overflow section is arranged in the riverbed section of the sediment-retaining dam, with a weir crest elevation of 1389 m.
The physical model of the sediment in the lower reservoir of the pumped storage power station is designed based on the dynamic riverbed model similarity criteria, site conditions, and other fundamental requirements. The scale ratios of the model are summarized in Table 2.
Table 2.
Model scale.
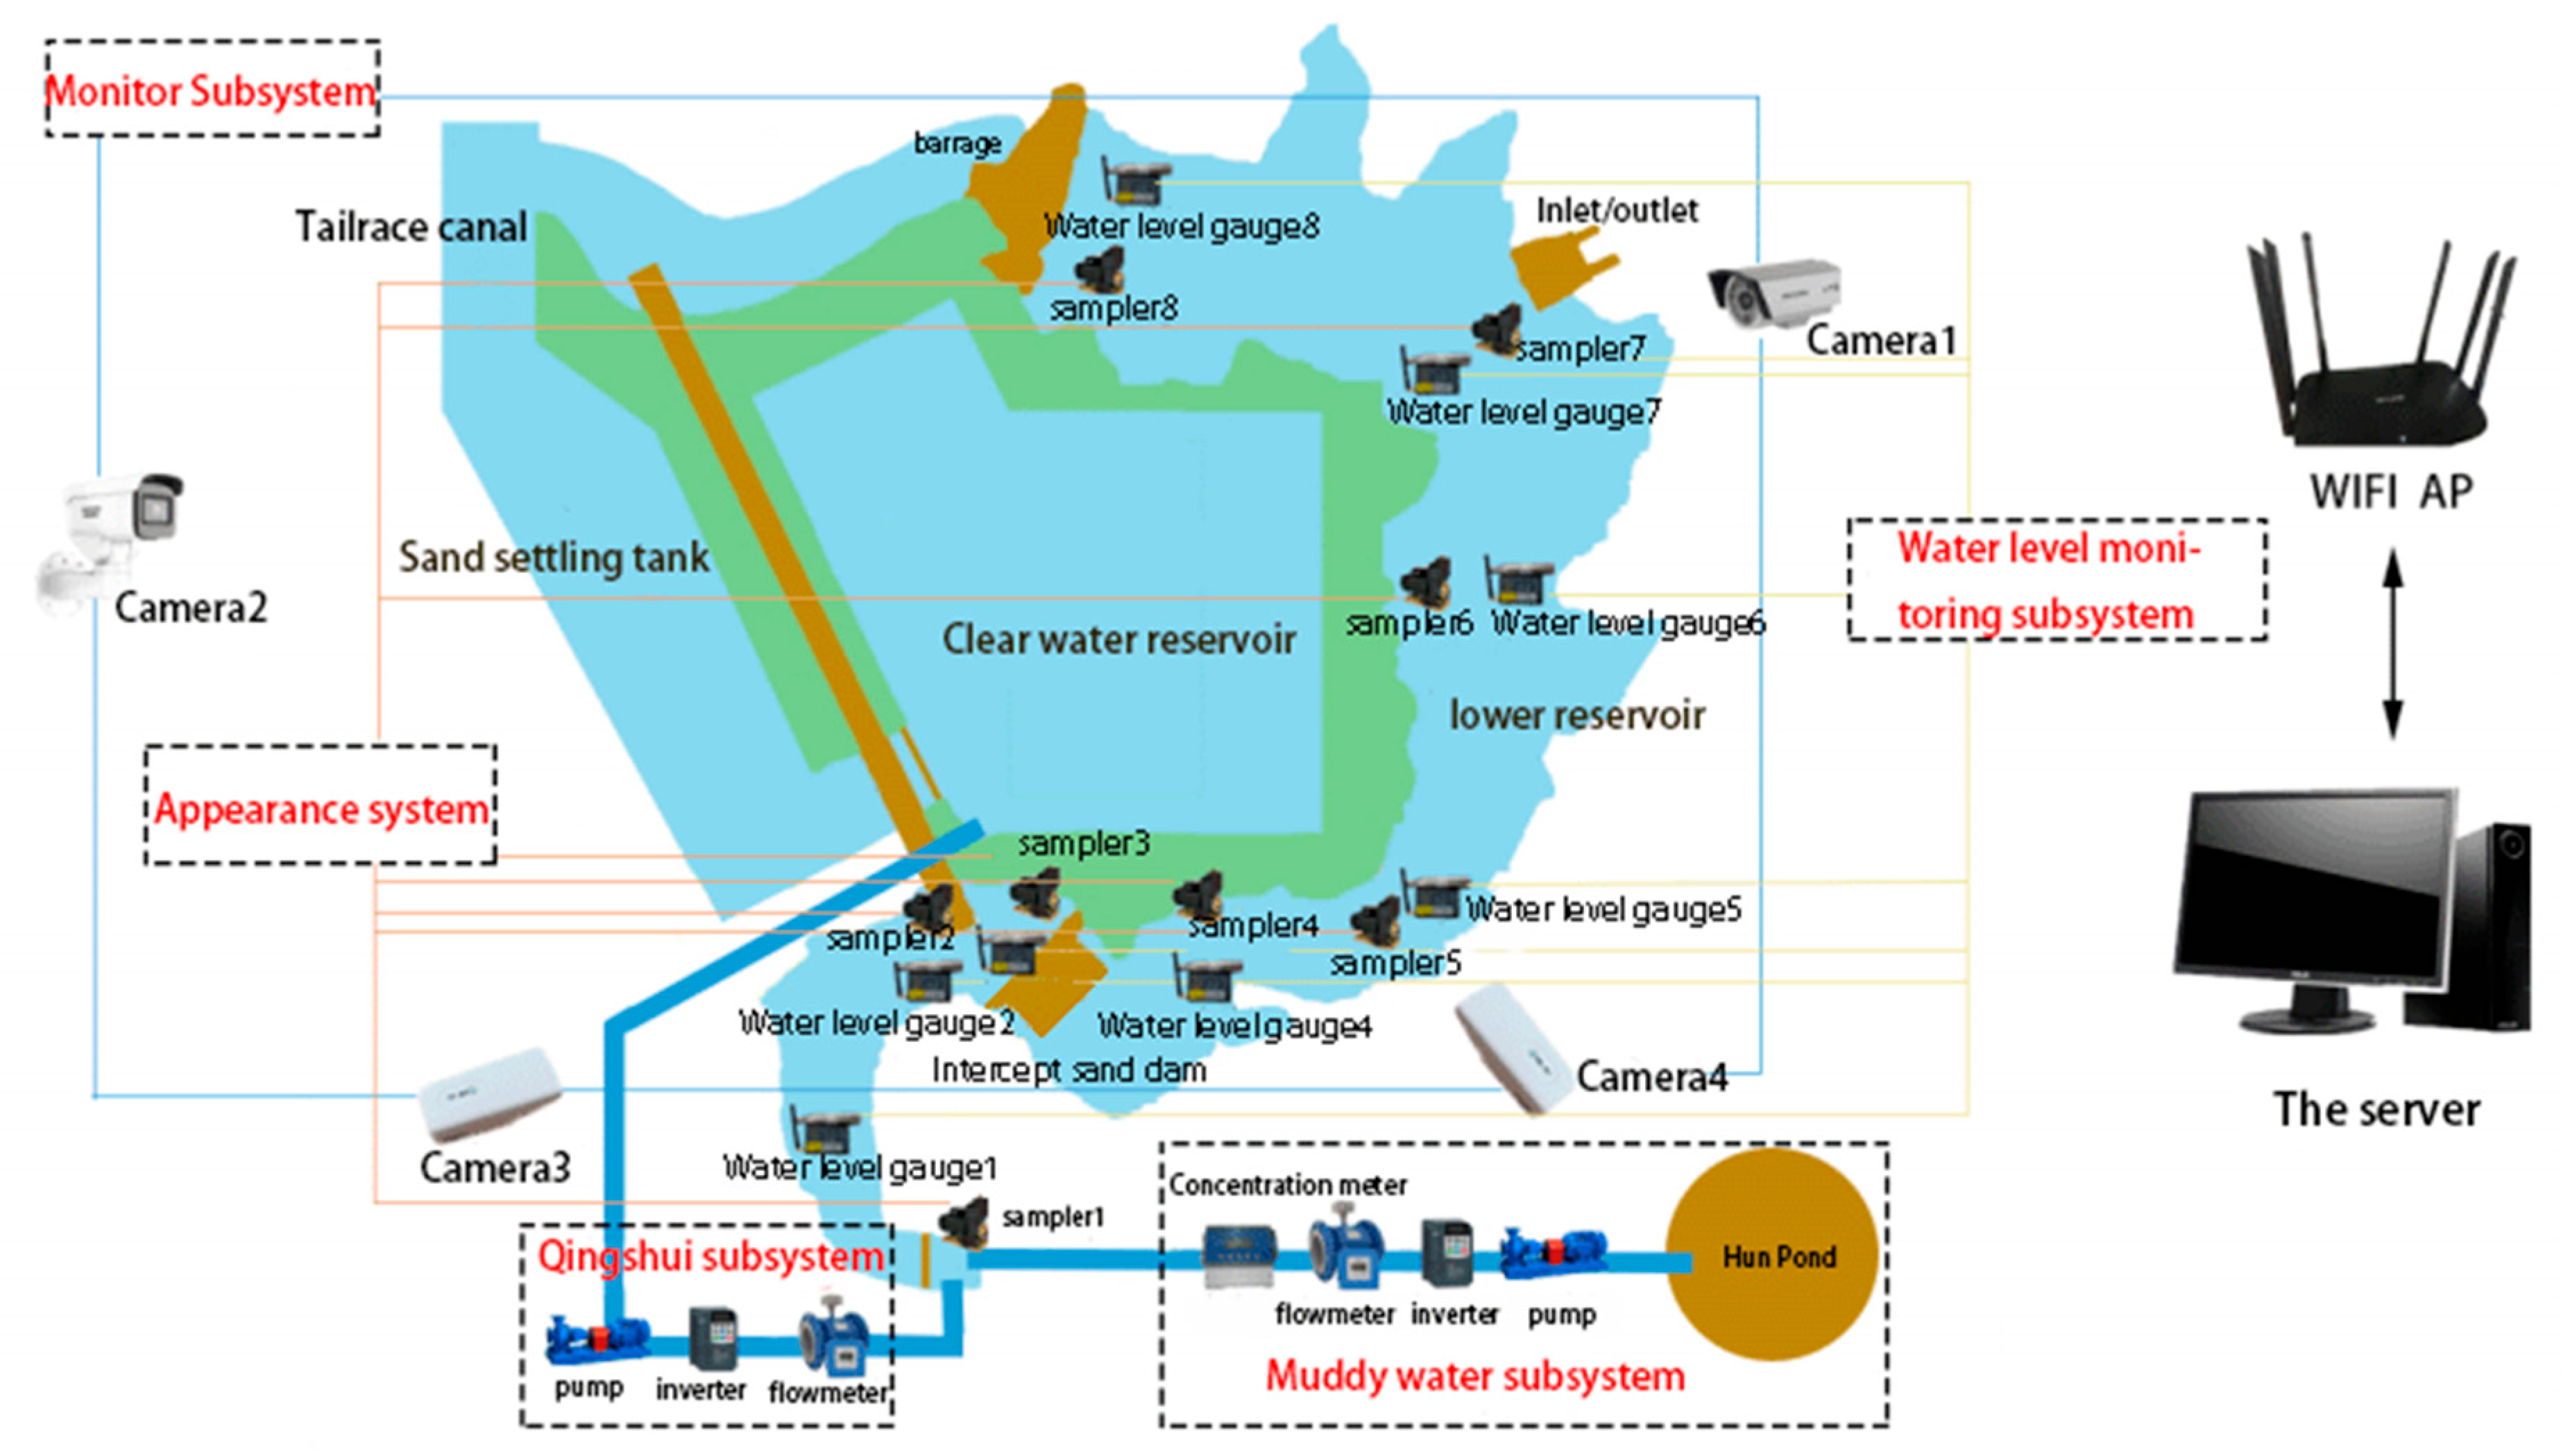
The model construction is based on the River Engineering Model Test standard (SL 99-2012) [53], with the simulated area topography derived from actual river segment maps and measured cross-sectional data. Buildings are constructed using plexiglass materials and strictly arranged according to engineering design. The model measurement and control system (Figure 1 and Figure 2) includes clear water and turbid water subsystems, providing the inlet water and sediment conditions. Along the course, 8 water level gauges (Dalian Haifeng Flow Instrument Co., Ltd., Dalian, China) are arranged for real-time water level monitoring, and 8 samplers (Xiangyang Bozhong Electromechanical Co., Ltd., Xiangyang, China) are used in conjunction with 1000 mL specific gravity bottles (Cangzhou Yixuan Testing Instrument Co., Ltd., Cangzhou, China) to control the concentration of suspended sediment, with the LA-950 laser particle size analyzer (Zhuhai OMEC Instruments Co., Ltd., Zhuhai, China) employed to analyze the gradation of suspended sediment. The sedimentation topography is measured using an ultrasonic topographic instrument (Lianyungang Lianguang Instrument & Meter Sales Co., Ltd., Lianyungang, China), and the flow velocity is measured using an ADV flow velocity meter (Shandong Holton Electronic Technology Co., Ltd., Weifang, China). The bidirectional water supply system is composed of PVC pipes, plexiglass pipes, pipeline pumps (Shanghai Etern Industrial Co., Ltd., Shanghai, China), four-way valves, and booster pumps, simulating the linkage between the upper and lower reservoirs, and is equipped with a flow connection hole for sampling the turbine sediment concentration.
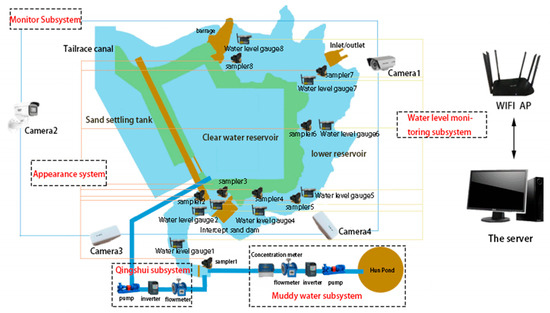
Figure 1.
Overall schematic diagram of the model.
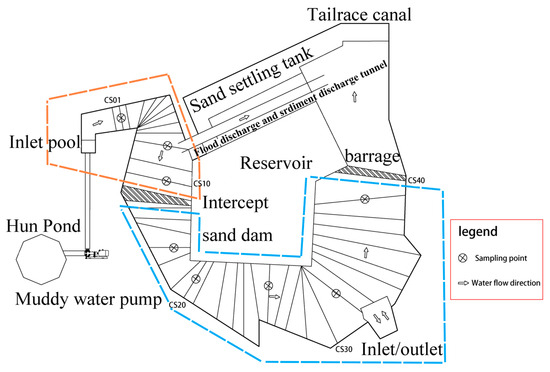
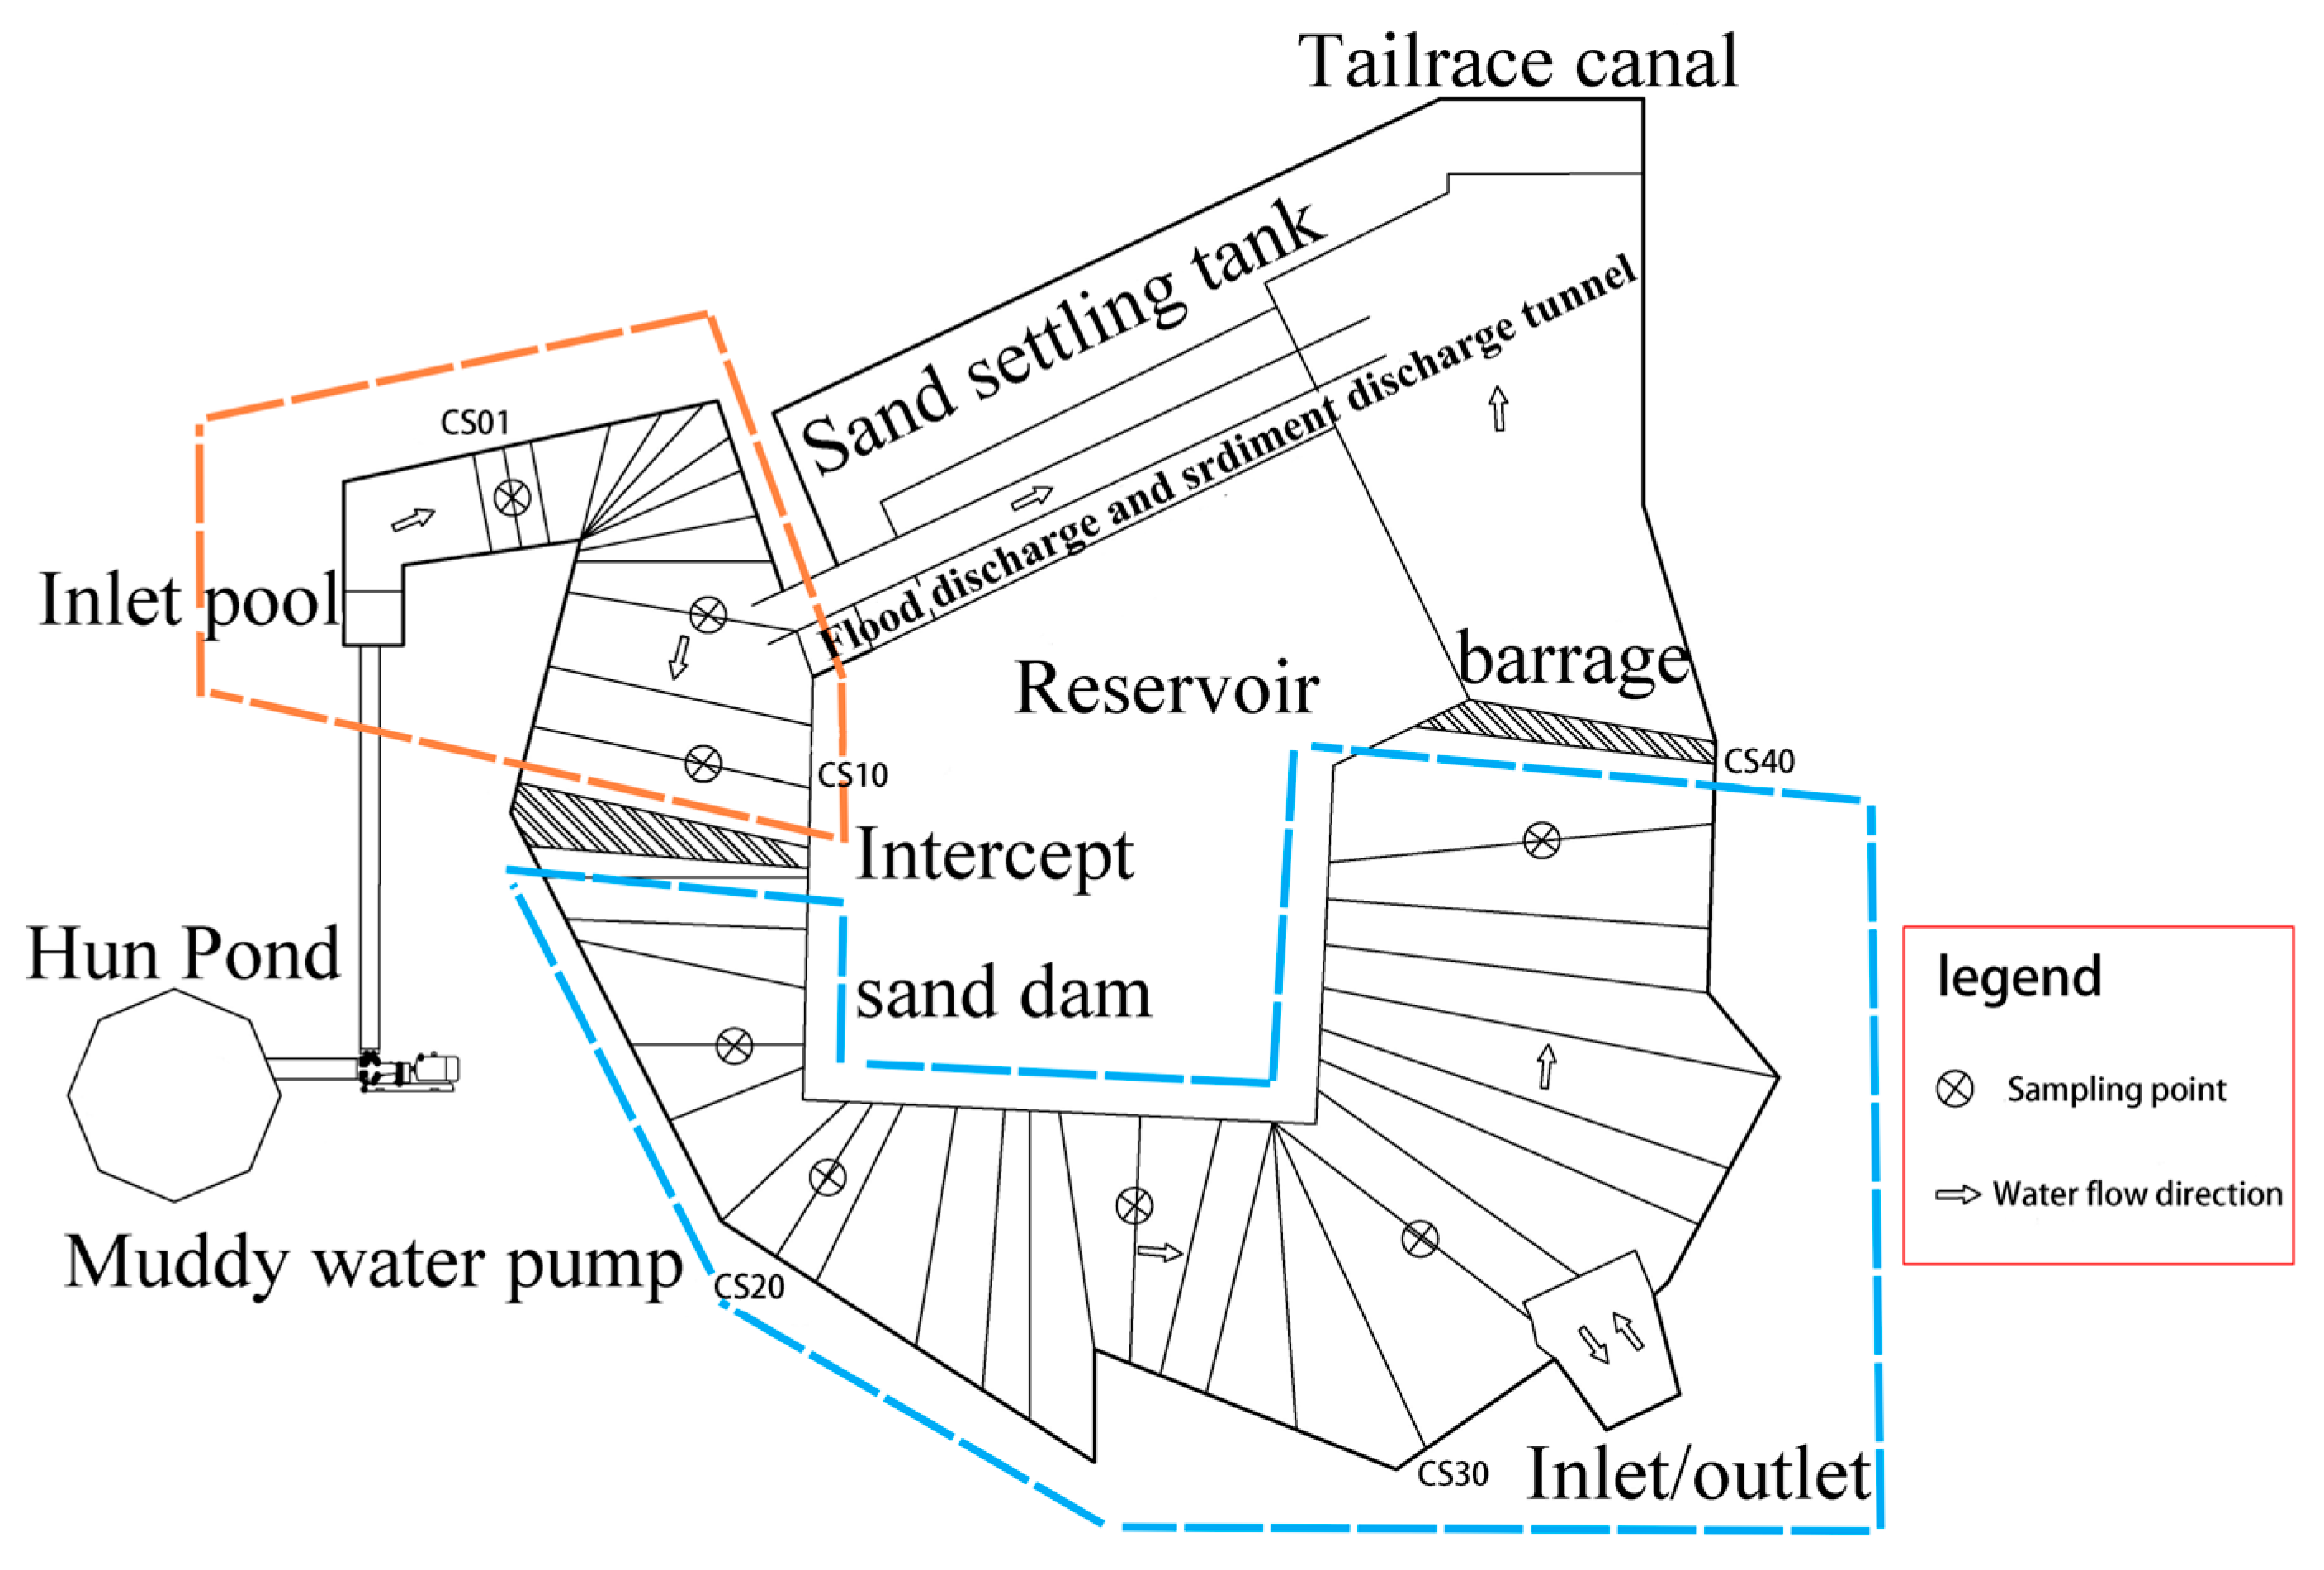
Figure 2.
Model Layout Diagram.
The median particle size of the suspended sediment in the simulated area is 0.016 mm, which is relatively fine. To meet the similarity requirements for sediment movement and bed roughness, the experiment selected fly ash from power plants as the model sediment. The particle size distribution curve is shown in Figure 3. The specific gravity of the model sediment is close to that of natural sand, with a low incipient velocity and a particle size range of 0.005~0.15 mm. It can simulate both bed load and suspended load, and its dynamic characteristics are similar to natural sand, with low cohesiveness, thus meeting the experimental requirements.
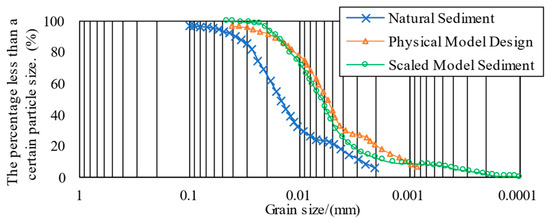
Figure 3.
Gradation Curve of Model Sand.
2.2. Boundary Conditions for Model Experiments
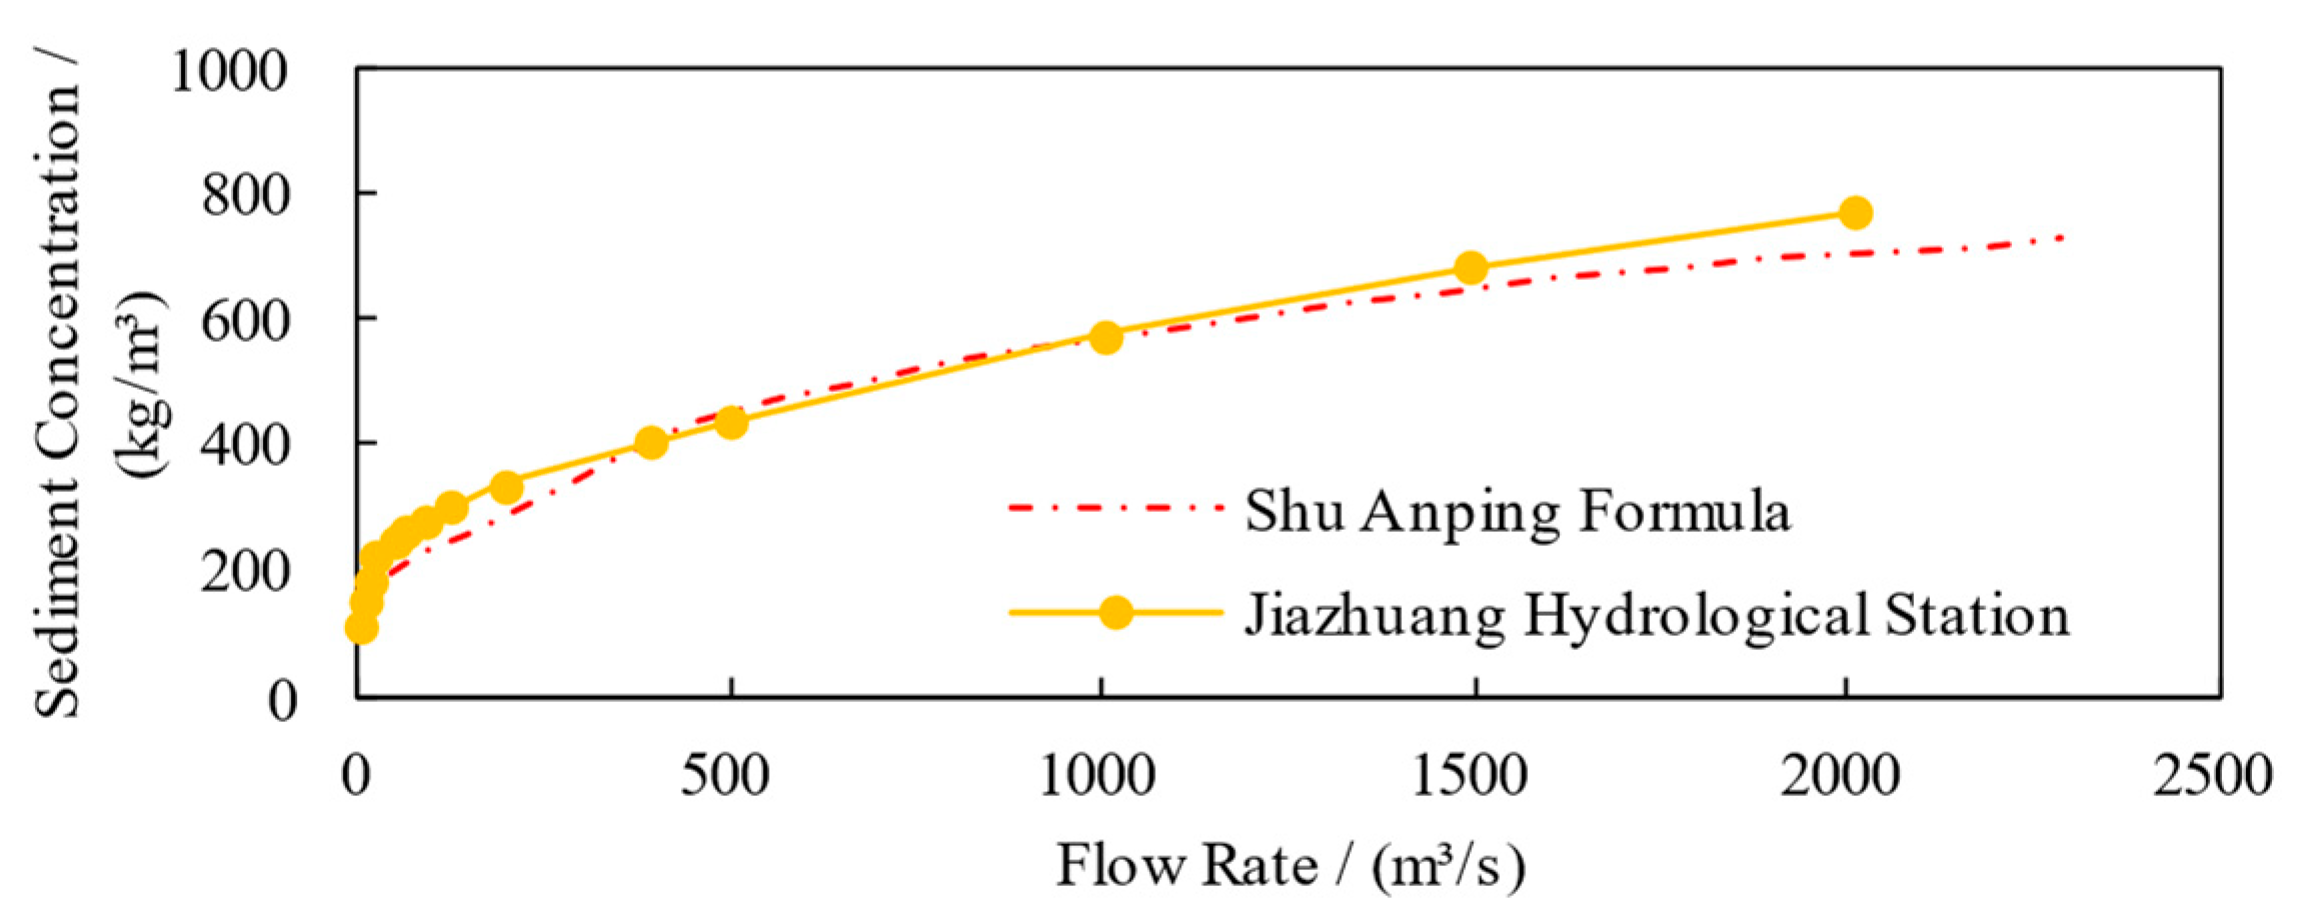
The measured data from specialized hydrological stations do not cover all operating conditions, so the boundary conditions for the model experiment were selected based on the long-series flow and sediment concentration data from the nearby Jia-zhuang Hydrological Station, supplemented by calculations using a sediment-carrying capacity formula; the specific water and sediment characteristic parameters are shown in Table 3. A comparison between observed data from the hydrometric station and computed values is presented in Figure 4.
Table 3.
Hydrological and Sediment Characteristic Parameters of Peak Floods at Different Frequencies.
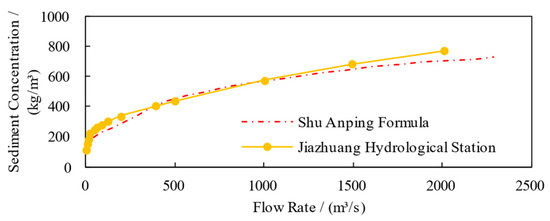
Figure 4.
Water-sediment relationship in model experiments.
The suspended sediment concentrations for 5-year and 10-year return periods were calculated using the Zhang Ruijin formula [54]:
In the equation: SL is the sediment-carrying capacity of water flow, in kg/m3; k and m0 are empirical coefficients related to the bed material and flow conditions (for ease of comparison, k = 3.8 and m0 = 0.38); U is the average flow velocity, in m/s; g is the gravitational acceleration, in m/s2; is the settling velocity of the sediment particles, in m/s; h is the water depth at the cross-section, in meters.
Sediment concentrations for 80-year and 100-year return periods were calculated using Shu Anping’s formula for sediment-carrying capacity of hyperconcentrated flows [55]:
In the equation: μr denotes the relative viscosity of sediment-laden flow, which is a dimensionless parameter; is the von Kármán constant, which characterizes the velocity distribution profile and is a dimensionless parameter; fm is the drag coefficient, which is a dimensionless number; γm is the unit weight of sediment-laden water, with units of KN/m3; the units of the remaining symbols are the same as in the equation above.
2.3. Model Calibration
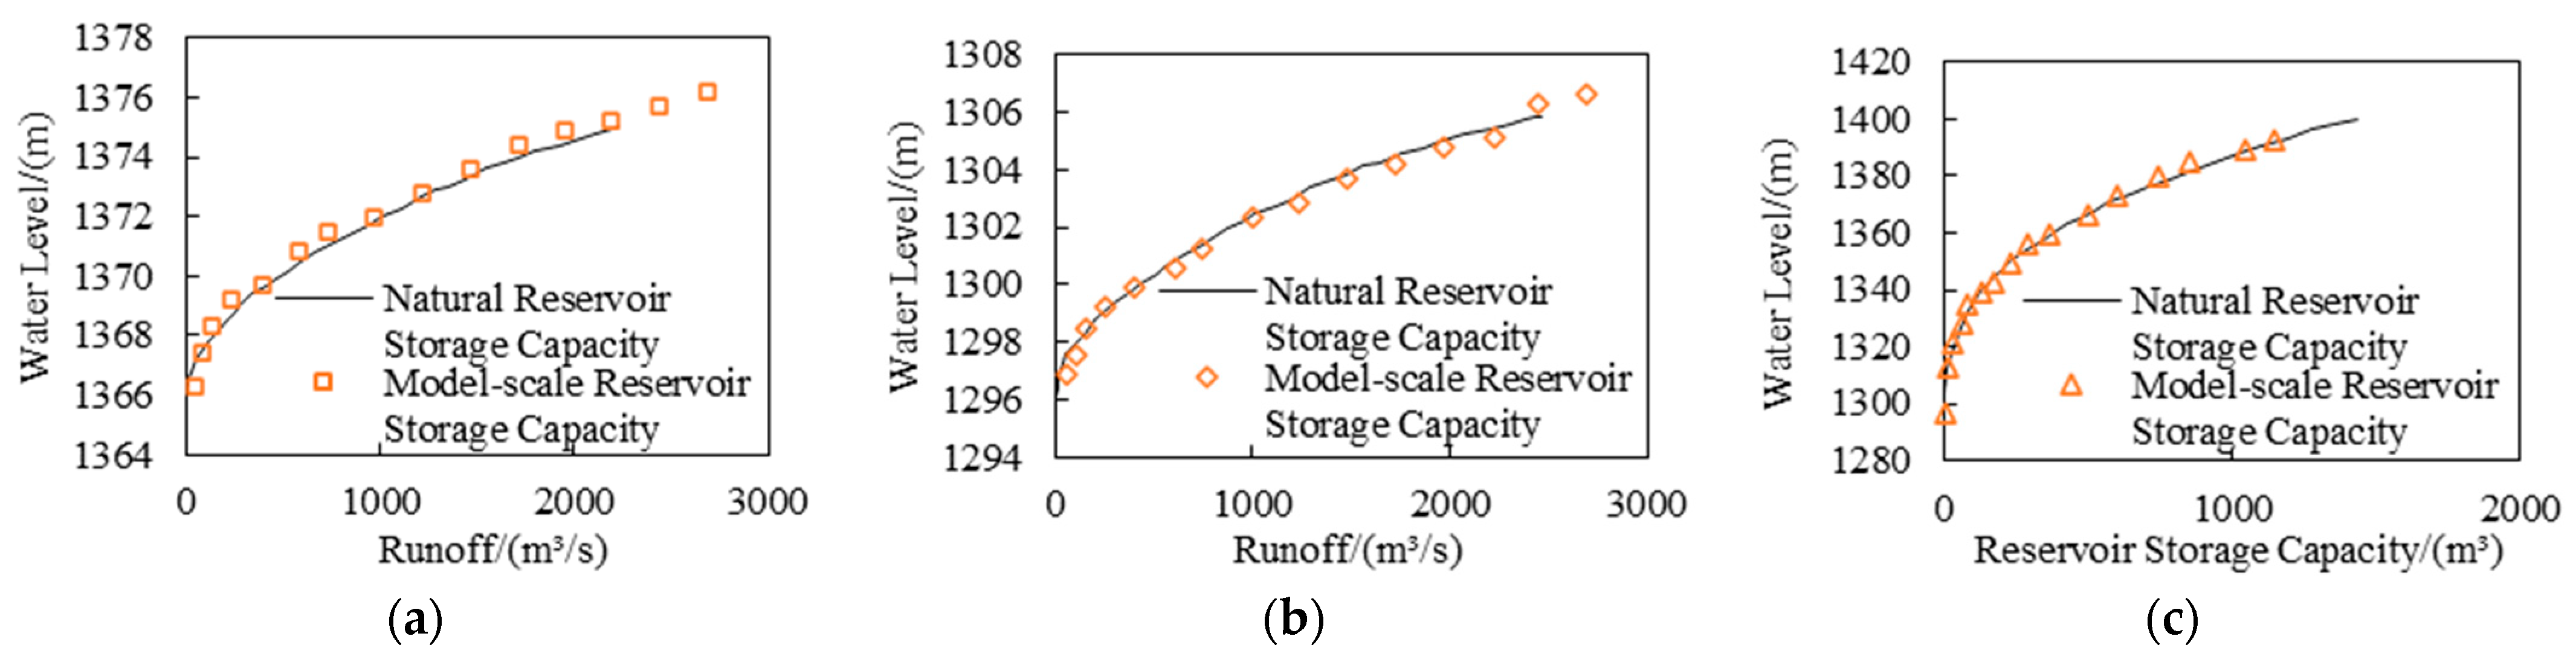
The lower reservoir was calibrated using the designed water level–discharge relationship and storage capacity curve to ensure similarity in model resistance and precision in construction. As shown in Figure 5a,b, the measured discharge at the sediment-trapping dam section under low water levels is slightly lower than the theoretical value, and the model output at the dam section under low water levels is slightly lower than the calculated value. However, in other scenarios, the results align well. Figure 5c indicates that the model storage capacity is largely consistent with the natural storage capacity. The validation of the bidirectional pipe-pump system demonstrates its ability to accurately simulate reciprocal water flow, with precise flow control. The construction accuracy of the model meets both the specifications and experimental requirements.
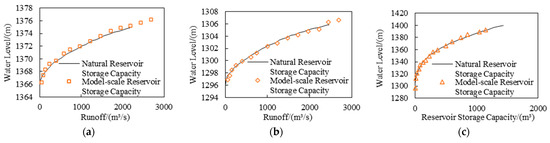
Figure 5.
(a) Stage–discharge relationship at sand barrier section. (b) Stage–discharge relationship at river barrier section. (c) Stage–storage relationship at lower reservoir.
2.4. Pearson Correlation Coefficient
Correlation analysis is a statistical method used to examine relationships between variables and measure their degree of association. The Pearson correlation coefficient, as a widely applicable measure of linear dependence between variables, demonstrates high reliability—particularly when analyzing complex data with multifactorial influences. The Pearson coefficient ranges from −1 to 1.
Let (X,Y)T be a random vector following a bivariate distribution F(X,Y). The Pearson correlation coefficient between variables X and Y, denoted by γ, is defined as follows:
In which Xi and Yi represent the actual observed values of the two variables, and and denote the mean values of the two variables, respectively.
Normality Assumption Test Based on Variance Formula:
In which xi represents the i-th actual observed value in the dataset, μ denotes the population mean (the average of all observed values), and N indicates the total number of observed values in the population.
Standardized coefficients are calculated by multiplying the unstandardized regression coefficients by the standard deviation of the independent variable and dividing by the standard deviation of the dependent variable. The formula is as follows:
In which βj represents the standardized coefficient for the jth independent variable, bj denotes the non-standardized coefficient for the jth independent variable, Sxj is the standard deviation of the jth independent variable, and Sy is the standard deviation of the dependent variable.
The calculation method for the elevation difference between the inlet/outlet floor elevation and the formed sediment bed surface is as follows:
In the equation: H represents the elevation difference between the inlet/outlet floor elevation and the formed sediment bed surface, in meters; h1 represents the elevation of the formed sediment bed surface, in meters; h0 represents the floor elevation of the inlet/outlet in the lower reservoir, in meters.
2.5. Experimental Program
The experiment primarily involved fixed-bed sediment addition in the lower reservoir, with the initial topography based on the actual waste material backfill terrain. The topographic data for each subsequent test were derived from the cumulative results of the previous experiments. Tests were conducted sequentially under three conditions: without a sediment-trapping dam, without a sediment-trapping dam at high water levels, and with a sediment-trapping dam. The water and sediment conditions were set incrementally from smaller to larger magnitudes according to the annual sequence. Observations included longitudinal water levels, cross-sectional flow velocities, and the gradation and concentration of suspended sediment at the inlet and outlet (see Table 4).
Table 4.
Model Test Scheme.
3. Results
Based on the research content of this paper and the physical model experiments, the inflow discharge (Q), inflow sediment concentration (S0), inflow suspended sediment particle size (D50), and the maximum vertical elevation difference (H) between the floor elevation of the inlet and outlet of the lower reservoir and the sediment deposition bed surface (hereinafter referred to as the elevation difference) were selected as the primary factors influencing the turbine sediment concentration in the context of inflow water and sediment conditions.
3.1. The Relationship Between Inflow Discharge and Turbine Sediment Concentration (TSC)
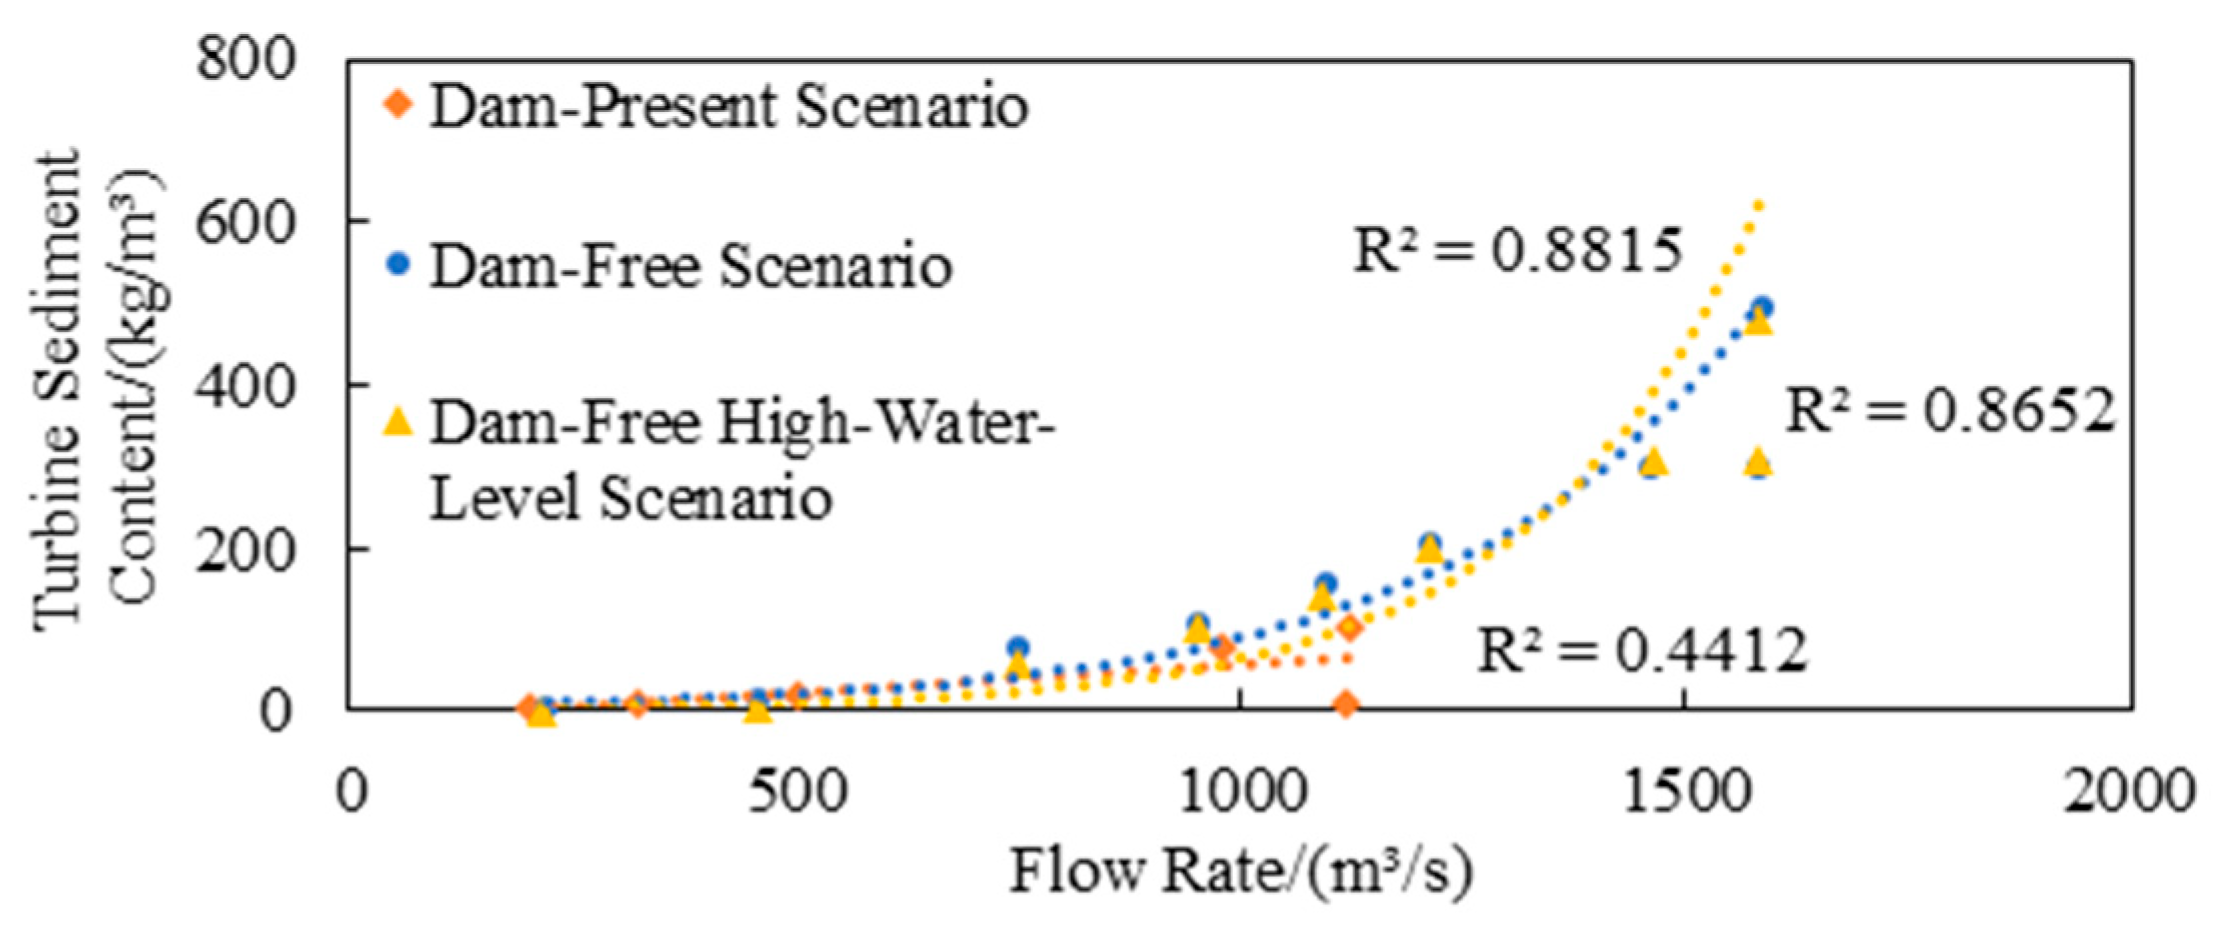
Figure 6 illustrates the fitting relationship between the inflow discharge and Turbine Sediment Concentration (TSC) under three operating conditions. Under the with sediment-trapping dam, without sediment-trapping dam, and without sediment-trapping dam at high water levels scenarios, the inflow discharge exhibits a positive correlation with TSC, with correlation coefficients of 0.4412, 0.8815, and 0.8652, respectively, indicating that TSC increases with the rise in discharge. In the with sediment-trapping dam scenario, the increasing trend of TSC with discharge is attenuated, and the correlation is lower, due to the sediment-trapping effect of the dam system. Comparing the without sediment-trapping dam and without sediment-trapping dam at high water levels scenarios, it is observed that the impact of inflow discharge on the sediment concentration of the intake water is related to the operating water level of the lower reservoir: under the same discharge, the sediment concentration of the intake water is higher in the low water level without sediment-trapping dam scenario, suggesting that the positive correlation between discharge and intake sediment concentration becomes more pronounced at lower operating water levels, and is more significantly influenced by variations in discharge.
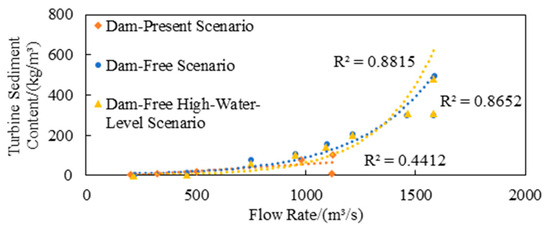
Figure 6.
Relationship between flow rate and turbine sediment concentration.
The inflow discharge has a certain influence on the sediment concentration attenuation trend from the lower reservoir inlet to the intake/outlet of the power station in the lower reservoir. Figure 7 illustrates the relationship between the inflow discharge and the attenuation ratio of the incoming sediment concentration. It can be observed that under the same conditions, such as the length of the reservoir, the attenuation ratio of sediment concentration from the reservoir inlet to the power station intake/outlet is higher when the inflow discharge is larger. When the inflow discharge is less than 500 m3/s, the attenuation ratio of sediment concentration exceeds 90%; however, when the inflow discharge is greater than 1200 m3/s, the attenuation ratio ranges between 30% and 80%.
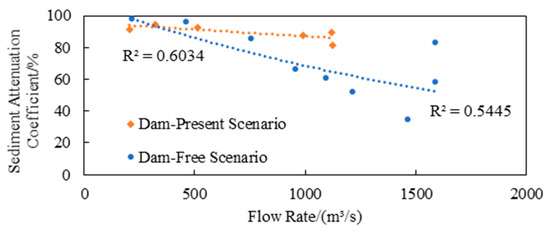
Figure 7.
Relationship Between Inflow Rate and Attenuation Ratio of Sediment Concentration Along the Course.
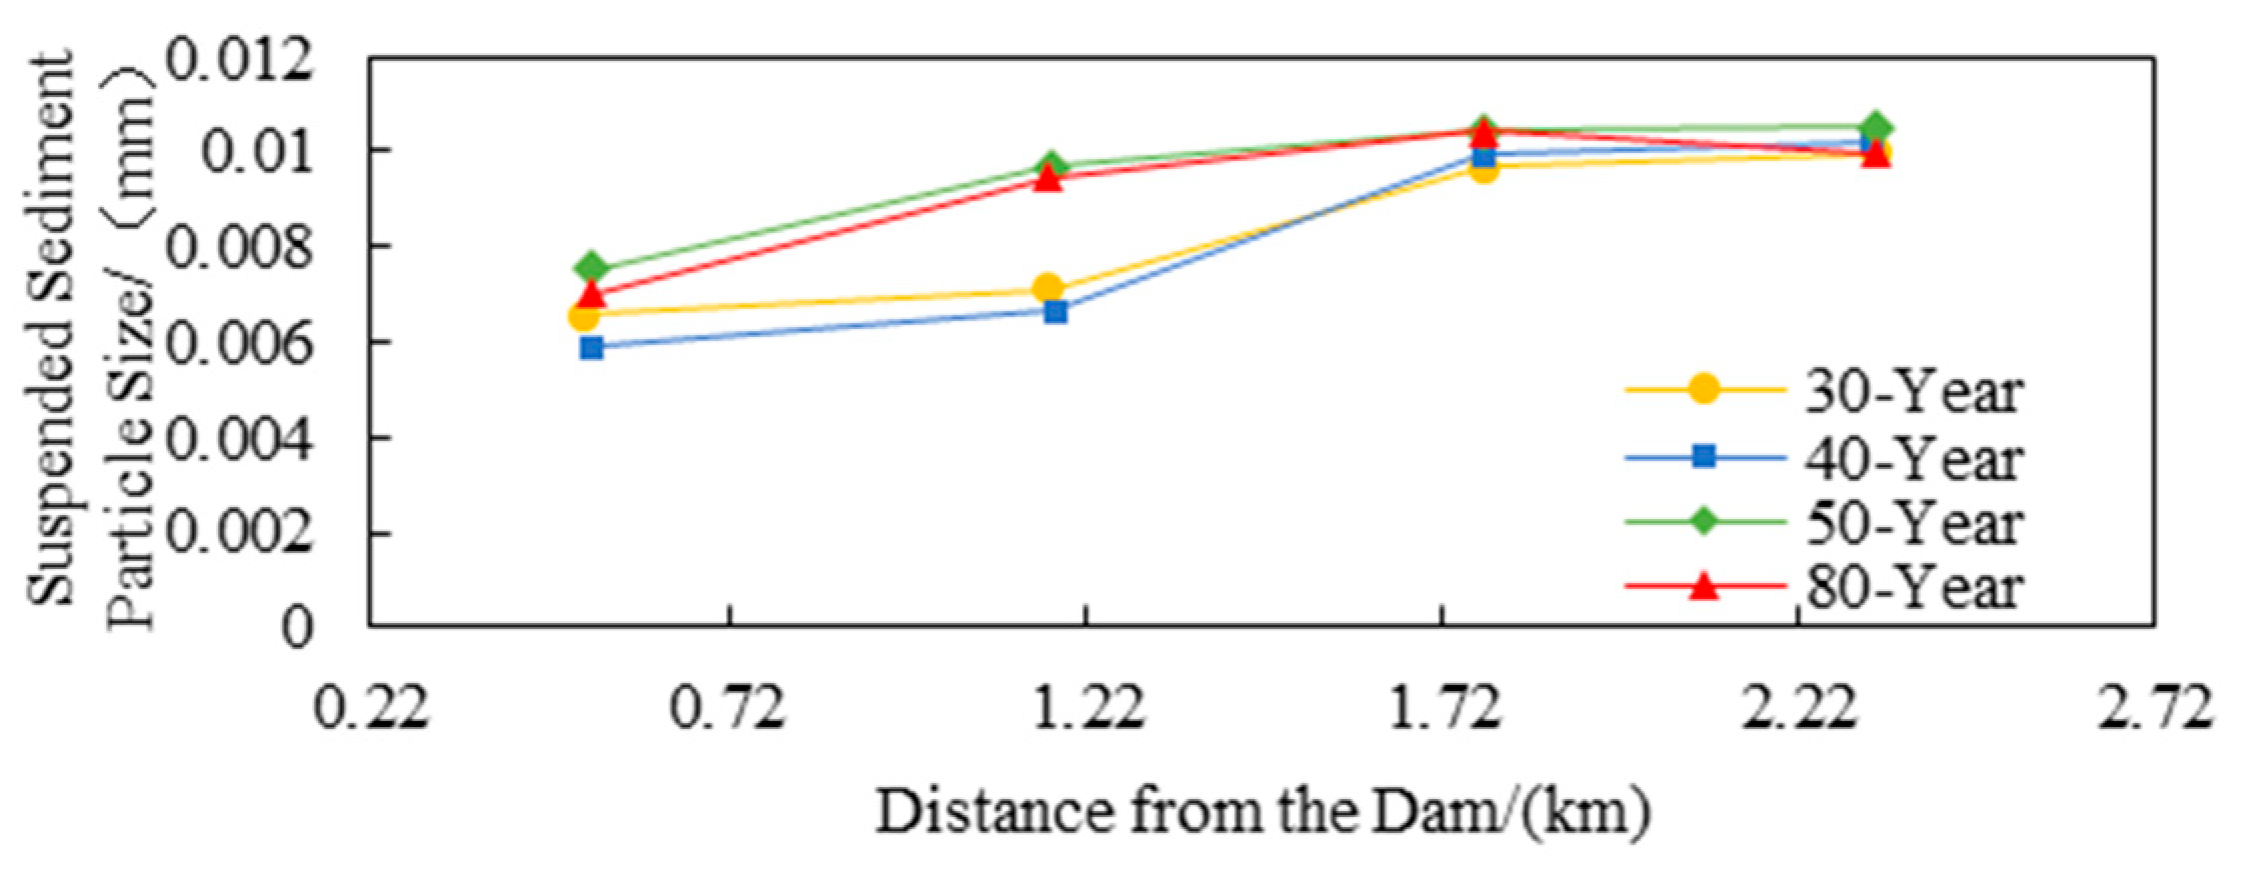
The magnitude of the inflow discharge also has a certain influence on the adjustment range of suspended sediment particle size. When the inflow discharge is larger, the reduction in sediment particle size along the course is relatively smaller; conversely, when the inflow discharge is smaller, the reduction in sediment particle size along the course is relatively greater. As shown in Figure 8, which depicts the longitudinal variation in the median suspended particle size in the lower reservoir during floods with return periods of 30, 40, 50, and 80 years under the condition of a sediment trapping dam, the adjustment range of sediment particle size for floods with 30-year and 40-year return periods is generally between 0.006 and 0.01 mm. For floods with 50-year and 80-year return periods, the adjustment range of sediment particle size is generally between 0.007 and 0.01 mm. The longitudinal adjustment range of the median suspended particle size is positively correlated with the flood return period, and as the return period increases, the lower limit of the particle size tends to rise.

Figure 8.
Variation in Median Particle Size of Suspended Load Along the Course Under Different Operating Conditions.
3.2. The Relationship Between the Incoming Sediment Concentration and the Turbine Sediment Concentration
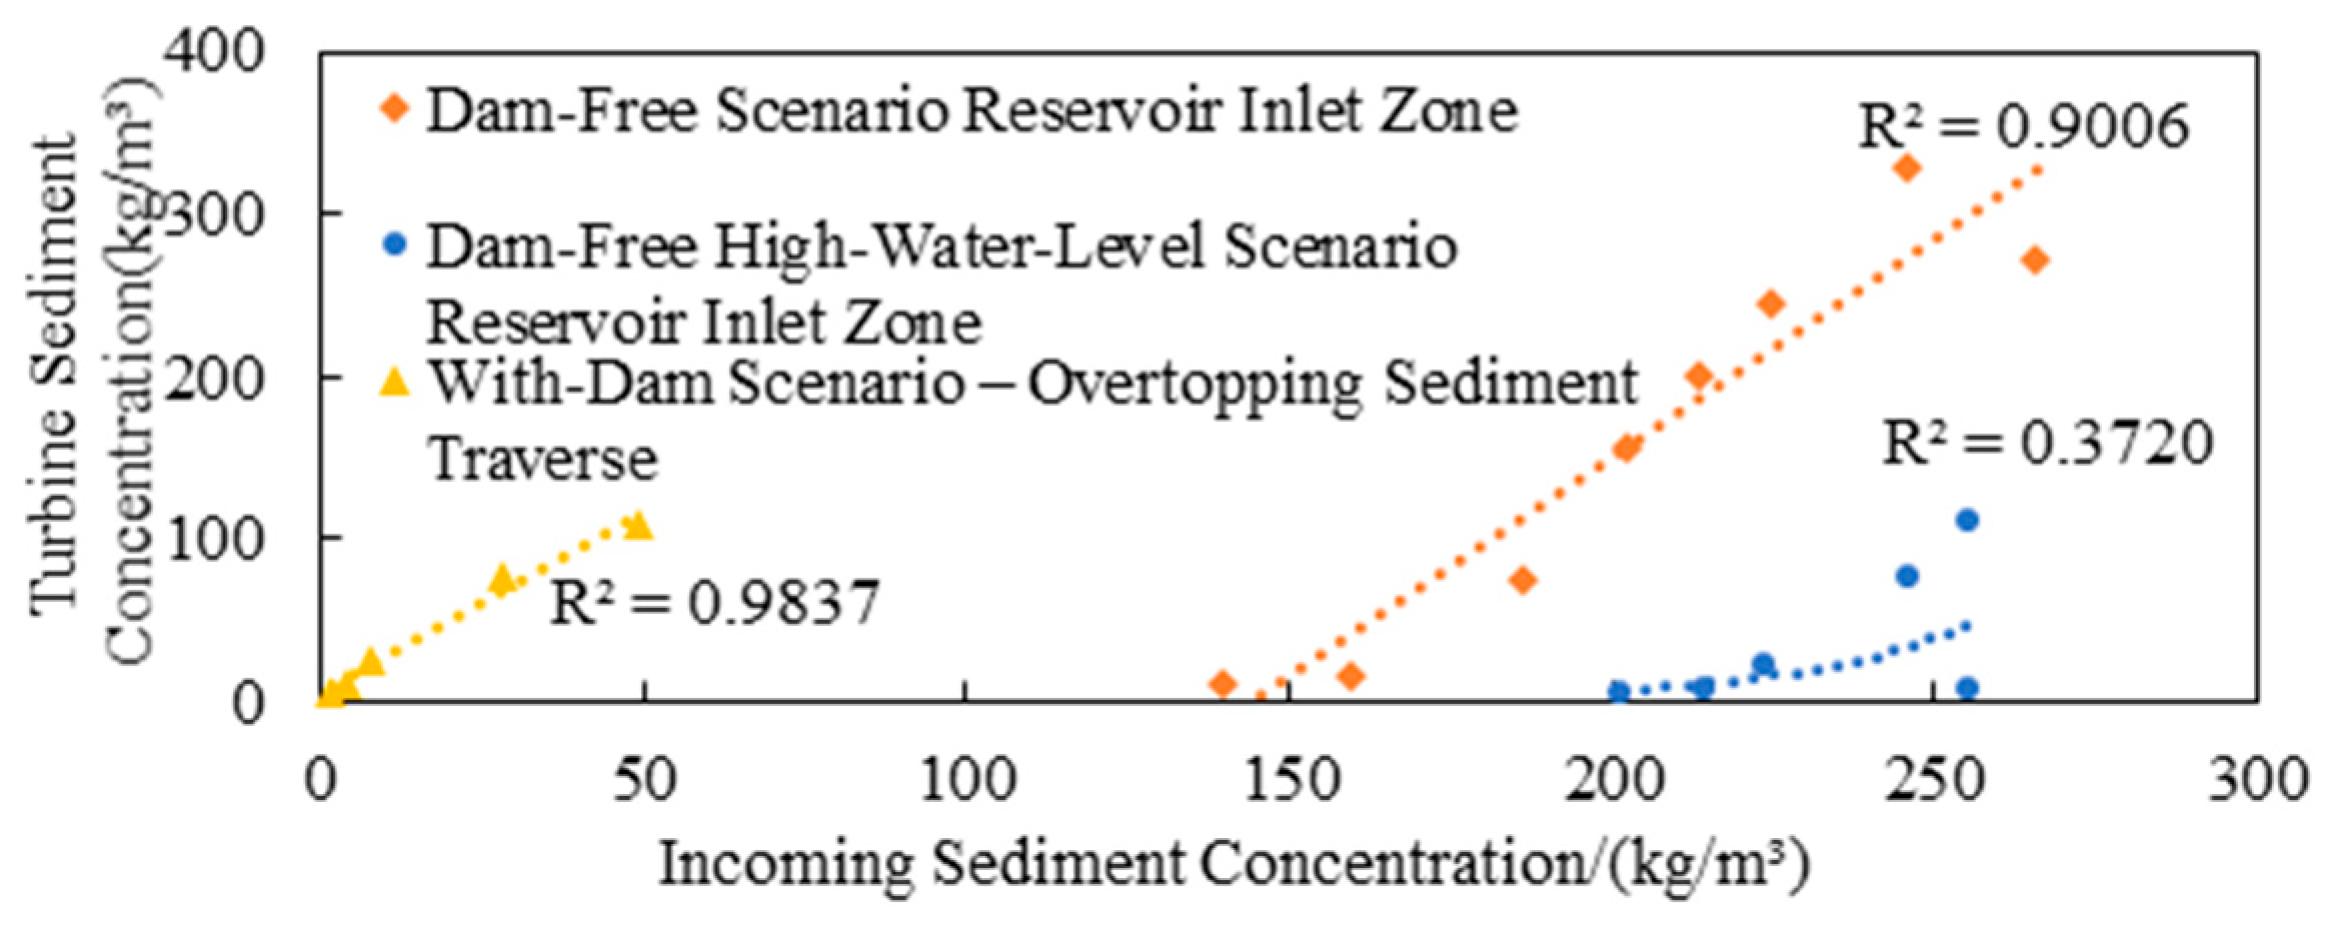
Under the same operational scheduling, a comparison of the relationship between incoming sediment concentration and Turbine Sediment Concentration (TSC) for scenarios with and without a sediment trapping dam (as shown in Figure 9) reveals that both scenarios exhibit a significant increase in TSC as the incoming sediment concentration rises. In the scenario without a sediment trapping dam, the correlation coefficient reaches 0.9006, indicating that the incoming sediment concentration plays a dominant role in determining TSC when the sediment trapping and discharge system is absent. However, in the scenario with a sediment trapping dam, the correlation coefficient decreases to 0.372, demonstrating that the sediment trapping and discharge system weakens the influence of incoming sediment concentration on TSC. Additionally, in the scenario with a sediment trapping dam, the sediment concentration bypassing the dam shows a highly positive correlation with TSC (R2 = 0.9837), suggesting that the sediment trapping dam significantly alters the sediment dynamics and reduces the direct impact of incoming sediment on the turbine.
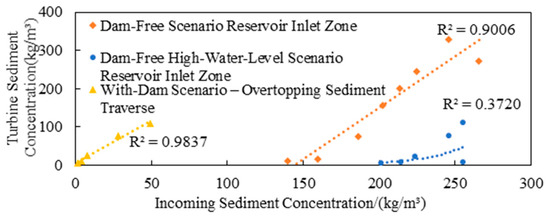
Figure 9.
The relationship between the particle size of incoming sediment and the Turbine Sediment Concentration.
3.3. The Relationship Between the Particle Size of Incoming Sediment and the Turbine Sediment Concentration
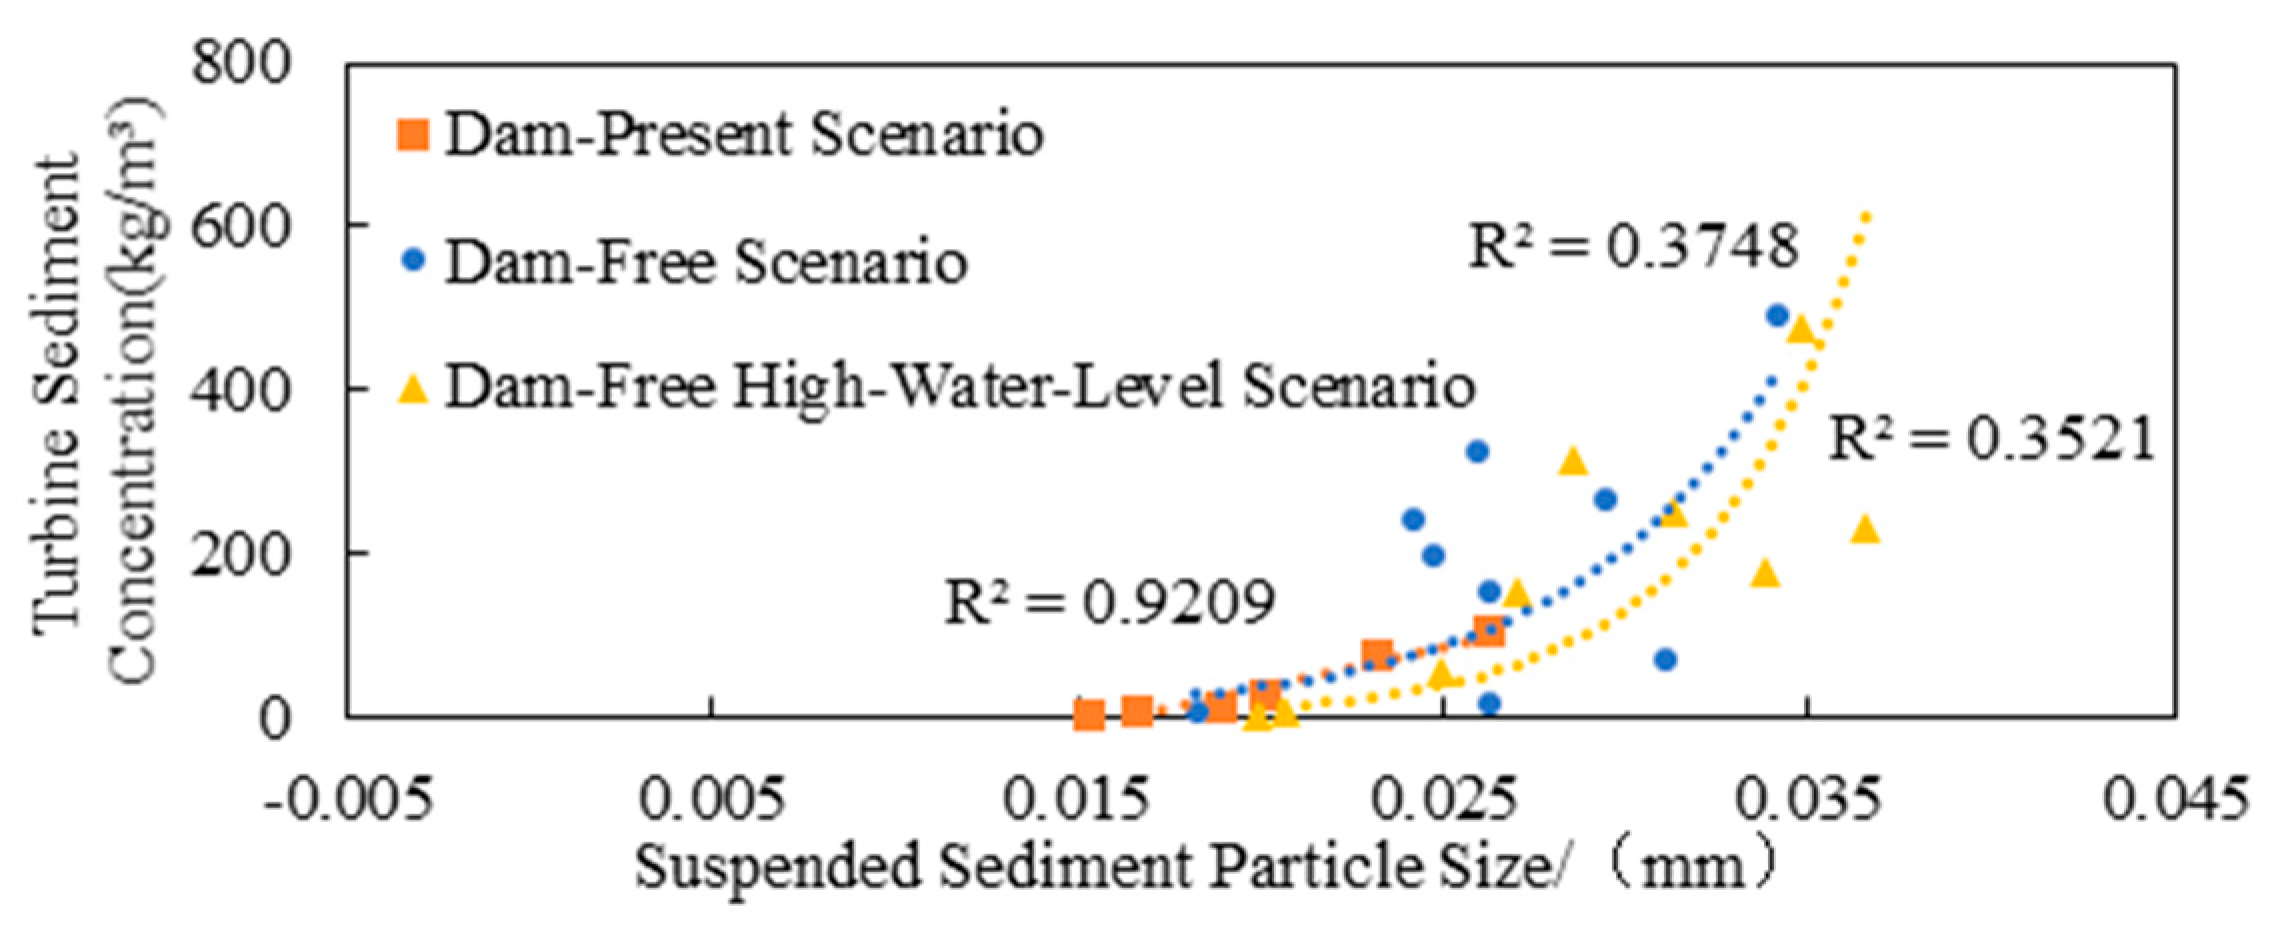
Figure 10 illustrates the fitted relationships between inflow sediment particle size and turbine sediment concentration under three operational scenarios. In the undammed scenario and undammed high-water-level scenario, the relationship between inflow suspended sediment particle size and turbine sediment concentration appears scattered, indicating a complex influence mechanism of particle size on turbine sediment transport under these conditions. In contrast, the dammed scenario exhibits a strong positive correlation between spillway suspended sediment particle size and turbine sediment concentration: as inflow sediment particle size increases, turbine sediment concentration shows a rising trend, with a correlation coefficient of 0.9209, confirming robust interdependency.

Figure 10.
Fitted Relationship Between Inflow Sediment Particle Size and Turbine Sediment Concentration.
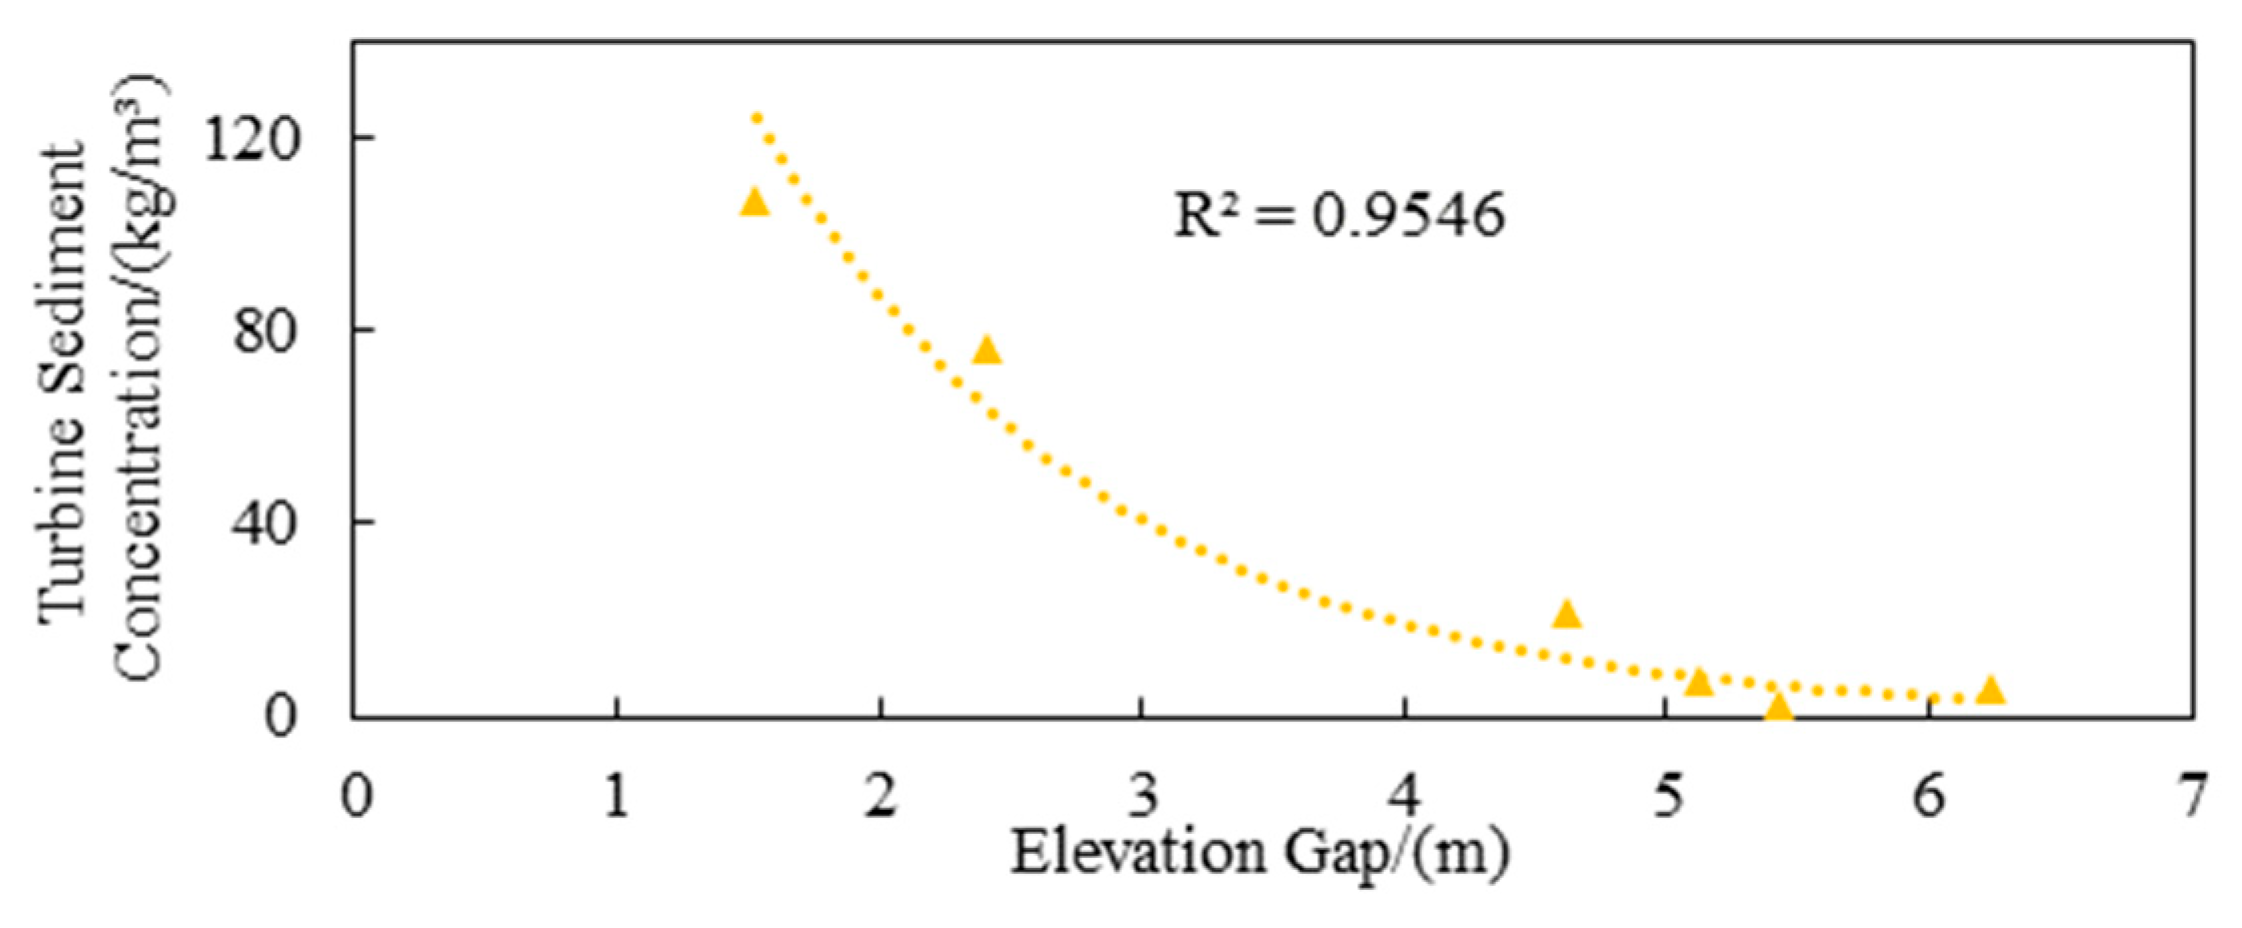
3.4. The Relationship Between the Elevation Difference (Inlet/Outlet vs. Sediment Bed) and Turbine Sediment Concentration
Given the vertical distribution characteristic of sediment particles exhibiting lower concentration near the bed and higher concentration toward the water surface, suspended sediment primarily concentrates near the bed and gradually diffuses upward, with sediment concentration continuously decreasing from the bed to the water surface. Considering the vertical distribution of suspended sediment, the vertical difference between the inlet/outlet floor slab and the deposition-formed bed surface (hereafter termed the elevation gap) exerts a certain influence on the sediment concentration in hydro-turbines.
The relationship between the elevation gap and turbine sediment concentration was analyzed using experimental data from dam-controlled scenarios, as shown in Figure 11. A strong correlation (correlation coefficient of 0.9546) is observed, where smaller elevation gaps correspond to higher sediment concentrations in turbines. However, due to the arrangement of experimental sequences, this correlation also inherently reflects the impact of incoming sediment concentration on turbine operation. Consequently, the results preliminarily suggest a potential association between the elevation gap and intake sediment concentration, though further investigation is required to isolate their specific cause-effect relationship.
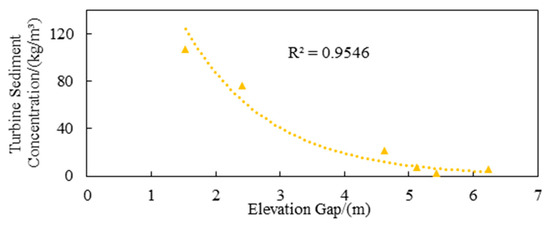
Figure 11.
Fitted Relationship Between the Height Difference at Inlet and Outlet Gates and Turbine Sediment Concentration.
Table 5 presents a comparative analysis of the 80-year-flood event and the second 100-year-flood event under dam-controlled scenarios, where over-dam sediment concentrations were comparable. Under consistent sediment management strategies and similar over-dam sediment levels, the 80-year-flood event (with an elevation gaps difference of 1.02 m compared to the 100-year-flood scenario) demonstrates that an increased vertical gap significantly enhances sediment attenuation effects. This enhancement leads to a reduction in the actual sediment transport volume through hydro-turbines as the vertical gap increases, with the two parameters exhibiting a significant correlation.
Table 5.
Comparison of Sediment Concentration Attenuation Along the Path.
It can be observed that TSC increases sharply when H is small. However, the linear regression fails to explain the nonlinear saturation effect under sediment inflow disturbances, as evidenced by the flattened tail region of the curve in Figure 11.
To address the nonlinear attenuation characteristics of the vertical sediment concentration gradient with respect to elevation difference, we employed the optimized Adomian decomposition method (OADM) [56]:
Based on the mechanisms of energy balance and sediment diffusion, the governing equation for the nonlinear H-TSC relationship was established:
In which, denotes the vertical sediment concentration (kg/m3), represents the turbulent diffusion coefficient, is the settling velocity, and refers to the attenuation function related to elevation difference.
Application of the OADM:
Decomposition and iteration: expand into a series , and decompose the nonlinear term into Adomian polynomials An.
Convergence control: introduce parameter h to optimize the series convergence, with the modified equation as follows:
For the Adomian series solution X, define the residual of the governing equation as follows:
Initial setup: set the initial guess h0 = −1 (empirical value to ensure series convergence direction), with a convergence threshold ε = 0.0001. Iterative computation: fix hk, compute the series solution up to N = 5 terms, evaluate the residual Res(hk), and update hk+1 via the golden-section method to narrow the search interval . Termination condition: when −ε < Res(hk+1) − Res(hk) < ε. Calculation results are shown in Table 6. Goodness-of-fit comparison in Table 7.
Table 6.
Calculation results.
Table 7.
Goodness-of-Fit Comparison.
The OADM model analysis of nonlinear regression reveals that increased elevation difference shortens the vertical mixing time, intensifying the flow-driven redistribution of suspended sediment. This process amplifies the “sediment enrichment near the bed—surface dilution” effect.
Based on the above analysis, it can be concluded that under the same inflow water and sediment conditions, the larger the elevation difference, the smaller the Turbine Sediment Concentration (TSC). Therefore, selecting this factor to represent the influence of the reservoir terrain conditions on TSC is reasonable.
4. Discussion
4.1. Precondition Testing for Pearson Correlation and Regression Analysis
Based on the aforementioned calculation principles, using IBM SPSS Statistics 25 software and integrating the results from the model tests, TSC was treated as the dependent variable, while the inflow sediment concentration (S0), inflow discharge (Q), median particle size of suspended sediment (D50), inlet and outlet configurations, and elevation gap (H) were treated as independent variables. By combining the experimental data from scenarios with and without a sediment retention dam, the correlation coefficients between different influencing factors were obtained, as shown in Figure 12.
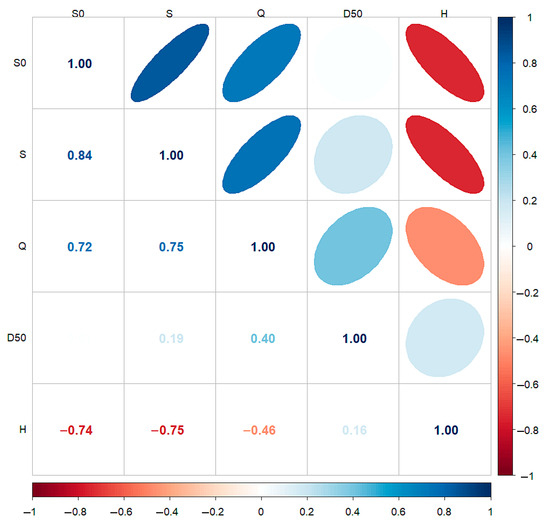
Figure 12.
Pearson Correlation Matrix Plot.
As illustrated in Figure 12, significant correlations were identified between the sediment concentration in the turbine S and the inflow sediment concentration S0, inflow discharge Q, and sediment deposition thickness. The corresponding correlation coefficients were 0.84, 0.75, and −0.75, respectively, satisfying the prerequisites for regression analysis. Building on these results, the experimental data were employed to analyze three factors—inflow discharge Q, inflow sediment concentration S0, and elevation difference H—as key determinants of turbine sediment concentration S for a sediment-laden river power station. The correlation coefficients, variance inflation factor (VIF) values, and Durbin–Watson (D-W) statistic for residual independence are tabulated in Table 8.
Table 8.
Pearson Correlation Coefficients and Parameter Values.
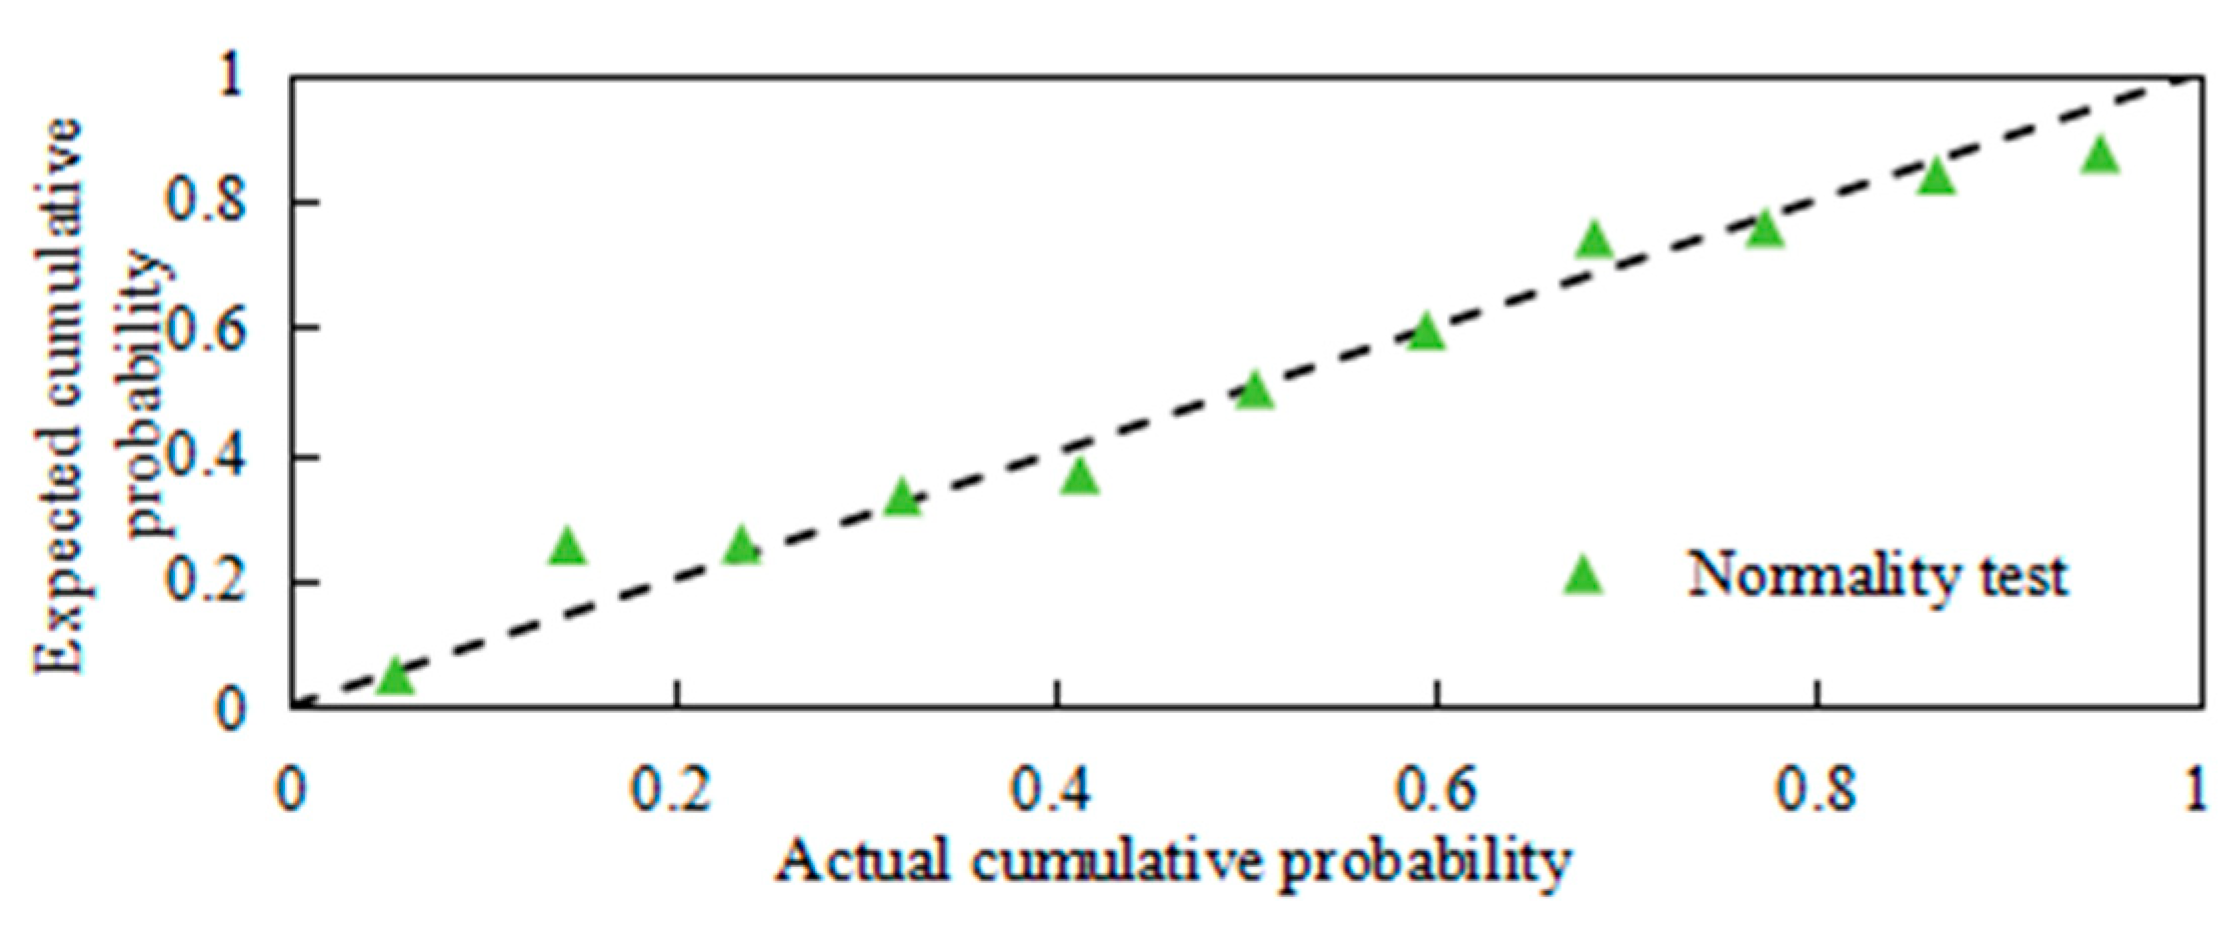
The results are shown in Figure 13. From the figure, it can be observed that the data follow a linear distribution, indicating that the residuals of the selected data conform to a normal distribution.
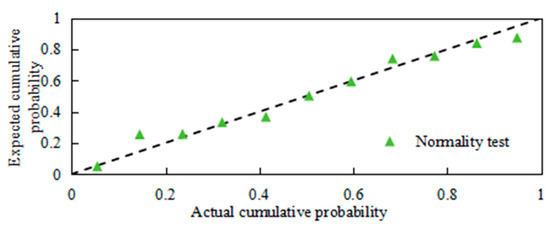
Figure 13.
Normal Probability Distribution Plot.
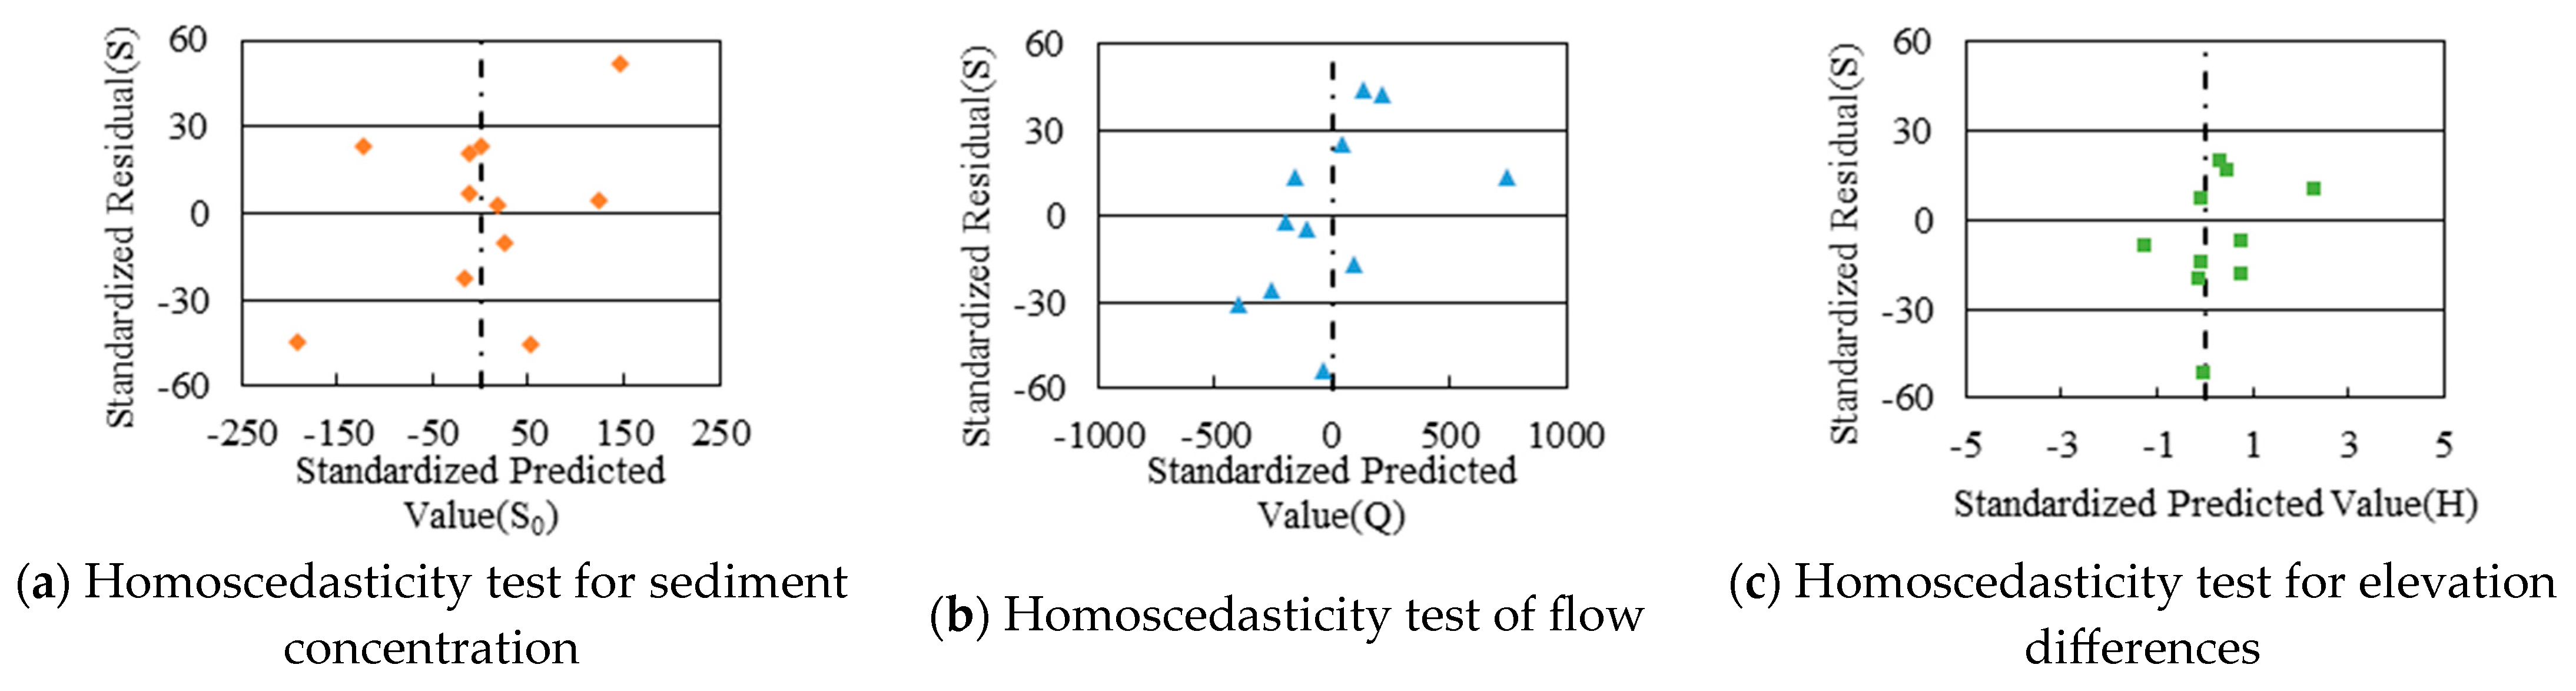
To simplify interpretation, this study standardized all variables by converting residuals and predicted values into standardized scores. A scatterplot (Figure 14) was created with standardized residuals on the Y-axis and standardized predicted values on the X-axis to test the homoscedasticity assumption. The data points are symmetrically distributed around Y = 0, confirming homoscedasticity.
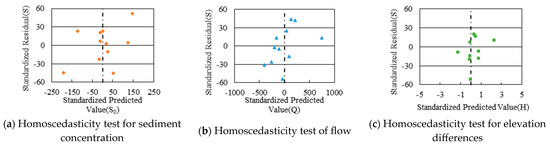
Figure 14.
Variance Standardized Scatter Plot. Note: Dashed line = zero predictions. Orange diamonds: sediment concentration variance homogeneity test; blue triangles: flow rate variance test; green squares: elevation difference variance test.
In summary, the chosen influencing factors are able to meet the preconditions for linear regression analysis, making it reasonable and justified to employ linear regression for the analysis.
4.2. Analysis of Linear Regression Results
As shown in Table 9, the model’s R2 value of 0.8 indicates that “sediment concentration at the reservoir inflow”, “flow rate at the reservoir inflow”, and “elevation difference” can collectively explain 80% of the variation in “sediment concentration at the turbine.” Based on experimental data and Pearson correlation analysis, it is evident that there is a strong correlation between sediment concentration at the reservoir inflow, flow rate at the reservoir inflow, elevation difference, and sediment concentration at the turbine. Among the three influencing factors selected in the model experiment, their impact on sediment concentration at the turbine ranks as follows: sediment concentration at the reservoir inflow > flow rate at the reservoir inflow > elevation difference between the inlet and outlet and the nearby riverbed.
Table 9.
Linear Regression Results.
4.3. Analysis of Nonlinear Regression Results
Based on the linear regression results, we further employ the Optimal Adaptive Decomposition Method (OADM) to perform a nonlinear analysis of the original linear model.
Introducing quadratic terms and interaction terms .
Parameter Optimization Process:
In this process, all coefficients are assigned dynamic weights through OADM, with parameters retaining their previous meanings (see Table 10).
Table 10.
Nonlinear regression iterative computation process.
Convergence criteria: (a) the validation set MSE exhibits a change rate < 0.1% for 3 consecutive iterations; (b) weight fluctuations remain < 1%.
The nonlinear model results demonstrate that the adjusted R2 increases to 0.82 via nonlinear regression, reflecting a 2% improvement over linear regression, while the AIC value decreases from 187 to 176. Moreover, the residual autocorrelation index (Durbin–Watson = 1.91) remains stable.
In summary, based on linear and nonlinear regression analyses, the primary three influencing factors of TSC are ranked by their impact degree as follows: incoming sediment concentration (S0) > inflow discharge (Q) > elevation difference between the inlet/outlet and adjacent riverbed (H).
4.4. Turbine Sediment Concentration Formula Fitting
As an experimental approach, based on the results of model testing and the analysis of influencing factors, variables such as the inflow rate (Q), inflow sediment concentration (S0), median particle size of suspended sediment (D50), reservoir length (L), and elevation difference (H) were selected as independent variables. Considering that sediment-laden flow primarily undergoes sedimentation in still water after entering the reservoir, additional factors influencing the settling efficiency of sediment particles, such as settling velocity (ω) and fluid viscosity (ν), were included. Preliminary analysis indicates the following:
By selecting H, S0, and ν as fundamental variables to express other variables, and in accordance with the principle of dimensional homogeneity, the following relationship can be derived:
To validate the accuracy of the dimensionless formulation, a vertical sediment concentration control equation was derived based on the principle of sediment mass conservation, serving as the theoretical foundation for predicting turbine-passing sediment concentration.
Considering the mass conservation of suspended load per unit water volume and neglecting the dominant effects of horizontal transport, the one-dimensional vertical equation is expressed as follows:
In the equation: C(z,t) is the sediment concentration (kg/m3) at height z from the bed and time t; κ(z) is the vertical turbulent diffusion coefficient; is the Stokes settling velocity; characterizes the regulating effect of elevation difference H on the vertical concentration gradient.
Under quasi-steady-state conditions (), the equation can be simplified as follows:
The optimized Adomian decomposition method (OADM) is employed to solve this nonlinear equation.
Series expansion of : decompose the nonlinear term into Adomian polynomials An.
Convergence control: introduce parameters to adjust the series convergence, obtaining the iterative solution.
where L−1 is a second-order integral operator, and the boundary conditions are determined by the trial water level.
For the Adomian series solution , the residual of the governing equation is defined as follows:
Obtain the dimensionless groups derived from dimensional analysis of the analytical solution:
Fully compatible with Equation (12), proving that the data-fitting formula implicitly embodies a convection–diffusion mechanism.
Therefore, the prediction formula for the sediment concentration in a hydro turbine can be expressed as the following dimensionless equation:
To calibrate the parameters of the above formula using data from physical model tests, and to facilitate the related analysis, the logarithmic form of the equation is taken on both sides:
The selected data consist of partial groups of data from experiments conducted under the same operational scheduling conditions.
The water temperature was set at 20 °C, and the kinematic viscosity coefficient, ν, was selected as 10−6 m2/s. The calibration of coefficients was conducted using multivariate regression analysis through IBM SPSS Statistics 25.
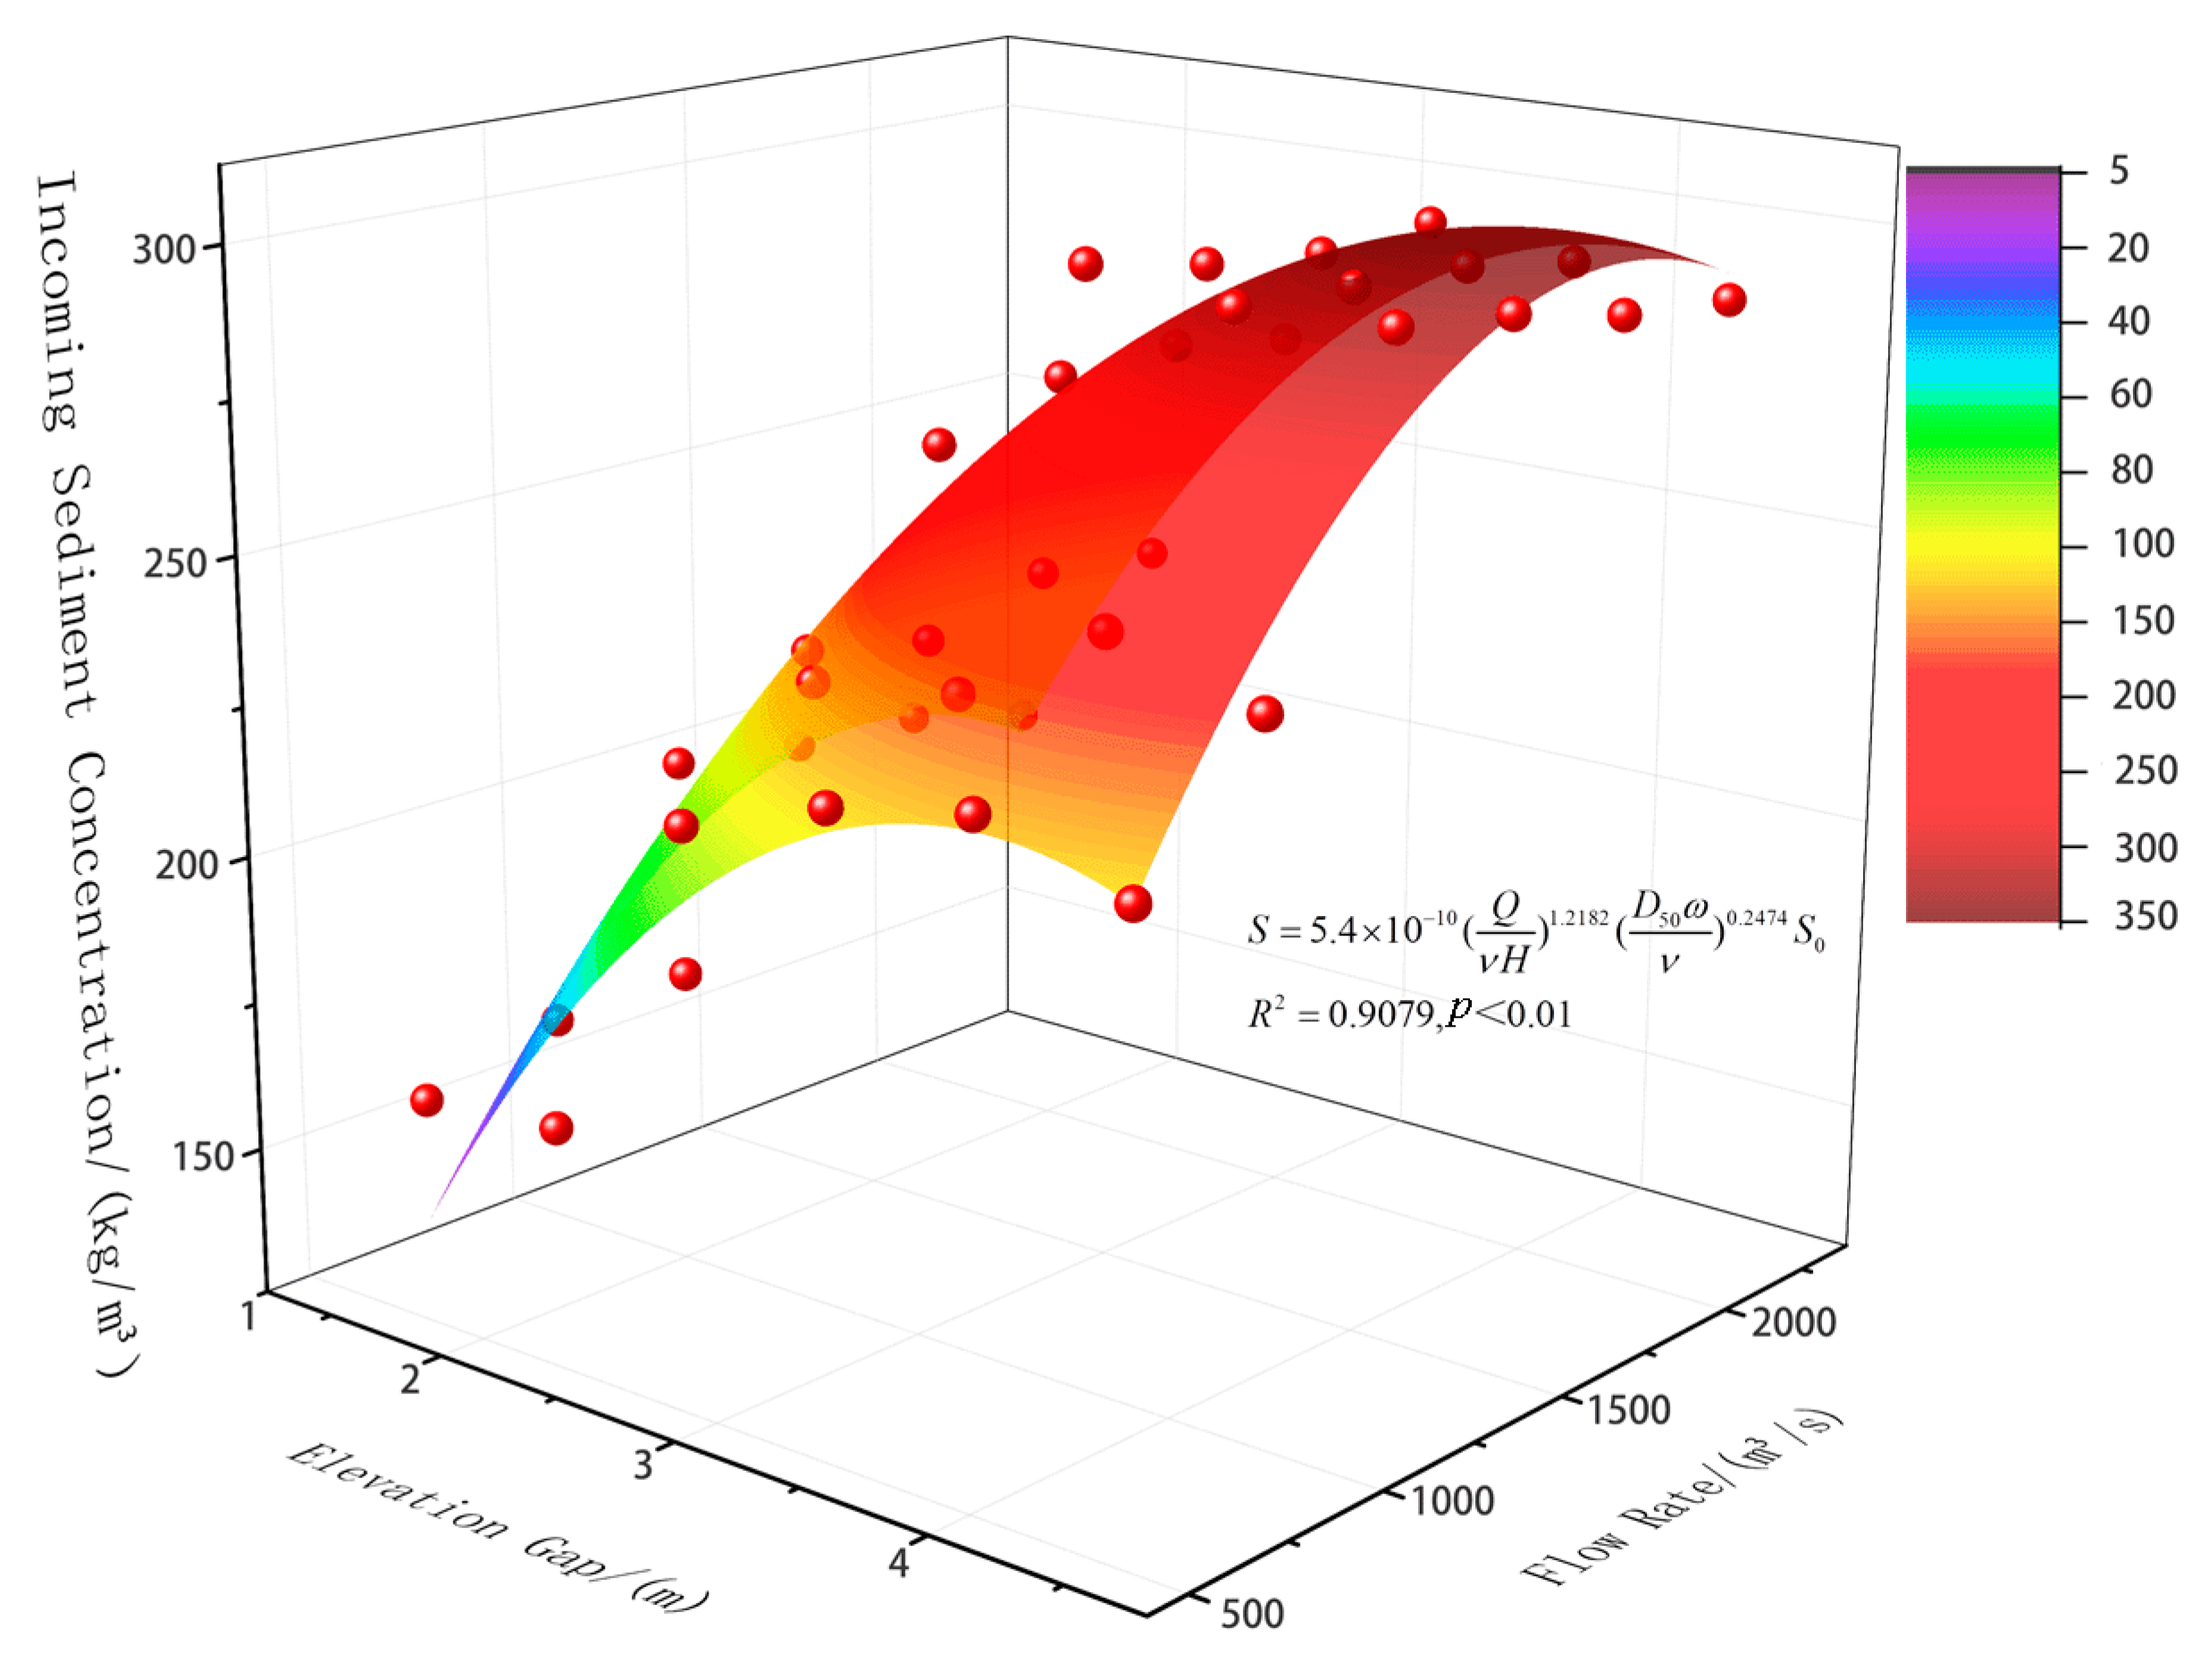
The calculated data series were subjected to nonlinear regression analysis using Origin, yielding the following coefficients: a0 = −15.6284, a1 = 0.7754, and a2 = −0.1718. Details of the fitting results are shown in Figure 15.

Figure 15.
Nonlinear fitting results.
Based on the aforementioned theoretical framework, the dimensionless parameters in the statistical model fundamentally reflect that: a1 = 0.7754 corresponds to the sublinear growth of vertical diffusion efficiency; a2 = −0.1718 characterizes the inhibitory effect of viscous dissipation on settling velocity.
Therefore, the formula for calculating the sediment concentration in the hydroturbine, fitted based on the aforementioned influencing factors, is as follows:
Here, S* is the fitted sediment concentration in the turbine, in kg/m3; the meanings of other symbols remain the same as previously stated.
The Fengning Pumped-Storage Hydropower Station in China exhibits high similarity with the power station studied in this research, and its data can serve as a reliable reference. Detailed comparative parameters are listed in Table 11.
Table 11.
Parameter comparison.
The multi-year average suspended sediment concentration at the inflow of both the Fengning Pumped-Storage and the studied pumped-storage power stations is quite similar, with suspended sediment primarily concentrated during the flood season in July and August. Additionally, the pumping periods of the two stations are nearly identical. The flood duration is typically 24 h, with relatively short peak periods, and flood peaks do not necessarily coincide with pumping operations. Furthermore, during power generation, a significant portion of the sediment pumped from the lower reservoir to the upper reservoir returns to the downstream flow, combined with anti-sediment measures, resulting in similar sediment inflow conditions for both stations.
Given that the distance between the intake/outlet of the lower reservoir and the dam site in the studied pumped-storage power station is shorter than that of the Fengning Pumped-Storage station, the influence of this difference on the sediment concentration passing through the turbines is first analyzed.
According to the concept of the “suspension index” (Z) from sediment diffusion theory [43]—where Z = ω/(κU*), with ω representing the settling velocity of a single sediment particle in still water (m/s), κ the von Kármán constant (taken as 0.4), and U* the shear velocity (m/s)—when Z < 5.0, sediment particles of a given size can remain suspended in the corresponding flow, whereas particles with Z ≥ 5.0 cannot.
Calculations indicate that, for the flow near the intake/outlet, a particle size of d = 0.02 mm corresponds to a suspension index of Z ≈ 5.0. Measured suspended sediment gradation results show that particles finer than 0.02 mm account for approximately 25% of the total sediment load, meaning that about 25% of the suspended sediment can remain in suspension at the intake/outlet. Meanwhile, at a location 1.6 km upstream of the dam, the suspension index for d = 0.1 mm remains below 5.0, indicating that all particles smaller than 0.1 mm can remain fully suspended at this location.
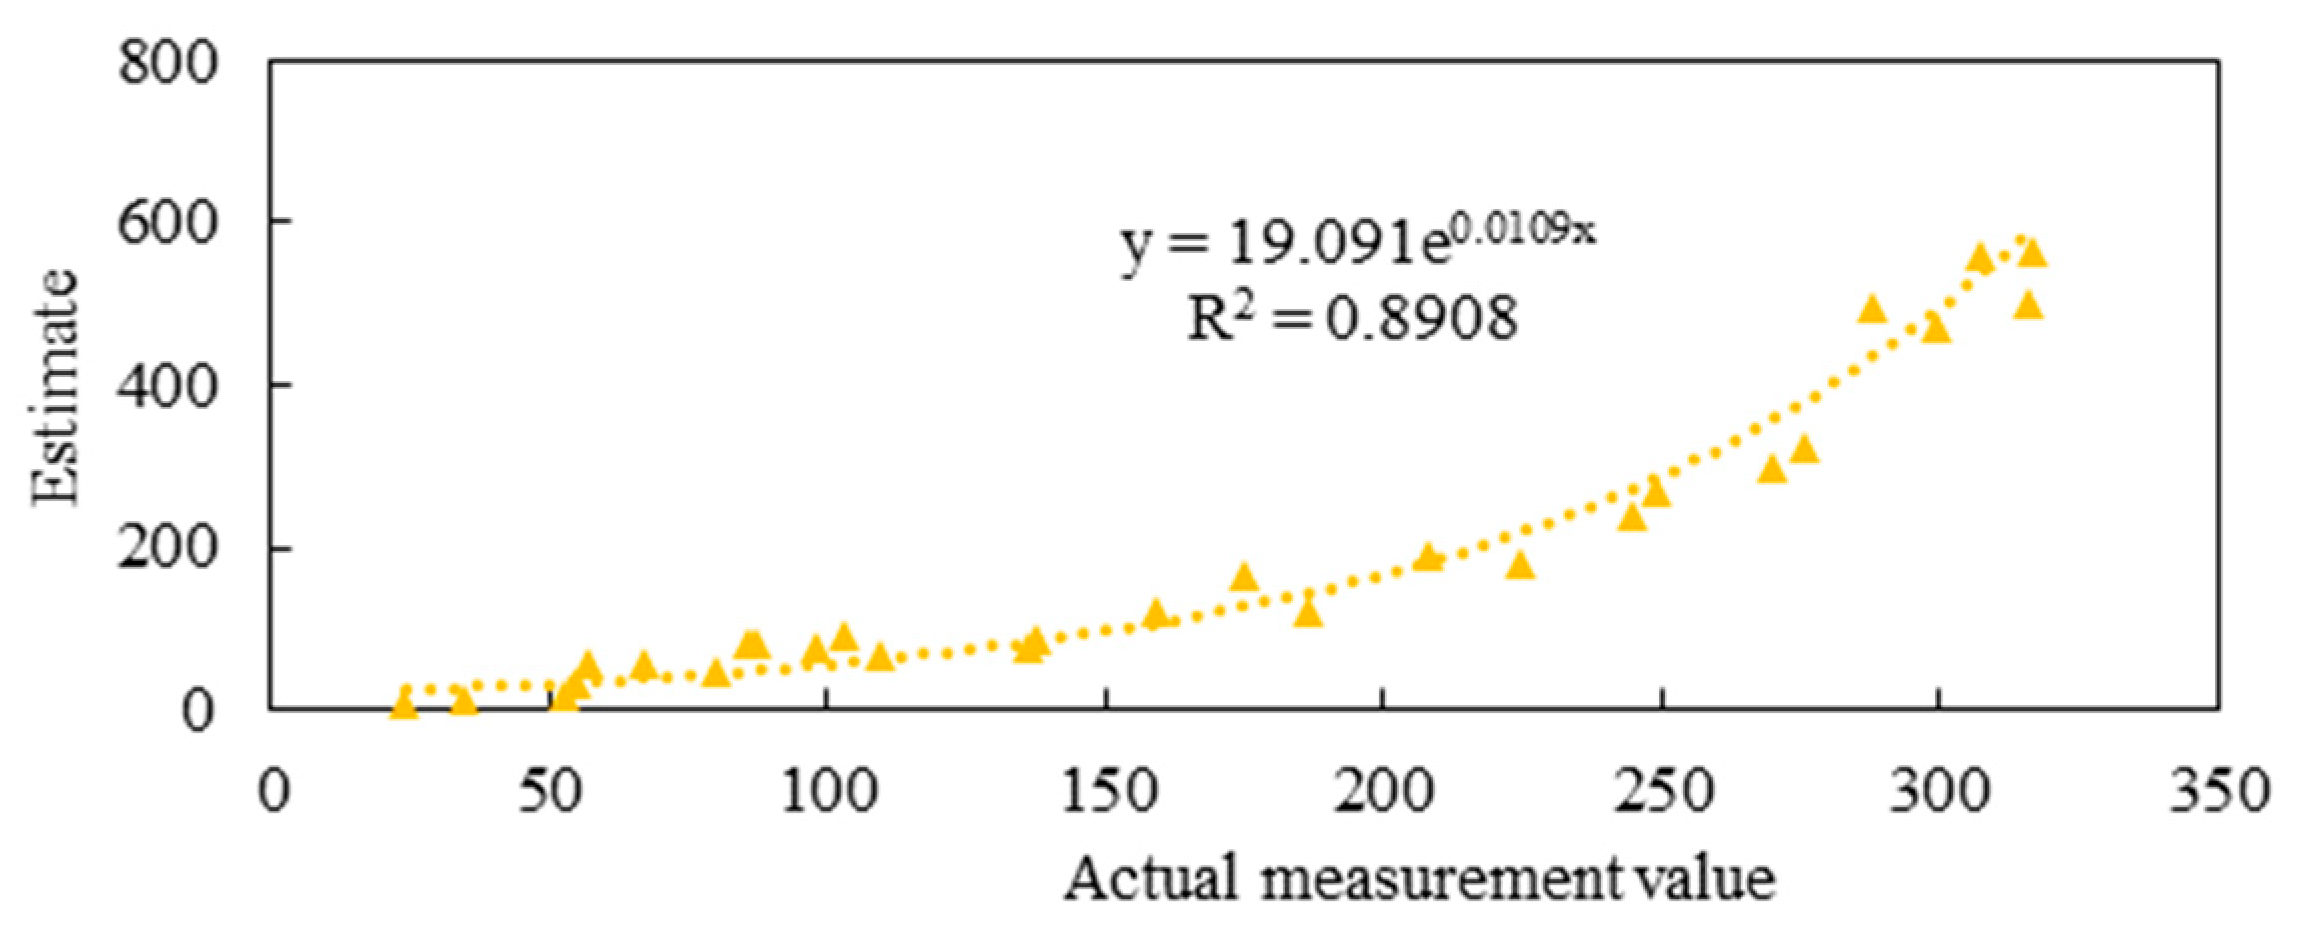
To verify the accuracy of the formula, measured operational data from the Fengning Pumped-Storage Hydropower Station in China (data sourced from the China Institute of Water Resources and Hydropower Research shared dataset) were used to validate Equation (20). The verification results are shown in Figure 16.

Figure 16.
Fitted Prediction Performance of Turbine Sediment Content.
5. Conclusions
- (1)
- The test results indicate that, under constant conditions of reservoir length and other parameters, the inflow discharge significantly affects the attenuation efficiency of sediment concentration from the reservoir inflow to the power station’s inlet and outlet: in the low discharge range (Q < 500 m3/s), the sediment concentration attenuation rate generally exceeds 90%; in the medium discharge range (500~1200 m3/s), the attenuation rate decreases to between 80% and 90%; and under high discharge conditions (Q > 1200 m3/s), the sediment concentration exhibits a sharp attenuation, with the attenuation rate ranging from 30% to 80%, leading to an increase in the sediment concentration at the power station’s inlet and outlet. This suggests that a sudden change in the longitudinal hydraulic gradient occurs at an inflow discharge of 1200 m3/s, marking a critical inflection point in sediment transport efficiency.
- (2)
- The lower boundary of the median particle size adjustment range for suspended load gradually increases with the flood return period, rising from 0.006 mm for 30 and 40-year events to 0.009 mm for an 80-year event. Furthermore, during an 80-year event, the particle size fluctuation range approaches a high-level narrow distribution of 0.009~0.011 mm.
- (3)
- The linear regression model constructed using the inflow sediment concentration, inflow discharge, and the elevation difference between the inlet/outlet and the nearby riverbed has an R2 value of 0.8, indicating that these three factors can explain 80% of the variation in the sediment concentration at the turbine for pumped storage power stations. Moreover, based on the absolute values of the standardized coefficients, the importance of each factor is ranked as follows: inflow sediment concentration (0.36) > inflow discharge (0.345) > elevation difference between the inlet/outlet and the nearby riverbed (0.319).
- (4)
- Using multiple factors influencing sediment concentration in turbines as independent variables, a TSC prediction formula was derived through dimensional analysis. The parameters were calibrated via multivariate regression, fitting a formula based on the sediment-carrying capacity theory. The results were then validated through engineering analogy, demonstrating favorable predictive accuracy.
- (5)
- Future research could integrate Large Eddy Simulation (LES) and phase-resolving modeling techniques to accurately capture the transient impact effects of turbulence on sediment entrainment at the bed interface. Simultaneously, machine learning algorithms (e.g., LSTM, Physics-Informed Neural Networks, PINNs) could be introduced to optimize the dynamic inversion and prediction of sediment-laden flow boundary conditions. This can facilitate a technological leap from theoretical mechanism analysis to intelligent engineering control, thereby providing scientific decision-making support for long-term reservoir capacity optimization and safe operation of pumped-storage power stations.
Author Contributions
Conceptualization, L.L. and Z.D.; methodology, Z.D.; software, L.L.; validation, L.L. and Z.D.; formal analysis, L.L.; investigation, L.L.; resources, L.L.; data curation, L.L.; writing—original draft preparation, L.L.; writing—review and editing, Z.W.; visualization, L.L. and Z.D.; supervision, L.L.; project administration, Z.D.; funding acquisition, Z.D. All authors have read and agreed to the published version of the manuscript.
Funding
This research was funded by National Natural Science Foundation of China (Grant No. U22A20237).
Data Availability Statement
All research data can be found in this article.
Acknowledgments
The authors are grateful for the Beijing Survey and Design Institute Corporation for the data support.
Conflicts of Interest
The authors declare no conflicts of interest.
Abbreviations
The following abbreviations are used in this manuscript:
| Pure-PSPS | Pure pumped-storage power stations |
| TSC | Turbine sediment concentration |
References
- Li, J.; Yi, C.; Gao, S. Prospect of new pumped-storage power station. Glob. Energy Interconnect. 2019, 2, 235–243. [Google Scholar] [CrossRef]
- Ji, L.; Li, X.; Huang, W.; Dong, J.; Bai, M.; Li, C. Study on site selection combination evaluation of pumped-storage power station based on cycle elimination—Based on the empirical analysis of North China. J. Energy Storage 2022, 52, 104824. [Google Scholar] [CrossRef]
- Kong, Y.; Kong, Z.; Liu, Z.; Wei, C.; Zhang, J.; An, G. Pumped storage power stations in China: The past, the present, and the future. Renew. Sustain. Energy Rev. 2017, 71, 720–731. [Google Scholar] [CrossRef]
- Storli, P.T. Overview of Pumped Hydro Resource. In Advances in Energy Storage: Latest Developments from R&D to the Market; Wiley: Hoboken, NJ, USA, 2022; pp. 211–238. [Google Scholar]
- Mao, X.; Hu, J.; Pan, Z.; Zhong, P.; Zhang, N. A Brief Review of Recent Research on Reversible Francis Pump Turbines in Pumped Storage Plants. Energies 2025, 18, 394. [Google Scholar] [CrossRef]
- Taniguchi, H.; Nagao, T.; Higasa, H. Development of a pumped-storage power station model for power system stability study. Electr. Eng. Jpn. 1992, 112, 50–62. [Google Scholar] [CrossRef]
- Zhang, F.; Ni, J.B.; Liu, R. Unit stability analysis for Jixi pumped-storage hydropower station. J. Hydroelectr. Eng. 2021, 40, 112–123. [Google Scholar]
- Shen, Z.Z.; Zhang, L.; Xu, L.Q. Optimization of seepage prevention form of the Zhen’an Pumped Storage Power Station. Appl. Mech. Mater. 2015, 724, 180–184. [Google Scholar] [CrossRef]
- Zeng, W.; Beck, M.B. Development and evaluation of a mathematical model for the study of sediment-related water quality issues. Water Sci. Technol. 2001, 43, 47–54. [Google Scholar] [CrossRef]
- Zhang, C.L.; Zhu, H.H.; Zhong, W.Q.; Huang, Z.M. Experimental research on inlet/outlet hydraulics of pump storage power plants. J. Hydroelectr. Eng. 2005, 24, 60–63. [Google Scholar]
- Guan, B.; Hou, J.; Lv, J.; Li, D.; Chen, G.; Fang, Y.; Shi, L. Numerical Simulation of Dam-Break Flood Routing in Pumped Storage Power Stations with Multi-Conditions and Disaster Impact Analysis. Water Resour. Manag. 2024, 39, 741–757. [Google Scholar] [CrossRef]
- Papanicolaou, A.N.; Elhakeem, M.; Krallis, G.; Prakash, S.; Edinger, J. Sediment transport modeling review—Current and future developments. J. Hydraul. Eng. 2008, 134, 1–14. [Google Scholar] [CrossRef]
- Bo, Y.; Tao, Z.; Kexun, Z.; Shuangying, Z.; Xiao, H.; Senlin, W.; Shiwan, C. Enclosed Karst Depression Identification and Analysis for the Pumped Storage Power Station Reservoir Construction Using DEM. Geofluids 2023, 2023, 4794665. [Google Scholar] [CrossRef]
- Yang, X.; Lian, J.; Wang, H.; Zhang, Z.; Hu, Y. Forced vibration analysis model for pumped storage power station based on the 1D–3D coupling and pipe walls vibration. Earthq. Eng. Resil. 2022, 1, 393–409. [Google Scholar] [CrossRef]
- Liu, C.; Yu, M.; He, X.; Wang, K.; Shao, Y. Numerical Simulation and Sensitivity Analysis of Sediment Issues in Pumped Storage Power Stations: Sediment Conveyance of Turbine and Sedimentation of Reservoirs. Water 2023, 15, 3531. [Google Scholar] [CrossRef]
- Budinski, L.; Spasojević, M. 2D modeling of flow and sediment interaction: Sediment mixtures. J. Waterw. Port Coast. Ocean. Eng. 2014, 140, 199–209. [Google Scholar] [CrossRef]
- Montaseri, H.; Tavakoli, K.; Evangelista, S.; Omidvar, P. Sediment transport and bed evolution in a 180° curved channel with lateral intake: Numerical simulations using Eulerian and Discrete Phase models. Int. J. Mod. Phys. C Comput. Phys. Phys. Comput. 2020, 31, 2050113. [Google Scholar] [CrossRef]
- Mehnifard, M.; Dalfardi, S.; Baghdadi, H.; Seirfar, Z. Simulation of local scour caused by submerged horizontal jets with Flow-3D numerical model. Desert 2015, 20, 47–55. [Google Scholar]
- Tarek, A.S. Three-dimensional numerical study for determining the optimum diversion angle of bifurcating channels. Ain Shams Eng. J. 2023, 14, 241–249. [Google Scholar]
- Jin, M. Numerical Analysis of Flow Characteristics in a Braided River with Diversion Weirs; Shenyang Agricultural University: Shenyang, China, 2017. [Google Scholar]
- Wu, T.; Wei, Z.; Zhan, Y. A prediction method for sediment passing through pumped storage power stations. Hongshui River 2006, 12, 78–81. [Google Scholar]
- Pan, J.; Ma, J.; Han, J.; Zhou, Y.; Wu, L.; Zhang, W. Prediction of sediment wear of francis turbine with high head and high sediment content. Front. Energy Res. 2023, 10, 1117606. [Google Scholar] [CrossRef]
- Li, J.; He, X.; Wei, J.; Bao, Y.; Tang, Q.; de Dieu Nambajimana, J.; Nsabimana, G. Multifractal features of the particle-size distribution of suspended sediment in the Three Gorges Reservoir, China. Int. J. Sediment Res. 2021, 36, 489–500. [Google Scholar] [CrossRef]
- Li, J.; Cao, Z.; Liu, Q. Waves and sediment transport due to granular landslides impacting reservoirs. Water Resour. Res. 2019, 55, 495–518. [Google Scholar] [CrossRef]
- Fu, Y.; Bellerby, R.G.J.; Ji, H.; Chen, S.; Fan, Y.; Li, P. Impacts of riverine floods on morphodynamics in the yellow river delta. Water 2023, 15, 1568. [Google Scholar] [CrossRef]
- Fitri, A.; Hashim, R.; Abolfathi, S.; Abdul Maulud, K.N. Dynamics of sediment transport and erosion-deposition patterns in the locality of a detached low-crested breakwater on a cohesive coast. Water 2019, 11, 1721. [Google Scholar] [CrossRef]
- Alvarez, L.V.; Grams, P.E. An Eddy-Resolving Numerical Model to Study Turbulent Flow, Sediment, and Bed Evolution Using Detached Eddy Simulation in a Lateral Separation Zone at the Field-Scale. J. Geophys. Res. Earth Surf. 2021, 126, e2021JF006149. [Google Scholar] [CrossRef]
- Hu, P.; Tao, J.; Ji, A.; Li, W.; He, Z. A computationally efficient shallow water model for mixed cohesive and non-cohesive sediment transport in the Yangtze Estuary. Water 2021, 13, 1435. [Google Scholar] [CrossRef]
- Imanshoar, F.; Jahangirzadeh, A.; Basser, H.; Akib, S.; Kamali, B.; Tabatabaei, M.R.M.; Kakouei, M. Reservoir sedimentation based on uncertainty analysis. In Abstract and Applied Analysis; Hindawi Publishing Corporation: London, UK, 2014; Volume 2014, p. 367627. [Google Scholar]
- Tsai, C.W.; Yeh, T.G.; Hsu, Y.; Wu, K.T.; Liu, W.J. Risk analysis of reservoir sedimentation under non-stationary flows. J. Flood Risk Manag. 2021, 14, e12706. [Google Scholar] [CrossRef]
- Stefanidis, P.; Stefanidis, S. Reservoir sedimentation and mitigation measures. Lakes Reserv. Res. Manag. 2012, 17, 113–117. [Google Scholar] [CrossRef]
- Lajczak, A. Modelling the long-term course of non-flushed reservoir sedimentation and estimating the life of dams. Earth Surf. Process. Landf. 1996, 21, 1091–1107. [Google Scholar] [CrossRef]
- Mustapha, M.K.; Abodunrin, I.A. Is siltation affecting the limnology and gradually eroding the functions of Agba reservoir, Ilorin, Nigeria?—An old tropical African drinking water reservoir. Lakes Reserv. Res. Manag. 2021, 26, e12366. [Google Scholar]
- Yang, Y.; Zheng, J.; Zhang, H.; Chai, Y.; Zhu, Y.; Wang, C. Impact of the Three Gorges Dam on riverbed scour and siltation of the middle reaches of the Yangtze River. Earth Surf. Process. Landf. 2022, 47, 1514–1531. [Google Scholar] [CrossRef]
- Sun, J.; Zhang, F.; Zhang, X.; Lin, B.; Yang, Z.; Yuan, B.; Falconer, R.A. Severely declining suspended sediment concentration in the heavily dammed Changjiang fluvial system. Water Resour. Res. 2021, 57, e2021WR030370. [Google Scholar] [CrossRef]
- Eidmann, J.S.; Rathburn, S.L.; White, D.; Huson, K. Channel response and reservoir delta evolution from source to sink following an extreme flood. J. Geophys. Res. Earth Surf. 2022, 127, e2020JF006013. [Google Scholar] [CrossRef]
- Wang, T.; Tang, H.; Chen, H.; Ma, D.; Wang, Y.; Fan, H. Numerical Evaluation on Massif Vibration of Pumped Storage Power Plant in Hydraulic Transients. Energies 2025, 18, 222. [Google Scholar] [CrossRef]
- Xu, L. A new load grouping control method for pumped storage power stations in the planning curve mode. J. Phys. Conf. Ser. 2025, 2935, 012012. [Google Scholar] [CrossRef]
- Lin, J.; Zhu, Y.; Hou, J.; Pan, B.; Chu, W.; Huang, W. Equivalent Continuum Coupling-Based Slope Stability Analysis of Zhouning Pumped Storage Power Station. Geofluids 2021, 2021, 9926751. [Google Scholar] [CrossRef]
- Yang, L.; Wang, H.; Yang, X.; Li, H. Study of the inhibitory effect of a soft cushion on the propagation of pressure pulsation in pumped storage power stations. Earthq. Eng. Resil. 2023, 2, 301–315. [Google Scholar] [CrossRef]
- Tian, J.; Xu, P.; Hu, H.; Liang, D.; Wang, Y.; Shang, Y. Hydrodynamic Optimization of Non-Pressurized Tunnel Intersection of Pumped Storage Power Station. Water 2025, 17, 471. [Google Scholar] [CrossRef]
- Fan, H.; Wu, H.; Li, S.; Han, S.; Ren, J.; Huang, S.; Zou, H. Optimal Scheduling Method of Combined Wind–Photovoltaic–Pumped Storage System Based on Improved Bat Algorithm. Processes 2025, 13, 101. [Google Scholar] [CrossRef]
- Wang, Z.; Li, Q.; Kong, S.; Li, W.; Luo, J.; Huang, T. Analysis of renewable energy consumption and economy considering the joint optimal allocation of “renewable energy+ energy storage+ synchronous condenser”. Sci. Rep. 2023, 13, 20376. [Google Scholar] [CrossRef]
- Pikl, F.G.; Richter, W.; Zenz, G. Pumped storage technology combined with thermal energy storage–Power station and pressure tunnel concept: Pumpspeichertechnologie kombiniert mit thermischer Energiespeicherung–Kraftwerks-und Druckstollenkonzept. Geomech. Tunn. 2017, 10, 611–619. [Google Scholar] [CrossRef]
- Huang, H.; Zhou, M.; Zhang, L.; Li, G.; Sun, Y. Joint generation and reserve scheduling of wind-solar-pumped storage power systems under multiple uncertainties. Int. Trans. Electr. Energy Syst. 2019, 29, e12003. [Google Scholar] [CrossRef]
- Zhang, L.; Xin, H.; Wu, J.; Ju, L.; Tan, Z. A multiobjective robust scheduling optimization mode for multienergy hybrid system integrated by wind power, solar photovoltaic power, and pumped storage power. Math. Probl. Eng. 2017, 2017, 9485127. [Google Scholar] [CrossRef]
- Gao, J.; Zheng, Y.; Li, J.; Zhu, X.; Kan, K. Optimal Model for Complementary Operation of a Photovoltaic-Wind-Pumped Storage System. Math. Probl. Eng. 2018, 2018, 5346253. [Google Scholar] [CrossRef]
- Shen, J.; Wang, Y.; Hao, T.; Cheng, C. Pumped-storage renovation for grid-scale, long-duration energy storage. Nat. Rev. Electr. Eng. 2025, 2, 79–80. [Google Scholar] [CrossRef]
- Pang, J.; Liu, H.; Liu, X.; Yang, H.; Peng, Y.; Zeng, Y.; Yu, Z. Study on sediment erosion of high head Francis turbine runner in Minjiang River basin. Renew. Energy 2022, 192, 849–858. [Google Scholar] [CrossRef]
- Zhang, Y.; Wang, Y.H.; Zhang, S.L.; Zhang, Q.J. Influence of Imported Water and Sediment on the Sediment Concentration in a Pumped Storage Power Station. Pearl River 2018, 39, 45–49. [Google Scholar]
- Zou, X.; Wang, C.; Song, H.; Han, Z.; Ma, Z.; Hu, W. Applications of ultrasound imaging system for measuring water-sand parameters during sediment transport process in hydraulic model experiments. J. Hydroinformatics 2018, 20, 410–423. [Google Scholar] [CrossRef]
- Ministry of Housing and Urban-Rural Development of the People’s Republic of China, State Administration for Market Regulation. GB/T 50180—2018 Standard for Design of Engineering Sediment in China; China Standards Press: Beijing, China, 2018. [Google Scholar]
- Ministry of Water Resources of the People’s Republic of China. SL 99—2012 Standard for River Model Test; China Water & Power Press: Beijing, China, 2012. [Google Scholar]
- Zhang, R.J. River Dynamics; China Water Power Press: Beijing, China, 1998; pp. 182–186. [Google Scholar]
- Shu, A.P.; Fei, X.J. Sediment transport capacity of hyperconcentrated flow. Sci. China Ser. G Phys. Mech. Astron. 2008, 51, 961–975. [Google Scholar] [CrossRef]
- Turkyilmazoglu, M. A reliable convergent Adomian decomposition method for heat transfer through extended surfaces. Int. J. Numer. Methods Heat Fluid Flow 2018, 28, 2551–2566. [Google Scholar] [CrossRef]


Disclaimer/Publisher’s Note: The statements, opinions and data contained in all publications are solely those of the individual author(s) and contributor(s) and not of MDPI and/or the editor(s). MDPI and/or the editor(s) disclaim responsibility for any injury to people or property resulting from any ideas, methods, instructions or products referred to in the content. |
© 2025 by the authors. Licensee MDPI, Basel, Switzerland. This article is an open access article distributed under the terms and conditions of the Creative Commons Attribution (CC BY) license (https://creativecommons.org/licenses/by/4.0/).