Abstract
Hundreds of veterinary drugs are widely used in agricultural activities and continuously enter aquatic environments through various pathways, posing potential risks to ecosystem. Considering that sediments function both as sinks and sources of these contaminants, it is crucial to promptly and accurately acquire veterinary drug residue level in sediments. In this study, a highly effective analytical method for simultaneous determination of 103 veterinary drugs from 16 classes in sediments was developed using high-performance liquid chromatography–tandem mass spectrometry (HPLC-MS/MS). The extraction procedure was performed twice by ultrasound-assisted extraction with an acetonitrile-buffer mixture consisting of Na2EDTA, Na3PO4·12H2O, and Na3C6H5O7·2H2O. The supernatant was cleaned using 500 mg/6 mL Oasis HLB solid-phase cartridges. The elution solutions were concentrated and redissolved in formic acid–methanol–water (0.1/20/79.9, v/v, FA-MeOH-H2O) for detection. Results showed that all 103 target drugs exhibited good linearity with R2 > 0.990 over a concentration range of 0.010 to 1000 μg·L−1, and method detection limits (MDLs) ranged from 0.025 to 5 μg·kg−1. The recoveries at three spiking levels (2, 5, and 10 times of the method quantification limits, MQLs) varied from 33% to 150%, 32% to 140%, and 40% to 140%, respectively, with relative standard deviations (RSDs, n = 3) of 0.7%~29%, 0.8%~23%, and 0.5%~20%. The matrix effects for all compounds ranged from –85% to 84% with 32 targets negligible, 51 moderate, and 20 significant. An isotope-labeled surrogate method was proposed for quantitation to effectively overcome matrix effects and improve accuracy with better recoveries of 60%~120% for 93 target drugs and RSDs (n = 3) all below 20%. This method was applied to determine 12 sediment samples collected from the Jiulong River, and 16 target drugs were detected in the concentrations range of 0.1~7.6 μg·kg−1. The method is accurate, sensitive, and efficient, providing a powerful analytical tool for behavior and effect studies of multi-classed veterinary drug residue in sediment environments.
1. Introduction
The rapid development of livestock and aquaculture has led to increasing growth in both the production and usage of veterinary drugs. Approximately 70% of antibiotics are excreted in active original forms and can subsequently enter into aquatic environments through various pathways, including animal waste, sewage disposal, hospital wastewater, rain-off and washout, etc. [1,2,3,4,5]. These compounds may be absorbed into sediments, resulting in difficult degradation and persistent environmental pollution [6,7]. Although the detected concentrations of most veterinary drugs in sediments are relatively low, certain drugs exhibit high detection rates in wide ranges with elevated concentrations [8,9,10]. Over the past decade, research on veterinary drug residuals focused on developing robust and reliable analytical methods for simultaneous determination of multiple compounds [11,12]. However, the diverse chemical structures, amphoteric properties, and different polarities of veterinary drugs present significant challenges in sample pretreatment, instrumental analysis, and accurate quantification.
The simultaneous extraction of veterinary drugs from sediment is most effectively conducted through liquid–solid extraction (LSE), which is usually promoted using assistance techniques such as ultrasonic waves [13,14,15], mechanical oscillation [13,15,16], microwaves [17], and accelerated solvent extraction [6,18,19]. Various extraction solvents, including methanol, acetonitrile, and buffers such as McIlvaine buffer [14,15,17], sodium citrate buffer [18,19], and phosphate buffer [13,20], have been employed to minimize matrix interference caused by co-extracted components. The extracted solution is then typically purified using various solid-phase extraction (SPE) cartridges. Among them, hydrophilic-lipophilic balance (HLB) [15,17,18,20] or HLB combined with strong anion exchange (SAX) [13,14,19] are widely used due to their ability to adsorb compounds with varying polarities. This versatility is attributed to the HLB’s polymers of oleophilic divinylbenzene and hydrophilic N-vinylpyrrolidone, which can offer high performance stability across a wide pH range (1–14). Thus, the ideal extraction efficiency requires tailored optimization of the extraction-assisted method, buffer solvent selection, and SPE cleanup procedures, especially for a broad spectrum of veterinary drugs.
High-performance liquid chromatography coupled with tandem mass spectrometry (HPLC-MS/MS) is the most powerful technology for simultaneous detection of various veterinary drugs due to its excellent LC separation capability and high sensitivity of mass spectrometer [13,14,15,16,17,18,19,20]. However, reported methods cover only common target compounds, such as sulfonamides, quinolones, macrolides, tetracyclines, and chloramphenicols [13,14,17,19,20], while neglecting emerging veterinary drugs, including androgens, nitrofurans, steroids, nitroimidazoles, benzimidazoles, etc. This highlights the importance of developing robust methods for simultaneous determination of multi-class veterinary drugs in various matrices.
Common quantitation methods include the external standard method, internal standard method, matrix matching method, and isotope-labeled dilution method. External and internal standard methods face many challenges in ensuring detection accuracy for complicated sediment samples. Although it provides excellent performance in overcoming matrix effects (ME), the matrix matching method also confronts limitations due to the diverse origins and compositions of sediment samples, which make it difficult to find the appropriate representative blank matrix [15,17,20]. Furthermore, different samples require separate calibration curves, which lead to massive workload. Isotope-labeled dilution method [15,18,20] has proven to be highly effective in compensating for matrix interference and target losses during sample pretreatment. However, insufficient choice and high purchase cost limit its broader application. Therefore, development of a cost-effective and robust quantitation method that can both minimize ME and improve accuracy are critical for multiple target compounds analysis in complicated matrices.
The objective of this study was to develop a reliable, sensitive, and accurate method for simultaneous determination of 103 veterinary drugs from 16 classes in sediment matrices using LSE-SPE-LC/MSMS. A novel buffer solution and HLB elusion solvents were optimized to facilitate the extraction and purification of target compounds with diverse physico-chemical properties. An isotope-labeled surrogate quantitation method was investigated and proposed for ME elimination and accuracy promotion. The established method was successfully validated and applied to analyze sediment samples from the Jiulong River, demonstrating its robustness and performance in determining a wide range of veterinary drugs in complicated sediment matrices.
2. Materials and Methods
2.1. Chemicals and Reagents
All standard compounds and isotope-labeled surrogates listed in Table 1 were purchased from Dr. Ehrenstorfer GmbH (Augsburg, Germany) and Sigma-Aldrich (St. Louis, MO, USA). Individual stock solutions were prepared by dissolving each compound in methanol to concentrations ranging from 10 to 1000 mg·L−1. Working solutions were prepared at concentrations ranging from 0.1 to 10 mg·L−1. All standard solutions were stored at −20 °C in amber glass container to prevent degradation until further use.

Table 1.
Target compounds, abbreviations, retention times, and MS parameters, including precursor ion (PI), product ion (DI), collision energy (CE), and ionization mode.
HPLC-grade solvents, including methanol, acetonitrile, formic acid, and dichloromethane, were supplied by Tedia (Fairfield, IA, USA). Disodium ethylenediaminetetraacetate (Na2EDTA), trisodium phosphate dodecahydrate (Na3PO4·12H2O), and sodium citrate dihydrate (Na3C6H5O7·2H2O) were of analytical grade and obtained from Xilong Chemical (Shantou, Guangdong, China). Reagent water with a resistivity of 18.2 MΩ·cm was prepared using a Milli-Q water purification system (Millipore, Bedford, MA, USA). Solid-phase extraction cartridges (Oasis HLB 500 mg/6 mL) were purchased from Waters (Milford, MA, USA).
2.2. Sample Collection and Treatment
Surface sediment samples (0–10 cm) were collected from 12 sites along the Jiulong River, Fujian Province, China in October 2019. Sediment samples were moved into pre-cleaned glass jars, lyophilized at −18 °C using a Labconco freeze dryer (Kansas City, MO, USA), homogenized by passing through a 100-mesh sieve, and stored at −18 °C until analysis.
2.3. Sample Extraction and Purification
Sediment samples were accurately weighed, and 2.0 g was placed into 100 mL polypropylene centrifuge tubes and spiked with 20 ng of substitution standards in triplicate. Buffer A (2 mL) and acetonitrile (18 mL) were added to each tube, followed by thorough mixing for 1 min. The samples were then subjected to ultrasonic oscillation for 10 min. After centrifugation at 3500 rpm for 5 min, the solid and liquid phases were separated. The above extraction procedure was repeated a second time under identical conditions. For the third extraction, the same procedure was followed, except with buffer B in place of buffer A (Table 2).
Table 2.
Buffer solutions with specific pH values for sediment extraction.
The three extracts were combined in a 150 mL round-bottom flask and evaporated at 35 °C to remove organic solvent to 0.5 mL. The concentrated extracts were reconstituted three times with 3 mL of Milli-Q water and subsequently loaded through HLB cartridges, which were preconditioned sequentially with 6 mL methanol and 10 mL Milli-Q water. The cartridges were washed with 12 mL of Milli-Q water and dried under vacuum, then eluted with 8 mL of methanol and 4 mL of dichloromethane (two steps). The eluates were evaporated to dryness at 35 °C under gentle nitrogen stream. The residues were then reconstituted in 1 mL of MeOH-H2O (0.1% formic acid, 20:80, v/v) and filtered through a PTFE syringe filter (0.22 μm pore size) for HPLC-MS/MS analysis.
2.4. Instrumental Analysis and Parameters
The target compounds were determined using an Agilent 1260 Infinity LC system coupled to an Agilent 6490 triple quadrupole mass spectrometer (MS/MS) equipped with an electrospray ionization (ESI) source (Agilent, Palo Alto, CA, USA). Separation was achieved by injecting 10 μL of the sample onto a Kinetex C18 column (150 mm × 3.0 mm i.d., particle size 2.6 μm, Phenomenex, Torrance, CA, USA), protected with a guard column (C18; particle size 2.6 μm), at 30 °C. The mobile phase for negative ionization mode (ESI−) detection consisted of H2O and acetonitrile (ACN) and H2O and ACN containing 0.1% formic acid for positive ionization mode (ESI+) detection. The optimized LC gradient programs for the two separate runs (ESI+ and ESI−) are listed in Table S1.
For MS/MS detection, the ESI source operated in both positive and negative ionization mode using nitrogen gas as the drying gas and collision gas. The optimal MSMS parameters were as follows: drying gas temperature of 300 °C, drying gas flow rate of 10 L· min−1, sheath gas temperature of 350 °C, sheath gas flow rate of 12 L ·min−1, nebulizer pressure of 35 psi, nozzle voltage of 1500 V, capillary voltage of 4000 V, and fragmentation voltage of 380 V. The optimal collision energy and ionization modes for multiple-reaction monitoring (MRM) mode are listed in Table 1.
2.5. Quantification and Quality Control
The method was validated by evaluating linearity, recovery, sensitivity, precision, and matrix effects for each target compound. Linearity across the full concentration range was determined by spiking target compounds into extracts from blank samples or solvents, and correlation coefficients (R2) were calculated for all compounds. Recoveries were accessed by spiking standard solutions into samples at 2, 5, and 10 times the method quantification limits (MQLs). All experiments were conducted in triplicate, and relative standard deviations (RSDs) were calculated to evaluate the method precision. The MQLs and method detection limitations (MDLs) for target veterinary drugs were defined as the minimum detectable concentrations with signal-to-noise ratios of 10 and 3, respectively.
2.6. Matrix Effect
It is essential to evaluate matrix effects in the analysis using HPLC-MS/MS, primarily due to the coelution of unknown matrix components that may suppress or enhance analyte ionization at electrospray interface [21]. The matrix effect is calculated according to Equation (1).
Amatrix, Ablank, and Asolvent represent the peak areas obtained in HPLC-MS/MS analysis for target analytes in matrix-matched standard, blank sample, and standard solution, respectively [22]. Positive or negative values of the matrix effect indicate whether the ionization of the target compounds was enhanced or suppressed by interfering substances. When |ME| ≤ 20%, the signal enhancement or suppression is considered negligible. If 20% < |ME| ≤ 50%, moderate enhancement or suppression has occurred. When |ME| > 50%, the effect is deemed significant. To ensure analytical accuracy, strict quality control procedures were implemented for all samples. The concentrations of target compounds were quantified using a calibration curve constructed with isotope-labeled surrogate standards.
2.7. Isotope-Labeled Surrogate Quantitation Method
Isotope-labeled internal standards represent the most effective approach for compensating for matrix effects and correcting losses in analytical produces. However, their practical application in multi-residue analysis is often constrained by the difficulty in obtaining matched isotope-labeled counterparts for each target analyte.
To overcome this limitation, the isotope-labeled surrogate quantitation method was investigated through an extension of traditional isotope dilution methodology. In this study, we implemented an innovative strategy employing 13 isotopically labeled surrogate standards to represent target analytes with similar physicochemical properties, chromatographic behaviors (retention time windows), recoveries, and matrix effects.
In data processing, the relative response factor (RRF) is first obtained through calculation methods, and then, the content of target substance is calculated:
where RRFx/Su represents the relative response factor of the target compound relative to the surrogate in instrumental analysis. Ax and Asu denote the peak areas of the target compound and surrogate in the standard calibration curve, respectively. Cx and CSu correspond to the concentrations of the target compound and surrogate in the standard calibration curve (μg·g−1). C indicates the concentration of the target compound in the sample (ng·g−1). ax and aSu represent the peak areas of the target compound and surrogate in the concentrated sample extract. WSu specifies the amount of surrogate added prior to sample pretreatment (μg). VS refers to the sample volume before pretreatment (g).
The detailed surrogate-to-target analyte correspondence relationship and validation data are provided in Appendix B.
3. Results and Discussion
3.1. Optimization of MS/MS Parameters
To achieve ideal sensitivity, the mass spectrometry parameters for each target analyte were optimized at concentrations ranging from 1 to 5 mg·L−1 under ESI+ and ESI− modes according to molecular structure and polarity properties (listed in Table 1).
3.2. Optimization of LC Separation Conditions
The LC separation conditions were optimized to achieve effective separation for 103 target analytes using a Phenomenex Kinetex C18 column (Phenomenex Inc., Torrance, CA, USA) under ESI+ and ESI− modes (Figure S1). For ESI+ mode, increasing acetonitrile proportion resulted in peak bifurcation for sulfonamides and significant peak broadening and tailing for compounds with later retention times. The addition of 0.1% formic acid greatly improved both ionization efficiency and separation performance [23,24]. Thus, ultrapure water (A) and acetonitrile containing 0.1% (v/v) formic acid (B2) were used as mobile phases at a flow rate of 0.25 mL·min−1 and 10 μL injection volume. For ESI+ mode, the addition of formic acid enhanced both ionization efficiency and chromatographic separation. For ESI− mode, ultrapure water (A) and acetonitrile (B1) were used as mobile phases. Mass spectrometry parameters were optimized under both ESI+ and ESI− conditions based on molecular structural characteristics: electronegative groups (e.g., halogens) facilitated anion formation in ESI−, while tertiary/secondary amine groups promoted cationization in ESI+.
3.3. Optimization of Extraction Procedure
Organic solvents and aqueous buffers are commonly used for extraction of various strong polar organic compounds from sediment and soil samples. The composition of extraction solvents plays a crucial role on extraction performance. Numerous extraction methods have been optimized by combining water or a water-based buffer with an organic solvent, mostly acetonitrile [25,26].
3.3.1. Optimization of Buffer Solution pH
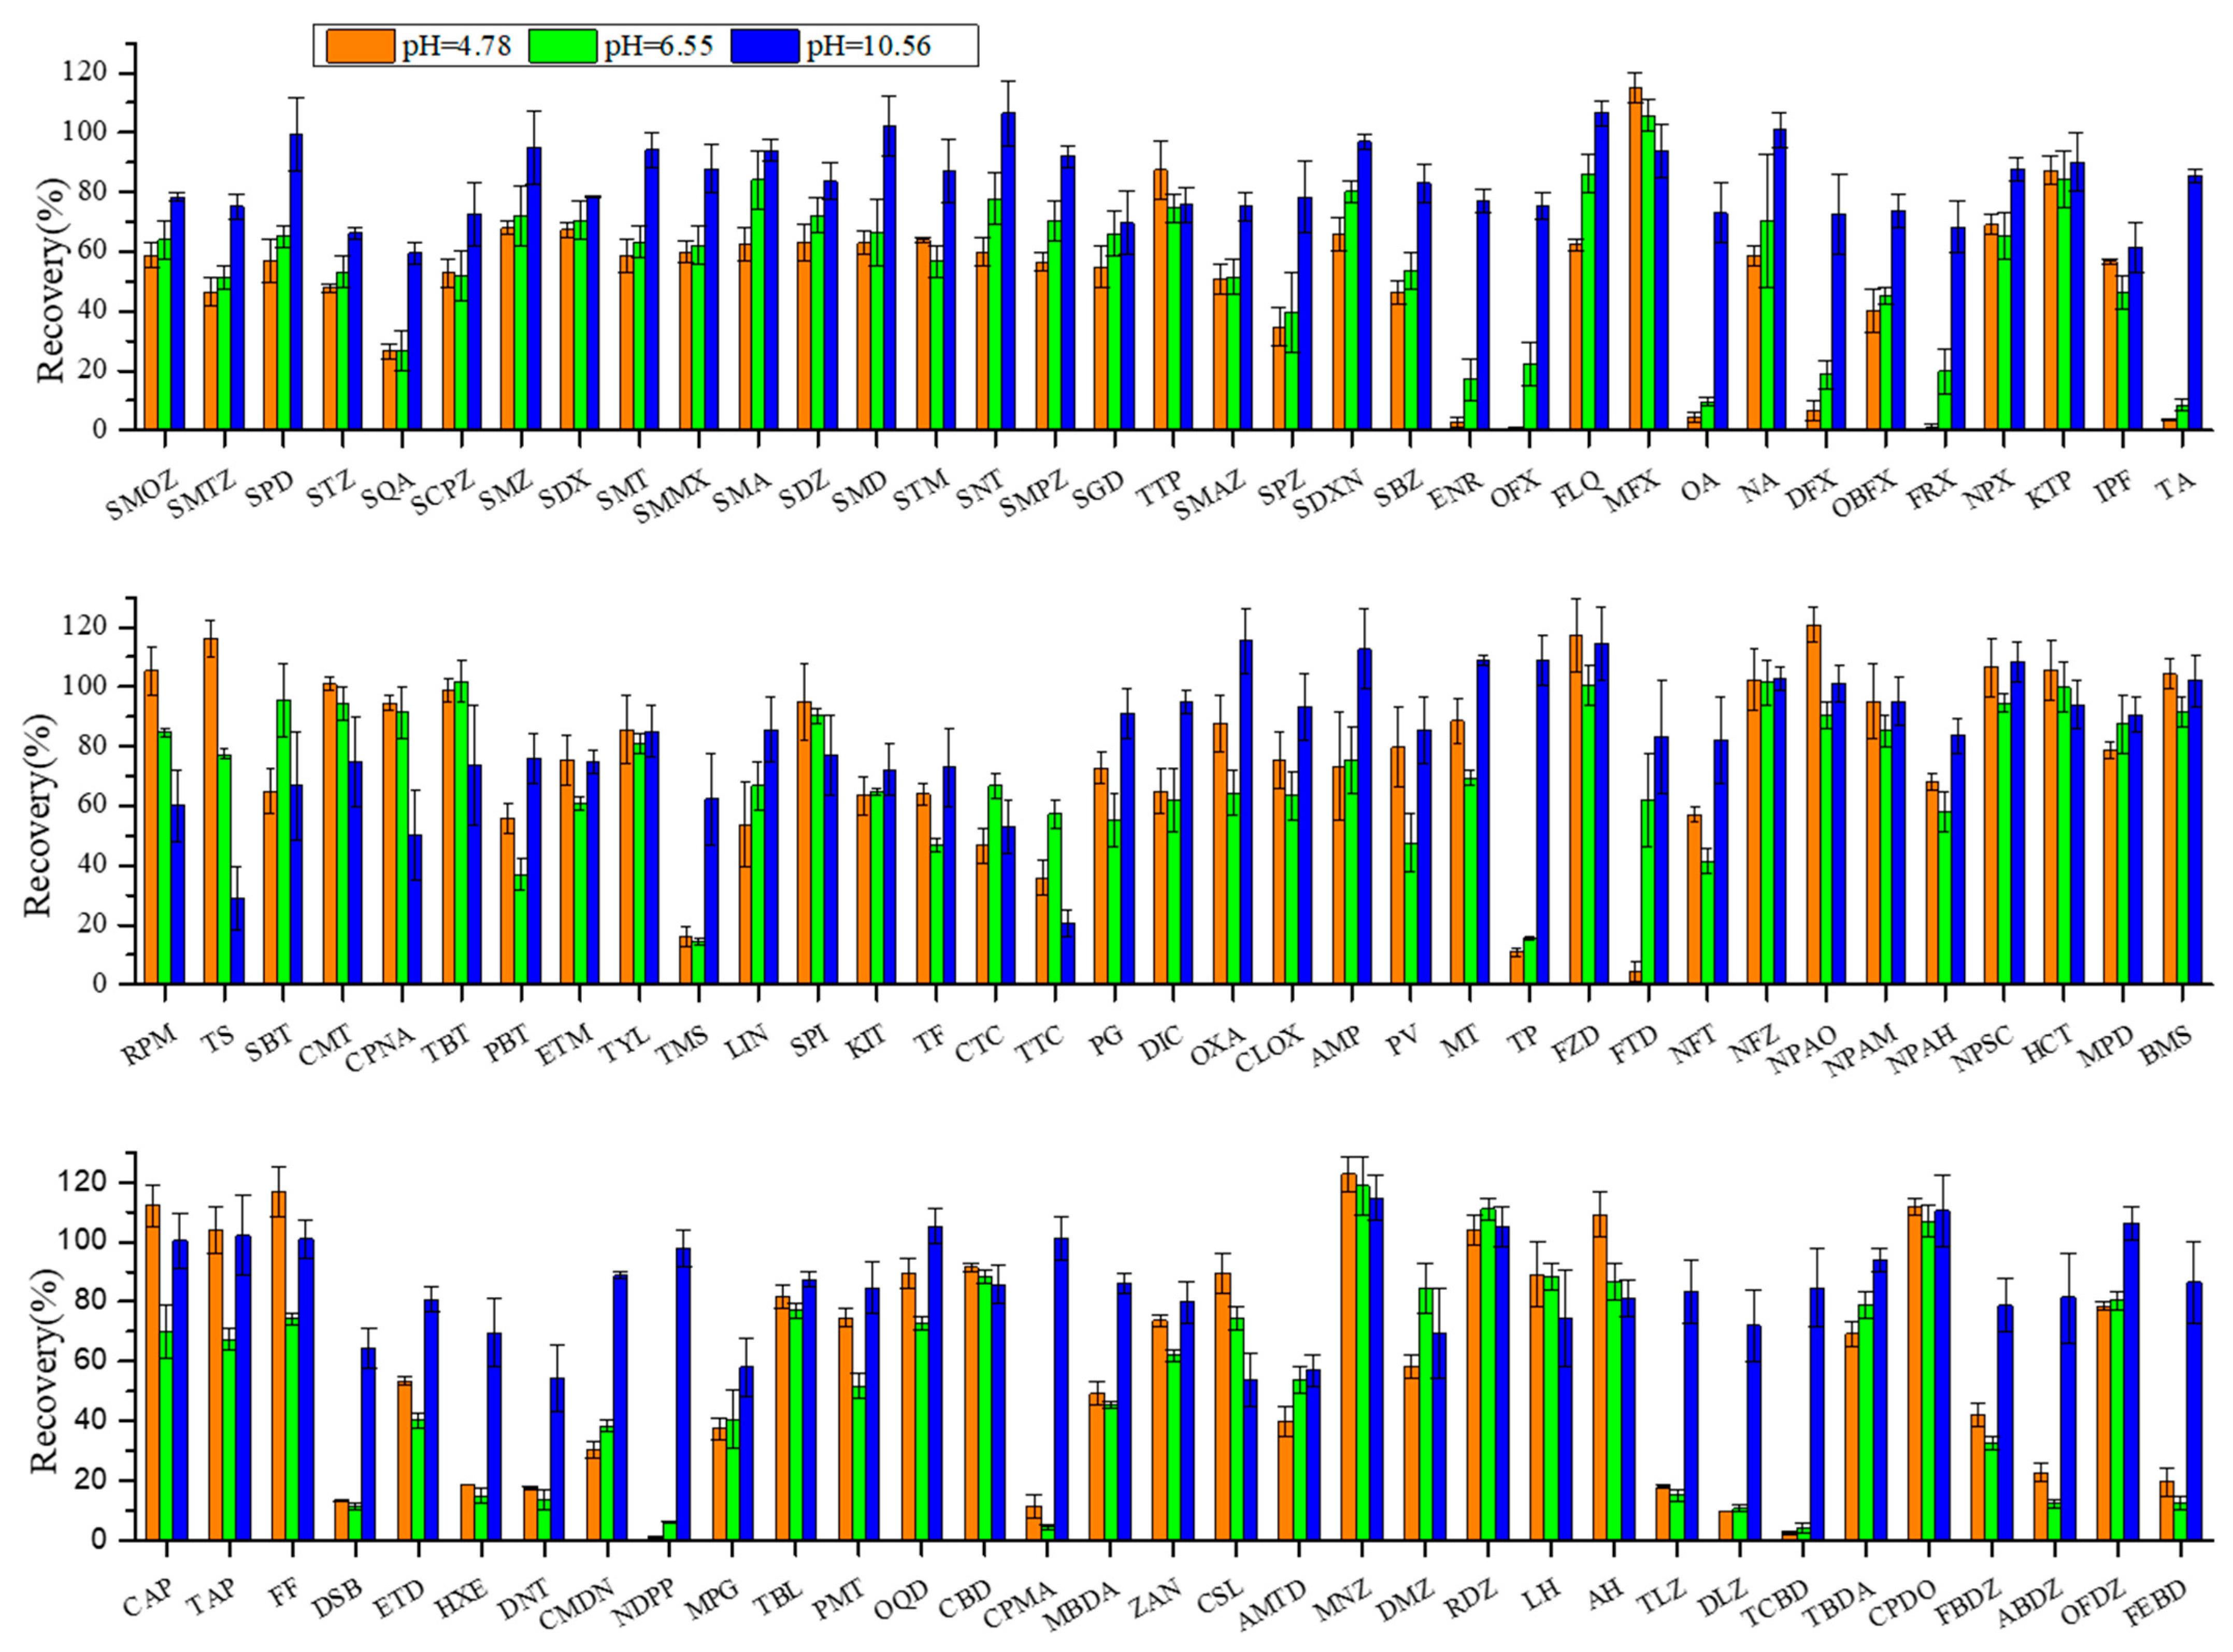
Most veterinary drugs, including antibiotics and hormones, typically contain multiple ionic functional groups and possess acid dissociation constant (pKa), allowing them to exist as cations, neutral ions, or anions depending on the solution pH. Under acidic conditions, the excessive amount of Na2EDTA appeared to reduce recoveries, possibly through chelation with the analytes or critical metal ions in the matrix, thereby forming complexes that were less efficiently extracted; in an alkaline environment, the higher pH value causes the target substances to predominantly exist in anionic forms, thereby reducing the cation exchange interaction between these substances and the colloids in the sediments. As a result, the charge states of veterinary drugs and sediment matrices can be substantially altered by pH adjustment to significantly improve extraction efficiency [27,28,29]. In this study, the buffer solution consisted of a mixture of Na3PO4·12H2O, Na3C6H5O7·2H2O, and Na2EDTA, and the pH was modulated by adjusting Na2EDTA concentration. The extraction efficiencies at different pH—acidic (4.78), neutral (6.55), and alkaline (12.13)—were investigated and are shown in Figure 1.
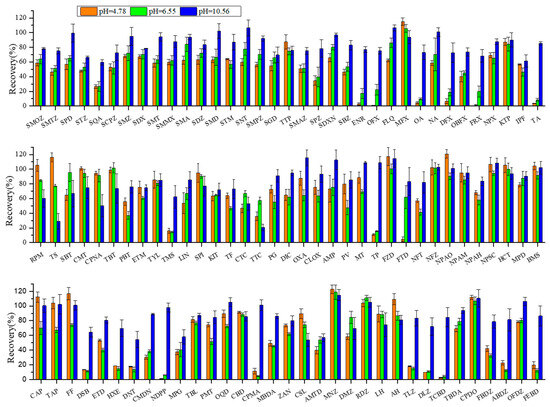
Figure 1.
Effect of buffer pH on recoveries of target veterinary drugs in sediment matrix at 10 µg·kg−1 spiking concentration. Conditions: The extraction solution consisted of 18 mL acetonitrile (ACN) with 2 mL different pH buffers. The extracts were purified through 500 mg/6cc HLB cartridges and eluted with 8 mL methanol (MeOH) and 4 mL methanol–chloroform (MeOH−CH2Cl2) (50:50, v/v). The abbreviations for the veterinary drugs are as listed in Table 1.
The sesults showed that the recoveries of most target compounds were significantly improved at alkaline pH 10.56 (average 84% ± 18%), better than both acidic pH 4.78 (average 60% ± 28%) and neutral pH 6.55 (average 62% ± 33%). This difference highlights the importance of pH optimization (i.e., charge status adjustment) in the effective extraction of ionic polar veterinary drugs from complicated sediment or soil matrices. For example, the average recoveries of quinolones and steroids dropped from 82% ± 14% and 75% ± 16% at alkaline pH 10.56 to as low as 32% ± 40% and 32% ± 26% at acidic pH 4.78, respectively. Therefore, an alkaline buffer solution (pH 10.56) was selected as the optimal aqueous extraction solvent.
3.3.2. Optimization of Buffer Addition Volume
Acetonitrile was selected as the organic phase to form an extraction solvent with the above inorganic buffer. The effects of different buffer additions in volumes of 1 mL, 2 mL, and 3 mL on extraction efficiency of target veterinary drugs were investigated and are shown in Figure 2.
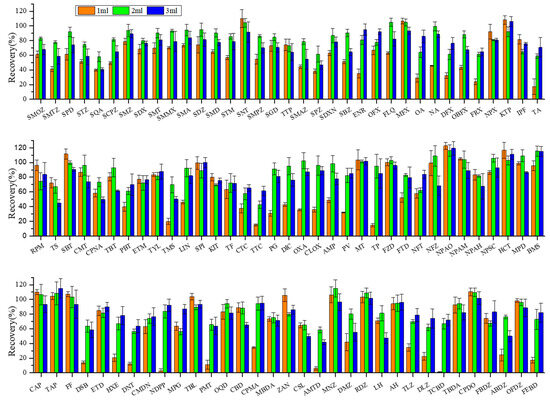
Figure 2.
Effect of buffer volume on recoveries of target veterinary drugs in sediment matrix at 10 µg·kg−1 spiking concentration. Conditions: The extraction solution consisted of 18 mL acetonitrile (ACN) with 1 mL, 2 mL, and 3 mL buffer solution. The extracts were purified through 500 mg/6cc HLB cartridges and eluted with 8 mL methanol (MeOH) and 4 mL methanol–chloroform MeOH−CH2Cl2 (50:50, v/v). The abbreviations for the veterinary drugs are as listed in Table 1.
On the whole, the best average recoveries for all target compounds were achieved at 2 mL buffer addition volume (84 ± 16%), followed by 3 mL (78 ± 16%), whereas 1 mL the lowest (64 ± 31%). These findings revealed that even at the same nominal pH (pH = 10.56), a small change in the buffer addition volume can alter the polarity and extraction efficiency. No significant recovery differences were observed between 2 mL and 3 mL addition volumes for most target compounds. However, sulfonamide antibiotics showed distinctly higher recoveries with 2 mL addition (84 ± 11%) compared to 3 mL addition (71 ± 13%) (p < 0.05). By contrast, generally lower recoveries were observed at 1 mL addition volume, presumably due to insufficient pH and ionic strength for target compounds to release from matrices. As a result, 2 mL of buffer addition volume was adopted for subsequent studies.
3.3.3. Optimization of Elution Solvent
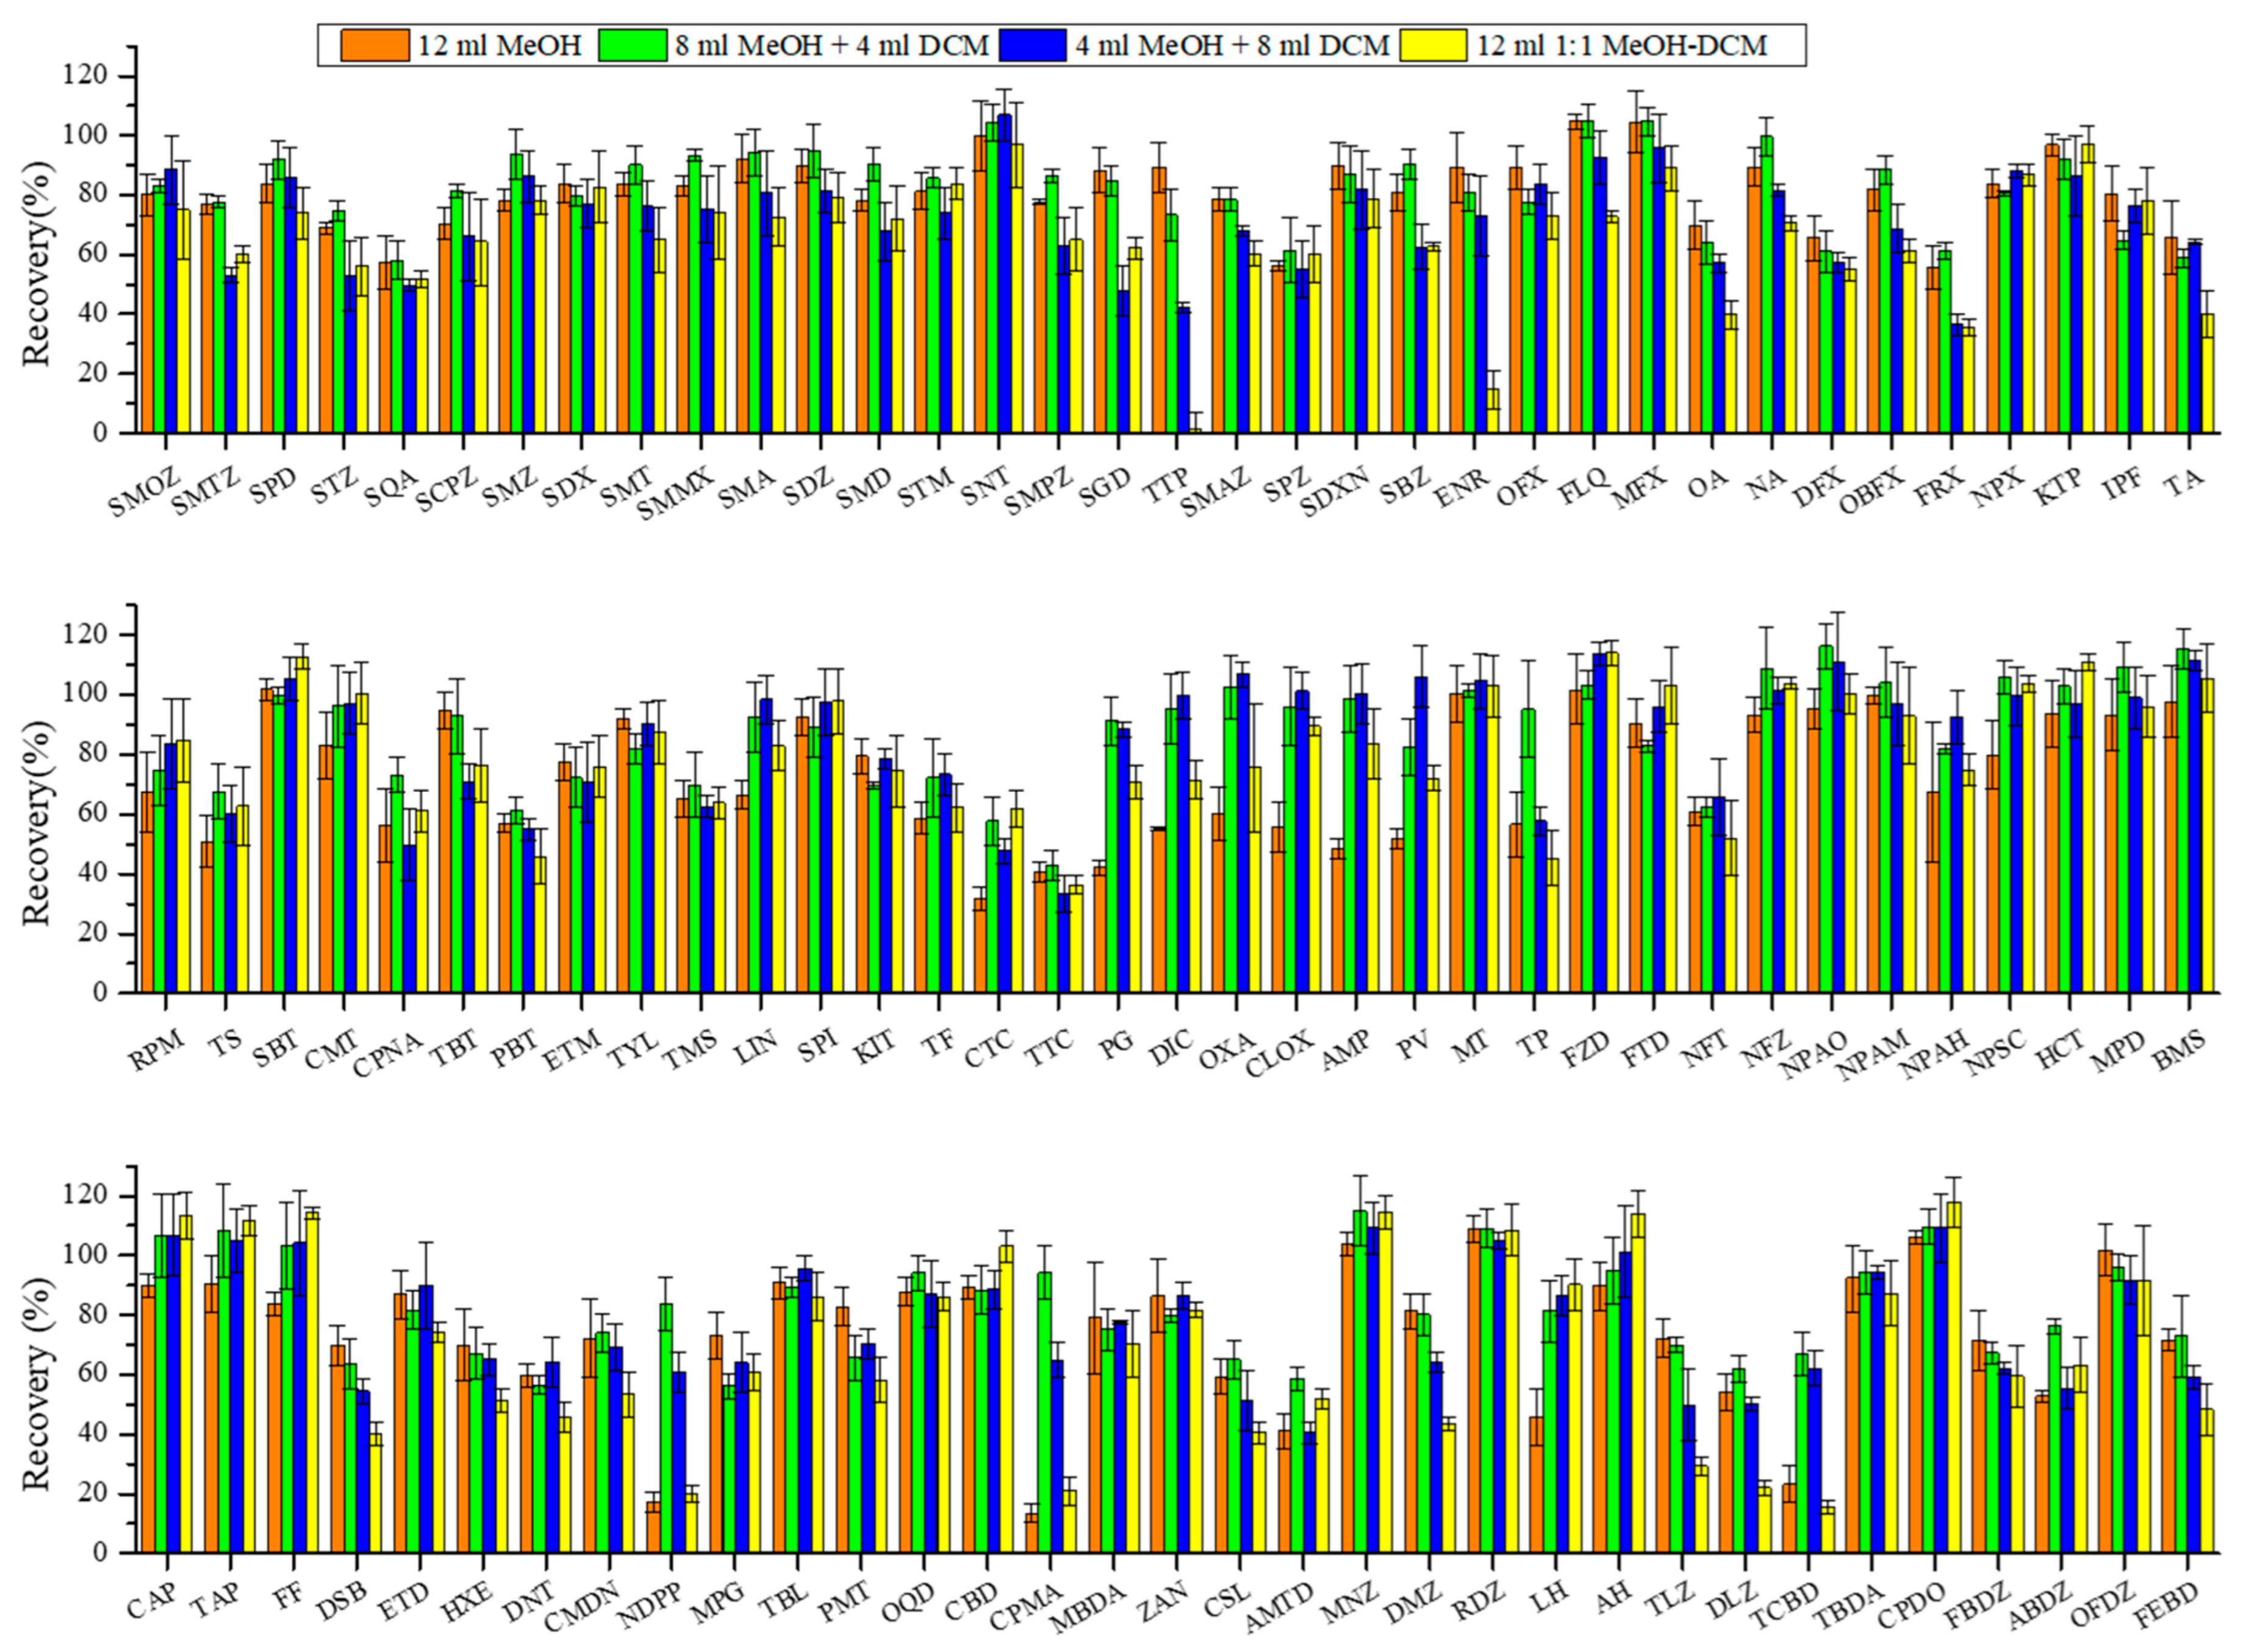
In recent years, the HLB cartridge has been widely reported to effectively eliminate interfering substances in various complex sample extracts due to its broad polarity adaptation range and pH tolerance. However, the elution solvent varies depending on the specific organic targets and becomes a critical parameter requiring careful optimization. In this study, the elution solvent composed of methanol (MeOH) and dichloromethane (DCM) was systematically optimized to effectively remove interferences. The rationale for selecting MeOH and DCM lies in their complementary properties: methanol, with its high polarity and strong hydrogen-bonding capacity, effectively interacts with polar functional groups such as sulfonamide (−SO2NH2) and carboxylic acid (−COOH) groups present in sulfonamides and quinolones, thereby enhancing desorption efficiency and recovery rates.
The recoveries of target veterinary drugs under different elution conditions, namely 12 mL MeOH (single-step), 8 mL MeOH + 4 mL DCM (two-step), 4 mL MeOH + 8 mL DCM (two-step), and 12 mL 1:1 MeOH-DCM (single-step), are shown in Figure 3. The average recoveries were obtained as 76% ± 20%, 84% ± 16%, 78% ± 20%, and 72% ± 26%, respectively. Furthermore, 8 mL MeOH + 4 mL DCM performed significantly higher recoveries than other combination solvents (p < 0.05) and was adopted for subsequent experiments.

Figure 3.
Effect of elution solvents on recoveries of target veterinary drugs in sediment matrix at 10 µg·kg−1 spiking concentration. Conditions: The extraction solution was 18 mL ACN and 2 mL buffer; the extraction procedure was accomplished by three operation steps (buffer A for the first and second extraction and buffer B for the third extraction). The extracts passed through 500 mg/6cc HLB cartridge and were eluted with 12 mL different organic solvent combinations (8 mL MeOH, 8 mL MeOH + 4 mL DCM, 4 mL MeOH + 8 mL DCM, and 12 mL DCM). The abbreviations of antibiotics are the same as given in Table 1.
3.4. Method Validation
The observed sediment samples that showed no obvious MS signals of the target veterinary drugs at the corresponding retention times were chosen as blank matrices and used in following method validation.
3.4.1. Linearity, IDLs, IQLs, MDLs, and MQLs
The linearity of this method was assessed by constructing calibration curves for each target veterinary drugs at seven different concentrations in the range of 0.10~1000 μg·kg−1. All target compounds exhibited excellent linearity with a determination coefficient (R2) above 0.990 for both standard solution curves and isotope-labeled surrogate calibration curves (Appendix A).
The instrumental detection limits (IDLs) and quantification limits (IQLs) as well as the method detection limits (MDLs) and quantification limits (MQLs) for the target compounds are presented in Appendix A. The IDLs ranged from 0.005 μg·L−1 (Trimethoprim) to 5.0 μg·L−1 (Estradiol) and the IQLs from 0.010 μg·L−1 to 10 μg·L−1. The MDLs ranged from 0.020 μg·kg −1 (Chloramphenicol) to 5.0 μg·kg−1 (Spiramycin) and the MQLs from 0.050 μg·kg−1 to 10 μg·kg−1. Overall, the IDLs, IQLs, MDLs, and MQLs in this study were comparable to or better than those in reported studies focusing on multiresidue antibiotic analysis in sediment [30,31,32,33].
3.4.2. Matrix Effect and Isotope-Labeled Surrogate Quantitation Method
For all 103 veterinary drugs, matrix effects ranged from −85% to 84% (Appendix B), with 32 targets showing no observable matrix effects, 51 targets moderate matrix effects, and 20 significant matrix effects. Ninety-five targets exhibited negative matrix effects. Most sulfonamides, benzimidazoles, macrolides, nitrofurans, and β-agonists showed either no observable or moderate negative matrix effects. In contrast, significant negative matrix effects were observed for steroids, two sulfonamides, antiparasitics, chloramphenicols, and three β-lactams. Among targets exhibiting positive matrix effects, Oxfendazole, Sulfadoxine, and Amantadine were moderate and Nitrofurantoin and Sulfadimethoxine significant.
The matrix effect can distort real recovery through enhancing or suppressing MS signals, resulting in method inaccuracy. To overcome the influence of matrix effects, the isotope-labeled dilution method is considered the most effective strategy for accurate quantitation. In practice, except for expensive purchase prices, most target organic compounds do not have identified corresponding isotope-labeled compounds due to synthesis difficulty, especially when dealing with a large number of target compounds. Under these circumstances, non-isotopic “analogues” or “surrogates “ are commonly used as substitutes that have similar chemical property, chromatographic behavior, and MS signal intensity as the target substances but are not present in sample matrices. USEPA Method 1694 proves the effectiveness of the surrogate quantitation method [34] in which 17 surrogates were used to represent 65 target antibiotics in water, soil, and sediment samples.
In this study, we validated and proposed a quantitation method combining the isotope-labeled dilution method and surrogate method. Namely, besides indicating and calculating corresponding target compounds, 13 isotope-labeled standards were also used as surrogates for other targets with similar chromatographic characteristics, MS behavior, matrix effect, as well as spiking recoveries. For example, Sulfadimethoxine-D6 adjusted the recoveries of Sulfadimethoxine from 150% to 100% and also Sulfadoxine (the same sulfonamide class) from 130% to 93.0%. Chloramphenicol-D5 adjusted the recoveries of Chloramphenicol from 56% to 11% and also Florfenicol (the same antimicrobial class) from 38% to 84%. Methyl testosterone-D3 (different steroid class) adjusted the recoveries of Fenbendazole from 54.0% to 75% and Mebendazole from 55% to 81%. The details of the specific correspondence relationships are provided in Table S2.
The isotope-labeled surrogate quantitation method demonstrates exceptional efficiency and accuracy. When confronted with a batch of samples containing complicated matrices, this approach requires only a single validation experiment to confirm the high consistency between target analytes and isotope-labeled surrogates in the aspects of MSMS response, recoveries, and matrix effects, thereby establishing a reliable substitution relationship. Compared to the traditional matrix-matching method, which faces challenges in identifying suitable blank matrices, and the conventional surrogate method, which struggles to select appropriate non-isotope substitutes, this isotope-labeled surrogate quantitation method significantly reduces experimental complexity and time consumption. Notably, when sufficient and appropriate isotope-labeled surrogates are available, the method could effectively overcome matrix effects and improve quantitation accuracy.
3.4.3. Recovery and Precision
The average recoveries of target veterinary drugs at three spiking concentrations (2, 5, and 10 MQLs, three replicates each) were calculated using external standard quantitation method and ranged from 33% to 150% at 2 MQLs, 32% to 140% at 5 MQLs, and 40% to 140% at 10 MQLs, respectively (Table S2). As presented in Table 3, the isotope-labeled surrogate quantitation method gave better recovery results at the 10 MQL spiking level, with 93 targets within 60–120%, only 7 targets below 60%, and 3 targets above 120%.
Table 3.
Statistics of recoveries for 103 target veterinary drugs calculated using two quantitation methods.
The precision was systematically evaluated through repeatability and intra-laboratory reproducibility studies. Repeatability (n = 3) was conducted at three spiking levels during recovery experiments, and intra-laboratory reproducibility (n = 6) was assessed over three consecutive days. According to AOAC standards, the expected precision (repeatability) thresholds are defined as RSD ≤ 15% for analytes at the 100 ppb level, RSD ≤ 21% for analytes at the 10 ppb level, and RSD ≤ 30% for analytes below 1 ppb [35].
In this study, the majority of target compounds at three spiking levels (2, 5, and 10 MQL) fell within the 1~10 ppb range. Repeatability results showed acceptable RSDs below 15% for most target compounds, with only 20 targets in the range of 15%~20%. Intra-laboratory reproducibility demonstrated even better performance, with RSDs ranging from 2.30% to 16% across all tested concentration levels. The developed method exhibits excellent accuracy, precision, and stability.
3.5. Method Application
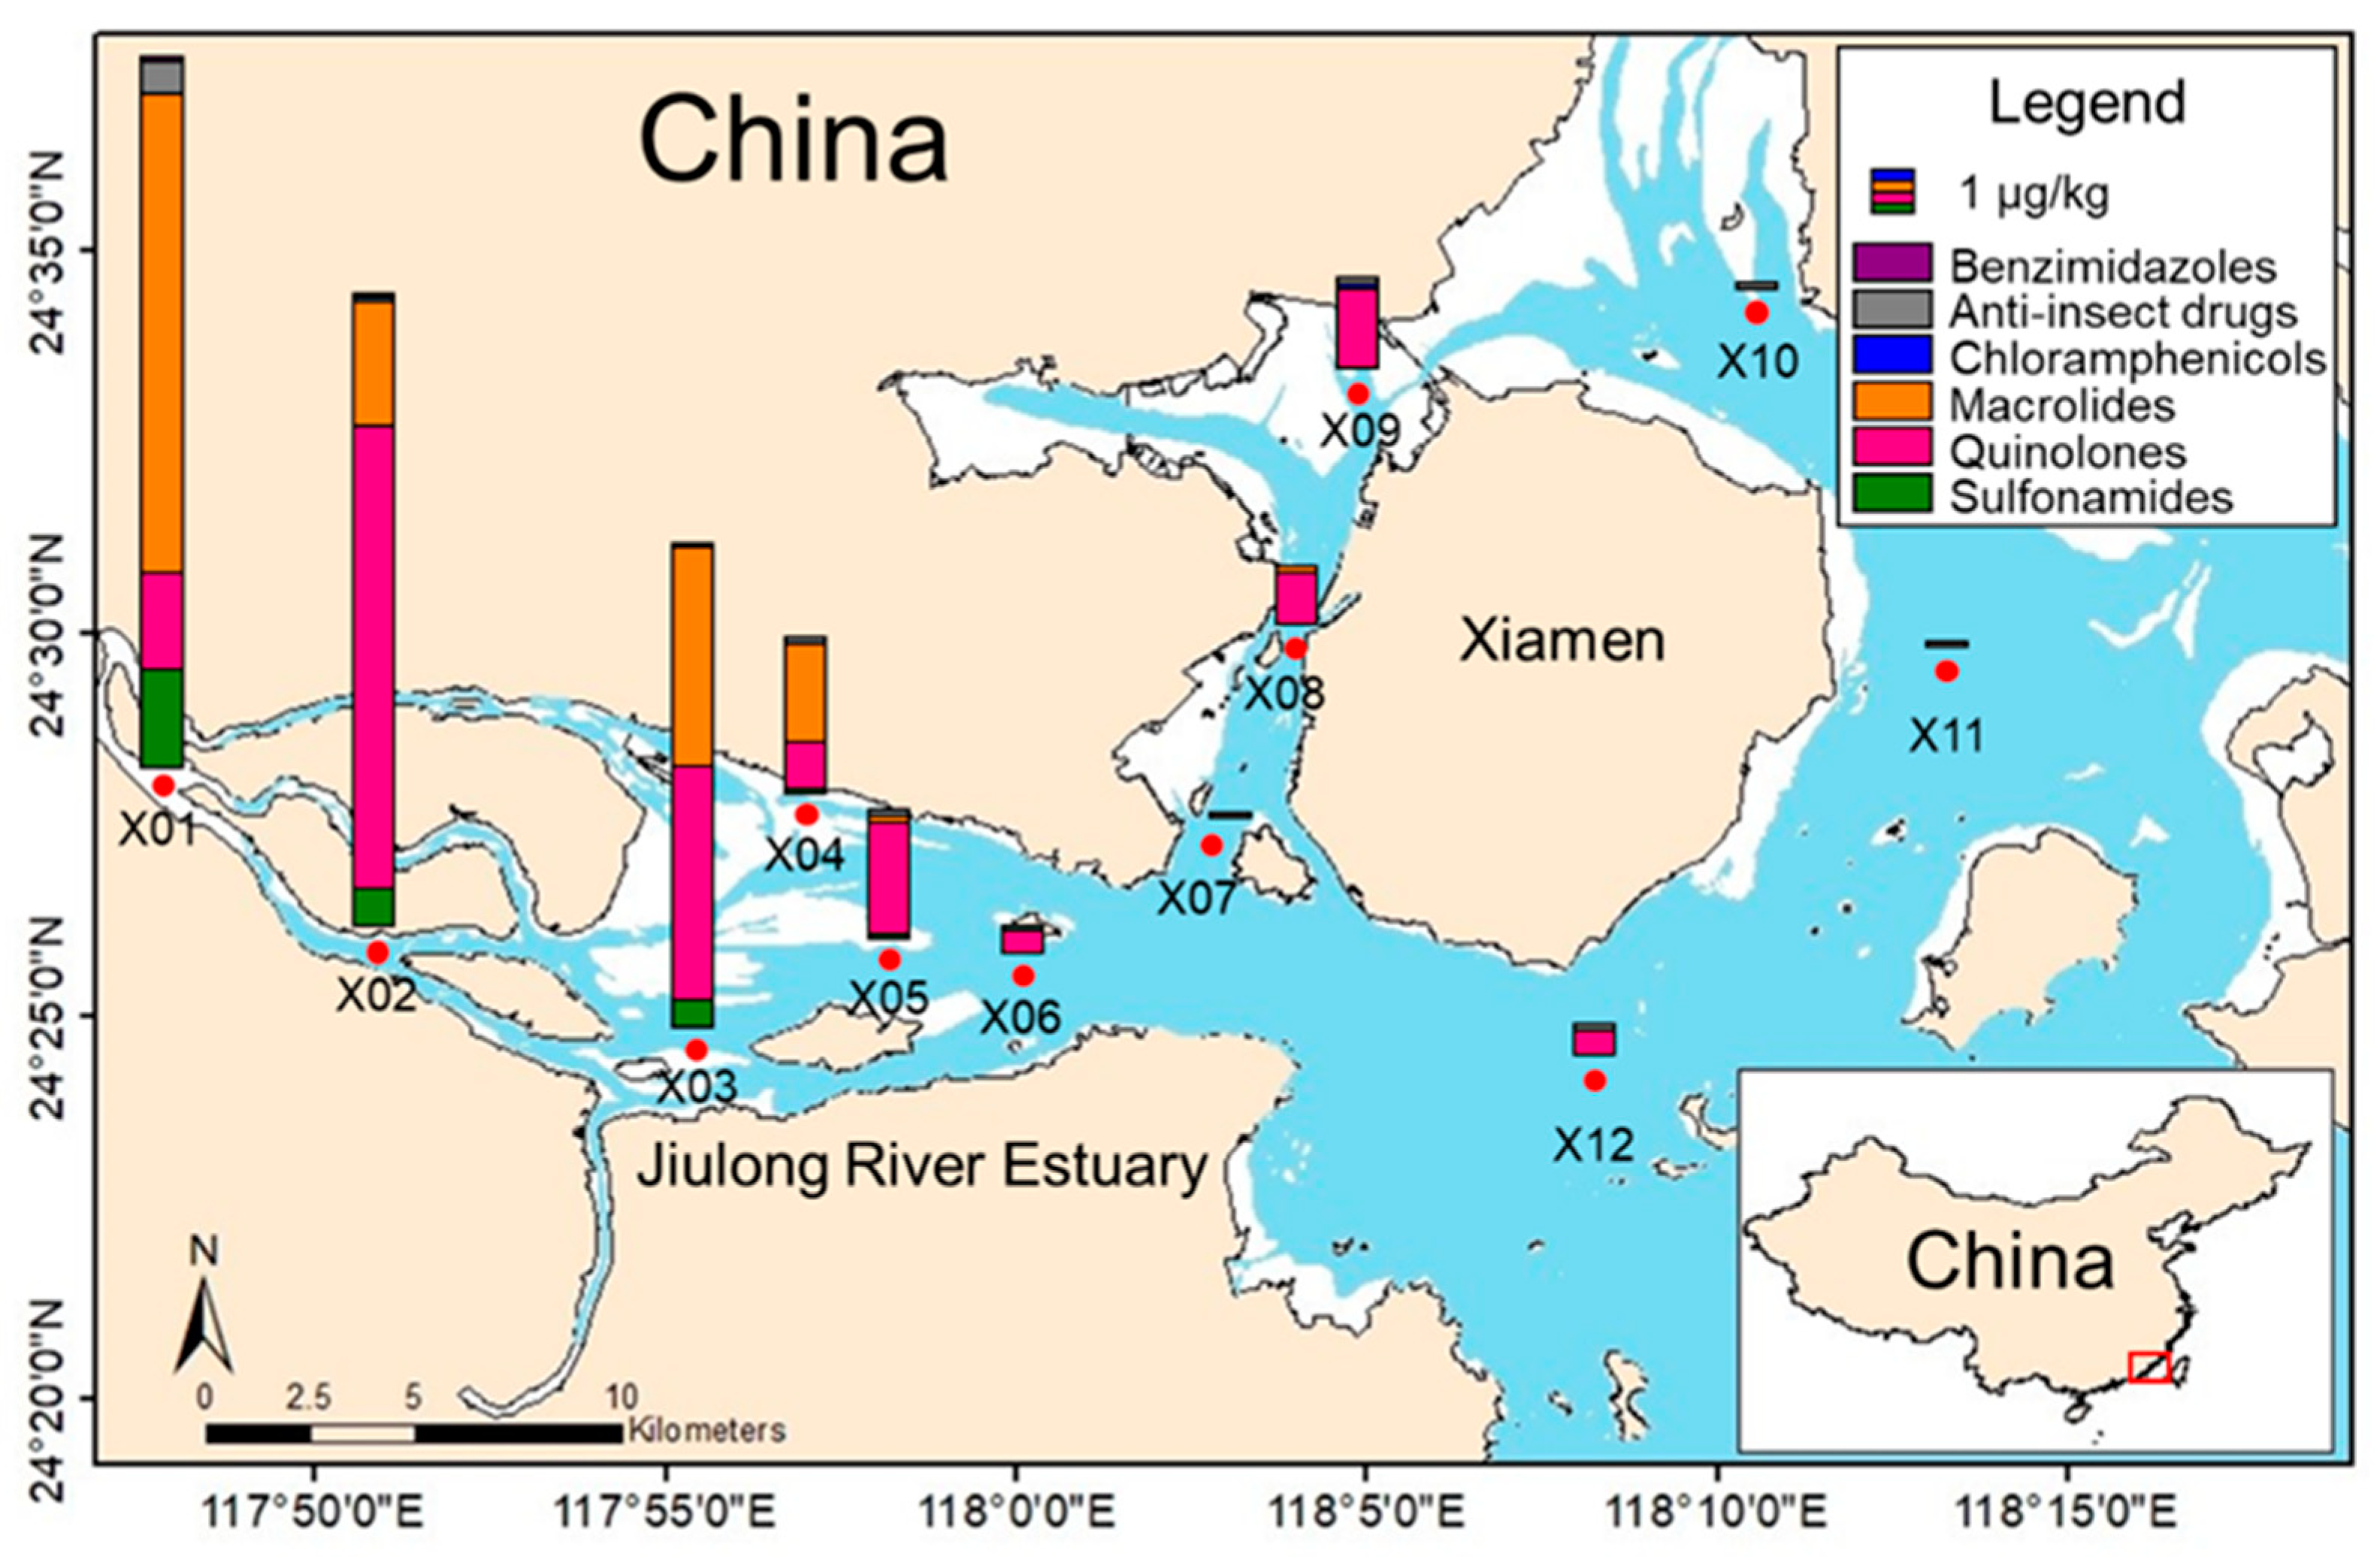
To evaluate the applicability and reliability of the established method, 12 sediment samples from Jiulong River, Fujian Province, China, were determined. Thirteen isotope-labeled surrogates, with duplicates for each sample, one procedural blank, and three random spiking samples, were conducted as quality control, and all data met requirements. The detection and distribution of target veterinary drugs in sediment samples are shown in Figure 4.

Figure 4.
Detection and distribution of target veterinary drugs in sediment samples from Jiulong River, Fujian, China.
The results showed that 16 antibiotics, including 5 sulfonamides, 2 quinolones, 4 macrolides, 2 imidazoles, 2 antiparasitics, and 1 chloramphenicol, were detected, with concentrations ranging from 0.1 µg·kg−1 (Trimethoprim) to 7.6 µg·kg−1 (Ofloxacin). The X01 sampling site exhibited the highest contamination level (17 µg·kg−1, comprising 15 detected targets), followed by X02 (15 µg·kg−1, with 13 targets detected) and X03 (12 µg·kg−1, with 11 targets detected). Among the detected compounds, mebendazole was the most frequently detected contaminant, appearing in 11 out of 12 sampling sites, followed by ofloxacin detected in 9 sites and enrofloxacin detected in 6 sites. The highest detected concentrations at individual sampling sites were that of Ofloxacin (X02, 7.6 µg·kg−1), followed by Tilmicosin (X01, 6.8 µg·kg−1) and Tiamulin fumarate (X01, 4.2 µg·kg−1). The overall distribution trends showed a gradual decrease in concentrations from inland to estuarine, indicating that the primary pollution source is terrestrial input.
4. Conclusions
In this study, a method for the simultaneous determination of 103 veterinary drugs in sediment was established using SPE for cleanup, HPLC-MS/MS for detection, and isotope-labeled surrogate method for quantification. High extraction efficiency was achieved by adjusting extraction solvent combination, pH, and addition volume. Matrix effects were improved through optimizing both an HLB cleanup procedure and LC gradient separation program. A novel isotope-labeled surrogate quantitation method, combining the advantages of isotope-labeled dilution and surrogate, was validated and adopted for matrix effect elimination and accuracy promotion. Under optimal conditions, method detection limits (MDLs) ranged from 0.025 to 5.0 μg·kg−1, and the recoveries at three spiking levels varied from 33% to 150%, 32% to 140%, and 40% to 140%, of which 76, 79, and 93 targets were within 60~120%, respectively. RSDs (n = 3) ranged from 0.7%~29%, 0.8%~23%, and 0.5%~20%, of which 73, 81, and 83 targets were below 15%. The method was successfully applied to real sediment sample analysis and suggested meaningful findings that deserve further study. The developed method is accurate, sensitive, and precise and offers a powerful analytical solution for multi-category veterinary drug residue study in sediment environments.
Supplementary Materials
The following supporting information can be downloaded at: https://www.mdpi.com/article/10.3390/w17091256/s1, Table S1: Gradient program of mobile phase for ESI+ and ESI− run. Table S2: Recoveries and RSDS for 103 veterinary drugs calculated using two different quantitative methods. Figure S1: MRM chromatogram of target compounds by HPLC-MS/MS.
Author Contributions
Conceptualization, M.C. and H.L.; investigation, H.L. and Y.G.; visualization, H.L.; software, Q.W.; writing—original draft, H.L.; writing—review and editing, M.C. and K.L.; supervision, M.C.; project administration, M.C. All authors have read and agreed to the published version of the manuscript.
Funding
This research received no external funding.
Data Availability Statement
The original contributions presented in this study are included in the article/Supplementary Materials. Further inquiries can be directed to the corresponding authors.
Acknowledgments
We thank the State Key Laboratory of Marine Environmental Science (Xiamen University) for providing the experimental facilities.
Conflicts of Interest
The authors declare no conflicts of interest.
Appendix A. Calibration Linear Range, Correlation Coefficients (R2), IDL, IQL, MDL, and MQL of Target Veterinary Drugs and Isotope-Labeled Surrogates
| Target Compounds | Class | Abbreviation | Instrumental Performance | Method Performance | ||||||
|---|---|---|---|---|---|---|---|---|---|---|
| IDLS (μg·L−1) | IQLS (μg·L−1) | R2 | Linear Range | MDLS (μg·L−1) | MQLS (μg·L−1) | R2 | Linear Range | |||
| Sulfamethoxazole | Sulfonamides | SMOZ | 0.01 | 0.05 | 0.9993 | 0.1–100 | 0.05 | 0.25 | 0.9998 | 0.5–50 |
| Sulfamethizole | Sulfonamides | SMTZ | 0.05 | 0.10 | 0.9999 | 0.1–100 | 0.10 | 0.25 | 0.9997 | 0.5–50 |
| Sulfapyridine | Sulfonamides | SPD | 0.05 | 0.10 | 0.9999 | 0.1–100 | 0.10 | 0.25 | 0.9948 | 0.5–50 |
| Sulfathiazole | Sulfonamides | STZ | 0.05 | 0.10 | 0.9969 | 0.1–100 | 0.10 | 0.25 | 0.9971 | 0.5–50 |
| Sulfaquinoxaline | Sulfonamides | SQA | 0.05 | 0.20 | 0.9956 | 0.1–50 | 0.10 | 0.25 | 0.9978 | 0.5–50 |
| Sulfachlorpyridazine | Sulfonamides | SCPZ | 0.025 | 0.05 | 0.9984 | 0.1–50 | 0.05 | 0.10 | 0.9998 | 0.2–20 |
| Sulfamerazine | Sulfonamides | SMZ | 0.05 | 0.10 | 0.9978 | 0.1–100 | 0.10 | 0.25 | 0.9970 | 0.5–50 |
| Sulfadimethoxine | Sulfonamides | SDX | 0.01 | 0.02 | 0.9973 | 0.1–100 | 0.10 | 0.25 | 0.9995 | 0.5–50 |
| Sulfameter | Sulfonamides | SMT | 0.05 | 0.10 | 0.9985 | 0.1–50 | 0.10 | 0.25 | 0.9996 | 0.5–50 |
| Sulfamonomethoxine | Sulfonamides | SMMX | 0.01 | 0.05 | 0.9991 | 0.1–100 | 0.05 | 0.10 | 0.9970 | 0.2–20 |
| Sulfamethazine | Sulfonamides | SMA | 0.01 | 0.05 | 0.9999 | 0.1–100 | 0.05 | 0.10 | 0.9881 | 0.2–20 |
| Sulfadiazine | Sulfonamides | SDZ | 0.01 | 0.05 | 0.9997 | 0.1–100 | 0.10 | 0.25 | 0.9998 | 0.5–50 |
| Sulfaisodimidine | Sulfonamides | SMD | 0.01 | 0.02 | 0.9992 | 0.1–100 | 0.05 | 0.10 | 0.9995 | 0.2–20 |
| Sulfacetamide | Sulfonamides | STM | 0.05 | 0.10 | 0.9973 | 0.1–50 | 0.05 | 0.10 | 0.9990 | 0.2–20 |
| Sulfanitran | Sulfonamides | SNT | 0.05 | 0.10 | 0.9976 | 0.1–100 | 0.25 | 1.0 | 0.9993 | 2–200 |
| Sulfamethoxypyridazine | Sulfonamides | SMPZ | 0.01 | 0.05 | 0.9992 | 0.1–100 | 0.05 | 0.10 | 0.9970 | 0.2–20 |
| Sulfaguanidine | Sulfonamides | SGD | 0.10 | 0.50 | 0.9947 | 1–100 | 0.50 | 1.0 | 0.9906 | 2–40 |
| Trimethoprim | Sulfonamides | TTP | 0.005 | 0.01 | 0.9982 | 0.01–50 | 0.025 | 0.10 | 0.9990 | 0.2–20 |
| Sulfamethazole | Sulfonamides | SMAZ | 0.01 | 0.05 | 0.9993 | 0.1–100 | 0.05 | 0.25 | 0.9999 | 0.5–50 |
| Sulfaphenazole | Sulfonamides | SPZ | 0.05 | 0.10 | 0.9972 | 0.1–100 | 0.10 | 0.25 | 0.9992 | 0.5–50 |
| Sulfadoxine | Sulfonamides | SDXN | 0.005 | 0.01 | 0.9981 | 0.01–100 | 0.05 | 0.25 | 0.9947 | 0.5–50 |
| Sulfabenzamide | Sulfonamides | SBZ | 0.05 | 0.10 | 0.9985 | 0.1–100 | 1.0 | 2.5 | 0.9918 | 5–500 |
| Enrofloxacin | Quinolones | ENR | 0.05 | 0.10 | 0.9973 | 0.1–100 | 0.25 | 1.0 | 0.9966 | 2–200 |
| Ofloxacin | Quinolones | OFX | 0.005 | 0.01 | 0.999 | 0.01–50 | 0.10 | 0.50 | 0.9974 | 1–100 |
| Flumequine | Quinolones | FLQ | 0.01 | 0.05 | 0.9956 | 0.1–50 | 0.05 | 0.10 | 0.9776 | 0.2–20 |
| Marbofloxacin | Quinolones | MFX | 0.05 | 0.10 | 0.9961 | 0.1–100 | 0.10 | 0.25 | 0.9921 | 0.5–50 |
| Oxolinic Acid | Quinolones | OA | 0.01 | 0.05 | 0.9973 | 0.1–50 | 0.05 | 0.25 | 0.9776 | 0.5–50 |
| Nalidixic acid | Quinolones | NA | 0.005 | 0.01 | 0.9978 | 0.01–20 | 0.05 | 0.25 | 0.9975 | 0.5–50 |
| Difloxacin | Quinolones | DFX | 0.05 | 0.10 | 0.9971 | 0.1–100 | 0.10 | 1.0 | 0.9966 | 2–200 |
| Orbifloxacin | Quinolones | OBFX | 0.01 | 0.05 | 0.9928 | 0.1–20 | 0.025 | 0.10 | 0.9997 | 0.2–20 |
| Fleroxacin | Quinolones | FRX | 0.10 | 0.50 | 0.9991 | 1–50 | 0.10 | 1.0 | 0.9972 | 2–200 |
| Ractopamine | Clenbuterols | RPM | 0.05 | 0.20 | 0.9994 | 0.1–50 | 0.05 | 0.50 | 0.9992 | 1–100 |
| Terbutaline sulphate | Clenbuterols | TS | 0.05 | 0.10 | 0.9869 | 0.1–50 | 0.05 | 0.50 | 0.9994 | 1–100 |
| Salbutamol | Clenbuterols | SBT | 0.05 | 0.10 | 0.9953 | 0.1–50 | 0.1 | 0.50 | 0.9998 | 1–100 |
| Cimaterol | Clenbuterols | CMT | 0.01 | 0.05 | 0.9961 | 0.01–50 | 0.05 | 0.10 | 0.9997 | 0.2–20 |
| Clorprenaline | Clenbuterols | CPNA | 0.005 | 0.01 | 0.9977 | 0.1–50 | 0.05 | 0.25 | 0.9967 | 0.5–50 |
| Tulobuterol | Clenbuterols | TBT | 0.005 | 0.01 | 0.9986 | 0.1–50 | 0.025 | 0.10 | 0.9981 | 0.2–20 |
| Penbutolol | Clenbuterols | PBT | 0.005 | 0.01 | 0.9979 | 0.1–50 | 0.025 | 0.10 | 0.9968 | 0.2–20 |
| Erythromycin | Macrolides | ETM | 0.05 | 0.10 | 0.9985 | 0.1–100 | 0.50 | 1.0 | 0.9991 | 2–200 |
| Tylosin | Macrolides | TYL | 0.05 | 0.10 | 0.9997 | 0.1–100 | 0.25 | 2.5 | 0.9998 | 5–500 |
| Tilmicosin | Macrolides | TMS | 0.25 | 0.50 | 0.9981 | 0.5–500 | 1.0 | 5.0 | 0.9960 | 10–1000 |
| Lincomycin | Macrolides | LIN | 0.01 | 0.02 | 0.9985 | 0.02–50 | 0.025 | 0.10 | 0.9970 | 0.2–20 |
| Spiramycin | Macrolides | SPI | 2.0 | 5.0 | 0.998 | 10–100 | 5.0 | 10 | 0.9919 | 20–2000 |
| Kitasamycin | Macrolides | KIT | 0.005 | 0.01 | 0.9994 | 0.01–100 | 0.25 | 1.0 | 0.9996 | 2–200 |
| Tiamulin fumarate | Macrolides | TF | 0.005 | 0.01 | 0.9998 | 0.01–50 | 0.025 | 0.10 | 0.9983 | 0.2–20 |
| Chlortetracycline | Tetracyclines | CTC | 0.50 | 2.0 | 0.9959 | 5–500 | 2.5 | 5.0 | 0.9627 | 10–1000 |
| Tetracycline | Tetracyclines | TTC | 0.50 | 2.0 | 0.9978 | 5–500 | 2.5 | 5.0 | 0.9904 | 10–1000 |
| Penicillin G | β-lactams | PG | 0.10 | 0.20 | 0.9995 | 0.2–200 | 0.25 | 1.0 | 0.9996 | 2–200 |
| Dicloxacillin | β-lactams | DIC | 0.10 | 0.20 | 0.9994 | 0.2–200 | 0.50 | 1.0 | 0.9993 | 2–200 |
| Oxacillin | β-lactams | OXA | 0.10 | 0.20 | 0.9991 | 0.2–200 | 0.50 | 1.0 | 0.9961 | 2–200 |
| Cloxacillin | β-lactams | CLOX | 0.10 | 0.20 | 0.9977 | 0.2–200 | 0.10 | 1.0 | 0.9967 | 2–200 |
| Ampicillin | β-lactams | AMP | 0.10 | 0.20 | 0.9984 | 0.2–200 | 0.25 | 1.0 | 0.9971 | 2–200 |
| Penicillin V | β-lactams | PV | 0.50 | 1.0 | 0.9999 | 2–50 | 1.0 | 2.5 | 0.9951 | 5–500 |
| Methyl Testosterone | Testosterones | MT | 0.01 | 0.05 | 0.998 | 0.1–50 | 0.10 | 0.50 | 0.9969 | 1–100 |
| Testosterone Propionate | Testosterones | TP | 0.05 | 0.10 | 0.9983 | 0.1–50 | 0.50 | 1.0 | 0.9978 | 2–200 |
| Furazolidone | Nitrofurans | FZD | 0.50 | 1.0 | 0.9964 | 5–50 | 1.0 | 2.5 | 0.9987 | 5–100 |
| Furaltadone | Nitrofurans | FTD | 0.05 | 0.10 | 0.9963 | 1–200 | 0.50 | 1.0 | 0.9972 | 2–200 |
| Nitrofurantoin | Nitrofurans | NFT | 0.25 | 0.50 | 0.9993 | 0.5–500 | 2.5 | 5.0 | 0.9939 | 10–1000 |
| Nitrofurazone | Nitrofurans | NFZ | 0.20 | 0.50 | 0.9949 | 0.5–200 | 2.5 | 5.0 | 0.9993 | 10–1000 |
| NP-AOZ | Nitrofurans | NPAO | 0.05 | 0.10 | 0.9938 | 0.1–50 | 0.10 | 0.25 | 0.9989 | 0.5–50 |
| NP-AMOZ | Nitrofurans | NPAM | 0.05 | 0.10 | 0.9958 | 0.1–50 | 0.10 | 1.0 | 0.9984 | 2–200 |
| NP-AHD | Nitrofurans | NPAH | 0.20 | 0.50 | 0.9995 | 0.5–500 | 1.3 | 2.5 | 0.9979 | 5–500 |
| NP-SCA | Nitrofurans | NPSC | 0.20 | 0.50 | 0.9995 | 0.5–500 | 1.3 | 2.5 | 0.9999 | 5–500 |
| Hydrocortisone | Glucocorticoids | HCT | 0.05 | 0.10 | 0.9998 | 0.1–100 | 0.50 | 1.0 | 0.9967 | 2–200 |
| Methylprednisolone | Glucocorticoids | MPD | 0.10 | 0.20 | 0.9993 | 0.2–50 | 0.25 | 1.0 | 0.9983 | 2–200 |
| Betamethasone | Glucocorticoids | BMS | 0.05 | 0.10 | 0.999 | 1–100 | 0.25 | 1.0 | 0.9967 | 2–200 |
| Naproxen | Nonsteroidal | NPX | 0.05 | 0.10 | 0.9998 | 1–100 | 0.25 | 1.0 | 0.9985 | 2–200 |
| Ketoprofen | Nonsteroidal | KTP | 0.05 | 0.10 | 0.9976 | 1–50 | 0.05 | 1.0 | 0.9999 | 2–100 |
| Ibuprofen | Nonsteroidal | IPF | 0.05 | 0.10 | 0.9992 | 1–100 | 0.50 | 1.0 | 0.9974 | 2–200 |
| Tolfenamic Acid | Nonsteroidal | TA | 0.05 | 0.10 | 0.9901 | 1–50 | 0.50 | 1.0 | 0.9917 | 2–200 |
| Chloramphenicol | Cloramphenicols | CAP | 0.01 | 0.05 | 0.9992 | 0.1–100 | 0.02 | 0.05 | 0.9991 | 0.1–10 |
| Thiamphenicol | Cloramphenicols | TAP | 0.05 | 0.10 | 0.9992 | 0.1–500 | 0.10 | 0.25 | 0.9995 | 0.5–50 |
| Florfenicol | Cloramphenicols | FF | 0.05 | 0.10 | 0.9952 | 0.1–500 | 0.05 | 0.1 | 0.9969 | 0.2–20 |
| Diethylstilbestrol | Steroids | DSB | 0.5 | 1.0 | 0.9969 | 1–100 | 0.50 | 1.0 | 0.9923 | 2–200 |
| Estradiol | Steroids | ETD | 5.0 | 10 | 0.9971 | 50–1000 | 5.0 | 10 | 0.9902 | 20–2000 |
| Hexoestrol | Steroids | HXE | 1.0 | 2.0 | 0.9994 | 5–100 | 0.50 | 1.0 | 0.9906 | 2–200 |
| Dienoestrol | Steroids | DNT | 1.0 | 2.0 | 0.9974 | 5–200 | 0.50 | 1.0 | 0.9918 | 2–200 |
| Chlormadinone | Steroids | CMDN | 0.05 | 0.10 | 0.9996 | 0.1–50 | 0.25 | 1.0 | 0.9997 | 2–200 |
| Nandrolone phenylpropionate | Steroids | NDPP | 0.50 | 1.0 | 0.9994 | 1–100 | 0.50 | 2.5 | 0.9719 | 5–100 |
| Medroxyprogesterone 17-acetate | Steroids | MPG | 0.01 | 0.02 | 0.9966 | 0.02–50 | 0.10 | 0.50 | 0.9973 | 1–100 |
| Trenbolone | Steroids | TBL | 0.01 | 0.02 | 0.9934 | 0.02–50 | 0.25 | 1.0 | 0.9985 | 2–200 |
| Pyrimethamine | Others | PMT | 0.005 | 0.01 | 0.9965 | 0.01–50 | 0.10 | 1.0 | 0.9993 | 2–200 |
| Olaquindox | Others | OQD | 0.005 | 0.01 | 0.998 | 0.01–100 | 0.10 | 1.0 | 0.9899 | 2–200 |
| Carbadox | Others | CBD | 0.05 | 0.10 | 0.9996 | 0.1–100 | 0.10 | 1.0 | 0.9985 | 2–200 |
| Chlorpromazine | Others | CPMA | 0.005 | 0.01 | 0.9997 | 0.01–50 | 0.05 | 0.25 | 0.9946 | 0.5–50 |
| Mebendazole | Antiparasitics | MBDA | 0.005 | 0.01 | 0.9991 | 0.01–100 | 0.025 | 0.10 | 0.9955 | 0.2–20 |
| Zeranol | Antiparasitics | TBDA | 0.05 | 0.10 | 1 | 0.1–100 | 0.10 | 0.50 | 0.9999 | 1–100 |
| Clorsulon | Antiparasitics | ZAN | 0.05 | 0.10 | 0.9999 | 0.1–100 | 0.05 | 0.50 | 0.9998 | 1–100 |
| Amantadine | Antiparasitics | CSL | 0.01 | 0.02 | 0.9956 | 0.02–40 | 0.10 | 0.25 | 0.9996 | 0.5–50 |
| Metronidazole | Antiparasitics | CPDO | 0.05 | 0.10 | 0.9999 | 0.1–100 | 0.25 | 0.50 | 0.9995 | 1–100 |
| Dimetridazole | Nitromidazoles | MNZ | 0.05 | 0.10 | 0.9996 | 0.1–100 | 0.05 | 0.50 | 0.9981 | 1–100 |
| Ronidazole | Nitromidazoles | DMZ | 0.05 | 0.10 | 0.9974 | 0.1–100 | 0.10 | 0.50 | 0.9984 | 1–100 |
| Levamisole hydrochloride | Nitromidazoles | RDZ | 0.005 | 0.01 | 0.9997 | 0.01–50 | 0.10 | 0.50 | 0.9909 | 1–100 |
| Amprolium hydrochloride | Antiparasitics | LH | 0.10 | 0.50 | 0.9973 | 1–100 | 0.50 | 1.0 | 0.9996 | 2–200 |
| Toltrazuril | Antiparasitics | AH | 0.05 | 0.20 | 0.9985 | 0.5–100 | 1.0 | 5.0 | 0.9988 | 10–1000 |
| Diclazuril | Antiparasitics | TLZ | 0.01 | 0.05 | 0.9994 | 0.5–100 | 0.10 | 0.50 | 0.9938 | 1–100 |
| Triclabendazole | Antiparasitics | DLZ | 0.10 | 0.50 | 0.9959 | 1–50 | 0.50 | 1.0 | 0.9876 | 2–200 |
| Thiabendazole | Antiparasitics | TCBD | 0.025 | 0.05 | 0.9993 | 0.05–50 | 0.05 | 0.25 | 0.9938 | 0.5–50 |
| Clopidol | Antivirals | AMTD | 0.10 | 0.20 | 0.9962 | 1–100 | 0.05 | 0.50 | 0.9984 | 1–100 |
| Flubendazole | Benzimidazoles | FBDZ | 0.005 | 0.01 | 0.9996 | 0.01–100 | 0.05 | 0.25 | 0.9969 | 0.5–20 |
| Albendazole | Benzimidazoles | ABDZ | 0.02 | 0.05 | 0.9955 | 0.1–100 | 0.05 | 0.25 | 0.9995 | 0.5–50 |
| Oxfendazole | Benzimidazoles | OFDZ | 0.05 | 0.10 | 0.9948 | 0.1–50 | 0.05 | 0.25 | 0.9978 | 0.5–50 |
| Fenbendazole | Benzimidazoles | FEBD | 0.005 | 0.01 | 0.9987 | 0.01–50 | 0.05 | 0.25 | 0.9917 | 0.5–50 |
| Sulfathiazole-13C6 | / | / | 0.05 | 0.10 | 0.9995 | 0.1–100 | 0.10 | 0.25 | 0.9995 | 0.5–50 |
| Sulfaquinoxaline-13C6 | / | / | 0.05 | 0.20 | 0.9984 | 0.1–50 | 0.10 | 0.25 | 0.9998 | 0.5–50 |
| Sulfadimethoxine-D6 | / | / | 0.01 | 0.02 | 0.9979 | 0.1–100 | 0.10 | 0.25 | 0.9992 | 0.5–50 |
| Sulfadiazine-D4 | / | / | 0.01 | 0.05 | 0.9991 | 0.1–100 | 0.10 | 0.25 | 0.9998 | 0.5–50 |
| Ractopamine-D3 | / | / | 0.05 | 0.20 | 0.9966 | 0.1–50 | 0.06 | 0.50 | 0.9971 | 1–100 |
| Salbutamol-D3 | / | / | 0.05 | 0.10 | 0.9938 | 0.1–50 | 0.10 | 0.50 | 0.9978 | 1–100 |
| NP-AOZ-D4 | / | / | 0.05 | 0.10 | 0.9969 | 0.1–50 | 0.10 | 0.25 | 0.9995 | 0.5–50 |
| NP-AMOZ-D5 | / | / | 0.05 | 0.10 | 0.9969 | 0.1–50 | 0.10 | 1.0 | 0.9958 | 2–200 |
| NP-AHD-13C3 | / | / | 0.20 | 0.50 | 0.9956 | 0.5–500 | 1.2 | 2.5 | 0.9995 | 5–500 |
| Chloramphenicol-D5 | / | / | 0.01 | 0.05 | 0.9973 | 0.1–100 | 0.02 | 0.05 | 0.9992 | 0.1–10 |
| Enrofloxacin-D5 | / | / | 0.05 | 0.10 | 0.9997 | 0.1–100 | 0.25 | 1.0 | 0.9973 | 2–200 |
| Thiabendazole-D6 | / | / | 0.025 | 0.05 | 0.9994 | 0.05–50 | 0.05 | 0.25 | 0.9993 | 0.5–50 |
| Methyl Testosterone-D3 | / | / | 0.01 | 0.05 | 0.9953 | 0.1–50 | 0.10 | 0.50 | 0.998 | 1–100 |
Appendix B. Substitution Relationship, Matrix Effect, and Intra-Laboratory Reproducibility
| Compound | Abbreviation | Substitution | Matrix Effects (%) | Intra-Laboratory Reproducibility (%, n = 6) | ||
|---|---|---|---|---|---|---|
| 2MQL | 5MQL | 10MQL | ||||
| Sulfamethoxazole | SMOZ | Sulfadimethoxine-D6 | −7.8 | 8.3 | 7.6 | 8.0 |
| Sulfamethizole | SMTZ | Sulfadiazine-D4 | −21 | 5.7 | 4.9 | 7.0 |
| Sulfapyridine | SPD | Sulfathiazole-13C6 | −50 | 6.8 | 7.7 | 11 |
| Sulfathiazole | STZ | Sulfathiazole-13C6 | −16 | 11 | 8.2 | 8.3 |
| Sulfaquinoxaline | SQA | Sulfaquinoxaline-13C6 | −68 | 17 | 6.4 | 12 |
| Sulfachlorpyridazine | SCPZ | Sulfadiazine-D4 | −25 | 13 | 6.5 | 7.6 |
| Sulfamerazine | SMZ | Sulfadiazine-D4 | −26 | 12 | 7.1 | 7.8 |
| Sulfadimethoxine | SDX | Sulfadimethoxine-D6 | 84 | 7.3 | 4.9 | 4.8 |
| Sulfameter | SMT | Sulfadiazine-D4 | −22 | 11 | 6.1 | 5.7 |
| Sulfamonomethoxine | SMMX | Sulfadiazine-D4 | −13 | 12 | 5.0 | 5.5 |
| Sulfamethazine | SMA | Sulfadiazine-D4 | −24 | 13 | 7.6 | 9.8 |
| Sulfadiazine | SDZ | Sulfadiazine-D4 | −16 | 9.2 | 7.6 | 9.6 |
| Sulfaisodimidine | SMD | Sulfadiazine-D4 | −34 | 7.2 | 10 | 9.7 |
| Sulfacetamide | STM | Sulfadiazine-D4 | −29 | 9.2 | 7.9 | 7.2 |
| Sulfanitran | SNT | Sulfadimethoxine-D6 | −2.7 | 11.5 | 7.8 | 5.9 |
| Sulfamethoxypyridazine | SMPZ | Sulfadiazine-D4 | −7.9 | 9.6 | 6.0 | 3.8 |
| Sulfaguanidine | SGD | Sulfadiazine-D4 | −17 | 8.1 | 15 | 7.9 |
| Trimethoprim | TTP | Sulfadimethoxine-D6 | −5.0 | 4.7 | 9.1 | 6.6 |
| Sulfamethazole | SMAZ | Sulfadiazine-D4 | −31 | 10 | 6.0 | 7.3 |
| Sulfaphenazole | SPZ | Sulfathiazole-13C6 | −44 | 12 | 9.5 | 7.1 |
| Sulfadoxine | SDXN | Sulfadimethoxine-D6 | 38 | 9.8 | 10 | 6.7 |
| Sulfabenzamide | SBZ | Sulfathiazole-13C6 | −44 | 6.1 | 4.8 | 8.3 |
| Enrofloxacin | ENR | Enrofloxacin-D5 | −51 | 13 | 16 | 11 |
| Ofloxacin | OFX | Salbutamol-D3 | −10 | 5.7 | 5.7 | 12 |
| Flumequine | FLQ | Thiabendazole-D6 | −1.8 | 10 | 10 | 4.1 |
| Marbofloxacin | MFX | Salbutamol-D3 | −19 | 13 | 4.1 | 11 |
| Oxolinic Acid | OA | Thiabendazole-D6 | −12 | 3.4 | 10 | 5.1 |
| Nalidixic acid | NA | Thiabendazole-D6 | 9.6 | 6.0 | 5.2 | 9.6 |
| Difloxacin | DFX | Salbutamol-D3 | −34 | 12 | 12 | 5.8 |
| Orbifloxacin | OBFX | Salbutamol-D3 | −22 | 9.5 | 6.8 | 6.5 |
| Fleroxacin | FRX | Ractopamine-D3 | −41 | 13 | 13 | 9.0 |
| Ractopamine | RPM | Ractopamine-D3 | −22 | 8.5 | 4.6 | 5.8 |
| Terbutaline sulphate | TS | Enrofloxacin-D5 | −14 | 7.3 | 14 | 14 |
| Salbutamol | SBT | Salbutamol-D3 | −3.1 | 6.1 | 6.7 | 5.6 |
| Cimaterol | CMT | Thiabendazole-D6 | −1.7 | 6.7 | 7.2 | 9.8 |
| Clorprenaline | CPNA | Methyl Testosterone-D3 | −14 | 5.2 | 8.3 | 10 |
| Tulobuterol | TBT | Methyl Testosterone-D3 | −37 | 11 | 7.3 | 11 |
| Penbutolol | PBT | Sulfaquinoxaline-13C6 | −41 | 13 | 9.1 | 11 |
| Erythromycin | ETM | Sulfaquinoxaline-13C6 | −68 | 14 | 10 | 9.6 |
| Tylosin | TYL | Methyl Testosterone-D3 | −44 | 5.4 | 9.8 | 5.7 |
| Tilmicosin | TMS | Sulfaquinoxaline-13C6 | −42 | 9.4 | 9.1 | 14 |
| Lincomycin | LIN | Methyl Testosterone-D3 | −29 | 11 | 6.6 | 8.5 |
| Spiramycin | SPI | Sulfaquinoxaline-13C6 | −46 | 14 | 8.5 | 9.8 |
| Kitasamycin | KIT | Sulfathiazole-13C6 | −46 | 9.1 | 12 | 6.7 |
| Tiamulin fumarate | TF | Sulfathiazole-13C6 | −48 | 6.1 | 5.1 | 13 |
| Chlortetracycline | CTC | Sulfaquinoxaline-13C6 | −46 | 15 | 8.0 | 6.6 |
| Tetracycline | TTC | Sulfaquinoxaline-13C6 | −46 | 4.8 | 13 | 5.5 |
| Penicillin G | PG | Methyl Testosterone-D3 | −62 | 11 | 12 | 5.7 |
| Dicloxacillin | DIC | Methyl Testosterone-D3 | −59 | 10 | 7.2 | 10 |
| Oxacillin | OXA | Chloramphenicol-D5 | −61 | 12 | 5.2 | 12 |
| Cloxacillin | CLOX | Methyl Testosterone-D3 | −41 | 5.4 | 6.4 | 11 |
| Ampicillin | AMP | Methyl Testosterone-D3 | −41 | 9.5 | 4.1 | 10 |
| Penicillin V | PV | NP-AHD-13C3 | −12 | 8.9 | 7.0 | 9.4 |
| Methyl Testosterone | MT | Methyl Testosterone-D3 | −44 | 7.1 | 8.3 | 8.0 |
| Testosterone Propionate | TP | Sulfaquinoxaline-13C6 | −50 | 11 | 8.9 | 7.5 |
| Furazolidone | FZD | NP-AOZ-D4 | −2.0 | 7.5 | 6.9 | 9.8 |
| Furaltadone | FTD | Methyl Testosterone-D3 | −36 | 5.9 | 6.8 | 7.3 |
| Nitrofurantoin | NFT | NP-AOZ-D4 | 67 | 9.1 | 8.8 | 17 |
| Nitrofurazone | NFZ | NP-AOZ-D4 | −20 | 6.1 | 6.1 | 7.6 |
| NP-AOZ | NPAO | NP-AOZ-D4 | −1.1 | 5.3 | 7.7 | 5.5 |
| NP-AMOZ | NPAM | NP-AMOZ-D5 | −23 | 7.5 | 4.9 | 5.0 |
| NP-AHD | NPAH | NP-AHD-13C3 | −1.2 | 9.4 | 3.9 | 10 |
| NP-SCA | NPSC | NP-AHD-13C3 | −40 | 11 | 9.7 | 7.9 |
| Hydrocortisone | HCT | NP-AMOZ-D5 | −45 | 6.3 | 9.9 | 11 |
| Methylprednisolone | MPD | Chloramphenicol-D5 | −46 | 8.8 | 5.6 | 8.1 |
| Betamethasone | BMS | NP-AOZ-D4 | −24 | 6.3 | 8.6 | 10 |
| Naproxen | NPX | NP-AMOZ-D5 | −7.4 | 9.3 | 7.7 | 11 |
| Ketoprofen | KTP | Sulfadiazine-D4 | −44 | 4.5 | 7.2 | 8.9 |
| Ibuprofen | IPF | Chloramphenicol-D5 | −58 | 5.4 | 7.4 | 9.0 |
| Tolfenamic Acid | TA | Sulfaquinoxaline-13C6 | −49 | 8.1 | 5.1 | 11 |
| Chloramphenicol | CAP | Chloramphenicol-D5 | −48 | 4.2 | 6.5 | 10 |
| Thiamphenicol | TAP | Sulfaquinoxaline-13C6 | −85 | 9.0 | 5.4 | 5.9 |
| Florfenicol | FF | Chloramphenicol-D5 | −67 | 6.7 | 5.2 | 7.0 |
| Diethylstilbestrol | DSB | Sulfaquinoxaline-13C6 | −74 | 11 | 11 | 10 |
| Estradiol | ETD | Sulfadiazine-D4 | −54 | 7.0 | 10 | 6.1 |
| Hexoestrol | HXE | Sulfaquinoxaline-13C6 | −67 | 12 | 9.4 | 6.8 |
| Dienoestrol | DNT | Sulfaquinoxaline-13C6 | −72 | 14 | 11 | 11 |
| Chlormadinone | CMDN | Sulfaquinoxaline-13C6 | −51 | 11 | 7.6 | 9.3 |
| Nandrolone phenylpropionate | NDPP | Sulfaquinoxaline-13C6 | −62 | 16 | 6.2 | 9.3 |
| Medroxyprogesterone 17-acetate | MPG | Sulfaquinoxaline-13C6 | −51 | 11 | 6.7 | 7.2 |
| Trenbolone | TBL | NP-AOZ-D4 | −20 | 5.0 | 11 | 5.8 |
| Pyrimethamine | PMT | Methyl Testosterone-D3 | −49 | 6.5 | 10 | 8.5 |
| Olaquindox | OQD | Methyl Testosterone-D3 | −49 | 6.0 | 14 | 15 |
| Carbadox | CBD | Thiabendazole-D6 | −6.9 | 4.0 | 7.4 | 5.2 |
| Chlorpromazine | CPMA | Methyl Testosterone-D3 | −52 | 9.4 | 7.0 | 10 |
| Mebendazole | MBDA | Methyl Testosterone-D3 | −36 | 6.7 | 5.8 | 16 |
| Zeranol | TBDA | NP-AMOZ-D5 | −17 | 4.7 | 4.6 | 4.2 |
| Clorsulon | ZAN | Sulfaquinoxaline-13C6 | −41 | 11 | 4.0 | 9.9 |
| Amantadine | CSL | NP-AMOZ-D5 | −68 | 8.0 | 7.7 | 6.3 |
| Metronidazole | CPDO | Thiabendazole-D6 | −4.1 | 6.7 | 7.2 | 6.4 |
| Dimetridazole | MNZ | Thiabendazole-D6 | −2.6 | 9.1 | 8 | 15 |
| Ronidazole | DMZ | Thiabendazole-D6 | 21 | 4.7 | 14.1 | 11.1 |
| Levamisole hydrochloride | RDZ | Methyl Testosterone-D3 | −6.0 | 8.2 | 4.1 | 7.4 |
| Amprolium hydrochloride | LH | Thiabendazole-D6 | −24 | 6.2 | 15 | 7.9 |
| Toltrazuril | AH | Sulfaquinoxaline-13C6 | 10 | 9.6 | 9.8 | 14 |
| Diclazuril | TLZ | Sulfaquinoxaline-13C6 | −59 | 6.4 | 5.0 | 5.1 |
| Triclabendazole | DLZ | Sulfaquinoxaline-13C6 | −54 | 9.2 | 11 | 11 |
| Thiabendazole | TCBD | Thiabendazole-D6 | −17 | 10 | 14 | 14 |
| Clopidol | AMTD | Thiabendazole-D6 | 49 | 9.3 | 11 | 14 |
| Flubendazole | FBDZ | Methyl Testosterone-D3 | −22 | 18 | 10 | 11 |
| Albendazole | ABDZ | Sulfaquinoxaline-13C6 | −41 | 11 | 8.5 | 9.7 |
| Oxfendazole | OFDZ | Thiabendazole-D6 | 21 | 5.3 | 8.5 | 8.3 |
| Fenbendazole | FEBD | Methyl Testosterone-D3 | 0.5 | 19 | 9.2 | 10 |
References
- Yang, J.-F.; Ying, G.-G.; Zhao, J.-L.; Tao, R.; Su, H.-C.; Liu, Y.-S. Spatial and seasonal distribution of selected antibiotics in surface waters of the Pearl Rivers, China. J. Environ. Sci. Health 2011, 46, 272–280. [Google Scholar] [CrossRef] [PubMed]
- Xue, B.; Zhang, R.; Wang, Y.; Liu, X.; Li, J.; Zhang, G. Antibiotic contamination in a typical developing city in south China: Occurrence and ecological risks in the Yongjiang River impacted by tributary discharge and anthropogenic activities. Ecotoxicol. Environ. Saf. 2013, 92, 229–236. [Google Scholar] [CrossRef] [PubMed]
- Narciso, A.; Caracciolo, A.B.; De Carolis, C. Overview of direct and indirect effects of antibiotics on terrestrial organisms. Antibiotics 2023, 12, 1471. [Google Scholar] [CrossRef] [PubMed]
- Nkoh, J.N.; Shang, C.; Okeke, E.S.; Ejeromedoghene, O.; Oderinde, O.; Etafo, N.O.; Mgbechidinma, C.L.; Bakare, O.C.; Meugang, E.F. Antibiotics soil-solution chemistry: A review of environmental behavior and uptake and transformation by plants. J. Environ. Manag. 2024, 354, 120312. [Google Scholar] [CrossRef]
- Wang, Z.; Li, Y.; Wang, J.; Li, S. Tetracycline antibiotics in agricultural soil: Dissipation kinetics, transformation pathways, and structure-related toxicity. Sci. Total Environ. 2024, 949, 175126. [Google Scholar] [CrossRef]
- Schlüsener, M.P.; Spiteller, M.; Bester, K. Determination of antibiotics from soil by pressurized liquid extraction and liquid chromatography–tandem mass spectrometry. J. Chromatogr. A 2003, 1003, 21–28. [Google Scholar] [CrossRef]
- Saeed, H.; Padmesh, S.; Singh, A.; Nandy, A.; Singh, S.P.; Deshwal, R.K. Impact of veterinary pharmaceuticals on environment and their mitigation through microbial bioremediation. Front. Microbiol. 2024, 15, 1396116. [Google Scholar] [CrossRef]
- Sun, J.; Zeng, Q.; Tsang, D.C.; Zhu, L.; Li, X. Antibiotics in the agricultural soils from the Yangtze River Delta, China. Chemosphere 2017, 189, 301–308. [Google Scholar] [CrossRef]
- Tong, L.; Qin, L.; Xie, C.; Liu, H.; Wang, Y.; Guan, C.; Huang, S. Distribution of antibiotics in alluvial sediment near animal breeding areas at the Jianghan Plain, Central China. Chemosphere 2017, 186, 100–107. [Google Scholar] [CrossRef]
- Liang, X.; Chen, B.; Nie, X.; Shi, Z.; Huang, X.; Li, X. The distribution and partitioning of common antibiotics in water and sediment of the Pearl River Estuary, South China. Chemosphere 2013, 92, 1410–1416. [Google Scholar] [CrossRef]
- Bohm, D.; Stachel, C.; Gowik, P. Multi-method for the determination of antibiotics of different substance groups in milk and validation in accordance with Commission Decision 2002/657/EC. J. Chromatogr. A 2009, 1216, 8217–8223. [Google Scholar] [CrossRef] [PubMed]
- Guidi, L.R.; Santos, F.A.; Ribeiro, A.C.S.; Fernandes, C.; Silva, L.H.; Gloria, M.B.A. A simple, fast and sensitive screening LC-ESI-MS/MS method for antibiotics in fish. Talanta 2016, 163, 85–93. [Google Scholar] [CrossRef]
- Hu, W.; Guo, C.; Ma, L.; Wang, Y. Simultaneous analysis of multiple classes of antibiotics in water and soil samples via solid phase extraction and liquid chromatog-raphy-tandem mass spectrometry. In Proceedings of the 2010 4th International Conference on Bioinformatics and Biomedical Engineering, Chengdu, China, 18–20 June 2010. [Google Scholar]
- Hu, W.; Ma, L.; Guo, C.; Sha, J.; Zhu, X.; Wang, Y. Simultaneous extraction and determination of fluoroquinolones, tetracyclines and sulfonamides antibiotics in soils using optimised solid phase extraction chromatography-tandem mass spectrometry. Int. J. Environ. Anal. Chem. 2012, 92, 698–713. [Google Scholar] [CrossRef]
- Ho, Y.; Zakaria, M.P.; Latif, P.A.; Saari, N. Simultaneous determination of veterinary antibiotics and hormone in broiler manure, soil and manure compost by liquid chromatography–tandem mass spectrometry. J. Chromatogr. A 2012, 1262, 160–168. [Google Scholar] [CrossRef]
- Salvia, M.-V.; Vulliet, E.; Wiest, L.; Baudot, R.; Cren-Olivé, C. Development of a multi-residue method using acetonitrile-based extraction followed by liquid chromatography–tandem mass spectrometry for the analysis of steroids and veterinary and human drugs at trace levels in soil. J. Chromatogr. A 2012, 1245, 122–133. [Google Scholar] [CrossRef]
- Tong, L.; Liu, H.; Xie, C.; Li, M. Quantitative analysis of antibiotics in aquifer sediments by liquid chromatography coupled to high resolution mass spectrometry. J. Chromatogr. A 2016, 1452, 58–66. [Google Scholar] [CrossRef]
- Ye, A.; Yang, Y.; Zhang, J.; Liu, M.; Hou, L.; Zhou, J.L. Simultaneous determination of steroidal and phenolic endocrine disrupting chemicals in fish by ultra-high-performance liquid chromatography–mass spectrometry/mass spectrometry. J. Chromatogr. A 2013, 1278, 126–132. [Google Scholar] [CrossRef] [PubMed]
- Jacobsen, A.M.; Halling-Sørensen, B.; Ingerslev, F.; Hansen, S.H. Simultaneous extraction of tetracycline, macrolide and sulfonamide antibiotics from agricultural soils using pressurised liquid extraction, followed by solid-phase extraction and liquid chromatography–tandem mass spectrometry. J. Chromatogr. A 2004, 1038, 157–170. [Google Scholar] [CrossRef]
- Huang, Y.; Cheng, M.; Li, W.; Wu, L.; Chen, Y.; Luo, Y.; Christie, P.; Zhang, H. Simultaneous extraction of four classes of antibiotics in soil, manure and sewage sludge and analysis by liquid chromatography-tandem mass spectrometry with the isotope-labelled internal standard method. Anal. Methods 2013, 5, 3721–3731. [Google Scholar] [CrossRef]
- Matuszewski, B.K.; Constanzer, M.L.; Chavezeng, C.M. Strategies for the assessment of matrix effect in quantitative bioanalytical methods based on HPLC−MS/MS. Anal. Chem. 2003, 75, 3019–3030. [Google Scholar] [CrossRef]
- Matić, I.; Grujić, S.; Jauković, Z.; Laušević, M. Trace analysis of selected hormones and sterols in river sediments by liquid chromatography-atmospheric pressure chemical ionization–tandem mass spectrometry. J. Chromatogr. A 2014, 1364, 117–127. [Google Scholar] [CrossRef]
- Council Directive 96/23/EC concerning the performance of analytical methods and the interpretation of results. Off. J. Eur. Communities 2002, 221, 8–36.
- Becker, M.; Zittlau, E.; Petz, M. Residue analysis of 15 penicillins and cephalosporins in bovine muscle, kidney and milk by liquid chromatography-tandem mass spectrometry. Anal. Chim. Acta 2004, 520, 19–32. [Google Scholar] [CrossRef]
- Zhou, L.J.; Ying, G.G.; Zhao, J.L.; Yang, J.F.; Wang, L.; Yang, B.; Liu, S. Trends in the occurrence of human and veterinary antibiotics in the sediments of the Yellow River, Hai River and Liao River in northern China. Environ. Pollut. 2011, 159, 1877–1885. [Google Scholar] [CrossRef] [PubMed]
- Shi, H.; Yang, Y.; Liu, M.; Yan, C.; Yue, H.; Zhou, J. Occurrence and distribution of antibiotics in the surface sediments of the Yangtze Estuary and nearby coastal areas. Mar. Pollut. Bull. 2014, 83, 317–323. [Google Scholar] [CrossRef] [PubMed]
- Kulshrestha, P.; Giese, R.F.; Aga, D.S. Investigating the Molecular interactions of oxytetracycline in clay and organic matter: Insights on factors affecting its mobility in soil. Environ. Sci. Technol. 2004, 38, 4097–4105. [Google Scholar] [CrossRef]
- Tolls, J. Sorption of veterinary pharmaceuticals in soils: A review. Environ. Sci. Technol. 2001, 35, 3397–3406. [Google Scholar] [CrossRef]
- Kim, S.-C.; Carlson, K. Temporal and spatial trends in the occurrence of human and veterinary antibiotics in aqueous and river sediment matrices. Environ. Sci. Technol. 2006, 41, 50–57. [Google Scholar] [CrossRef]
- Vazquez-Roig, P.; Blasco, C.; Picó, Y. Advances in the analysis of legal and illegal drugs in the aquatic environment. TrAC Trends Anal. Chem. 2013, 50, 65–77. [Google Scholar] [CrossRef]
- Dasenaki, M.E.; Thomaidis, N.S. Multi-residue determination of 115 veterinary drugs and pharmaceutical residues in milk powder, butter, fish tissue and eggs using liquid chromatography-tandem mass spectrometry. Anal. Chim. Acta 2015, 880, 103–121. [Google Scholar] [CrossRef]
- Boscher, A.; Guignard, C.; Pellet, T.; Hoffmann, L.; Bohn, T. Development of a multi-class method for the quantification of veterinary drug residues in feedingstuffs by liquid chromatography-tandem mass spectrometry. J. Chromatogr. A 2010, 1217, 6394–6404. [Google Scholar] [CrossRef] [PubMed]
- Sun, L.; Jia, L.; Xie, X.; Xie, K.; Wang, J.; Liu, J.; Cui, L.; Zhang, G.; Dai, G.; Wang, J. Quantitative analysis of amoxicillin, its major metabolites and ampicillin in eggs by liquid chro-matography combined with electrospray ionization tandem mass spectrometry. Food Chem. 2016, 192, 313–318. [Google Scholar] [CrossRef] [PubMed]
- USEPA. Method 1694, Pharmaceuticals and Personal Care Products in Water, Soil, Sediment, and Biosolids by HPLC/MS/MS; USEPA: New York, NY, USA; Washington, DC, USA, 2007. [Google Scholar]
- AOAC International. Guidelines for Single Laboratory Validation of Chemical Methods for Dietary Supplements and Botanicals. Appendix F, Official Methods of Analysis. 2013, Gaithersburg, MD, USA. Available online: https://max.book118.com/html/2015/1001/26477980.shtm (accessed on 23 March 2025).

Disclaimer/Publisher’s Note: The statements, opinions and data contained in all publications are solely those of the individual author(s) and contributor(s) and not of MDPI and/or the editor(s). MDPI and/or the editor(s) disclaim responsibility for any injury to people or property resulting from any ideas, methods, instructions or products referred to in the content. |
© 2025 by the authors. Licensee MDPI, Basel, Switzerland. This article is an open access article distributed under the terms and conditions of the Creative Commons Attribution (CC BY) license (https://creativecommons.org/licenses/by/4.0/).