


Abstract
Drainage solution reuse in soilless strawberry production can reduce nutrient-rich discharge, but adoption requires microbial control, hydraulic reliability, and manageable energy demand. This field study evaluated a photovoltaic (PV) assisted ultraviolet-C (UV-C) treatment loop for substrate derived drainage solution in a 132 m2 three-tier natural light greenhouse producing ‘Solhyang’ strawberry in Sokcho-si, Republic of Korea. The system used an 11.25 kWp vertical windbreak-type PV facility and a 650 W treatment loop comprising a 250 W low-pressure mercury UV-C reactor, a 350 W pump, and a 50 W controller. The loop operated for 2.5 h day−1, processed 3.25 m3 day−1 as cumulative reactor throughput, and consumed 1.625 kWh day−1, equal to 4.22% of the measured daily PV alternating current (AC) output (38.5 kWh day−1). The drainage solution had low ultraviolet transmittance at 254 nm (UVT254; 25–50%) and moderate turbidity (5–30 NTU), conditions that can attenuate UV radiation and shield microorganisms. Across six post fruit set sampling events, the mean log10 reductions were 1.15 ± 0.09 for culturable molds/fungal propagules and 1.64 ± 0.09 for culturable aerobic bacteria; paired tests on log10 transformed counts were significant (p < 0.001). Total coliform bacteria were not detected after treatment, corresponding to a detection limit-based lower-bound reduction of ≥2.69 ± 0.17 log10. Apparent fluence values were treated as engineering estimates rather than validated delivered dose. The results support UV-C sanitation as a preliminary enabling step for drainage solution reuse, while biodosimetry, untreated circulation controls, multi-stage seasonal sampling, full-season recirculation, and crop response validation remain necessary.
1. Introduction
Drainage solution reuse is an important agricultural water management strategy for soilless greenhouse production because it can reduce freshwater demand, fertilizer discharge, and nutrient-rich effluent losses [1,2,3,4,5]. In protected strawberry production, drainage solution discharged after fertigation still contains water and residual macro- and micronutrients, making it a potentially valuable reuse stream. However, reuse is only acceptable when microbial risk, optical water quality, and nutrient balance are controlled under practical farm conditions.
The motivation for drainage solution reuse has strengthened in Korea because water resource efficiency, renewable energy use, and circular hydroponics are increasingly linked in agricultural policy [6,7,8,9]. Government led programs promote drainage solution recirculation as a resource-saving technology that can reduce water use, fertilizer use, production costs, and carbon emissions when nutrient correction is properly managed [8,9].
Fertilizer market instability adds an economic driver for water and nutrient reuse. The Korean mineral fertilizer sector depends heavily on imported raw materials, making fertilizer prices sensitive to supply chain disruptions, export controls, exchange rate changes, and geopolitical conflicts [10,11]. The Russia–Ukraine war caused major disruptions in fertilizer production, trade flows, and prices, exposing the vulnerability of import-dependent fertilizer markets [11,12,13]. Under these conditions, reusing drainage solution becomes both a water quality measure and a farm level cost control strategy.
Despite this need, adoption of closed or semi-closed nutrient solution reuse remains limited because farms must install collection tanks, return plumbing, nutrient correction, microbial control, monitoring routines, pumps, and sanitation equipment. Dutch greenhouse horticulture provides a useful precedent: closed soilless systems and drain water reuse have been developed over many years, and UV-based disinfection has been used as a practical treatment option before reuse [14,15,16]. This precedent is directly relevant to agricultural water management because it links water quality control, microbial risk reduction, and nutrient solution recirculation.
Ultraviolet-C (UV-C) disinfection is attractive for agricultural water reuse because it can inactivate microorganisms without chemical disinfectant dosing or the formation of disinfectant residues [17,18,19,20]. Reactor and lamp factors that affect UV-C performance include reactor geometry, flow rates, hydraulic residence times, lamp output, and quartz sleeve conditions. Water matrix factors include turbidity, suspended particles, organic matter, and ultraviolet transmittance at 254 nm (UVT254) [20,21,22]. These constraints are especially important for substrate-derived strawberry drainage solution, which can contain fine particles, root zone organic matter, humic-like substances, and biofilm fragments that attenuate UV radiation and shield microorganisms. Related ultraviolet disinfection and microbial monitoring systems for nutrient solution residual liquids have also been proposed [23], but the present study focuses on 254 nm UV-C treatment.
Renewable energy integration can reduce the operating energy barrier of on-farm water treatment. Photovoltaic (PV) and agrivoltaic systems have been studied as ways to couple agricultural production with renewable electricity [24,25], and vertical PV structures may reduce direct competition with crop light interception while providing site-specific wind-sheltering functions [26]. The Sokcho installation evaluated here was an electrical vertical windbreak-type PV generation facility, not a thermal hybrid photovoltaic system. Windbreak performance was not a study endpoint; the present analysis focuses on water treatment energy demand and PV coverage of UV-C operation.
The objective of this study was to evaluate the water reuse feasibility, field energy balance, and microbial indicator reduction of a PV-assisted UV-C treatment loop operated with substrate-derived strawberry drainage solution. The study was intentionally framed as a field feasibility evaluation rather than a validated UV dose response study or a full-season recirculating crop trial. The specific aims were to: (i) describe the greenhouse, drainage collection, and UV-C water treatment configuration; (ii) quantify hydraulic throughput, specific energy demand, and PV coverage; (iii) evaluate microbial indicator log10 reductions across six post fruit set sampling events; (iv) assess UVT254 and turbidity as optical constraints on UV-C performance; (v) distinguish directly measured values from energy allocation estimates; and (vi) define the validation requirements needed before full-season drainage solution recirculation.
The novelty claim is therefore limited to PV-assisted field operation of a dedicated UV-C drainage treatment loop in a substrate derived strawberry drainage matrix rather than UV-C recirculation or strawberry drainage solution reuse itself.
2. Materials and Methods
2.1. Greenhouse Site and Water Reuse System
The experiment was conducted in a vinyl greenhouse located in Sokcho-si, Republic of Korea. The greenhouse scale was approximately 132 m2 (40 pyeong). Strawberry plants (Fragaria × ananassa Duch. cv. ‘Solhyang’) were transplanted in August, and the crop cycle was terminated in April. Approximately 1000 plants were cultivated in natural light, in a three-tier substrate culture system using drip fertigation and a commercial horticultural substrate rather than rockwool. The production system was normally operated as a non-recirculating fertigation system; for the present water treatment experiment, drainage collection and the UV-C loop were operated in temporary circulation mode.
Environmental and PV operating conditions were recorded as operational descriptors rather than as controlled experimental factors. The greenhouse was operated under natural daylight without supplementary lighting, and the vertical PV modules were installed along the greenhouse boundary rather than above the crop canopy; therefore, no intentional crop shading treatment was imposed by the PV facility (Hanwha Q.Tron XL-G2, Seoul, Republic of Korea). The drainage solution temperature during the microbial treatment tests was 19–22 °C. Continuous greenhouse air temperature, global solar irradiance, and shade maps were not available for all six microbiological sampling events, so sunlight/PV conditions were described using the measured daily PV AC output (38.5 kWh day−1), specific PV yield (3.42 kWh kWp−1 day−1), the 2.5 h day−1 UV-C operating schedule, and the allocated 75% direct PV/25% battery-mediated PV electricity pathway.
The crop was supplied through the grower’s standard commercial strawberry nutrient solution, prepared as a two-part A/B stock fertilizer diluted with source water and managed through the farm fertigation controller. The fertilizer recipe was not varied as an experimental treatment, and complete stock solution composition and full ion-balance data were not generated for this field feasibility study. Available pH, electrical conductivity (EC), turbidity, and UVT254 records from NICEM-accredited water quality analyses are identified in Table S2, whereas full ion-balance validation is treated as a required follow-up step before repeated recirculation.
2.2. Vertical Windbreak-Type Photovoltaic Facility for Water Treatment Energy Supply
The installed energy system was officially designated as a vertical windbreak-type PV generation facility. The facility comprised 18 PV modules, each rated at 625 W, giving a total nominal installed PV electrical capacity of 11.25 kWp. The modules were installed vertically along the greenhouse boundary. This configuration was selected because the Sokcho site is exposed to wind and because greenhouse structural designs in this region must consider wind conditions. The present study analyzed the electrical role of the facility in supporting UV-C drainage solution disinfection and reuse. No thermal recovery function was installed or evaluated, and windbreak performance was not quantified.
2.3. Drainage Collection, UV-C Reactor, and Water Treatment Loop
Nutrient solution was supplied through drip fertigation, and substrate-derived drainage solution was collected from the three-tier strawberry cultivation system. The collected drainage solution was transferred to a storage or mixing tank and circulated through the UV-C reactor before potential reuse. The irrigation reservoir volume was 0.5 m3, and the collected drainage volume used in the hydraulic analysis was 0.15 m3. The design/measured flow rate was 1.3 m3 h−1, and the nominal hydraulic residence time used for microbial treatment tests was ≤1 min in the irradiated section.
The UV-C reactor used a low-pressure mercury lamp (UV module T24, UV Plus Co., Gwangju, Republic of Korea) rated at 250 W. The reactor included an internal quartz sleeve maintenance function based on periodic acid cleaning to reduce fouling and sustain UV transmittance. The loop also included a 350 W circulation pump and a 50 W controller, resulting in a total connected treatment loop load of 650 W. The monitored operating schedule was 2.5 h day−1, yielding a cumulative reactor throughput of 3.25 m3 day−1 and a total loop electricity demand of 1.625 kWh day−1. The distribution of PV electricity use (75% direct PV and 25% battery-mediated PV) was allocated from the typical daytime dominant fertigation and drainage profile of substrate grown strawberries, where most UV-C operation occurs during peak solar irradiation hours while battery storage buffers late afternoon or cloudy condition operations. This allocation was not treated as a fixed inverter-reported ratio.
Turnover time was calculated as V/Q. UV-C only specific electrical energy consumption was calculated as PUVC/Q. Total loop specific electrical energy consumption was calculated as (PUVC + Ppump + Pcontroller)/Q. In these equations, V is solution volume, Q is flow rate, PUVC is the UV-C lamp electrical power, Ppump is the pump electrical power, and Pcontroller is the controller electrical power.
2.4. Engineering Apparent Fluence Estimate
The nominal reactor pipe inner diameter was approximately 0.10 m. The cross-sectional area was calculated as A = πD2/4, and the mean flow velocity was calculated as Q/A. The electrical input normalized apparent fluence estimate was calculated as Helec = Pe × D/(4 × Q), and the UVT254-adjusted apparent estimate was calculated as HUVT254 = fUV × UVT254 × Pe × D/(4 × Q). In these equations, D is the nominal reactor diameter, Pe is the UV-C electrical input, fUV is an assumed lumped UV delivery coefficient excluding UVT254, and UVT254 is the decimal UV transmittance at 254 nm. This calculation was used only for engineering interpretation and does not replace direct radiometry, biodosimetry, reduction equivalent dose analysis, or validated delivered dose determination [27,28]. Therefore, microbial reductions are reported as field indicator reductions under the tested reactor, flow, and optical water quality conditions, not as a transferable UV dose response curve.
Supporting device calibration and quality control documentation were managed within NICEM’s accredited laboratory quality system and the field operation log. NICEM’s testing framework is based on KOLAS accreditation under the ISO/IEC 17025:2017 competence framework for testing and calibration laboratories. The supporting water quality records were interpreted with reference to applicable ISO water quality standards, including ISO 5667-3:2024 for sample preservation and handling, ISO 10523:2008 for pH, ISO 7888:1985 for electrical conductivity, ISO 7027-1:2016 for turbidity, and ISO 8466-1:2021 for analytical calibration. Because a calibrated in-reactor UV radiometer or biodosimetric challenge test was not performed, apparent fluence values are retained only as engineering estimates rather than a validated delivered UV dose [29,30,31,32,33,34,35].
2.5. Microbiological Sampling and Accredited Laboratory Analysis
Six sampling events were conducted during the crop growth period (n = 6), mainly after fruit set according to flower cluster developmental progression. At each event, a pre-treatment grab sample was collected from the well-mixed drainage storage tank immediately before UV-C operation. A post-treatment grab sample was then collected from the treated water stream or tank after operation through the UV-C loop at the design flow condition. Samples were collected in sterile containers, kept chilled during transport, and submitted for laboratory analysis.
Drainage solution samples were analyzed by the National Instrumentation Center for Environmental Management (NICEM, Seoul National University, Republic of Korea). NICEM is a Korea Laboratory Accreditation Scheme (KOLAS) internationally accredited testing laboratory (KT 375) and is also listed as a drinking water quality testing institution [29]. Therefore, the water quality and microbiological results used in this study were generated through NICEM’s accredited testing procedures, within the ISO/IEC 17025:2017 laboratory competence framework [30]. Microbiological sampling and culture-based enumeration were interpreted with reference to the relevant ISO water microbiology standards, including ISO 19458:2006 for microbiological water sampling, ISO 8199:2018 for culture based microbiological examination, ISO 6222:1999 for culturable microorganism colony count enumeration, and ISO 9308-1:2014/Amd.1:2016 for E. coli and coliform bacteria by membrane filtration [36,37,38,39]. The design did not include an untreated circulation time control; therefore, the analysis evaluates paired field before/after changes under UV-C operation and does not separately quantify possible settling, handling, or tank circulation effects.
NICEM certificate values were standardized and reported on a colony-forming unit (CFU) basis. For plate count indicators, diluted aliquots equivalent to 1 mL were reported as CFU mL−1 for culturable molds/fungal propagules and culturable aerobic bacteria. For total coliform bacteria, the analysis was reported on a 100 mL water sample basis as CFU 100 mL−1. All post-treatment total coliform samples were reported as not detected (ND), with a method reporting limit of 1 CFU 100 mL−1. Therefore, total coliform log10 reductions were interpreted as detection limit-based lower-bound values rather than exact residual counts. Trial level certificate values and reporting limits are provided in Table S1.
2.6. Optical Water Quality and Nutrient Solution Monitoring
Optical water quality and nutrient solution status were assessed through NICEM-accredited water quality records and field operation records. Optical water quality was characterized by UVT254 and turbidity; turbidity was interpreted under ISO 7027-1:2016-type nephelometric/turbidimetric guidance, while UVT254 was used as an engineering optical constraint based on UV-C absorbance/transmittance at 254 nm under the laboratory standard operating procedure. Nutrient solution status was assessed operationally using pH and electrical conductivity (EC), with reference to ISO 10523:2008 and ISO 7888:1985, respectively. Complete event-paired ion-balance analysis was not performed in this feasibility study; future recirculation validation should include NO3−–N, NH4+–N, PO43−–P, K+, Ca2+, Mg2+, Na+, Cl−, and SO42− by appropriate ion chromatography, colorimetric, or ICP-based methods [29,31,32,33,34].
UVT254 varied from 25 to 50% across growth stage and seasonal conditions, with an average value of approximately 35%. Turbidity ranged from 5 to 30 NTU, with an average value of approximately 20 NTU. These values were treated as water quality constraints because low UVT254 and suspended particles can reduce delivered fluence and promote microbial shielding. UVT254 and turbidity were not paired with every microbial certificate value in a formal dose response design; therefore, the study cannot define optical threshold values for reliable inactivation.
NICEM-accredited water quality analysis and field operation records indicated no operationally significant nutrient solution composition change between before and after UV-C treatment, but this observation should not be interpreted as a complete ion balance validation. For long-term drainage solution reuse, fresh nutrient solution, untreated drainage solution, and UV-C-treated drainage solution should be periodically analyzed for pH, EC, NO3−–N, NH4+–N, PO43−–P, K+, Ca2+, Mg2+, Na+, Cl−, and SO42−. This monitoring is needed to manage recycling driven ion balance, not because short UV-C exposure is expected to alter the fertilizer recipe. The actual statuses of available water quality and ion data are clarified in Table S2.
2.7. Statistical Analysis and Data Treatment
Microbial counts were analyzed across six post-fruit-set sampling events (n = 6). For culturable molds/fungal propagules and culturable aerobic bacteria, before- and after-treatment counts were log10 transformed and compared using paired t-tests. Mean log10 reductions and 95% confidence intervals (CIs) were calculated from event-level log10 reductions. Wilcoxon signed rank tests were also used as a non-parametric sensitivity check because the sample size was small. For total coliform bacteria, post-treatment data were left censored as ND with a reporting limit of 1 CFU 100 mL−1. Therefore, total coliform reductions were summarized as detection limit based lower bounds rather than exact paired residual counts. The 75% direct PV and 25% battery mediated PV values were treated as energy balance allocation estimates and were not included in inferential statistics. The six-event dataset was interpreted as preliminary field feasibility evidence and not as full season performance validation across all seasonal, optical, and hydraulic conditions.
To strengthen the statistical reporting, homogeneous-group letters were used in the Results section. For each microbial indicator, before- and after-treatment groups were compared on log10 transformed values; groups sharing the same letter are not significantly different, whereas different letters indicate a significant paired difference at α = 0.05. Because the design contained only two paired levels for each indicator, these letters are equivalent to the paired test grouping. Spearman correlation analysis was considered for microorganism counts versus optical, nutrient, and PV variables; however, UVT254, turbidity, and nutrient data were not available as complete event-paired measurements for all six microbial certificates. To avoid generating unsupported correlations, this manuscript reports the limitation explicitly and treats event-paired correlation analysis as a required follow-up validation item.
3. Results
3.1. Water Treatment System, Reuse Context, and Energy Capacity
The experiment was conducted in an approximately 132 m2 vinyl greenhouse containing approximately 1000 ‘Solhyang’ strawberry plants in a natural light, three-tier substrate culture system. The renewable energy structure was a vertical windbreak-type PV generation facility, not a thermal hybrid photovoltaic system. Eighteen 625 W PV modules were installed vertically along the greenhouse boundary, resulting in 11.25 kWp nominal PV electrical capacity. Detailed greenhouse, hydraulic, optical, energy, and nutrient solution characteristics are provided in Table S4 rather than as a main text table.
3.2. Hydraulic Throughput, Specific Energy Demand, and PV Coverage
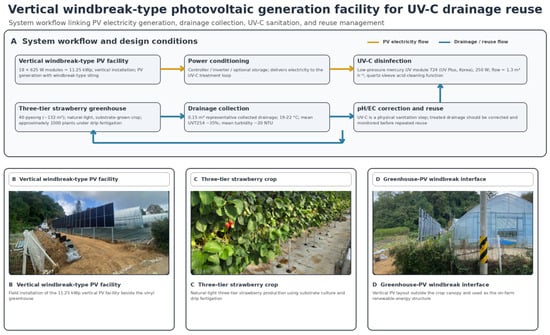
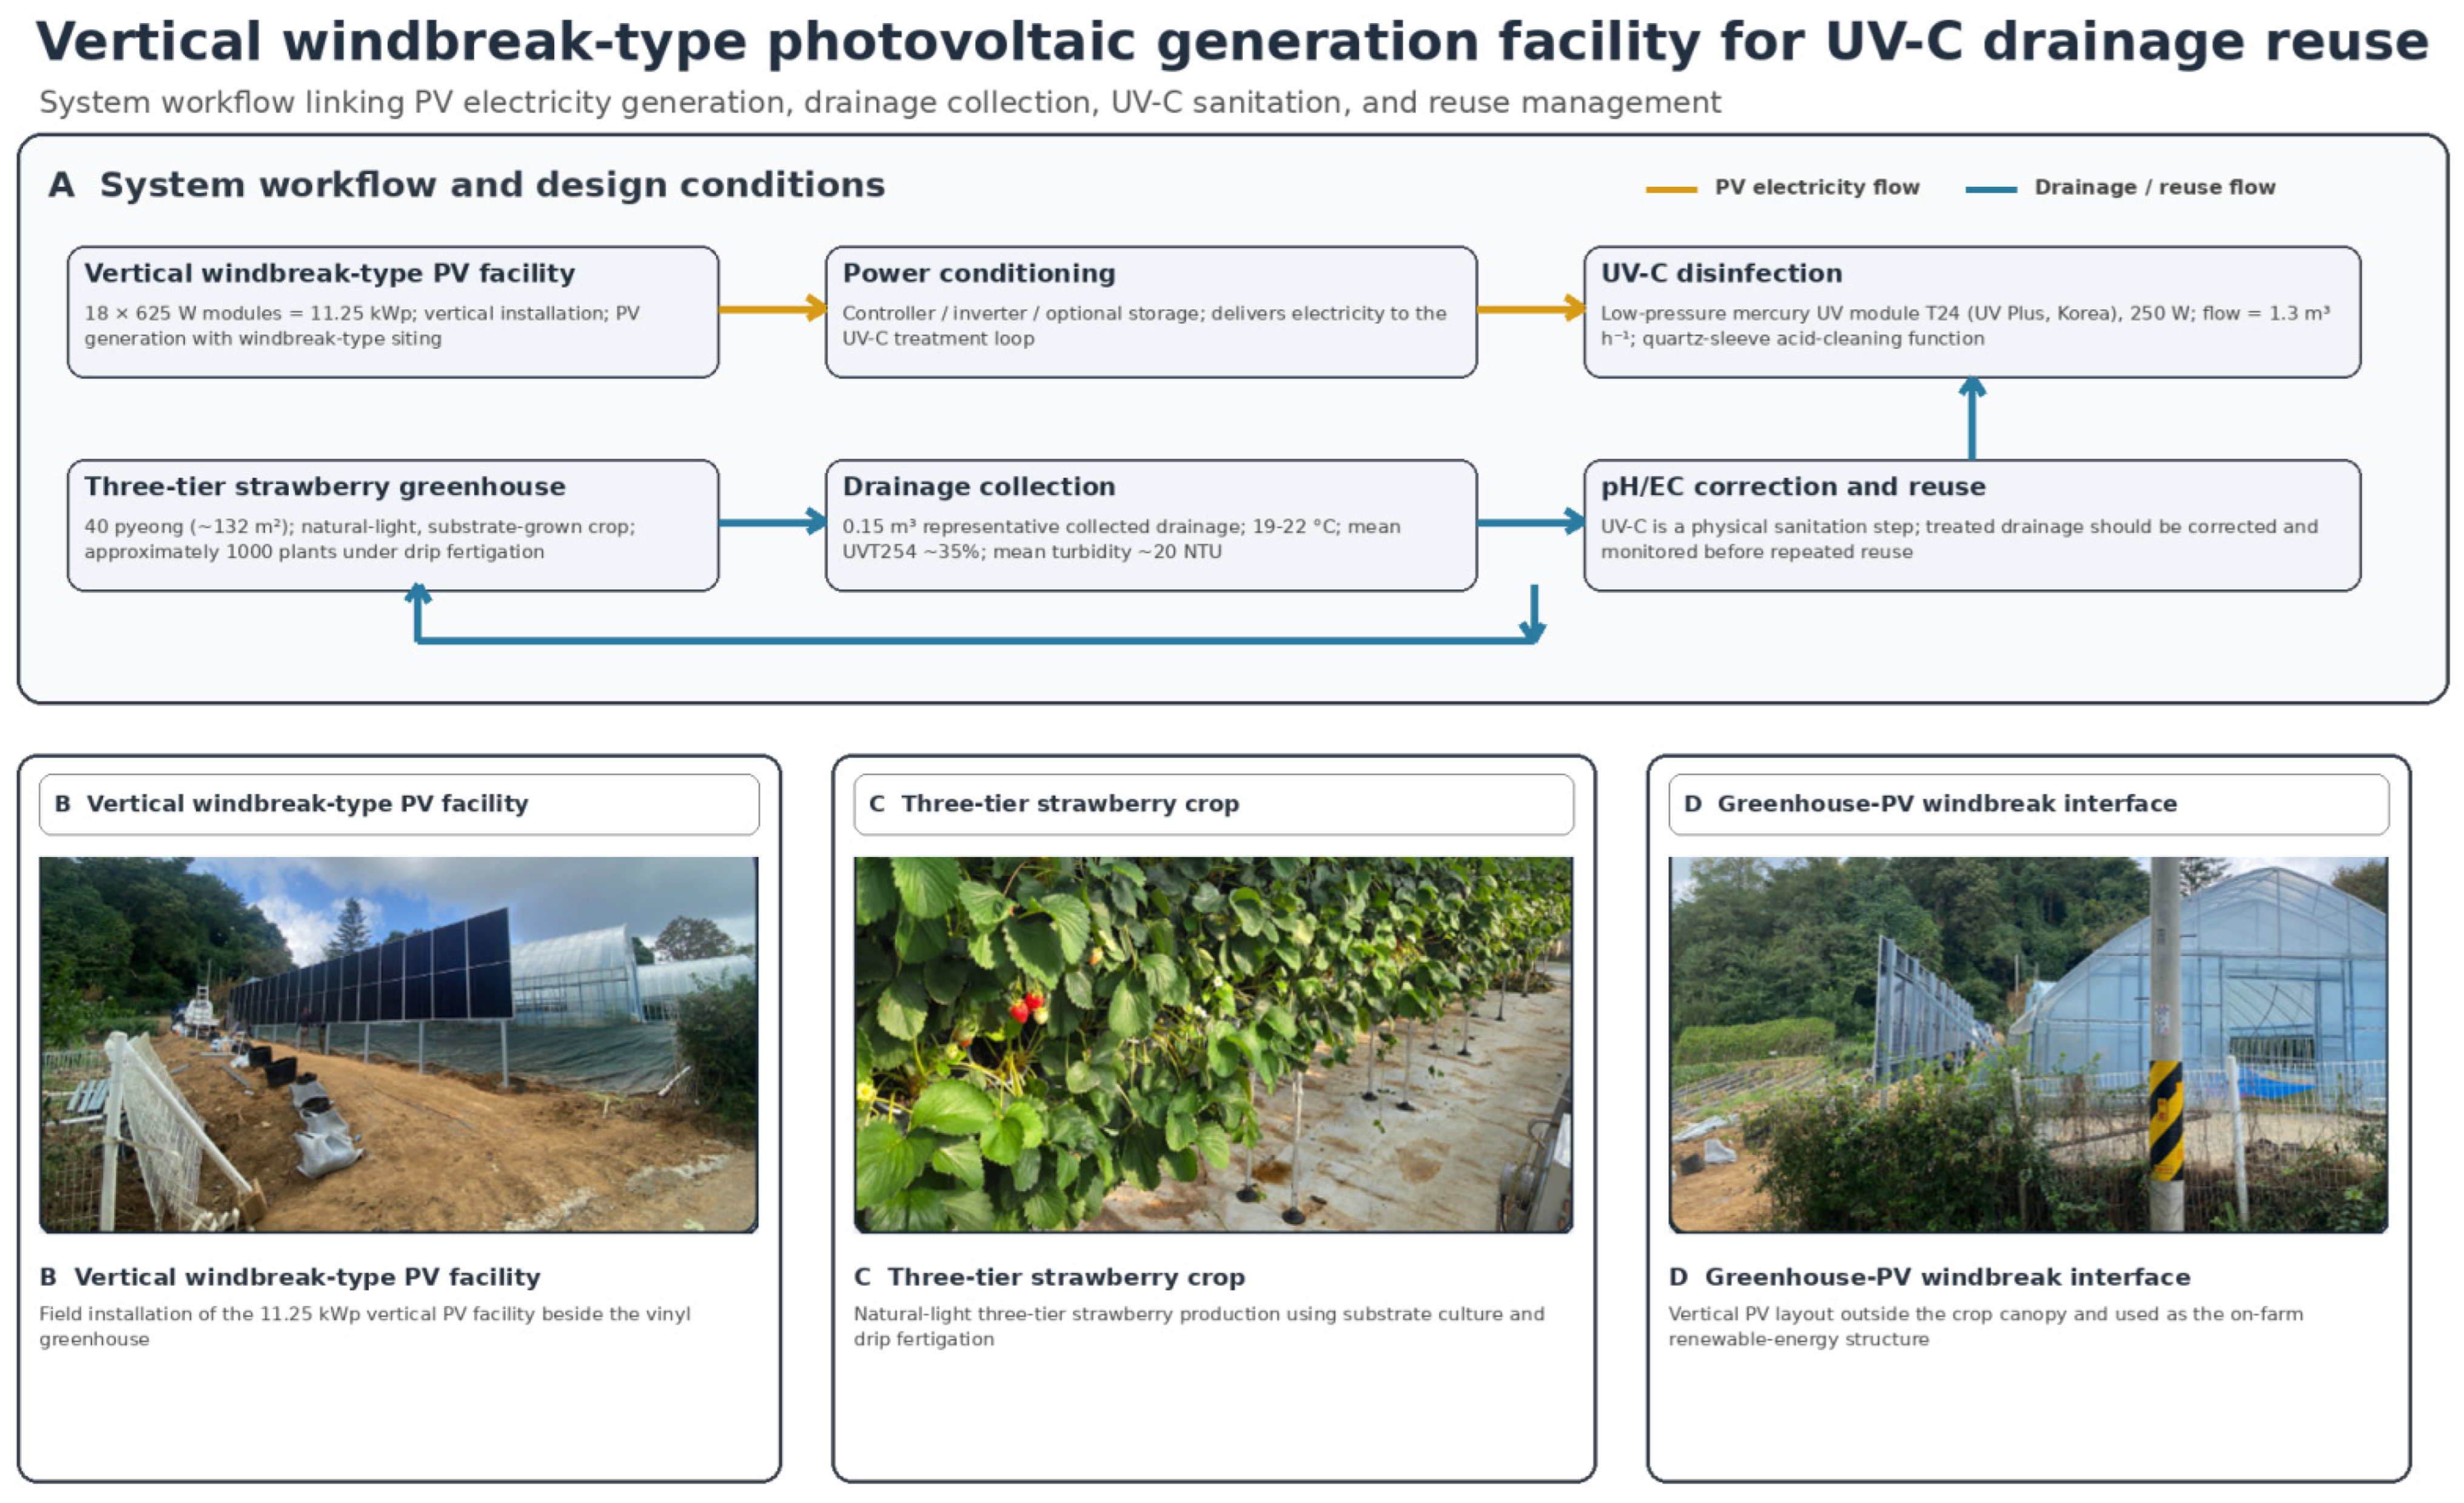
At the design flow rate of 1.3 m3 h−1, the 0.15 m3 collected drainage volume required 0.115 h, or approximately 6.9 min, for one theoretical pass through the UV-C loop. The 0.5 m3 irrigation reservoir required approximately 23.1 min for one theoretical turnover at the same flow rate. The monitored operating schedule was 2.5 h day−1. Therefore, the UV-C loop processed 3.25 m3 day−1 as cumulative reactor throughput, and consumed 1.625 kWh day−1. The integrated system workflow and representative field photographs are shown in Figure 1.
Figure 1.
System schematic and representative field photographs of the vertical windbreak-type photovoltaic generation facility, the three-tier strawberry crop, and the greenhouse PV windbreak interface. The upper schematic summarizes the PV electricity path, drainage collection, UV-C treatment, and intended pH/EC correction step before reuse. The site layout and additional equipment photographs are provided in Figures S1 and S2.
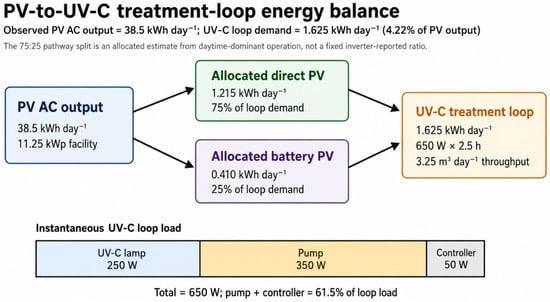
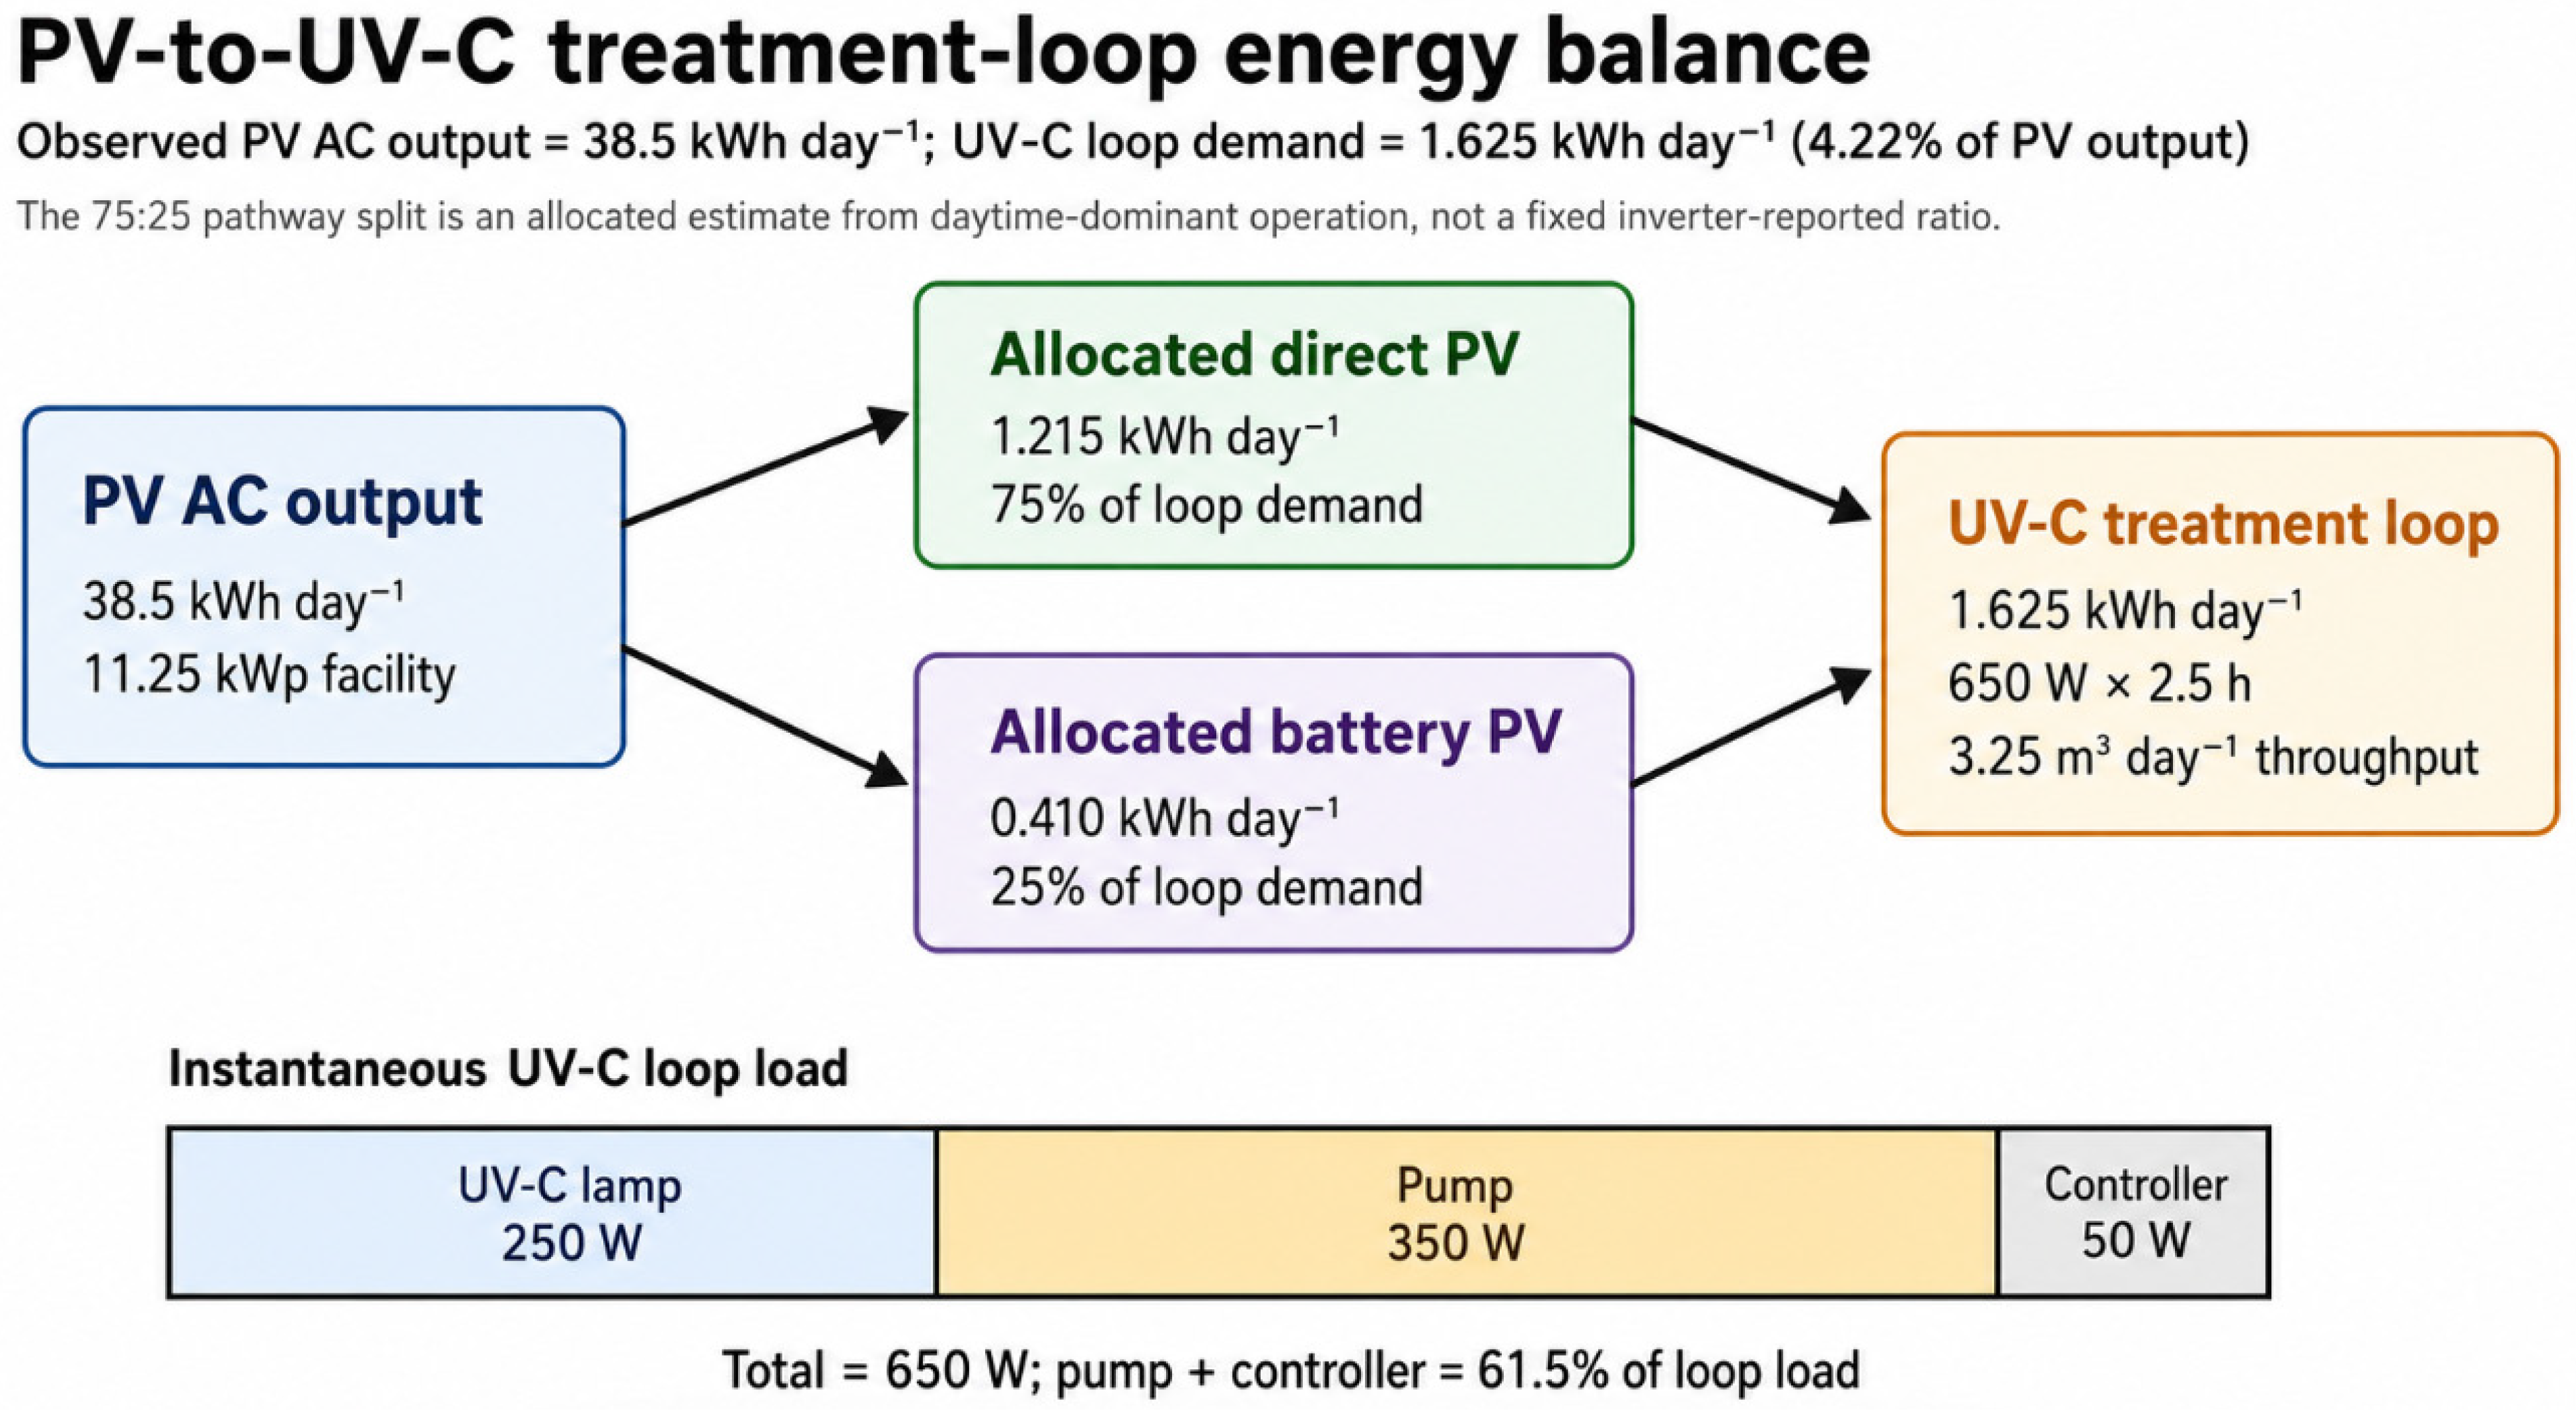
For the monitored operating condition, the daily electricity demand was allocated as approximately 1.215 kWh day−1 direct PV supply (75%) and 0.410 kWh day−1 battery-mediated PV supply (25%). This 75:25 distribution was not obtained as a fixed inverter-reported ratio; it was allocated from the typical daytime dominant fertigation and drainage profile of substrate grown strawberries, in which most UV-C operation occurs during peak solar irradiation hours while battery storage buffers late afternoon or cloudy condition operation. The measured PV AC output and treatment loop energy records are provided in Table S3.
The energy balance shows that hydraulic components are important in water treatment design. Although the UV-C lamp required 250 W, the pump and controller required 350 W and 50 W, respectively; together, the pump and controller accounted for 61.5% of the instantaneous treatment-loop load. Future optimization should therefore address pump selection, pipe head loss, filtration pressure drop, and batch treatment scheduling, in addition to UV-C lamp efficiency. The measured energy and hydraulic results are summarized in Table 1, and the corresponding PV to UV-C energy balance is shown in Figure 2.
Table 1.
Measured PV output, UV-C treatment-loop demand and hydraulic throughput under the monitored operating condition.
Figure 2.
PV to UV-C treatment loop energy balance. Direct PV and battery mediated PV values are allocated estimates based on the daytime dominant operating profile, not fixed inverter-reported ratios. The UV-C loop demand represented 4.22% of the measured daily PV AC output.
An engineering-scale apparent fluence estimate was calculated using the 10 cm nominal reactor diameter, 250 W electrical input, and 1.3 m3 h−1 flow rate. The electrical input normalized estimate before optical correction was 1731 mJ cm−2. After applying the mean UVT254 of 35% and an assumed lumped UV delivery coefficient of 0.10–0.30, the UVT254-adjusted apparent estimate was 60.6–181.7 mJ cm−2; across the observed UVT254 range of 25–50%, the corresponding range was 43.3–259.6 mJ cm−2. These values are engineering estimates only and should not be interpreted as validated delivered UV dose or reduction equivalent dose [27,28]. Consequently, the microbial results below are interpreted as observed field indicator reductions under the tested conditions, not as a validated fluence–response relationship.
3.3. Microbial Indicator Log10 Reduction Under Low UVT254 and Moderate Turbidity
Six drainage solution disinfection tests were performed during the crop growth period after fruit set (n = 6). Each test consisted of actual sampling before UV-C treatment and actual sampling after UV-C treatment, followed by laboratory analysis by NICEM under accredited testing procedures. Drainage solution temperature during the tests was 19–22 °C, and the nominal hydraulic residence time in the irradiated section was ≤1 min. Untreated drainage solution contained quantifiable culturable molds/fungal propagules, culturable aerobic bacteria, and total coliform bacteria. Because no untreated circulation time control was included, reductions are reported as paired before/after field reductions associated with operation of the UV-C loop.
Mean log10 reductions were 1.15 ± 0.09 for culturable molds/fungal propagules and 1.64 ± 0.09 for culturable aerobic bacteria. Paired t-tests on log10 transformed before- and after-treatment counts indicated significant reductions for both indicators (p < 0.001). Wilcoxon signed rank tests gave the same directional conclusion (one-sided p = 0.0156). For total coliform bacteria, all post-treatment samples were reported as ND with a reporting limit of 1 CFU 100 mL−1; the detection limit-based lower-bound log10 reduction was at least 2.69 ± 0.17. These results demonstrate microbial indicator reduction, but not complete sterilization or pathogen specific validation because culturable molds/fungal propagules and aerobic bacteria remained detectable in post-treatment samples and no target plant pathogen or foodborne pathogen challenge test was performed. Event level count data were moved from the main text to Table S1 to avoid redundancy.
Homogeneous group letters confirmed that pre- and post-treatment microbial counts belonged to different groups for culturable molds/fungal propagules and culturable aerobic bacteria at α = 0.05. For total coliform bacteria, the post-treatment group is reported as a censored ND group because all post-treatment values were below the method reporting limit. The results are summarized in Table 2.
Table 2.
Summary of log10 transformed microbial indicator reductions across six post-fruit set sampling events.
Exploratory correlation interpretation was limited by the data structure. Microbiological reductions could be paired within sampling events, but UVT254, turbidity, pH/EC, and nutrient measurements were not complete event-matched observations for all samples. Therefore, no numerical correlation coefficient between microorganism count and optical/nutrient variables is presented, and the manuscript now identifies complete event-paired correlation analysis as a scale-up validation requirement rather than an unsupported result.
3.4. Nutrient Solution Stability and Water Reuse Implications
The drainage solution had low UVT254 and moderate turbidity, indicating that prefiltration and routine optical monitoring are necessary for stable UV-C performance. NICEM-accredited water quality analysis and field operation records indicated no operationally significant nutrient solution change between the solution before UV-C treatment and the solution after UV-C treatment. This finding is consistent with the intended role of UV-C as a physical disinfection process: it reduces the microbial load without chemical disinfectant dosing or fertilizer recipe modification. However, the statement is operational rather than a complete quantitative ion-balance claim; repeated reuse still requires direct pH, EC, and ion monitoring.
This point is important for agricultural water reuse. In Dutch recirculating greenhouse practice, UV-based drain water disinfection has been used as part of nutrient solution reuse systems, including medium pressure UV treatment of drain water before reuse [14,15,16]. Therefore, under appropriate exposure and monitoring conditions, UV-C treatment itself is not expected to be a major cause of nutrient composition change or growth inhibition. Any long-term agronomic risk in repeated drainage solution reuse is more likely to arise from ion accumulation, ion depletion, salinity, substrate exchange, or biofilm and tank hygiene, rather than from short UV-C exposure itself.
Before treated drainage solution is returned to the crop over multiple cycles, pH and EC should be corrected, and periodic ion analysis should be performed. For strawberry, Na+ and Cl− accumulation, K/Ca balance, Ca/Mg balance, and fruiting stage nutrient demand are particularly important [3,4,40,41].
4. Discussion
4.1. Relevance to Agricultural Water Reuse
The Sokcho system should be understood as a field scale water reuse support system in which PV electricity reduces the operating energy burden of UV-C sanitation. The primary measured contribution analyzed in this manuscript is electrical power for the drainage solution treatment loop. The windbreak-type PV installation is described only as part of the site-specific greenhouse context because structural design in the region must consider wind exposure. Wind-speed reduction, greenhouse heat loss reduction, and windbreak performance were outside the objective and were not analyzed.
This design aligns with the farm-level problem that motivated this study. Korea is simultaneously encouraging renewable energy use in protected horticulture and the dissemination of circular hydroponic systems for water and fertilizer savings [6,7,8,9]. However, drainage solution reuse can be avoided at the farm level because of the initial investment required for tanks, return plumbing, nutrient correction, sensors, and sanitation equipment, as well as the additional electricity needed for pumps and UV treatment. In this context, the daily treatment loop demand of 1.625 kWh day−1, equivalent to 4.22% of measured daily PV AC output, shows that a farm-integrated PV facility can support on-farm water treatment under the tested operating schedule.
4.2. UV-C Performance Under Low UVT254 and Moderate Turbidity
The use of a 250 W UV-C reactor was justified for this field test because the tested drainage solution was not optically clear. A mean UVT254 of approximately 35% and a mean turbidity of approximately 20 NTU indicate substantial UV attenuation and possible particle shielding. Under such conditions, lower power UV units designed for clearer hydroponic solutions may not provide enough microbial reduction during short residence times.
The present findings are consistent with prior UV-C studies in agricultural and recirculating water systems, which show that microbial inactivation is strongly affected by turbidity, UVT254, pH, nutrient composition, and target microorganism [17,18,19,20,21,22]. In particular, work on agricultural waters with differing turbidity and on hydroponic nutrient solutions has emphasized that field water matrices can reduce UV effectiveness compared with clearer laboratory water [18,19,21,22]. The low UVT254 strawberry drainage matrix in this study therefore supports reporting the results as field indicator reductions under tested conditions rather than as a generalized UV dose–response model.
Recent nutrient solution studies provide useful benchmarks for interpreting the magnitude of these reductions. In recirculating hydroponic systems, Moore et al. reported significant 1.4–1.5 log10 CFU mL−1 reductions of generic E. coli in nutrient solution after 254 nm UV-C treatment [19], which is close to the 1.64 log10 reduction observed here for culturable aerobic bacteria. Mendoza et al. reported that 5, 10, and 15 s UV-C exposures reduced Listeria monocytogenes in strawberry nutrient solution from 5.70 log10 CFU mL−1 to 4.50, 2.19, and 1.75 log10 CFU mL−1, respectively, corresponding to approximate reductions of 1.20, 3.51, and 3.95 log10 [18]. Those longer exposure nutrient solution reductions exceed the 1.15–1.64 log10 reductions observed in the present field drainage matrix, whereas the total coliform lower bound of ≥2.69 log10 falls between the 10 s and 15 s nutrient solution benchmarks. Adhikari et al. further showed that, in agricultural water with a turbidity of 10.93–23.32 NTU, lower turbidity increased E. coli reduction by more than 2.15 log10 units [21]. Thus, the relatively moderate reductions in the present study are consistent with the low UVT254 (25–50%), moderate turbidity (5–30 NTU), short residence time, and heterogeneous substrate-derived drainage matrix rather than with failure of UV-C treatment.
The observed reductions support the use of a higher power UV-C reactor for rapid microbial risk reduction in substrate-derived strawberry drainage solution. However, the findings should be described as microbial indicator reduction, not sterilization. UV-C treatment has no residual disinfectant effect, and microorganisms embedded in particles or biofilms downstream of the UV-C reactor can recontaminate the solution. A practical water reuse system should therefore combine UV-C treatment with prefiltration, tank sanitation, line cleaning, and microbial monitoring over the crop cycle.
The revised methodology was interpreted against specific standards and accreditation frameworks. ISO/IEC 17025:2017 defines the competence, impartiality, and consistent operation framework for testing and calibration laboratories; NICEM’s KOLAS accreditation (KT 375) places the reported analyses within this internationally recognized laboratory quality framework. For water sampling and routine water quality support measurements, the manuscript references ISO 5667-3:2024 for preservation/handling of water samples, ISO 10523:2008 for pH, ISO 7888:1985 for electrical conductivity, ISO 7027-1:2016 for turbidity, and ISO 8466-1:2021 for analytical calibration. For microbiological water analysis, ISO 19458:2006 addresses microbiological sampling, ISO 8199:2018 provides general culture-based examination requirements, ISO 6222:1999 provides a culturable microorganism colony count framework, and ISO 9308-1:2014/Amd.1:2016 covers membrane filtration enumeration of E. coli and coliform bacteria. For UV disinfection itself, ISO 20468-4:2021 provides performance evaluation guidance for UV disinfection in full scale water reuse systems, and ISO 16075-5:2021 addresses disinfection and equivalent treatments for irrigation reuse. Compared with these UV-performance frameworks, the present experiment should be regarded as a field indicator reduction test rather than a standards-validated UV disinfection performance test because the delivered UV dose was not validated by calibrated radiometry, biodosimetry, or reduction equivalent dose testing [29,30,31,32,33,34,35,36,37,38,39,42,43].
4.3. Nutrient Solution Composition During Reuse Oriented UV-C Treatment
A central water reuse concern in soilless culture is whether disinfection changes nutrient solution composition enough to affect crop growth. In the present system, NICEM-accredited water quality analysis and field operation records indicated no operationally significant change in nutrient solution composition between before and after UV-C treatment. This supports interpretation of the UV-C unit as a sanitation device rather than a nutrient adjustment device. The result is also consistent with commercial greenhouse practice in which UV-based systems are used for drain water disinfection before reuse, especially in Dutch recirculating greenhouse systems [14,15,16].
Nevertheless, nutrient management remains essential because recycling changes solution chemistry through plant uptake, evaporation, substrate exchange, precipitation, and accumulation of poorly absorbed ions. EC-based correction alone cannot identify individual ion accumulation or deficiency. Previous strawberry closed-loop studies emphasize that recycling can improve water and nutrient use efficiency, but excessive recycling or insufficient ion correction can reduce fruit size, disturb nutrient balance, or alter fruit quality [3,4]. Therefore, the absence of observed UV-C induced nutrient changes should not be interpreted as proof that repeated drainage solution reuse can be managed without pH/EC corrections and periodic ion analyses.
4.4. Limitations and Scope of Inference
This study should be interpreted as a field scale feasibility evaluation of UV-C microbial risk reduction and PV-assisted water treatment energy balance, not as a full season agronomic validation of closed-loop strawberry production. The system was normally non-recirculating and was operated in temporary circulation mode for the disinfection experiment. The microbiological data were derived from six post fruit set sampling events, and no samples were collected during vegetative growth, flowering, or late-season crop stages. Therefore, the data do not represent the full temporal range of drainage solution microbial communities.
The small sample size and lack of an untreated circulation control are central design constraints. Six paired events provide preliminary evidence of before/after changes but do not provide robust power to characterize seasonal variability. Because a parallel non-UV circulation control was not included under identical hydraulic conditions, this study cannot attribute the full observed reduction exclusively to UV-C; settling, handling, and tank circulation effects may have contributed. Consequently, the conclusions have been narrowed to preliminary field feasibility and should not be read as a validated causal estimate of UV-C-only disinfection performance.
This study also did not include a full season recirculating water balance, replicated reactor configurations, validated delivered dose measurement, or a crop yield comparison. The practical relevance of the work is therefore specific: it demonstrates how renewable electricity can reduce the sanitation energy burden of drainage solution reuse and how UV-C operations can reduce microbial indicators under field conditions, while broader farm adoption still depends on capital costs, nutrient corrections, labor, hydraulic designs, pathogen specific validation, and crop cycle performance.
The apparent fluence calculation should also be treated as an engineering estimate. Direct radiometry, biodosimetry, and reactor validation would be required to convert the present design calculation into a validated delivered dose or reduction equivalent dose [27,28]. Future experiments should pair each microbial sampling event with UVT254, turbidity, total suspended solids (TSS), dissolved organic carbon (DOC), flow rate, lamp age, quartz sleeve condition, and exact post-treatment counts from the laboratory certificate. Energy monitoring should also be expanded to include the PV monitoring date, daily irradiance, inverter AC output, battery state of charge, and storage efficiency. A screening-level economic analysis should estimate the annual UV-C electricity cost, PV offset value, fertilizer recovery value, and payback period for the reuse infrastructure. These items define the transition from field feasibility to deployable water reuse design.
Accordingly, this study does not claim full compliance with the validation package expected for a standardized UV disinfection performance test under ISO 20468-4:2021. A standards-oriented follow-up should include event-paired UVT254, turbidity/TSS/DOC, calibrated UV irradiance or biodosimetry, lamp output and age, quartz sleeve transmission/fouling checks, flow distribution/residence time verification, untreated circulation controls, and predefined acceptance criteria for target microorganisms [42,43].
Because this manuscript has thematic proximity to recent overlapping-author strawberry vertical farming studies, its scope was explicitly separated from those publications. The two-tier LED aeroponic water use efficiency study reported system water balance, water use efficiency, yield, and 30% UV-C treated recovered solution reuse in a closed indoor aeroponic platform, whereas the partial recirculation study compared 0%, 30%, and 50% recirculation and nutrient solution drifts over two cultivation years in a 25 m2 480-plant indoor aeroponic system [44,45]. In contrast, the present dataset was generated in a Sokcho natural light substrate culture greenhouse and focuses on the electrical demand and PV coverage of a dedicated UV-C drainage treatment loop, UVT254/turbidity constraints, and paired before/after microbial indicator reductions in substrate derived drainage solution. No yield, water use efficiency, nutrient drift, or recirculation ratio dataset from those indoor aeroponic studies was reused here.
4.5. Validation Priorities for Scale-Up
To prevent overinterpretation, the main methodological vulnerabilities were converted into explicit validation requirements. Table 3 summarizes how each issue was handled in the revised manuscript and what additional evidence would be required before the system is used as a generalized UV-C dose response model, a closed-loop agronomic recommendation, or an economic investment case.
Table 3.
Scope of inference and evidence required for scale-up validation.
5. Conclusions
This field feasibility study shows that a farm-integrated PV facility can supply the electrical demand of a UV-C drainage solution treatment loop under the tested operating schedule. The 650 W treatment loop consumed 1.625 kWh day−1 during 2.5 h day−1 operation, equivalent to 4.22% of the measured daily PV AC output from the 11.25 kWp vertical windbreak-type PV facility. The energy result supports the practical feasibility of coupling renewable electricity with on-farm drainage solution sanitation.
The microbiological results indicate measurable log10 reductions in an optically constrained strawberry drainage matrix. Under an UVT254 of 25–50% and turbidity of 5–30 NTU, UV-C operation produced mean reductions of 1.15 log10 for culturable molds/fungal propagules and 1.64 log10 for culturable aerobic bacteria, while total coliform bacteria were reduced to ND with a lower-bound reduction of at least 2.69 log10. These findings support UV-C treatment as a microbial risk reduction step, not as complete sterilization or pathogen specific validation.
The broader implication is that PV-assisted UV-C sanitation can be one enabling component of drainage solution reuse in protected strawberry production, provided that it is integrated with prefiltration, pH/EC correction, ion monitoring, tank and line hygiene, and crop cycle validation. Because sampling was limited to six post-fruit-set events and no untreated circulation control was included, the present evidence should be interpreted as preliminary field feasibility rather than full-season agronomic, economic, or delivered dose validation.
Future validation should follow the ISO 20468-4:2021 type UV-performance evaluation and ISO 16075-5:2021-type irrigation reuse/disinfection guidance before the system is claimed as a standards-validated UV disinfection process [42,43].
Supplementary Materials
The following supporting information can be downloaded at: https://www.mdpi.com/article/10.3390/w18141754/s1, Figure S1, Site layout and vertical windbreak type PV facility; Figure S2, UV-C reactor and drainage-solution reuse loop; Table S1, Microbial indicator count summaries for paired pre and post UV-C drainage solution samples; Table S2, pH, EC, turbidity and UVT254 water quality record status before and after UV-C treatment; Table S3, Measured PV AC output and UV-C treatment-loop energy consumption under the monitored operating condition; Table S4, Detailed consolidated characteristics of the greenhouse, vertical windbreak-type PV facility and UV-C drainage solution treatment loop.
Author Contributions
Conceptualization, J.Y.L.; methodology, J.-S.Y., Y.H.I., and C.K.L.; validation, J.Y.L., J.-S.Y., and Y.H.I.; formal analysis, J.-S.Y., Y.H.I., and C.K.L.; investigation, J.Y.L. and J.-S.Y.; resources, Y.H.I. and C.K.L.; data curation, J.Y.L., Y.H.I., and C.K.L.; writing—original draft preparation, J.Y.L.; writing—review and editing, J.-S.Y.; visualization, J.Y.L. and J.-S.Y.; supervision, J.Y.L.; project administration, Y.H.I.; funding acquisition, Y.H.I. All authors have read and agreed to the published version of the manuscript.
Funding
This research was funded by the Rural Development Administration under the project “Development of Small-Scale Photovoltaic Power Generation and Storage Technology for Agricultural Application” (RS-2024-00399318). Additional support was provided by the Korea Institute of Planning and Evaluation for Technology in Food, Agriculture and Forestry (IPET) and the Korea Smart Farm R&D Foundation (KosFarm) through the Smart Farm Innovation Technology Development Program, funded by the Ministry of Agriculture, Food and Rural Affairs (MAFRA), the Ministry of Science and ICT (MSIT), and the Rural Development Administration (RDA) (RS-2024-00400250) and was supported by KIST Internal Grant (26Z0011).
Data Availability Statement
The original contributions presented in this study are included in the article and Supplementary Materials. Trial-level microbial counts used for the reduction calculations are reported in Table S1. Additional supporting data, including NICEM-accredited water quality records, available nutrient solution monitoring records, PV energy monitoring records and equipment specifications, can be made available by the corresponding author upon reasonable request, subject to institutional data management requirements. The PV output records, UVT254/turbidity observations, and microbial before/after dataset reported here were generated from the Sokcho substrate greenhouse drainage treatment trial and were not reused from the overlapping author indoor aeroponic strawberry recirculation or water use efficiency studies.
Acknowledgments
This work was supported by the Rural Development Administration, IPET, KosFarm, MAFRA, MSIT, and RDA through the projects listed in the Funding section. During manuscript preparation, OpenAI ChatGPT (GPT-5.6 Pro, accessed 15 July 2026) was used only to improve organization, readability, and formatting. The authors reviewed, edited, and verified the scientific content and take full responsibility for the manuscript.
Conflicts of Interest
The authors declare no conflicts of interest.
References
- Kumar, R.R.; Cho, J.Y. Reuse of hydroponic waste solution. Environ. Sci. Pollut. Res. 2014, 21, 9569–9577. [Google Scholar] [CrossRef] [Scilit] [PubMed]
- Ahn, T.I.; Yang, J.-S.; Park, S.H.; Im, Y.-H.; Lee, J.Y. Nutrient recirculating soilless culture system as a predictable and stable way of microbial risk management. J. Clean. Prod. 2021, 298, 126747. [Google Scholar] [CrossRef] [Scilit]
- Lim, M.Y.; Kim, S.H.; Roh, M.Y.; Choi, G.L.; Kim, D. Nutrient dynamics and resource-use efficiency in greenhouse strawberries: Effects of control variables in closed-loop hydroponics. Horticulturae 2024, 10, 851. [Google Scholar] [CrossRef] [Scilit]
- Kim, M.; Rabbani, M.G.; Jeong, Y.; Zebro, M.; Baek, J.; Choi, K.-Y. Drainage recycling ratio influences yield, fruit quality, and antioxidant properties of Korean strawberry ‘Seolhyang’. Plants 2025, 14, 2984. [Google Scholar] [CrossRef] [Scilit] [PubMed]
- Son, J.; Kang, T.; Park, M.; Kong, M.; Choi, H.-S. Variation in pathogenic organisms as affected by using hydroponic nutrient wastewater in horticultural facilities. Agriculture 2022, 12, 1340. [Google Scholar] [CrossRef] [Scilit]
- Ministry of Agriculture, Food and Rural Affairs (MAFRA). 2026 Smart Agriculture Promotion Implementation Plan; MAFRA: Sejong, Republic of Korea, 2026. Available online: https://www.mafra.go.kr/bbs/home/791/594105/download.do (accessed on 1 July 2026).
- Ministry of Agriculture, Food and Rural Affairs (MAFRA). Guidelines for the Agricultural Energy Use Efficiency Improvement Program: Renewable Energy Facilities; MAFRA: Sejong, Republic of Korea, 2025. Available online: https://www.mafra.go.kr/bbs/home/798/574274/artclView.do (accessed on 1 July 2026).
- Rural Development Administration (RDA). Expanding Circular Hydroponics for Environmental Conservation and Resource Savings; RDA: Jeonju, Republic of Korea, 2023. Available online: https://www.rda.go.kr/board/board.do?boardId=farmprmninfo&dataNo=100000792190&mode=updateCnt&prgId=day_farmprmninfoEntry (accessed on 1 July 2026).
- Rural Development Administration (RDA). Reusing Fertilizer Solution: Circular Hydroponics Gains Attention; RDA/Korea Policy Briefing: Seoul, Republic of Korea, 2026. Available online: https://www.korea.kr/briefing/pressReleaseView.do?newsId=156761615 (accessed on 1 July 2026).
- R2025-11; Policy Tasks for Persistence in Inorganic Fertilizer Industry. Korea Rural Economic Institute (KREI): Naju, Republic of Korea, 2025. Available online: https://repository.krei.re.kr/handle/2018.oak/32653 (accessed on 1 July 2026).
- Vos, R.; Glauber, J.; Hebebrand, C.; Rice, B. Global shocks to fertilizer markets: Impacts on prices, demand and farm profitability. Food Policy 2025, 133, 102790. [Google Scholar] [CrossRef] [Scilit]
- Hebebrand, C.; Glauber, J.W. The Russia-Ukraine War after a Year: Impacts on Fertilizer Production, Prices, and Trade Flows. In The Russia-Ukraine Conflict and Global Food Security; International Food Policy Research Institute (IFPRI): Washington, DC, USA, 2023; Available online: https://ideas.repec.org/h/fpr/ifpric/9780896294394_08.html (accessed on 1 July 2026).
- International Food Policy Research Institute (IFPRI). Global Fertilizer Trade 2021–2023: What Happened After War-Related Price Spikes? IFPRI: Washington, DC, USA, 2024; Available online: https://www.ifpri.org/blog/global-fertilizer-trade-2021-2023-what-happened-after-war-related-price-spikes/ (accessed on 1 July 2026).
- Van Os, E.A. Closed soilless growing systems: A sustainable solution for Dutch greenhouse horticulture. Water Sci. Technol. 1999, 39, 105–112. [Google Scholar] [CrossRef] [Scilit]
- Voogt, W. The road to sustainable water and nutrient management in soil-less culture in Dutch greenhouse horticulture. In Proceedings of the NUTRIHORT: Nutrient Management, Nutrient Legislation and Innovative Techniques in Intensive Horticulture, Ghent, Belgium, 16–18 September 2013. [Google Scholar]
- Enthoven, N.L.M.; Zwartveld, D. Reducing emission of nutrients and plant protection agents from horticulture with advanced oxidation by hydrogen peroxide and medium pressure UV light. Acta Hortic. 2014, 1034, 71–76. [Google Scholar] [CrossRef] [Scilit]
- Perez, S.L.; Ferro, R.B.; Corrêa, B.; Casarin, R.; Corrêa, T.Q.; Blanco, K.C.; Bagnato, V.S. Enhanced vegetable production in hydroponic systems using decontamination of closed circulating fluid. Sci. Rep. 2024, 14, 602. [Google Scholar] [CrossRef] [Scilit] [PubMed]
- Mendoza, J.; Lituma, I.; Fontenot, K.; Adhikari, A. Effect of pH, nutrient composition, and UV-C light treatment on Listeria monocytogenes in hydroponic nutrient solutions. J. Food Prot. 2025, 88, 100632. [Google Scholar] [CrossRef] [Scilit] [PubMed]
- Moore, M.; Yang, T.; Douraki, M.J.; Rivard, C.; Pliakoni, E.; Nwadike, L.; Bhullar, M. Effect of ultraviolet water treatment on survival and growth of Escherichia coli in recirculating hydroponic systems. J. Food Prot. 2025, 88, 100575. [Google Scholar] [CrossRef] [Scilit] [PubMed]
- Adeniyi, A.O.; Jimoh, M.O. Decontamination potential of ultraviolet type C radiation in water treatment systems: Targeting microbial inactivation. Water 2024, 16, 2725. [Google Scholar] [CrossRef] [Scilit]
- Adhikari, A.; Parraga Estrada, K.J.; Chhetri, V.S.; Janes, M.; Fontenot, K.; Beaulieu, J.C. Evaluation of ultraviolet (UV-C) light treatment for microbial inactivation in agricultural waters with different levels of turbidity. Food Sci. Nutr. 2020, 8, 1237–1243. [Google Scholar] [CrossRef] [Scilit] [PubMed]
- Haley, O.C.; Zhao, Y.; Hefley, T.; Britton, L.L.; Nwadike, L.; Rivard, C.; Bhullar, M. Developing a decision-making tool for agricultural surface water decontamination using ultraviolet-C light. J. Food Prot. 2023, 86, 100129. [Google Scholar] [CrossRef] [Scilit] [PubMed]
- Wang, X.; Fang, W.; Zhao, Z. Design of UVA ultraviolet disinfection system for nutrient solution residual liquid and development of microbial online monitoring system. Sustainability 2023, 15, 173. [Google Scholar] [CrossRef] [Scilit]
- Ghosh, A. Nexus between agriculture and photovoltaics (agrivoltaics, agriphotovoltaics) for sustainable development goal: A review. Sol. Energy 2023, 266, 112146. [Google Scholar] [CrossRef] [Scilit]
- T13-29:2025; Dual Land Use for Agriculture and Solar Power Production: Overview and Performance of Agrivoltaic Systems. International Energy Agency Photovoltaic Power Systems Programme (IEA PVPS). 2025. Available online: https://iea-pvps.org/key-topics/dual-land-use-agriculture-solar-power-production/ (accessed on 1 July 2026).
- Honningdalsnes, E.H.; Marstein, E.S.; Lindholm, D.; Bonesmo, H.; Riise, H.N. Wind sheltering in vertical agrivoltaics can increase crop yields: A modeling study for Northern Europe. Energy Nexus 2025, 19, 100516. [Google Scholar] [CrossRef] [Scilit]
- Bolton, J.R.; Linden, K.G. Standardization of methods for fluence (UV dose) determination in bench-scale UV experiments. J. Environ. Eng. 2003, 129, 209–215. [Google Scholar] [CrossRef] [Scilit]
- EPA 815-R-06-007; Ultraviolet Disinfection Guidance Manual for the Final Long Term 2 Enhanced Surface Water Treatment Rule. United States Environmental Protection Agency: Washington, DC, USA, 2006. Available online: https://www.epa.gov/system/files/documents/2022-10/ultraviolet-disinfection-guidance-manual-2006.pdf (accessed on 1 July 2026).
- National Instrumentation Center for Environmental Management (NICEM). Certification Status. Seoul National University, Republic of Korea. Available online: https://nicem.snu.ac.kr/about/certification.php (accessed on 1 July 2026).
- ISO/IEC 17025:2017; General Requirements for the Competence of Testing and Calibration Laboratories. International Organization for Standardization (ISO): Geneva, Switzerland, 2017. Available online: https://www.iso.org/standard/66912.html (accessed on 2 July 2026).
- ISO 5667-3:2024; Water Quality—Sampling—Part 3: Preservation and Handling of Water Samples. International Organization for Standardization (ISO): Geneva, Switzerland, 2024. Available online: https://www.iso.org/standard/82273.html (accessed on 2 July 2026).
- ISO 10523:2008; Water Quality—Determination of pH. International Organization for Standardization (ISO): Geneva, Switzerland, 2008. Available online: https://www.iso.org/standard/51994.html (accessed on 2 July 2026).
- ISO 7888:1985; Water Quality—Determination of Electrical Conductivity. International Organization for Standardization (ISO): Geneva, Switzerland, 1985. Available online: https://www.iso.org/standard/14838.html (accessed on 2 July 2026).
- ISO 7027-1:2016; Water Quality—Determination of Turbidity—Part 1: Quantitative Methods. International Organization for Standardization (ISO): Geneva, Switzerland, 2016. Available online: https://www.iso.org/standard/62801.html (accessed on 2 July 2026).
- ISO 8466-1:2021; Water Quality—Calibration and Evaluation of Analytical Methods—Part 1: Linear Calibration Function. International Organization for Standardization (ISO): Geneva, Switzerland, 2021. Available online: https://www.iso.org/standard/77139.html (accessed on 2 July 2026).
- ISO 19458:2006; Water Quality—Sampling for Microbiological Analysis. International Organization for Standardization (ISO): Geneva, Switzerland, 2006. Available online: https://www.iso.org/standard/33845.html (accessed on 2 July 2026).
- ISO 8199:2018; Water Quality—General Requirements and Guidance for Microbiological Examinations by Culture. International Organization for Standardization (ISO): Geneva, Switzerland, 2018. Available online: https://www.iso.org/standard/64151.html (accessed on 2 July 2026).
- ISO 6222:1999; Water Quality—Enumeration of Culturable Micro-Organisms—Colony Count by Inoculation in a Nutrient Agar Culture Medium. International Organization for Standardization (ISO): Geneva, Switzerland, 1999. Available online: https://www.iso.org/standard/28960.html (accessed on 2 July 2026).
- ISO 9308-1:2014/Amd.1:2016; Water Quality—Enumeration of Escherichia coli and Coliform Bacteria—Part 1: Membrane Filtration Method for Waters with Low Bacterial Background Flora—Amendment 1. International Organization for Standardization (ISO): Geneva, Switzerland, 2016. Available online: https://www.iso.org/standard/70094.html (accessed on 2 July 2026).
- Mielcarek, A.; Kłobukowska, K.; Rodziewicz, J.; Janczukowicz, W.; Bryszewski, K.Ł. Water nutrient management in soilless plant cultivation versus sustainability. Sustainability 2024, 16, 152. [Google Scholar] [CrossRef] [Scilit]
- Fathidarehnijeh, E.; Nadeem, M.; Cheema, M.; Thomas, R.; Krishnapillai, M.; Galagedara, L. Current perspective on nutrient solution management strategies to improve the nutrient and water use efficiency in hydroponic systems. Can. J. Plant Sci. 2024, 104, 88–102. [Google Scholar] [CrossRef] [Scilit]
- ISO 20468-4:2021; Guidelines for Performance Evaluation of Treatment Technologies for Water Reuse Systems—Part 4: UV Disinfection. International Organization for Standardization (ISO): Geneva, Switzerland, 2021. Available online: https://www.iso.org/standard/74248.html (accessed on 2 July 2026).
- ISO 16075-5:2021; Guidelines for Treated Wastewater Use for Irrigation Projects—Part 5: Treated Wastewater Disinfection and Equivalent Treatments. International Organization for Standardization (ISO): Geneva, Switzerland, 2021. Available online: https://www.iso.org/standard/72929.html (accessed on 2 July 2026).
- An, H.; Nam, J.W.; Lee, B.H.; Joung, K.H.; Park, G.S.; Oh, S.S.; Lee, J.Y. Water use efficiency in two-tier aeroponic vertical strawberry farming with LEDs. Hortic. Sci. Technol. 2026. online first. [Google Scholar] [CrossRef] [Scilit]
- An, H.; Nam, J.W.; Lee, B.H.; Joung, K.H.; Park, G.S.; Oh, S.S.; Lee, J.Y. Partial recirculation in two-tier indoor aeroponic strawberry: Yield-input trade-off and nutrient-solution drift. Horticulturae 2026, 12, 680. [Google Scholar] [CrossRef] [Scilit]

Disclaimer/Publisher’s Note: The statements, opinions and data contained in all publications are solely those of the individual author(s) and contributor(s) and not of MDPI and/or the editor(s). MDPI and/or the editor(s) disclaim responsibility for any injury to people or property resulting from any ideas, methods, instructions or products referred to in the content. |
© 2026 by the authors. Licensee MDPI, Basel, Switzerland. This article is an open access article distributed under the terms and conditions of the Creative Commons Attribution (CC BY) license.