Abstract
Village-level agricultural specialization in China is becoming increasingly important for rural development. However, existing knowledge of specialized agricultural villages (SAVs) based on singular assessment criteria and data describing static time points becomes insufficient in addressing multifaceted developmental questions today. We examined the long-term development patterns of SAVs in Anhui, China, with attributes from multiple angles, and explored how local factors affected SAV development across space and time using random forest regression. We found that as time elapsed, economic rationality drove specialized farmers closer to sale dependency and made SAVs more susceptible to market and economic factors, which builds upon previous findings analyzing SAVs at specific time points and consolidates the importance of market factors in the long-term development of SAVs. However, this susceptibility manifests differently in these two geographically contrasting regions north and south of Huai River. The northern SAVs received increased influences from market and economic factors, while the southern SAVs were continuously controlled by market and location factors. The dynamic spatial and temporal patterns of the two regions point to different dependencies, which emphasized local sales in the north and distant sales in the south. We propose that policies and strategies regarding SAV development accommodate these dynamics and address appropriate influencing factors accordingly.
1. Introduction
Agricultural production in the twentieth century was characterized by three major processes: intensification, specialization, and concentration [1]. Together, these three have greatly stimulated agricultural income in rural areas, accelerated production activities, and advanced land-use efficiency [2,3].
Agricultural specialization has been broadly defined as the process of concentrating resources such as labor and capital on producing a limited variety of goods [1]. Cases such as the One Village One Product project of Japan and the Saemaul Undong Movement in the Republic of Korea have shown specialization’s potential in reaching higher production efficiencies and incomes [4,5,6], revealing its potential in dealing with the rural decline now prevalent in many countries [7,8].
However, specialization takes on a different meaning in the Chinese context. While large-scale grain production is increasing in size and quantity, most of the agricultural production in China is still being carried out by smallholder farmers [9]. This huge proportion of the farming practice has been operating under an abundant labor force and scarce available land resources. This, coupled with the farmers’ need to maximize profit, the diverse geographical environment, and the sub-regional market, serve as the breeding ground for small-scale agricultural specialization.
Meanwhile, agricultural specialization in China was also shaped by traditions as well as economic and political development. In traditional rural China, a village is the remnant of the historical patriarchal lineage [10] and therefore maintains a tighter bond than the mere combination of geographical relatedness and collective economic activities. It is both a functional and hierarchical unit in Chinese society. Ever since the Reform and Opening-up, the household responsibility system empowered farmers with more control over their cultivation choices, which became increasingly affected by market and economic elements. Additionally, as certain households begin to savor the fruit of increased income from alternative cultivation such as cash crops, others in the village may choose to follow. The result is village-level specialization (specialized agricultural villages, SAVs). With reference to the relevant study [11], this study considers SAVs as villages in which 65% of farm households are commercially engaged in one or more agricultural production or service, such that the output constitutes the bulk of the village’s economic output.
Whereas small-scale agricultural specialization elsewhere usually takes the form of estates or farms dedicated to the production and sale of fine wine or cheese [12,13], SAVs in China predominantly produce vegetables, coarse cereals, and fruits [14]. Here, an SAV is defined as when most village households engage in one or more interrelated agricultural produce (non-staple food) or service activities [15]. By the end of 2016, there were 60,473 SAVs in China, 2398 of which had economic incomes of more than USD 15 million, and the rural per capita disposable income was USD 2106 in the SAVs, 12.2% higher than the national average of USD 1850. These villages employed 17.46 million rural households, accounting for 80.4% of the total households in these SAVs [16].
The growing importance of SAVs in China calls for more research into the development of SAVs and the underlying drivers. However, the uniqueness of the scale and form of Chinese SAVs separates them from cases found in other countries, impeding our ability to draw theoretical and practical guidance from studies outside the Chinese context. On the other hand, while studies analyzing SAVs in China did so at various scales [17], most were based on cross-sectional data to examine SAVs at a particular time. However, as Chinese rural areas are undergoing rapid transformations, particularly in the market and technological aspects, the analysis of SAVs at static points in time can hardly cover their changing trends. Thus, while these studies revealed how various factors such as geography, market, and transportation affected the SAVs, they lacked validation at longer temporal scales. Questions such as how the multiple drivers of SAV development change over time, and whether new factors are brought in by rural transformations are still open and are becoming increasingly important for understanding the SAVs’ development patterns and mechanisms in China.
In this study, we used data from SAVs in continuous development gathered from Anhui Province, China over a ten-year period (2010–2019), and integrated multiple factors (e.g., terrain, resources, location, market, and economic data) using random forest regression (RFR) to analyze the changing pattern and the driving factors during the development stages of the SAVs. While being a traditional agricultural province, Anhui stretches across northern and southern China, and has diverse geography (plain in the north, hilly and mountainous terrains in the south) and climate (warm-temperate in the north, subtropical in the south). It provides a good combination of diversification and representativeness such that the findings based on the SAVs here can be both broad and extrapolatable to other underdeveloped inland areas.
2. Study Area and Method
2.1. Study Area
Our study area is in Anhui, a major agricultural province and a typical inland area in east-central China. The agricultural economy plays an essential role in the development of Anhui. In 2019, its agricultural output value was USD 45.1 billion, and per capita Gross Domestic Product (GDP) was USD 8067.1 [18].
The Huai River, part of the Qinling–Huai River geographical and climatic dividing line that separates northern and southern regions of China, cuts through Anhui and divides it into the Huai-bei (northern, dominated by the Huai River Plain) and Huai-nan (southern, the Yangtze River Plain and the mountainous south) regions (Figure 1). These two regions on the opposite sides of the Huai River hold clear differences in natural conditions, geographical features, agricultural production, and cultural traditions. Specifically:
- (1)
- The Qinling-Huai River line roughly coincides with the zero-degree line of average temperature in January, which makes the area north of the Huai River more susceptible to winter frost, while the south is protected by hills and mountains. This leads to differences in accumulative temperature between the north and the south, which translates to differences in crop types.
- (2)
- The Qinling-Huai River line also roughly coincides with the annual precipitation line of 800 mm, which divides the province into wet and dry regions. The north of the Huai River is semi-humid while the south is humid, which leads to the dry-field cultivation type in the north (mainly winter wheat Triticum aestivum, and summer maize Zea mays) and the water-field cultivation type in the south (mainly rice, Oryza sativa).

Figure 1.
Study area: Anhui Province in China.
Figure 1.
Study area: Anhui Province in China.

2.2. Quantifying the Long-Term Development of SAVs
The SAV data from 2010 to 2019 were provided by the Department of Agriculture and Rural Affairs of Anhui Province, and included the names, leading industries, output value, household number, and per capita disposable income of the villages. We first excluded villages that were experiencing decreasing output values. Then, to better represent continuous development, we balanced the duration of the SAVs with their matching proportions. Specifically, the highest number of SAVs that lasted no less than five years from any given year in 2010–2019 was 732 (from 2015–2019). When we moved the duration of the SAVs to six years, the number dropped steeply to 45 (from 2014–2019). We thus ran with the 732 SAVs from 2015–2019. These 732 SAVs covered most of the specialization types (greater than 50%), but to increase representativeness, we excluded 50 SAVs from various types that constituted less than 10% of the total number, which resulted in 682 SAVs for our subsequent analysis. These SAVs included specialized fruit villages (fru-SAV), specialized vegetable villages (veg-SAV), specialized coarse cereal village (cer-SAV), specialized tea villages (tea-SAV), and specialized livestock villages (liv-SAV), and their respective numbers were 247, 139, 132, 84, and 80. Therefore, we define the long-term development of an SAV as an SAV existing for more than five years in this study. Then, we extracted the spatial information of these SAVs from Anhui cadastral data (Anhui Provincial Land and Resources Survey and Survey and Planning institute) referencing their names.
Based on existing studies [19,20] and the definition of the SAV development indicators provided by the Ministry of Agriculture and Rural Affairs of China [16], we constructed our SAV development indicator using factor analysis [21] with three variables: the output value of SAVs, the farmer specialization ratio, and the income of the farmers in the SAV. The output value of SAVs depicts the total economic output; the specialization ratio within an SAV was calculated as the ratio of specialized farmers to the total number of farmer households. The farmers’ income was the per capita disposable income. We performed the FA with the standardized transformations of the three variables. The SAV development indicators were further split into five sub-categories: DIfru (for fru-SAV), DIveg (for veg-SAV), DIcer (for cer-SAV), DItea (for tea-SAV), and DIliv (for liv-SAV). Their respective DIs were calculated based on FA results as follows:
where I1, I2, and I3 represent the standardized output, the specialization ratio, and the farmer income of SAVs, respectively, and a, b, and c are the coefficients of each of the standardized variables (see Table 1).
DI = a × I1 + b × I2 + c × I3

Table 1.
Component score coefficient matrix of factor analysis.
2.3. Defining the Factors and the Underlying Variables
We constructed a series of indices covering the terrain, resource, location, market, and economy of SAVs (Table 2) based on previous studies that depict the development of SAVs and the underlying drivers [14] and considering the available data. Specifically, terrain was broken down into elevation and slope, both of which affect crop growth. The higher the elevation and greater the slope, the more difficult it is for crops to grow [22]. The resource indicator was broken down into spatial distance from SAV to river network, precipitation, and soil quality to reflect water and soil resource availability. Location was broken down into the Road Network Distance (RND) from SAV to the road network, the RND from SAV to county, the RND from SAV to city, and the RND from SAV to the highway intersection to reflect traffic accessibility and the SAV’s distance to the city. The transportation cost of agricultural products is positively associated with these distances. Market was broken down into the county urbanization population, the prefecture-level urban population, the county urbanization rate, the prefecture-level urbanization rate, and the disposable income of urban residents in the county to reflect market size, supply and demand, and consumption levels. The economic factor was broken down into the gross production value of the county, gross production value of the city, the number of agricultural enterprises in the county, and the number of agricultural enterprises in prefecture-level cities to reflect the total output value and agricultural investments. Market and economic factors tend to have positive effects on SAV development [14,22].
Table 2.
Indices and variables accounting for SAV development.
We selected the variables after testing for multicollinearity. To ensure that each first-order factor was represented by at least one variable, we set VIF ≤ 5 as the selection criteria, arriving at thirteen second-order variables (Table 2).
The thirteen variables were calculated using various sources and methods. Terrain variables (elevation and slope) were calculated based on SRTM DEM 30 m data (Resource and Environment Data Cloud Platform of Chinese Academy of Sciences), using the zonal statistics as a table tool window analysis (2.51 km2 as the window size) in ArcGIS10.7 (Esri, Redlands, CA, USA). For the resource variables, distance to river was calculated based on Anhui’s five-level river data (Anhui Provincial Land and Resources Survey and Planning Institute) using the near tool of ArcGIS10.7 (Esri, Redlands, CA, USA), precipitation and soil quality were calculated by the yearly average precipitation data of Anhui Province (National Meteorological Data Center of China) and soil quality data of Anhui Province (Land-Atmosphere Interaction Research Team of Sun Yat-sen University) in the zonal statistics as a table tool of ArcGIS10.7 (Esri, Redlands, CA, USA). The location variables were calculated based on Anhui’s road network data (national road, provincial road, and county road) from Anhui Provincial Land and Resources Survey and Planning Institute, and we utilized the network analysis tool of ArcGIS10.7 (Esri, Redlands, CA, USA) to calculate the RNDs from SAVs to the respective sites. Market and economy variables were gathered from the statistical yearbooks of the relevant counties.
2.4. Methodology
2.4.1. Kernel Density Estimation
Kernel density estimation is a non-parametric method used to estimate the specified feature density in an area [23]. It is an important method to characterize the spatial pattern of geographic events and has been widely applied in geography, ecology, and epidemiology [24,25]. We used this method to analyze the spatial pattern of SAVs.
where is the density value of the estimated point (x,y); h represents the width of a measurement window (also called the kernel bandwidth); n is the number of point events within a specific bandwidth range, meaning the number of SAVs within a certain distance in this study; is the distance between the incident point i and the location (x,y); K is a density function that describes the contribution of point i changing with the changing of ; δ is a constant; and f′ represents the second derivative of the kernel function.
2.4.2. Random Forest Regression Model
Random forest regression (RFR) is a natural non-linear statistical method that was formed based on random sampling learning and feature selection [26]. The RFR method has been widely used in simulating the dynamic distribution of the population [27], analyzing PM2.5 concentration [28], etc. Compared with the standard regression models (such as multiple linear regression and logistic regression), RFR excels at ensuring high model accuracy, reporting variable importance, and avoiding over-fitting. It is suitable for dealing with complex geographic problems [26]. We ran the RFR in the scikit-learn package of Python 3.8.6 [29] to explore the influences of terrain, resources, location, market, and economic factors on the development of SAVs. First, the frequency of occurrence of each variable was counted and ranked from high to low, then the variable with the highest frequency at each step was selected as a critical variable in the development index of SAV. We also applied root mean square error (RMSE) and coefficient of determination (R2) to evaluate the accuracy of RFR (Equations (5) and (6)). A larger R2 and smaller RMSE translate to a higher RFR accuracy.
where represents the actual value, is the predicted value of RFR, is the average value of the sample, and n is the number of samples.
3. Results
3.1. Changing Patterns of SAV Development
We quantified and generalized the development for the five types of SAVs in 2015–2019 to roughly three major patterns (Figure 2). The continuously rising SAVs, fru-SAV and veg-SAV, continued to develop throughout the study period (Figure 2a,b), and their annual growth rates held steady around 0.1. The plateaued SAVs, tea-SAV and liv-SAV, thrived at first but plateaued after 2017, and their annual growth rates dropped from around 0.1 in 2015 to 0.01 in 2019 (Figure 2d,e). The rising but fluctuating SAV, cer-SAV, was a special case because it demonstrated considerable fluctuations, showing zero growth in 2017 but rapid growth in 2018 (Figure 2c).
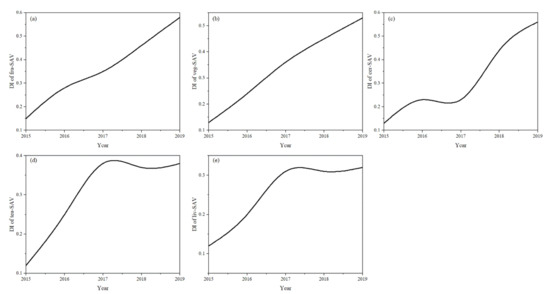
Figure 2.
Long-term development indices of fru-SAV (a), veg-SAV (b), cer-SAV (c), tea-SAV (d) and liv-SAV (e).
3.2. The Spatial Distribution of Long-Term SAVs
The kernel density of the development indices shows SAVs aggregating in three areas, which were the Huai River plain to the north of Huai River, the hill–plain transition area to the south of Huai River, and the hill–mountain transition zone further down south (Figure 3a). The numbers of continuous SAVs to the north and south of Huai river were 363 and 319, respectively. A breakdown of the different types of SAVs shows that fru-SAV and cer-SAV are mainly distributed in the northern plains, with minor distributions in the plain–hill transition area in the middle (Figure 3b,d). The veg-SAV is mainly distributed in the plain–hill transition area in the middle, with minor distributions in the northern plains and the southern hill–mountain transition area (Figure 3c). The tea-SAV and liv-SAV are mainly distributed in the southern hill–mountain transition areas (Figure 3e,f).
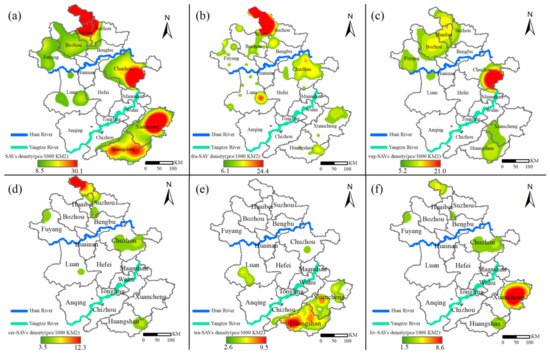
Figure 3.
The spatial distribution of SAVs (a), fru-SAV (b), veg-SAV (c), cer-SAV (d), tea-SAV (e) and liv-SAV (f).
Using kernel density distribution as a selection criterion, we partitioned the SAVs in their highest distributed areas for better representation of their attributes, which was used for the subsequent RFR analysis. The respective density thresholds for the fru-SAV, veg-SAV, cer-SAV, tea-SAV, and liv-SAV were 16.8 pcs/1000 km2, 14.4 pcs/1000 km2, 9.1 pcs/1000 km2, 7.0 pcs/1000 km2, and 6.1 pcs/1000 km2.
3.3. Factors Accounting for the Spatial–Temporal Variations in SAV Development
The RMSE values of RFR ranged from 0.0354 to 0.0485, and the R2 values ranged from 0.86 to 0.91. By summing up the Normalized Feature Importance, we were able to compare the influences of variables for the various types of SAVs and their changing patterns over time. It shows that the long-term overall development of SAVs in Anhui was influenced more by location, market, and economic factors than it was by terrain and resource factors (Figure 4). As time passed, market and economic factors grew in their relative importance, while those of terrain and resources dropped (Figure 4).
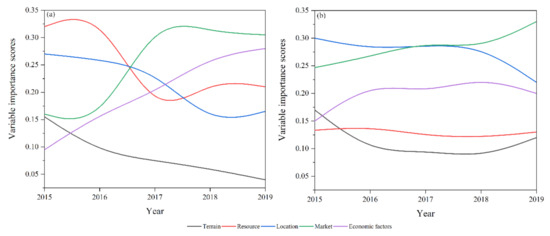
Figure 4.
Factors accounting for long-term SAV development north (a) and south (b) of Huai River.
However, if we look at the regions north and south of Huai River separately, we can see that while market and economic factors dominated the long-term development of SAVs in the north, it was location and market factors that continuously controlled the south. Even similarities in the first-order indices between the two regions had different underlying second-order variables nested inside. The key economic variable for the long-term development of fru-SAVs in the north was the gross production value of the county (Table 2; Figure 5a), mostly likely pointing to local market and sales. However, the key economic variable for the long-term development of both tea-SAVs and liv-SAVs in the south was the number of agricultural enterprises (Table 2; Figure 5b,c), which can mean a variety of things, including transportation and logistics.
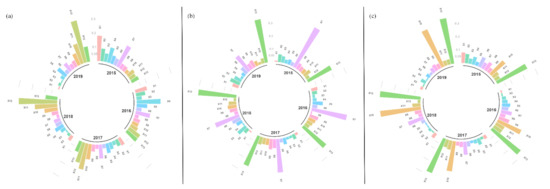
Figure 5.
Spatial–temporal pattern of the factors affecting the long-term development of SAVs. (a) Fruit SAVs, (b) tea SAVs, and (c) livestock SAVs. The variables are ×1: elevation, ×2: slope, ×3: road network distance from SAVs to river, ×4: precipitation, ×5: soil quality, ×6: road network distance from SAVs to county, ×7: road network distance from SAVs to road network, ×8: road network distance from SAVs to the highway intersection, ×9: county urbanization population, ×10: county urbanization rate, ×11: disposable income of urban residents in the county, ×12: gross production value of the county, and ×13: number of agricultural enterprises in the county.
Though the relative importance of location factors dropped, they still retained some influence over the development of SAVs south of Huai River. They were key for the long-term development of veg-SAVs (variable ×7: RND from SAV to the road network, Table 2; Figure 6a), and came in second for the long-term development of cer-SAVs (variable ×7: RND from SAV to the road network, Table 2; Figure 6b). Location was vital for SAVs because produce depends on efficient transportation to reach its destination. However, as China made sustained efforts to improve rural transportation throughout the nation, the moving of agricultural products was made increasingly easier, thereby reducing its relative importance.
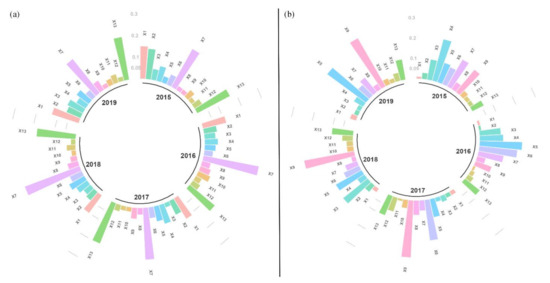
Figure 6.
Spatial–temporal pattern of the factors affecting the long-term development of SAVs. (a) Vegetable SAVs, (b) cereal SAVs. The variables are ×1: elevation, ×2: slope, ×3: road network distance from SAVs to river, ×4: precipitation, ×5: soil quality, ×6: road network distance from SAVs to county, ×7: road network distance from SAVs to road network, ×8: road network distance from SAVs to the highway intersection, ×9: county urbanization population, ×10: county urbanization rate, ×11: disposable income of urban residents in the county, ×12: gross production value of the county, and ×13: number of agricultural enterprises in the county.
4. Discussion
4.1. Factors Accounting for the Spatial–Temporal Variations in SAV Development
Compared with the formation of SAVs, which has been associated with the leadership of rural elites or preexisting traditions [11], SAVs’ long-term development can manifest as changes in complex attributes at multiple levels. We attempted to capture these attributes by selecting variables at and within the village, which helps to avoid using one-dimensional attributes, because each angle in itself can only measure one side of the SAV development. From the village perspective, attributes such as output value and number of SAVs reflect the level of agricultural specialization in the region. These have also been the primary indicators used in previous SAV studies. In terms of the intrinsic attributes, as farming households gradually becomes more specialized in a near competition-free environment, the proportion of specialized households within a village therefore not only defines an SAV, but also reflects the vibrancy of the village and the acceptance of said specialization pattern. As we look further down at individual households, farmers’ income measures both the change in living standards resulting from specialization and the potential for reinvestment in production activities, the latter of which drives the continued development of an SAV. The combination of these attributes generated multifaceted images of the SAVs’ development characteristics. Using FA, we were able to extract the latent quantities of these three aspects by differentiating the communalities and the uniqueness of the multiple attributes for further analysis.
Our methodology can also be applied when evaluating other comprehensive SAV concepts such as resilience and development potential, for which single and direct measurements are difficult to identify. These concepts are important for a broad range of rural developments. A multifaceted approach to SAV development offers enormous possibilities for understanding relevant studies with potentially richer spatial and temporal details, and for detecting complex and non-linear changes. Meanwhile, using multiple attributes can also generate multi-angle measurements as a self-validation mechanism.
4.2. Similarities and Differences of Influencing Factors North and South of Huai River
Specialization is the farmer’s way of rationalizing their economic conditions by utilizing the diverse geographic conditions and rich resources available to them. In the beginning, these advantages might have been terrain and resources, which set SAVs apart from traditional cultivation villages; these differences in marginal productivity in turn determined specialized types [14]. As SAVs developed further, economic rationality drove farmers to seek maximized profit by pursuing the most productive factors that gave them comparative advantages, only this time it was market and economic factors which determined the sale of their products. This reinforces the market’s importance in the long-term development of SAVs regardless of their type and geographic location.
In northern Anhui, where geographic and climatic conditions largely resemble those of China’s northern warm-temperate agricultural regions (such as Henan and Shandong Province), the aggregating fru-SAVs and cer-SAVs (Figure 2) were under the increased relative influences of market and economic factors, because SAVs thrive on the sale of their products. In our case, market and economic factors directly translate to the condition of sales locally. While terrain, resources, and location factors might have played important roles in the initial stages of the SAVs in these regions, they became less important as SAVs continued to develop. Furthermore, with the completion of the national Cun-cun-tong Project (Extending Access to Every Village), the transportation of agricultural products became less of a limiting factor in the development of these SAVs. Our findings echo with previous reports of rural development in China’s northern agricultural regions [22,30], and suggest that market and economic environments should be given more thought in promoting rural specialization at the township or village levels in similar areas.
In southern Anhui, where veg-SAVs, tea-SAVs, and liv-SAVs aggregated (Figure 2), however, market and location factors have continuously played key roles in the SAVs’ long-term development (Figure 4b). This partly relates to its geographical location south of Huaihe River, which is controlled by a subtropical humid monsoon climate with abundant resources, and abundancy meant less threat, which meant less influence. However, more importantly, this is where Huishang (merchants of southern Anhui) historically thrived and is now part of the Yangtze River Delta urban agglomeration, which is one of the most active economic regions in China. The rural residents here have always been trade oriented, and their SAVs thrive by catering to the needs of the major cities (e.g., Shanghai, Nanjing, and Hangzhou) on top of the local ones. Therefore, location factors came in second because they function as surrogates that measure distant markets. Similarly, the highest contributing economic variable (variable ×13: number of agricultural enterprises in the county, Figure 5b,d,e) grew in relative importance, most likely by representing enterprises registered locally that transport goods to the large cities. These patterns are different from previous findings identifying market and economic factors as the main contributor in SAV development distribution, such as those south of Huai River [22]. However, our results do not necessarily contradict previous ones. By analyzing SAVs in larger geographical areas, previous studies likely categorized the SAVs with their distant markets in one region, and, naturally, location factors became less important within that region, while economic factors of the region became more so. Together, our findings suggest that a spatial mismatch may exist between the source of economic factors that influence SAV development (e.g., investment into SAVs) and the location of the SAVs, one that can only be revealed at the right spatial scales. It also means that policies for SAV development coming from different levels of the authorities should target different influential factors to maximize efficiency.
4.3. Policies for Promoting SAV Development
Our analysis suggests a differential treatment for SAVs north and south of Huai River in Anhui and similar areas when policies to promote SAV development are being made: (1) for the SAVs north of Huai River whose development is dominated by market and economic factors, local authorities or stakeholders should focus on the types of agricultural products and improve their quality by bettering the production environment and expanding relevant markets. They can also establish agricultural trading platforms (online or offline markets) to attract economic elements inside and outside of the region and create an integrated service system for the production and marketing of agricultural products to promote the prosperity of rural industries; (2) For the SAVs south of Huai River whose development is largely affected by market and location factors, local authorities or stakeholders should focus on agricultural products with higher values to increase their competitiveness, which can help their products reach larger, more competitive, and more demanding markets.
Meanwhile, the temporal and spatial limitations of the influencing factors should also be considered. Authorities and local communities should treat SAV development as continuously changing rather than fixed, and policies and strategies coming from different hierarchical levels should address appropriate influencing factors accordingly.
5. Conclusions
We analyzed the long-term development of SAVs in Anhui Province, with respect to the geographical differences north and south of Huai River, from 2010 to 2019, examined their spatial patterns, and explored how terrain, resources, location, market, and economic factors continuously affected SAVs’ long-term development. We found that the SAVs in Anhui differentially distributed north and south of Huai River, with the fru-SAVs and cer-SAVs aggregating in the north, and the cer-SAVs, tea-SAVs, and liv-SAVs aggregating in the south.
While market and economic factors, compared with terrain, resources, and location factors, were on the whole more important to the development of SAVs in Anhui, different temporal and spatial patterns emerged in the northern and southern regions. The SAVs in northern Anhui received increased influences from market and economic factors, but the SAVs in southern Anhui were dominated by market and location factors. These patterns reveal similar underlying dependencies to sales. The SAV development in northern Anhui should focus on market and economic environments, formulating policies and strategies, and on the types and quality of agricultural products to expand relevant local markets. The SAV development in southern Anhui should make better use of their proximity advantages by focusing on agricultural products with higher values to reach larger markets. The dynamic temporal and spatial patterns of the factors affecting SAV development also suggest that policies and strategies should accommodate these dynamics and address appropriate influencing factors accordingly.
The development of SAVs is affected by multiple factors. Aside from those discussed here, factors such as rural elites, local government management, and peasant household self-development capabilities are also important. However, it has been challenging to measure these factors quantitatively. We may need to introduce novel data by datamining through new approaches and define new indicator systems to quantify these factors in future studies. Meanwhile, our study did not intend to establish any causal relationship between the development of SAVs and these factors using RFR due to nonlinearity, which limits the applicability of our policy recommendations. In this regard, future studies would benefit from establishing causal relationships using econometric models or nonlinear predictive models.
Author Contributions
The authors confirm contributions to the paper as follows: L.L. designed the research, conducted the literature review, performed data analysis, interpreted the results, and finalized the manuscript. N.N. participated in the whole research processing, particularly during research design, literature discussion, review and interpretation of analysis results, and revising and drafting the manuscript. X.L. co-designed the research framework and revised the drafts in due course. All authors have read and agreed to the published version of the manuscript.
Funding
This research was funded by the National Natural Science Foundation of China (grant Nos. 41801113, 41971223 and 42001337), Key Scientific and Technological Project of Henan Province (No. 202102310009), and Key Research Institute of Yellow River Civilization and Sustainable Development and Collaborative Innovation Center on Yellow River Civilization at Henan University (No. 2020M18).
Data Availability Statement
Please contact niun5@mail3.sysu.edu.cn.
Conflicts of Interest
The authors declare no conflict of interest.
References
- Abson, D.J. Agroecosystem Diversity; Academic Press: Cambridge, MA, USA, 2019; pp. 301–315. [Google Scholar]
- Lambin, E.F.; Meyfroidt, P. Global land use change, economic globalization, and the looming land scarcity. Proc. Natl. Acad. Sci. USA 2011, 108, 3465–3472. [Google Scholar] [CrossRef] [PubMed]
- Klasen, S.; Meyer, K.M.; Dislich, C.; Euler, M.; Faust, H.; Gatto, M.; Hettig, E.; Melati, D.N.; Jaya, I.N.S.; Otten, F.; et al. Economic and ecological trade-offs of agricultural specialization at different spatial scales. Ecol. Econ. 2016, 122, 111–120. [Google Scholar] [CrossRef]
- Boody, G.; Vondracek, B.; Andow, D.A.; Krinke, M.; Westra, J.; Zimmerman, J.; Welle, P. Multifunctional agriculture in the United States. BioScience 2005, 55, 27–38. [Google Scholar] [CrossRef]
- Lsao, F. Lessons from abroad in rural community revitalization: The one village, one product movement in Japan. Community Dev. J. 1992, 27, 10–20. [Google Scholar]
- Kang, D.C. Bad loans to good friends: Money politics and the developmental state in South Korea. Int. Organ. 2002, 56, 177–207. [Google Scholar] [CrossRef]
- Chidumu, J.I. The Mpact of “One Village One Product (OVOP)” on Household Income—Implications on Food Security: The Case of Bvumbwe Operation Area, Thyolo District, Malawi. Master’s Thesis, Ergerton University, Jorro, Kenyan, 2007. [Google Scholar]
- Fujita, M. Economic Development Capitalizing on Brand Agriculture: Turning Development Strategy on Its Head (No. 76); Institute of Developing Economies, Japan External Trade Organization: Tokyo, Japan, 2006.
- Lowder, S.K.; Sánchez, M.V.; Bertini, R. Which farms feed the world and has farmland become more concentrated? World Dev. 2021, 142, 105455. [Google Scholar] [CrossRef]
- Fei, X. Globalization and Cultural Self-Awareness; Springer: Berlin/Heidelberg, Germany, 2015; pp. 100–111. [Google Scholar]
- Li, X.; Ye, X.; Zhou, X.; Zheng, C.; Leipnik, M.; Lou, F. Specialized villages in inland China: Spatial and developmental issues. Sustainability 2018, 10, 2994. [Google Scholar] [CrossRef]
- Kettl, D.F. The job of government: Interweaving public functions and private hands. Public Admin. Rev. 2015, 75, 219–229. [Google Scholar] [CrossRef]
- Kasabov, E. Investigating difficulties and failure in early-stage rural cooperatives through a social capital lens. Eur. Urban Reg. Stud. 2016, 23, 895–916. [Google Scholar] [CrossRef]
- Mussina, K.; Dulatbekova, Z.; Baimbetova, A.; Podsukhina, O.; Lemanowicz, M. The current state and prospects for the development of Akmola region as a tourism destination. J. Environ. Manag. 2019, 10, 1934–1946. [Google Scholar]
- Bellandi, M.; Di Tommaso, M.R. The case of specialized towns in Guangdong, China. Eur. Plan Stud. 2005, 13, 707–729. [Google Scholar] [CrossRef]
- Marac. Reply to Recommendation No. 3421 of the Fifth Session of the Twelfth National People’s Congress. Available online: http://www.moa.gov.cn/gk/jyta/201710/t20171017_5842497.htm (accessed on 18 October 2017).
- Wu, N.; Li, L.; Li, E.; Li, X. The spatial continuity of specialized plantation: A case study of raspberry farm in Fengqiu county, Henan province. Sci. Geogr. Sin. 2018, 38, 428–436. (In Chinese) [Google Scholar]
- Wang, Y.; Hu, X.; Jin, G.; Hou, Z.; Ning, J.; Zhang, Z. Rapid prediction of chlorophylls and carotenoids content in tea leaves under different levels of nitrogen application based on hyperspectral imaging. J. Sci. Food Agric. 2019, 99, 1997–2004. [Google Scholar] [CrossRef] [PubMed]
- Michalek, J.; Zarnekow, N. Application of the rural development index to analysis of rural regions in Poland and Slovakia. Soc. Indic. Res. 2012, 105, 1–37. [Google Scholar] [CrossRef]
- Pater, R.; Harasym, R.; Skica, T. Index of regional economic development. Some considerations and the case of Poland. Stud. Reg. Lokal. 2015, 59, 54–85. [Google Scholar]
- Gudjonsson, G. An easy guide to factor analysis. Personal. Indiv. Differ. 1994, 17, 302. [Google Scholar] [CrossRef]
- Cao, Z.; Liu, Y.; Li, Y.; Wang, Y. Spatial pattern and its influencing factors of specialized villages and towns in China. Acta Geogr. Sin. 2020, 75, 1647–1666. (In Chinese) [Google Scholar]
- Botev, Z.I.; Grotowski, J.F.; Kroese, D.P. Kernel density estimation via diffusion. Ann. Stat. 2010, 38, 2916–2957. [Google Scholar] [CrossRef]
- Brunsdon, C. Estimating probability surfaces for geographical point data: An adaptive kernel algorithm. Comput. Geosci. 1995, 21, 877–894. [Google Scholar] [CrossRef]
- Han, D.; Rogerson, P.A.; Bonner, M.R.; Nie, J.; Vena, J.E.; Muti, P.; Trevisan, M.; Freudenheim, J.L. Assessing spatio-temporal variability of risk surfaces using residential history data in a case control study of breast cancer. Int. J. Health Geogr. 2005, 4, 1–10. [Google Scholar] [CrossRef] [PubMed][Green Version]
- Liaw, A.; Wiener, M. Classification and regression by Random Forest. R News 2002, 2, 18–22. [Google Scholar]
- Ye, T.; Zhao, N.; Yang, X.; Ouyang, Z.; Liu, X.; Chen, Q.; Hu, K.; Yue, W.; Qi, J.; Li, Z. Improved population mapping for China using remotely sensed and points-of-interest data within a random forests model. Sci. Total Environ. 2019, 658, 936–946. [Google Scholar] [CrossRef] [PubMed]
- Liu, Y.; Cao, G.; Zhao, N.; Mulligan, K.; Ye, X. Improve ground-level PM2. 5 concentration mapping using a random forests-based geostatistical approach. Environ. Pollut. 2018, 235, 272–282. [Google Scholar] [CrossRef] [PubMed]
- Pedregosa, F.; Varoquaux, G.; Gramfort, A.; Michel, V.; Thirion, B.; Grisel, O.; Blondel, M.; Prettenhofer, P.; Weiss, R.; Dubourg, V. Scikit-learn: Machine learning in Python. J. Mach. Learn. Res. 2011, 12, 2825–2830. [Google Scholar]
- Li, X.; Zhou, X.; Zheng, C. Geography and economic development in rural China: A township level study in Henan province, China. Acta Geogr. Sin. 2008, 63, 147–155. (In Chinese) [Google Scholar]


Publisher’s Note: MDPI stays neutral with regard to jurisdictional claims in published maps and institutional affiliations. |
© 2021 by the authors. Licensee MDPI, Basel, Switzerland. This article is an open access article distributed under the terms and conditions of the Creative Commons Attribution (CC BY) license (https://creativecommons.org/licenses/by/4.0/).