Abstract
As compared with conventional approaches for reducing carbon emissions, the strategies of reducing emissions from deforestations and forest degradation (REDD) can greatly reduce costs. Hence, the United Nations Framework Convention on Climate Change regards the REDD strategies as a crucial approach to mitigate climate change. To respond to climate change, Taiwan passed the Greenhouse Gas Reduction and Management Act to control the emissions of greenhouse gases. In 2021, the Taiwan government has announced that it will achieve the carbon neutrality target by 2050. Accordingly, starting with focusing on the carbon sink, the REDD strategies have been considered a recognized and feasible strategy in Taiwan. This study analyzed the net present value and carbon storage for various land-use types to estimate the carbon stock and opportunity cost of land-use changes. When the change of agricultural land to artificial forests generated carbon stock, the opportunity cost of carbon stock was negative. Contrarily, restoring artificial forests (which refer to a kind of forest that is formed through artificial planting, cultivation, and conservation) to agricultural land would generate carbon emissions, but create additional income. Since the opportunity cost of carbon storage needs to be lower than the carbon market price so that landlords have incentives to conduct REDD+, the outcomes of this study can provide a reference for the government to set an appropriate subsidy or price for carbon sinks. It is suggested that the government should offer sufficient incentives to reforest collapsed land, and implement interventions, promote carbon trading policies, or regulate the development of agricultural land so as to maintain artificial broadleaf forests for increased carbon storage.
1. Introduction
During 1951–2010, greenhouse gases increased the average global surface temperature by 0.5 °C to 1.3 °C [1]. Among them, CO2 is the major human-made greenhouse gas. Between 1980 and 2011, the average annual increase of global CO2 concentration was 1.7 ppm [2]. After emissions generated by energy consumption, the second major causes of greenhouse gas emissions are deforestation and forest degradation, which account for 17% of the global human-made CO2 emissions [3,4,5].
Compared with conventional approaches for reducing carbon emissions, the strategies for reducing emissions from deforestation and forest degradation (REDD) can address climate change issues with greatly reduced costs [6]. As the extension of REDD, the REDD+ strategies additionally include forest protection, carbon storage, and sustainable forest management. Both the REDD and REDD+ strategies are recognized as fundamental strategies for mitigating climate change by the United Nations Framework Convention on Climate Change [7].
Many countries have realized that the REDD and REDD+ strategies contribute considerable financial benefits [8]. In 2011, the value of global REDD projects exceeded USD 87 million and that of afforestation/reforestation (A/R) projects reached USD 65 million, whereas the trading volumes of REDD and A/R projects were 7.3 MtCO2e and 7.6 MtCO2e, respectively [9]. In the same year, the global carbon market grew by 11% in value, to USD 176 billion [10].
The REDD+ strategies are a solution for protecting tropical forests [11] and an essential and proactive incentive approach for carbon emission reduction and sustainable forest management [12]. A study on a dry forest in southwestern Madagascar indicated that potential REDD+ payments can provide sufficient financial incentives to protect forests with relatively low opportunity costs of carbon storage [13]. However, the benefits of REDD+ can only be received through meaningful investments, with the benefits surpassing the costs. Therefore, governments tend to evaluate the costs and benefits of REDD+ investments before making decisions. White and Minang [14] divided costs into the following three categories: opportunity cost, implementation cost, and transaction cost. They concluded that the opportunity cost is the most crucial part of the benefits of REDD+ because the opportunity cost reveals the influence of deforestation, and facilitates evaluations of the amount of fair compensation for land-use change.
Pagiola et al. [15] implied that when a country reduces its forest loss rate to fulfill the REDD obligations, the opportunity cost is the most essential cost among all of the incurred costs. In fact, the opportunity cost indicates the highest net income of the alternative land use regarding deforested areas [16]. Guo and Gong [17] used a partial equilibrium model based on intertemporal optimization to examine the potential and the cost of promoting forest carbon sequestration through taxes/subsidies to land owners for reducing/increasing carbon storage in their forests. Yang and Li [18] estimated the opportunity cost for REDD+ using the net present value (NPV), and discovered that the estimated opportunity costs are uncertain and differ greatly by region. Product price, carbon density, and time are key factors for changes in the opportunity cost. Kovacs et al. [19] used optimization of a structural dynamic model to evaluate the cost of carbon sequestration when afforestation subsidies are used to encourage private landowners to switch from cropland to forests.
Grieg-Gran [20] mentioned that the opportunity cost is (1) applicable for plantations and other types of land use, and is affected by (2) the output of different types of land use according to soil and climate conditions, (3) the scale of the business, (4) the investment and technology employed, and (5) the distance to market and the quality of basic transportation facilities. Other factors influencing the opportunity cost include the price of agricultural products, discount rate, and investment payback period. Moreover, Huettner et al. [11] accentuated that the opportunity cost might change over time. The opportunity cost of agricultural land was likely to increase in the future because of its scarcity caused by the implementation of REDD+ and growing demand for forestry and agricultural products [21]. In this case, large rewards must be provided to prevent deforestation [22].
In recognition of the United Nations Framework Convention on Climate Change and its protocols, as well as relevant international convention resolutions, the Taiwan government passed the Greenhouses Gas Reduction and Management Act in 2015 [23]. This Act is formulated to reduce greenhouse gas emissions, to protect the Earth’s environment, and to ensure sustainable development in Taiwan. The long-term goal is to reduce greenhouse gas emissions to less than 50% of those in 2005 by 2050. However, Taiwan has no carbon trading policies, and thus landlords cannot receive REDD+ payments despite the fact that the implementation of afforestation, reforestation, and reductions in deforestation can increase the amount of carbon stock and protect the environment. Thus, if Taiwan had its own carbon offset market, landlords could receive additional income from the REDD+ strategies, which would further incentivize protecting and regenerating forests. This would facilitate achievement of the long-term goal established by the Greenhouse Gas Reduction and Management Act. However, when landlords decide whether to implement the REDD+ strategies, they usually consider whether the cost is lower than the benefit. If the cost is lower than the benefit, the REDD+ strategies can be implemented. Because the opportunity cost is the most important item in cost, it has been crucial to analyze the trade-off between the NPVs of different land use types and carbon storage, and the opportunity cost of carbon sequestration of land use changes due to the development of REDD+. Accordingly, starting with focusing on the carbon sink, the REDD+ strategies have been considered to be a recognized and feasible approach in Taiwan. However, the forestlands of Taiwan are insufficient and have too high an opportunity cost for the REDD+ strategies. Although previous studies have proposed some approaches to calculate land-use income and estimate the opportunity cost, they rarely investigated how to use the REDD+ strategies to increase the amount of carbon sinks, nor did they consider the opportunity cost of REDD+ in Taiwan. To address these issues, this study examines the balance between the NPV and carbon storage regarding various land-use types to estimate the carbon stock and opportunity cost of land-use changes. The results can provide a reference for the government to set an appropriate subsidy or price for carbon sinks.
2. Materials and Methods
2.1. Theoretical Model
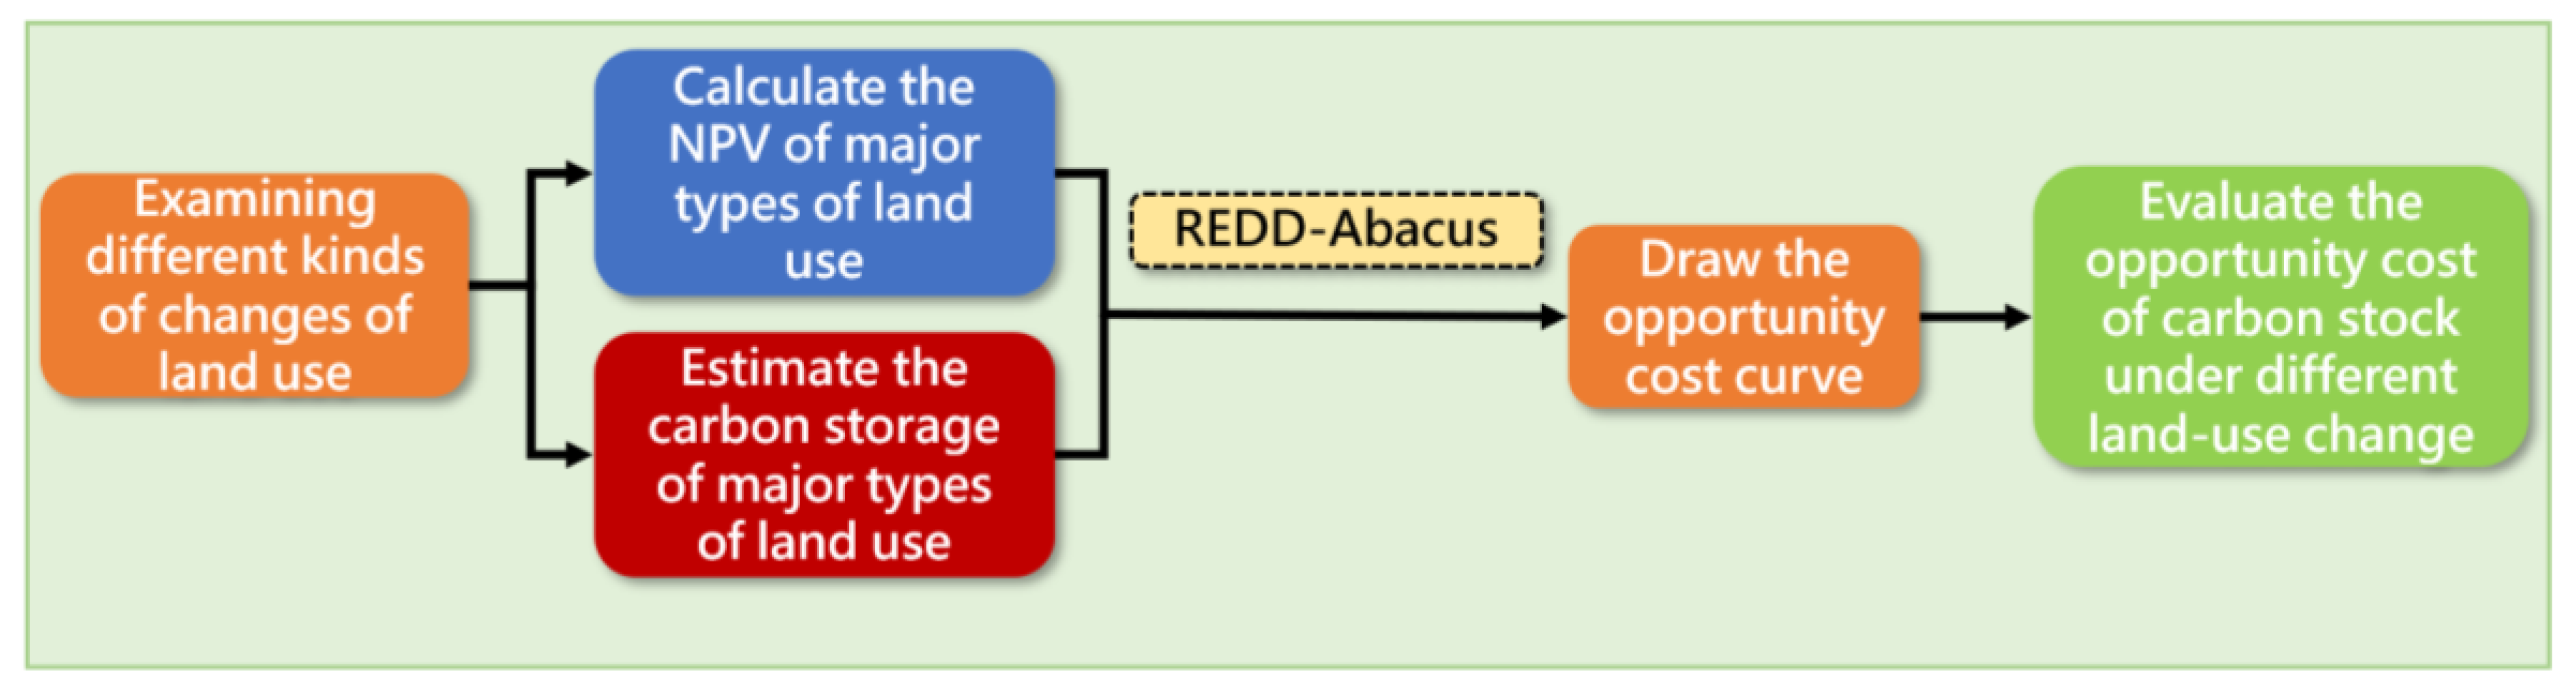
This study mainly employed the method of estimating the opportunity costs of the REDD+ strategies. The procedure of this method is described as follows: (1) examining changes of land use, (2) estimating the carbon storage for major land-use types, (3) calculating the NPV of different land uses, and (4) using the REDD Abacus software to create opportunity cost curves. The opportunity cost curves depicted the opportunity cost of land-use changes among various lands. The measure NTD/ton CO2e is used to demonstrate the potential amount of carbon stock for each type of land-use change. The forest income was used as the cost of changes in terms of land use, in which the forest income was generated from logging (see Figure 1).

Figure 1.
The workflow of this study.
The opportunity cost curves did not provide information on the amount of payments required for the increased amount of carbon stock, but only provided the estimated value of mean carbon stock and marginal opportunity cost [24].
The opportunity cost, using NTD/ton CO2e as the unit, is calculated as follows:
where NPVTime1 is the NPV of the original land-use type; NPVTime2 is the NPV of the later land-use type; CstockTime1 is the carbon storage of the original land-use type; and CstockTime2 is that of the later land-use type.
2.2. Materials
We divided land use into 10 types, i.e., natural coniferous forests, natural conifer–broadleaf forests, natural broadleaf forests, artificial coniferous forests, artificial conifer–broadleaf forests, artificial broadleaf forests, bamboo–tree mixed forests, bamboo forests, collapsed land, and other types of land (defined as agricultural land in this study) (see Table 1). We also referred to the National Greenhouse Gas Inventory Report released by the Environmental Protection Administration, Executive Yuan, Taiwan in 2019 [25] and the Forestry Statistics Yearbook publicized by the Forestry Bureau, Council of Agriculture, Executive Yuan, Taiwan in 2019 [26] to obtain the areas nationwide where the use of forests was unchanged, where land was restored to forests during 1990–2017, and where plant cover was reduced by collapse or wind disasters during 2010–2017.

Table 1.
Types of land-use changes during 2010–2017 in Taiwan.
3. Results
3.1. The NPV of Forest Revenues
We classified forests into the following eight types: natural coniferous forest, natural conifer–broadleaf forest, natural broadleaf forest, artificial coniferous forest, artificial conifer–broadleaf forest, artificial broadleaf forest, bamboo–tree mixed forest, and bamboo forest. The actual revenues of the forests were unknown because they had not been deforested, but the wood had value. Accordingly, we multiplied the stock volume of forests by their wood price in order to obtain their stumpage value.
3.2. Forest Stock Volumes
Compiled according to the fourth forest resource survey conducted by the Forestry Bureau, Council of Agriculture, Executive Yuan, Taiwan in 2015 [27], the stock volume per hectare of each forest type is demonstrated in Table 2.
Table 2.
Stock volume of current forest types in Taiwan.
3.3. Wood Prices of Forests
3.3.1. Natural Coniferous Forests
According to the fourth forest resource survey conducted by the Forestry Bureau, Council of Agriculture, Executive Yuan, Taiwan in 2015 [27], natural coniferous forests can be categorized into hemlock, fir, spruce, natural cypress, natural pine, and other natural coniferous forests. We used the wood price information system established by the Forestry Bureau, Taiwan in 2020 [28], and applied the mean wood price of hemlock, fir, spruce, natural cypress (i.e., red, and yellow cypresses), and pine from April 2010 to April 2020 as the wood price of natural coniferous forests per cubic meter, and obtained a result of 14,561 NTD/m3.
3.3.2. Natural Broadleaf Forests
In the fourth forest resource survey conducted by the Forestry Bureau, Taiwan in 2015 [25], natural broadleaf forests had no subdivisions. Hence, we adopted the mean miscellaneous wood price between April 2010 and April 2020, based on the wood price information system established by the Forestry Bureau, Taiwan in 2020 [28] as the wood price of natural broadleaf forests per cubic meter, and obtained a result of 2537 NTD/m3.
3.3.3. Natural Conifer–Broadleaf Forests
Natural conifer–broadleaf forests were not subdivided by the fourth forest resource survey conducted by the Forestry Bureau, Taiwan in 2015 [27]. Therefore, we calculated the wood price of natural conifer–broadleaf forests per cubic meter using the mean wood price of natural coniferous and broadleaf forests and obtained a result of 8549 NTD/m3.
3.3.4. Artificial Coniferous Forests
Artificial coniferous forests were subdivided into artificial cypress, incense cedar, pine, fir, Japanese cedar, Taiwania, and other artificial coniferous forests in the fourth forest resource survey conducted by the Forestry Bureau, Taiwan in 2015 [27]. We used the aforementioned wood price information system, applied the mean wood price of cypress (i.e., red, and yellow cypresses), incense cedar, pine, fir, Japanese cedar, and Taiwania during April 2010–April 2020 as the wood price of artificial coniferous forests per cubic meter, and obtained a result of 4637 NTD/m3.
3.3.5. Artificial Broadleaf Forests
Artificial broadleaf forests were subdivided into artificial Taiwan zelkova, camphor tree, Taiwan acacia, Formosan ash, and other artificial broadleaf forests in said survey by the Forestry Bureau, Taiwan in 2015 [27]. We used the mean wood price of Taiwan zelkova, camphor tree, Taiwan acacia, and Formosan ash during April 2010–April 2020 as the wood price of artificial broadleaf forests per cubic meter, based on the aforementioned system, and obtained a result of 3794 NTD/m3.
3.3.6. Artificial Conifer–Broadleaf Forests
The artificial conifer–broadleaf forests had no subdivisions. Hence, the mean wood price of artificial coniferous and broadleaf forests was applied to calculate the wood price of artificial conifer–broadleaf forests per cubic meter, and a result of 4215 NTD/m3 was obtained.
3.3.7. Bamboo Forests
The bamboo forests were divided into two types: single-branch bamboo and clustered bamboo. The price of the two types of bamboo was calculated using the price in the Market Statistics of Taiwan Bamboo Utilization Market [29]. From 2003 to 2012, the total bamboo production in Taiwan was 15.84 million (45.175 mt), with a mean price of 2900 NTD/mt. Accordingly, the price of a bamboo was 8.27 NTD/m3.
3.3.8. Bamboo–Tree Mixed Forests
We applied the mean of the NPV of natural broadleaf forest per hectare (500,470 NTD/ha) and bamboo forest per hectare (100,560 NTD/ha) as the NPV of bamboo–tree mixed forest per hectare (300,520 NTD/ha), and obtained a wood price of bamboo–tree mixed forest of 4548 NTD/m3.
The stumpage value (million NTD/ha) of each forest type was obtained by multiplying the stock volume per hectare of forest by its wood price. The results are displayed in Table 3.
Table 3.
Stock volume, wood price, and NPV of current forest types in Taiwan.
3.4. Carbon Price
Because Taiwan does not have a carbon market, we referred to Article 28 of the Greenhouse Gas Reduction and Management Act (penalty of a maximum of NTD 1500/tCO2e for excess emissions; Environmental Protection Administration, Executive Yuan, 2015) and defined the carbon price as NTD 1500/tCO2e.
3.5. Calculation of the NPV of Collapsed Land
Collapsed land contained no forests, and could no longer sustain production. Therefore, their NPVs (revenues) were regarded as 0 NTD/ha.
3.6. Calculation of the NPV of Agricultural Land
Most land converted for agriculture was located on hillsides and used for crops including tea, temperate fruits, alpine vegetables, and betel nut trees. In Taiwan, the crops that are commercially cultivated at a considerable scale include temperate fruits, namely pears, persimmons, plums, peaches, and apples [31] as well as alpine vegetables such as cabbages and spinaches. Accordingly, we calculated the NPV of the other land-use types using the mean output value per hectare of these crops, a one-year harvesting period, and a discount rate of 1.089% [30]. A mean NPV of 1.1632 million NTD/ha was obtained (Table 4).
Table 4.
The NPV of various types of agricultural land-use.
3.7. Calculation on Forest CO2 Storage
Relying on the fourth forest resource survey conducted by the Forestry Bureau, Council of Agriculture, Executive Yuan, Taiwan in 2015 [25], we employed the equation proposed by the Intergovernmental Panel on Climate Change (IPCC) to obtain the CO2 storage and areas of various forests in Taiwan. We divided the CO2 storage of forests by areas to obtain their CO2 storage per hectare (Table 5). The CO2 storage per hectare of natural and artificial coniferous forests, natural and artificial conifer–broadleaf forests, natural and artificial broadleaf forests, bamboo–tree mixed forests, and bamboo forests was 522.99 tCO2/ha, 604.77 tCO2/ha, 328.87 tCO2/ha, 103.07 tCO2/ha, and 110.36 tCO2/ha, respectively.
Table 5.
CO2 storage of various types of forest land-use.
3.8. CO2 Storage in Collapsed Land
We assumed that collapsed land contained no forest or vegetation, and thus we defined its CO2 storage as 0 tCO2/ha.
3.9. CO2 Storage in Agricultural Land
We assumed that hillside farming and pastoral land were used mainly as fruit tree farms, betel nut farms, and vegetable gardens. According to [38], the CO2 storage of fruit tree farms and vegetable gardens are 452.1 tCO2/ha and 126.5 tCO2/ha, respectively. Based on [36], the CO2 storage of betel nut farms is 154.0 tCO2/ha. The mean CO2 storage of fruit tree farms, betel nut farms, and vegetable gardens (244.2 tCO2/ha) was applied to agricultural land (Table 6), obtaining a result of 244.2 tCO2/ha.
Table 6.
CO2 storage of various types of agricultural land-use.
4. Discussion
4.1. The NPV and CO2 Storage Regarding Land-Use Categories
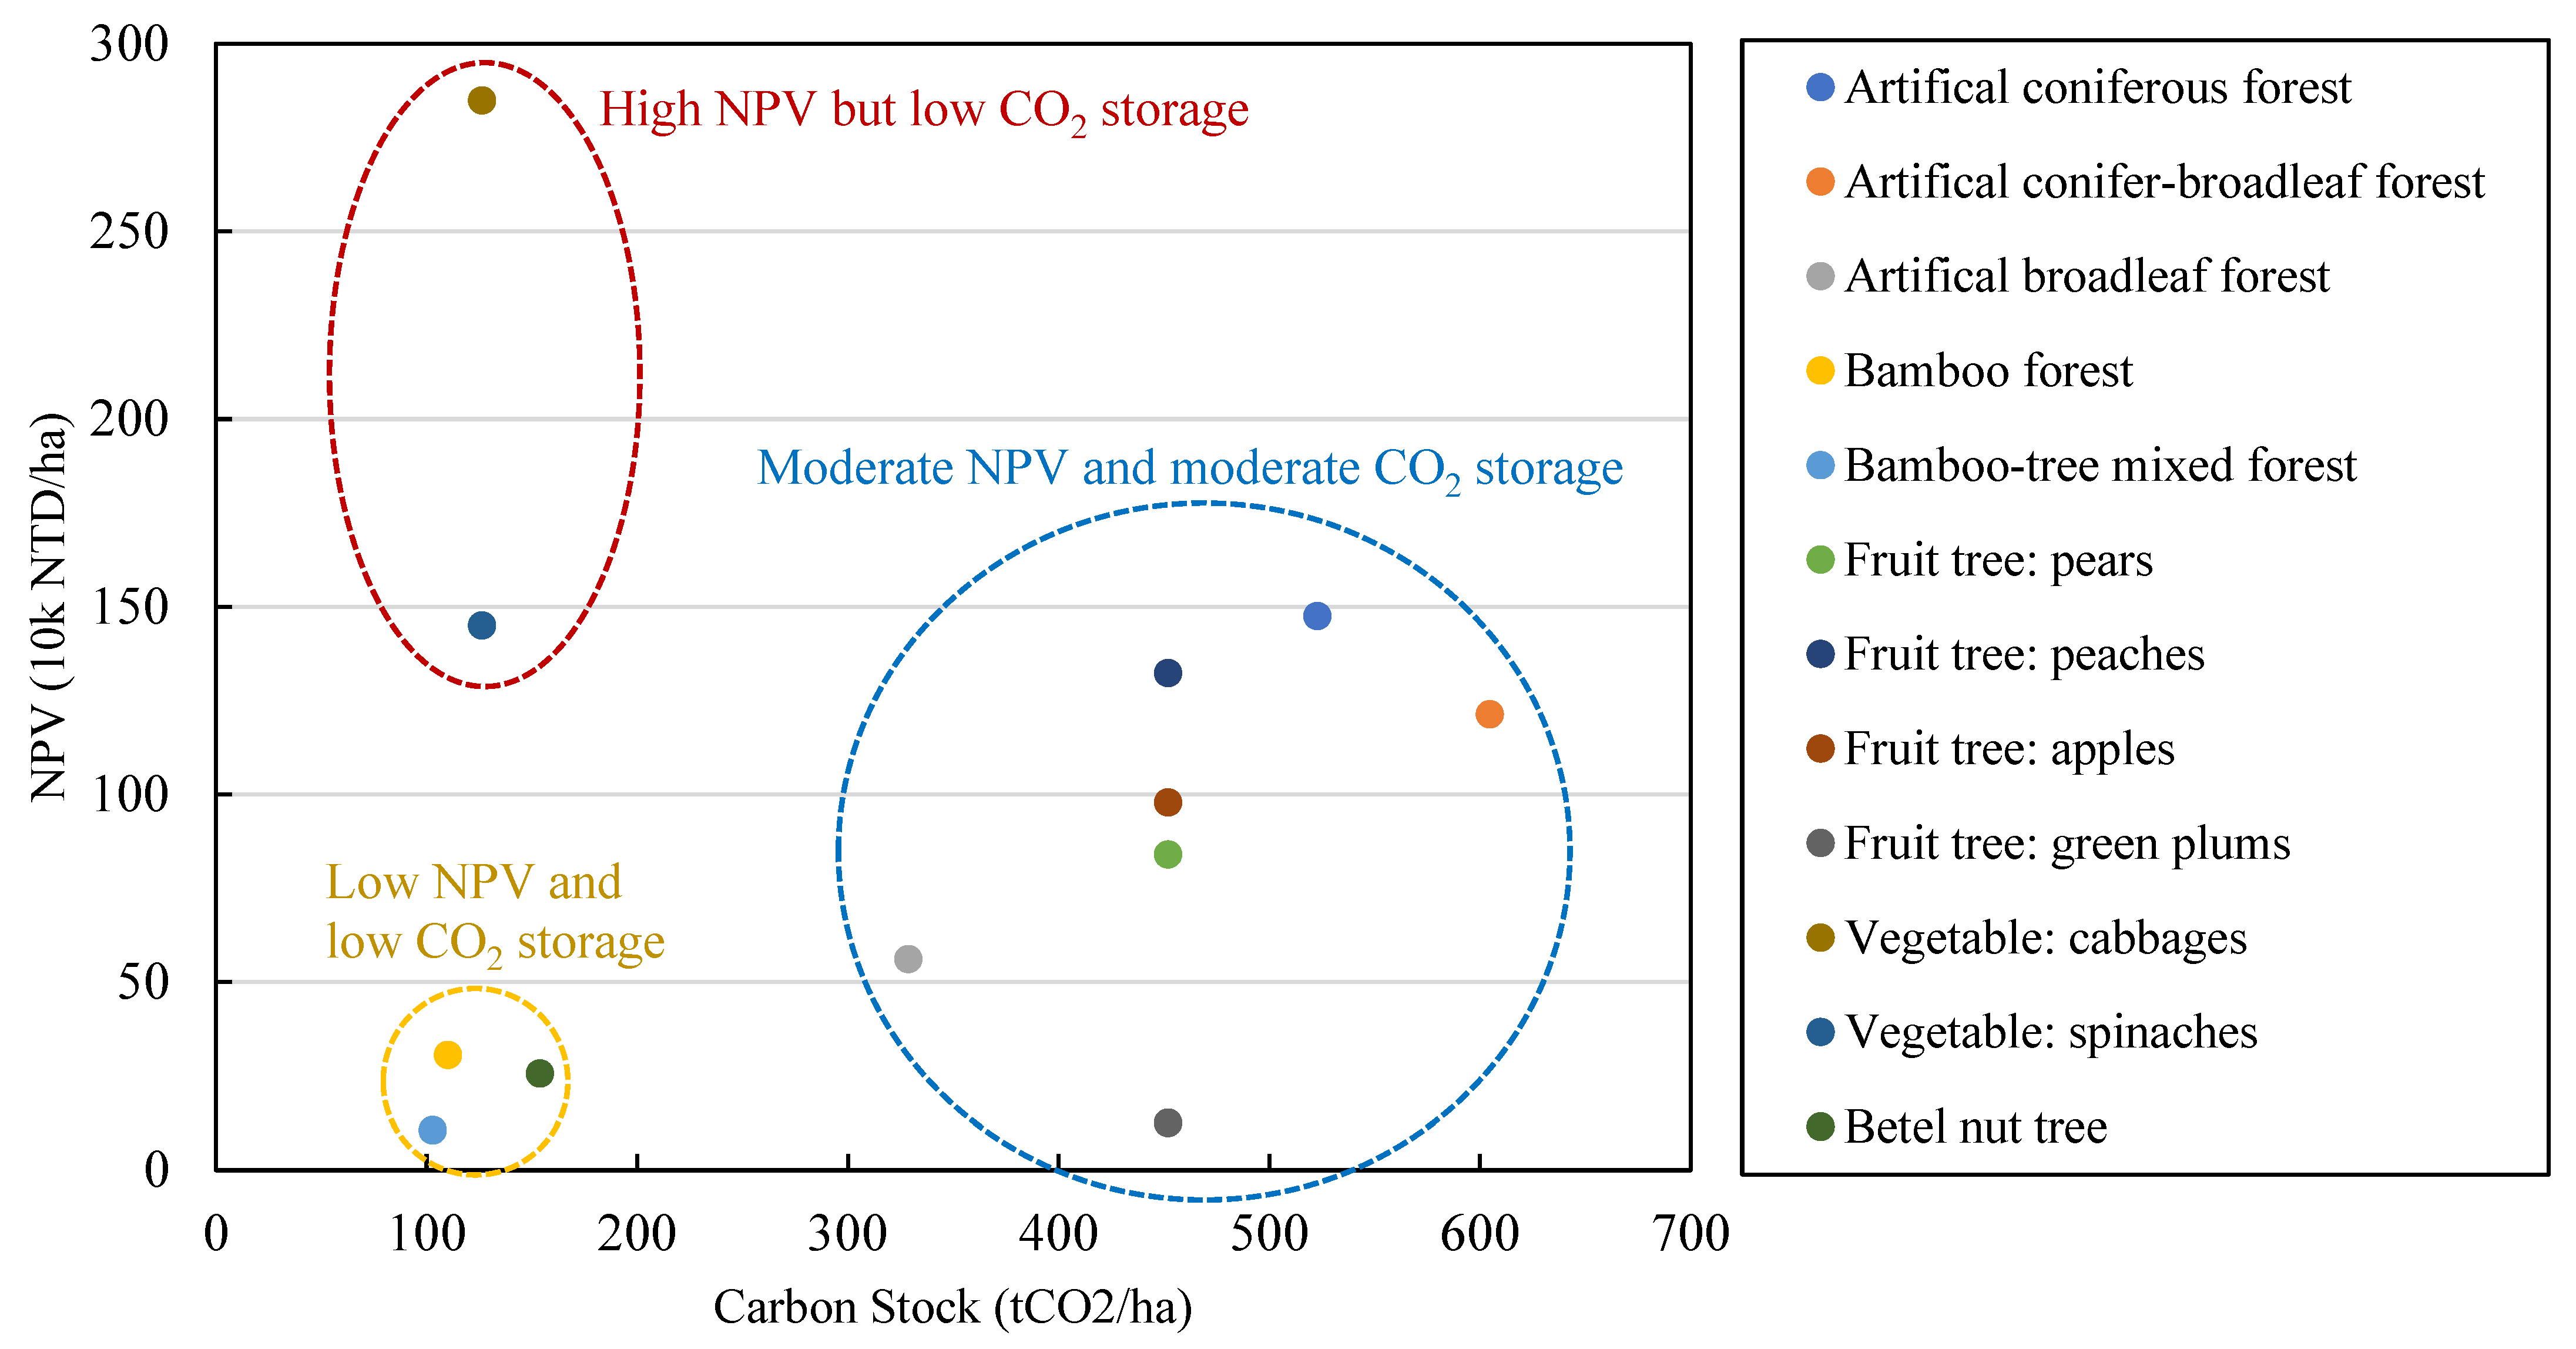
Different land-use classifications have different NPV and CO2 storage. The NPV indicates the discount of land output value (i.e., land profitability) and CO2 storage refers to the amount of aboveground CO2 fixation. Based on the data for the two indicators (Figure 2 and Table 7), we categorized land use into the following four classes.
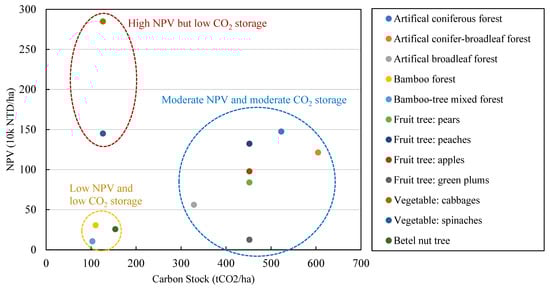
Figure 2.
Plots of the NPV versus the CO2 storage of various land-use types, which are divided into three categories: (1) high NPV but low CO2 storage, (2) moderate NPV and moderate CO2 storage, and (3) low NPV and low CO2 storage.
Table 7.
NPV and CO2 storage of various land-use types.
4.1.1. High NPV and High CO2 Storage
Natural coniferous and conifer–broadleaf forests belonged to this classification. Natural trees have long growth times, larger diameters and volumes, and thus higher stumpage value. Furthermore, larger volumes suggest higher CO2 storage. However, we did not include the data of natural forests in Figure 2 for comparison because natural forests in Taiwan are under logging bans.
4.1.2. High NPV but Low CO2 Storage
Vegetables in agricultural land (i.e., cabbages and spinaches) belonged to this classification. Vegetables allow profits within a short time, and have a high unit price, as well as preferable profitability and, thus, a high NPV. However, land planted with vegetables has low CO2 storage, leading to low carbon fixation.
4.1.3. Moderate NPV and Moderate CO2 Storage
Artificial forests (i.e., artificial coniferous, conifer–broadleaf, and broadleaf forests) and fruit trees in agricultural land (i.e., pears, peaches, and apples) belonged to this classification. These two forest types have modest levels of profitability and CO2 storage ability.
4.1.4. Low NPV and Low CO2 Storage
Bamboo–tree mixed forests, bamboo forests, and betel nut trees in agricultural land belonged to this classification. These forest types have relatively low profitability, and have undesirable CO2 fixation capacity.
The results showed that a single land-use type was unlikely to have preferable probability (NPV) and carbon fixation ability (CO2 storage) simultaneously. Natural forests had high NPV and CO2 storage, but they required a long time to grow and could not be logged at random. Moreover, a high NPV could only be realized where large amounts of actual revenue could be obtained through harvesting. Accordingly, artificial forests and agricultural land with fruit trees were better choices to obtain both profitability and carbon fixation ability.
4.2. Opportunity Cost of Carbon Stock among Different Land-Use Changes
The opportunity cost curve of carbon stock was calculated according to land-use changes, the CO2 storage, and NPVs of different land-use types. In Figure 3, the opportunity cost curve represents a comparison of the potential amount of carbon stock and its cost, in which the potential amount of carbon stock refers to the carbon emissions resulting from land-use changes. The horizontal axis depicts the amount of carbon emissions (i.e., the potential amount of carbon stock), while the vertical axis indicates the opportunity cost of carbon stock.
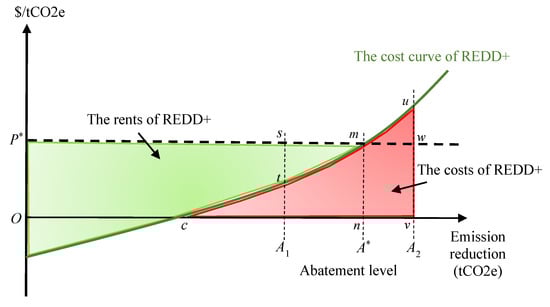
Figure 3.
The opportunity cost curve of REDD+. Note that the opportunity cost curve represents a comparison of the potential amount of carbon stock and its cost, in which the potential amount of carbon stock refers to the carbon emissions resulting from land-use changes. The REDD+ payment is the rectangular area under carbon price (□OP*mn), the cost is the area under the opportunity cost curve (Δcmn), and the difference between the two is the net income (trapezoid OP*mc). A region with an emission reduction level lower than A* (e.g., A1) relinquishes a certain amount of net income (Δtsm), whereas a region with an emission reduction level higher than A* (e.g., A2) has additional expenditures (trapezoid nmuv), and additional REDD+ revenue (□nmwv) cannot compensate for the loss (Δmuw).
Figure 3 also shows that the carbon price is equivalent to the cost of the carbon stock when the emission reduction level and the carbon price are A* and P*, respectively. Under such an emission reduction level, the REDD+ payment is the rectangular area under the carbon price (□OP*mn), the cost is the area under the opportunity cost curve (Δcmn), and the difference between the two is the net income (trapezoid OP*mc). A region with an emission reduction level lower than A* (e.g., A1) relinquishes a certain amount of net income (Δtsm), whereas a region with an emission reduction level higher than A* (e.g., A2) has additional expenditures (trapezoid nmuv), and additional REDD+ revenue (□nmwv) cannot compensate for the loss (Δmuw).
Land-use change can result in two situations: carbon emissions and carbon stock. In the first situation, the opportunity cost of carbon would be negative. In the second situation, the opportunity cost of carbon would be positive. To examine the opportunity cost curves, we analyzed the NPV and CO2 storage for 2010, 2012, 2015, and 2017, respectively (Figure 4, Figure 5, Figure 6 and Figure 7 and Table 8). Data for areas in which forests remained unchanged, in which land was converted to forests, in which forest cover was reduced by collapse or wind disaster, and different forest types and other types of land (defined as agricultural land in this study) were analyzed.
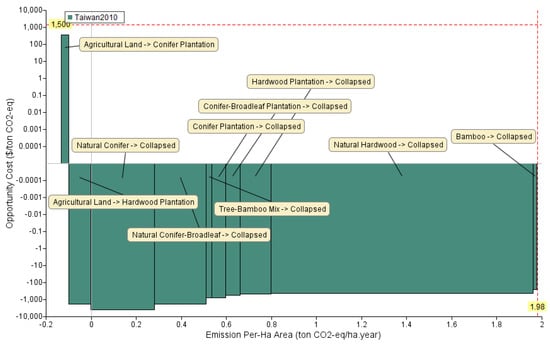
Figure 4.
Opportunity costs of various kinds of land-use change in 2010. Note that the opportunity cost refers to the unit cost sacrificed by one kind of land-use change. In addition, the carbon emissions are mostly caused by changes from forests to collapsed land.
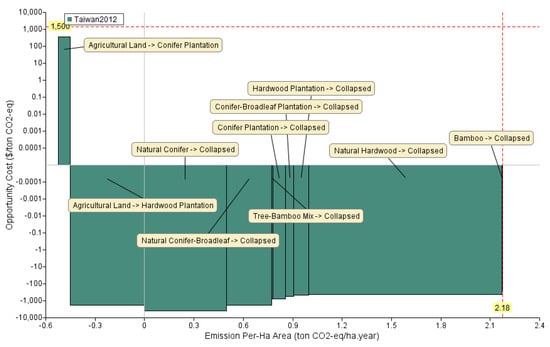
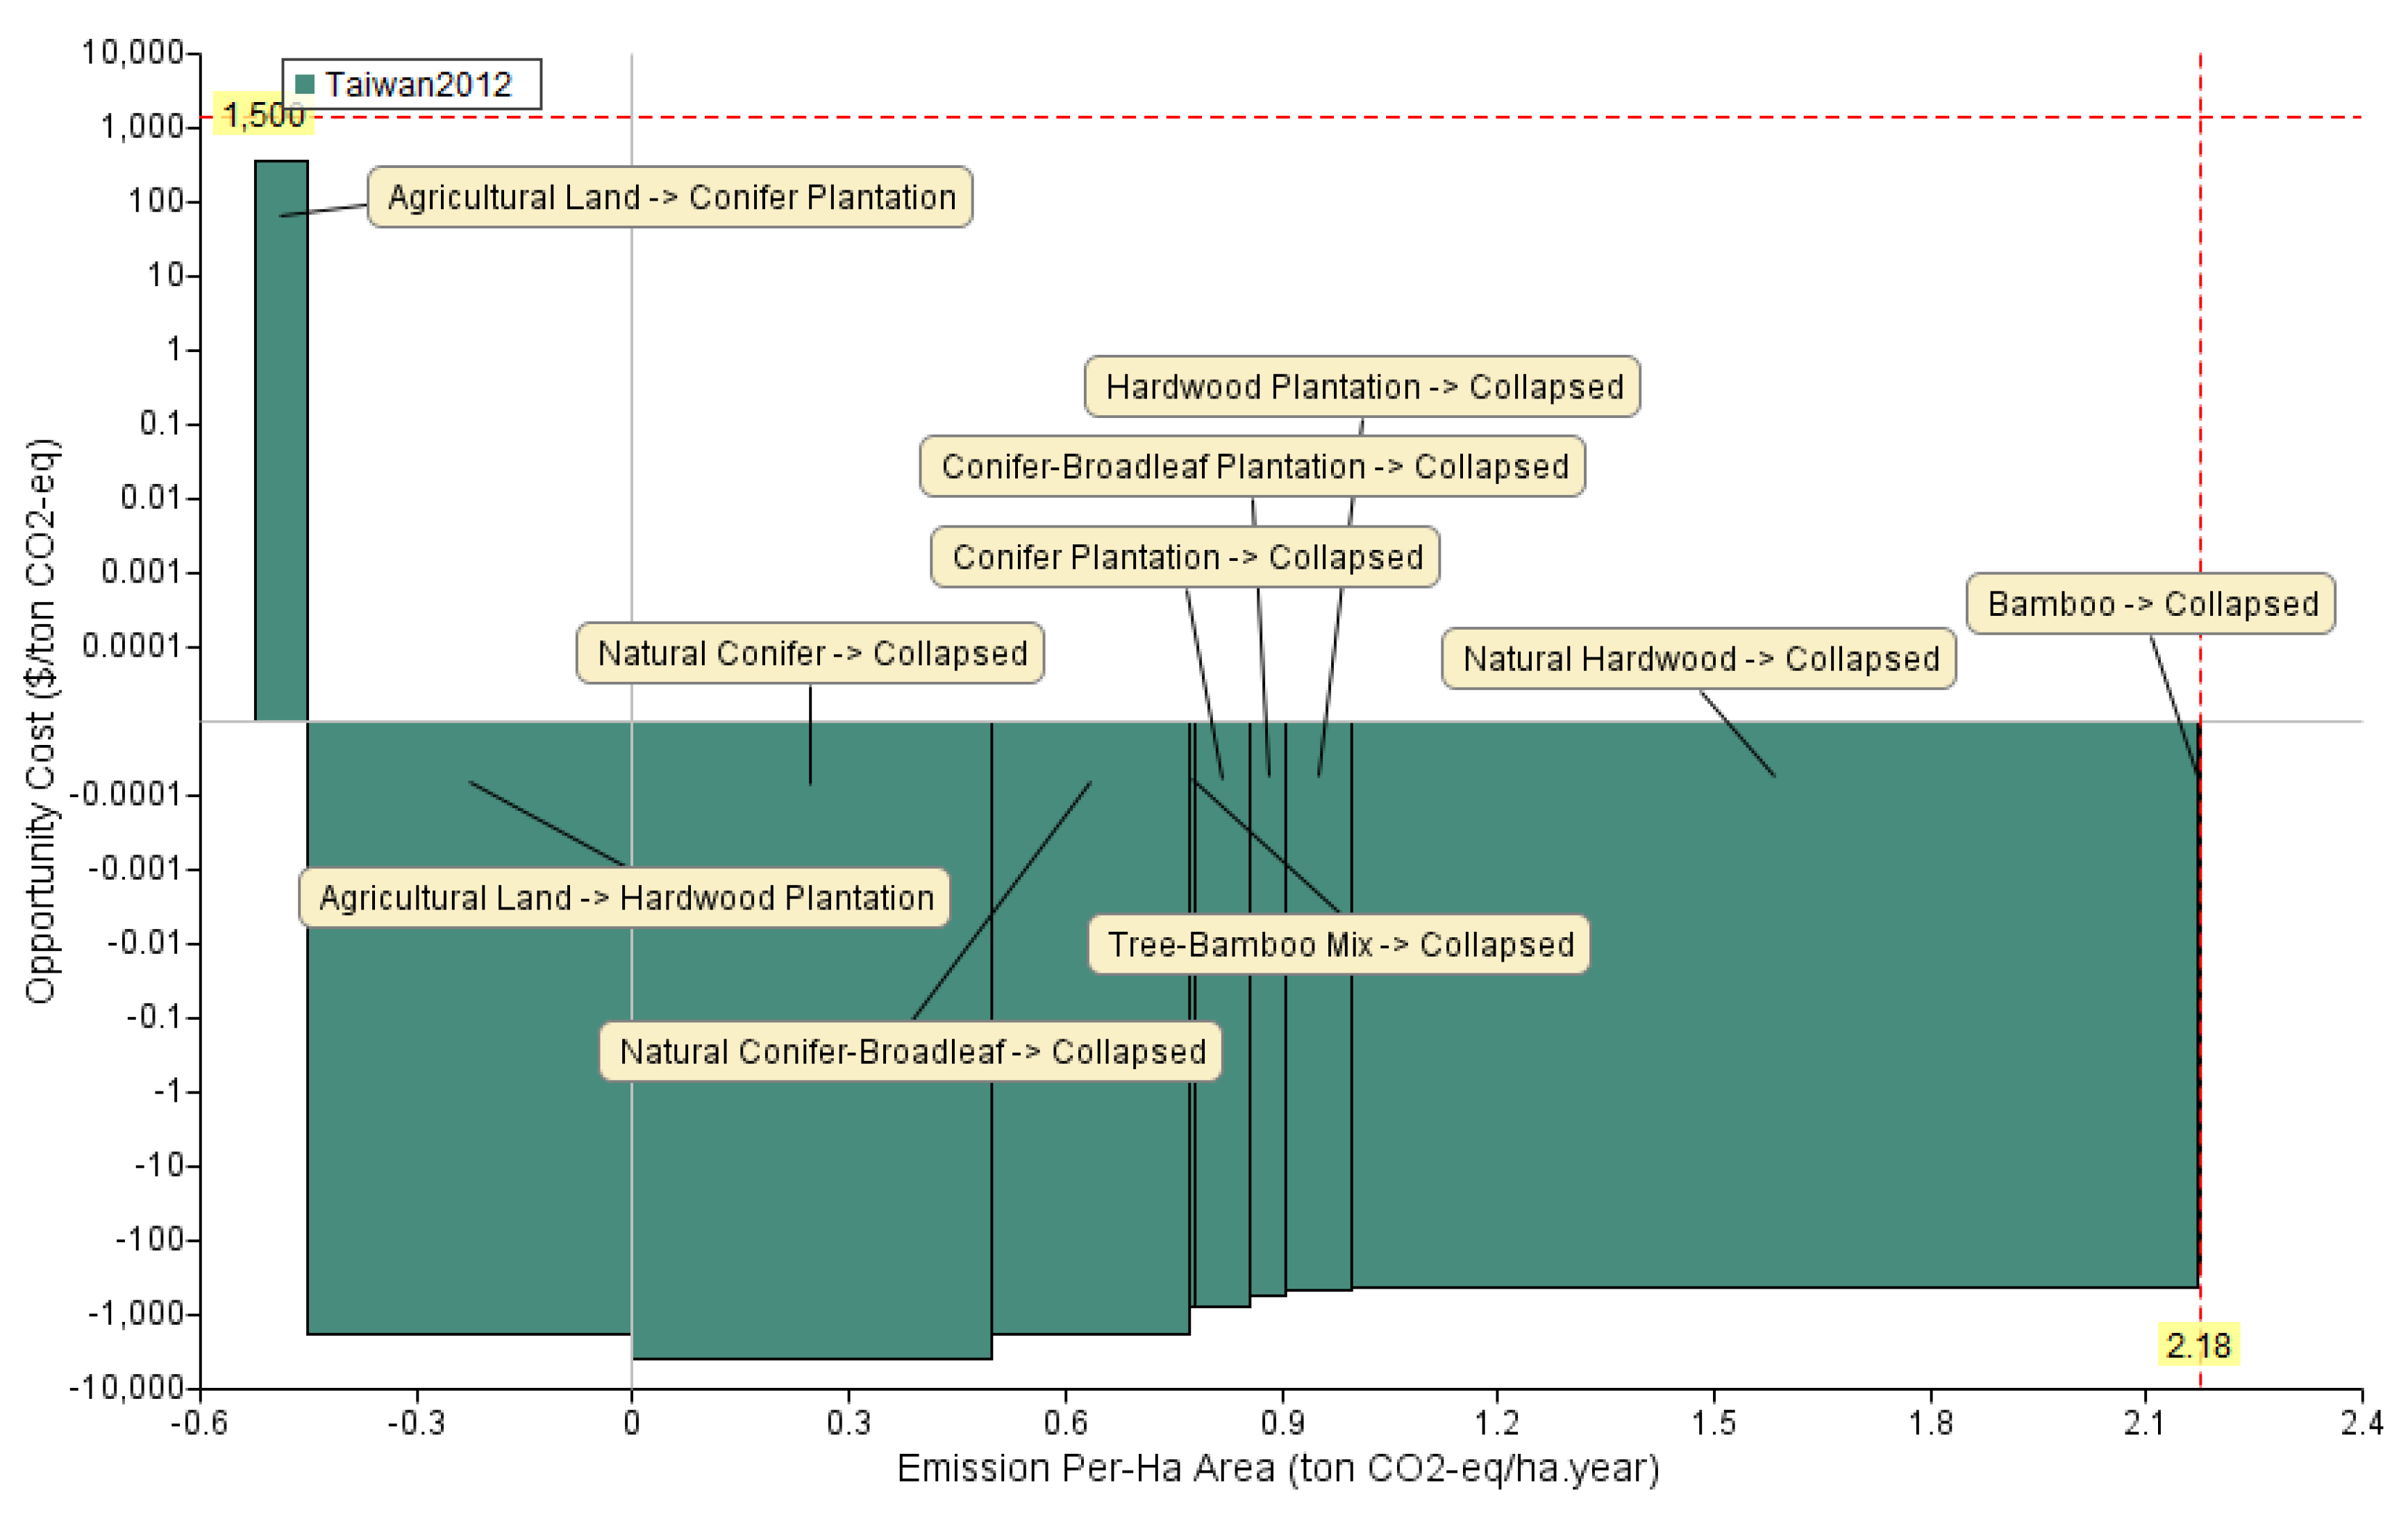
Figure 5.
Opportunity costs of various kinds of land-use change in 2012. Note that the opportunity cost refers to the unit cost sacrificed by one kind of land-use change. In addition, the carbon emissions are mostly caused by changes from forests to collapsed land.
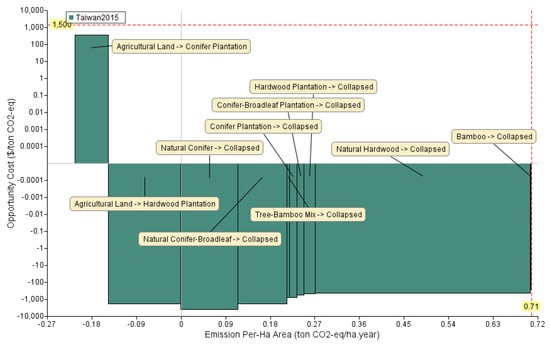
Figure 6.
Opportunity costs of various kinds of land-use change in 2015. Note that the opportunity cost refers to the unit cost sacrificed by one kind of land-use change. In addition, the carbon emissions are mostly caused by changes from forests to collapsed land.
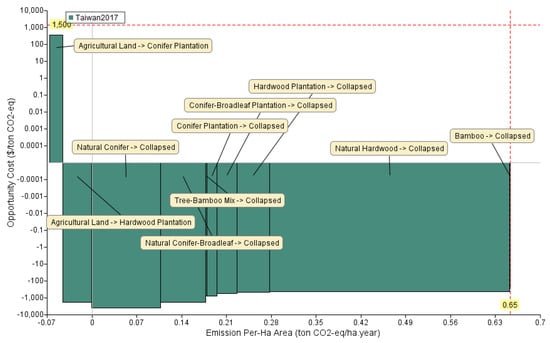
Figure 7.
Opportunity costs of various kinds of land-use change in 2017. Note that the opportunity cost refers to the unit cost sacrificed by one kind of land-use change. In addition, the carbon emissions are mostly caused by changes from forests to collapsed land.
Table 8.
Opportunity cost of carbon stock in various kinds of land-use change.
Forests that change into collapsed land resulted in carbon emissions, with changes from natural coniferous forest, natural conifer–broadleaf forest, and natural broadleaf forest into collapsed land being the most common land-use changes. Typhoons and heavy rains also lead to reductions of forest coverage. The carbon emissions at the front end of the curves in Figure 4, Figure 5, Figure 6 and Figure 7 are mostly caused by changes from forests to collapsed land. The results demonstrate that the opportunity cost of carbon stock regarding the change from a forest to collapsed land is negative. This implies that carbon stock offers considerable benefits and contributes to income instead of cost. In addition, to prevent carbon emissions generated by the collapse of forests, the opportunity cost of carbon stock must be lower than carbon price to ensure that the investment in carbon stock valuable. When the opportunity cost of carbon stock regarding the change from forest to collapsed land is negative and the carbon price is positive, the opportunity of carbon stock is lower than the carbon price, indicating that the carbon stock is profitable.
Moreover, agricultural land changes (i.e., changes from agricultural land to artificial coniferous forests and artificial broadleaf forests) also increase carbon stock, and the opportunity cost of carbon emissions resulting from change from agricultural land to artificial broadleaf forest is negative. Although the conversion of artificial broadleaf forest to agricultural land generates carbon emissions, carbon stock does not result in loss but contributes additional income. Therefore, artificial broadleaf forests are likely to be restored to agricultural land. When the opportunity cost of carbon emissions regarding the change from agricultural land to artificial coniferous forest is positive, the profitability of carbon emissions depends on the carbon price. If the opportunity cost of carbon emissions is less than the carbon price, land use with more carbon emissions becomes more advantageous.
5. Conclusions and Suggestions
With a special geographical and climate environment, Taiwan has many high mountains (more than 3000 m2) and is affected by many typhoons, with the result that forestland collapse or landslides often occur. Therefore, it is very important to analyze the changes in carbon stock caused by land use changes (man-made or natural factors). We categorized hillside land in Taiwan into 10 land-use types, accessed the NPV and CO2 storage of different land-use types, and further divided land types into four land-use scenarios: (1) high NPV and high CO2 storage (natural forests), (2) high NPV but low CO2 storage (vegetable gardens), (3) moderate NPV and moderate CO2 storage (artificial forests and fruit trees), and (4) low NPV and low CO2 storage (bamboo forests and betel nut farms). We concluded that choosing the land-use type with moderate NPV and moderate CO2 storage can achieve the maximum amount of environmental and economic benefits.
Carbon emissions were mostly generated by collapsed forestland. The results indicate that the opportunity cost of carbon stock for the change from forests to collapsed land was negative. It implies that carbon stock offers sizeable benefits and contributes to income rather than cost. To ensure that an investment in carbon stock is beneficial, carbon emissions caused by collapsed land should be prevented. When the opportunity cost of carbon stock for the change from forest to collapsed land was negative, the carbon price became positive. This suggests that the opportunity cost of carbon stock was less than the carbon price, so that carbon stock was profitable and could attract investment in carbon stock from governments and forest owners. Furthermore, changing agricultural land into artificial forests generated carbon stock, and the opportunity cost of carbon emissions regarding the change from agricultural land to artificial broadleaf forest was negative. This indicates that restoring artificial broadleaf forests back to agricultural land generated carbon emissions, but carbon stock resulted in additional income rather than cost. Artificial broadleaf forests were, thus, likely to be restored to agricultural land.
The carbon emissions caused by the collapse of forests represented the loss of potential carbon stock in Taiwan, so that the negative opportunity cost of carbon stock represented additional income. Hence, we conclude that greater income could be obtained by offering enough incentive to encourage governments and forest owners to reforest collapsed land or prevent the reductions of forest coverage that are caused by collapse or wind disasters. Moreover, according to the results, among the changes of artificial forests to collapsed land, the opportunity cost of carbon stock for the change of artificial coniferous forest to collapsed land was the lowest. Therefore, reforesting collapsed land with coniferous trees would be the most beneficial course of action. However, suitable land and trees during reforestation should be identified as a first priority.
The opportunity cost of carbon emissions generated by the change from agricultural land to artificial broadleaf forest was negative, implying that carbon emissions increased in this case and contributed to additional income. Accordingly, artificial broadleaf forests present incentives for being converted to agricultural use. If governments hope to increase carbon storage in Taiwan and do not prefer to transform artificial broadleaf forests into agricultural land, they can consider the following measures: (1) strictly prohibiting overuse of forests and preventing owners from restoring artificial broadleaf forests to agricultural land, (2) implementing carbon trading or offset policies and increasing payment for carbon stock to maintain incentives to retaining artificial broadleaf forests, (3) increasing the operation costs of agricultural land, such as charging environmental protection fees for hillside agricultural land use to reduce the incentive to change forests into agricultural land, and (4) increasing afforestation rewards and incentives.
We used the forest data of Taiwan to carry out the net present value and carbon storage in different land use types, analyzed the opportunity cost curve of carbon sequestration of land use changes, and further evaluated the opportunity cost of carbon sequestration under land use changes. Sensitivity analysis was not conducted to justify the parameters. Considering sensitivity analysis is important to simulation analysis, and as such it is suggested that subsequent researchers conduct sensitivity analysis around the different impacts of future climate change and different occurrence probability of forest collapsed.
Author Contributions
Investigation, software, visualization, writing—original draft, writing—review & editing, M.-Y.C.; conceptualization, methodology, writing—original draft, writing—review & editing, validation, supervision, W.-Y.L. All authors have read and agreed to the published version of the manuscript.
Funding
This work has been supported in part by the Ministry of Science and Technology, Taiwan, under Grant 110-2321-B-005-003; and the Ministry of Education, Taiwan, under the Higher Education Sprout Project.
Institutional Review Board Statement
Not applicable.
Informed Consent Statement
Not applicable.
Data Availability Statement
Data sharing not applicable.
Conflicts of Interest
The authors declare no conflict of interest.
References
- IPCC (Intergovernmental Panel on Climate Change). Climate Change 2013: The Physical Science Basis. Chapter 10: Detection and Attribution of Climate Change: From Global to Regional. 2013. Available online: https://www.ipcc.ch/site/assets/uploads/2018/02/WG1AR5_Chapter10_FINAL.pdf (accessed on 30 April 2020).
- IPCC (Intergovernmental Panel on Climate Change). Climate Change 2013: The Physical Science Basis. Chapter 2: Observations: Atmosphere and Surface. 2013. Available online: https://www.ipcc.ch/site/assets/uploads/2017/09/WG1AR5_Chapter02_FINAL.pdf (accessed on 30 April 2020).
- Gagan, D.S.; Muhammad, I.S.; Umer, S.; Mansi, J.; Ritika, C. Exploring the nexus between agriculture and greenhouse gas emissions in BIMSTEC region: The role of renewable energy and human capital as moderators. J. Environ. Manag. 2021, 297, 113316. [Google Scholar]
- FAO (Food and Agriculture Organization of the United Nations). Climate Change Mitigation Finance for Smallholder Agriculture: A Guidebook to Harvesting Soil Carbon Sequestration Benefits. 2011. Available online: http://www.fao.org/3/i2485e/i2485e00.pdf (accessed on 30 April 2020).
- Kremen, C.; Niles, J.O.; Dalton, M.G.; Daily, G.C.; Ehrlich, P.R.; Fay, J.P.; Grewal, D.; Guillery, R.P. Economic incentives for rain plantation conservation across scales. Science 2000, 288, 1828–1832. [Google Scholar] [CrossRef] [PubMed] [Green Version]
- Ji, Y.Y.; Ram, R.J. A global climate-economy model including the REDD option. J. Environ. Manag. 2019, 247, 342–355. [Google Scholar] [CrossRef]
- Demsai, R.; Animekh, H.; Gudeta, W.S.; Rajiv, P.; Das, A.K.; Arun, J.N. Assessing tree diversity and carbon storage during land use transitioning from shifting cultivation to indigenous agroforestry systems: Implications for REDD+ initiatives. J. Environ. Manag. 2021, 298, 113470. [Google Scholar]
- Nicodemus, N.; Pedro, C. Impact of land cover changes on carbon stock trends in Kenya for spatial implementation of REDD+ policy. Appl. Geogr. 2021, 133, 102479. [Google Scholar]
- Ecosystem Marketplace & Bloomberg New Energy Finance, Developing Dimension: State of the Voluntary Carbon Markets. 2012. Available online: https://about.bnef.com/blog/developing-dimension-state-of-the-voluntary-carbon-markets-2012/ (accessed on 30 April 2020).
- World Bank. State and Trends of the Carbon Market 2012. Available online: http://hdl.handle.net/10986/13336 (accessed on 30 April 2020).
- Huettner, M. Risks and opportunities of REDD+ implementation for environmental integrity and socio-economic compatibility. Environ. Sci. Policy 2012, 15, 4–12. [Google Scholar] [CrossRef] [Green Version]
- Mollicone, D.; Freibauer, A.; Schulze, E.D.; Braatz, S.; Grassi, G.; Federici, S. Elements for the expected mechanisms on ‘reduced emissions from deforestation and degradation, REDD’ under UNFCCC. Environ. Res. Lett. 2007, 2, 1–7. [Google Scholar] [CrossRef]
- Neudert, R.; Olschofsky, K.; Kübler, D.; Prill, L.; Köhl, M.; Wätzold, F. Opportunity costs of conserving a dry tropical plantation under REDD+: The case of the spiny dry plantation in southwestern Madagascar. Plant. Policy Econ. 2018, 95, 102–114. [Google Scholar] [CrossRef]
- White, S.D.; Minang, P.A. Estimating the Opportunity Costs of REDD+: A Training Manual, Version 1.3. 2011. Available online: https://www.researchgate.net/publication/264044481_Estimating_the_Opportunity_Costs_of_REDD_A_Training_Manual_Version_13 (accessed on 30 April 2020).
- Pagiola, S.; Bosquet, B. Estimating the Costs of REDD at the Country Level. 2009. Available online: https://mpra.ub.uni-muenchen.de/13726/ (accessed on 30 April 2020).
- Böttcher, H.; Eisbrenner, K.; Fritz, S.; Kindermann, G.; Kraxner, F.; McCallum, I.; Obersteiner, M. An assessment of monitoring requirements and costs of ‘Reduced Emissions from Deforestation and Degradation’. Carbon Balance Manag. 2009, 4, 7. [Google Scholar] [CrossRef] [PubMed] [Green Version]
- Guo, J.; Gong, P. The potential and cost of increasing forest carbon sequestration in Sweden. J. For. Econ. 2017, 29, 78–86. [Google Scholar] [CrossRef]
- Yang, H.Q.; Li, X. Potential variation in opportunity cost estimates for REDD+ and its causes. Plant. Policy Econ. 2018, 95, 138–146. [Google Scholar] [CrossRef]
- Kovacs, K.; Haight, R.G.; Moore, K.; Popp, M. Afforestation for carbon sequestration in the Lower Mississippi River Basin of Arkansas, USA: Does modeling of land use at fine spatial resolution reveal lower carbon cost? For. Policy Econ. 2021, 130, 102526. [Google Scholar] [CrossRef]
- Grieg-Gran, M. The Cost of Avoiding Deforestation Update of the Report Prepared for the Stern Review of the Economics of Climate Change; International Institute for Environment and Development: London, UK, 2008. [Google Scholar]
- Sohngen, B.; Beach, R.H. Avoided Deforestation as a Greenhouse Gas Mitigation Tool: Economic Issues for Consideration. 2006. Available online: https://www.researchgate.net/publication/228622617_Avoided_deforestation_as_a_greenhouse_gas_mitigation_tool_Economic_issues_for_consideration (accessed on 30 April 2020).
- Kindermann, G.E.; Obersteiner, M.; Rametsteiner, E.; McCallum, I. Predicting the deforestation-trend under different carbon-prices. Carbon Balance Manag. 2006, 1, 1–17. [Google Scholar] [CrossRef] [PubMed] [Green Version]
- Environmental Protection Administration, Greenhouse Gas Reduction and Management Act. 2015. Available online: https://oaout.epa.gov.tw/law/LawQuery.aspx (accessed on 30 April 2020).
- Swallow, B.; van Noordwijk, M.; Dewi, S.; Murdiyarso, D.; White, D.; Gockowski, J.; Hyman, G.; Budidarsono, S.; Robiglio, V.; Meadu, V.; et al. Opportunities for Avoided Deforestation with Sustainable Benefits. An Interim Report by the ASB Partnership for Tropical Forest Margins; ASB Partnership for the Tropical Forest Margins: Nairobi, Kenya, 2007. [Google Scholar]
- Environmental Protection Administration. National Greenhouse Gas Inventory Report. 2019. Available online: http://unfccc.saveoursky.org.tw/nir/tw_nc_2018.php (accessed on 30 April 2020).
- Forestry Bureau. Forestry Statistics. 2019. Available online: https://www.forest.gov.tw/0000574 (accessed on 30 April 2020).
- Forestry Bureau. The 4th National Forest Resources Survey. 2020. Available online: https://www.forest.gov.tw/0002393 (accessed on 30 April 2020).
- Forestry Bureau. System of Wood Price. 2020. Available online: https://woodprice.forest.gov.tw/Summary/Q_SummarySingleWoodPrice.aspx (accessed on 30 April 2020).
- Lin, J.C.; Lin, Y.R.; Chiou, C.R. Statistics of Taiwan Bamboo Utilization Market in the Past 10 Years. For. Res. 2014, 21, 38–42. [Google Scholar]
- Bank of Taiwan. Discount Rate. 2020. Available online: https://rate.bot.com.tw/twd?Lang=zh-TW (accessed on 30 April 2020).
- Agriculture and Food Agency. Young Farmers Counseling Platform. 2020. Available online: https://academy.coa.gov.tw/YF/ (accessed on 30 April 2020).
- Agriculture and Food Agency. System of Agricultural Products Price. 2020. Available online: https://apis.afa.gov.tw/pagepub/AppInquiryPage.aspx (accessed on 30 April 2020).
- Agriculture and Food Agency. Grain Production and Marketing Information Platform. 2020. Available online: https://pbi.afa.gov.tw/afabi_open/default/index (accessed on 30 April 2020).
- Agriculture and Food Agency. Agricultural and Food Agency Statistics Database. 2020. Available online: https://www.afa.gov.tw/cht/index.php?code=list&ids=324 (accessed on 30 April 2020).
- Agriculture and Food Agency. Analysis of Pear Production. 2018. Available online: http://pbi.afa.gov.tw/AFABI_Open/Other/ExpertList/10 (accessed on 30 April 2020).
- Lu, M.D.; Song, J.W.; Shih, J.J.; Yang, C.M. Crisis and Turning-Point for Taiwan Temperate Fruit Tree Industry under Climate Change: Industrial Strengths and Development Strategies. Spec. Publ. TARI. 2015, 189, 95–104. [Google Scholar]
- Directorate General of Budget. Accounting and Statistics, Executive Yuan, General Situation of Areca Production in The Past Five Years. 2014. Available online: https://www.stat.gov.tw/ct.asp?xItem=5215&ctNode=1831 (accessed on 30 April 2020).
- Lin, Y.R. Ecosystem Carbon Stocks and Soil Properties in the Long-Term Abandoned Orchards and Afforested Lands. Master’s Thesis, National Chung Hsing University, Department of Forestry, Taichung, Taiwan, 2012; p. 62. [Google Scholar]
- Chiu, C.R.; Cheng, C.H.; Lin, J.C.; Chan, W.H. Carbon Stocks Changes in Reforested Farmland of Betel Nut Palm: A Case Study of Honduras Mahogany. Q. J. Chin. For. 2012, 45, 97–108. [Google Scholar]


Publisher’s Note: MDPI stays neutral with regard to jurisdictional claims in published maps and institutional affiliations. |
© 2021 by the authors. Licensee MDPI, Basel, Switzerland. This article is an open access article distributed under the terms and conditions of the Creative Commons Attribution (CC BY) license (https://creativecommons.org/licenses/by/4.0/).