Abstract
A characteristic element of the transformations of cities in Central and Eastern Europe after 1990 was the emergence of shrinking cities. The main problem related to shrinking cities is around how this process developed as a result of rapidly intensifying de-industrialization. While many studies in this area are devoted to demographic, social, and economic issues, relatively few studies address the spatial dimension. In this article, the example of spatial development in the (post-) mining city of Bytom in southern Poland is discussed, pointing to the need for a multifaceted approach to this issue. This article begins with an attempt to contextualize this issue within a broader time perspective. Such an analysis makes it possible to better situate contemporary changes in the context of the processes that were visible in previous periods. Next, these changes are described using two methods. The basis of the first method is comparisons between the different types of land use. The second method, which is emphasized, is the method of A. Macias, which indicates the degree of naturalization/anthropogenization of space. Macias’ method is crucial in the context of discussions about the future of post-mining towns, where attention is paid, among other things, to the issue of sustainable development.
1. Introduction
Economic development creates opportunities for the development of cities and, in the event of crises, can disintegrate their social, economic, and spatial structures. The dependence of cities upon economic conditions is quite apparent. However, there is ambiguity about the direct links between the primary industries which influence the development of cities, both in progression and recession. This is because social, political, and environmental factors also determine the development of cities. It is also vital to note that cities are located in a system of geographical connections. These geographical connections can refer to both the immediate surroundings and those of a network nature. Thus, it can be concluded that economic factors affect cities, but a city is also the sum of the impacts of other factors. Therefore, this relation is not a feedback relationship [1].
This fact seems to be visible in the geographical space of cities. The urban space is the background of all economic impulses. Each time, economic impacts leave a mark on the spatial development and functional structure of a city. Nevertheless, the spatial development and functional structure of a city also shaped by a background of social, political, and environmental influences. This is evident a city’s spatial development and changes in the structure of its components over time.
An analysis of changes in the spatial development of cities also allows us to partially answer the question of the actual dimension of the city’s dependence on its economic foundations—especially when, for example, due to de-industrialization, these economic foundations disappear. In such a case, the model of a city that does not matter, known from scientific literature, appears [2]. This is a city that exists, but its city-forming basis does not exist; a city that has lost its economic subjectivity (entirely or partially) but has not lost its geographical subjectivity.
This model of cities is considered in studies concerning various regions of the world, although it is most often associated with the phenomenon of de-industrialization and urban shrinkage [3,4,5]. Although there are differences in the course of these phenomena between individual countries and regions of the world [6,7,8,9], certain attributes seem to be constant in each case (e.g., a loss of demographic and economic potential, visible changes in the structure of land use, the formation of brownfields or the need for external support).
This article examines the city of Bytom in Poland; an interesting example of a shrinking city [10,11,12,13]. Notably, shrinkage here is mainly due to deindustrialization; the disappearance of the most significant economic entities—hard coal mines and other large industrial plants. The aim of this article is to attempt to answer the following question: does the application of A. Macias’s method allow for a more thorough interpretation of the land use structure in a bigger city experiencing de-industrialization and urban shrinkage? This article also examines a possible mismatch between the phases of economic and demographic changes and spatial changes. Detailed studies of one of the most significant shrinking (post-) industrial cities in Europe [14,15] will clarify this issue, based on in-depth studies of changes in spatial development from a historical perspective.
2. Research Review
The issue of transformations in post-industrial cities is an essential element of contemporary urban studies. This focus results from two fundamental research challenges. Firstly, cities of this type provoke questions about the future of the various sectors of the economy to be potential stabilizers of development. Secondly, research into changes always provokes questions about the development of future cities. It is impossible to outline this issue adequately, even within the general framework, without a good understanding of the current trends in developing individual urban structures—economic, social, spatial, ecological, and others. Hence, in contemporary urban studies, many scientific discourses have emerged in which issues relating to these two basic assumptions are addressed. At least four essential discourses can be found in relation to the studied city and the title issue of land-use changes.
The first discourse concerns the problem of shrinking cities [16,17,18,19]. Urban shrinkage is understood as a synonym of depopulation, and, more often, as a set of socio-economic phenomena and processes. Depopulation is one aspect of this [20,21,22,23,24]. It is assumed that two main phenomena are triggering urban shrinkage: suburbanization and de-industrialization [13,25]. Both types of cities were studied in Poland and the EEC [26].
The second discourse relates to post-industrial cities and the direction of functional changes. This issue has been developed in world literature since the second half of the 20th century and is related to an observed increase in the role of services in the economies of cities [27,28]. As part of this discourse, however, not only the change in the proportion between the industrial sector and the service sector is indicated, but also changes within one sector (re-industrialization or new services). This aspect is essential for cities such as Bytom, which, in the face of the loss of numerous jobs in coal mining and heavy industry, are looking for new paths of re-industrialization.
The third discourse concerns the spatial development of derelict areas, emphasizing post-industrial brownfields [29]. The discourse on the management of urban brownfields is gaining importance in relation to realized investment opportunities and diversified development [30,31]. In post-mining towns, the specificity of brownfields, the possibility of their rehabilitation and general challenges related to the implementation of buildings in their area are also important issues. Due to the large number of liquidated industrial plants, and their location, in all districts of Bytom, this subject is significant in this city.
The fourth discourse, which is meaningful only in light of this research, is based on the scientific literature devoted to Bytom [10,11,12,32]. It should be noted that works discussing demographic, urban, and economic aspects are dominant. In this city, the decline in the population was mainly due to the deindustrialization of the city, and an urban policy focused on this problem that was not entirely satisfactory [13]. Works devoted to the aspect of spatial changes should also be noted. However, they are generally presented [33] or devoted to only one form of spatial development at a particular moment in time [34].
This article refers to all of the above-mentioned discourses, but with a special reference to spatial issues. These issues were included in the area of land-use changes. Changes in land use are both a factor and an effect of such phenomena as urban shrinkage or de-industrialization. This phenomenon is related to the changes in the number and structure of the population observed in this type of city [35,36,37]. In Central and Eastern Europe, such changes were noticed when researching (post-) industrial cities [26,38,39].
3. Methods and Data
Historical cartographic materials are a valuable source of information on the changes in land use over the last two hundred years [40,41,42,43,44,45,46,47,48,49,50,51]. Prussian Urmesstischblätter maps from the beginning of the 19th century, Messtischblatter maps from the end of the 19th century and the beginning of the 20th century were used to study land-use changes [52,53,54]. These maps were made at 1:25,000 scale using the table method by qualified military cartographers in the polyhedral projection of the Bessel ellipsoid [55]. According to research by W. Jankowski [56] and A. Konias [55], these materials are characterized by good cartometric properties that are comparable to contemporary cartographic materials from the turn of the 20th and 21st centuries. Archival Prussian maps were compared with Polish topographic maps from the end of the 20th century (prepared on a scale of 1:10,000), and with aerial photos from 2019 (on the same scale) that were obtained from the Open Regional Spatial Information System [57,58]. Archival and contemporary map materials and aerial photos have been rectified in MapInfo Professional 10.0 and then vectorized.
Vector maps were used to create a space-time database, from which a tabular summary of the city’s land-use structure was prepared (Table 1). In this way, information on the state of the city’s land development was obtained and organized into five-time steps: the beginning of the 19th century (1827), the end of the 19th century (1883), the beginning of the 20th century (1934), and the end of the 20th century (1993), and the beginning of the 21st century (2019). In addition, aerial photos of parts of the city were taken in 2021 using the DJI Phantom 4 Advanced uncrewed aerial vehicle.

Table 1.
Changes in land use in Bytom in the period 1827–2019.
The degree of anthropogenic transformation of the city area was calculated according to A. Macias’ classification, using the database on the land use structure [59]. This author distinguished eleven types of land use and assigned them the degree of anthropogenic transformation, as follows:
- natural surfaces (e.g., natural forests, natural watercourses, and lakes in class I cleanliness) with a transformation degree of 0%;
- subnatural surfaces (e.g., current forests with unchanged habitat and lakes with class II water purity) with a transformation degree of 10%;
- semi-natural areas (e.g., commercial forests and natural lakes in other water purity classes) with a transformation degree of 20%,;
- pseudo-natural areas (e.g., grasslands) with a transformation degree of 30%;
- anthropogenic surfaces with similarities with natural surfaces (e.g., parks, squares, and ponds) with a transformation degree of 40%;
- agricultural areas (e.g., arable land and orchards) with a transformation degree of 50%;
- areas of very intensive cultivation (e.g., home gardens and allotment gardens) with a transformation degree of 60%;
- sub-anthropogenic surfaces (e.g., cemeteries, sports grounds, and wooden buildings) with a transformation degree of 70%;
- semi-anthropogenic areas (e.g., rural and villa buildings, and unpaved roads) with a transformation degree of 80%;
- anthropogenic urbanized areas (e.g., compact development) with a transformation degree of 90%;
- anthropogenic, highly urbanized, and industrialized areas (e.g., large housing estates, industrial areas, communication areas, landfills, workings, dumps, settlements, and active slopes) with a transformation degree of 100%.
Each type of land use distinguished in the course of this study in individual time steps was classified into an appropriate group based on the source materials and literature. Watercourses were not included in the analysis because the authors considered their area negligible in relation to the entire research area. The degree of anthropogenic transformations of the area in particular periods was then calculated based on the following formula:
where:
P1, P2, P3....., P11—the size of the distinguished area [ha];
Pm—an area of the research area;
0%, 10%, 20%...., 100%—the degree of its anthropogenic transformation assigned to each unit.
The results obtained in this way represented the average degree of transformation of all the used areas in the study area in the five considered time steps. A. Macias [59] distinguished the following types of land transformation: landscape not transformed (0% transformation), very poorly transformed landscape (1–10%), poorly transformed landscape (11–30%), medium transformed landscape (31–50%), a firmly transformed landscape (51–70%), a strongly transformed landscape (71–90%), very strongly transformed landscape (91–99%), and a completely transformed landscape (100%).
4. Changes in Land Use in Bytom—Between Industrialization and De-Industrialization
4.1. Outline of the Economic Development of Bytom
Bytom is one of the main cities of the Katowice Conurbation (Figure 1). The city was founded under German Law in 1254 [60]. Over the centuries, Bytom developed thanks to its location on the trade route between Kraków and Wrocław, and ore mining—initially silver, and then zinc and lead [61,62]. The oldest mentions of mining works in the vicinity of towns date back to the first half of the 12th century [63,64]. For centuries, the mining of zinc and lead ores was an essential factor in developing the settlement network in the city area. For this purpose, numerous tunnels were built, and drainage devices were used [65,66,67].
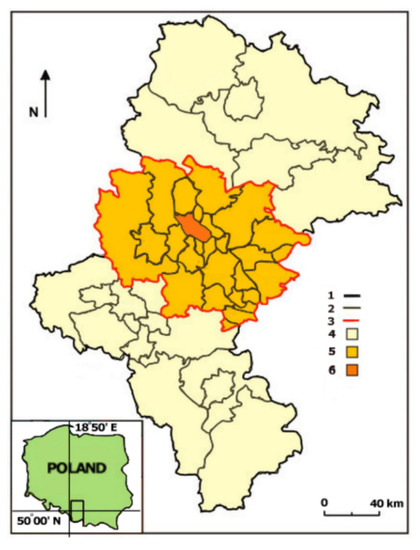
Figure 1.
Location of the studied city (Sourced by authors). Explanations: 1—Silesian province boundary; 2—county and commune boundaries; 3—Katowice conurbation boundaries; 4—area of the Silesian province outside the Katowice conurbation; 5—area of the Katowice conurbation; 6—city of Bytom discussed in the paper.
The machinery industry and railways that developed in the 19th century brought a huge demand for iron. The first hard coal mine in today’s city was established in 1794 [68]. It exploited coal in the area of Bobrek. The dynamic development of hard coal mining took place in the second half of the 19th century. The mining fields and small mines established at the beginning of this century were consolidated into larger plants [68]. The development of industry brought in a new stage in the development of the settlement. The newly established plants conditioned the creation of workers’ settlements, which were gradually incorporated into the city limits.
There were seven large mining plants in the city, two of which still operate today [68,69,70,71,72]. As a result of the transformation which started in the 1990s, most of the industrial plants in the city collapsed.
4.2. Land-Use Changes—Dynamic Perspective
4.2.1. Land-Use Changes in the Period from the Nineteenth to the Early Twenty-First Century
Over the past 196 years, there have been significant changes in the use of the area of Bytom. At the beginning of the 19th century, agricultural and forest areas covered almost 95.0% of the city’s area (Figure 2). The category of agricultural land includes arable fields, fallow land, post-agricultural wasteland, meadows and pastures. In the years 1827, 1883, 1934, and 1994, this category included all of the open and undeveloped areas that were used by default for agriculture: arable land, fallow land, and post-agricultural wasteland. The area of Bytom at the beginning of the 19th century was a typically agricultural region. In the 1820s, agriculture was either the main or additional source of income for most of the town’s inhabitants [73]. In the following sub-periods, the proportion of land being used for agricultural purposes diminished: at the beginning of the 19th century, 66.0% of the city’s area was used for agriculture, whereas at the beginning of the 21st century only 13.0% was used for agriculture. The most dynamic decrease in the share of these use categories took place during the 20th century, between 1934 and 1994. At that time, the share of agricultural (open) land decreased by 2.103 ha, (i.e., 30.0% of the current area of Bytom) (Table 1). Likewise, the share of meadows, pastures, and other grasslands in the same time period decreased from 9.0 to 5.0% (Table 1).
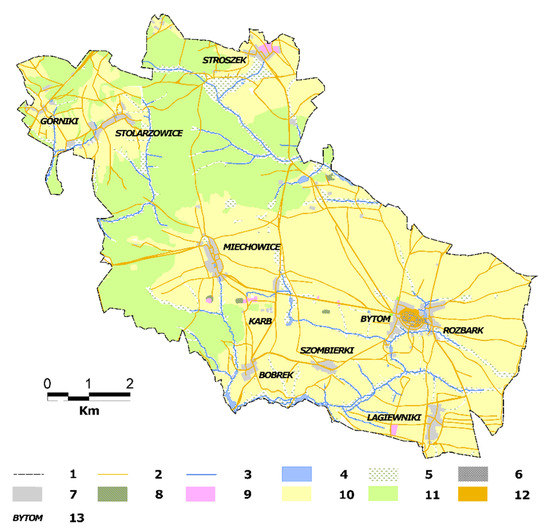
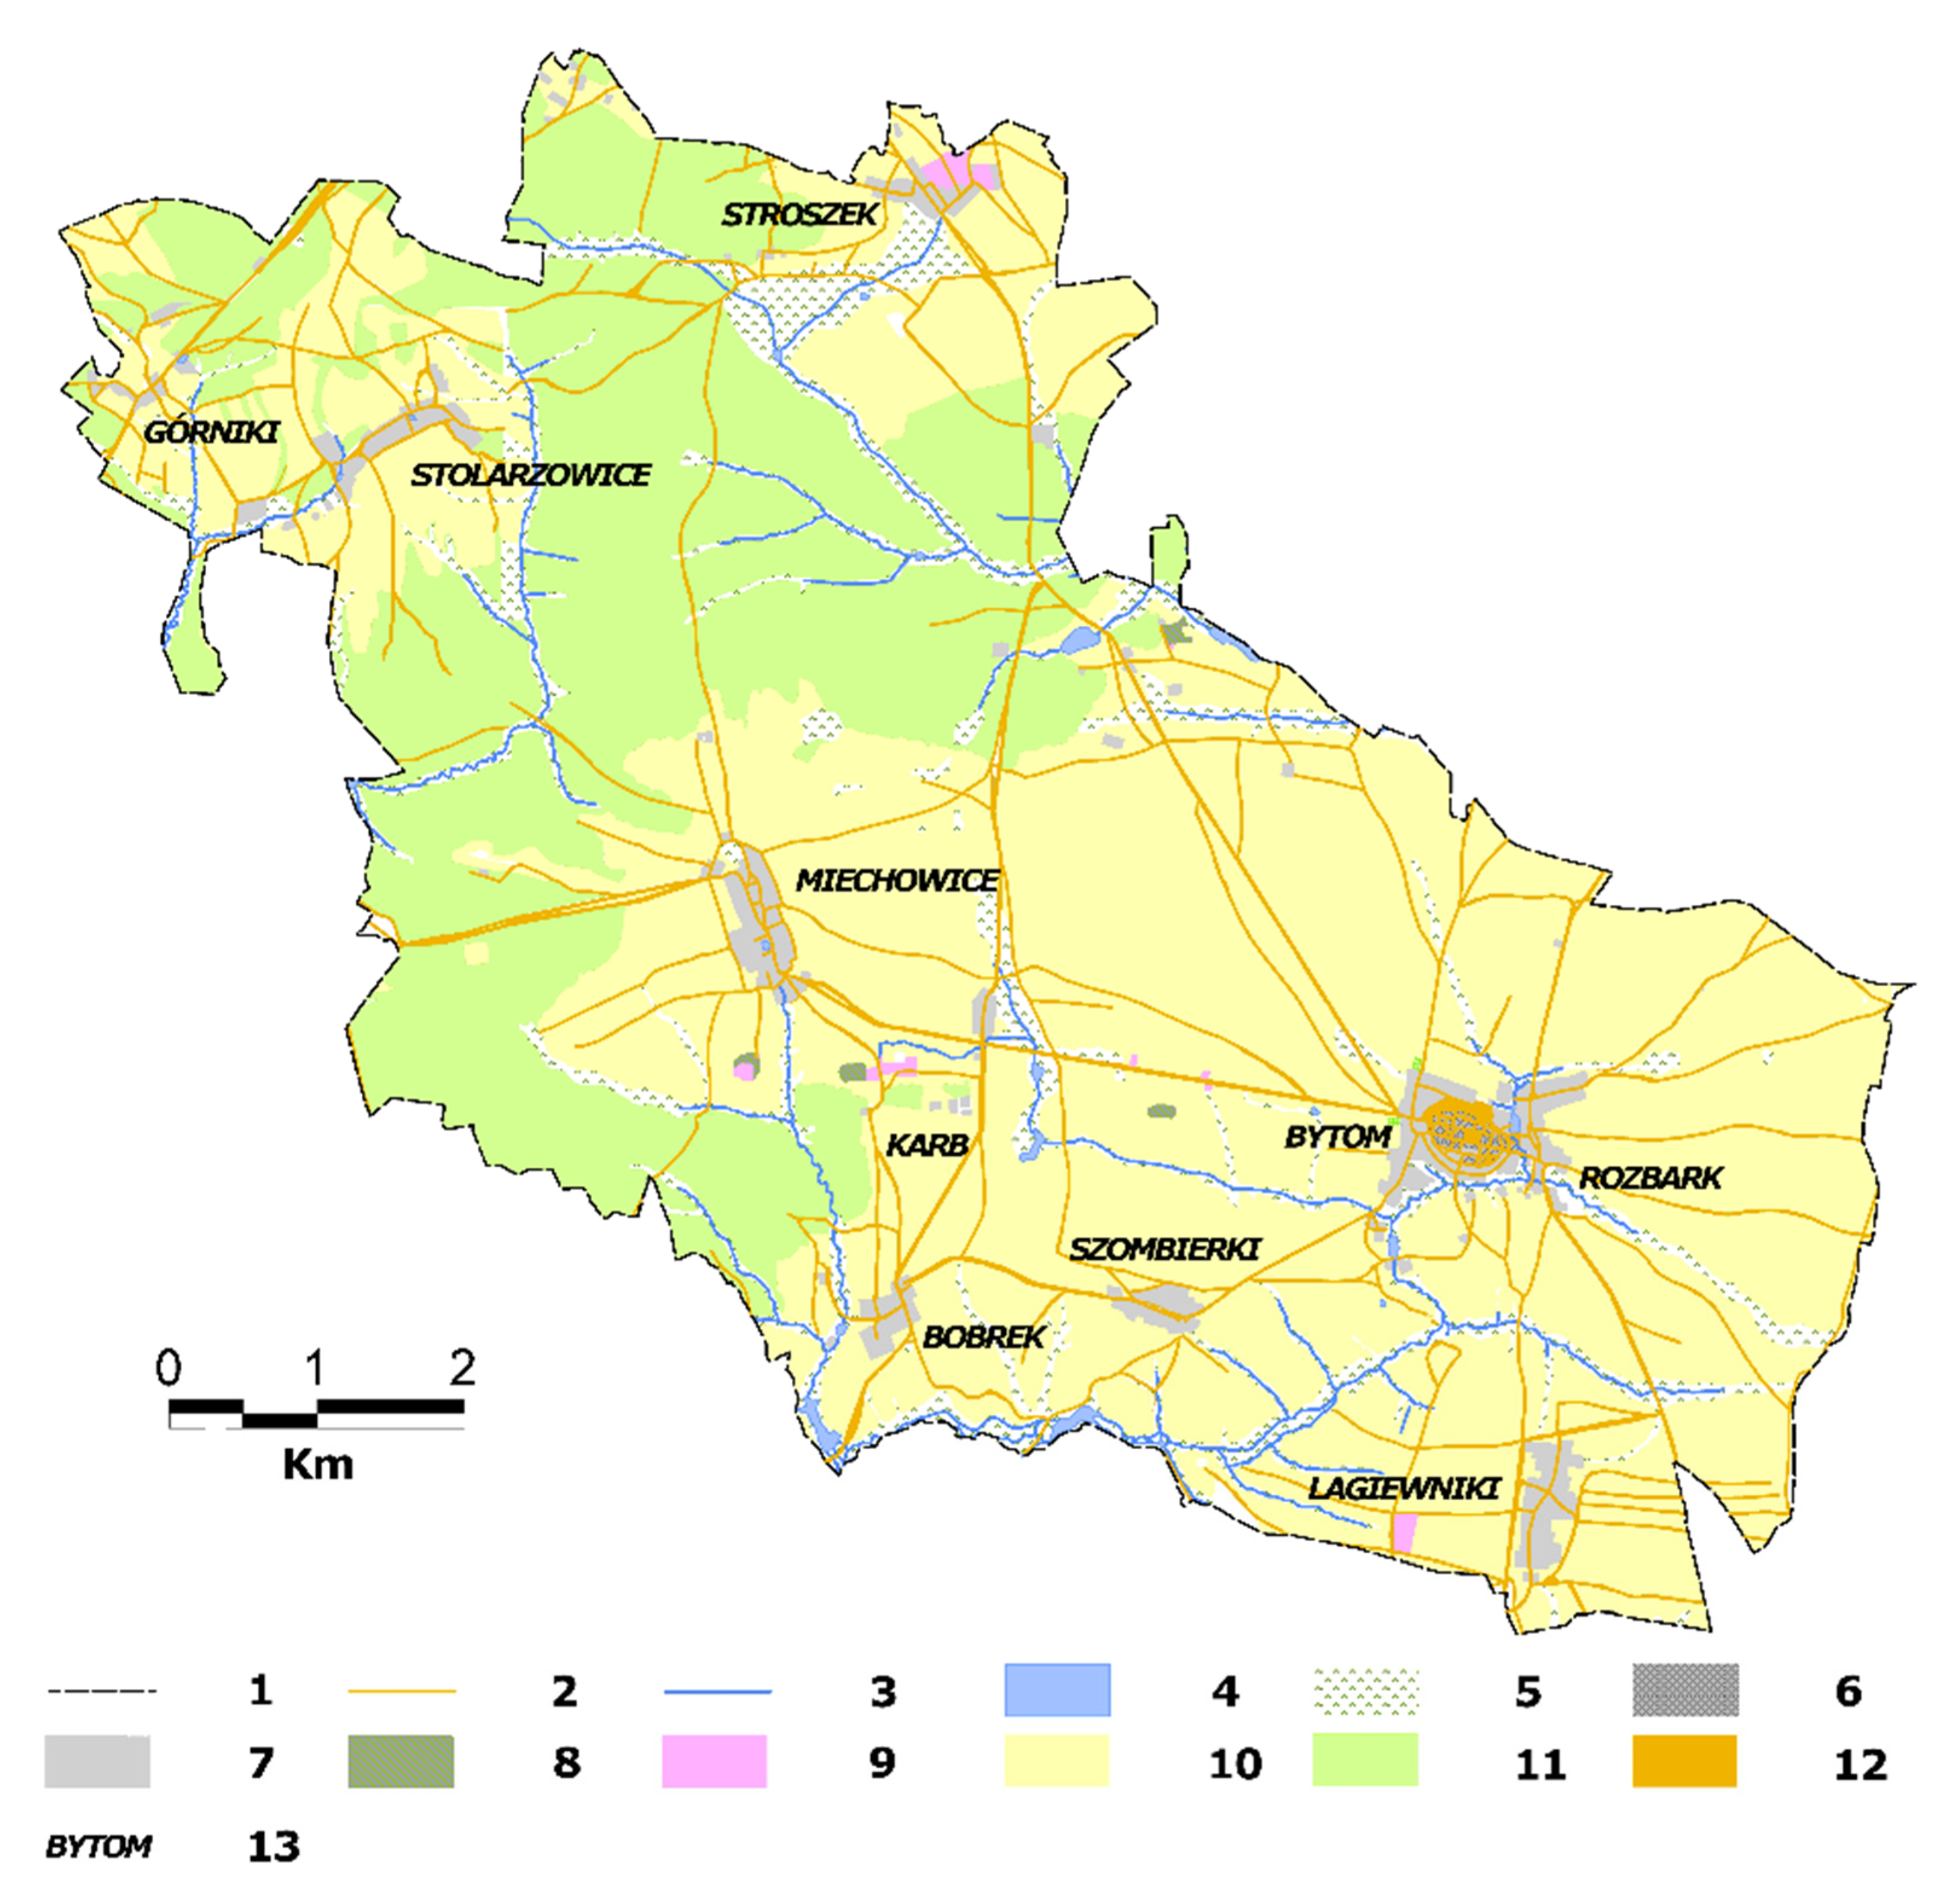
Figure 2.
The land use of the area of Bytom in 1827 (Sourced by authors on the basis of: Preussische Reussische Ur-messtischblatter, 1827, 1: 25,000, sheet: 3309 Beuthen; 3308 Hindenburg; 3257 Broslawitz; 3258 Tarnowitz; Berlin). Explanations: 1—current city border, 2—dirt and hardened roads, 3—water courses, 4—water reservoirs, 5—meadows, 6—compact development, 7—dispersed development, cemeteries, 8—ore and zinc extractions and post-extractions wastelands, 9—industrial areas, 10—arable fields, fallow lands, 11—forests and trees, 12—road areas, 13—topographic names.
The share of forest areas and tree cover slightly decreased from the beginning of the intensive industrialization of these areas (1827-1883-1934) due to the use of wood in industry and an increase in the proportion of built-up areas, industrial areas, heaps, and other categories of land use. Forests and trees covered almost 29.0% of Bytom’s area at the beginning of the 19th century. By the beginning of the 20th century, this proportion has decreased to almost 24.0%. However, the tendency was reversed in the 20th century. Between 1934–2019, there was an increase in the share of forested areas, which can be associated with the planned reclamation of some post-industrial areas, dumps, post-agricultural wasteland, or spontaneous succession (secondary succession) of unused areas. At the beginning of the 21st century, forests and trees covered over 31.0% of the city’s area, which is more than before the period of intense industrialization and urbanization.
The result of centuries of industrial activity within the city is a specific type of landscape, with a dominant accent of irregularly located industrial plants with densely crowded workers’ housing estates. An inseparable element of this landscape is the surface pits of ore and coal, clay pits, sandpits, gravel pits, solid rock quarries, waste rock dumps, and broadly understood post-excavation wastelands, created at various times of industrial development. Although this area has been subject to mining and anthropogenic pressures for almost 900 years, the most dynamic developments in many types of industries took place in the last two centuries. Even at the beginning of the 19th century, the area occupied by industrial areas was only 25.0 ha (0.4% of the research area). At that time, it consisted of: ore pits and post-excavation wasteland (7.4 ha—0.1%), heaps of waste material (0.6 ha—0.01%) as well as ore mines located in Szarlej, the northern part of Miechowice and between Miechowice, Karb and Bobrek, the total area of which was approximately 17.0 ha (0.2%) (Figure 2).
From the mid-nineteenth century, the industry was booming. In addition to ore mines, which exploit iron, zinc, and lead on an increasing scale, coal mines appeared. Coal has become an indispensable energy resource for metallurgy, railroads, and many other types of activity. The industrial plants and industrial-related areas amounted to 349.1 ha at the end of the 19th century, which was then slightly more than 5.0% of the contemporary city area. This land-use category structure was dominated by ore and post-excavation wastelands, covering 198.3 ha (2.8%). During this period, the percentage of industrial land and heaps also increased significantly. However, clay pits, quarries, sandpits, and gravel pits were a new landscape element. The raw materials they extracted were mainly used for the production of building materials (e.g., sand, gravel, clay, and limestone) and in metallurgical processes (e.g., dolomite) (Figure 3). The most dynamic development of industry and industrial areas occurred in the 20th century (see Figure 4 and Figure 5). The industrial area increased from 765.8 ha (11.0%) at the beginning of the century to 853.2 ha (12.2%) at the end of the century.
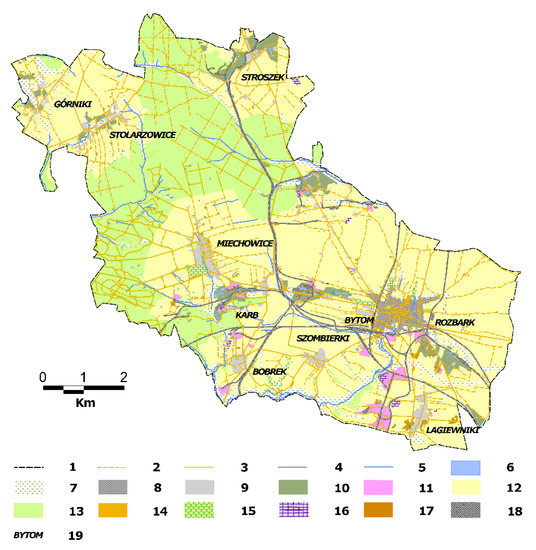
Figure 3.
The land use of the area of Bytom in 1883 (Sourced by authors on the basis of Herausgegeben von der Preussischen Landesaufnahme 1883. Reichsamt für Landesaufnahme., 1: 25,000, sheet: 3309 Beuthen; 3308 Hindenburg; 3257 Broslawitz; 3258 Tarnowitz; Berlin). Explanations: 1—current city border; 2—dirt roads; 3—paved roads; 4—railway lines; 5—water courses; 6—water reservoirs; 7—meadows; 8—dense development; 9—dispersed development, cemeteries, railway areas; 10—ore and zinc extractions and post-extractions wastelands; 11—industrial areas; 12—arable fields, fallow lands; 13—forests and trees; 14—road areas; 15—parks, squares, and lawns; 16—quarries; 17—gravel pits, clay pits and sand pits; 18—dumps; 19—topographic names.
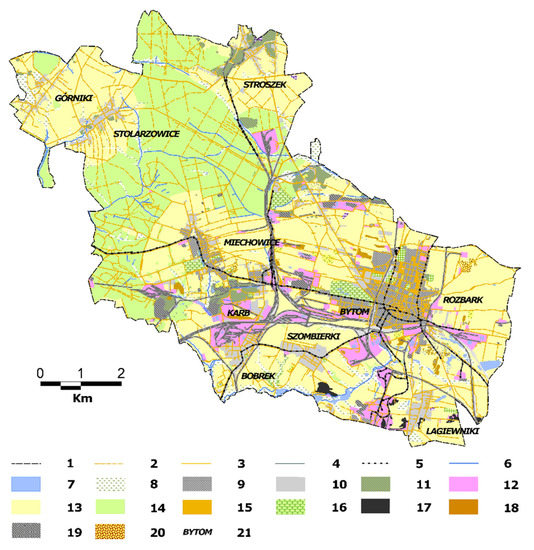
Figure 4.
The land use of the area of Bytom in 1934 (Sourced by authors on the basis of Herausgegeben von der Preussischen Landesaufnahme 1934. Reichsamt für Landesaufnahme., 1: 25 000, sheet: 3309 Beuthen; 3308 Hindenburg; 3257 Broslawitz; 3258 Tarnowitz; Berlin). Explanations: 1—current city border; 2—dirt roads; 3—paved roads; 4—railway lines; 5—tram lines; 6—water courses; 7—water reservoirs; 8—meadows; 9—dense buildings; 10—dispersed buildings, cemeteries, railway areas; 11—ore and zinc extractions and post-extractions wastelands; 12—industrial areas; 13—arable fields, fallow lands; 14—forests and trees; 15—road areas; 16—parks, squares, and lawns; 17—hard coal workings; 18—quarries, clay pits; 19—dumps; 20—sand pits; 21—topographic names.
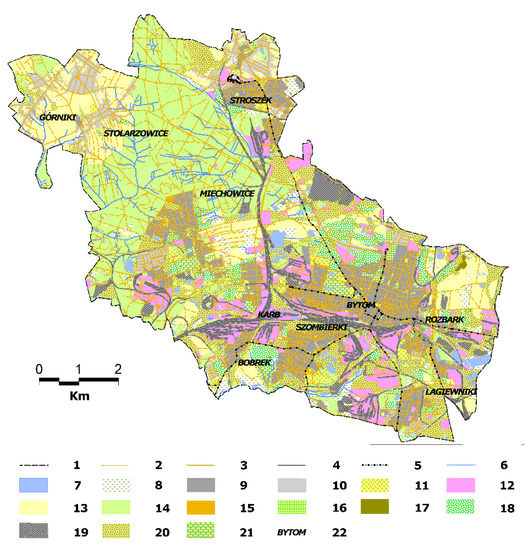
Figure 5.
The land use of the area of Bytom in 1994 (Sourced by authors on the basis of Topographic map of Poland 1994, 1: 10,000, sheet: M-34-50-D-C-1 Wieszowa; M-34-50-D-C-2 Bytom–Stolarzowice; M-34-50-D-C-3 Zabrze–Mikulczyce; M-34-50-D-C-4 Bytom–Miechowice; M-34-50-D-D-1 Bytom–Radzionków; M-34-50-D-D-3 Bytom–Centrum; M-34-50-D-D-4 Piekary Śląskie–Brzozowice Kamień; M-34-62-B-A-2 Ruda Śląska–Ruda; M-34-62-B-B-1 Świętochłowice; M-34-62-B-B-2 Chorzów). Explanations: 1—current city border; 2—dirt roads; 3—paved roads; 4—railway lines; 5—tram lines; 6—water courses; 7—water reservoirs; 8—meadows; 9—dense buildings; 10—dispersed buildings, railway areas; 11—sports facilities; 12—industrial areas; 13—arable fields, fallow lands; 14—forests and trees; 15—road areas; 16—cemeteries; 17—landfills; 18—allotment gardens; 19—dumps; 20—wastelands; 21—parks, squares, and lawns; 22—topographic names.
At the beginning of the 20th century, ore and post-excavation wastelands covered a large percentage of the area (2.4%). However, in the post-war years, this type of exploitation was discontinued. A similar situation occurred in sandpits, clay pits, and quarries, which at the beginning of the century covered 76.5 ha, which constituted 1.0% of the research area. At the end of the 20th century, extraction of the above-mentioned raw materials ceased. Due to the dynamic development of the mining industry in the 20th century, the percentage of the area occupied by heaps of waste material increased significantly. At the beginning of the 20th century, the area they occupied was 79.8 ha (1.1%). By the end of that century, it increased to 155.3 ha (2.2%). At the end of the 20th century, a significant percentage of the research area was a wasteland, as their area amounted to 790.7 ha (i.e., less than 11.3% of the area studied) (Table 1). In the 1990s, due to systemic transformation, industrial plants began to decline gradually. At the turn of the 20th and 21st centuries, hard coal mining was being stopped by most local mines. Five out of seven mining plants were closed, and two ironworks operating in the city (Huta Bobrek and Huta Zygmunt) were closed. As a result, the industrial area decreased to 458.9 ha (6.5%), of which 145.7 ha (2.0%) were waste rock dumps (Figure 6, Table 1). At the turn of the 20th/21st century, there was also a significant decrease in the area of wastelands (from 11.3% to 6.0%). Large-scale commercial facilities became a new category of land use at the beginning of the 21st century (Figure 6). In 2019, they occupied almost 1.5% of the area of Bytom. These facilities were built in post-industrial or wasteland areas. The decrease in the percentage of land occupied by wasteland at the turn of the 20th and 21st centuries was also because tree vegetation began to enter part of this area (Figure 6).
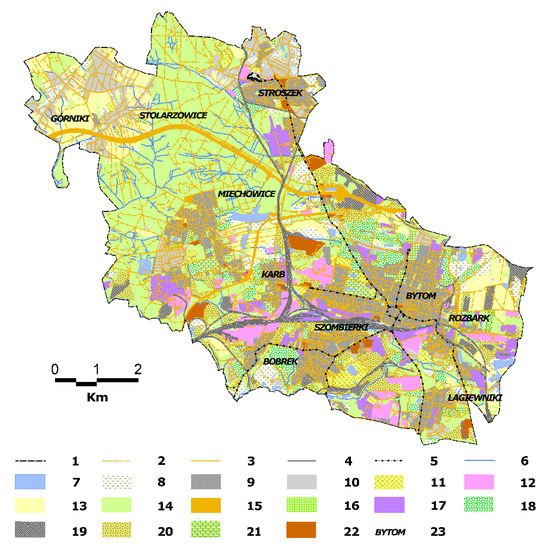
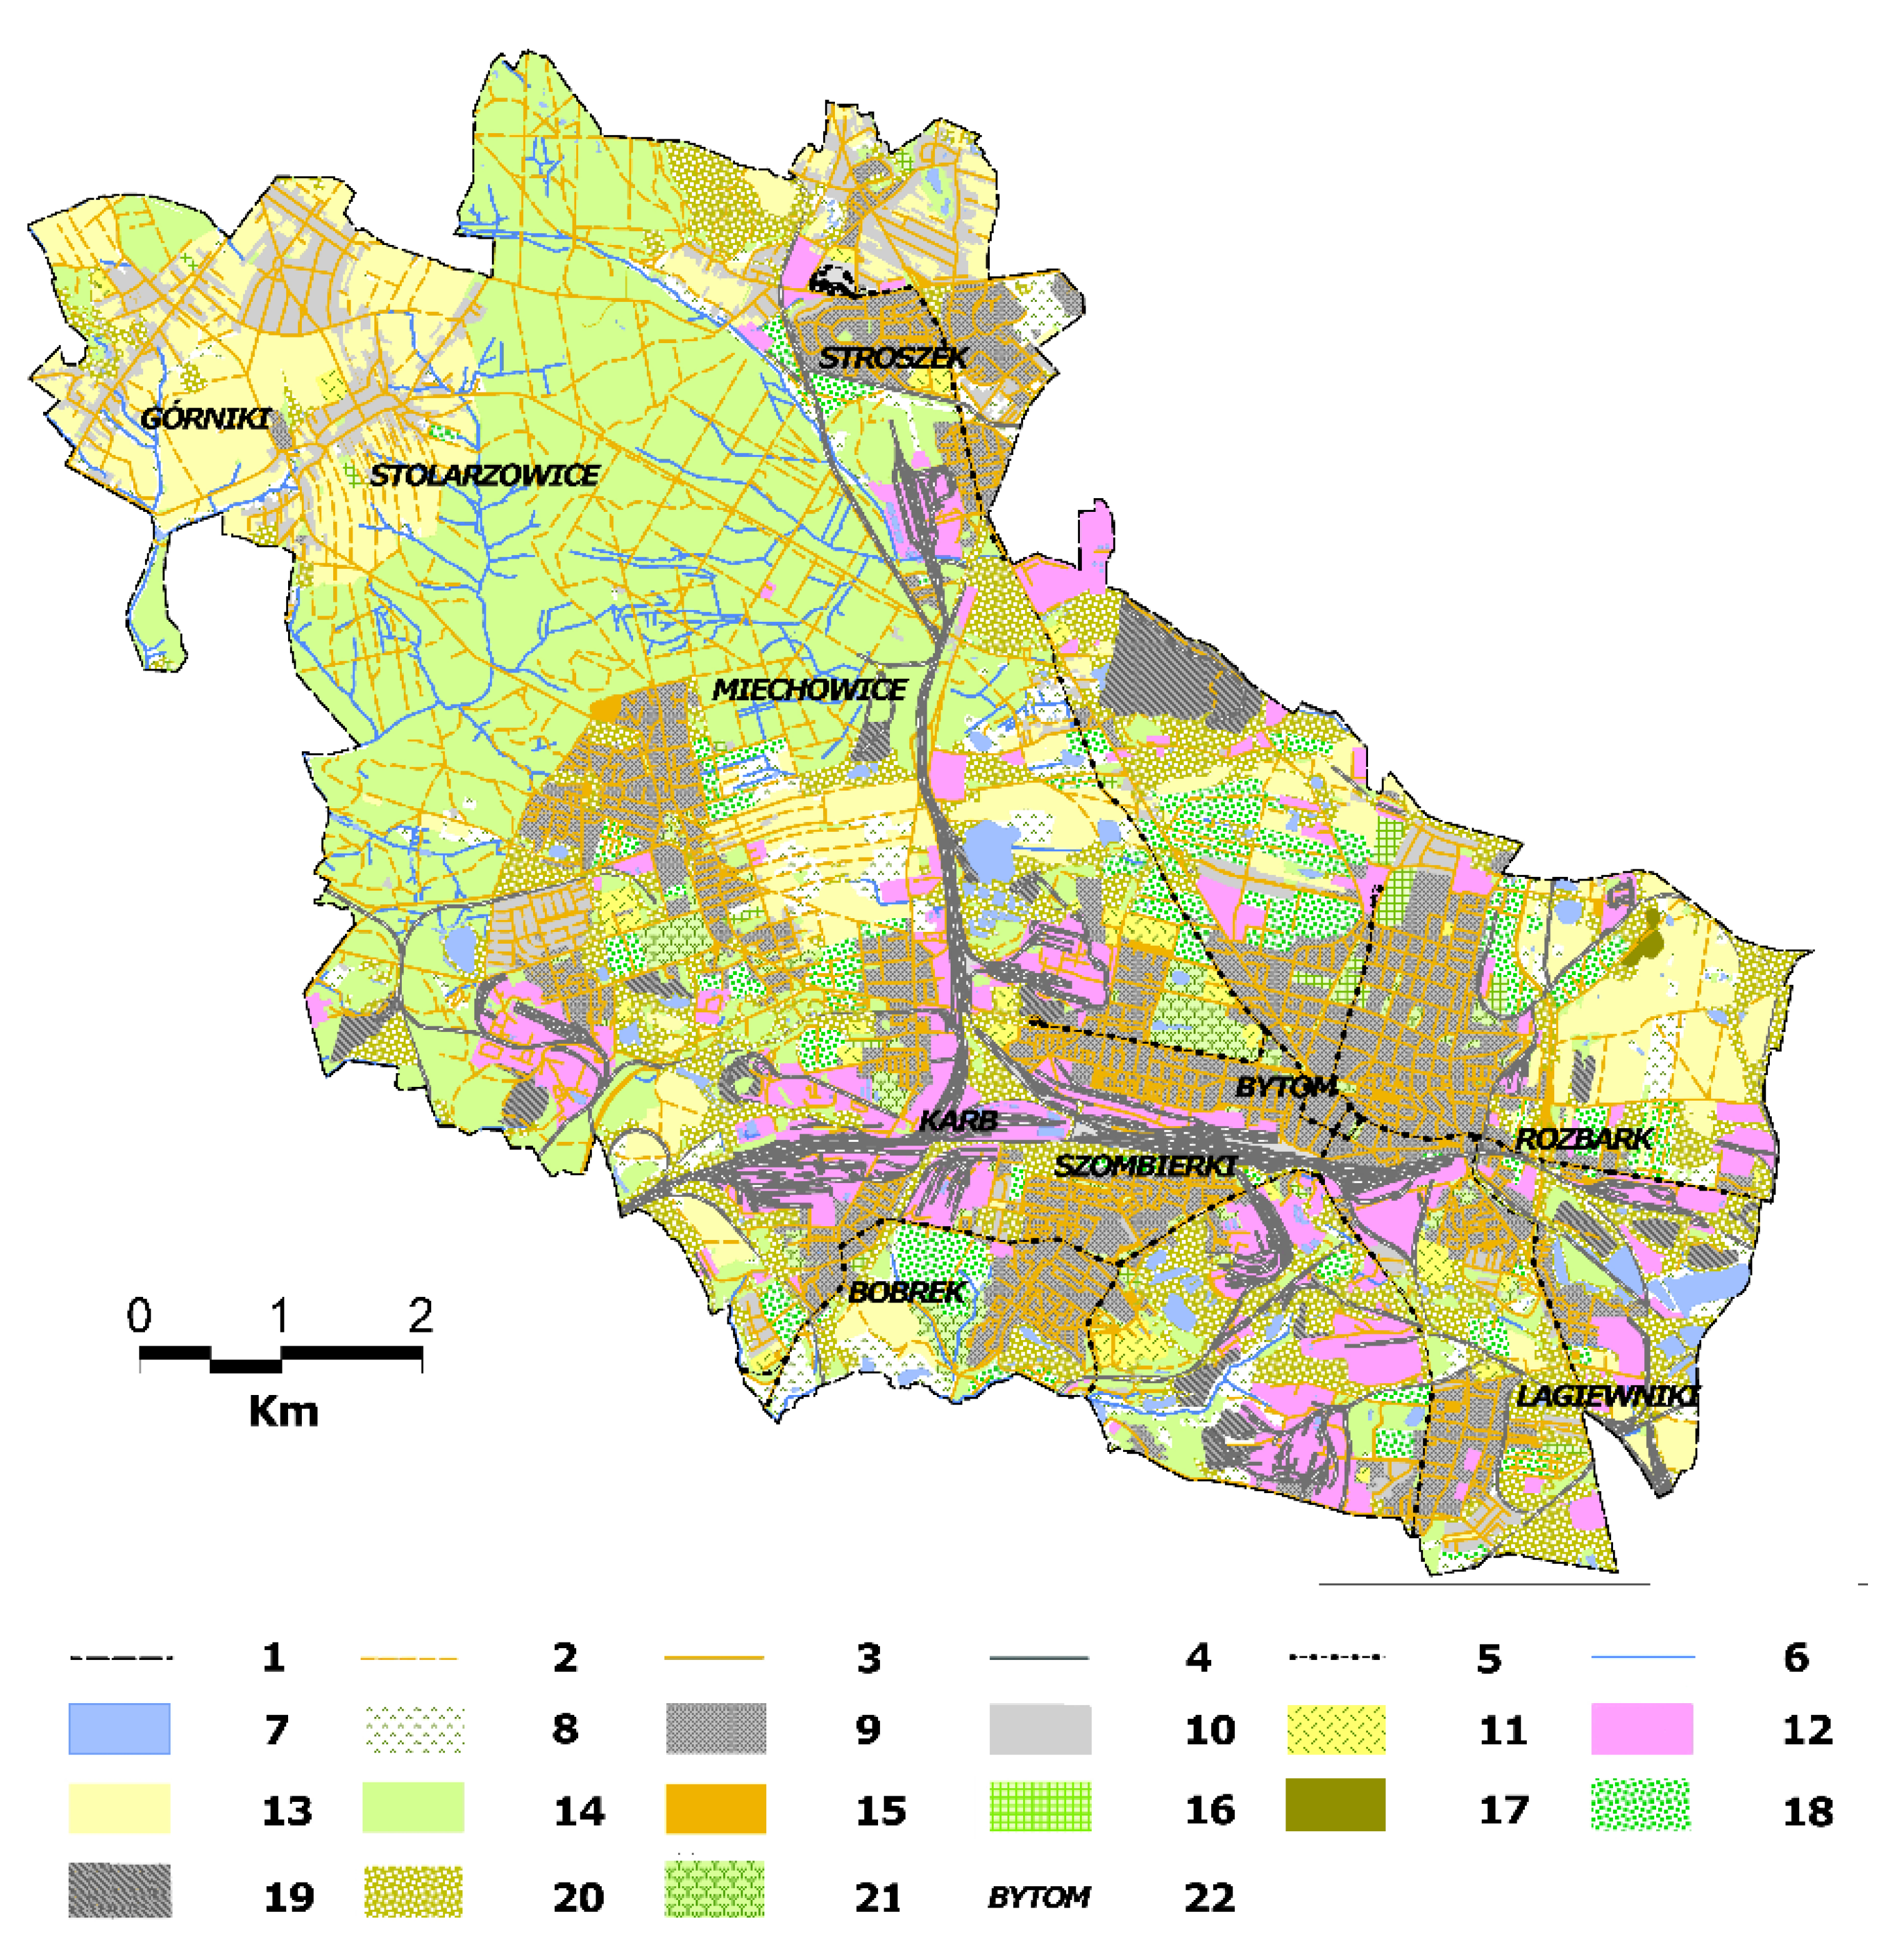
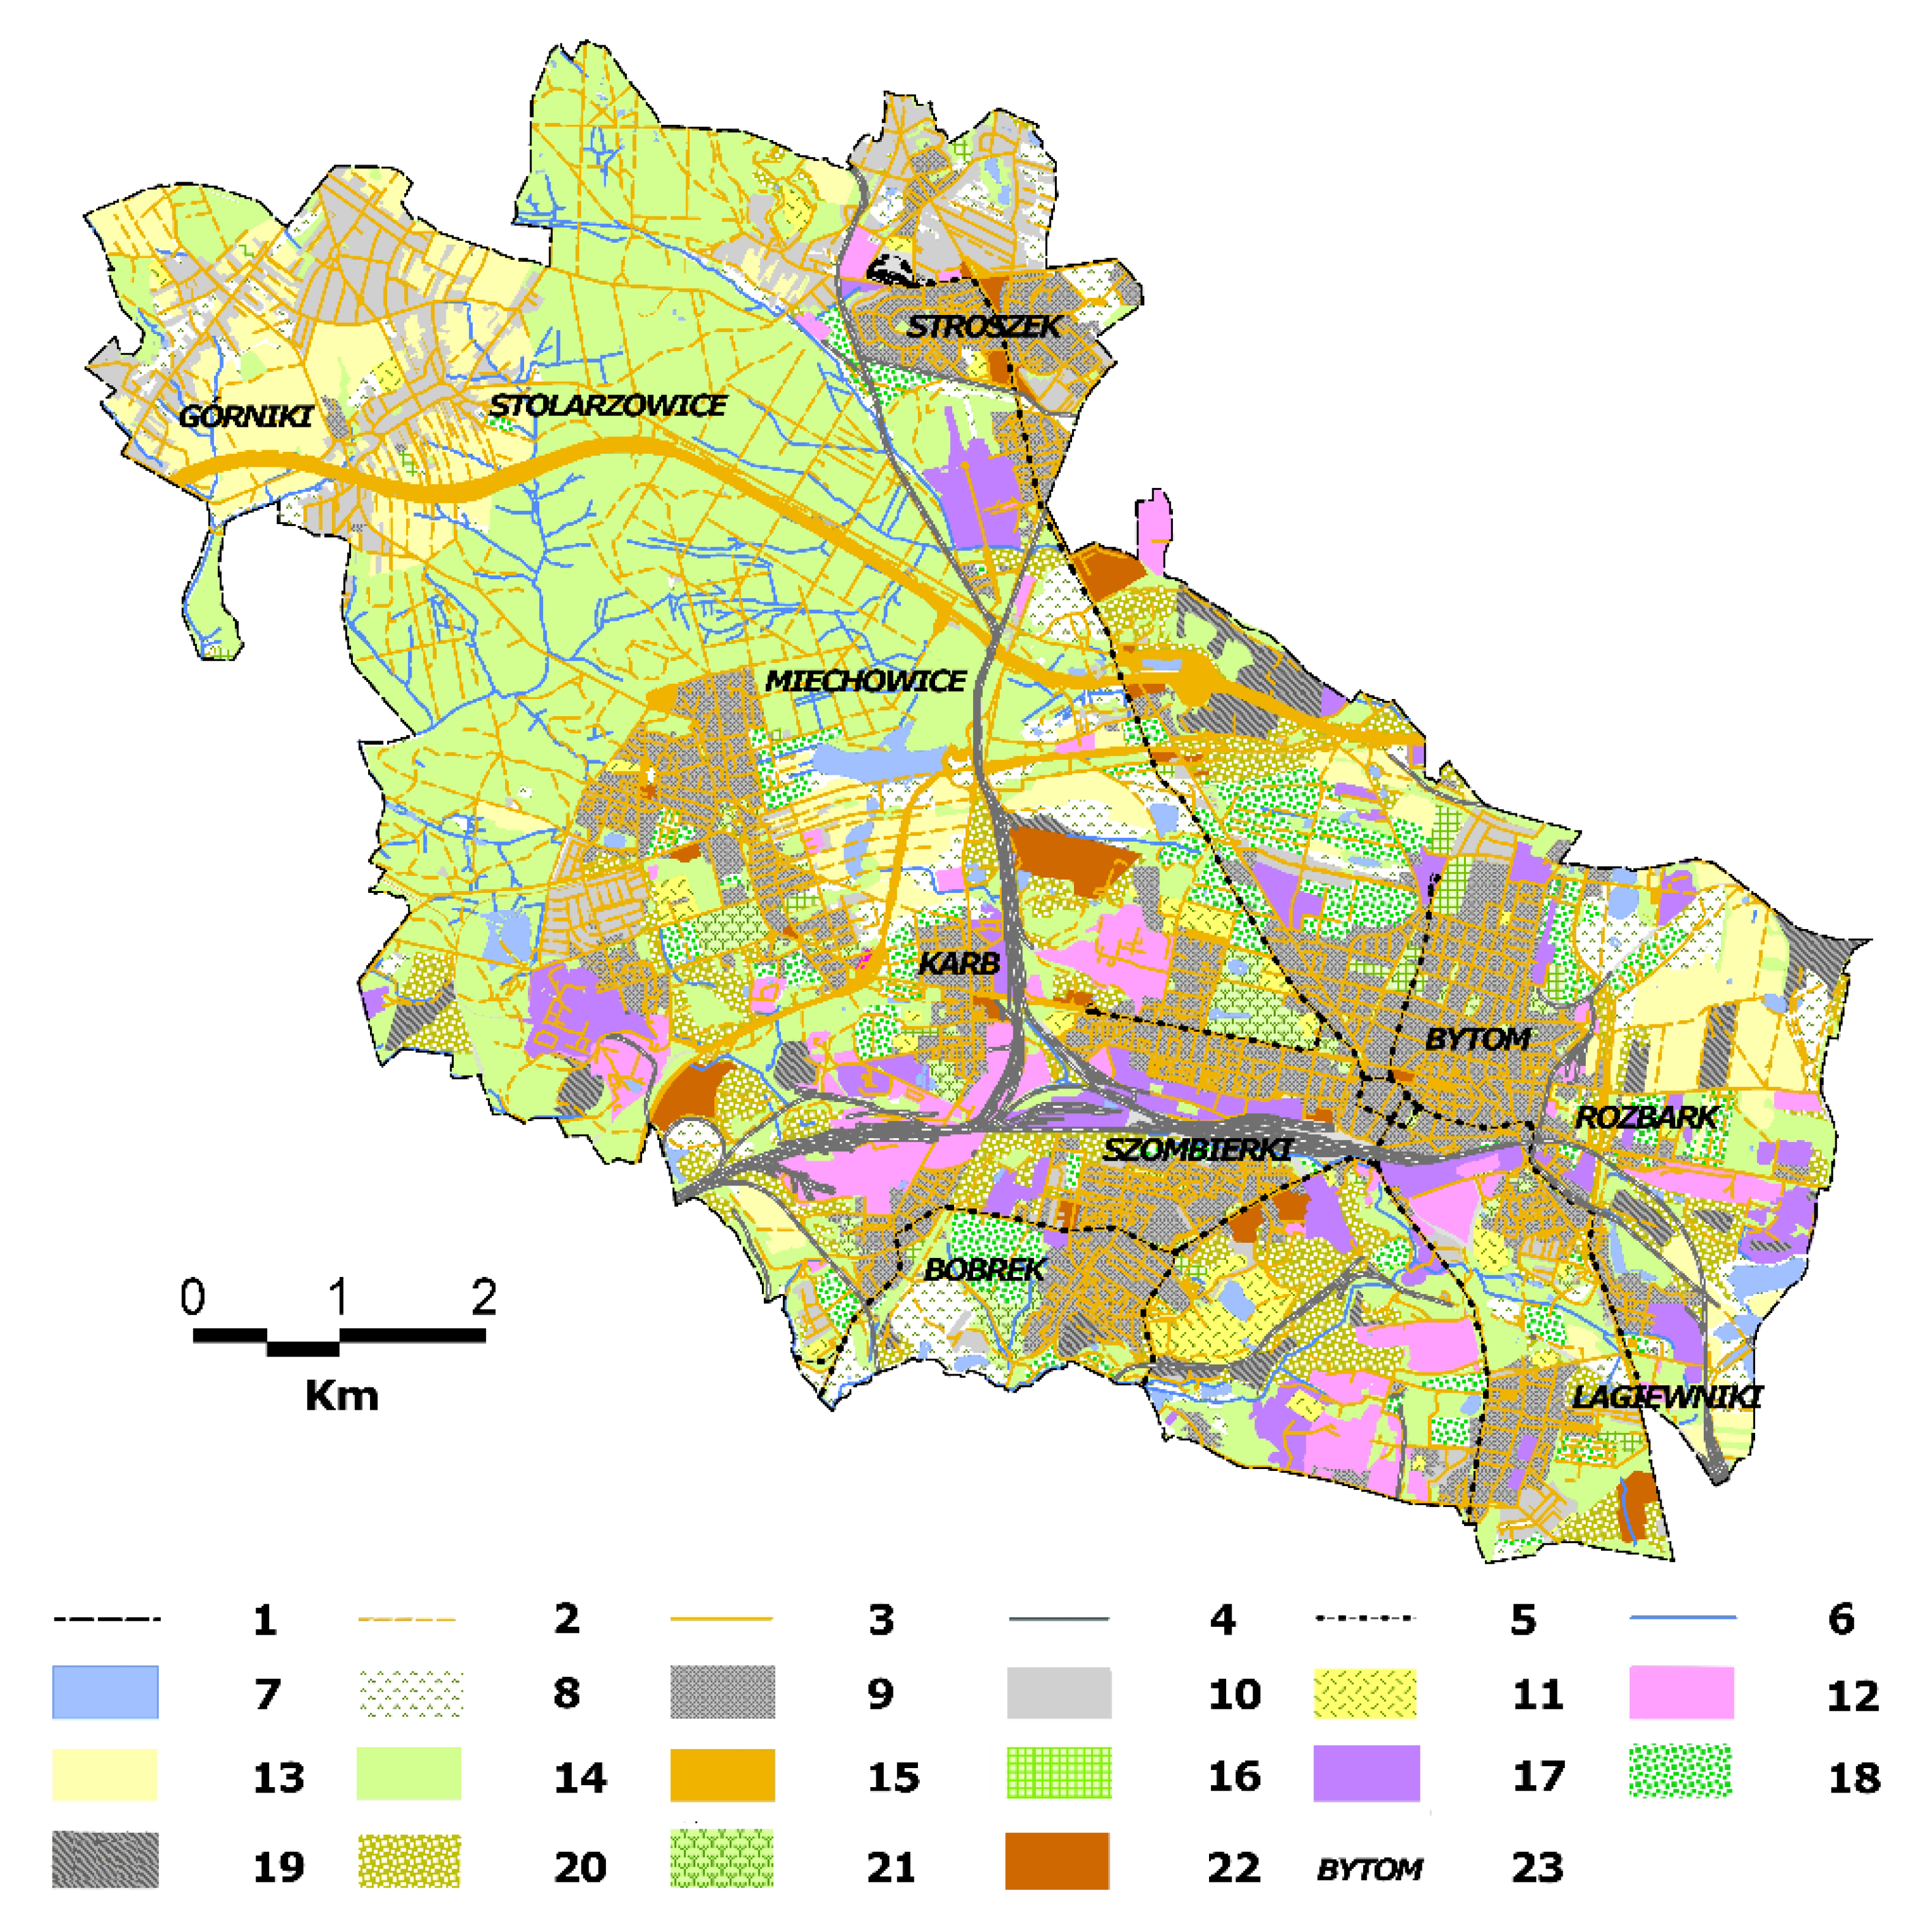
Figure 6.
The land use of the area of Bytom in 2019 (Sourced by authors on the basis of https://mapy.orsip.pl/imap/?gpmap=gp1-2) (accessed on 1 November 2020). Explanations: 1—current city border; 2—dirt roads; 3—paved roads; 4—railway lines; 5—tram lines; 6—water courses; 7—water reservoirs; 8—meadows; 9—dense buildings; 10—dispersed buildings, railway areas; 11—sports facilities; 12—industrial areas; 13—arable fields, fallow lands; 14—forests and trees; 15—road areas; 16—cemeteries; 17—postindustrial areas; 18—allotment gardens; 19—dumps; 20—wastelands, landfills; 21—parks, squares, and lawns; 22—malls; 23—topographic names.
The development of industry entailed the development of railways. The length of the railway lines increased until the end of the 20th century, when they reached the length of 321.6 km. However, at the beginning of the 21st century, it decreased by as much as 50.0% (Table 1). The reason for this was the liquidation of many industrial plants in the city.
The settlement network of the research area was fully developed already in the Middle Ages, but the spatial development of built-up areas over the centuries showed relatively little dynamism [67]. The situation changed only in the nineteenth century, when the dynamically developing industry resulted in an influx of large numbers of people and, consequently, the spatial development of built-up areas. Even at the beginning of the century, the area occupied by buildings was only 201.0 ha, which was only 2.9% of the total area of the study area (Table 1). At that time, the largest share in the built-up area was that of buildings in Bytom. However, it slightly exceeded the area of the medieval city walls. The city’s development progressed mainly along the roads leading towards Szarlej, Tarnowskie Góry, and Szombierki (Figure 2). Miechowice also had a relatively large share among the built-up areas. From the second half of the nineteenth century, due to the influx of people to the local industrial plants, the settlement network developed dynamically. At that time, workers’ housing estates in Miechowice, Szombierki, Karb, and Bobrek were established. Along with the progress of industrialization, the pace of expansion of Bytom also increased. In the 1870s, the buildings in the city center were densely packed, and in the place of old, primarily two-story houses, new multi-story ones were built [69].
There was also a further expansion of built-up areas beyond the medieval city area. The buildings initially developing along the roads leading from the city center were limited in this period due to their intersection with railway lines from the west, east, and south. This forced the northern direction of the spatial development of Bytom. During this period, the expansion of the city progressed in the area of today’s streets: Piekarska, Wolności, Żeromskiego, Witczaka, Brzezińska, Katowicka, Karol Miarka, Sądowa and Powstańców Warszawskich [73]. The lively construction movement resulted in an increase in built-up areas to 277.8 ha, which constituted 4.0% of the area of the study area (Figure 3). The period between the end of the nineteenth and the beginning of the twentieth century saw the development of the factory buildings characteristic of this area—the so-called family houses (Familienhaus). Along with the increase in people working in the nearby mines and steel mills, workers’ colonies and patronage estates developed. The largest of them were built in Bobrek. These were: the Huty Bobrek (Nowa Kolonia Robotnicza) workers’ housing estate built in 1907–1922 and the Graffin Johanna mine estate built in 1912–1920 (Figure 7). There was also further territorial development of Bytom towards the north, which was mainly caused by the mining activities of the Heintz mines (located to the south and east of the city), Hohenzollern (located south of the city), and Karsten-Centrum (located west of the city). At that time, the following estates were built in Bytom: Grossfeld (1930), Bergmannshoft (1934), Eisenbahnersieldung (1913), and the North Housing Estate (1930). A colony, Gemander, was built in Szombierki (1906–1908) [74].

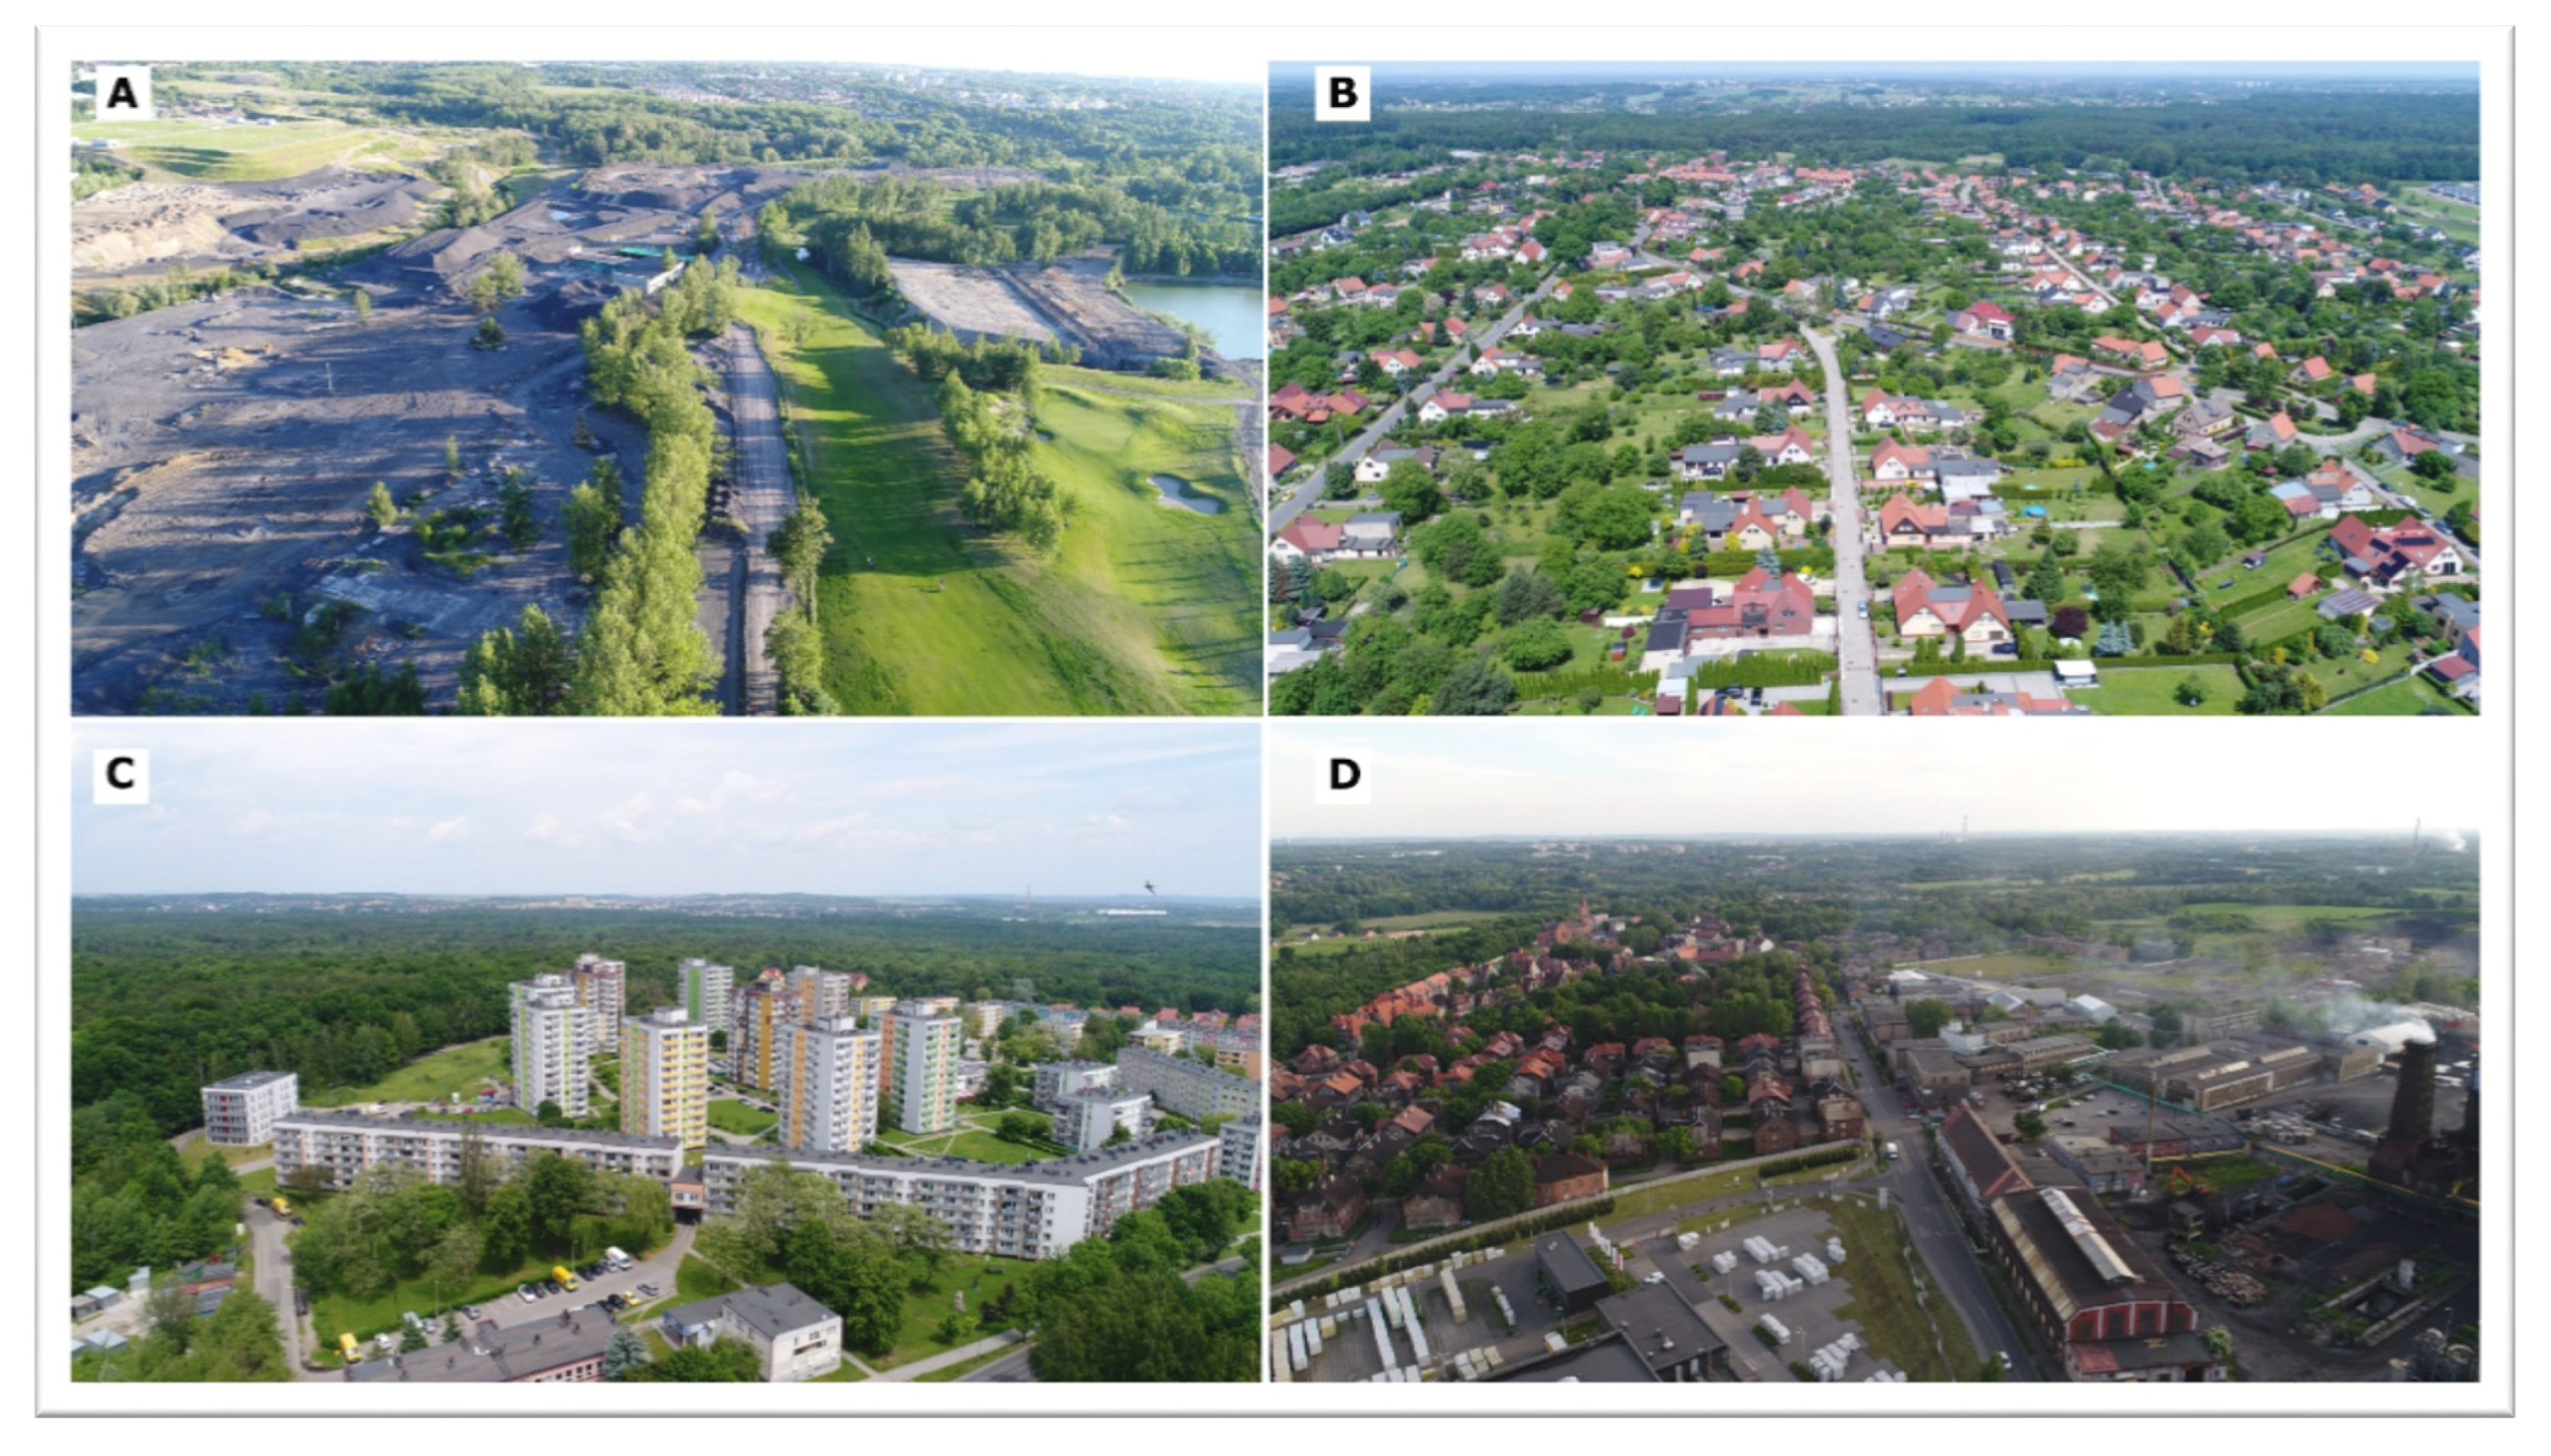
Figure 7.
Selected landscapes of Bytom in 2021 (Sourced by authors). Explanations: (A)—Reclaimed areas of the former the Szombierki Coal Mine; (B)—Single-family housing in the agricultural district of the Stolarzowice; (C)—Housing estate in the Miechowice district; (D)—The workers’ housing estate from the beginning of the 20th century (Nowa Kolonia Robotnicza) and a coking plant in the Bobrek district.
Miechowice, Karb, and the villages located in the northern part of the research area developed to a lesser extent. At the same time, the primary problem was in reconciling the construction development of Bytom and the neighboring towns with the dynamically developing mining industry. Hard coal mines owned a large percentage of the area in the city and its vicinity. The development of mining was in contradiction with the development of new housing estates. In the 1930s, the mining authorities took the initiative to transfer Bytom and the neighboring communes of Bobrek, Szombierki, Karb, and Miechowice to new housing estates, which were to be built near Pyskowice. The main goal of this project was to enable full exploitation of the rich hard coal deposits and metal ores lying near the city and neighboring villages. However, this plan was never implemented [75]. Thus, in the mid-1930s, the built-up area increased to 604.2 ha, which accounted for about 8.7% of the research area (Table 1). The period between the beginning and the end of the 20th century was the most dynamic (see Figure 4 and Figure 5).
The population inflow connected with employment in industry made it necessary to build large housing estates. During the Polish People’s Republic, housing estates of the so-called big plate were built. Housing estates were built, among others, in: Miechowice (the area including the streets: Stolarzowicka, Nickla, Felińskiego, Daleka, Nowa and Francuska), Szombierki (the area including the streets: gen. Grota-Roweckiego, Orzegowska, Modrzewskiego), Rozbark (the area including the streets: Chorzowska, Reymonta), in Karb (the area including: Technicznej, Konstytucji, ks. Popiełuszki streets), in Rokitnica (the area of Krakowska street) and in Bytom itself (the area of Wrocławska, Olimpijska streets) (Figure 7). In the 1950s, as part of the country’s administrative reform, Miechowice, Bobrek, Karb, Łagiewniki and Szombierki were incorporated into Bytom. In the 1970s, the city also included Górniki, Stolarzowice and Radzionków, which on January 1 1998 again became an independent commune. At the end of the 20th century, the area occupied by built-up areas increased to 1222.6 ha, which constituted less than 17.2% of the studied area. Between 1994 and 2019, there was a further increase in the share of built-up areas (by 125.5 ha). This was the result of the emergence of new small housing estates (e.g., in Miechowice, Szombierki) and single-family housing in the following districts: Górniki, Stolarzowice and Miechowice (Figure 7). The spatial development of built-up and industrial areas resulted in an increase in road areas. Their share in the analyzed period increased from 1.7% at the beginning of the 19th century to 7.3% at the beginning of the 21st century. Until the first half of the 20th century, unpaved roads dominated the city. In the 20th and early 21st centuries, Bytom saw a gradual increase in the length of paved roads and a slight decrease in the length of dirt roads (Table 1). During the period under study, the share of landscaped green areas in the city increased, including cemeteries, parks, squares, lawns, allotment gardens as well as sports facilities and grounds. At the beginning of the 21st century, these areas covered a total of 562.9 ha (i.e., 8.0% of the city area). The development of industry resulted in the creation of many water reservoirs, the total area of which increased until the end of the 20th century, and then slightly decreased at the beginning of the 21st century (Table 1). Water reservoirs were created in clay, sand and gravel excavations, solid rock quarries and in numerous subsidence basins [76].
4.2.2. The Degree of Land Use in Bytom in Terms of the SAPT Indicator
In order to synthetically determine the degree of anthropogenic land transformation (SAPT) of the city, the indicator proposed by A. Macias [59] was used. The indicator was calculated for five stages: the beginning and the end of the 19th century, the beginning and the end of the 20th century, and the 21st century. For this purpose, land use categories with a specific degree of anthropogenic transformation were distinguished (Table 2).
Table 2.
Changes in the Degree of Anthropogenic Transformation of the Bytom Area in 1827–2019.
At the beginning of the 19th century, the average value of SAPT in the whole region was 40.8%, and the range was 31.0% to 50%, which corresponds to landscapes that are moderately transformed by humans. The largest share in the city’s area was then held by agricultural areas, which according to A. Macias [59], are classified as areas with 50% anthropogenic transformation, and commercial forests, classified as semi-natural areas, with a transformation degree of 20%. The forests, which are the area’s natural vegetation, have been gradually decommissioned since the Neolithic Revolution. At the expense of forest areas, arable fields, meadows, and pastures, which are the primary source of food in the era of agri-livestock farming, were expanded. The process of deforestation in these areas intensified in the Middle Ages and the modern era. According to research by A. Nyrek [77], by the middle of the 17th century, the forest cover of Upper Silesia was already decreased to only slightly over 40%, with the most deforested areas being those with fertile soils and those favorable to settlement. At that time, the areas between Bytom, Tarnowskie Góry, Siewierz, and Będzin were heavily deforested, which can be attributed primarily to the relatively high population density in this region [77]. Within the research area, vast amounts of wood were also used for the needs of zinc and lead mining, for adits and drainage galleries [78]. Until the mid-nineteenth century, wood was the primary building material and a commonly used fuel [77].
The third largest proportion of land in the area of the city was pseudo-natural areas (30% transformation), which included meadows, pastures, and other grasslands. Sub-anthropogenic (70% transformation) and semi-anthropogenic (80% transformation) areas covered only 4.6% of Bytom’s area, most of which were built-up areas and road areas (primarily unpaved). At that time, highly urbanized and industrialized areas, characterized by 100% anthropogenic transformation, occupied only 0.4% of the city’s area. This category was dominated by industrial areas; mainly mines and workings of zinc and lead ores (Table 2).
The calculations made based on maps published at the end of the 19th century show that, at that time, the SAPT index increased to 47.4% (i.e., it was still within the range of 30–50%), corresponding to the anthropogenically transformed landscapes. During this period, the area of agricultural land, forests, and grasslands slightly decreased. In these areas, new pads of zinc and lead ores and hard coal were opened, and the areas of extraction of ores and other raw materials were expanded. The areas occupied by buildings and road areas also expanded, and railway areas were a new element of the city’s landscape. As a result, these areas replaced areas that were poorly and moderately transformed by humans (from 20.0 to 50.0%) with the highest degree of anthropogenization (from 90.0 to 100.0%) (Table 2).
The 20th century brought further dynamic developments in the mining industry and related industrial plants located in the city. Until the 1990s, the SAPT index increased by over 10.0%, reaching its maximum value in the entire period under study: 64.3%. This value still corresponds to the areas that have heavily anthropogenically transformed. Nevertheless, areas with a conversion of over 80% covered almost half of the city area (49.0%). Although the share of forested areas slightly increased, at the same time, the areas of agricultural land (arable land, meadows, and pastures) decreased significantly. The 20th century, especially after World War II, brought a very high demand for raw materials. In the economic system of the Polish People’s Republic, hard coal mining played a particular role, and coal was the most crucial export raw material throughout its duration [70]. At that time, Bytom became one of the leading industrial centers of the Upper Silesian Coal Basin. The dynamic development of industry caused an influx of people, which resulted in the creation of new housing estates (large slabs). The share of land devoted to road areas also increased. At the end of the 20th century, wastelands became an essential element of the city space (Table 2).
The turn of the 1980s and 1990s was a time of systemic transformation in Poland. Following this period was the transition from a centrally controlled socialist economy to a capitalist economy. The consequence of these changes was the collapse of many industrial plants in Upper Silesia, including Bytom. As a result, the share of industrial areas decreased significantly, and their place was taken by post-industrial areas and post-industrial wastelands, which were partially overgrown or planted with trees during the reclamation process. Thus, at the beginning of the 21st century, the area covered by forests and trees increased. During this period, there was a further decline in agricultural land, railway land, and waste heaps (road construction material). On the other hand, the share of built-up areas (resulting from suburbanization) and road areas increased. As a consequence of the collapse of many industrial sectors and changes in land use, the SAPT index calculated for 2019 was slightly less than for 1994—61.0%, and the area occupied by areas above 80% of anthropogenic transformation decreased to 46.1% of the city’s area.
5. Discussion
A city that loses its previous functions in a short time is exposed to advanced deurbanization. However, this has a different character in terms of the scale of the loss recorded in individual spheres (demographic, economic, infrastructural, and financial). It should also be noted that urban shrinkage activates (self) defense mechanisms at the same time. These are visible in urban policy, in initiatives like rebuilding the local economic base, revitalization and gentrification in residential districts, redevelopment of brownfields, pro-demographic and pro-social projects [79,80,81,82,83,84]. In the long run (e.g., 20–30 years), their results may eliminate regressive tendencies.
Over the last two centuries, Bytom has undergone very significant changes in spatial development. Until the mid-nineteenth century, these were towns surrounded by forests and agricultural areas with a network of neighboring, still poorly-industrialized villages. From the mid-nineteenth century until the end of the twentieth century, there was a rapid development of the city outside and intense urbanization of agricultural villages. This trend is visible in the overall and percentage increases in the amount of land invested. In the second half of the 20th century, due to housing, industrial and communal buildings, the investment zones covering most of the city’s districts were also integrated. In terms of the development of built-up zones and the development of demographic structures, Bytom was similar to Hoyt’s concentric model [34].
Undoubtedly, the turning point in the spatial and functional development of the city occurred in 1990. The de-industrialization of the city also brought about its deurbanization. This is evident in the demographic dimension. In 1990–2020, the city’s population dropped from almost 240,000 to 165.2 K inhabitants [13]. In 1998, the former district of Radzionków, which became a separate town, separated from the city [79]. The processes of deurbanization were also visible in the spatial structure of the city. There was an increase in the share of post-industrial areas, a decrease in the area and share of industrial areas, the liquidation of part of the municipal and transport infrastructure. Another aspect of deurbanization and shrinking of the city, not studied here, was the most significant number of deserted dwellings in the voivodship [80]. All of these indicators undoubtedly indicate the problem of the city’s demographic and economic decline. On the other hand, there was an increase in green areas, including forests and built-up areas. Regardless of the large number of vacant flats, new buildings and housing estates were also built (including Szombierki, Miechowice, Górniki, and Stolarzowice).
In post-industrial cities with the urban shrinkage syndrome, regardless of the need for their broadly understood revitalization, there is a need to find functional changes; this applies both to the mentioned workplaces and spatial zoning. This research indicates that, for some post-industrial and post-mining cities, the natural direction of changes in spatial development is partial “renaturalization” of the city and a focus on residential and service functions. This direction is also visible in Bytom [84]. Interestingly, regardless of the provisions of strategic and planning documents, this process took place in reality. The areas whose share increased after 1990 are forests and residential areas. Tree plantings entered both the former wastelands and some post-industrial and post-mining areas. The process of natural vegetation succession in post-mining areas of different historical origins in the studied urban region was recently presented by Rahmonov et al. [85] and Abramowicz et al. [86].
The dual nature of changes in the spatial structure of Bytom can also be seen in the typology of Macias [59]. The area and share of land close to the natural category have been increasing in recent decades. On the other hand, there has been a noticeable upward trend in anthropogenic urbanized areas, which mostly overlap with residential buildings.
In light of this, from the perspective of post-industrial studies of shrinking cities, can the proposed typology of Macias [59] be a helpful tool? Taking Bytom as an example—a larger Polish city considered to have experienced significant urban shrinkage—it should be approached positively. Shifting the center of gravity to the scale of changes determined, on the one hand, by natural areas and, on the other hand, by extremely anthropogenic transformations, allows for a direct reference to the issue of, for example, the diversified development of cities. Furthermore, suppose we assume that sustainable development is where a balance is sought between the environment and human well-being. In that case, the proposed typology is a good reference point for determining the scale of sustainable development in the examined city.
A weakness, and indeed a research challenge, is aggregating individual types of development into specific typological ranges determined by A. Macias [59]. To be more specific, the problem may be the different nature of data in different countries, concerning the nomenclature or defining the types of development. For example, even though they are visually wooded, some forests and green areas have different statuses in municipal documents—forest, park, wasteland, post-industrial area, recreation area, and others. Significant discrepancies in this respect may cause imperfection in determining the degree of sustainability and the balance between anthropogenization and naturalization of urban space. Moreover, if such problems occur in one city, in one country, it is likely that this method may encounter barriers when comparing cities from different countries.
6. Conclusions
Changes in the use of urban space are a natural element of urban development. However, in shrinking cities, post-industrial cities, and those that Rodríguez-Pose [2] has termed cities which “do not matter,” the issue takes on an additional dimension. It is not just the direction these changes should pursue that is of relevance, but how such cities are supposed to look and function. The scale of problems in such cities is usually large, so it seems that the decision-making perspective should be shorter (at least theoretically). The sustainable development of cities in the 21st century essentially directs these expectations towards development, which reconciles the environment and well-being. In researching the idea of a sustainable city, there is a need to improve the tools and methods of cognition. In this context, the article presents Bytom—one of the most problematic large cities in the European Union. Assuming that an element of understanding the degree of sustainability may be the proportions between “natural” structures and “anthropogenic” structures, the author’s used the method of A. Macias [59], in which each type of spatial development corresponds to the percentage share of each of the attributes mentioned above. Despite some imperfections of this method regarding the possibility of data aggregation (even in the same country or city), it should be stated that this method provides an interesting impulse for further research on the naturalization and sustainability of cities, not only research that focuses on those aspects that are problematic. This study also confirms the observations resulting from the analysis of temporal changes in individual types of spatial development.
Author Contributions
Conceptualization, M.S. and R.K.; methodology, M.S. and R.K.; software, M.S.; validation, M.S. and R.K.; formal analysis, M.S. and R.K.; investigation, M.S. and R.K.; resources, M.S. and R.K.; data curation, M.S.; writing–original draft preparation, M.S. and R.K.; writing–review and editing, M.S. and R.K.; visualization, M.S.; supervision, R.K. All authors have read and agreed to the published version of the manuscript.
Funding
This research received no external funding.
Institutional Review Board Statement
Not applicable.
Informed Consent Statement
Not applicable.
Data Availability Statement
The data presented in this study are available on request from the corresponding author.
Conflicts of Interest
The authors declare no conflict of interest.
References
- Pacione, M. Urban Geography; Routledge: London, UK, 2005. [Google Scholar]
- Rodríguez-Pose, A. The revenge of the places that don’t matter (and what to do about it). Camb. J. Reg. Econ. Soc. 2018, 11, 189–209. [Google Scholar] [CrossRef]
- Fol, S.; Cunningham-Sabot, E. Urban Decline and Shrinking Cities: A Critical Assessment of Approaches to Urban Shrinkage. Ann. Géogr. 2010, 674, 359–383. [Google Scholar] [CrossRef]
- Schindler, S.; Gillespie, T.; Banks, N.; Bayırbağ, M.; Burte, H.; Kanai, M.; Sami, N. Deindustrialization in cities of the Global South. Area Dev. Policy 2020, 5, 283–304. [Google Scholar] [CrossRef] [Green Version]
- Taft, C.E. Deindustrialization and the Postindustrial City, 1950–Present. Oxf. Res. Encycl. Am. Hist. 2018. [Google Scholar] [CrossRef]
- Rieniets, T. Shrinking Cities: Causes and Effects of Urban Population Losses in the Twentieth Century. Nat. Cult. 2009, 4, 231–254. [Google Scholar] [CrossRef]
- Döringer, S.; Uchiyama, Y.; Penker, M.; Kohsaka, R. A meta-analysis of shrinking cities in Europe and Japan: Towards an integrative research agenda. Eur. Plan. Stud. 2019, 28, 1693–1712. [Google Scholar] [CrossRef] [Green Version]
- Li, H.; Mykhnenko, V. Urban shrinkage with Chinese characteristics. Geogr. J. 2018, 184, 398–412. [Google Scholar] [CrossRef]
- Audirac, I. Shrinking cities: An unfit term for American urban policy? Cities 2018, 75, 12–19. [Google Scholar] [CrossRef]
- Krzysztofik, R.; Runge, J.; Kantor-Pietraga, I. Paths of Shrinkage in the Katowice Conurbation. Case Studies of Bytom and Sosnowiec Cities; WNoZ Uniwersytet Śląski: Sosnowiec, Poland, 2011. [Google Scholar]
- Krzysztofik, R.; Runge, J.; Kantor-Pietraga, I. An Introduction to Governance of Urban Shrinkage. A Case of Two Polish Cities: Bytom and Sosnowiec; WNoZ Uniwersytet Śląski: Sosnowiec, Poland, 2012. [Google Scholar]
- Runge, J.; Michalski, T.; Runge, A. The Level of Preparedness among the Local Governments of the Katowice Conurbation for Risks Associated with Depopulation and Ageing of the Population. Stud. Transit. States Soc. 2020, 12, 77–92. [Google Scholar]
- Kantor-Pietraga, I. Does One Decade of Urban Policy for the Shrinking City Make Visible Progress in Urban Re-Urbanization? A Case Study of Bytom, Poland. Sustainability 2021, 13, 4408. [Google Scholar] [CrossRef]
- Kantor-Pietraga, I.; Krzysztofik, R.; Runge, J.; Spórna, T. Problemy zarządzania miastem kurczącym się na przykładzie Bytomia [Problems of governance shrinking city for the example of Bytom]. In Społeczna Odpowiedzialność w Procesach Zarządzania Funkcjonalnymi Obszarami Miejskimi [Social Responsibility in the Processes of Governance Functional Urban Areas]; Markowski, T., Stawasz, D., Eds.; Biuletyn KPZK PAN: Warszawa, Poland, 2014; pp. 162–175. [Google Scholar]
- Runge, A.; Runge, J.; Kantor-Pietraga, I.; Krzysztofik, R. Does urban shrinkage require urban policy? The case of a post-industrial region in Poland. Reg. Stud. Reg. Sci. 2020, 7, 476–494. [Google Scholar]
- Mykhnenko, V.; Turok, I. East European Cities—Patterns of Growth and Decline, 1960–2005. Int. Plan. Stud. 2008, 13, 311–342. [Google Scholar] [CrossRef]
- Reckien, D.; Martinez-Fernandez, C. Why Do Cities Shrink? Eur. Plan. Stud. 2011, 19, 1375–1397. [Google Scholar] [CrossRef]
- Bănică, A.; Istrate, M.; Muntele, I. Challenges for the Resilience Capacity of Romanian Shrinking Cities. Sustainability 2017, 9, 2289. [Google Scholar] [CrossRef] [Green Version]
- Spórna, T.; Kantor-Pietraga, I.; Krzysztofik, R. Trajectories of depopulation and urban shrinkage in the Katowice conurbation, Poland. Espace Popul. Soc. 2016, 1, 316–343. [Google Scholar] [CrossRef]
- Bontje, M. Facing the challenge of shrinking cities in East Germany: The case of Leipzig. GeoJournal 2004, 61, 13–21. [Google Scholar] [CrossRef]
- Pallagst, K. Shrinking cities in the United States of America: Three cases, three planning stories. In The Future of Shrinking Cities: Problems, Patterns and Strategies of Urban Transformation in a Global Context; Wu, T., Rich, J., Eds.; Monograph 2009-01; University of California: Oakland, CA, USA, 2009; pp. 81–88. [Google Scholar]
- Wolff, M.; Wiechmann, T. Urban growth and decline: Europe’s shrinking cities in a comparative perspective 1990–2010. Eur. Urban. Reg. Stud. 2017, 25, 122–139. [Google Scholar] [CrossRef]
- Martínez-Fernandez, C.; Audirac, I.; Fol, S.; Cunningham-Sabot, E. Shrinking cities: Urban challenges of globalization. Int. J. Urban Reg. Res. 2012, 36, 213–225. [Google Scholar] [CrossRef]
- Rall, E.L.; Haase, D. Creative intervention in a dynamic city: A sustainability assessment of an interim use strategy for Brownfield in Leipzig, Germany. Landsc. Urban Plan. 2011, 100, 189–201. [Google Scholar] [CrossRef]
- Spórna, T. The suburbanisation process in a depopulation context in the Katowice conurbation, Poland. Environ. Socio-Econ. Stud. 2018, 6, 57–72. [Google Scholar] [CrossRef] [Green Version]
- Stryjakiewicz, T. (Ed.) Kurczenie Się Miast w Europie Środkowo-Wschodniej [Shrinking Cities in Central-Eastern Europe]; Bogucki Scientific Publishers: Poznań, Poland, 2014; p. 155. [Google Scholar]
- Runge, J.; Kłosowski, F.; Runge, A. Conditions and Trends of Social-economic Changes of Katowice region. Bull. Geogr. Socio-Econ. Ser. 2003, 2, 85–102. [Google Scholar]
- Krzysztofik, R.; Kantor-Pietraga, I.; Kłosowski, F. Between Industrialism and Postindustrialism—The Case of Small Towns in a Large Urban Region: The Katowice Conurbation, Poland. Urban Sci. 2019, 3, 68. [Google Scholar] [CrossRef] [Green Version]
- Martinat, S.; Navratil, J.; Hollander, J.B.; Trojan, J.; Klapka, P.; Klusacek, P.; Kalok, D. Re-reuse of regenerated brownfields: Lessons from an Eastern European post-industrial city. J. Clean. Prod. 2018, 188, 536–545. [Google Scholar] [CrossRef]
- Pytel, S.; Sitek, S.; Chmielewska, M.; Zuzańska-Żyśko, E.; Runge, A.; Markiewicz-Patkowska, J. Transformation Directions of Brownfields: The Case of the Górnośląsko-Zagłębiowska Metropolis. Sustainability 2021, 13, 2075. [Google Scholar] [CrossRef]
- Krzysztofik, R.; Dulias, R.; Kantor-Pietraga, I.; Spórna, T.; Dragan, W. Paths of urban planning in a post-mining area. A case study of a former sandpit in southern Poland. Land Use Policy 2020, 99, 104801. [Google Scholar] [CrossRef]
- Bernt, M.; Haase, A.; Großmann, K.; Cocks, M.; Couch, C.; Cortese, C.; Krzysztofik, R. How does(n’t) Urban Shrinkage get onto the Agenda? Experiences from Leipzig, Liverpool, Genoa and Bytom. Int. J. Urban Reg. Res. 2014, 38, 1749–1766. [Google Scholar] [CrossRef]
- Krzysztofik, R.; Runge, J.; Kantor-Pietraga, I. Governance of urban shrinkage: A tale of two Polish cities, Bytom and Sosnowiec. In Contemporary Issues in Polish Geography; Churski, P., Ed.; Bogucki Scientific Publishers: Poznań, Poland, 2012; pp. 201–224. [Google Scholar]
- Waldman, K.; Krzysztofik, R. Zmiany obszaru zabudowy mieszkaniowej w krajobrazie śródmiejskim Bytomia w okresie od XIX do XXI wieku [Changes in the built-up area in the urban landscape of Bytom from the 19′th to the 21′st century]. Pr. Kom. Kraj. Kult. 2019, 42, 7–24. [Google Scholar] [CrossRef]
- Lima, M.F.; Eischeid, M.R. Shrinking cities: Rethinking landscape in depopulating urban contexts. Landsc. Res. 2017, 42, 691–698. [Google Scholar] [CrossRef] [Green Version]
- Hollander, J.B.; Pallagst, K.; Schwarz, T.; Popper, F. Planning shrinking cities. Prog. Plan. 2009, 72, 223–232. [Google Scholar]
- Rink, D.; Rumpel, P.; Slach, O.; Cortese, C.; Violante, A.; Bini, P.C.; Haase, A.; Mykhnenko, V.; Nadolu, B.; Couch, C.; et al. Shrink Smart. Governance of Shrinkage—Lessons Learnt from Analysis for Urban Planning and Policy; Helmholtz Centre for Environmental Research: Leipzig, Germany, 2012; p. 47. [Google Scholar]
- Rumpel, P.; Slach, O. Governace of Shrinkage of the City of Ostrava; European Science and Art Publishing: Praha, Czech Republic, 2012. [Google Scholar]
- Jaroszewska, E. Urban Shrinkage and Regeneration of an Old Industrial City: The Case of Wałbrzych in Poland. Quaest. Geogr. 2019, 38, 75–90. [Google Scholar] [CrossRef] [Green Version]
- Petit, C.; Lambin, E. Impact of data integration technique on historical land-use/land-cover change: Comparing historical maps with remote sensing data in the Belgian Ardennes. Landsc. Ecol. 2002, 17, 117–132. [Google Scholar] [CrossRef]
- Pradela, A.; Solarski, M. Wykorzystanie Systemów Informacji Geograficznej do badań przemian powierzchniowej sieci hydrograficznej w XIX i XX wieku na przykładzie bytomskiego rejonu złożowego. [Use of the Geographical Information System to researches of surface hydrographic network changesin 19th and 20th century on the Bytom deposit area example]. In Woda w Badaniach Geograficznych [Water in the Geographical Researches]; Ciupa, T., Suligowski, R., Eds.; Uniwersytet Jana Kochanowskiego w Kielcach: Kielce, Poland, 2010; pp. 231–241. [Google Scholar]
- Skaloš, J.; Weber, M.; Lipský, Z.; Trpáková, I.; Šantrůčková, M.; Uhlířová, L.; Kukla, P. Using old military survey maps and orthophotograph maps to analyse long-term land cover changes—Case study (Czech Republic). Appl. Geogr. 2011, 31, 426–438. [Google Scholar] [CrossRef]
- Affek, A. Kalibracja map historycznych z zastosowaniem GIS. In Źródła Kartograficzne w Badaniach Krajobrazu Kulturowego; Plit, J., Nita, J., Eds.; Komisja Krajobrazu Kulturowego PTG: Sosnowiec, Poland, 2012; Volume 16, pp. 48–62. [Google Scholar]
- James, L.A.; Hodgson, M.E.; Ghoshal, S.; Latiolais, M.M. Geomorphic change detection using historic maps and DEM differencing: The temporal dimension of geospatial analysis. Geomorphology 2012, 137, 181–198. [Google Scholar] [CrossRef]
- Solarski, M. Anthropogenic transformations of the Bytom area relief in the period of 1883–1994. Environ. Socio-Econ. Stud. 2013, 1, 1–8. [Google Scholar] [CrossRef]
- Harnischmacher, S.; Zepp, H. Mining and its impact on the earth surface in the Ruhr District (Germany). Z. Geomorphol. 2014, 58, 3–22. [Google Scholar] [CrossRef]
- Kaim, D.; Kozak, J.; Ostafin, K.; Dobosz, M.; Ostapowicz, K.; Kolecka, N.; Gimmi, U. Uncertainty in historical land-use reconstructions with topographic maps. Quaest. Geogr. 2014, 33, 55–63. [Google Scholar] [CrossRef] [Green Version]
- Dulias, R. Changes in Morphometric Parameters of Terrain Caused by Mining. In The Impact of Mining on the Landscape. Environmental Science and Engineering; Springer: Berlin/Heidelberg, Germany, 2016; pp. 83–93. [Google Scholar] [CrossRef]
- Yang, Y.Y.; Zhang, S.W.; Liu, Y.S.; Xing, X.S.; de Sherbinin, A. Analyzing historical land use changes using a Historical Land Use Reconstruction Model: A case study in Zhenlai County, northeastern China. Sci. Rep. 2017, 7, 41275. [Google Scholar] [CrossRef]
- Szypuła, B. Digital adaptation of the Geomorphological Map of Upper Silesian Industrial Region, Poland (1:50,000)—Old map new possibilities. J. Maps 2020, 16, 614–624. [Google Scholar] [CrossRef]
- Henselowsky, F.; Rölkens, J.; Kelterbaum, D.; Bubenzer, O. Anthropogenic relief changes in a long-lasting lignite mining area (‘Ville’, Germany) derived from historic maps and digital elevation models. Earth Surf. Process. Landf. 2021, 46, 1725–1738. [Google Scholar] [CrossRef]
- Topographic Maps. Preussische Reussische Ur-messtischblatter, 1827, 1: 25 000, sheet: 3309 Beuthen; 3308 Hindenburg; 3257 Broslawitz; 3258 Tarnowitz; Berlin.
- Topographic Maps. Herausgegeben von der Preussischen Landesaufnahme 1883. Reichsamt für Landesaufnahme., 1: 25 000, sheet: 3309 Beuthen; 3308 Hindenburg; 3257 Broslawitz; 3258 Tarnowitz; Berlin.
- Topographic Maps. Herausgegeben von der Preussischen Landesaufnahme 1934. Reichsamt für Landesaufnahme., 1: 25 000, sheet: 3309 Bethen; 3308 Hindenburg; 3257 Broslawitz; 3258 Tarnowitz; Berlin.
- Konias, A. Kartografia Topograficzna Państwa i Zaboru Pruskiego: Od Połowy XVIII Wieku do Połowy XX Wieku [Topographic Cartography of the State and the Prussian Partition from the Second Half of the 18th Century to the Middle of the 20th Century]; Publishers of the Pomeranian Academy in Słupsk: Słupsk, Poland, 2010; p. 232. [Google Scholar]
- Jankowski, W. Niemiecka mapa w skali 1:25,000 na terenach polskich na wschód od Odry i Nysy [German map at a scale of 1:25000 in the Polish territory east of the Oder and Neisse]. Przegl. Geod. 1961, 33, 417–458. [Google Scholar]
- Topographic Maps of Poland, 1994, 1: 10 000, sheet: M-34-50-D-C-1 Wieszowa; M-34-50-D-C-2 Bytom—Stolarzowice; M-34-50-D-C-3 Zabrze—Mikulczyce; M-34-50-D-C-4 Bytom—Miechowice; M-34-50-D-D-1 Bytom—Radzionków; M-34-50-D-D-3 Bytom—Centrum; M-34-50-D-D-4 Piekary Śląskie—Brzozowice Kamień; M-34-62-B-A-2 Ruda Śląska—Ruda; M-34-62-B-B-1 Świętochłowice; M-34-62-B-B-2 Chorzów.
- Open Regional Spatial Information System. Available online: https://mapy.orsip.pl/imap/?gpmap=gp1-2 (accessed on 1 November 2020).
- Macias, A. Ocena stopnia antropogenicznego przekształcenia terenu małych miast na przykładzie miasta Zduny [Assessment of the degree of anthropogenic transformation of small towns on the example of the Zduny town]. In Zastosowanie Ekologii Krajobrazu w Ekorozwoju [Application of Landscape Ecology in Eco-Development]; Richling, A., Lechnio, J., Malinowska, E., Eds.; Problemy Ekologii Krajobrazu; The University of Warsaw Press: Warsaw, Poland, 1997; Volume 1, pp. 164–169. [Google Scholar]
- Dziewulski, W. Powstanie i rozwój Bytomia feudalnego (do 1806 roku). Bytom przedlokacyjny [Establishment and development of feudal Bytom (until 1806). Pre-location Bytom]. In Bytom. Zarys Rozwoju Miasta. [Bytom. Outline of the City’s Development]; Długoborski, W., Ed.; Polish Scientific Publishers: Warszawa, Poland, 1979; pp. 43–55. [Google Scholar]
- Cembrzyński, P. Mining and Towns. Development of Towns in the Silesian-Cracow Lead Ore Deposit Zone from the Middle Ages to the Early Modern Age. Forum Urbes Medii Aevi XII 2014, 8, 22–31. [Google Scholar]
- Lamparska, M. Post-industrial Cultural Heritage Sites in the Katowice conurbation, Poland. Environ. Socio-Econ. Stud. 2013, 1, 36–42. [Google Scholar] [CrossRef] [Green Version]
- Piernikarczyk, J. Historia Górnictwa i Hutnictwa na Górnym Śląsku; The Effort of the Silesian Academic Union: Katowice, Poland, 1933; p. 474. [Google Scholar]
- Boroń, P.; Rozmus, D. Silver and lead production centre in Southern Poland—Between Bytom, Olkusz and Tarnowskie Góry in the Middle Ages. Research problems. Acta Rerum Nat. 2014, 16, 51–60. [Google Scholar]
- Agricola, G. De re Metallica Libri XII. (Trans. H.C. Hoover, L.H. Hoover, 1912). The Mining Magazine. 1564, p. 680. Available online: https://www.gutenberg.org/files/38015/38015-h/38015-h.htm (accessed on 10 August 2021).
- Abt, E.L.G. Geschichte des Bley und Silber—Bergbaues um Tarnowitz um Beuthen in Oberschlesien von 1528 an, bis zum Verfall und bis zur Wiederaufnahme in 1784; (trans. Majewski, S. 1957); “Śląsk” Publisher: Katowice, Poland, 1791; p. 289. [Google Scholar]
- Frużyński, A. Historia przemysłu górniczo–hutniczego w Bytomiu od początku XVIII wieku do roku 1939. [The history of the mining and metallurgical industry in Bytom from the beginning of the 18th century to 1939]. In Bytom i Jego Dziedzictwo. W 750-Lecie Nadania Praw Miejskich. [Bytom and Its Heritage. On the 750th Anniversary of Granting City Rights]; City Hall in Bytom: Bytom, Poland, 2004; pp. 219–251. [Google Scholar]
- Jaros, J. Słownik Historyczny Kopalń Węgla na Ziemiach Polskich. [Historical Dictionary of Coal Mines in Poland]; “Śląsk” Publisher: Katowice, Poland, 1984; p. 198. [Google Scholar]
- Sulik, A. Bytom w okresie przynależności do Rzeszy Niemieckiej 1870–1945. Życie gospodarcze do roku 1921. [ Bytom during the period of belonging to the German Reich 1870–1945. Economic life until 1921]. In Bytom. Zarys Rozwoju Miasta. [Bytom. Outline of the City’s Development]; Długoborski, W., Ed.; Polish Scientific Publishers: Warszawa, Poland, 1979; pp. 259–277. [Google Scholar]
- Frużyński, A. Zarys Dziejów Górnictw w Polsce. [An Outline of the History of Coal Mining in Poland]; Coal Mining Museum in Zabrze: Zabrze, Poland, 2012; p. 240. [Google Scholar]
- Available online: http://www.weglokokskraj.pl/kwk-bobrek-piekary/ (accessed on 1 June 2021).
- Available online: https://dziennikzachodni.pl/w-bylej-kopalni-powstancow-slaskich-gornicy-znow-fedruja/ar/c3-358067 (accessed on 1 June 2021).
- Długoborski, W. Industrializacja i narodziny miasta kapitalistycznego 1807–1870 [Industrialization and the birth of a capitalist city 1807–1870]. In Bytom. Zarys Rozwoju Miasta. [Bytom. Outline of the City’s Development]; Długoborski, W., Ed.; Polish Scientific Publishers: Warszawa, Poland, 1979; pp. 129–251. [Google Scholar]
- Krawczyk, J.A.; Nadolski, P. Atlas Geograficzny Bytomia. [The Geographical Atlas of Bytom]; City Hall in Bytom: Bytom, Poland, 2007; p. 40. [Google Scholar]
- Drabina, J. Historia Bytomia 1254–2000 [The History of Bytom 1254–2000]; Towarzystwo Miłośników Bytomia: Bytom, Poland, 2000; p. 362. [Google Scholar]
- Pradela, A.; Solarski, M. Zmiany powierzchniowej sieci hydrograficznej i pierwszego poziomu wód podziemnych miasta Bytom wywołane eksploatacją rud cynku i ołowiu w XIX i XX wieku [Changes in the surface hydrographic network and the first groundwater level of the city of Bytom caused by the exploitation of zinc and lead ores in the 19th and 20th centuries]. In Zmiany Stosunków Wodnych w Czasach Historycznych. Studia i Prace z Geografii i Geologii nr 9. [Changes in Water Conditions in Historical Times. Studies and Works in Geography and Geology No. 9.]; Kaniecki, A., Baczyńska, A., Eds.; Bogucki Scientific Publishers: Poznań, Poland, 2010; pp. 143–154. [Google Scholar]
- Nyrek, A. Gospodarka Leśna na Górnym Śląsku od Połowy XVII do Połowy XIX w. [Forest Management in Upper Silesia from Mid-Seventeenth to Mid-Nineteenth Century]; Zakład Narodowy im. Ossolińskich: Wrocław, Poland, 1975; p. 234. [Google Scholar]
- Moledna, D. Kopalnie Rud Ołowiu na Terenie Złóż Śląsko—Krakowskich w XVI–XVIII Wieku. z Dziejów Postępu Technicznego w Eksploatacji Kruszców. [Lead Ore Mines in the Silesia—Krakow Deposits in the 16th–18th Centuries. From the History of Technical Progress in the Exploitation of Ores]; Zakład Narodowy im. Ossolińskich Wydawnictwo PAN: Wrocław, Poland, 1972; p. 420. [Google Scholar]
- Available online: http://isap.sejm.gov.pl/isap.nsf/download.xsp/WDU19971090705/O/D19970705.pdf (accessed on 1 June 2021).
- Kantor-Pietraga, I.; Machowski, R. (Eds.) Przemiany Przestrzenne Oraz Społeczne Bytomia i Jego Centrum. Studia i Materiały [Spatial and Social Changes of Bytom and Its Center. Studies and Materials]; Wydział Nauk o Ziemi Uniwersytetu Śląskiego: Sosnowiec, Poland, 2012. [Google Scholar]
- Kunc, J.; Martinát, S.; Tonev, P.; Frantál, B. Destiny of urban brownfields: Spatial patterns and perceived consequences of post-socialistic deindustrialization. Transylv. Rev. Adm. Sci. 2014, 41, 109–128. [Google Scholar]
- Marot, N.; Černič Mali, B. Using the Potentials of Post-Mining Regions—A Good Practice Overview of Central Europe. In Post-Mining Regions in Central Europe Problems, Potentials, Possibilities; Wirth, P., Mali, B.Č., Fischer, W., Eds.; Oekom: München, Germany, 2012; pp. 130–147. [Google Scholar]
- Rink, D.; Couch, C.; Haase, A.; Krzysztofik, R.; Rumpel, P. The governance of urban shrinkage in cities of post-socialist Europe: Policies, strategies and actors. Urban Res. Pract. 2014, 7, 258–277. [Google Scholar] [CrossRef]
- Available online: https://www.bytom.pl/dla-mieszkanca/strategia-rozwoju-miasta-bytom-2020 (accessed on 1 June 2021).
- Rahmonov, O.; Krzysztofik, R.; Środek, D.; Smolarek-Lach, J. Vegetation- and Environmental Changes on Non-Reclaimed Spoil Heaps in Southern Poland. Biology 2020, 9, 164. [Google Scholar] [CrossRef] [PubMed]
- Abramowicz, A.; Rahmonov, O.; Chybiorz, R. Environmental Management and Landscape Transformation on Self-Heating Coal-Waste Dumps in the Upper Silesian Coal Basin. Land 2021, 10, 23. [Google Scholar] [CrossRef]


Publisher’s Note: MDPI stays neutral with regard to jurisdictional claims in published maps and institutional affiliations. |
© 2021 by the authors. Licensee MDPI, Basel, Switzerland. This article is an open access article distributed under the terms and conditions of the Creative Commons Attribution (CC BY) license (https://creativecommons.org/licenses/by/4.0/).