1. Introduction
Conservation agriculture (CA) is defined as the combination of three principles: minimum soil disturbance, permanent soil organic cover and species diversification [
1]. In addition to reduced management costs, CA is considered to enhance several ecosystem services (soil physical and chemical properties, soil organic carbon (SOC) and biodiversity) [
2,
3] and prevent some soil threats, such as soil erosion [
4,
5,
6]. Although some of these benefits remain less clear, the worldwide adoption of CA grew to 12.5% of 2016 global cropland. At odds with this growth trend, there is Europe, where only 5% of total cropland is managed with CA. One country that has shown particularly limited adoption is Italy—less than 300,000 ha (a mere 2% of agricultural land) [
7].
Adoption of CA has suffered slow adoption in Europe primarily due to the long transition time that follows conversion from conventional agriculture to CA before the positive effects are realized. During this crucial period, farmers face reduced crop yield and new equipment expenditures. Conversion to CA also requires a permanent soil covering, yet another cost that would benefit from economic support [
8]. A key reason behind the very limited use of CA in Italian agrosystems is the long conversion time (more than five years) required before SOC, fertility and nutrient use efficiency benefits are observed [
9,
10]. Most studies have considered transition time only as a function of a single parameter, such as soil physical properties [
11,
12], yield [
13,
14,
15,
16], net SOC stock [
17,
18], soil aggregate stability, biodiversity, SOC content [
19,
20], earthworm density, or CO
2 emission reduction [
21]. However, each of these exerts an effect on CA. As such, we suggest that a holistic approach capable of considering multiple parameters may provide a better means by which to evaluate the effects of CA.
The ecosystem services delivered by CA justify the need for environmentally conscious policymakers to consider economic support of the practice through a program such as the “green payments” program already established in the EU Common Agricultural Policy [
22]. Alternatively, yield losses and/or other negative effects could be limited or compensated in some fashion. In either case, programs such as these are effective only when the protocol created is adaptable to local area specifics but is assessable by a single, consistent set of criteria. As is often described in the literature, an index represents one way to determine and compare the impact of different management strategies [
23,
24]. Similarly, the literature has already identified potential soil quality indicators to comprise an index: physical soil property measures (soil hydraulics, penetration resistance and bulk density) [
25,
26] plus soil aggregate stability [
27], soil C and N content and earthworm density [
28]. Masto et al. [
29] previously adopted a statistical methodology to determine the impact of different management strategies on soil quality and sustainability using a dataset with several soil characteristics, as reported above. The method involved the application of a principal component analysis (PCA) to derive the weight of the different soil parameters in promoting the sustainability. The derived index showed to be a reliable tool to assess the performance and impacts of alternative land uses and soil management options [
23].
In this work, three tillage systems (no tillage, minimum tillage and conventional tillage) were combined with three different soil coverings (tillage radish cover crop, winter wheat cover crop and bare soil) to compare the effects of the main factors influencing CA. A multivariate approach was applied to a dataset of soil quality measures taken during a north Italy field experiment. A sustainability index was calculated to compare different treatment combinations as a function of the selected indicator variability. This study aims to determine the short-term effects of reduced tillage and cover crops on the studied parameters. Our starting hypothesis was that a reduced tillage system combined with tillage radish could minimize conversion time side effects and improve soil properties.
3. Results
Below is a description of the mixed model results comparing changes in the 11 indicators of soil quality under the tested treatments over time (
Table 2).
Table 3 reports the average 2019 and 2020 values used to calculate RSIs.
All values of Agg, GWC and pH were significantly higher at T0 than at T1. Overall, average Agg was higher at T0 (4.50) than at T1 (3.19) and was characterized as of high-to-moderate stability, according to the SI range (0.3–6.1). At T0, all aggregate samples, except one, were of moderate stability (>3). The exception sample value, collected from treatment combination MT–BS, was 2.9. During the T1 survey, 44% of the observations were <3 (high aggregate stability) and the lowest values found in the reduced tillage systems (NT and MT). The measures of the GWC were strictly related to the pedoclimatic conditions on the sampling dates, with the GWC ranging from 20% to 25% in 2019 and from 12% to 22% in 2020. Cover crop treatments showed significant effects on GWC, as demonstrated by values of 18.3% in TR and 20.3% in WW, while BS had an intermediate value. Despite the significantly lower pH values at T0 versus T1, the pH values maintained non-critical averages (7.36 in T0 and 7.05 in T1).
Between survey T0 and T1, the N tot, PR and Ks all increased significantly. The N tot rose from 0.88‰ at T0 to 1.01‰ at T1. During each survey, the N tot maintained a modest variability, as indicated by the coefficients of variation at T0 (0.26) and T1 (0.13). The PR test values differed from an average of 0.70 MPa in T0 to an average of 1.34 MPa in T1. In the second survey, the PR was not only significantly higher, but also more variable than it was in T0; all of the PR observations across both surveys registered below the 2.5 MPa threshold. The PR differences occurred among the differing tillage systems. Specifically, CT reported a PR of 0.88 MPa, which proved to be significantly higher than the 1.18 MPa observed under NT. The PR result under MT was intermediate. Last, the Ks increased by 158% between T0 (3.4 × 10⁻⁵ m s−1) and T1 (8.7 × 10⁻⁵ m s−1). This parameter showed it was also significantly impacted by different tillage intensities, as shown by the average Ks values of 1.05 × 10⁻⁴ m s−1 in NT, 3.58 × 10⁻⁵ m s−1 in CT and an intermediate value in MT.
The parameters BD and EW were affected by the time × tillage interaction. Despite a generally limited effect on the BD across the various treatments, the average BD under CT was lower during the first survey (1.39 g cm
−3) versus the second survey (1.45 g cm
−3). All measures of BD were less than its 1.55 g cm
−3 threshold. In the case of EW, variability was higher; it ranged between 0 and 20 (
Table 3). Among the treatments, during T1, the EW differences were, on average, significantly higher (13.17) under NT than under CT (3.00).
The C org, Y and N min parameters resulted as unaffected by all factors tested. On average, the C org was 0.83% and displayed only a modest variability within and between the surveys. Similarly, Y (10.00 Mg ha−1, on average) and N min (24.54 mg kg−1, on average) showed no significance among the treatment combinations in the different surveys.
The values presented in
Table 3 were normalized. The average of each treatment combination is presented in
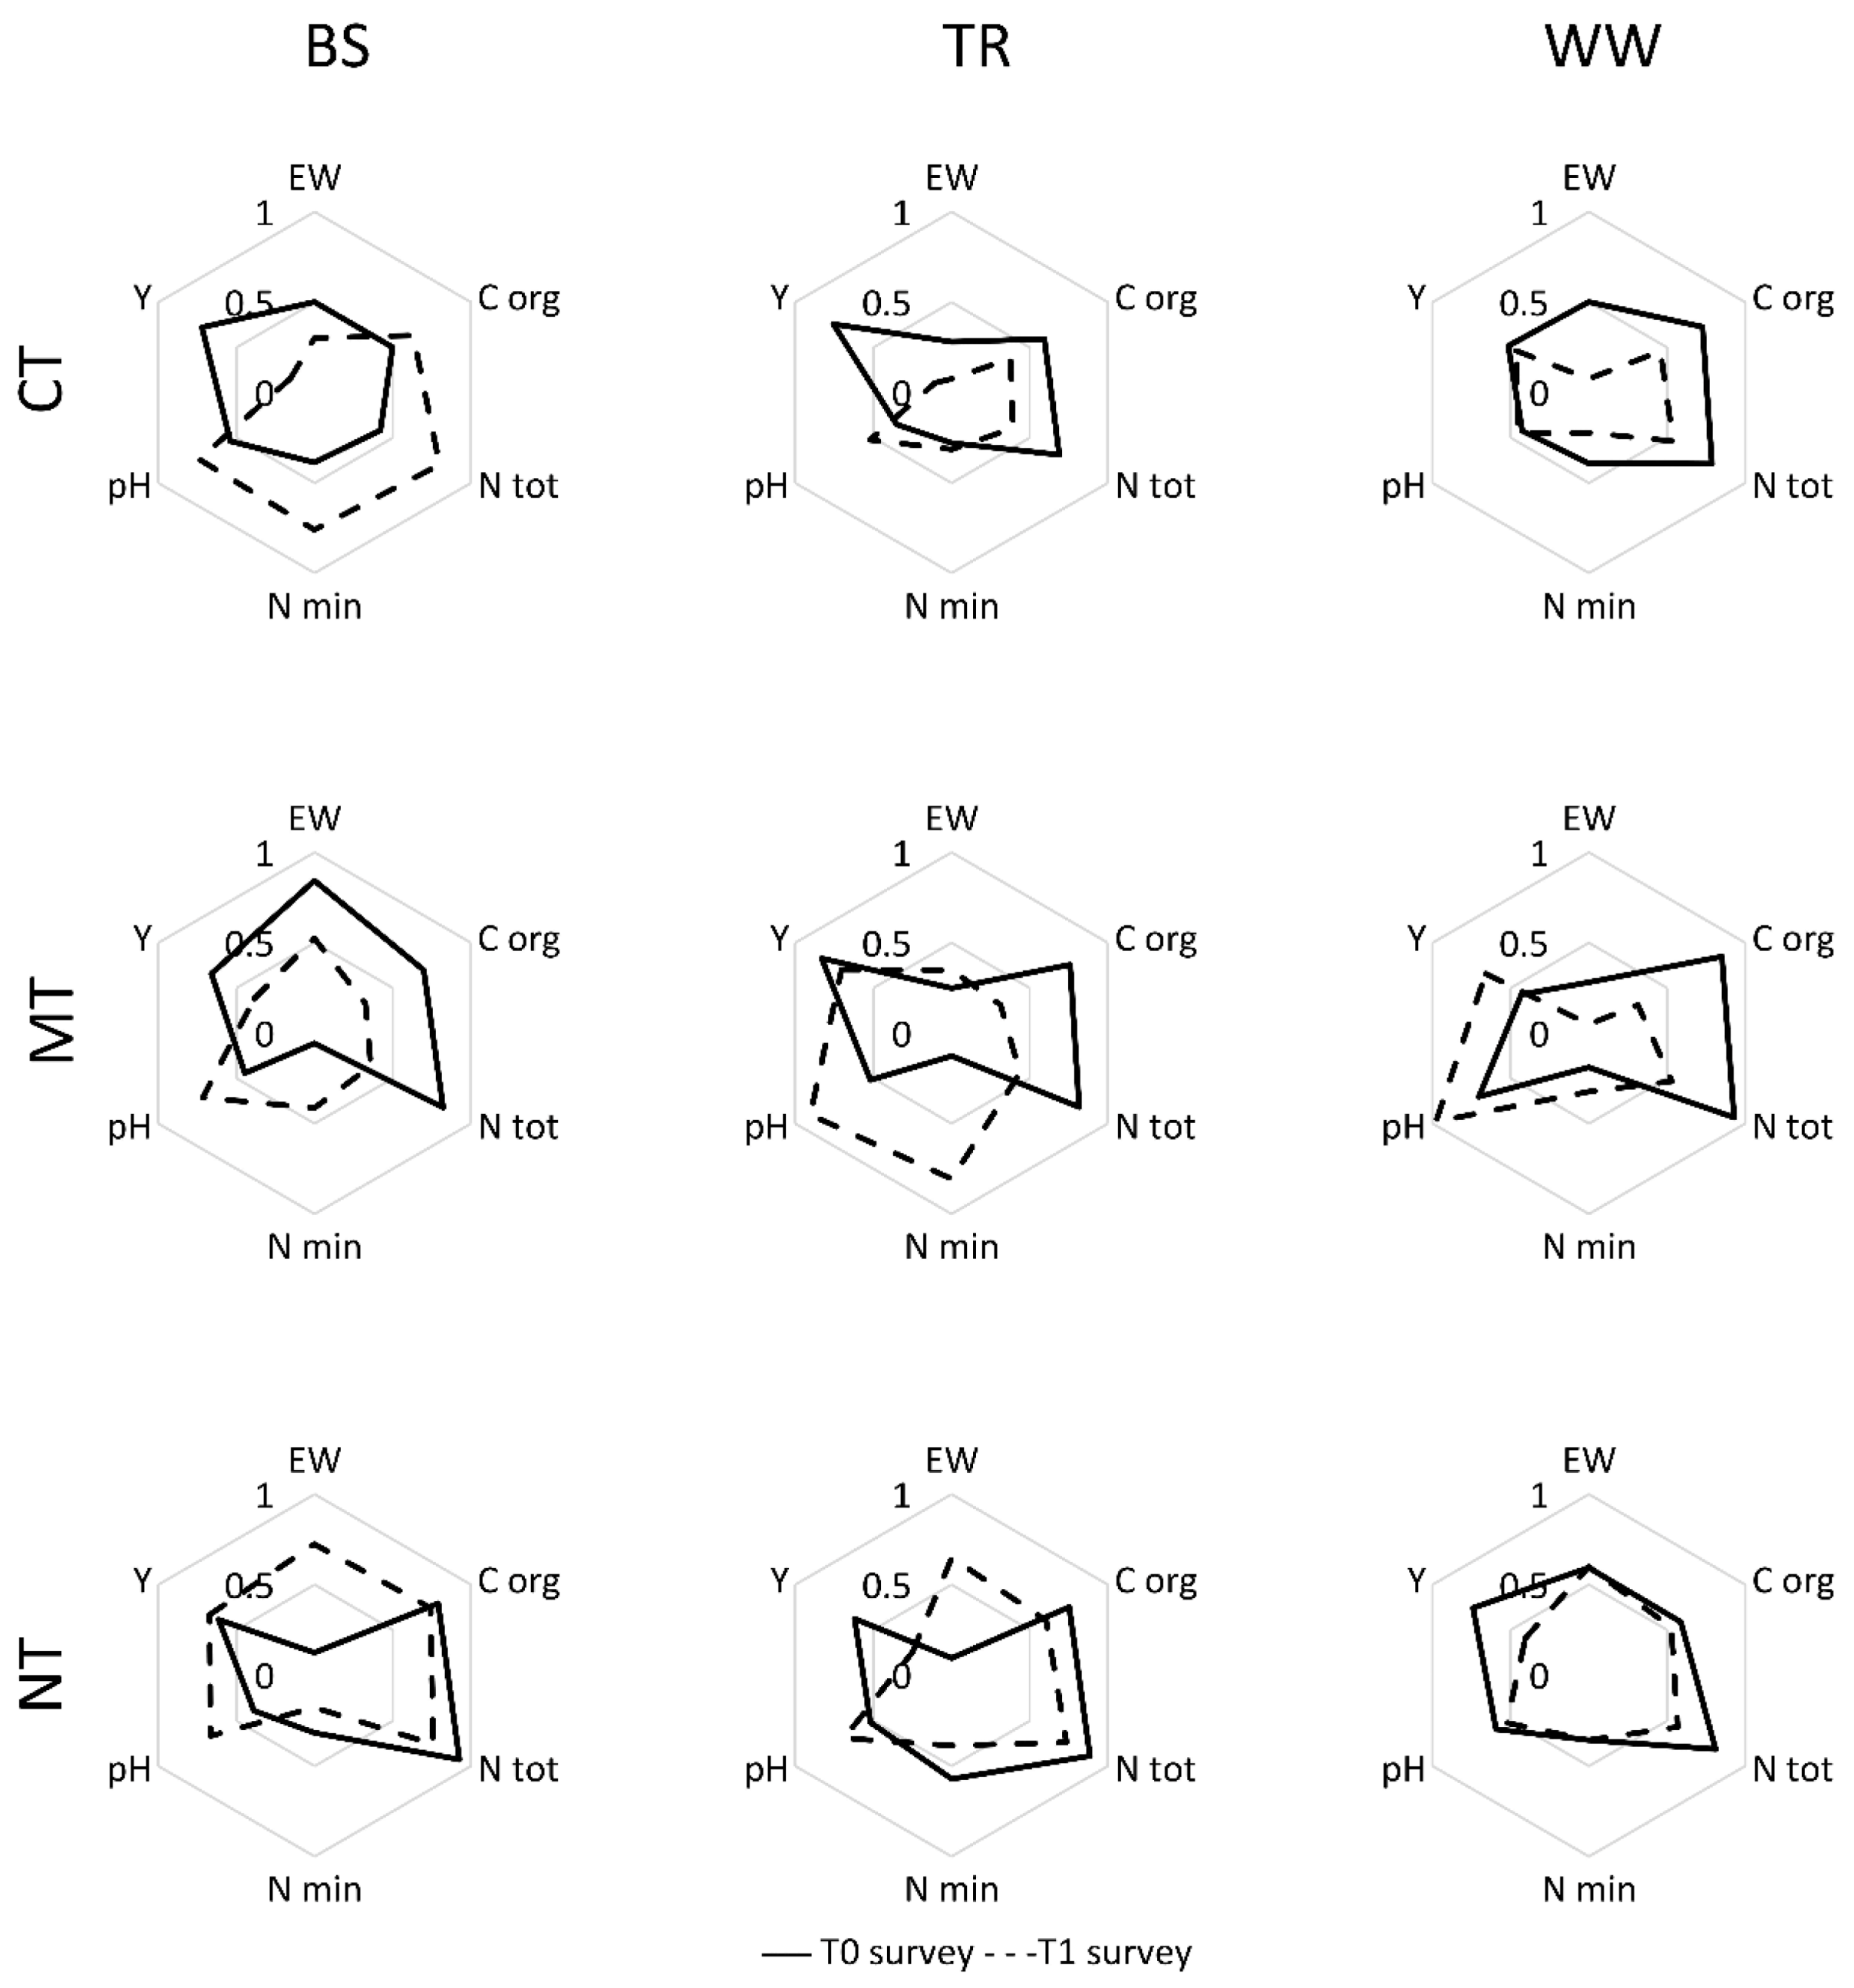
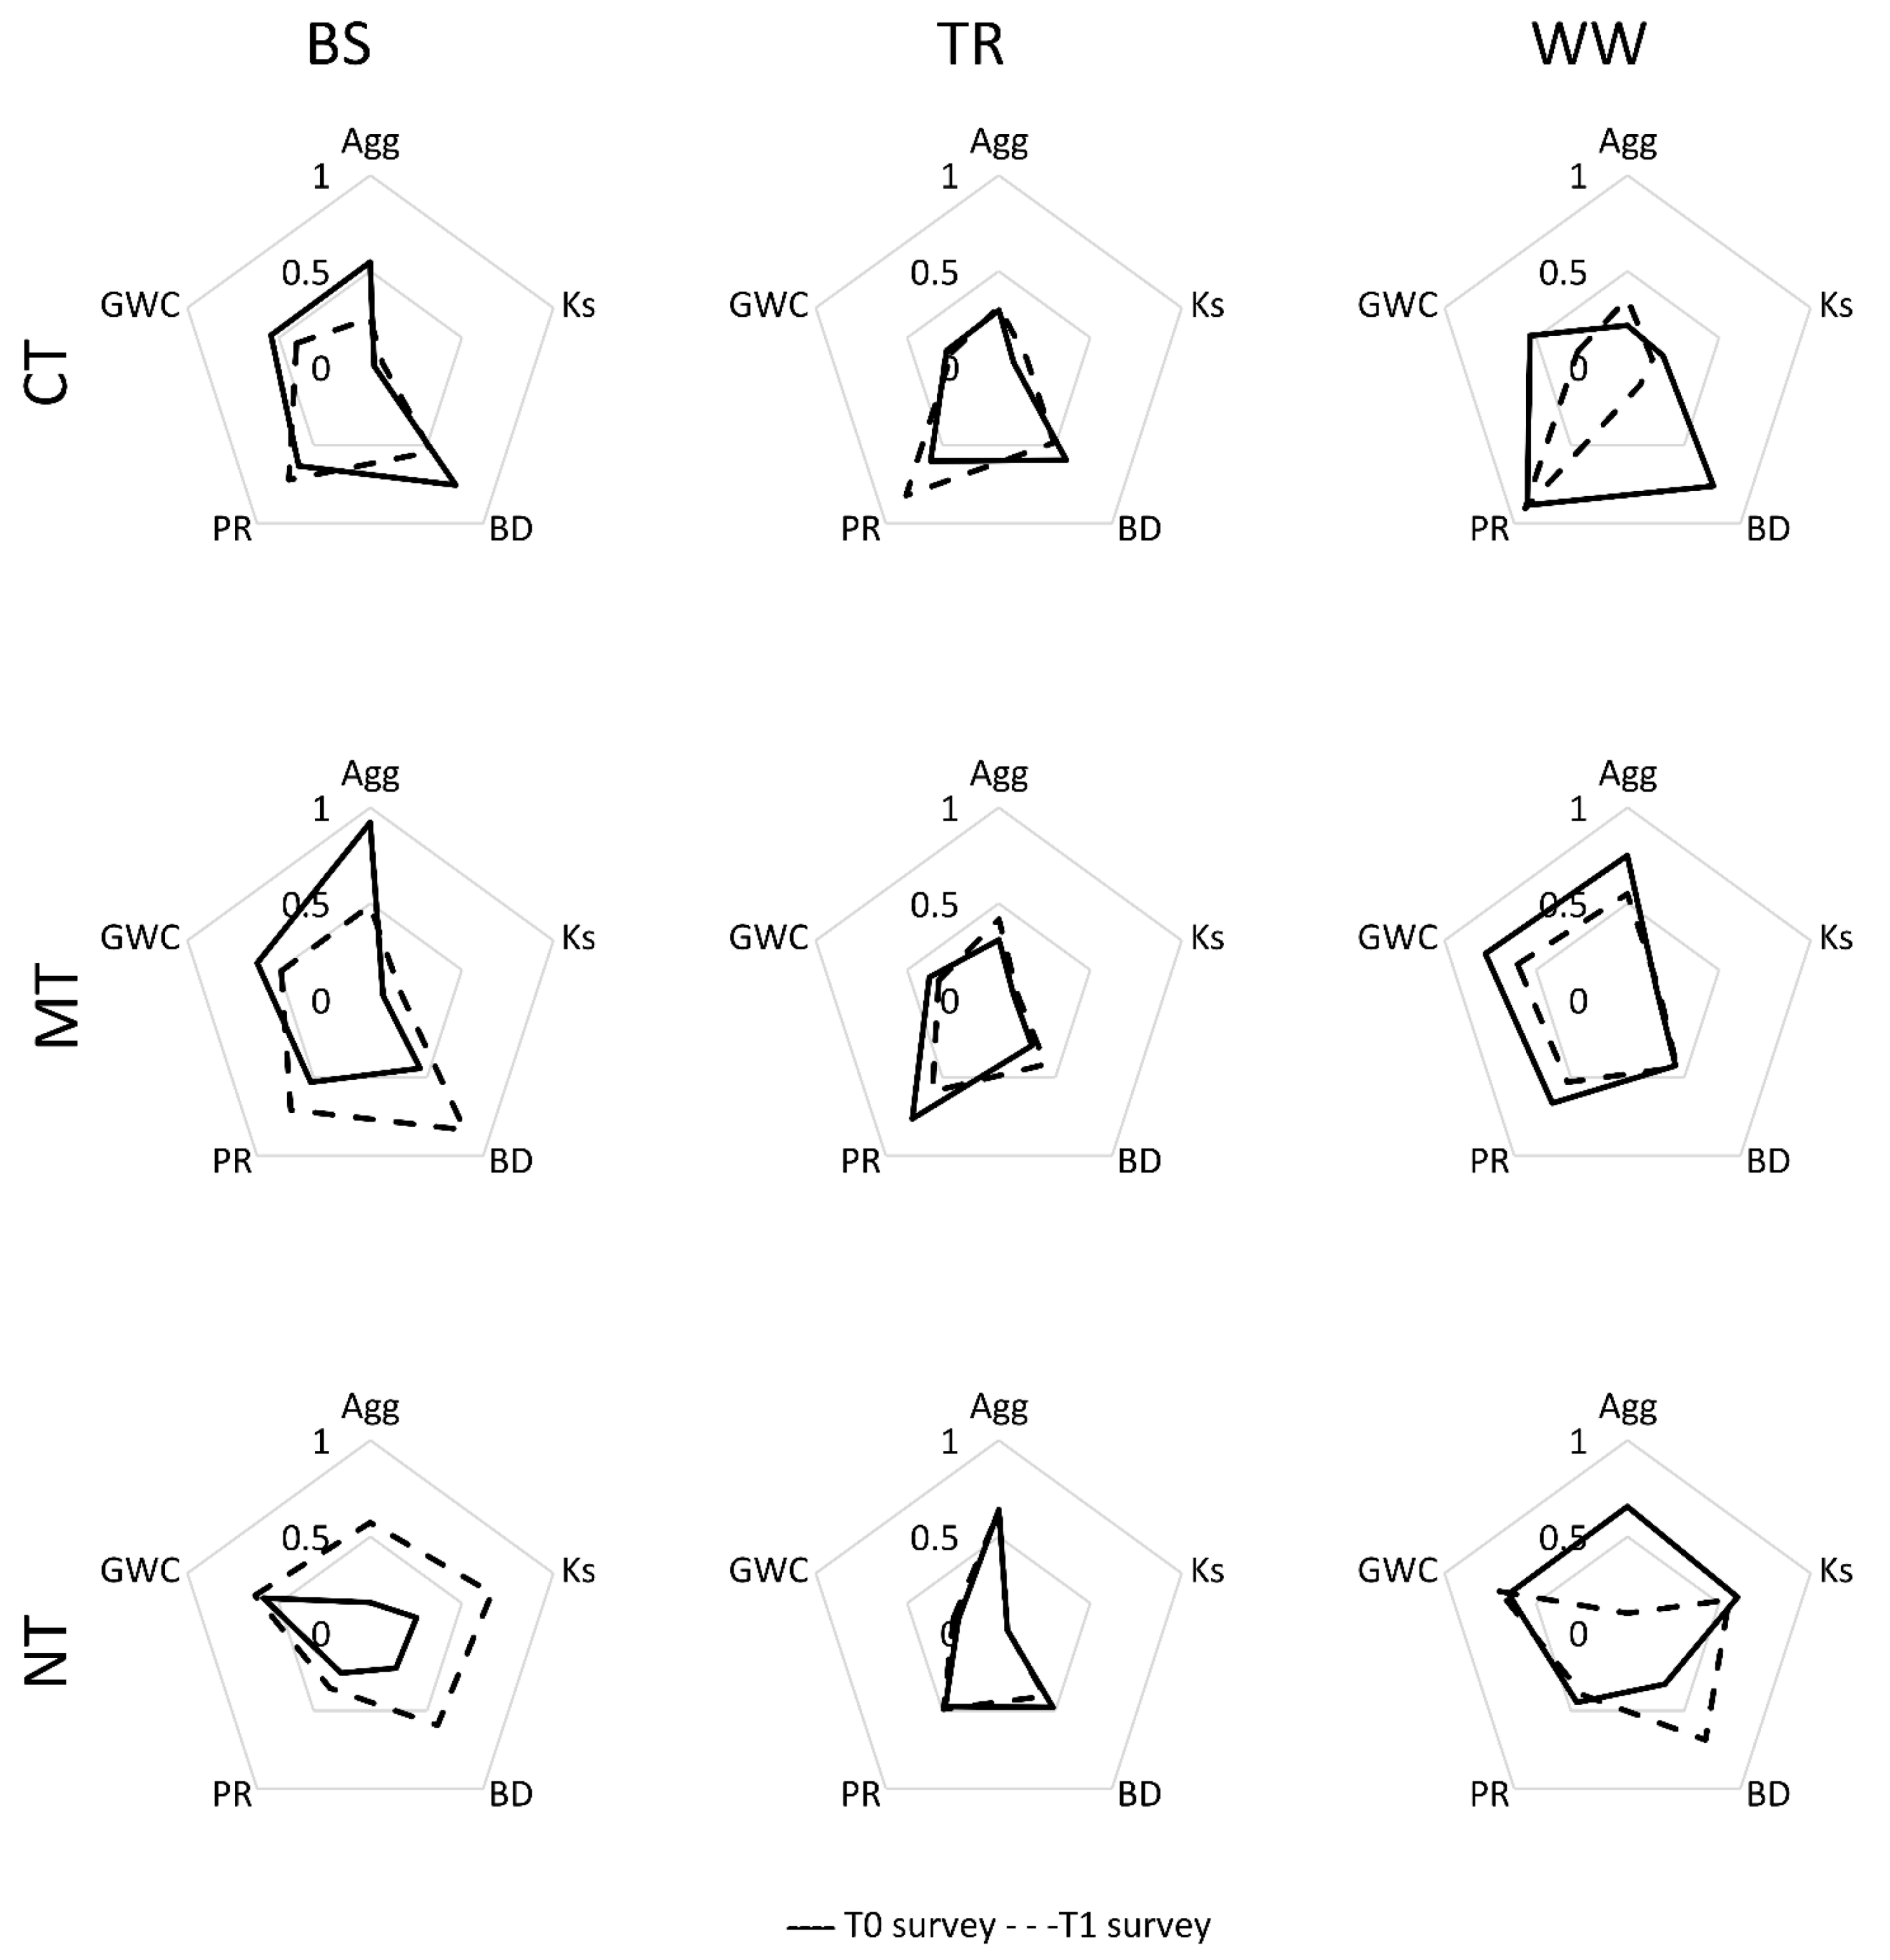
Figure 1 (biochemical parameters) and
Figure 2 (physical parameters). Normalization allows higher values to be associated with parameter improvement and wider areas to represent an overall sustainability increment.
Figure 1 and
Figure 2 show sizeable differences between the treatment combinations and two years. The correlation matrix between each parameter pair is shown in
Table 4. As expected, the highest correlation resulted between the C org and N tot (r = 0.924). To identify which of these highly-correlated parameters could best explain treatment variation—and warrant inclusion in the
RSI—we performed a principal component analysis (PCA).
Table 5 presents the PCA results. Each parameter was weighted according to the treatment variation it explained based on the PC selected.
The parameters selected in PC-1 were N tot, GWC, Ks and EW. It showed that the N tot should be included in the
RSI because it had the highest weight and it was highly correlated to the C org. In PC-2, the highly weighted parameters BD, PR and Y were all included in the
RSI as they showed limited correlation amongst them. In PC-3, the Agg and N min were selected and, in PC-4, the pH was chosen. The
PW of each parameter equals the variability explained by the PC selected for that specific factor (0.241 for PC-1, 0.149 for PC-2, 0.135 for PC-3 and 0.117 for PC-4). To normalize the RSI, the sum of the weighted parameters was divided by the highest sum of the weighted parameters reported across all observations (1.247). The value was reported under NT–WW (block 1) during the survey T0. The lowest value (0.358) was under CT–TR (block 2) in T1. Then, the resulting
RSI was expressed by Equation (9).
Then, mixed models were calculated on
RSI values, considering the combination of tillage and CC effects. The smallest AIC for the
RSI linear mixed model was obtained when intercept, tillage and covering were tested as fixed factors and block was a random factor.
Table 6 summarizes the
p-values for the selected mixed model.
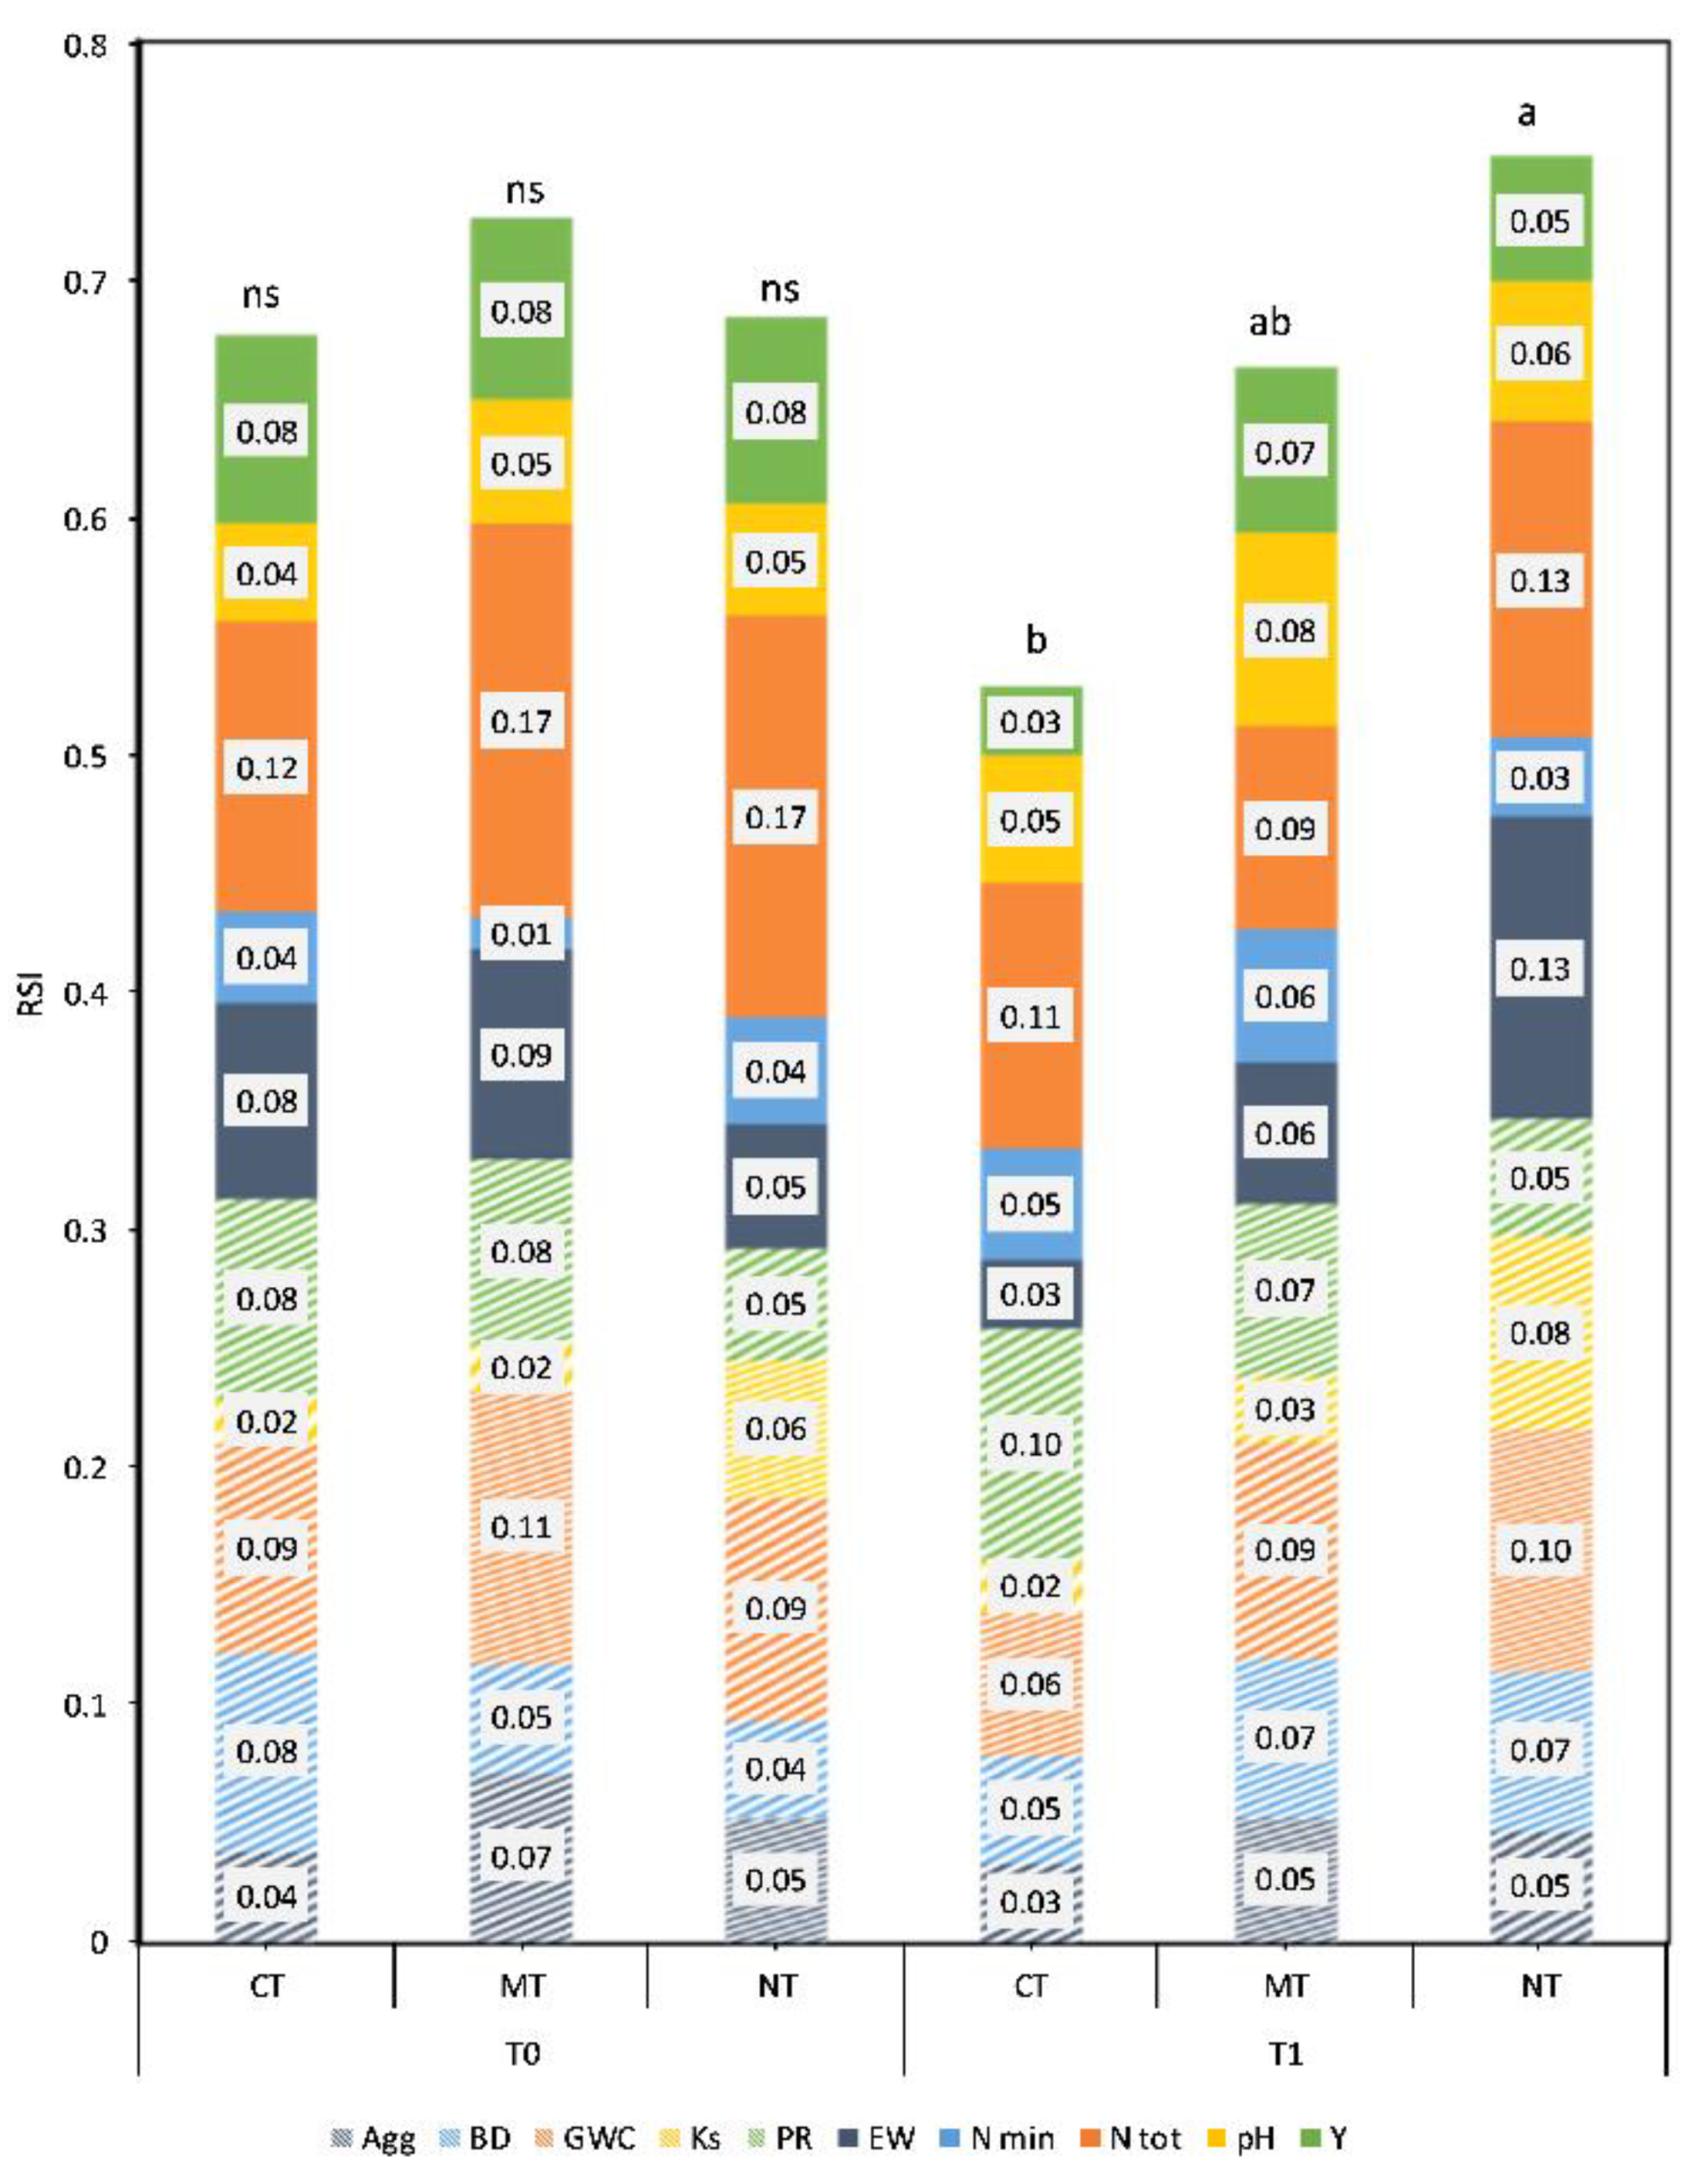
Figure 3 displays the average RSIs and corresponding contribution from each parameter to it under each treatment. On average, the GWC (0.09) and N tot (0.13) impacted the
RSI the most. During T1, their highest scores were in NT (GWC = 0.10 and N tot = 0.13.) Observations of the
Ks and EW were notable in that they contributed little to the RSI, yet they were high variable across treatments. During T1, the
Ks averaged 0.08 under NT, which was three-fold the value observed under MT (0.03) or CT (0.02). Similarly, the EW averaged 0.13 in NT, which was double that in MT (0.06) and four-fold the value observed in CT (0.03).
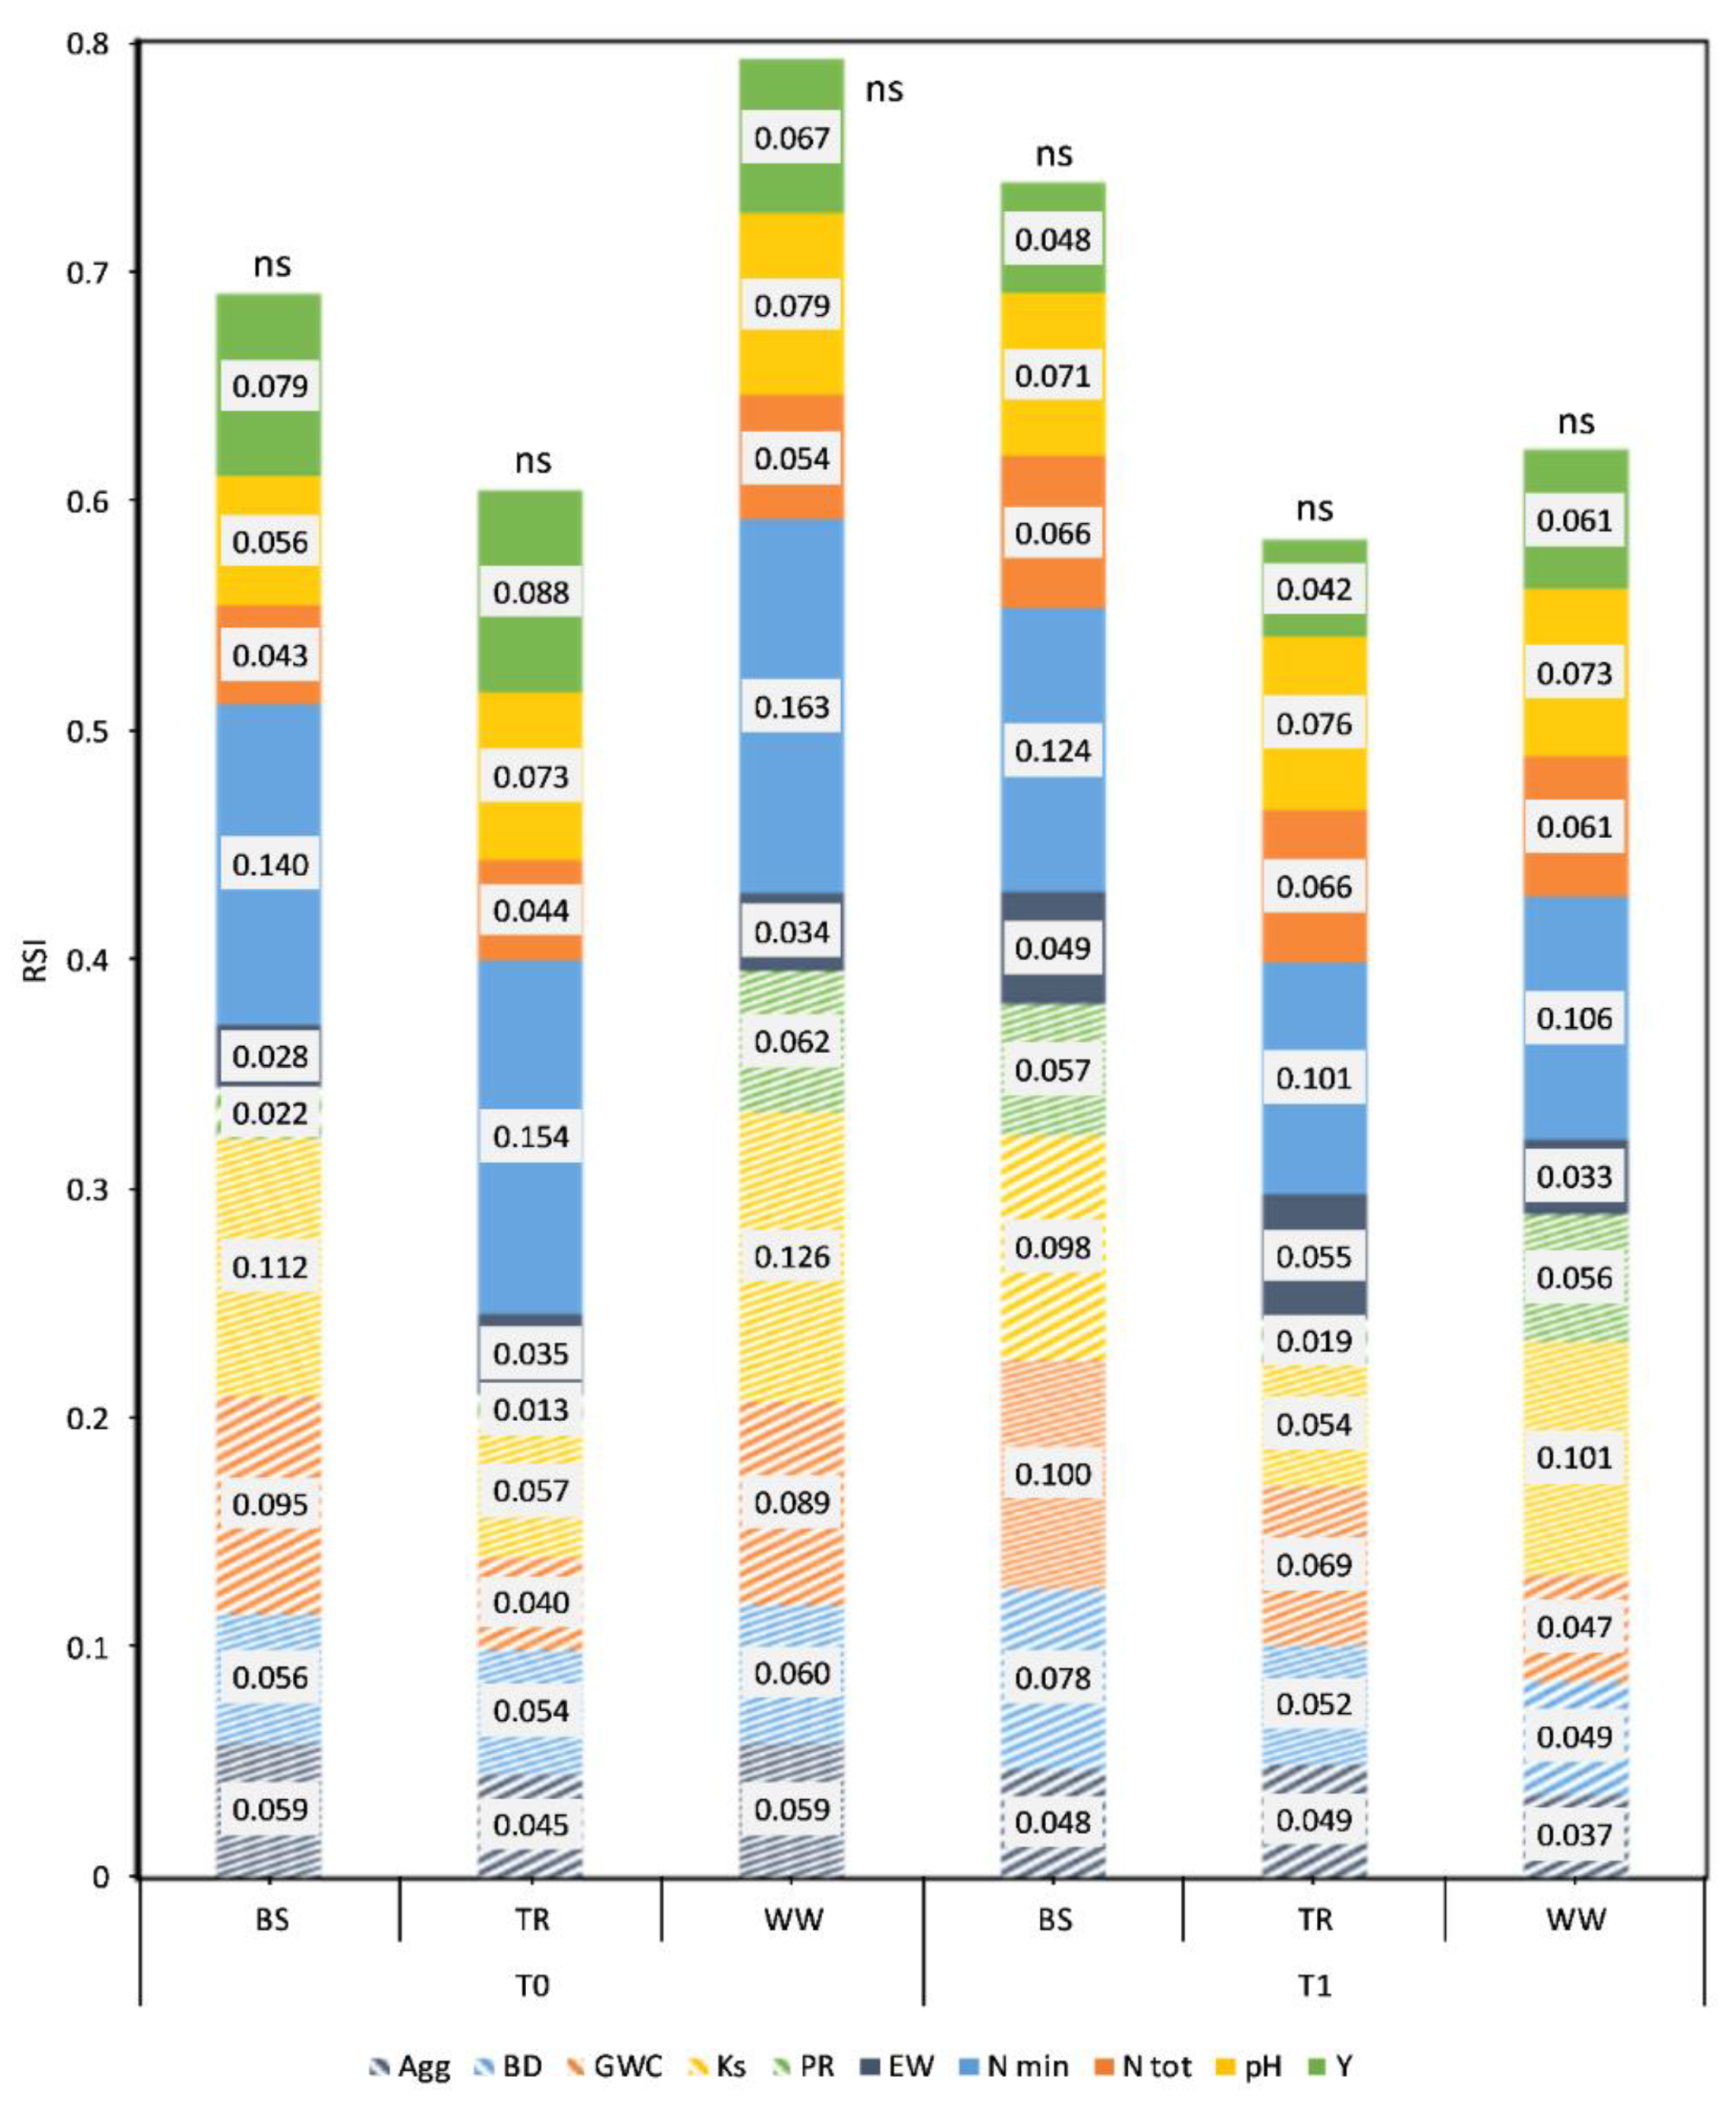
No clear effect was observed for the soil covering treatment in either year and no statistical difference was found. During both years under TR, the minimum
RSI was always reached (0.604 in 2019 and 0.583 in 2020). Higher values were recorded for coverings WW in 2019 and BS in 2020 (
Figure 4).
4. Discussion
In total, 8 of the 11 parameters revealed significant differences between T0 and T1, which suggests that the soil system was changing regardless of the agronomic management applied. One potential cause of these results may be attributed to differences in the environmental conditions at T0 and T1. The GWC was found to be affected by CC. For those who have considered the effects of CC on water cycle, the results have been contradictory. Some have found CC to improve water balance and water availability [
49], while others have reported soil water reduction in the subsequent crop after CC termination [
50]. Our results, where under WW, the GWC was high and, under TR, the GWC was at its lowest, are also mixed. In both instances, the results can be equally attributed to either better maintenance of soil water content by WW, or higher soil evaporation under TR, due to a lesser soil covering.
The different tillage systems seemed to have a stronger impact, especially on some parameters (BD, PR,
Ks and EW), if compared to the CC effect. For example, under CT, the BD and PR values aligned with previous evidence that reduced tillage systems can increase soil strength and bulk density, especially in the first years [
51]. The reduced BD and PR values were expected tillage effects under CT, given that that they were measured in the 0–20 cm soil layer. This result may also relate to instrument resolution; the PR can be negatively impacted by the high spatial variability in reduced tillage systems [
52]. However, in this instance, the BD almost always remained below its threshold (1.55 g cm
−3) for which it is known to limit plant root growth in silty loam soils [
33]. Similarly, the PR values (0.46–1.96 MPa) fell well below the growth-limiting threshold usually set at 2.5 MPa [
34]. Finally, the soil at the experimental site was characterized as having structural inertia in response to management changes [
53,
54,
55].
Although the BD and PR values worsened slightly (i.e., soil strength increased) under reduced tillage systems, soil function was improved in NT, as evidenced by an increase of 193% in the
Ks under NT relative to CT during T1. The highest EW value observed in this study may relate to the significant contributions made by earthworm bio-macropores to soil function and, in particular, air and water permeability, even in compacted soils. Earthworms can improve soil structure [
56] and hydraulic properties [
57] by burrowing and casting. The positive effects of NT on the EW confirm previous studies evidence [
9,
21,
28].
The computation of the RSI highlighted the strong effect of the EW as it carried a high relative weight (11%, on average) within the index. It also showed a high variability among the different treatments. Additional parameters that averaged high impact on the RSI were the N tot (17%), GWC, (14%) and PR (11%), which, together, accounted for more than 50% of the RSI. In addition to the EW, RSI variability was driven by the Ks, N min and Y. In absolute terms, the Ks, N min and Y each had impacts of less than 10% on the RSI, but their variation coefficients ranged the highest (from 0.67 for the Ks to 0.31 for the Y). These two conditions suggest that this set of measures should be considered as the best to indicate soil quality changes during the conversion from conventional tillage to CA. The RSI results also suggest that the Ks and EW are two sustainability indicators that were positively affected by NT.
The final
RSI score evaluates the combination of tillage intensity and soil covering with an holistic approach [
58]. It showed the positive effect of NT relative to conventional tillage, even in the short term. Midway between the effects of CT and NT lay the MT system. It mitigated the negative effects on some physical parameters but lessened the improvements of biological parameters (EW). According to Issaka et al. [
59], both the minimum and no-tillage systems resulted as sustainable techniques, considering the nutrient cycles. As opposed to other studies [
9,
10,
54], clear negative effects during the transition time were not detected during this three-year experiment.
The limited differences reported for the various soil coverings may be evidence that a CC effect was masked by the strong effects of reduced tillage systems combined with the sampling methods used. It may be that longer conversion times or different sampling methods are required for CC effects to be revealed [
60]. Even in the case of BS, a partial and spontaneous covering (weeds) may impact soil properties in a way not unlike that expected with CCs. Indeed, “spontaneous CCs” have provided ecosystem services [
61,
62,
63,
64,
65]. In the presence of plant residues, microbial diversity [
66] could improve to the point where it should even be considered an environmental sustainability indicator [
67].
From another perspective, the modest TR effect could relate to sample timing. Most TR-related benefits (improved porosity and pore connectivity) occur only when taproots are degraded. At the same time, reports of short-term tillage radish benefits exist [
68,
69], although it seems that longer timespans are necessary to exploit the benefits of TR on soil properties [
10]. The bio-tillage effect, which was expected from TR, as suggested by Zhang et al. [
70], could be masked by earthworm activity in NT treatments, irrespectively from the presence of TR. The high EW values observed under NT could have performed this bio-tillage effect, which, according to the authors, could replace conventional tillage.
Then, even if the WW fibrous root apparatus had a limited impact on soil structure, many Poaceae CC improved overall system sustainability [
71,
72] and aggregate stability [
49,
65,
73], or nutrient cycles [
74,
75,
76]. The combination of grass CC and reduced tillage systems proved to positively affect environmental sustainability, fostering biodiversity [
77] and soil organic carbon [
78].
In conclusion, to correctly evaluate the CA effect, especially on the soil system, a holistic approach should be preferred to consider both the effects on crop production and on soil physics, considering different soil function at different scales.
5. Conclusions
A multivariate analysis of selected sustainability indicators revealed a positive effect of reduced tillage systems management and in particular NT, despite the limited variation in the observed parameters.
Despite the short-term nature of the experiment, this positive result could be the effect of an increase in soil fauna activity, which could have contributed to soil structure improvement. As a consequence, NT seemed to impact soil physics and soil habitability, resulting in a significantly higher RSI value. The effect of CC was limited, but WW reported the best results in the short term, with a tendency to have higher RSI values.
Collectively, the combination of NT and WW can be considered the most promising in terms of sustainability improvement. In this study, only the short-term effect of different tillage and soil cover management results were reported. Therefore, longer-term experiments could better evaluate the effects of these management systems on some parameters, such as soil organic carbon, which have a wide impact on sustainability, yet vary little in the short term.
In conclusion, to correctly evaluate the CA effect, especially on the soil system, a holistic approach should be preferred to consider both the effects on crop production and on soil physics, considering different soil functions at different scales.


