Article

Degree of Abandoned Cropland and Socioeconomic Impact Factors in China: Multi-Level Analysis Model Based on the Farmer and District/County Levels

1
Key Laboratory of Land Surface Pattern and Simulation, Institute of Geographic Sciences and Natural Resources Research, Chinese Academy of Sciences, Beijing 100101, China
2
College of Public Administration, Nanjing Agricultural University, Nanjing 210095, China
*
Author to whom correspondence should be addressed.
Submission received: 27 October 2021 / Revised: 9 December 2021 / Accepted: 15 December 2021 / Published: 21 December 2021
(This article belongs to the Special Issue Efficient Land Use and Sustainable Urban Development)

Abstract

:
At present, abandoned cropland has become a common phenomenon spreading to countries around the world. China has seen widespread abandoned cropland in recent years. However, there are extremely few empirical studies of cropland abandonment and influencing factors nationwide. In this study, survey data from 8071 farmer households in 14 Chinese provinces were used to analyze the degree of cropland abandonment in China and its spatial distribution. A multi-level model was constructed to quantitatively explore the socioeconomic factors affecting the degree of cropland abandonment, at both the farmer and district/county levels. The results show that: (1) the proportion of farmers and the spatial distribution of abandoned cropland are consistent. (2) Chongqing City, Guangdong Province, and Shanxi Province are high-value areas of abandoned cropland, while Shandong, Liaoning, Henan and Jiangsu provinces are low-value areas. (3) Among the differences in cropland abandonment, 68.5% and 31.5% can be explained at the farmer and district/county level, respectively. (4) At the farmer level, all labor and cropland transfer indicators, including land labor quantity per unit area, male agricultural labor ratio, farmers mainly of middle-aged labor, cropland transfer area and cropland subcontract amount, have significant negative effects on the degree of abandoned cropland. There is a significant negative correlation between the value of agricultural operating fixed assets in the agricultural input indicators and the degree of abandoned cropland, but participation in professional, cooperative, economic, agricultural organizations has no significant impact on the degree of abandoned cropland. The per capita disposable income, which represents the quality of life indicator, has a significant positive impact on the degree of abandoned cropland. (5) At the district/county level, the proportion of the total co-working labor force and the transfer rate of cropland are negatively related to the degree of cropland abandonment, and the proportion of the co-working labor force outside the district/county is positively related to the degree of cropland abandonment. In addition, we briefly analyzed the mechanism and process of cropland abandonment from the perspective of farmers’ decision-making. Finally, the policy suggestions to alleviate the abandonment of cropland were put forward from the district/county and farmer level, respectively.

1. Introduction

The Global Food Security Index report (2020) stated that global agricultural production must increase by 60% to ensure food security from 2020 to 2050 and that sustainable land management can increase food production by 58% [1]. Therefore, the sustainable management and efficient utilization of cropland are crucial to human development worldwide. However, with the development of industrialization and urbanization, abandoned cropland has gradually evolved into a globally universal phenomenon [2]. According to statistics, from 1700 to 1990, the area of global cropland was about 235 million hectares. Since the 20th century, the area has reached 385 to 472 million hectares [3], accounting for about 8–10% of the world’s total cropland in 2012. Cropland abandonment in Europe, the United States, Japan, Australia [4,5,6,7,8] and other developed countries or regions started early and was widely distributed. Thailand, Chile, Argentina, China [9,10,11,12,13,14,15,16] and other developing countries have also experienced different degrees of abandonment in recent years.
The phenomenon of arable land abandonment often has mixed effects on economic, social and ecological systems [17]. Positive effects have been found, in terms of ecological effects such as vegetation and soil recovery, water retention, and increased biodiversity [18,19,20,21]. However, more studies have reported negative effects which, in addition to affecting food security, have led to increased fire frequency, higher agricultural costs, and loss of traditional agricultural landscapes and cultural values, among others [22,23,24,25,26]. In order to achieve the sustainable development of human society and mitigate the negative effects of land use change, we need to have a deeper understanding of the spatial distribution characteristics of abandoned cropland and the factors and mechanisms affecting abandonment, so that we can scientifically manage abandoned cropland, according to local conditions.
The spatial distribution of arable land abandonment has been uneven across historical periods and regions. In Europe, arable land abandonment mostly began in the mid-19th century during the industrial revolution and was concentrated in the mountainous regions of Central and Mediterranean Europe [27,28,29]; in Asia, it mostly began in the 20th century and was more pronounced in East and Southeast Asia [14,16,30]. As demand for agricultural products increases and land for construction expands, or even occupies arable land, agricultural land requires some degree of expansion or spatial shift. When there is sufficient available space, agricultural land can be expanded into remaining arable areas. For example, the concentration of arable land abandonment in the United States began in the eastern part of the country in the 20th century, later increasing by expanding arable land in the western part of the continent to increase agricultural supply [31]. However, when land that is suitable for expanding cultivation becomes progressively scarce and development is costly and environmentally expensive, reclaiming fallow cropland may become a powerful alternative to expanding agricultural areas into remaining natural ecosystems [32,33]. For example, in Slovakia in Eastern Europe, the abandonment rate of arable land was about 11% in 1986–2000, decreasing to about 6% in 2000–2010, and about 2% of arable land was reclaimed in both periods [34].
In China, the relationship between man and land use is tense. It is of great significance to observe the spatial distribution of abandoned farmland for farmland protection and exploration of hot areas of reclamation. According to the Third National Land Survey [35], the total cropland area of the Chinese mainland is 127.86 million hectares and the per capita cropland area is about 0.09 hectares, less than 40% of the worldwide average. However, according to incomplete statistics, about two thirds of the national provinces have reported cropland abandonment since 1992, including the eastern, central and western regions [36]. Some scholars predict that, in the worst case, between 2010 and 2030, China may abandon 13.53 million hectares of cropland and the cropland area will be reduced to 121.33 million hectares, almost reaching “the red line of 1.8 billion mu of cropland 1” [37]. Under the current circumstances, the spatial characteristics and influencing factors of farmland abandonment must be urgently explored at the national level, so as to provide valuable guidance for land use and management planning.
The meta-analysis reveals that cropland abandonment is the result of a multifactorial combination of the natural environment and socioeconomic and institutional policy [38], and the dominant factors are probably different in different periods and regions. Many countries have reported farmland abandonment and forest restoration under the influence of different dominant factors [39,40]. For example, the abandonment of cultivated land in Kazakhstan is mainly affected by the transformation of the economic operating mechanism. During the 1990–2000 period, driven by the market economy, the agricultural labor force in Kazakhstan was lost and about 54% of the arable land was abandoned. After 2000, government intervention reduced the abandonment rate by about 39% [41]. The determinants of the abandonment of cultivated land in Hokkaido, Japan, from the end of the 20th century to the beginning of the 21st century, were social conditions, such as geographic and demographic changes [42]. The agricultural location theory [43] and the differential land rent theory [44] are used to explain the abandonment of cultivated land because it often initially occurs in areas with poor physical geography and physical conditions, especially in areas with poor soil, large slopes, fragmented land and long distances between the farmers and markets. Areas that are far away are more likely to cause farmland marginalization [2,45,46,47]. In addition, it was confirmed that the topography and slope have no significant impact on the abandonment of cultivated land at the township level, in China’s mountainous areas [48]. Regardless of whether the impact of natural conditions is significant, it is difficult to adjust, especially the complex topography and landforms in China, and the abandoned cultivated land is widely distributed under various natural location conditions. Therefore, starting from social and economic factors, exploring the main influencing factors of China’s farmland abandonment at this stage is an important entry point to solve its negative impact.
Changes in socioeconomic elements, such as urbanization and industrialization, are considered to be the main driving force behind abandoned cropland [14,49,50]. With the development of urbanization and industrialization, the surplus rural labor force is gradually transferred to non-agricultural industries [51]. Wage levels rise rapidly and the cost of agricultural farming opportunities increases. In order to maximize the benefits, farmers will generally reduce the input ratio of the agricultural labor force, causing the phenomenon of labor migration. This is reflected in the studies on the influencing factors of arable land abandonment in many European and Asian countries [27,45,52,53]. Many farmers also choose to undertake part-time jobs [15,27], relying on livelihood diversification to reduce risk. In addition, farmers will also carry out cropland transfer to obtain capital income. For instance, Japan promotes the exchange of land use rights through land holding companies [54]. In particular, some farmers in China retain the value of cultivated land through rent-free circulation [55]. These decisions ultimately led to a reduction in part of the agricultural labor force. When the necessary labor force is gradually lost, and the cropland benefit is lower than the expected benefit, it is more easily abandoned. In summary, socioeconomic conditions (such as labor characteristics, agricultural production and input conditions), part-time jobs and cropland transfer are important factors affecting the degree of cropland abandonment. Many studies in the past have been constrained by conditions such as study samples, often considering only influencing factors such as natural conditions, or focusing one or two types of socioeconomic impact factors [56,57,58,59,60]; our study considered three types of socioeconomic impact factors.
Furthermore, the potential influencing factors on the extent of cropland abandonment are spatially heterogeneous and often manifest in a multilayered form [61]. Influenced by natural resource endowment and socioeconomic development, the degree of farmland abandonment of different families in the same region is generally more similar than that of randomly selected families in different regions; within the same family, the decision of farmland abandonment made by family members is often more similar than that made by members of different families. Therefore, the degree of cropland abandonment is the result of the nested structure of the influencing factors at different levels. However, in the past, the influencing factors of abandoned cropland mostly adopted traditional regression methods, which could not adequately explain the influencing factors of different levels. The multi-level model adopted in this paper can be used to study the relationships within and between the hierarchies of grouped data, and thus, is applicable to the quantification of nested relationships. Furthermore, previous studies focused on a certain region [17,47,62,63], and fewer studied the extent and influencing factors of farmland abandonment with systematic and large-scale (nationwide) peasant household survey data.
This paper aims to analyze the spatial distribution characteristics of the degree of cropland abandonment in China through the use of sampling data at the national level, as well as by observing the range of cropland with potential reusable value and studying the main influencing factors of cropland abandonment in China at the level of the farmer and district/county. In addition, the paper analyzes the mechanism and process of the abandonment of peasant cropland. Finally, according to the comprehensive analysis, we propose countermeasures to alleviate cropland abandonment and improve cropland utilization efficiency and sustainable development.

2. Materials and Methods

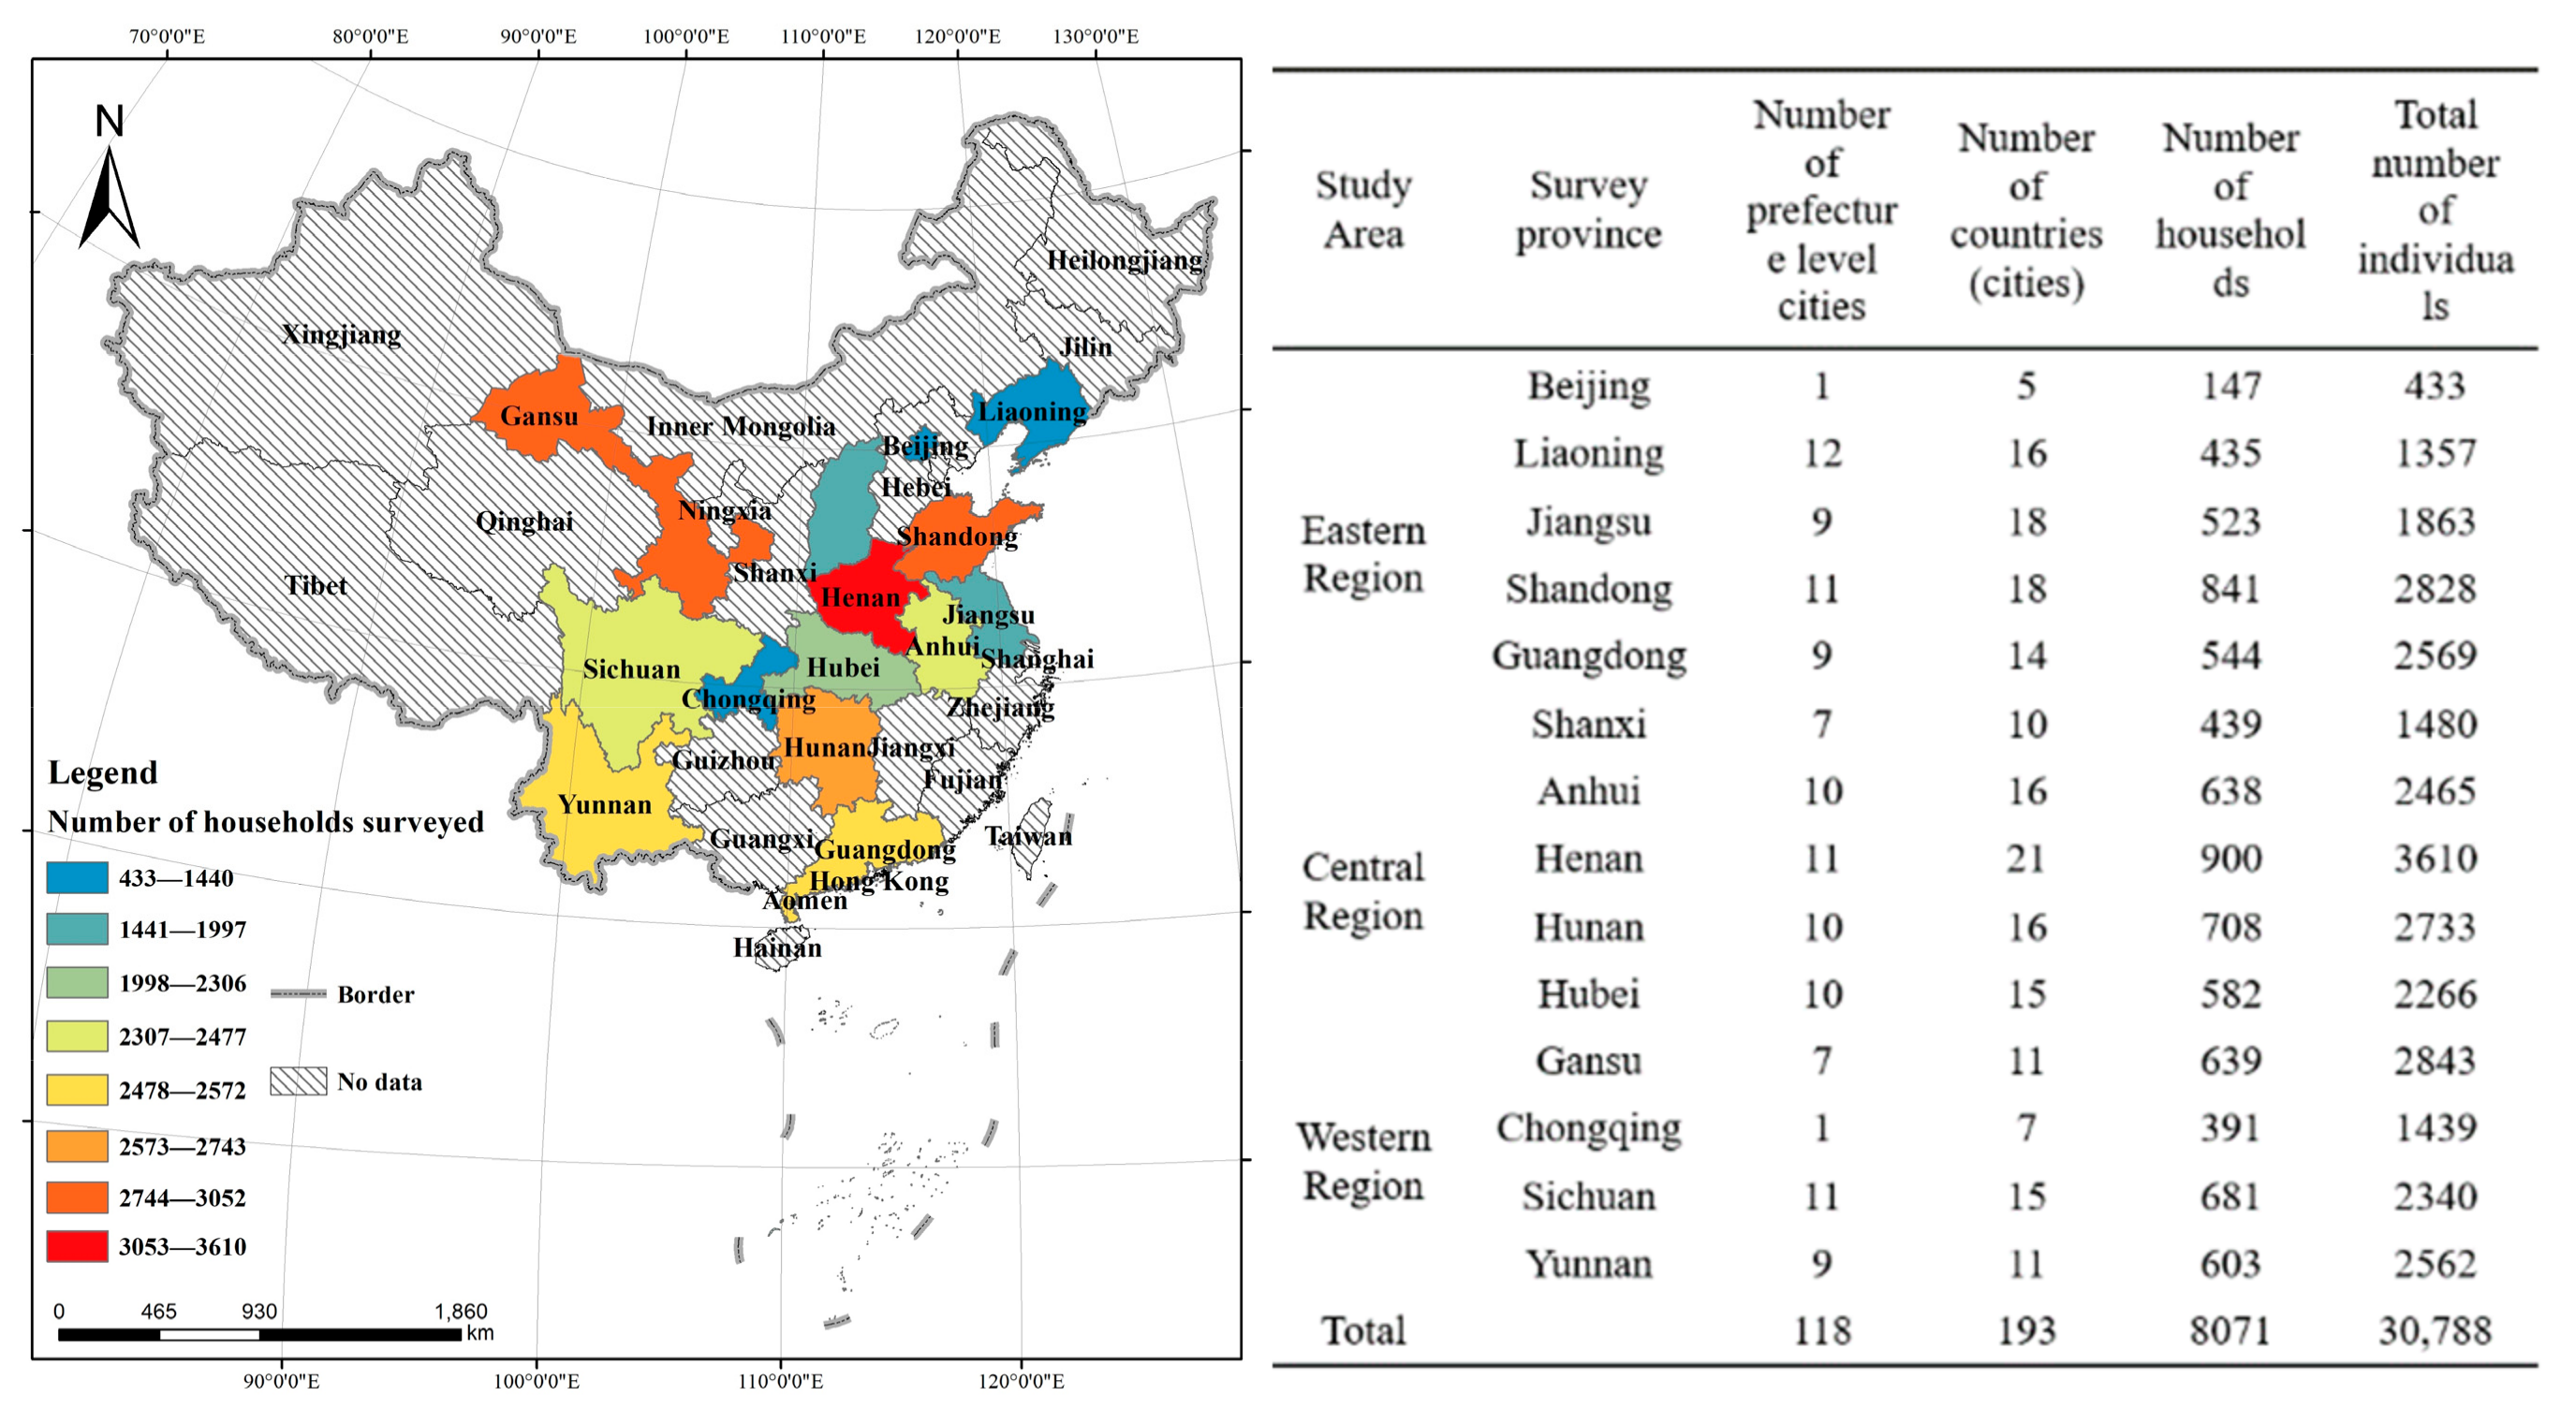
2.1. Study Area and Data Sources

The data used in this paper were obtained from the China Household Income Projects 2013, released by the China Income Distribution Research Institute. The CHIP2013 data were the fifth round of national survey data obtained by the National Household Survey Office of Urban–Rural Integration of the National Bureau of Statistics in 2014, which was the latest source of publicly released data [64]. The data took mainland China as the research area, and sampling methods were used to determine the specific research area. After sampling and sorting, the sample distribution area covered 14 provinces (municipalities directly under Central Government control) and 193 districts/counties in eastern, central and western China. After sorting, the effective sample was 8071 rural households and 30,788 individual samples, mainly involving the personal information of family members, agricultural business status and family income and expenditure. The resource endowment, economic and social status and the sample distribution area itself differed greatly and were strongly representative, which was helpful for analyzing the influencing factors of the degree of cropland abandonment in China at the farmer and district/county levels.
This paper mainly studied rural residents, to screen and sort samples in order to avoid possible human statistical errors in the raw data. Data processing was carried out as follows: (1) excluding samples without land; (2) excluding samples with household partial land areas greater than the total land areas; (3) excluding samples with subcontracted land areas of less than 0; (4) excluding samples with total household disposable incomes and total living consumption expenditures less than or equal to 0; (5) excluding samples with obviously missing key data.
The treated study area and samples are shown in Figure 1.

2.2. Study Methods

2.2.1. Definition of the Degree of Abandonment

This paper uses the abandonment rate of the research unit to express the degree of abandonment, which is specifically defined as the percentage of the abandoned cultivated land area of the research unit to the total cultivated area [65]. The formula is as follows:
Y ij = P ij S ij   ×   100 % ,   Y ij [ 0 , 1 ]
where “ Y ij ” represents the degree of abandonment of cropland of the jth farmer in the ith district/county (%); “ P ij ”represents the area of abandoned cropland of the jth farmer in the ith district/county (hectare); and “ S ij ” represents the total farmland of the jth farmer in the ith district/county.

2.2.2. Multi-Level Model

The degree of cropland abandonment is a continuous variable in the interval of [0,1]. Studies of the influencing factors of this type of variable often adopt nonlinear regression models such as Tobit, which frequently only focusses on individual differences, ignoring the influence of the individual group. The direct promotion of causality or correlation at the individual level to the group level can easily generate atomistic fallacies 2 [66,67] and lead to erroneous conclusions. In this study, the sample distribution was found spatially, particularly at the district/county scale, with distinct group divergence and within-group similarity. Theoretically, different areas and counties have different levels of economic and social development and resource endowments, which may lead to different degrees of farmland abandonment. In the same region, all kinds of influencing factors are similar, and the decision and degree of farmland abandonment may also be more similar. Thus, to break the limitations of the tissue effects caused by traditional regression [68], a multi-level model was used to analyze the influencing factors of farmer cropland abandonment [69]. In this study, the first level referred to the farmer level and the second level referred to the district/county level.
Model 1: ANOVA model
Using a multi-level model, it is first necessary to test the applicability of the model, i.e., whether there is a hierarchical structure of farmer data. Here the ANOVA Model without any explanatory variables is constructed first [69], and is as follows:
Level   1 :    Y ij = β 0 j + r ij ,    r ij ~ N ( 0 ,   σ 2 )
Level   2 :   β 0 j = γ 00 + μ 0 j ,   μ 0 j ~ N ( 0 ,   τ 00 )
Combining Formulas (2) and (3) creates a model including an analysis of variance, with only random effects at the district/county level:
Y ij = γ 00 + μ 0 j + r ij
where “ Y ij ” represents the degree of cropland abandonment of the jth farmer household in the ith district/county; “ r ij ” is the residual of the independent farmer household level, and “σ2” is the variation of the jth two-level unit; “ β 0 j ” is not a constant in ordinary linear regression but is decomposed into the sum of a constant and a random number; “ γ 00 ” represents the total average of all district/county level units; “ μ 0 j ” represents the residual error of the district/county level with independent intercept terms and “ τ 00 ” represents the variation of the district/county level equation cov r ij , τ 00 = 0 .
To test the applicability of the model, it is necessary to introduce the intra-group correlation coefficient ICC (1) [70,71] and reliability ICC (2) [72], as follows:
ICC ( 1 ) = τ 00 ^ σ 2 ^ + τ 00 ^
ICC   <   0.059 Low intra-group correlation 0.059   <   ICC   <   0.138 Moderate intra-group correlation ICC   >   0.138 High intra-group correlation
ICC 2 = j = 1 j τ 00 τ 00 + σ 2 n j j
ICC 2   >   0.7      Reliability reaches the desired level
where “ICC(1)” is used to determine the ratio of the variation at the district/county level in the overall variation of the degree of cropland abandonment. Generally, it needs to be greater than 0.059 to use the multi-level model; “ ICC (2)” represents the ratio of the variation between groups to the variation of the average of each group, i.e., if “ ICC (2)” > 0.7, the average number of organizations is highly representative and can be trusted, and a multi-level model can be used. In addition, the significance of “ τ 00 ” should be tested and, if it is significant, a two-level functional model of the factors affecting the degree of abandonment of cultivated land can be constructed.
Model 2: Random coefficient regression model
After the model applicability test, a random coefficient regression model was established [73]. The model contains only farmer-level explanatory variables and control variables, but allows the intercept and regression coefficients of this hierarchical equation to vary randomly across districts/counties, with the aim of measuring the impact of farmer-level explanatory variables on the degree of farmer cropland abandonment.
Level   1 :   Y ij = β 0 j + β nj X n + r ij
Level   2 :   β 0 j = γ 00 + μ 0 j
β nj = γ n 0 + μ nj ,   n = 1 , 2 , , 6
where “ X n ” represents the nth explanatory variable of the first level; “ β nj ” represents the regression slope of the nth explanatory variable of the first level; “ γ n 0 ” represents the mean value of “ β nj ”; “ μ n j ” is the variation of “ β nj ”; other symbols have the same meaning as above.
Model 3: Full model
It is necessary to establish a full model [74]. Through the interaction results at the district/county level and the farmers’ level, this explores the process of its effect on the difference in the degree of abandonment of farmland, which means the indirect adjustment effect of villages on the differences of degrees of farmland abandonment of farmers.
Level   1 :   Y ij = β 0 j + β nj X n + r ij
Level   2 :   β 0 j = γ 00 + γ 0 m Z m μ 0 j
β nj = γ n 0 + γ nm Z m + μ nj
where “ β 0 j ” represents the intercept of the jth explanatory variable at the second level to explain the intercepts of the explanatory variables at the first level; and “ γ nm ” represents the slope of the mth explanatory variable at the second level to explain the slopes of the explanatory variables at the first level. It reflects the effect of cross-level interaction; the effect can either exist or be 0; other symbols have the same meaning as above.
In the analysis, the above three models were constructed in turn, starting from an ANOVA Model without explanatory variables. Model two and model three added explanatory variables, respectively (see the section below for the selection of explanatory variables), and model two included all explanatory variables and control variables at the farmer level. Model three included all explanatory variables and control variables at two levels. To evaluate the above model, HLM version 8.1 was adopted, which was able to handle multi-level data consistent with nested characteristics, where the sample was non-independent, and could assess the explanatory power of explanatory variables for dependent variables, breaking through the limitations of the single-level interpretation of traditional regression.

2.3. Select Multi-Level Model Variables

The variable selection and variable index system construction of a multi-level model is an important basis for exploring the influencing factors of farmland abandonment. These influencing factors can be divided into natural factors, social/economic factors and management factors, according to their attributes [53,75]. One of the research objectives was to focus on the socio-economic impact factors based on the hard-to-change natural conditions, and to improve the situation of abandoned land by adjusting economic, social and management factors. Therefore, natural conditions were taken as control variables, and we focused on social and economic factors.
For the specific division of socioeconomic factor indicators, most studies are carried out at a single level. At the level of farmers, relative price changes of input–output are an important basis for farmers to decide whether to abandon their farmland [76]. Therefore, the variables related to agricultural input and output are often included in the main influencing factors of farmland abandonment. Specifically, agricultural input includes not only fixed assets and technological input, but also the input of the necessary labor force. A study of the characteristics of the labor force is almost an essential factor for the previous research on farmland abandonment. When the opportunity cost of farming increases and the comparative benefit decreases, labor migration often occurs. Studies on mountainous areas in Japan, South Korea, China, Europe and Asia all reflect the negative response of the decline in the quantity and quality of an agricultural labor force to abandonment, due to the impact of labor migration and aging [77,78,79,80]. In addition, when the necessary agricultural labor force is insufficient, peasant households will also consider putting cultivated land on the market to obtain its value [81]. At the same time, there are also studies analyzing the environmental level and we find that land lease market, labor transfer or part-time employment are hot, key factors of research [52,54].
Of course, the selection of these variables is also directly related to the availability of data. Based on the characteristics of previous studies and data, we set up a model of social and economic factors affecting farmland abandonment from two levels of farmers and districts/counties. Specific indicators and variables were selected as follows.
At the farmer level, we analyzed the influence of abandonment by using the characteristics of labor force, agricultural input, cropland transfer and quality of life [82]. Below, the indicators are listed for each of these characteristics. (1) Labor characteristic indicators include: the number of family agricultural labor force per unit of land area, the proportion of men in the family agricultural labor force and the square root average age of the workforce. We expected that the average workforce per hectare may negatively affect the extent of abandonment as the more labor, the less likely it is to leave arable land. We also expected the male workforce to negatively affect the degree of abandonment because men are, generally, physically stronger than women. We expected a nonlinear relationship between labor age and the degree of cropland abandonment, because younger or older workers tend to abandon more cropland, either due to a lack of farming experience or a lack of physical strength, respectively. Therefore, the “square root average age of the workforce” is discussed in the article. (2) Agricultural investment indicators include: the value of agricultural operational fixed assets and participation in farmer-specialized cooperative economic organizations. We expected both to negatively affect the abandonment of cropland. Owning fixed assets of agricultural operation and participating in farmer-specialized cooperative economic organizations 3 represent farmers’ material and technical input, which indicates that farmers tend to optimize agricultural operation and may reduce the degree of farmland abandonment. (3) Cropland transfer indicators include: the transfer area of family cropland and the average subcontract price per hectare of cropland (logarithmic form). We expected that the larger the area of cultivated land transferred out at the household level and the higher the per-hectare subcontract price, the higher the number of farmers who would tend to transfer their contracted management rights to other collectives or individuals, thereby reducing the degree of abandonment of cropland. (4) Quality of life indicators include: per capita disposable income (logarithmic form). We expected per capita disposable income to have a positive impact on the extent of farmland abandonment. The reason for this is that households with high income generally have part-time or non-agricultural labor, which may lead to an increase in farmland abandonment.
At the district/county level, we tried to obtain metrics that could affect variables at the family level for analysis. Finally, the two major indicators of household part-time employment and population mobility in the cropland transfer market are used to analyze the impact on the degree of cropland abandonment. (1) Indicators of part-time employment and population mobility in a household include: the proportion of the number of part-time workers in each district/county in the total number of wage workers and the proportion of the number of part-time workers outside the district/county in the total number of wage workers in each district/county. We expected that the higher the proportion of total part-time workers and the more the labor input, the lower the degree of cropland abandonment would be. The higher the proportion of the number of part-time workers outside the district/county, the higher the opportunity cost (including time and transportation costs), which may have a positive impact on the degree of cropland abandonment. (2) Cropland transfer market indicators include: the cropland transfer rate in districts/counties. The greater the area involved in cropland transfer within a district/county, the more active the cropland transfer market is and the lower the degree of cropland abandonment expected by farmers in the area.
In addition, the model introduces three indicators of control variables, namely natural conditions, family factors (that influence family decisions) and force majeure factors. (1) Natural condition indicators include: regional annual precipitation, average annual temperature and terrain. As the sample is a sampling survey, the latitude and longitude coordinates of specific farmer plots are not published, so the data source is limited. Therefore, the natural conditions index is the most accurate at the district and county level. Other indicators of natural conditions, such as slope and arable land quality, are difficult to obtain. In addition, natural conditions were not studied as the main influencing factors, so control variables were included. (2) Family factors affecting family decision-making include: the head of the household’s degree of formal schooling and the health status of family members. The head of the household, generally has a key impact on family agricultural production decision-making, so it is necessary to control for these personal characteristics. Since both age and gender are associated with the explanatory variables studied, they were not included. The health status of family members refers to whether there is a disabled person in the family; if so, he or she may need family care or high medical bills, which has an impact on the abandonment of cropland and is included in the control variables. (3) Force majeure variables include whether farmers have cropland requisition. Cropland requisition is a force majeure, which has nothing to do with the decision to abandon cropland, but it will affect the change of the cropland area, so it is included as a control variable. All of the variables and their descriptions are listed in Table 1.

2.4. Model Goodness of Fit Test

The Akaike information criterion (AIC) [84] is a measure of the goodness of fit of statistical models and, in general, the better the model is, the smaller the AIC value will be.
The AIC is typically expressed as:
AIC = 2 k     2 ln L
where “ k ” represents the number of parameters and “ L ” represents the likelihood function.
Assumptions: the error of the model follows an independent normal distribution.
AIC = 2 k + n   ln S S R n
where “ n ” represents the number of samples and “ SSR ” represents the sum of residual squares.

3. Results Analysis

3.1. Abandoned Cropland Decisions and Spatial Distribution of Degree of Abandonment

Sampling data showed that the phenomenon of cropland abandonment had been common, especially selective partial abandonment by farmers; the specific situation is shown in Figure 2. In 2013, the national cropland abandonment level of farmers accounted for 15.41% and the average degree of abandonment of cropland was 5.54%. From the perspective of spatial distribution, the proportion of farmers with abandoned cropland in each region and the spatial distribution of abandoned cropland were generally the same.
From the perspective of provincial spatial distribution, the proportion of farmers in Chongqing who made the decision to abandon cropland was the highest, reaching 40.15%, and the degree of abandonment also ranked first, reaching 25.34%. This was mainly affected by the mountainous terrain and the fact that cropland quality in Chongqing is of a low level. Guangdong Province and Shanxi Province had the second and third highest proportion of farmland abandonment, which exceeded 24% and 14%, respectively. However, the proportion of abandoned farms in Guangdong Province was lower than that of Shanxi Province, indicating that Guangdong Province may be affected by urban construction and development with broken cropland and less average cropland, but higher quality. Shanxi Province is located on a Loess Plateau, which is mainly affected by terrain and water- heat resources, with a high degree of abandonment.
In addition, for Shandong Province, Liaoning Province, Henan Province and Jiangsu Province (the provinces representing the main grain-producing areas), the proportion of abandoned cropland farmers and the degree of abandoned cropland were all low-value areas in China. In these four provinces, the proportion of farmers with farmland abandonment was less than 5% and the degree of farmland abandonment was less than 2%. From the perspective of spatial distribution at the county level, of the 193 county-level samples, 29.53% of the districts/counties did not decide to abandon cropland and the cropland abandonment rate was 0; these were also concentrated in these provinces. This is the result of the integrated role of natural selection and economic-social development. Most of these areas are located on the plains and surrounding areas, with excellent cropland quality and rich water-heat resources, at locations where agriculture has been developed since ancient times. In addition, the “food crop production strategy based on farmland management and technological application” 4 national policy has been vigorously supporting the agricultural development of provinces with major grain-producing areas.

3.2. Analysis of the Influencing Factors of Cropland Abandonment Degree

3.2.1. Preliminary Inspection

The collinearity of the selected variables was first tested before the model operation. The variance inflation factor (VIF) showed that the maximum VIF of each single variable was 1.772, much less than the cutoff of 10, indicating that there was no serious collinearity problem between the variables and, thus, they could be simulated.

3.2.2. Model Suitability and Reliability Test

The results of the ANOVA Model (Model 1) showed that this study was applicable to multi-level models with significant differences in the degree of cropland abandonment between districts/counties, as follows:
ICC 1 = τ 00 ^ σ 2 ^ + τ 00 ^     0.3153   >   0.138
ICC 2 = j = 1 j τ 00 τ 00 + σ 2 n j j     0.885   >   0.7
P τ 00   <   0.001
The calculation showed that the results of ICC 1 indicated a high within-group correlation at the district/county level and the ICC 2 results indicated that the model reliability reached the ideal level and   τ 00   was significant at 0.1%, so the model was very applicable. The values of ICC 1 also indicated that approximately 31.5% of the variance could be explained at the district/county level, with the remaining 68.5% of the variance being explained at the farmer level.

3.2.3. Model Results

The random coefficient regression model (model 2) introduced all explanatory variables and control variables at the farmer level. The specific results are as follows: (1) the proportion of men in the family’s agricultural labor force, agricultural operational fixed asset value, household cropland transfer area and subcontract price of cultivated land per hectare (log) showed a highly significant negative correlation with cropland abandonment, and per capita disposable income (log) showed a greatly significant positive correlation with it. (2) The number of family agricultural labor per unit area of cropland was significantly negatively correlated with the degree of abandonment of cultivated land. (3) The effect of participating in farmer-specialized cooperative economic organizations on the extent of cropland abandonment was not significant. (4) The square root mean age of the agricultural labor force had a significant non-linear relationship with the degree of cropland abandonment and presented an opposite effect. Alternatively, the random effect results varied significantly at level 2.
The full model (model 3) added the explanatory variables of district/county level to model 2. The specific results are as follows: (1) The response relationship between the farmer level and the degree of cropland abandonment was the same as model 2. (2) The results of explanatory variables at the district/county level showed that the overall proportion of concurrent workers and the rate of cropland transfer in the district/county had a significant negative effect on the degree of cropland abandonment, while the proportion of concurrent workers outside the county had a significant positive effect on the degree of cropland abandonment. (3) The random effect results showed that the district/county level variables effectively explained the variance at the farmer level, resulting in an uninterpretable decrease in variance when compared to model 2.

3.2.4. Model Goodness of Fit Test

In this study, the AIC value of model 1, model 2 and model 3 gradually decreased, indicating that the goodness-of-fit of model 3 was higher.
The running results of the model are shown in Table 2.

4. Discussion

4.1. Analysis of the Influencing Factors of Cropland Abandonment

The results of a multi-level model of cropland abandonment show that the farmer level can explain about 68.5% of the interpretable variance, and the district/county level explains about 31.5% of the interpretable variance. In other words, without considering other factors, the variables of the farmer level (labor characteristics, agricultural investment, cropland transfer and quality of life) and the district/county level (household part-time employment, population mobility and cropland transfer market) are all important factors affecting the degree of cropland abandonment.
At the farmer level: (1) Labor characteristic indicators can significantly affect the abandonment of cropland, which is also consistent with previous studies [5]. The modeled results in this paper are the same as the assumptions. The number of agricultural laborers per unit area of land, the proportion of male laborers with high farming efficiency, and the farm households comprising mainly middle-aged labor are all negatively correlated with the degree of abandonment of cropland. In other words, the richer the labor resources that farmers can supply, the higher the quality of the labor force, and the lower the possibility of cropland abandonment will be. Some studies also found that with the development of mechanization and cropland circulation, the response relationship between the labor force numbers and the degree of cropland abandonment was no longer significant from a certain stage. However, this paper, based on research at the national level in 2013, showed that the number of the labor force and the degree of abandoned cropland had not yet entered this stage.
(2) There is a significant negative correlation between the value of agricultural fixed assets and the degree of cropland abandonment in agricultural investment indicators. The higher the fixed asset value is, the higher the labor productivity of farmers may be and, in the long run, the input–output ratio will be relatively higher. Therefore, farmers with a higher value of agricultural operational fixed assets are more inclined to engage in agricultural operation for a long time, with the degree of cropland abandonment thus being reduced. In addition, participation in farmer-specialized cooperative economic organizations showed no significant relationship with the abandonment of cropland the original hypothesis was rejected. This may be because the development time of relevant organizations in China was short, and no scale effect occurred. In 2006, China issued the Law of the People’s Republic of China on the Professional Peasant Cooperatives, and the development of such organizations began to have formal legal norms. From 2006 to 2013, the development of relevant organizations took place slowly, and the market mechanism was not perfect. In 2013, in the study sample, the number of farmers participating in farmer-specialized cooperative economic organizations was only 243, accounting for 3.01% of the total sample. Farmers participating less had low benefits on the whole and was not significantly related to the degree of abandonment of cropland.
(3) Cropland transfer indicators (cropland transfer area and the average subcontract price per hectare of cropland) all have significant negative effects on the degree of cropland abandonment. As far as farmers are concerned, there are generally two main reasons for the transfer of cropland: one is to obtain economic benefits, i.e., the higher the transfer price, the more farmers tend to transfer cropland, thus reducing the possibility of abandoned cropland. The other reason is to ensure the quality of cropland. To be specific, some farmers have a “love for soil”. In the years when they cannot plow themselves, they are willing to transfer it to others, for free, and protect the cropland from being barren, obtaining agricultural subsidies. The results in this paper show that the proportion of “rent-free land transfer” reached 13.69% nationwide, and was especially common in the central and western regions. Among them, Chongqing and Shanxi Province had the highest proportion, reaching 38.25% and 38.02%, respectively, while Gansu, Sichuan, Hunan and Hubei Province all had more than 20%. However, regardless of the reason, the transfer of peasant land effectively reduced the abandonment of cropland.
(4) The per capita disposable income, which is an indicator of the quality of life, has a significant positive effect on the degree of abandonment of cultivated land. The Rural Green Paper: Analysis and Forecast of China’s Rural Economic Situation (2013–2014) pointed out that the wage income of farmers exceeded the net income of household operations for the first time in 2013. Farmers’ wage income accounted for 45.3 percent of their per capita net income. This means that the opportunity cost of farming increases as farmers tend to work outside or part-time. The proportion of a household’s non-agricultural income increases, and the loss of the agricultural labor force may lead to the abandonment of cropland.
According to the model, the variables at the district/county level had a significant impact on the degree of cropland abandonment. The human–land relationship at the farmer level can be explained by socioeconomic factors, and the regularity of this relationship can be explained at an environmental level.
At the farmer level, we mainly analyzed the impact of the labor force, labor materials, capital and technology input, and farmland subcontracting on the degree of abandonment of cropland from the perspective of input and transfer. When we treat farmland and its output products as commodities and circulate them in the market (and the input–output ratio becomes low, or even negative), we consider reducing or stopping production to reduce losses. With the rapid development of industrialization and urbanization, Chinese wages for migrant workers have risen rapidly at 10% per year since 2003 [85], resulting in higher agricultural labor costs. In 2013, the labor cost of average cropland per hectare was about 6450 yuan, exceeding the cost of agricultural materials and services for the first time. This means that farmers must find other ways to make up for the losses caused by rising labor costs, such as large-scale or intensive operations, but many areas are subject to land fragmentation and large slopes, which cannot improve labor productivity. Therefore, cropland with poor quality was gradually marginalized and the degree of abandonment of land deepened.
In order to avoid risks and maximize income, a part-time job has become a rational choice for many farmers. We find that, at the district/county level, the higher the proportion of the total part-time labor force, the lower the degree of cropland abandonment, and the higher the proportion of the part-time labor force outside the county, the higher the degree of cropland abandonment. The working distance may regulate the response relationship between the number of farmers and the abandonment of cropland. This is due to the fact that most of the laborers working part-time inside districts/counties are middle-aged and elderly, with an average age of 45 years. It is hoped that they can take both agricultural and non-agricultural work and still become an important component of the agricultural labor force. The long-distance part-time labor force is mostly young and middle-aged, with more than three fifths being under the age of 45. They have part-time jobs for a long time. They also take care of family agricultural operations when they are busy with farming. Most of them have non-agricultural wages as their main income. When the cost of agricultural operation opportunities gradually increases, the long-distance labor force tends to abandon cropland.
In addition, the phenomenon of “rent-free land transfer” found at the farmer level is also related to the imperfect cropland transfer mechanism at the district/county level. We found that the cropland transfer at the district/county level could effectively reduce the degree of cropland abandonment, but it was only in terms of the participation area of cropland transfer. During early data processing, it was found that the average hectare price of cropland transfer at the district/county level did not play a significant role in the degree of cropland abandonment. Of the 193 districts/counties sampled, 37.31% had “rent-free land transfer”, with more than two thirds of them in the central and western regions. This showed that the market mechanism of cropland transfer at the district/county level needed to be improved, especially in the central and western regions. This should be achieved by coordinating the quality and economic development level, properly handling the relationship between the withdrawal and transfer of cropland, establishing an effective price mechanism, and alleviating the conflicts between humans and land.

4.2. Interpretation of the Evolution Process and Mechanism of Cropland Abandonment

The study presented in this paper controlled for the influence of natural conditions and expected to select variables related to social-economic considerations that explain the influencing factors of cropland abandonment. From the perspective of input–output, the evolution process and mechanism of cropland abandonment in China at this stage, through the process of land use decision-making by an ordinary farmer, is shown in Table 3.
Assumptions: (1) Farmers are “rational people”. (2) There is a minimum labor input that guarantees the basic output per unit of arable land. If it is less than the minimum input, there is recessive abandonment of underutilized arable land, and no input corresponds to explicit abandonment [86,87,88,89]. If all the cropland of the family is not invested, it is regarded as completely abandoned or completely withdrawn. (At the district/county level, all the cropland of each farming household is taken as a unit and the non-investment of all the farmland of all the households in the district/county is regarded as complete abandonment or complete withdrawal.)
Phase 1: The stage of no abandoned cropland.
At this stage, all farmers invested all in agricultural production activities, mainly in labor and material resources. The input–output ratio showed an increasing trend and the cropland social security and economic output were close to, or reaching, an equilibrium point, generally not involving non-agricultural production activities, so there was no abandonment phenomenon.
From the perspective of sampling data results, there were very few areas where cropland had not been abandoned and farmers did not have part-time jobs, and these were concentrated in several urban areas in Jiangsu Province and Liaoning Province. The agricultural benefits were as expected, probably due to the rapid development of multi-functional urban agriculture relying on urban areas. There were also errors due to the small number of samples. In other words, in 2013, most Chinese farmers had gone through the stage of no abandoned cropland and no concurrent employment.
Phase 2: The stage of recessive abandoned cropland.
At this stage, farmers had part-time jobs and the cropland was not fully utilized, but farmers still mainly carried out agricultural activities. In China, especially since the 21st century, agricultural labor costs have risen rapidly, and farmers generally choose concurrent employment to reduce risks. At this stage, a small portion of the workforce moved to the non-agricultural sector and the labor devoted to agricultural activities decreased. Farmers often increased technical factors (such as improving mechanization) or adjusted the crop structure to balance losses and improve labor productivity, but these measures were easily restricted by natural conditions such as the terrain, slope and soil. Finally, the proportion of non-agricultural income was on the rise and the social security value of cropland was partially lost.
From the sampling data results, it can be observed that the recessive abandonment phenomenon in various districts/counties had been relatively common, concentrated in the traditional main grain-producing areas such as Henan Province, Liaoning Province, Anhui Province, Jiangsu Province and Shandong Province. The abandonment rate was 0 but the number of areas with part-time farmers accounted for about 27% of the total number of samples. There were 13 districts/counties where the abandonment rate was 0 but the proportion of rural households that included laborers or farmers with part-time jobs exceeded 50%. That is to say, farmers at this stage still attached importance to the social security value of cropland and were in the transition period of recessive abandonment and dominant abandonment.
Phase 3: The stage of dominant abandoned cropland and low-level abandoned cropland.
At this stage, farmers were generally engaged in part-time jobs, mainly in non-agricultural activities. The increased cost of agricultural operation opportunities prompted farmers to redistribute the input elements and shifted most of the agricultural labor force to the non-farming sector. At this time, cropland management generally appeared as two situations, one of which was the cropland transfer. Comprehensive cropland of high-quality easily entered the market, while relatively low-quality cropland was in less demand, of low price, and a lack of land rent transfers or the marginalization of cropland easily occurred. Second, in the case of no transfer, the minimum labor investment could not be guaranteed and passive abandonment and the degree of abandonment was gradually increased. In the end, farmers’ income was mainly non-agricultural income, and the importance of the social security value of cropland was relatively reduced.
Sampling data showed that more than 70% of the districts/counties had a low degree of abandonment in the 193 districts/counties sampled, and all provinces had obvious abandonment. In other words, around 2013, China was in a low stage of abandonment, where most farmers paid more attention to the economic benefits of non-agricultural work, but did not completely give up the social security value of cropland.
Phase 4: The stage of high-degrees of cropland abandonment and cropland withdrawal.
At this stage, farms were mainly non-agricultural operations, with agriculture acting as a sideline, or not engaged in agricultural operations. With this stability, especially in young and middle-aged families, the investment in agricultural production gradually became less, and even completely transferred to the non-agricultural sector. At this stage, farmers’ income almost completely depended on non-agricultural activities. When the social security value of cropland was replaced by non-agricultural income, farmers no longer needed cropland, and it would be actively abandoned; the degree of abandonment would become gradually higher until complete abandonment was reached or the cropland was completely transferred or withdrawn.
Sampling data showed that the high-degree abandoned areas were concentrated in the districts/counties of Anhui Province, Chongqing City and Shanxi Province, as well as in the urban areas of Beijing and Guangdong Province. On the one hand, these findings reflected the fact that the comparative income of cropland in the central and western regions was, in relative terms, too low, and the farmers with high-quality labor forces tended to engage in non-agricultural activities that could achieve the expected income. On the other hand, the growth in urbanization and construction and the increase in employment opportunities in the eastern developed areas also played a role in promoting the abandonment of cropland. According to the 2013 National Migrant Workers Monitoring and Survey Report [90], 77.39 million migrant workers migrated across provinces and 88.71 million migrated within their home province. Migrant workers in the eastern region mainly migrated within their home province, while migrant workers in the central and western regions mainly migrated across provinces. In summary, it was the socioeconomic development that provided farmers with choices and opportunities to make a diverse livelihood. To alleviate the abandonment of cropland, we should also start with socioeconomic factors.

4.3. Policy Revelation

The scientific and efficient use of cropland resources is of great significance in terms of maintaining food security and social stability, as well as promoting rural revitalization and sustainable regional development. Nationwide sampling data revealed the main socioeconomic factors affecting cropland abandonment. The labor status, part-time jobs and cropland transfer market were the focus of our attention. In order to address the impact of the above factors on cropland abandonment, we adjusted the socioeconomic factors based on the natural conditions that were difficult to change, and put forward suggestions for the suppression of cropland abandonment from the perspectives of the macro-regional level and the micro-farmer level in Table 4.
To conclude, policy proposals to alleviate cropland abandonment should not only consider maintaining the planting state of marginal land, but also focus on reducing the negative impact of cropland abandonment [14,91,92]. The key to policy implementation is to improve the capacity and competitiveness of sustainable agricultural development, especially the marginal land. For areas that are not suitable for farming and are not included in the red line of cropland, it is advisable to respect the choice of farmers and focus on natural withdrawal. At the same time, the mutual influence of the marginalization of cropland and rural marginalization in poor villages [93], and societal guarantees and environmental benefits, should be emphasized. For China’s main sloping cropland, it is difficult to achieve large-scale mechanization, so the focus should be on the necessary labor force, and improving agricultural income and agricultural production conditions and efficiency. At the same time, measures should be taken to speed up the suitable transformation of cropland mechanization in hilly and mountainous areas or the research and development of miniature agricultural machinery. For high-quality cropland, the key is to consider the preservation of cropland planting to maximize the benefits. For land suitable for farming but where farmers decide not to farm, the village collective should guide farmers to actively participate in the transfer of cropland. The government should clarify land property rights, standardize farmland transfer procedures, and improve farmland transfer markets. When other construction activities occupy cultivated land and need compensation, the development entity may obtain abandoned cultivated land for reclamation according to law.

4.4. Model Uncertainty

Based on the farmer household survey data of different counties in China, we built a multi-level analysis model to analyze the social and economic factors affecting the degree of farmland abandonment. Due to the large territorial space in China, the natural, social and economic conditions of many counties are varied. Theoretically, we could consider adding spatial variables into the modeling. Thus, we tested the spatial autocorrelation at the county level in the model; however, it was difficult to test the spatial autocorrelation at the household level. Due to the limitation of the data source, it was difficult for us to obtain farmers’ latitude and longitude coordinates in the survey. We tried to use spatial information at the provincial or county level to ascertain farmer locations for spatial model analysis. Unfortunately, this requirement was not satisfied. Therefore, we did not construct spatial variables at the household level. The absence of spatial variables may have led to some subtle errors of potential spatial interaction effects or spatial spillover effects that are difficult to observe. However, based on previous relevant studies, it is rare to consider spatial variables and establish spatial models after deciding to establish multi-level analysis models [36,69,71]. In other words, the uncertainty may have been small to the extent that it did not affect the results and conclusions.

5. Conclusions and Prospects

The phenomenon of cropland abandonment is quite common in China. In 2013, the national cropland abandonment level of farmers accounted for 15.41% and the average degree of abandonment of cropland was 5.54%. The proportion of farmers in each region and the spatial distribution of abandoned cropland were generally consistent. Chongqing, Guangdong and Shanxi Province were hot spots in terms of abandonment degrees, and Shandong, Liaoning, Henan and Jiangsu Province were low-value areas in terms of cropland abandonment in China. Cropland abandonment decision-making and abandonment degrees are the result of the combined effects of nature, economy, society and policy.
We used a multi-level model to assess the main socioeconomic impact factors of cropland abandonment at the farmer level and the district/county level. The study found that about 68.5% of the differences in abandoned cropland could be explained at the farmer level, and 31.5% were explained at the district/county level. Specifically, at the farmer level, all labor indicators and cropland transfer indicators, including land labor quantity per unit area, male agricultural labor ratio, middle-aged farmers, cropland transfer area and cropland subcontract amount, had a significant negative impact on the degree of cropland abandonment. The value of agricultural operational fixed assets in agricultural investment indicators was significantly negatively correlated to cropland abandonment, but the influence of joining farmer-specialized cooperative economic organizations on the degree of farmland abandonment was not significant. The per capita disposable income (an indicator of quality of life) had a significant positive effect on the degree of arable land idleness. At the district/county level, the proportion of the total part-time labor force was negatively related to the degree of cropland abandonment, while the proportion of the part-time labor force outside the county was positively related to the degree of cropland abandonment, and the part-time distance may adjust the response relationship between the proportion of the concurrent labor force and the degree of cropland abandonment.
At present, China is in a period of rapid transformation of land use. In the foreseeable future, the abandonment of arable land will continue to be common in China. This prediction can be combined with our research to illustrate the development trends of social and economic influencing factors such as labor status, agricultural input, farmland transfer and quality of life. (1) With the rapid development of urbanization and industrialization in China, it is an inevitable trend that the agricultural labor force will migrate to cities and the aging of the agricultural labor force will be further deepened. It is predicted that the proportion of aging farmers will increase from 20% (in 2010) to 50% (in 2030) [94]. The quantity and quality of the agricultural labor force will be affected in the future and the abandonment of arable land may increase. (2) From the perspective that agricultural input is mainly a fixed asset input, the growth momentum is insufficient. Chinese farming labor patterns have the traditional characteristics of small farming. For example, a typical farmer manages 0.56 hectares of cultivated land, but it is divided into several plots [95], with a high degree of land fragmentation. Farmers can only use small and micro machines or even primitive tools for farming [30], particularly in mountainous areas. The arable land in China’s mountainous areas accounts for about one quarter of the total arable land area in China and it is prone to abandonment. Therefore, farmers may be less enthusiastic about investing in fixed assets such as agricultural machinery in the future, thus increasing the possibility of abandoned farmland. (3) The active farmland transfer market is beneficial in terms of alleviating farmland abandonment. However, the abandoned farmland is of low quality and the phenomenon of rent-free circulation is prevalent. In the past, families with abundant labor could obtain marginal land to reduce the abandonment of farmland, but with the migration of the labor force, the land transfer market also faces obstacles, thus affecting the decision of farmland abandonment. (4) Although the per capita disposable income of rural residents in China has been on the rise from 2014 to 2020 [83], among the 570 million farmers, those who have part-time or a high proportion of non-agricultural labor account for about 50% [96,97]. This indicates that the rate of return on agriculture is too low, and that the possibility of further farmland abandonment will increase in the future. This is consistent with the predictions put forward in existing studies [98]. Although the Chinese government has taken a series of measures to support agricultural development, these measures may not be enough to support the alleviation of farmland marginalization and abandonment [99]. Therefore, the government should take more positive steps towards alleviating farmland abandonment.
According to the influencing factors and the national policy orientation in recent years, we suggest that alleviating the abandonment of cropland in the future should focus on the following aspects:
  • Comprehensive use of remote sensing satellites and sampling surveys to monitor the abandonment of cropland and establish a bank of abandoned land, which is closely related to the balance of cropland occupation and reclamation.
  • Protect the necessary agricultural labor force, introduce social capital and innovative-entrepreneurial talents to return to the countryside.
  • Improve the comprehensive quality of cropland.
  • Improve the mechanized transformation of hilly and mountainous areas.
  • Develop appropriately scaled operations and promote socialized agricultural production services, such as trusteeship.
  • Continue to implement agricultural subsidies and minimum purchase prices.
  • Promote revenue, cost, and disaster insurance to ensure agricultural income and asset value.
  • Improve the cropland transfer market and strictly implement the Administrative Measures for the Transfer of Rural Land Management Rights, in which special attention should be paid to clarifying the property rights and ownership periods and promoting the long-term investment, development and protection of cropland.
  • It is necessary to fully cooperate with the construction of grain production functional zones and important agricultural production protection zones.
  • “Stop the non-agriculturalization of cropland, prevent the non-grainization of cropland” 5 and strictly protect “the red line of 1.8 billion mu (120 million hectares) of cropland”.
At the same time, we should not only pursue the economic benefits of cropland, but give full play to the comparative benefits and pay attention to sustainable development and the protection of the ecological environment.

Author Contributions

C.J.: Conceptualization, Methodology, Software, Validation, Formal analysis, Writing—original draft preparation, Writing—review and editing, Visualization. W.S.: Conceptualization, Data curation, Writing—original draft preparation, Supervision. All authors have read and agreed to the published version of the manuscript.

Funding

This research was supported by the Projects of National Natural Science Foundation of China (grant number 42071233), the Strategic Priority Research of the Chinese Academy of Sciences (grant number XDA20040201) and the Second Tibetan Plateau Scientific Expedition and Research (grant number 2019QZKK0603).

Institutional Review Board Statement

Not applicable.

Informed Consent Statement

Not applicable.

Data Availability Statement

Data Availability Statement: Data are available in a publicly accessible repository.

Acknowledgments

We would like to thank the China Institute for Income Distribution (http://ciid.bnu.edu.cn/ (accessed on 10 September 2020)). We would also like to thank the anonymous reviewers for their valuable comments and suggestions for improving this paper.

Conflicts of Interest

The authors declare no conflict of interest.

Notes

1
The red line for protecting 1.8 billion mu of arable land is the minimum amount of arable land set by the Chinese government to ensure China’s food security. The area of 1.8 billion mu is equal to 120 million hectares.
2
The atomistic fallacy refers to the fallacy that occurs when data obtained from individual level analysis are extrapolated to the organizational level. It is used to emphasize the error of ignoring the impact of the organizational level.
3
Farmer-specialized cooperative economic organizations refer to the form of enterprise organization formed by farmers, especially small agricultural entities mainly operated by families, who jointly engage in specific economic activities, in order to maintain and improve their respective production and living conditions. Farmers’ participation in the organization is based on voluntary mutual assistance, equality and mutual benefit, and members are required to abide by the laws and regulations of the cooperative.
4
Land resources, science and technology should be taken as an important guarantee to ensure food security supply.
5
This is a policy of the Chinese government. The connotation is that farmers can only be engaged in agricultural production activities on cropland, planting food crops.

References

  1. GFSI. The Global Food Security Index. 2020. Available online: http://foodsecurityindex.eiu.com (accessed on 1 September 2020).
  2. Levers, C.; Schneider, M.; Prishchepov, A.V.; Estel, S.; Kuemmerle, T. Spatial variation in determinants of agricultural land abandonment in Europe. Sci. Total. Environ. 2018, 644, 95–111. [Google Scholar] [CrossRef] [PubMed]
  3. Campbell, J.E.; Lobell, D.B.; Genova, R.C.; Field, C.B. The global potential of bioenergy on abandoned agriculture lands. Environ. Sci. Technol. 2008, 42, 5791–5794. [Google Scholar] [CrossRef] [PubMed]
  4. MacDonald, D.; Crabtree, J.R.; Wiesinger, G.; Dax, T.; Stamou, N.; Fleury, P.; Lazpita, J.G.; Gibon, A. Agricultural abandonment in mountain areas of Europe: Environmental consequences and policy response. J. Environ. Manag. 2000, 59, 47–69. [Google Scholar] [CrossRef]
  5. Meyfroidt, P.; Lambin, E.F. Global Forest Transition: Prospects for an End to Deforestation. Annu. Rev. Environ. Resour. 2011, 36, 343–371. [Google Scholar] [CrossRef]
  6. Weissteiner, C.J.; Boschetti, M.; Bottcher, K.; Carrara, P.; Bordogna, G.; Brivio, P.A. Spatial explicit assessment of rural land abandonment in the Mediterranean area. Glob. Planet. Chang. 2011, 79, 20–36. [Google Scholar] [CrossRef]
  7. Alcantara, C.; Kuemmerle, T.; Baumann, M.; Bragina, E.V.; Griffiths, P.; Hostert, P.; Knorn, J.; Mueller, D.; Prishchepov, A.V.; Schierhorn, F.; et al. Mapping the extent of abandoned farmland in Central and Eastern Europe using MODIS time series satellite data. Environ. Res. Lett. 2013, 8, 035035. [Google Scholar] [CrossRef]
  8. Queiroz, C.; Beilin, R.; Folke, C.; Lindborg, R. Farmland abandonment: Threat or opportunity for biodiversity conservation? A global review. Front. Ecol. Environ. 2014, 12, 288–296. [Google Scholar] [CrossRef]
  9. Angelsen, A.; Kaimowitz, D. Introduction: The role of agricultural technologies in tropical deforestation. In Proceedings of the Workshop on Agricultural Technologies and Tropical Deforestation, Ctr Agronom Trop Investigac Ensenanza, Turrialba, Costa Rica, 11–13 March 1999; pp. 1–17. [Google Scholar]
  10. Shively, G.; Martinez, E. Deforestation, irrigation, employment and cautious optimism in Southern Palawan, the Philippines. In Proceedings of the Workshop on Agricultural Technologies and Tropical Deforestation, Ctr Agronom Trop Investigac Ensenanza, Turrialba, Costa Rica, 11–13 March 1999; pp. 335–346. [Google Scholar]
  11. Izquierdo, A.E.; Grau, H.R. Agriculture adjustment, land-use transition and protected areas in Northwestern Argentina. J. Environ. Manag. 2009, 90, 858–865. [Google Scholar] [CrossRef] [PubMed]
  12. Lambin, E.F.; Meyfroidt, P. Land use transitions: Socio-ecological feedback versus socio-economic change. Land Use Policy 2010, 27, 108–118. [Google Scholar] [CrossRef]
  13. Diaz, G.I.; Nahuelhual, L.; Echeverria, C.; Marin, S. Drivers of land abandonment in Southern Chile and implications for landscape planning. Landsc. Urban Plan. 2011, 99, 207–217. [Google Scholar] [CrossRef]
  14. Li, S.F.; Li, X.B. Global understanding of farmland abandonment: A review and prospects. J. Geogr. Sci. 2017, 27, 1123–1150. [Google Scholar] [CrossRef]
  15. Deng, X.; Xu, D.D.; Zeng, M.; Qi, Y.B. Does Internet use help reduce rural cropland abandonment? Evidence from China. Land Use Policy 2019, 89, 104243. [Google Scholar] [CrossRef]
  16. Han, Z.; Song, W. Abandoned cropland: Patterns and determinants within the Guangxi Karst Mountainous Area, China. Appl. Geogr. 2020, 122, 102245. [Google Scholar] [CrossRef]
  17. Yan, J.; Yang, Z.; Li, Z.; Li, X.; Xing, L.; Sun, L. Drivers of cropland abandonment in mountainous areas: A household decision model on farming scale in Southwest China. Land Use Policy 2016, 57, 459–469. [Google Scholar] [CrossRef] [Green Version]
  18. Sileika, A.S.; Stålnacke, P.; Kutra, S.; Gaigalis, K.; Berankiene, L. Temporal and Spatial Variation of Nutrient Levels in the Nemunas River (Lithuania and Belarus). Environ. Monit. Assess. 2006, 122, 335–354. [Google Scholar] [CrossRef] [PubMed]
  19. Segar, J.; Pereira, H.M.; Filgueiras, R.; Karamanlidis, A.A.; Saavedra, D.; Fernandez, N. Expert-based assessment of rewilding indicates progress at site-level, yet challenges for upscaling. Ecography 2021. [Google Scholar] [CrossRef]
  20. Baumann, M.; Kamp, J.; Pötzschner, F.; Bleyhl, B.; Dara, A.; Hankerson, B.; Prishchepov, A.V.; Schierhorn, F.; Müller, D.; Hölzel, N.; et al. Declining human pressure and opportunities for rewilding in the steppes of Eurasia. Divers. Distrib. 2020, 26, 1058–1070. [Google Scholar] [CrossRef]
  21. Kamp, J. Weighing up reuse of Soviet croplands. Nature 2014, 505, 483. [Google Scholar] [CrossRef] [Green Version]
  22. Song, W.; Pijanowski, B.C. The effects of China’s cultivated land balance program on potential land productivity at a national scale. Appl. Geogr. 2014, 46, 158–170. [Google Scholar] [CrossRef]
  23. Lieskovsky, J.; Bezak, P.; Spulerova, J.; Lieskovsky, T.; Koleda, P.; Dobrovodska, M.; Burgi, M.; Gimmi, U. The abandonment of traditional agricultural landscape in Slovakia—Analysis of extent and driving forces. J. Rural. Stud. 2015, 37, 75–84. [Google Scholar] [CrossRef]
  24. Muller, D.; Munroe, D.K. Changing Rural Landscapes in Albania: Cropland Abandonment and Forest Clearing in the Postsocialist Transition. Ann. Assoc. Am. Geogr. 2008, 98, 855–876. [Google Scholar] [CrossRef]
  25. Novara, A.; Gristina, L.; Sala, G.; Galati, A.; Crescimanno, M.; Cerda, A.; Badalamenti, E.; La Mantia, T. Agricultural land abandonment in Mediterranean environment provides ecosystem services via soil carbon sequestration. Sci. Total. Environ. 2017, 576, 420–429. [Google Scholar] [CrossRef] [Green Version]
  26. Paudel, B.; Wu, X.; Zhang, Y.; Rai, R.; Liu, L.; Zhang, B.; Khanal, N.R.; Koirala, H.L.; Nepal, P. Farmland abandonment and its determinants in the different ecological villages of the Koshi river basin, central Himalayas: Synergy of high-resolution remote sensing and social surveys. Environ. Res. 2020, 188, 109711. [Google Scholar] [CrossRef] [PubMed]
  27. Xu, D.D.; Deng, X.; Guo, S.L.; Liu, S.Q. Labor migration and farmland abandonment in rural China: Empirical results and policy implications. J. Environ. Manag. 2019, 232, 738–750. [Google Scholar] [CrossRef]
  28. Estel, S.; Kuemmerle, T.; Alcantara, C.; Levers, C.; Prishchepov, A.; Hostert, P. Mapping farmland abandonment and recultivation across Europe using MODIS NDVI time series. Remote Sens. Environ. 2015, 163, 312–325. [Google Scholar] [CrossRef]
  29. Hatna, E.; Bakker, M.M. Abandonment and Expansion of Arable Land in Europe. Ecosystems 2011, 14, 720–731. [Google Scholar] [CrossRef] [Green Version]
  30. Meyfroidt, P.; Schierhorn, F.; Prishchepov, A.V.; Muller, D.; Kuemmerle, T. Drivers, Constraints and Trade-Offs Associated with Recultivating Abandoned Cropland in Russia, Ukraine and Kazakhstan. Spat. Econ. 2016, 2, 55–103. [Google Scholar] [CrossRef] [Green Version]
  31. Ramankutty, N.; Heller, E.; Rhemtulla, J. Prevailing Myths About Agricultural Abandonment and Forest Regrowth in the United States. Ann. Assoc. Am. Geogr. 2010, 100, 502–512. [Google Scholar] [CrossRef]
  32. Smaliychuk, A.; Muller, D.; Prishchepov, A.V.; Levers, C.; Kruhlov, I.; Kuemmerle, T. Recultivation of abandoned agricultural lands in Ukraine: Patterns and drivers. Glob. Environ. Chang. 2016, 38, 70–81. [Google Scholar] [CrossRef]
  33. Prishchepov, A.V.; Ponkina, E.V.; Sun, Z.; Bavorova, M.; Yekimovskaja, O.A. Revealing the intentions of farmers to recultivate abandoned farmland: A case study of the Buryat Republic in Russia. Land Use Policy 2021, 107, 105513. [Google Scholar] [CrossRef]
  34. Pazur, R.; Lieskovsky, J.; Burgi, M.; Muller, D.; Lieskovsky, T.; Zhang, Z.; Prischchepov, A.V. Abandonment and Recultivation of Agricultural Lands in Slovakia—Patterns and Determinants from the Past to the Future. Land 2020, 9, 316. [Google Scholar] [CrossRef]
  35. Ministry of Natural Resources, P. Main Data Bulletin of the Third National Land Survey. Available online: http://www.mnr.gov.cn/dt/ywbb/202108/t20210826_2678340.html (accessed on 28 August 2021).
  36. Zhang, Y.; Li, X.; Song, W. Determinants of cropland abandonment at the parcel, household and village levels in mountain areas of China: A multi-level analysis. Land Use Policy 2014, 41, 186–192. [Google Scholar] [CrossRef]
  37. Li, S.F.; Li, X.B.; Sun, L.X.; Cao, G.Y.; Fischer, G.; Tramberend, S. An estimation of the extent of cropland abandonment in mountainous regions of China. Land Degrad. Dev. 2018, 29, 1327–1342. [Google Scholar] [CrossRef]
  38. Zhang, X.Z.; Zhao, C.S.; Dong, J.W.; Ge, Q.S. Spatio-temporal pattern of cropland abandonment in China from 1992 to 2017: A Meta-analysis. Acta Geogr. Sin. 2019, 74, 10. [Google Scholar] [CrossRef]
  39. Wang, J.Y.; Xin, L.J.; Wang, Y.H. Economic growth, government policies, and forest transition in China. Reg. Environ. Chang. 2019, 19, 1023–1033. [Google Scholar] [CrossRef]
  40. Wang, Y.H.; Li, X.B.; Xin, L.J.; Tan, M.H. Farmland marginalization and its drivers in mountainous areas of China. Sci. Total. Environ. 2020, 719, 135132. [Google Scholar] [CrossRef] [PubMed]
  41. Kraemer, R.; Prishchepov, A.V.; Muller, D.; Kuemmerle, T.; Radeloff, V.C.; Dara, A.; Terekhov, A.; Fruhauf, M. Long-term agricultural land-cover change and potential for cropland expansion in the former Virgin Lands area of Kazakhstan. Environ. Res. Lett. 2015, 10, 054012. [Google Scholar] [CrossRef]
  42. Kobayashi, Y.; Higa, M.; Higashiyama, K.; Nakamura, F. Drivers of land-use changes in societies with decreasing populations: A comparison of the factors affecting farmland abandonment in a food production area in Japan. PLoS ONE 2020, 15, e0235846. [Google Scholar] [CrossRef] [PubMed]
  43. Thünen, J.H.V. Der isolierte Staat in Beziehung auf Landwirtschaft und Nationalökonomie (German Edition); Nabu Press: Berlin, Germany, 2014; p. 696. [Google Scholar]
  44. Kyer, B.L. A note on Ricardo’s differential rent theory. Atl. Econ. J. 1991, 19, 55. [Google Scholar] [CrossRef]
  45. Liang, X.; Li, Y.; Zhou, Y. Study on the abandonment of sloping farmland in Fengjie County, Three Gorges Reservoir Area, a mountainous area in China. Land Use Policy 2020, 97, 104760. [Google Scholar] [CrossRef]
  46. Kerckhof, A.; Spalevic, V.; Van Eetvelde, V.; Nyssen, J. Factors of land abandonment in mountainous Mediterranean areas: The case of Montenegrin settlements. Springerplus 2016, 5, 485. [Google Scholar] [CrossRef] [PubMed] [Green Version]
  47. Shi, T.C.; Li, X.B.; Xin, L.J.; Xu, X.H. Analysis of Farmland Abandonment at Parcel Level: A Case Study in the Mountainous Area of China. Sustainability 2016, 8, 988. [Google Scholar] [CrossRef] [Green Version]
  48. Shi, T.; Li, X.; Xin, L.; Xu, X. The spatial distribution of farmland abandonment and its influential factors at the township level: A case study in the mountainous area of China. Land Use Policy 2018, 70, 510–520. [Google Scholar] [CrossRef]
  49. Qiu, B.W.; Yang, X.; Tang, Z.H.; Chen, C.C.; Li, H.W.; Berry, J. Urban expansion or poor productivity: Explaining regional differences in cropland abandonment in China during the early 21st century. Land Degrad. Dev. 2020, 31, 2540–2551. [Google Scholar] [CrossRef]
  50. Baumann, M.; Kuemmerle, T.; Elbakidze, M.; Ozdogan, M.; Radeloff, V.C.; Keuler, N.S.; Prishchepov, A.V.; Kruhlov, I.; Hostert, P. Patterns and drivers of post-socialist farmland abandonment in Western Ukraine. Land Use Policy 2011, 28, 552–562. [Google Scholar] [CrossRef]
  51. Zhang, X.; Yang, J.; Wang, S. China has reached the Lewis turning point. China Econ. Rev. 2011, 22, 542–554. [Google Scholar] [CrossRef] [Green Version]
  52. Terres, J.-M.; Scacchiafichi, L.N.; Wania, A.; Ambar, M.; Anguiano, E.; Buckwell, A.; Coppola, A.; Gocht, A.; Kallstrom, H.N.; Pointereau, P.; et al. Farmland abandonment in Europe: Identification of drivers and indicators, and development of a composite indicator of risk. Land Use Policy 2015, 49, 20–34. [Google Scholar] [CrossRef]
  53. Zaragozi, B.; Rabasa, A.; Rodriguez-Sala, J.J.; Navarro, J.T.; Belda, A.; Ramon, A. Modelling farmland abandonment: A study combining GIS and data mining techniques. Agric. Ecosyst. Environ. 2012, 155, 124–132. [Google Scholar] [CrossRef]
  54. Ito, J.; Nishikori, M.; Toyoshi, M.; Feuer, H.N. The contribution of land exchange institutions and markets in countering farmland abandonment in Japan. Land Use Policy 2016, 57, 582–593. [Google Scholar] [CrossRef]
  55. Chen, X.Y.; Zheng, G.Q. Research progress on arable land abandonment in China and abroad. China Popul. Resour. Environ. 2018, 28, 37–41. [Google Scholar] [CrossRef]
  56. Shao, J.A.; Zhang, S.; Li, X. Effectiveness of farmland transfer in alleviating farmland abandonment in mountain regions. J. Geogr. Sci. 2016, 26, 203–218. [Google Scholar] [CrossRef]
  57. Xu, D.; Guo, S.; Xie, F.; Liu, S.; Cao, S. The impact of rural laborer migration and household structure on household land use arrangements in mountainous areas of Sichuan Province, China. Habitat Int. 2017, 70, 72–80. [Google Scholar] [CrossRef]
  58. Yu, Z.; Liu, L.; Zhang, H.; Liang, J. Exploring the Factors Driving Seasonal Farmland Abandonment: A Case Study at the Regional Level in Hunan Province, Central China. Sustainability 2017, 9, 187. [Google Scholar] [CrossRef] [Green Version]
  59. Zhang, L.; Tan, S.; Liu, C.; Wang, S. Influence of labor transfer on farmland sustainable development: A regional comparison of plain and hilly areas. Qual. Quant. 2018, 52, 431–443. [Google Scholar] [CrossRef]
  60. Vu, T.-T.; Shen, Y. Land-Use and Land-Cover Changes in Dong Trieu District, Vietnam, during Past Two Decades and Their Driving Forces. Land 2021, 10, 798. [Google Scholar] [CrossRef]
  61. Han, Z.; Song, W. Spatiotemporal variations in cropland abandonment in the Guizhou-Guangxi karst mountain area, China. J. Clean. Prod. 2019, 238, 238. [Google Scholar] [CrossRef]
  62. Xie, H.; Wang, P.; Yao, G. Exploring the Dynamic Mechanisms of Farmland Abandonment Based on a Spatially Explicit Economic Model for Environmental Sustainability: A Case Study in Jiangxi Province, China. Sustainability 2014, 6, 1260–1282. [Google Scholar] [CrossRef] [Green Version]
  63. Wang, Y.; Peng, P.; Li, Q.; Chen, Z.; Tang, W. Spatial Heterogeneity of Farmland Abandonment in the Sichuan Province, China. Sustainability 2020, 12, 3356. [Google Scholar] [CrossRef] [Green Version]
  64. Institute, C.I.D.R. China Household Income Projects, CHIP2013. Available online: http://www.ciidbnu.org/chip/chips.asp?year=2013 (accessed on 2 October 2020).
  65. Tao, Z.; Guanghui, J.; Guangyong, L.; Dingyang, Z.; Yanbo, Q. Neglected idle rural residential land (IRRL) in metropolitan suburbs: Spatial differentiation and influencing factors. J. Rural. Stud. 2020, 78, 163–175. [Google Scholar] [CrossRef]
  66. Mackenbach, J.P. Roaming through methodology. XXVI. The ecological fallacy and its less well-known counterpart, the atomistic fallacy. Ned. Tijdschr. Voor Geneeskd. 2000, 144, 2097–2100. [Google Scholar]
  67. Seok, J.-H.; Park, W. Merit Pay and Motivation—A Multilevel Analysis of Organizational Moderators. Rev. Bus. Hist. 2012, 27, 177–204. [Google Scholar] [CrossRef]
  68. Stephen, W.; Raudenbush, A.S.B. Multilevel Linear Models: Applied to Data Analysis Methods; Social Sciences Academic Press: Beijing, China, 2007. [Google Scholar]
  69. Hox, J. Multilevel Analysis: Techniques and Applications; Lawrence Erlbaum Associated Inc.: Mahwah, NJ, USA, 2002; p. 342. [Google Scholar]
  70. Cohen, J. Statistical Power Analysis for the Behavioral Sciences, 2nd ed; Lawrence Erlbaum Associates Inc.: Mahwah, NJ, USA, 1988; p. 559. [Google Scholar]
  71. Wen, F.X.; Qiu, Z.H. Methodology of Multi-Level Models: Key Problems and Solutions of Hierarchical Linear Models; Economic Management Publishing House: Beijing, China, 2015; p. 221. [Google Scholar]
  72. Calvin, J.A. Hierarchical Linear Models: Applications and Data Analysis Methods. In Technometrics; Taylor Francis Group: Abingdon, UK, 1994. [Google Scholar]
  73. Raudenbush, S.W.; Bryk, A.S. Hierarchical Linear Models: Applications and Data Analysis Methods, 2nd ed.; Sage Publications: Thousand Oaks, CA, USA, 2002. [Google Scholar]
  74. Zhang, L.L.L.G.B. Applied Multilevel Data Analysis; Educational Science Publishing House: NanJing, China, 2003; p. 198. [Google Scholar]
  75. Qianru, C.; Hualin, X. Research Progress and Discoveries Related to Cultivated Land Abandonment. J. Resour. Ecol. 2021, 12, 165–174. [Google Scholar] [CrossRef]
  76. Song, W.; Zhang, Y. Farmland Abandonment Research Progress: Influencing Factors and Simulation Model. J. Resour. Ecol. 2019, 10, 345–352. [Google Scholar]
  77. He, Y.; Xie, H.; Peng, C. Analyzing the behavioural mechanism of farmland abandonment in the hilly mountainous areas in China from the perspective of farming household diversity. Land Use Policy 2020, 99, 104826. [Google Scholar] [CrossRef]
  78. Lee, J.; Oh, Y.G.; Yoo, S.H.; Suh, K. Vulnerability assessment of rural aging community for abandoned farmlands in South Korea. Land Use Policy 2021, 108, 105544. [Google Scholar] [CrossRef]
  79. Yamashita, R.; Hoshino, S. Development of an agent-based model for estimation of agricultural land preservation in rural Japan. Agric. Syst. 2018, 164, 264–276. [Google Scholar] [CrossRef]
  80. Lasanta, T.; Arnáez, J.; Pascual, N.; Ruiz-Flaño, P.; Errea, M.P.; Lana-Renault, N. Space–time process and drivers of land abandonment in Europe. Catena 2017, 149, 810–823. [Google Scholar] [CrossRef]
  81. López-Iglesias, E.; Sineiro-García, F.; Lorenzana-Fernández, R. Processes of Farmland Abandonment: Land Use Change and Structural Adjustment in Galicia (Spain). In Agriculture in Mediterranean Europe: Between Old and New Paradigms; Emerald Group Publishing Ltd.: Bingley, UK, 2013. [Google Scholar]
  82. Li, Z.; Yan, J.; Hua, X.; Xin, L.; Li, X. Factors influencing the cultivated land abandonment of households of different types: A case study of 12 typical villages in Chongqing Municipality. Geogr. Res. 2014, 33, 721–734. [Google Scholar]
  83. National Bureau of Statistics of China. Statistical Bulletin of the People’s Republic of China on National Economic and Social Development. 2020. Available online: http://www.gov.cn/xinwen/2021-02/28/content_5589283.htm (accessed on 15 March 2021).
  84. Akaike, H.T. A new look at the statistical model identification. IEEE Trans. Autom. Control. 1974, 19, 716–723. [Google Scholar] [CrossRef]
  85. Tian, Y.; Li, X.; Xin, L. Impacts of the rise of labor opportunity cost on agricultural land use changes: A case study of Ningxia Hui Autonomous Region. J. Nat. Resour. 2009, 24, 369–377. [Google Scholar]
  86. Li, S.; Li, X. The mechanism of farmland marginalization in Chinese mountainous areas: Evidence from cost and return changes. J. Geogr. Sci. 2019, 29, 531–548. [Google Scholar] [CrossRef] [Green Version]
  87. Tan, Y.; Chen, H.; Xiao, W.; Meng, F.; He, T. Influence of farmland marginalization in mountainous and hilly areas on land use changes at the county level. Sci. Total. Environ. 2021, 794, 149576. [Google Scholar] [CrossRef]
  88. Cao, Z.H.; Hao, J.M.; Liang, L.T. Economic Analysis and strategy of farmland abandonment behavior of farmers. J. Ageotechnical Econ. 2008, 03, 43–46. [Google Scholar]
  89. Guo, B.B.; Fang, Y.L.; Zhou, Y.K. Influencing factors and spatial differentiation of cultivated land abandonment at the household scale. Resour. Sci. 2020, 42, 696–709. [Google Scholar] [CrossRef]
  90. National Bureau of Statistics of China. National Migrant Workers Monitoring Survey Report. 2013. Available online: http://www.stats.gov.cn/tjsj/zxfb/201405/t20140512_551585.html (accessed on 20 February 2021).
  91. van Berkel, D.B.; Verburg, P.H. Sensitising rural policy: Assessing spatial variation in rural development options for Europe. Land Use Policy 2011, 28, 447–459. [Google Scholar] [CrossRef]
  92. Renwick, A.; Jansson, T.; Verburg, P.H.; Revoredo-Giha, C.; Britz, W.; Gocht, A.; McCracken, D. Policy reform and agricultural land abandonment in the EU. Land Use Policy 2013, 30, 446–457. [Google Scholar] [CrossRef]
  93. Pointereau, P.; Coulon, F.; Girard, P.; Lambotte, M.; Rio, A.D. Analysis of Farmland Abandonment and the Extent and Location of Agricultural Areas that Are Actually Abandoned or Are in Risk to be Abandoned; Office for Official Publications of the European Communities: Luxembourg, 2008; p. 204. [Google Scholar]
  94. Office, R. Data Assembly of National Rural Permanent Observation Sites Survey (2000–2009); China Agriculture Press: Beijing, China, 2010; p. 246. [Google Scholar]
  95. Dong, X.Y. Two-tier land tenure system and sustained economic growth in post-1978 rural China. World Dev. 1996, 24, 915–928. [Google Scholar] [CrossRef]
  96. National Bureau of Statistics of China. Report on monitoring and Investigation of Rural Migrant Workers in 2020. Available online: http://www.gov.cn/xinwen/2021-04/30/content_5604232.htm (accessed on 16 June 2021).
  97. The Xinhua News Agency. Opinions of the CPC Central Committee and The State Council on Comprehensively Promoting Rural Revitalization and Accelerating Agricultural and Rural Modernization. Available online: http://www.gov.cn/zhengce/2021-02/21/content_5588098.htm (accessed on 3 March 2021).
  98. Bai, X.; Yan, H.; Pan, L.; Huang, H.Q. Multi-Agent Modeling and Simulation of Farmland Use Change in a Farming–Pastoral Zone: A Case Study of Qianjingou Town in Inner Mongolia, China. Sustainability 2015, 7, 14802–14833. [Google Scholar] [CrossRef] [Green Version]
  99. Ding, G.P.; Liu, C.W.; Huang, L.M. A theoretical analysis and empirical research of marginalization of agricultural land in hilly-mountainous area under farmer-benetitmg policy:A case study of Tongcheng County in Hubei Province. J. Geogr. Res. 2009, 028, 109–117. [Google Scholar]
Figure 1. Map of the study area and sample distribution.
Land 11 00008 g001
Figure 2. Cropland abandonment levels and spatial distribution map of degrees of abandonment. (a) The picture shows the proportion of farmer households in the sampled provinces who made the decision to abandon their cropland. (b) The picture shows the proportion of farmer households in the sampled districts/counties who made the decision to abandon their cropland. (c) The picture describes the degree of cropland abandonment at the provincial level based on sampling data. (d) The picture describes the degree of cropland abandonment at the district/county level based on sampling data.
Land 11 00008 g002
Table 1. Descriptive statistics of multi-level model variables.
Variable CategoryVariable NameVariable DefinitionMeanStandard DeviationMinimum ValueMaximum Value
Dependent variable
Degree of abandoned croplandProportion of the abandoned household cropland in the total household cropland area0.080.220.001.00
Independent variable
Level 1—The Farmer Level (n = 8071)
Labor characteristicsWorkforce per hectareNumber of family agricultural labor/Total area of household cropland (excluding already abandoned cropland) (person/hectare)7.8012.900.00300.00
Proportion of the male workforceTotal Male Agricultural Labor/Family Agricultural Labor Force (%)0.430.300.001.00
Average age of labor forceTotal age/number of agricultural labor force (year)42.3521.000.0087.00
Labor force square root average ageSquare root of total age of agricultural labor force/square root of number of agricultural labor force (square root year)5.922.690.009.33
Agricultural investmentValue of agricultural operational fixed assets (in log)logarithmic (log element) of current estimated net value of agricultural operating fixed assets4.644210.0013.59
Farmer-specialized cooperative economic organizations 1 means “Yes”; 0 means “No” (such as Farmers Professional Association, etc.)0.030.170.001.00
Cropland transferTransfer area of croplandTotal area of peasant household cropland transferred out (hectare)0.030.090.002.80
Subcontract price of cultivated cropland (in log)Ln (existing arable cropland subcontract family per-hectare subcontract price) (log yuan)10.8030.600.00143.25
Quality of lifePer capita disposable income (in log)Total Ln (family disposable income/family population) (log yuan)9.110.714.7613.19
Level 2—The District/County Level (n = 193)
Household part-time employment and population mobilityProportion of part-time employeesProportion of the number of part-time employees at the district/county level occupying the total number of the main wage work (%)0.260.160.001.00
Proportion of the number of part-time employees outside the district/countyProportion of the number of part-time employees outside the district/county and the total number of major wage employees in the district/county (%) 0.060.100.001.00
Cropland circulationCropland transfer market indicatorsTotal area of cropland transfer/total area of cropland0.240.260.001.00
Control variable
Natural conditionsTopographyPlateau = 1; Mountain =2; Basin = 3; Hills = 4; Plain = 5 (matching according to national standard administrative division code)3.551.331.005.00
TemperatureAverage temperature at district/county level from 2011 to 2013 (℃)14.923.904.9323.21
PrecipitationAverage precipitation at district/county level from 2011 to 2013 (mm)956.82390.7594.852069.61
Family decision-making impactHead of the household of formal schooling1 = Not attended school (including literacy classes and other informal education); 2 = Primary School; 3 = Junior High School; 4 = Senior High School; 5 = Vocational High School/Technical School; 6 = Technical School; 7 = Junior College; 8 = University Undergraduate Degree; 9 = Graduate Student2.690.911.009.00
Health statusWhether there are disabled people in the family who affect normal work, study and life. 1 = Yes; 0 = No0.130.330.001.00
Force majeureCropland requisition1 = Yes; 0 = No0.110.320.001.00
Note: “Yuan” is the unit of measurement of the Chinese currency, RMB; the average exchange rate of the RMB was 6.8974 yuan per USD in 2020 [83].
Table 2. Multi-level model of degrees of cropland abandonment.
LevelVariableModel 1Model 2Model 3
Fixed effect
Level 1—The Farmer Level (n = 8071)
Labor characteristicsIntersection0.092401 ***0.092295 ***0.076400 ***
(0.010121)(0.026182)(0.027243)
Workforce per hectare −0.020894 **−0.020533 **
(0.008131)(0.008151)
Proportion of the male workforce −0.049368 ***−0.049202 ***
(0.009822)(0.009808)
Labor force square root average age −0.027912 ***−0.027912 ***
(0.002820)(0.002820)
Agricultural investmentValue of agricultural operational fixed assets (in log) −0.009514 ***−0.009420 ***
(0.001388)(0.001370)
Farmer-specialized cooperative economic organizations 0.0032530.003941
(0.017318)(0.017204)
Cropland transferTransfer area of cropland −0.006907 ***−0.006940 ***
(0.002182)(0.002172)
Subcontract price of cultivated cropland (in log) −0.010079 ***−0.009588 ***
(0.002061)(0.002043)
Quality of lifePer capita disposable income (in log) 0.017576 ***0.017631 ***
(0.004288)(0.004290)
Level 2—The District/County Level (n = 193)
Part-time job and population mobilityProportion of part-time employees −0.144998 ***
(0.051656)
Proportion of the number of part-time employees outside the district/county 0.230789 *
(0.138532)
Cropland circulationCropland transfer market indicators −0.043965 **
(0.019693)
Random effects
σ 2 0.038200.032440.03243
τ 00 (Var)0.017590.017880.01692
AIC criterion−24,370.33−25,968.98−26,176.08
Note: * indicates p < 0.1, ** indicates p < 0.05, and *** indicates p < 0.001. Table is not reported on the control variable.
Table 3. Evolution process of cropland abandonment for farmers.
Phase 1Phase 2Phase 3Phase 4
Production activitiesMainly agriculture Part-time job (high agricultural proportion)Part-time job (high non-agricultural proportion)Mainly non-agriculture
InputAgriculture: labor input (+)
other inputs (+)
Non-agricultural: no
Agriculture: labor input (−)
technology input (+)
Non-Agriculture: labor input (+)
Agriculture: labor input (−), even lower than the minimum input
Non-agriculture: labor input (+)
Agriculture: labor input (−), until 0
Non-agricultural: labor input (+) until 100%
OutputEconomy: agricultural income (+)
Society: social security value of cropland (+)
Economy: mainly agricultural income (−) non-agricultural income (+)
Society: social security value of cropland (−)
Economy: mainly non-agricultural income (+) agricultural income (−)
Society: social security value of cropland (−)
Economy: non-agricultural income mainly (+)
Society: social security value of cropland (−), take the initiative to give up, until 0
Farmer’s decisionsThere is no abandonment of croplandThe cropland is recessively abandonedThe cropland is predominantly abandoned—low degree of abandonmentHigh-degree of abandonment of cropland—completely abandoned or completely transferred or withdrawn
Note: The “(+)” indicates a relative upward trend and “(−)” indicates a relative downward trend.
Table 4. Policy suggestions on alleviating abandoned cropland by type.
Policy AdviceThe District/County LevelThe Farmer Level
Natural Condition
The comprehensive quality of cropland is poor and it is mostly located in areas with harsh natural conditions.Orderly guidance and supervision.
Natural exit is mainly dominant.
Improve social security.
Class I: Generally poor families or high-age families in remote mountainous areas, we should aim to improve livelihoods among these families.
Class II, III and IV: Guide farmers who have the ability to re-allocate production input factors to actively return to farmland, choose diversified livelihoods, and improve social security.
The comprehensive quality of cropland is medium and it is mostly located in hilly and mountainous areas.Improve agricultural production conditions: improve infrastructure, carry out land consolidation, conduct pilot projects to strengthen the quality of cropland projects.
Improve agricultural income: implement efficient planting and breeding, Internet + mode, and extend the industrial chain.
Build a market mechanism: clarify the cropland property rights, improve the cropland transfer market.
Class I and II: Keep up with the “rural revitalization” strategy, attract talent and capital return, protect the necessary labor force, reasonably develop small areas of high-income crops, and increase agricultural income.
Category III and IV: Encourage talented individuals to return to their hometowns to innovate and start businesses, implement support policies, and develop ecological and green agricultural industries.
We will guide farmers who lack enthusiasm in agricultural management to transfer their cropland into the market and standardize its transfer procedures.
The comprehensive quality of cropland is excellent and it is mostly located in the plain areas.Improve the level of mechanization, strengthen technical input, and increase output.
Stabilize the prices of agricultural products and continue to implement policies based on agricultural subsidies and agricultural insurance.
Standardize the market for cropland transfer and operate cropland at an appropriate scale.
Class I and II: Encourage and support large growers, drive individual farmers, and establish cooperative organizations.
Class III and IV: Guide the timely transfer of cropland, especially those with strong transfer willingness and long transfer cycles, inhibit seasonal and recessive abandonment, and promote the scale and mechanization of agricultural production.
Note: According to the Class of farmers’ abandonment behavior in Section 4.2, farmers are divided into 4 categories. Class I farmers: farmers are mainly agricultural producers; Class II farmers: part-time farmers, agricultural production occupies a high proportion of total labor; Class III farmers: part-time farmers, non-agricultural production accounts for a high proportion of total labor; Class IV farmers: farmers are mainly involved in non-agricultural production.
Publisher’s Note: MDPI stays neutral with regard to jurisdictional claims in published maps and institutional affiliations.

