

Spatiotemporal Evolution and Cause Analysis of Urban Housing Investment Resilience: An Empirical Study of 35 Large and Medium-Sized Cities in China

Abstract
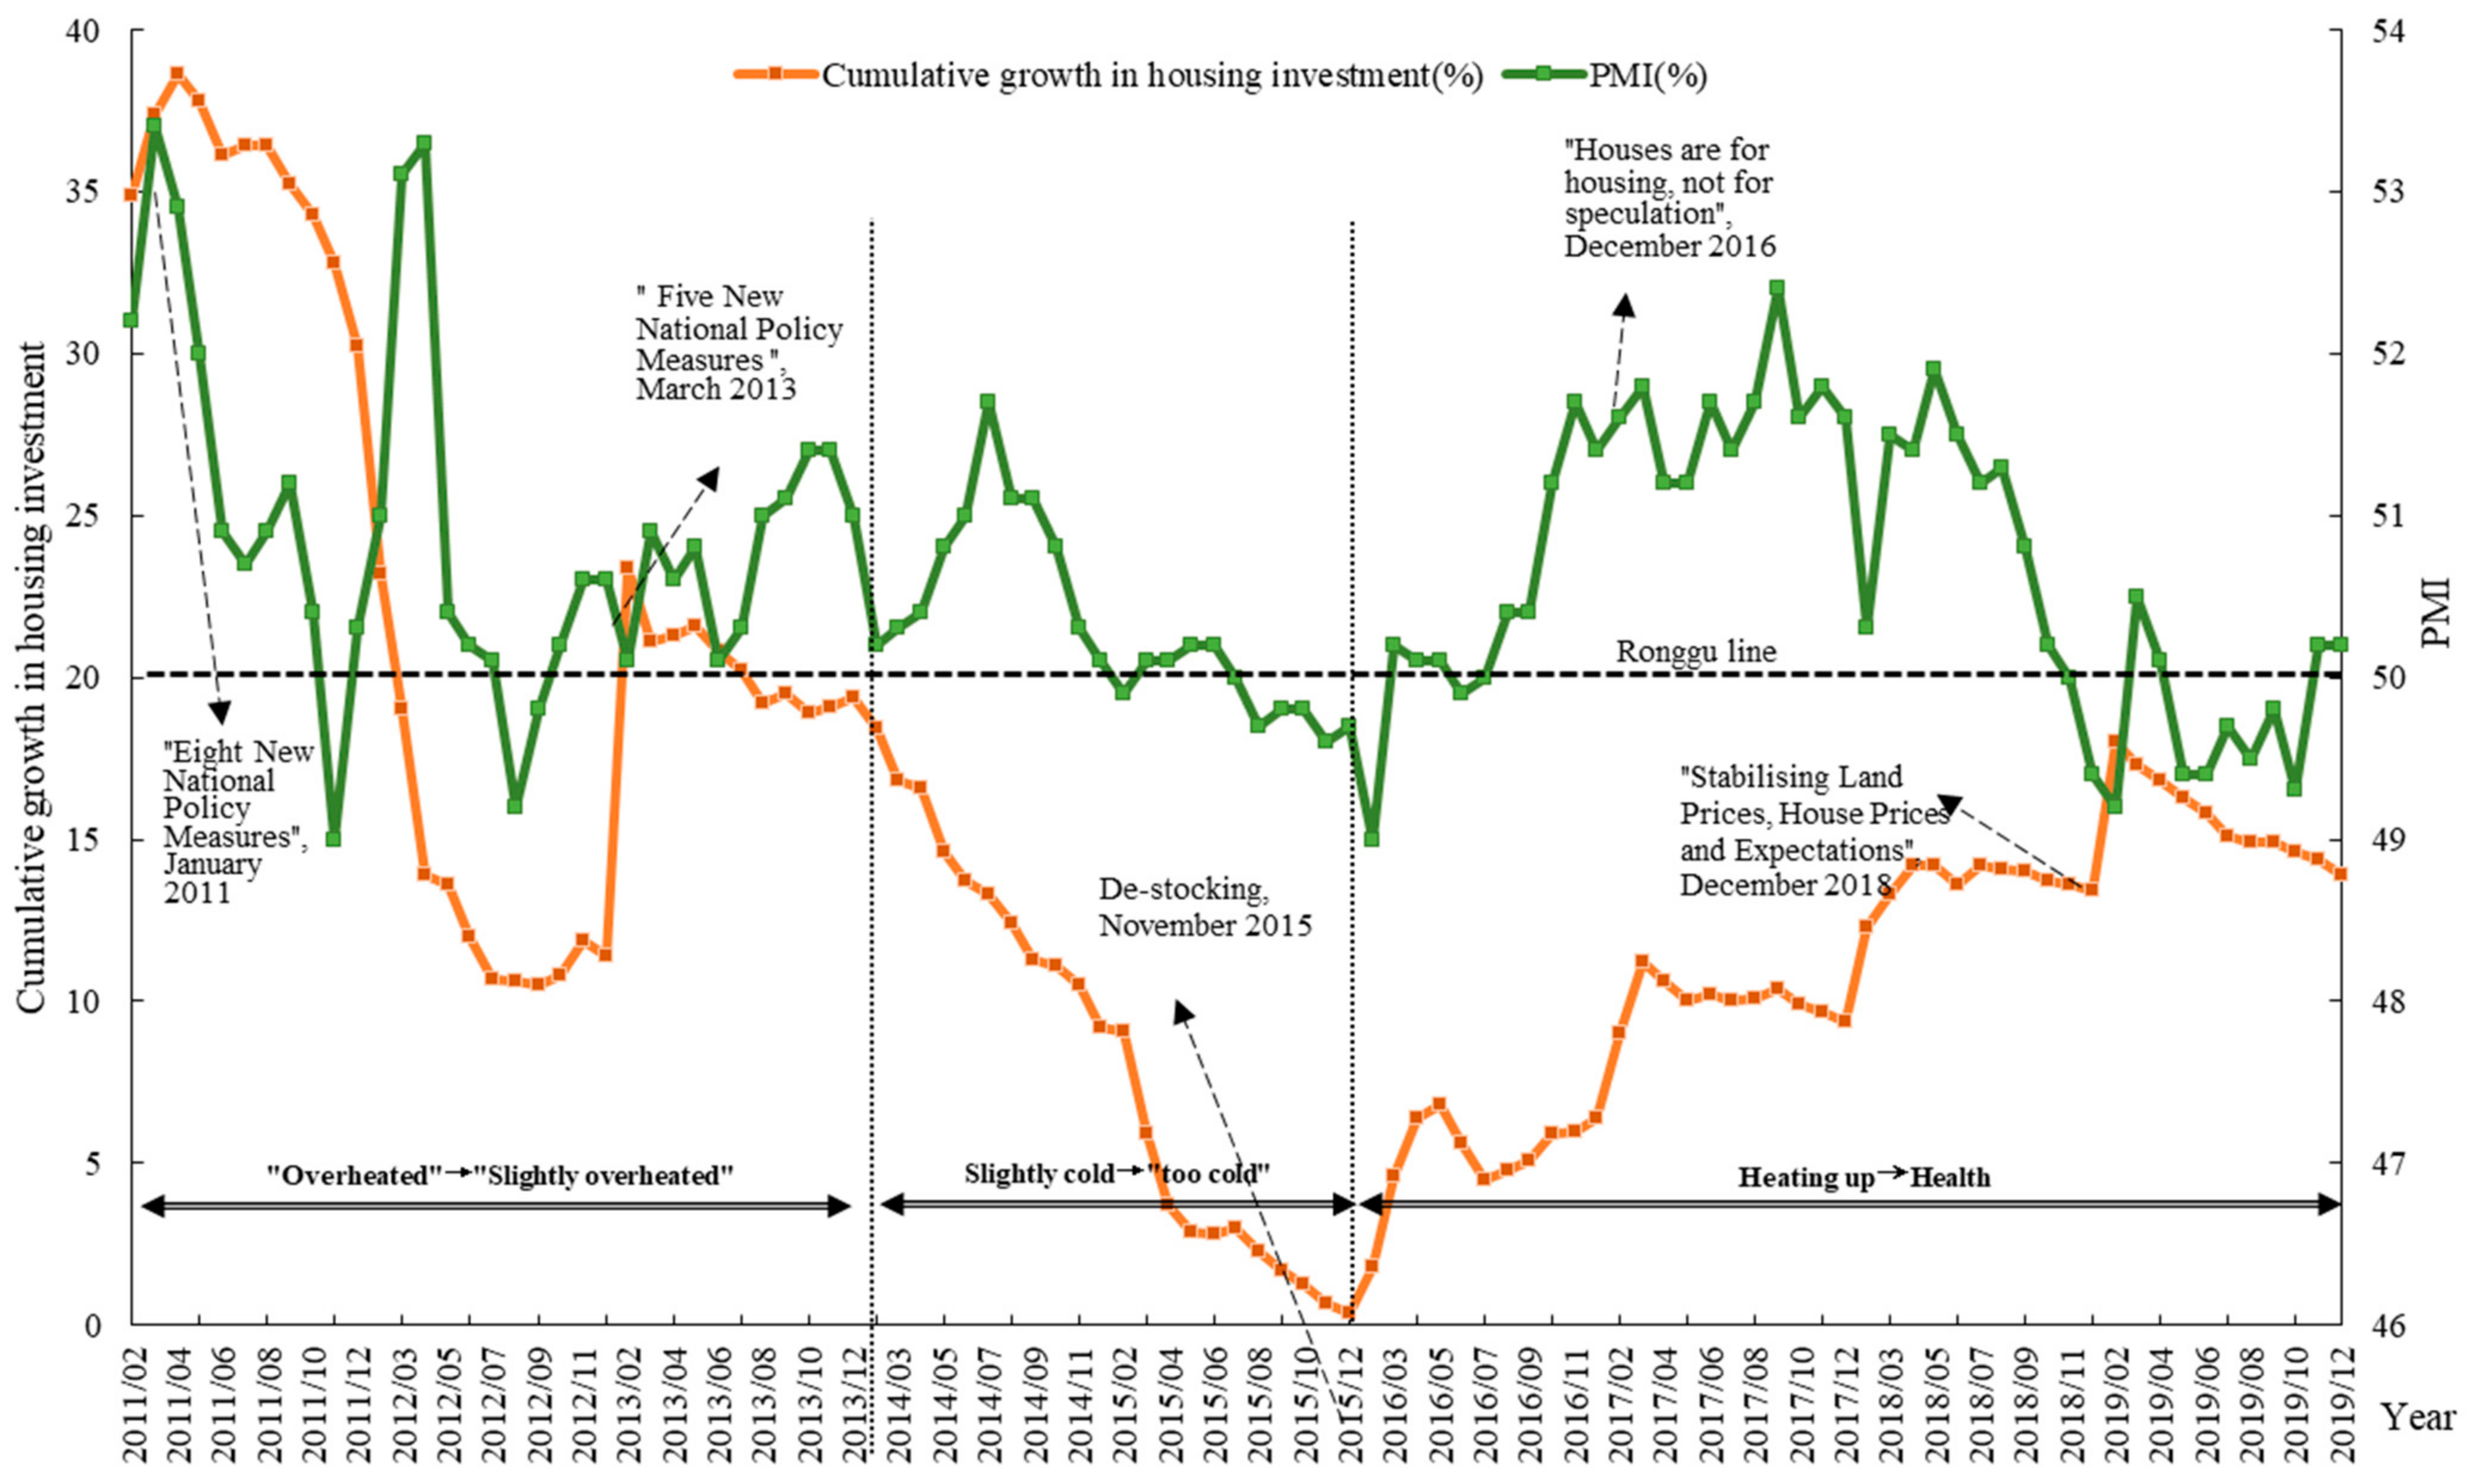
:1. Introduction
2. Research Methodology and Data Processing
2.1. Research Methodology
2.1.1. Housing Investment Resilience Measure
2.1.2. Qualitative Comparative Analysis Methods
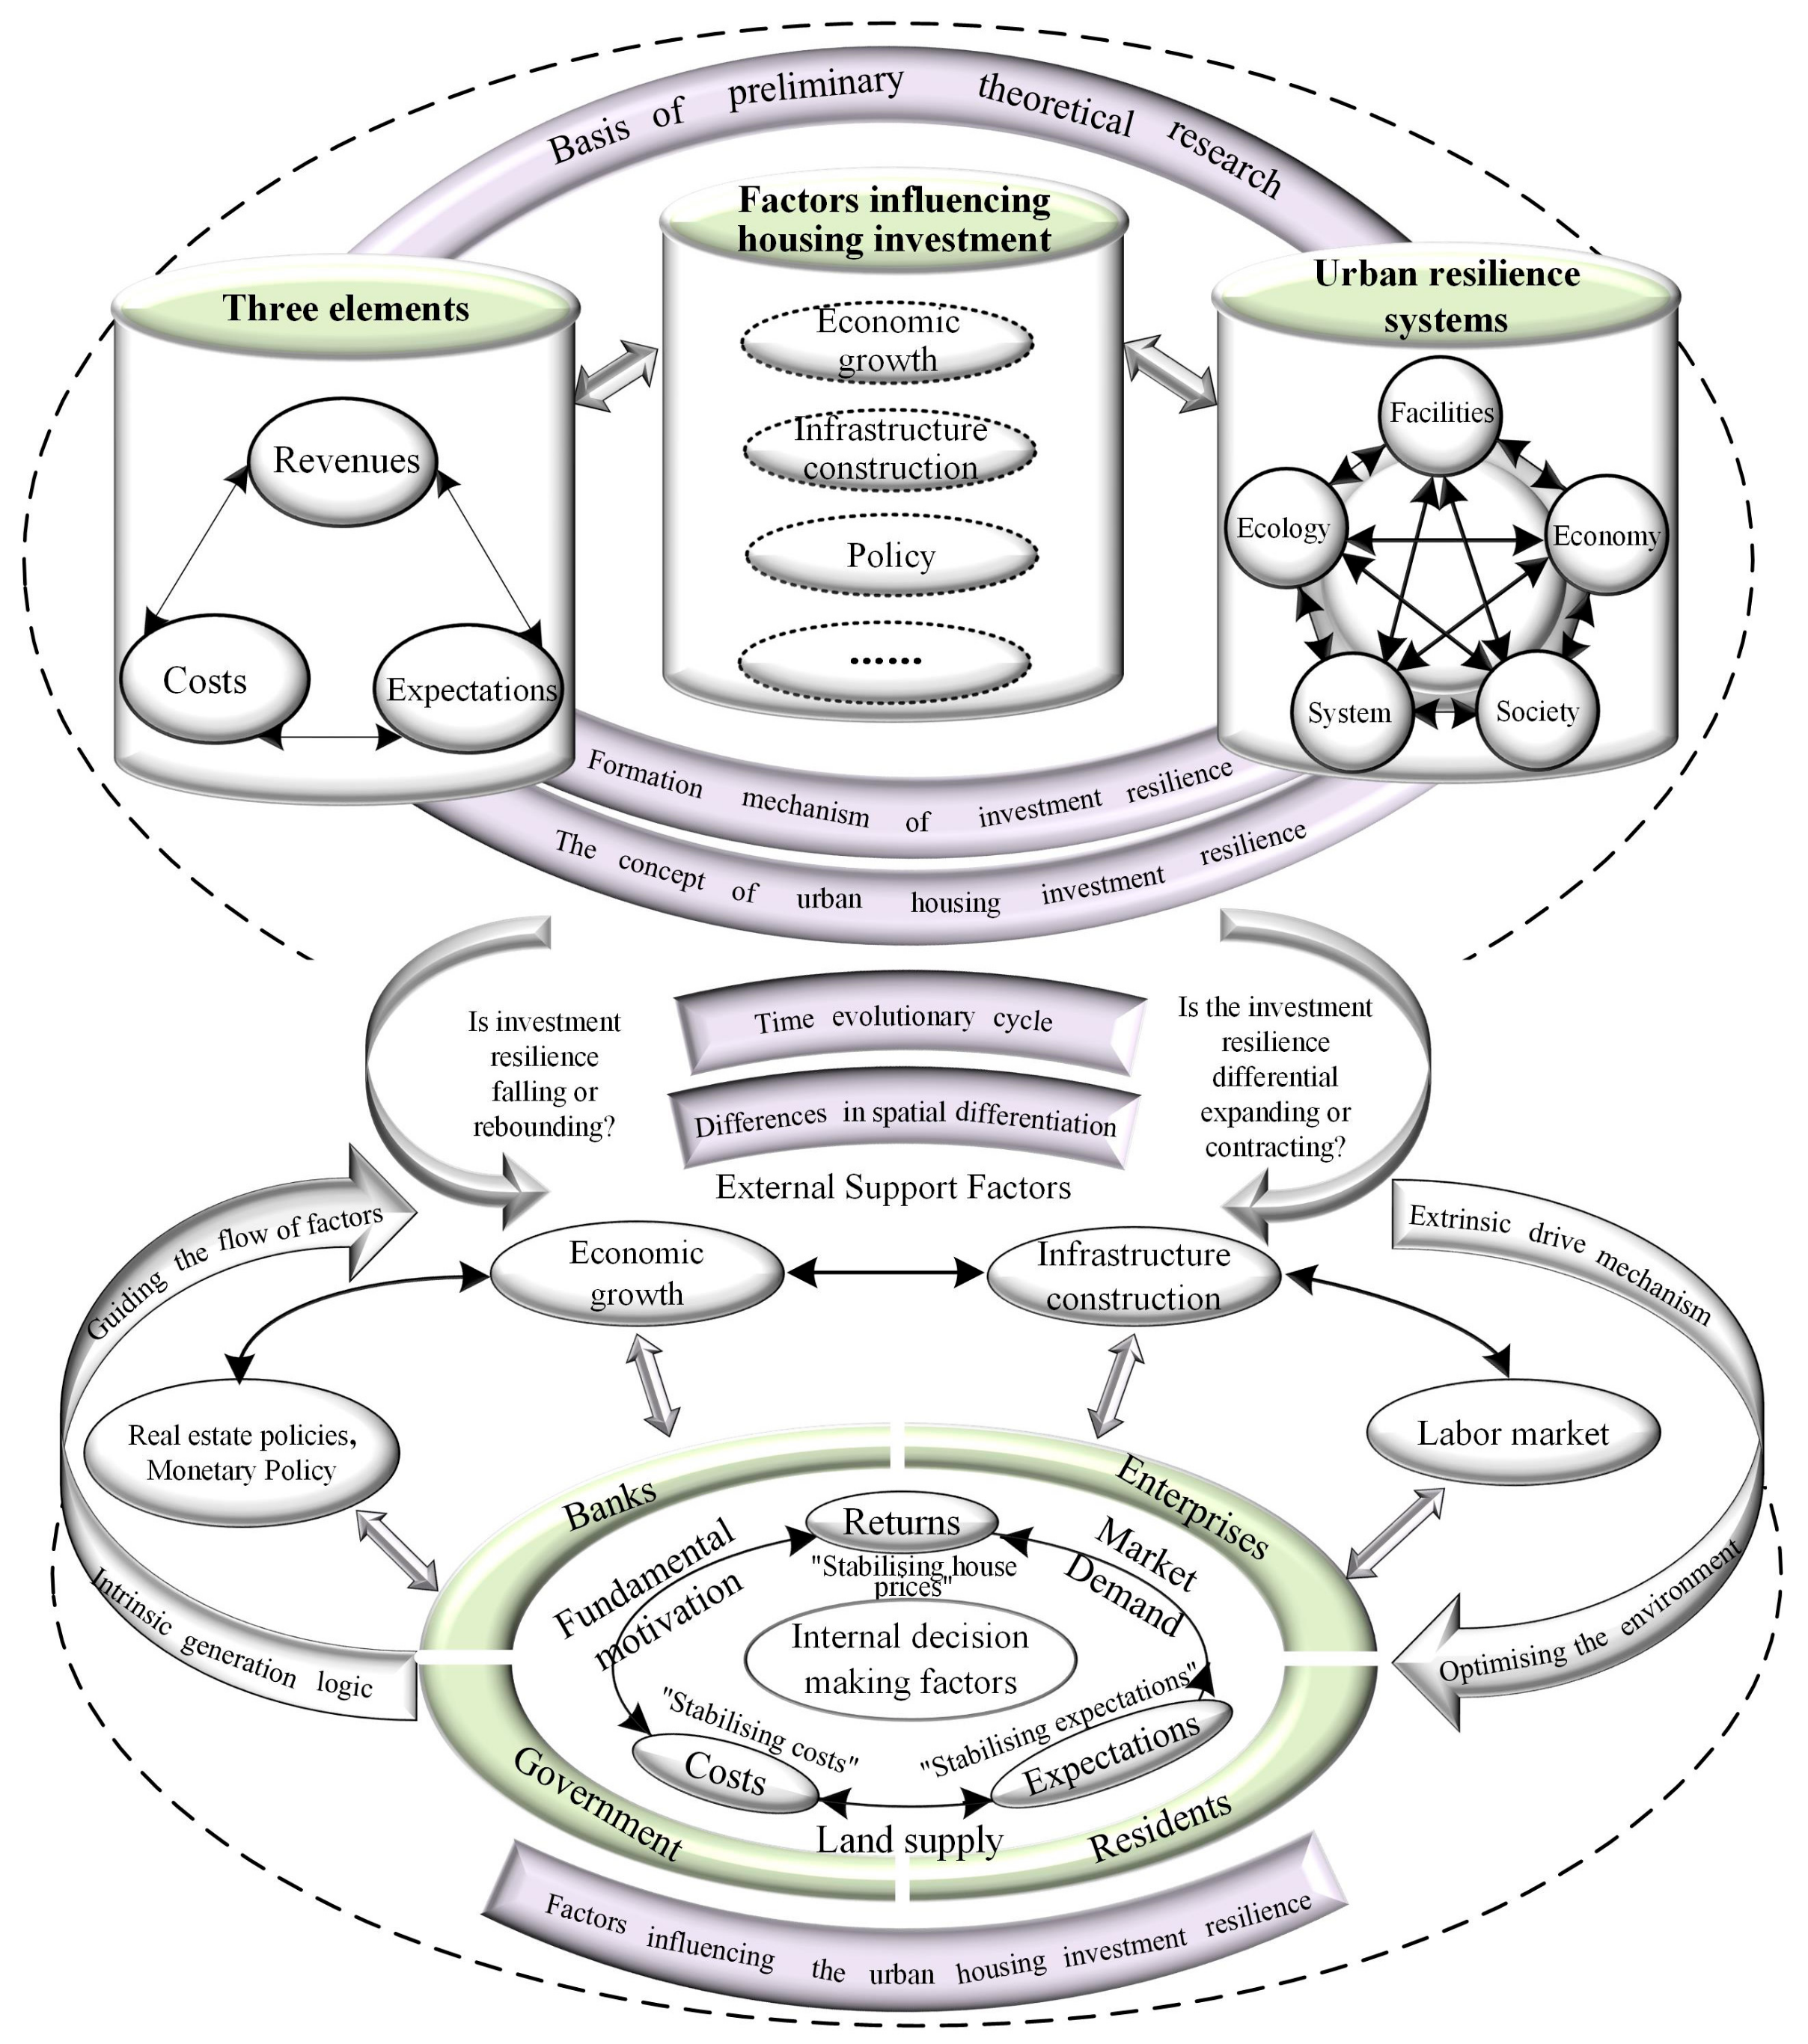
2.2. Theoretical Framework Construction and Analysis of Influencing Factors
2.3. Data Processing
2.3.1. Data Sources and Scoping Study
2.3.2. Measurement and Calibration
3. Spatiotemporal Evolutionary Characteristics of Urban Housing Investment Resilience
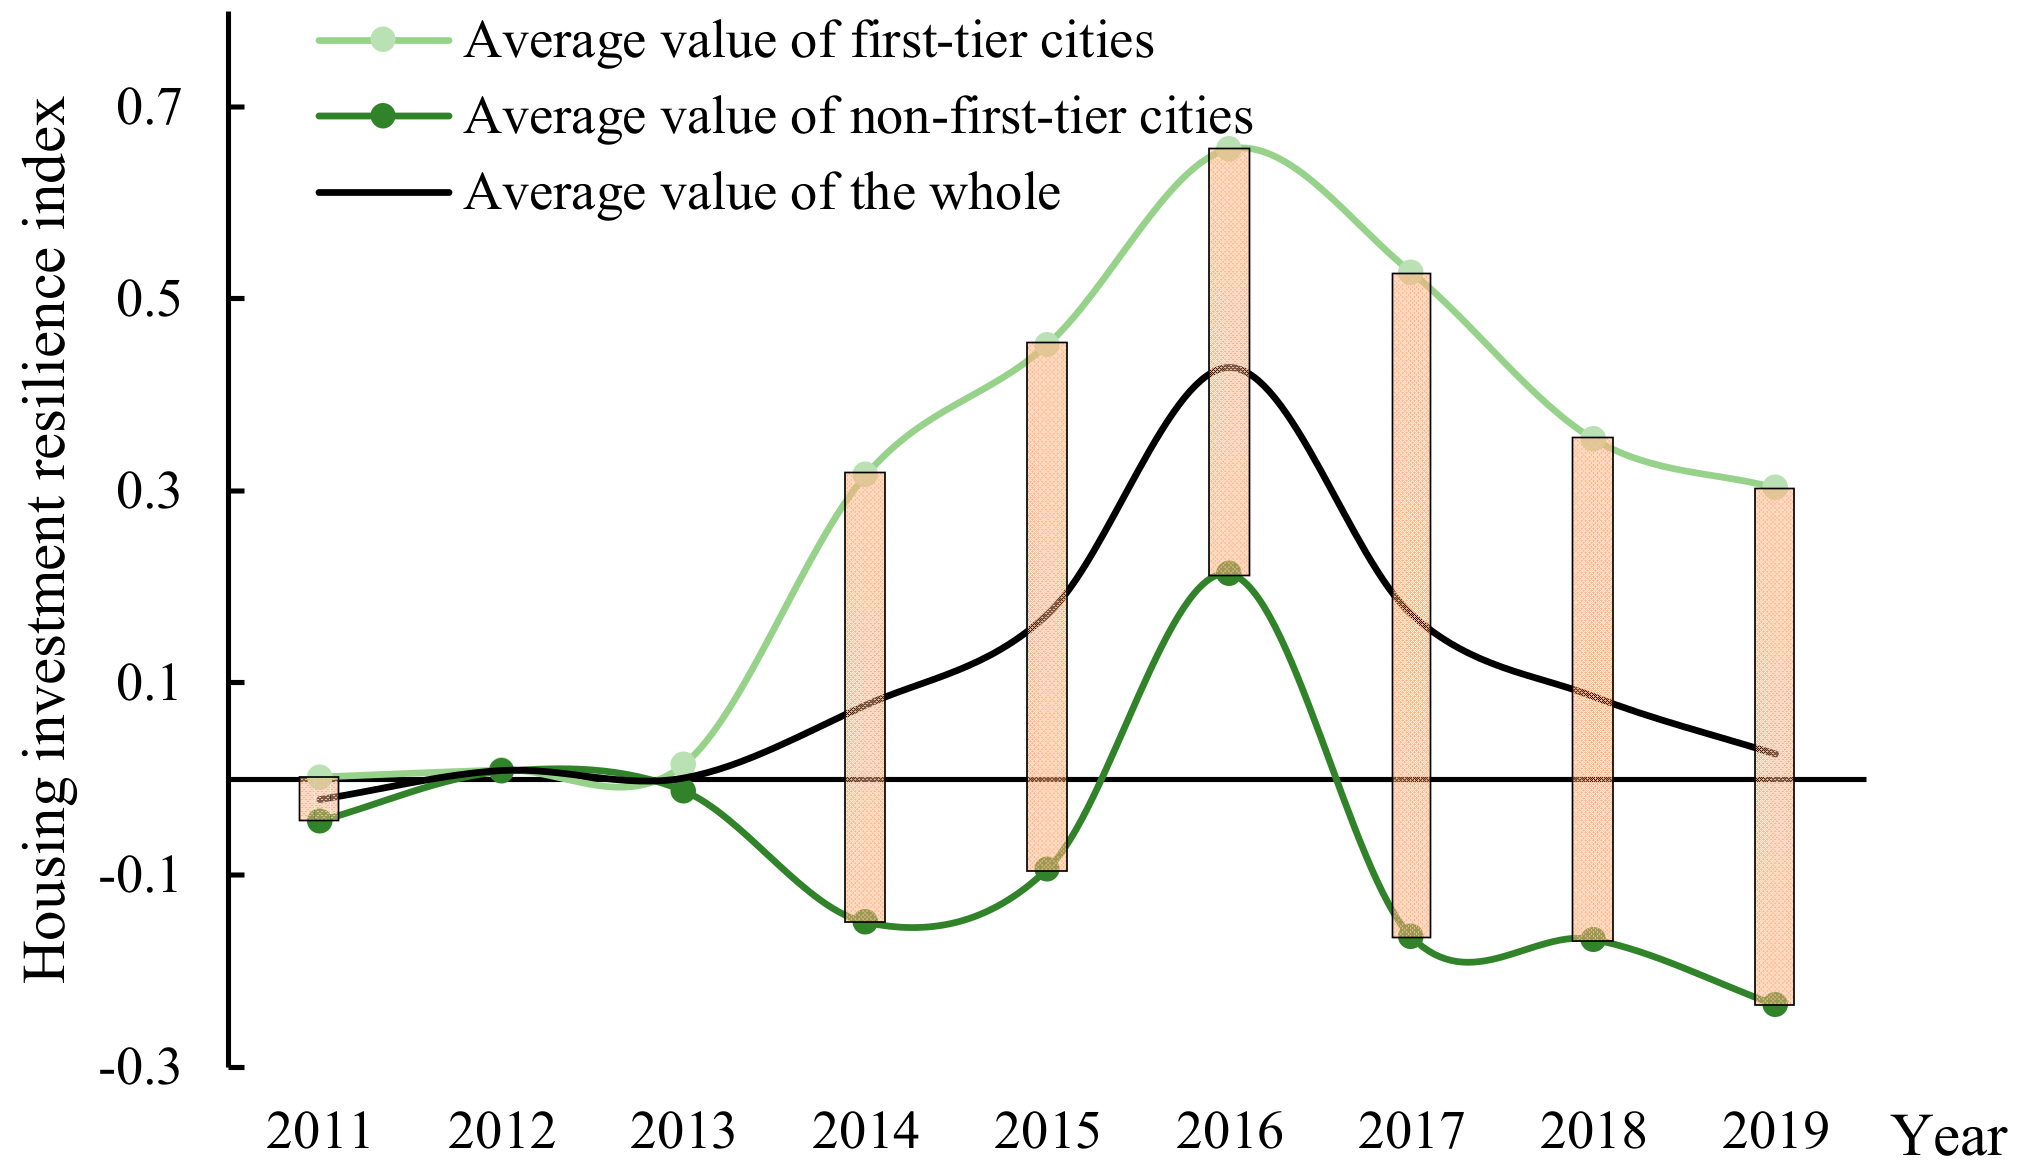
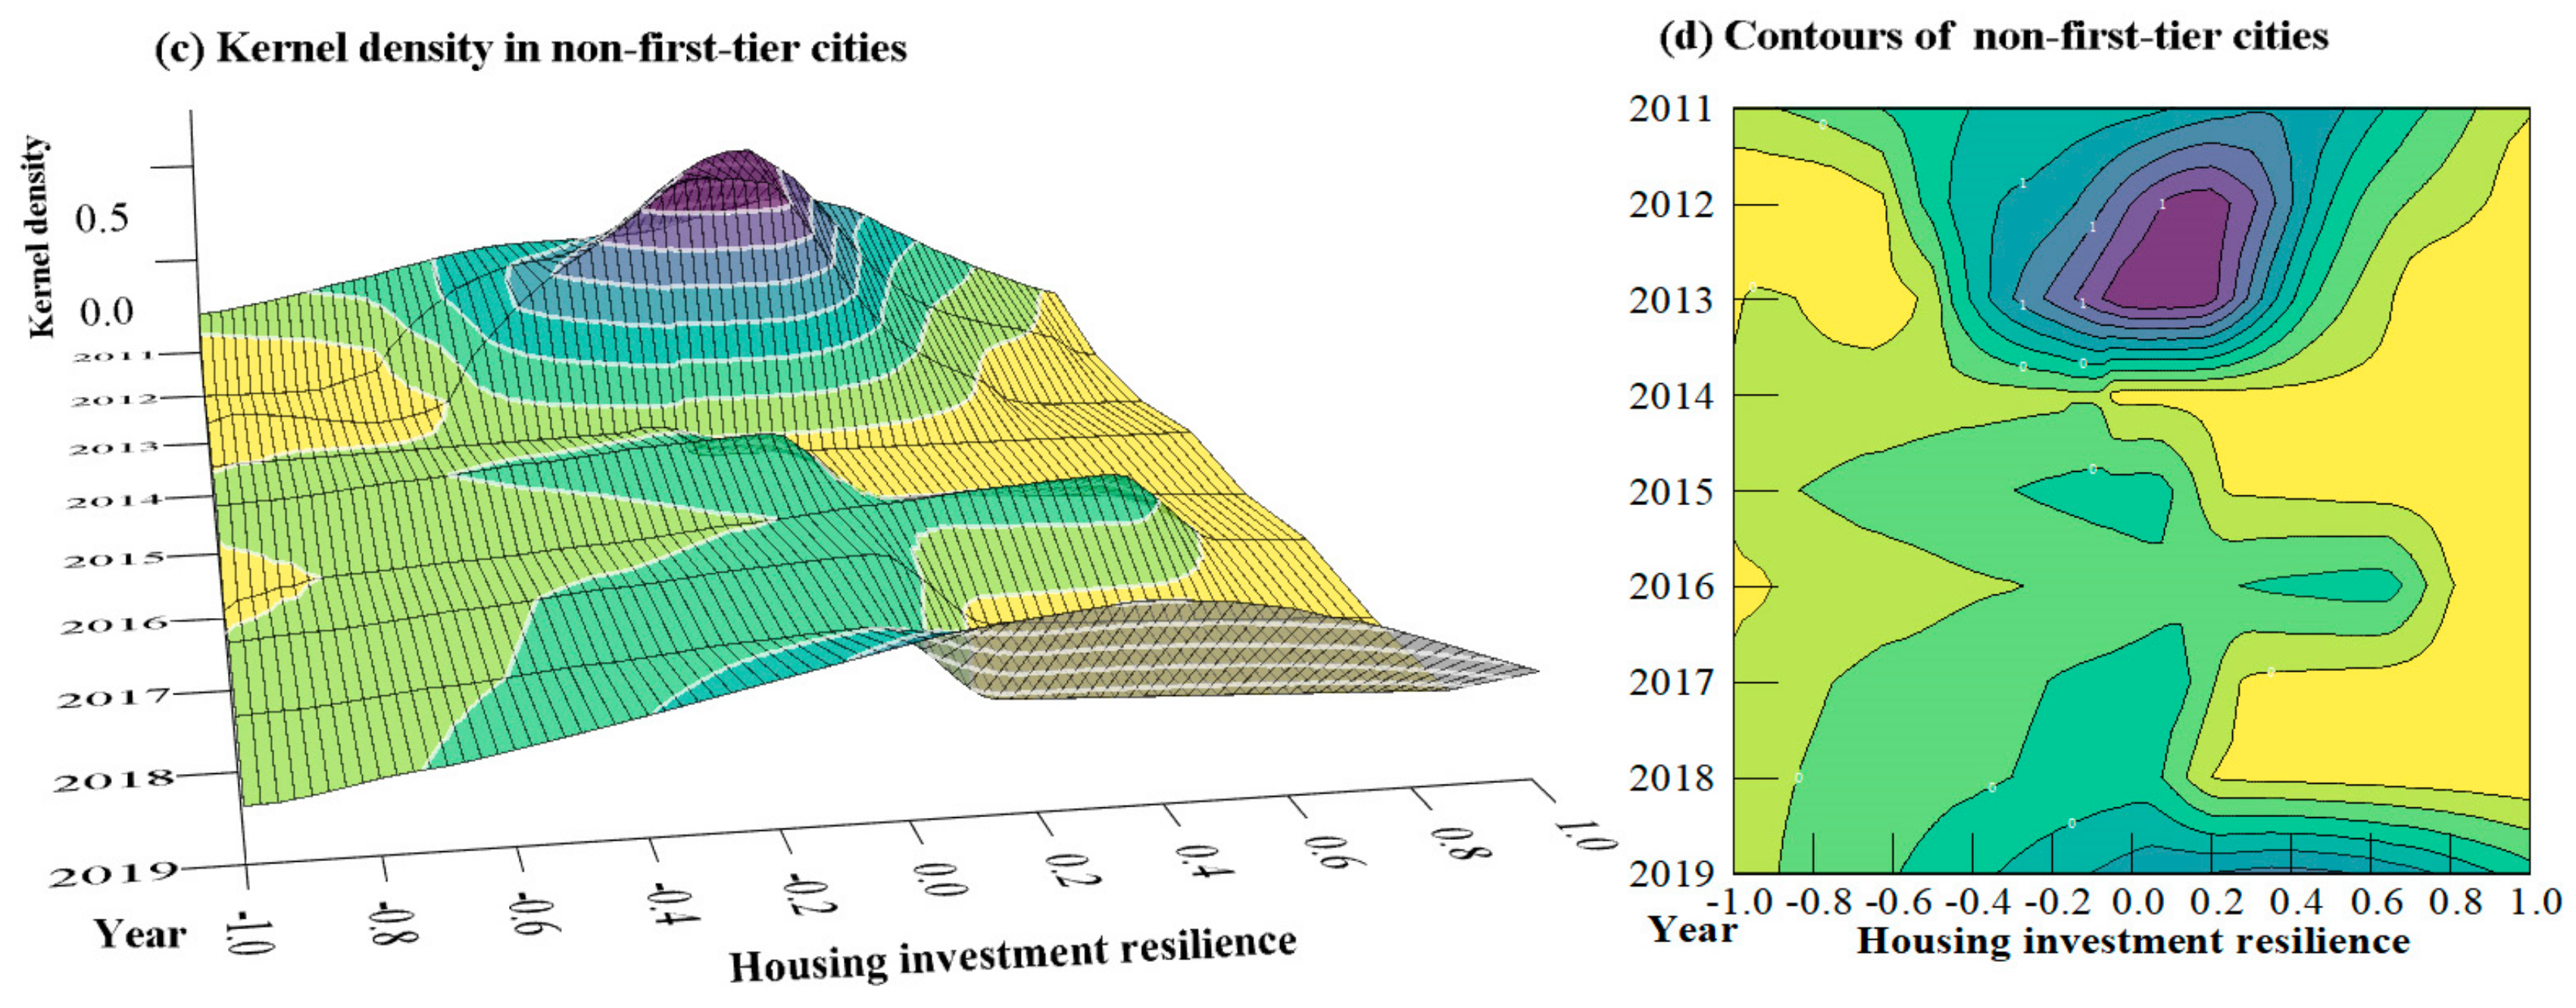
3.1. Time Series Characterization
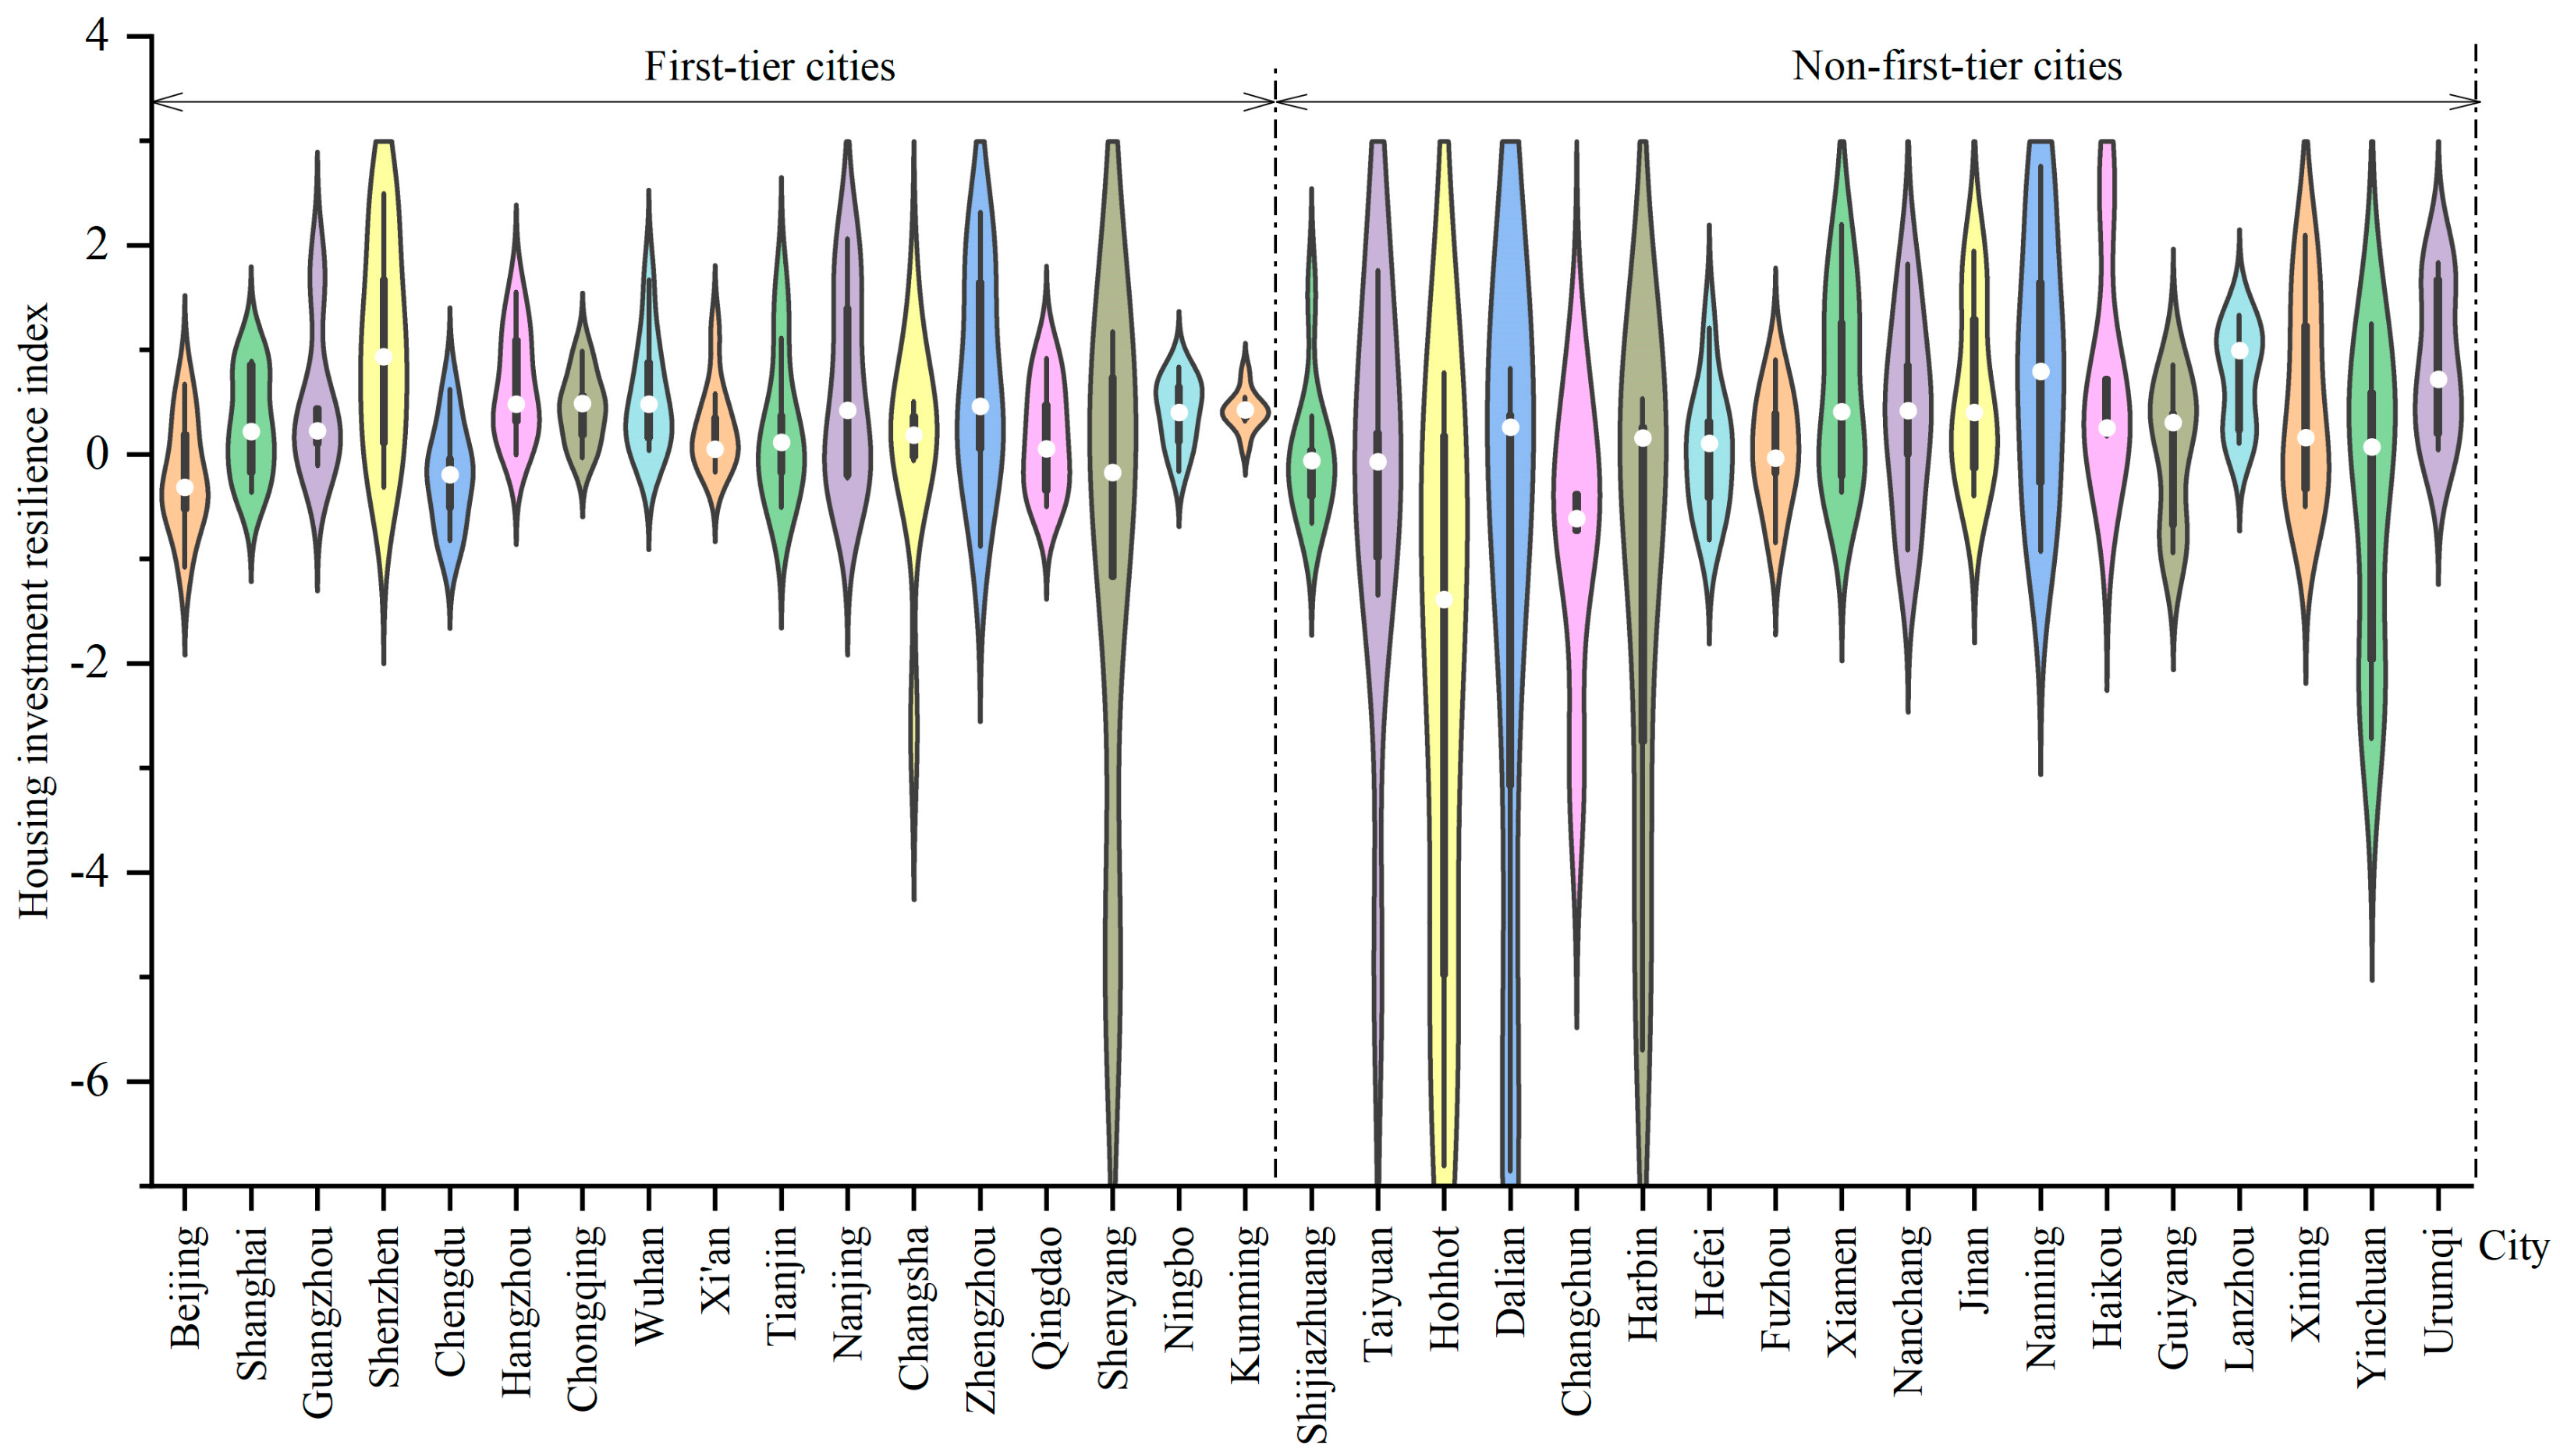
3.2. Spatial Characteristics
3.2.1. Spatial Distribution Characteristics
3.2.2. Endogeneity of the Network Structure
4. An Analysis of the Mechanisms That Shape Urban Housing Investment Resilience
4.1. Analysis of the Need for Individual Conditions
4.2. Sufficiency Analysis of Conditional Configurations
4.2.1. Path Analysis of High Levels of Housing Investment Resilience in First-Tier Cities
4.2.2. Path Analysis of High Levels of Housing Investment Resilience in Non-first-Tier Cities
4.3. Robustness Tests
4.3.1. Adjusting Consistency Levels
4.3.2. Change in Calibration Standard
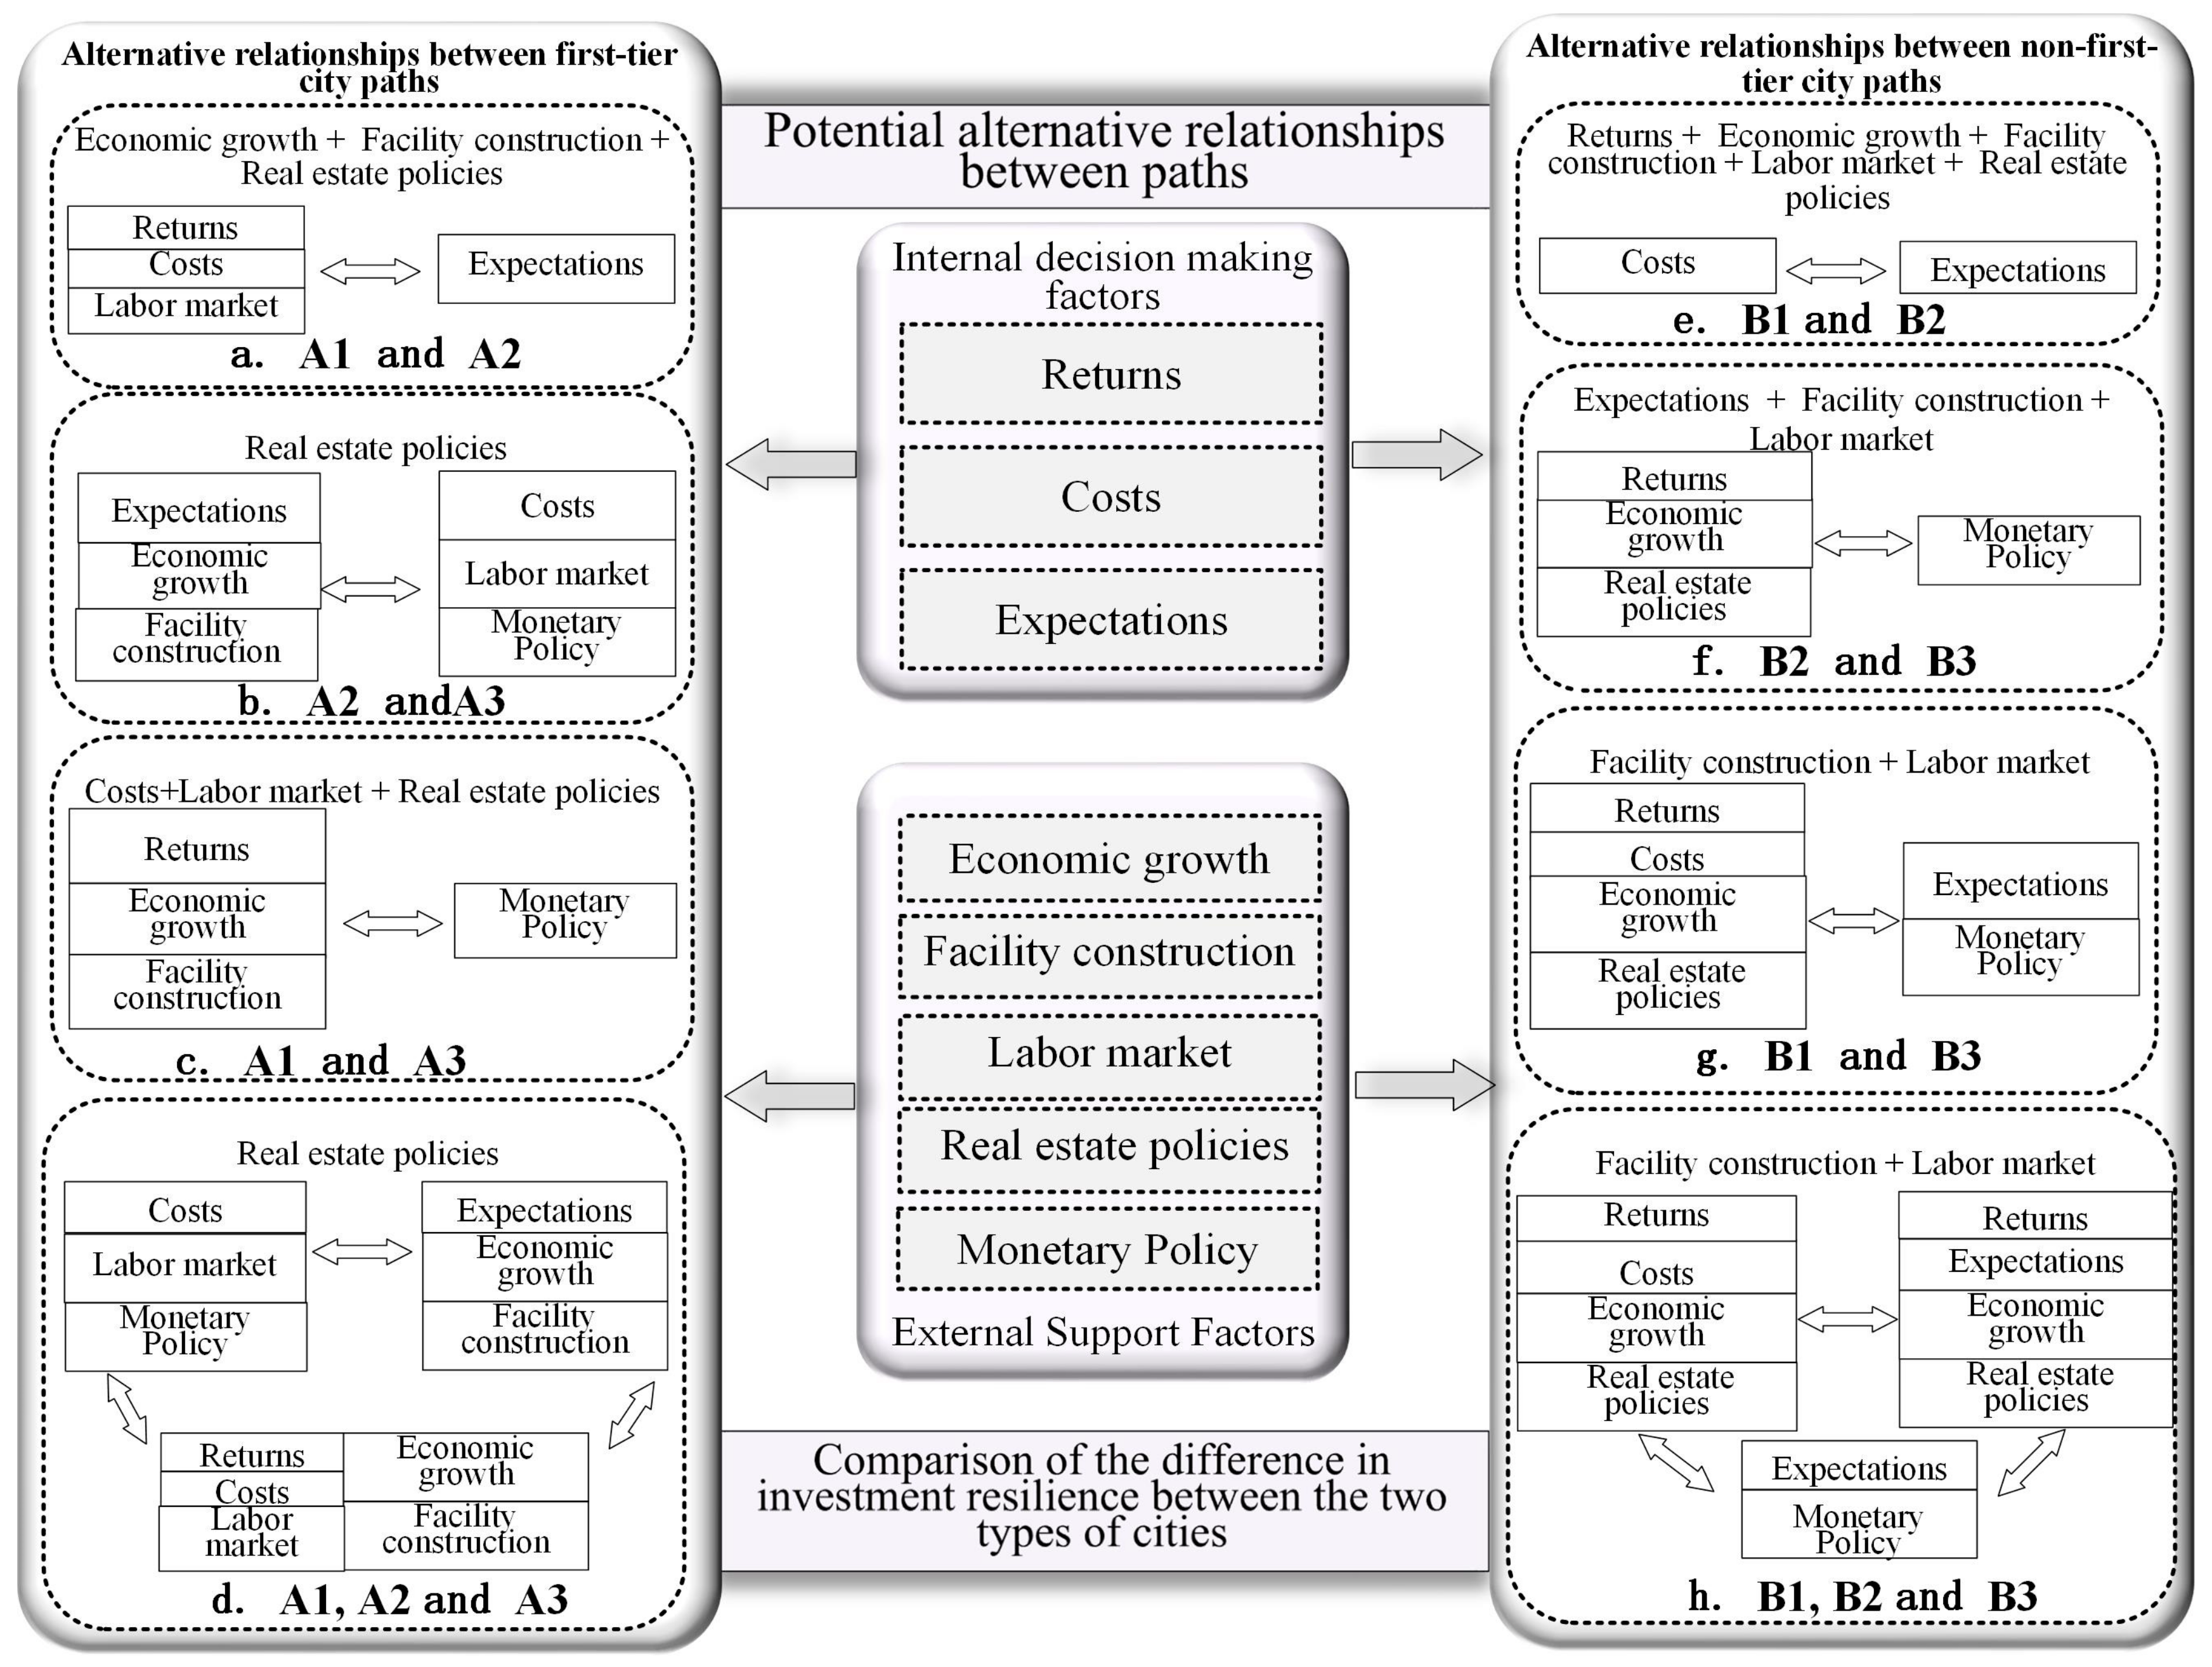
4.4. Analysis of Potential Substitution Relationships between the Two Types of Urban Configuration Path Conditions
5. Conclusions and Discussions
Author Contributions
Funding
Institutional Review Board Statement
Informed Consent Statement
Data Availability Statement
Conflicts of Interest
References
- Liu, X.X.; Zhang, X.; Li, S.W. Measurement of China’s macroeconomic resilience: A systemic risk perspective. Soc. Sci. China 2021, 1, 12–32. [Google Scholar]
- Zhao, R.D.; Fang, C.l.; Liu, H.M. Progress and prospect of urban resilience research. Prog. Geogr. 2020, 39, 1717–1731. [Google Scholar] [CrossRef]
- Resilience Alliance. Urban Resilience Research Prospectus; CSIRO: Canberra, Australia, 2007. [Google Scholar]
- Tang, Y.; Song, Y.Y.; Xue, D.Q.; Dong, C.Y. Spatio-temporal evolution of economic resilience of resource-based cities in Shanxi province and its obstacles. J. Arid. Land Resour. Environ. 2022, 36, 53–61. [Google Scholar] [CrossRef]
- Hou, L.G.; Sun, J.P. Evaluation of network structure resilience of Chengdu-Chongqing urban agglomeration from the perspective of complex networks. World Reg. Stud. 2022, 31, 561–571. [Google Scholar]
- Fang, Y.L.; Su, X.Q.; Huang, Z.F. Spatial spillover effect of urban resilience on tourism economy: A case study of the Yangtze River Delta urban agglomeration. Prog. Geogr. 2022, 41, 214–223. [Google Scholar] [CrossRef]
- Fang, Y.L.; Su, X.Q.; Huang, Z.F. Structural Characteristics and Resilience Evaluation of Tourism Flow Networks in Five Major Urban Agglomerations in Coastal China: From the Perspective of Evolutionary Resilience. Econ. Geogr. 2022, 42, 203–211. [Google Scholar] [CrossRef]
- Li, X.M.; Liu, K.Q.; Tian, S.Z.; Guan, Y.Y.; Liu, H. Evaluation of urban human settlements resilience based on DPSIR model: A case study of the Yangtze River Delta urban systems. Hum. Geogr. 2022, 37, 54–62. [Google Scholar] [CrossRef]
- Wei, S.M.; Pan, J.H. Network structure resilience of cities at the prefecture level and above in China. Acta Geogr. Sin. 2021, 76, 1394–1407. [Google Scholar]
- Smith, J.E. What Determines Housing Investment? An Investigation into the Social, Economic and Political Determinants of Housing Investment in Four European Countries; Delft University Press: Delft, The Netherlands, 1997. [Google Scholar]
- Byrne, P.; Lee, S. Spatial concentration in industrial real estate: Institutional investment in England and Wales. J. Prop. Invest. Financ. 2010, 28, 6–23. [Google Scholar] [CrossRef]
- Monnet, E.; Wolf, C. Demographic cycles, migration and housing investment. J. Hous. Econ. 2017, 38, 38–49. [Google Scholar] [CrossRef]
- Afolabi, A.O.; Ojelabi, R.A.; Bukola, A.; Akinola, A.; Afolabi, A. Statistical exploration of dataset examining key indicators influencing housing and urban infrastructure investments in megacities—ScienceDirect. Data Brief 2018, 18, 1725–1733. [Google Scholar] [CrossRef]
- Zhang, W.B.; Liu, X.; Tian, Y.Z. Research of real estate bubble based on the model of measurement system. Arid. Land Geogr. 2016, 39, 903–908. [Google Scholar] [CrossRef]
- Yang, Z.; Zhang, H.; Zhao, L.Q. Dual role of housing consumption and investment: Reexamine correlation of housing and consumption in urban China. Econ. Res. J. 2014, 49, 55–65. [Google Scholar]
- Kang, J.Y.; Suo, Z.H.; Liang, L.K.; Mai, Z.; Fang, M. Temporal and spatial evolution and its affecting factors of housing affordability at urban scale in China. Arid. Land Geogr. 2019, 42, 1153–1165. [Google Scholar]
- Yang, Y.; Li, P.P.; Mao, Y.H. Effects of institutional environment on location choice of real estate companies’ inter-regional investment. Manag. Rev. 2018, 30, 186–197. [Google Scholar] [CrossRef]
- Lin, L.Y.; Zhu, Y.; Ke, W.Q.; Lin, C.Z. The characteristics and determinants of the floating population’s housing invest-ment in the places of origin:Evidence from a survey in Fujian Province. Sci. Geogr. Sin. 2020, 40, 401–408. [Google Scholar] [CrossRef]
- Martin, R.; Gardiner, B. The resilience of cities to economic shocks: A tale of four recessions (and the challenge of Brexit). Pap. Reg. Sci. 2019, 98, 1801–1832. [Google Scholar] [CrossRef]
- Delery, J.E.; Doty, D.H. Modes of Theorizing in Strategic Human Resource Management: Tests of Universalistic, Contingency, and Configurational Performance Predictions. Acad. Manag. J. 1996, 39, 802–835. [Google Scholar] [CrossRef]
- Ragin, C.C. The Comparative Method: Moving Beyond Qualitativeand Quantitative Strategies; University of California Press: Oakland, CA, USA, 2014. [Google Scholar] [CrossRef]
- Liu, Y.Q.; Xing, B.; Wang, Q.S. A configuration research on the impact of tourism product innovation on perceived value of tourism experience. Bus. Manag. J. 2018, 40, 157–173. [Google Scholar] [CrossRef]
- Murphy, L. The global financial crisis and the Australian and New Zealand housing markets. J. Hous. Built Environ. 2011, 26, 335–351. [Google Scholar] [CrossRef]
- Lowe, P. Household debt, housing prices and resilience. Econ. Anal. Policy 2017, 55, 124–131. [Google Scholar] [CrossRef]
- Li, J.; Dong, Y.N.; He, C.F. More debts, more investment? The behaviors of real estate developers and spatial differentiation from housing financialization perspective. Bus. Manag. J. 2020, 42, 171–189. [Google Scholar] [CrossRef]
- Cao, Y.; Chen, J.; Zhang, Q. Housing investment in urban China. J. Comp. Econ. 2018, 46, 212–247. [Google Scholar] [CrossRef]
- Hu, J.Y. The competition between housing market entities and the regulatory control path option: An empirical analysis of the causes of high housing prices in major cities in China. Comp. Econ. Soc. Syst. 2019, 35, 144–155. [Google Scholar]
- Huang, Y.M. Spatial differentiation of housing price growth in China and its impact mechanism. Econ. Geogr. 2019, 39, 88–95. [Google Scholar] [CrossRef]
- Tang, Y.G.; Chen, Q.; Man, L.P. Capitalization fiscal incentives and the provision of local public services evidence from 35 large and medium sized cities of China. China Econ. Q. 2016, 15, 217–240. [Google Scholar] [CrossRef]
- Omokolade, A.; Nikiwe, M.; Taderera, M. The role of macro-economic indicators in explaining direct commercial real estate returns: Evidence from South Africa. J. Prop. Res. 2017, 35, 28–52. [Google Scholar] [CrossRef]
- Chang, F.; Li, X.T.; Guo, K.; Dong, J.C. Differentiated impact of monetary policy on regional real estate residential market-based on the empirical research on real estate residential markets of ten cities in China. Manag. Rev. 2013, 25, 3–9. [Google Scholar] [CrossRef]
- Wang, X.Z.; Yang, Y.W. Differentiated expectations; policy regulation and housing price fluctuations: An empirical study of 35 large and medium-sized cities in China. J. Financ. Ang Econ. 2015, 41, 51–61. [Google Scholar] [CrossRef]
- Li, C.; Lv, M.H.; Wang, T. The differential effects of monetary policy adjustment on enterprise investment: Theoretical analysis and empirical evidence. Financ. Forum 2021, 26, 11–21. [Google Scholar] [CrossRef]
- Du, Y.Z.; Liu, Q.C.; Cheng, J.Q. What Kind of Ecosystem For doing Business Will Contribute to City-level High Entrepreneurial Activity?A Research Based on Institutional Configurations. J. Manag. World 2020, 36, 141–155. [Google Scholar] [CrossRef]
- Zhang, M.; Chen, W.H.; Lan, H.L. Why do Chinese enterprises completely acquire foreign high-tech enterprises-a fuzzy set qualitative comparative analysis (fsQCA) based on 94 cases. China Ind. Econ. 2019, 4, 117–135. [Google Scholar] [CrossRef]
- Rodrigues, R.; Samagaio, A.; Felício, T. Corporate governance and R&D investment by European listed companies. J. Bus. Res. 2020, 115, 289–295. [Google Scholar] [CrossRef]
- Zhao, Y.H.; Tao, K.T.; Li, Y.H.; Li, X.H. Location choice of Chinese enterprises for outward foreign direct investment-research on linkage effect based on the QCA method. China Ind. Econ. 2020, 11, 118–136. [Google Scholar] [CrossRef]
- Du, Y.Z.; Jia, L.D. Configuration perspective and qualitative comparative analysis (QCA): A new way of management research. J. Manag. World 2017, 11, 155–167. [Google Scholar] [CrossRef]


| Variables | Indicator | Calibration of First-Tier Cities | Calibration of Non-first-Tier Cities | ||||
|---|---|---|---|---|---|---|---|
| Completely Affiliated | Crossover Point | Completely Unaffiliated | Completely Affiliated | Crossover Point | Completely Unaffiliated | ||
| Outcome variables | Urban housing investment resilience | 0.1605 | 0.0761 | 0.0150 | 0.1841 | 0.0709 | -0.0262 |
| Antecedent variables | Returns | 0.1138 | 0.0658 | 0.0289 | 0.1090 | 0.0576 | 0.0287 |
| Costs | 0.6596 | 0.0508 | −0.3023 | 0.4361 | −0.0205 | −0.3758 | |
| Expectations | 1057.7664 | 838.5956 | 575.7955 | 670.8886 | 472.3437 | 248.8328 | |
| Economic growth | 0.0959 | 0.0792 | 0.0629 | 0.1050 | 0.0767 | 0.0544 | |
| Infrastructure construction | 0.1376 | 0.1000 | 0.0555 | 0.1548 | 0.1027 | 0.0527 | |
| Labor market | 97.8 | 97.2 | 96.7 | 97.4 | 96.9 | 96.4 | |
| Real estate policies | 6.6839 | 5.6985 | 5.3955 | 6.7011 | 5.6873 | 5.3739 | |
| Monetary policy | 1 | / | 0 | 1 | / | 0 | |
| Housing Investment Resilience in First-Tier Cities | Housing Investment Resilience in Non-First-Tier Cities | |||
|---|---|---|---|---|
| Consistency | Coverage | Consistency | Coverage | |
| Returns | 0.5538 | 0.5419 | 0.6683 | 0.6864 |
| ~Returns | 0.5355 | 0.5315 | 0.6246 | 0.6061 |
| Costs | 0.6027 | 0.6110 | 0.6559 | 0.7224 |
| ~Costs | 0.4920 | 0.4717 | 0.6618 | 0.6037 |
| Expectations | 0.5227 | 0.5138 | 0.5807 | 0.6707 |
| ~Expectations | 0.5568 | 0.5503 | 0.7127 | 0.6261 |
| Economic growth | 0.6208 | 0.5977 | 0.7507 | 0.7097 |
| ~Economic growth | 0.4656 | 0.4699 | 0.6046 | 0.6388 |
| Infrastructure construction | 0.5355 | 0.5412 | 0.7398 | 0.7348 |
| ~Infrastructure construction | 0.5575 | 0.5360 | 0.6144 | 0.6160 |
| Labor market | 0.6213 | 0.6107 | 0.6327 | 0.6972 |
| ~Labor market | 0.4831 | 0.4773 | 0.6446 | 0.5877 |
| Real estate policies | 0.6478 | 0.6245 | 0.7317 | 0.6449 |
| ~Real estate policies | 0.4465 | 0.4501 | 0.5166 | 0.5941 |
| Monetary policy | 0.5811 | 0.4295 | 0.6284 | 0.4703 |
| ~Monetary policy | 0.4189 | 0.6192 | 0.3716 | 0.5563 |
| Path | First-Tier Cities | Non-first-Tier Cities | |||||
|---|---|---|---|---|---|---|---|
| Return- and Cost-Driven | Expectation-Driven | Cost-Driven | Return- and Cost-Driven | Return- and Expectation-Driven | Expectation-Driven | ||
| A1 | A2 | A3 | B1 | B2 | B3 | ||
| Internal decision-making factors | Returns | ● | ● | 🞄 | |||
| Costs | ● | ● | ● | ||||
| Expectations | ● | ● | ● | ||||
| External support factors | Economic growth | ● | ● | ● | ● | ||
| Infrastructure construction | ● | ● | ● | ● | ● | ||
| Labor market | ● | ● | ● | ● | ● | ||
| Real estate policies | 🞄 | ● | ● | ● | 🞄 | ||
| Monetary Policy | 🞄 | 🞄 | |||||
| Raw coverage | 0.0440 | 0.0332 | 0.0411 | 0.1350 | 0.1070 | 0.1565 | |
| Unique coverage | 0.0389 | 0.0139 | 0.0233 | 0.0516 | 0.0463 | 0.0104 | |
| Consistency | 0.8198 | 0.8170 | 0.9172 | 0.9963 | 0.9331 | 0.9583 | |
| Solution coverage | 0.1976 | 0.3471 | |||||
| Solution consistency | 0.8806 | 0.9567 | |||||
| Cases | Shenzhen, Zhengzhou, Nanjing, Hangzhou, Chongqing | Kunming, Beijing, Chengdu | Ningbo, Changsha | Changchun, Yinchuan, Xining, Nanning | Lanzhou, Nanchang | Haikou, Jinan, Fuzhou, Hefei | |
| Path | First-Tier Cities | Non-First-Tier Cities | |||||
|---|---|---|---|---|---|---|---|
| Path 1 | Path 2 | Path 3 | Path 1 | Path 2 | Path 3 | ||
| Internal decision-making factors | Returns | 🞄 | ● | ● | |||
| Costs | 🞄 | ● | |||||
| Expectations | 🞄 | ● | ● | ||||
| External support factors | Economic growth | ● | ● | ● | ● | ● | |
| Infrastructure construction | ● | ● | ● | ● | ● | ● | |
| Labor market | 🞄 | ● | ● | ● | |||
| Real estate policies | ● | ● | ● | ● | ● | ||
| Monetary Policy | 🞄 | ||||||
| Raw coverage | 0.1393 | 0.1009 | 0.1040 | 0.0779 | 0.0349 | 0.0355 | |
| Unique coverage | 0.0431 | 0.0139 | 0.0168 | 0.0685 | 0.0349 | 0.0261 | |
| Consistency | 0.9697 | 0.9720 | 0.9403 | 0.9145 | 0.9613 | 0.9619 | |
| Solution coverage | 0.1738 | 0.1389 | |||||
| Solution consistency | 0.9427 | 0.9355 | |||||
| Path | First-Tier Cities | Non-First-Tier Cities | |||||
|---|---|---|---|---|---|---|---|
| Path 1 | Path 2 | Path 3 | Path 1 | Path 2 | Path 3 | ||
| Internal decision-making factors | Returns | 🞄 | ● | ● | |||
| Costs | 🞄 | ● | |||||
| Expectations | 🞄 | ● | 🞄 | ||||
| External support factors | Economic growth | ● | ● | ● | ● | ● | |
| Infrastructure construction | ● | ● | ● | 🞄 | ● | ● | |
| Labor market | 🞄 | ● | ● | ● | |||
| Real estate policies | ● | ● | ● | ● | ● | ||
| Monetary Policy | 🞄 | ||||||
| Raw coverage | 0.0755 | 0.0450 | 0.0411 | 0.1565 | 0.08079 | 0.1349 | |
| Unique coverage | 0.0588 | 0.0450 | 0.0244 | 0.0753 | 0.0808 | 0.0538 | |
| Consistency | 0.9499 | 0.9339 | 0.9172 | 0.9583 | 0.9732 | 0.9963 | |
| Solution coverage | 0.1448 | 0.2911 | |||||
| Solution consistency | 0.9301 | 0.9695 | |||||
| Path | High-Level Development Configuration Path for Housing Investment Resilience in Two Types of Cities | |||||
|---|---|---|---|---|---|---|
| Same Path | Own Dedicated Paths | |||||
| First-Tier Cities | Non-First-Tier Cities | |||||
| Return- and Cost-Driven | Expectation-Driven | Cost-Driven | Return- and Expectation-Driven | Expectation-Driven | ||
| A1/B1 | A2 | A3 | B2 | B3 | ||
| Internal decision-making factors | Returns | ● | 🞄 | |||
| Costs | ● | ● | ||||
| Expectations | ● | ● | ● | |||
| External support factors | Economic growth | ● | ● | ● | ||
| Infrastructure construction | ● | ● | ● | ● | ||
| Labor market | ● | ● | ● | ● | ||
| Real estate policies | 🞄(First-tier)/●(Non-first-tier) | ● | ● | 🞄 | ||
| Monetary policy | 🞄 | 🞄 | ||||
Publisher’s Note: MDPI stays neutral with regard to jurisdictional claims in published maps and institutional affiliations. |
© 2022 by the authors. Licensee MDPI, Basel, Switzerland. This article is an open access article distributed under the terms and conditions of the Creative Commons Attribution (CC BY) license (https://creativecommons.org/licenses/by/4.0/).
Share and Cite
Wang, L.; Hu, H.; Wang, X.; Zhang, X.; Sun, H. Spatiotemporal Evolution and Cause Analysis of Urban Housing Investment Resilience: An Empirical Study of 35 Large and Medium-Sized Cities in China. Land 2022, 11, 1725. https://doi.org/10.3390/land11101725
Wang L, Hu H, Wang X, Zhang X, Sun H. Spatiotemporal Evolution and Cause Analysis of Urban Housing Investment Resilience: An Empirical Study of 35 Large and Medium-Sized Cities in China. Land. 2022; 11(10):1725. https://doi.org/10.3390/land11101725
Chicago/Turabian StyleWang, Linyan, Haiqing Hu, Xianzhu Wang, Xincheng Zhang, and Hao Sun. 2022. "Spatiotemporal Evolution and Cause Analysis of Urban Housing Investment Resilience: An Empirical Study of 35 Large and Medium-Sized Cities in China" Land 11, no. 10: 1725. https://doi.org/10.3390/land11101725
APA StyleWang, L., Hu, H., Wang, X., Zhang, X., & Sun, H. (2022). Spatiotemporal Evolution and Cause Analysis of Urban Housing Investment Resilience: An Empirical Study of 35 Large and Medium-Sized Cities in China. Land, 11(10), 1725. https://doi.org/10.3390/land11101725