
Spatiotemporal Variations in Farmland Rents and Its Drivers in Rural China: Evidence from Plot-Level Transactions


Abstract
:1. Introduction
2. Data and Methods
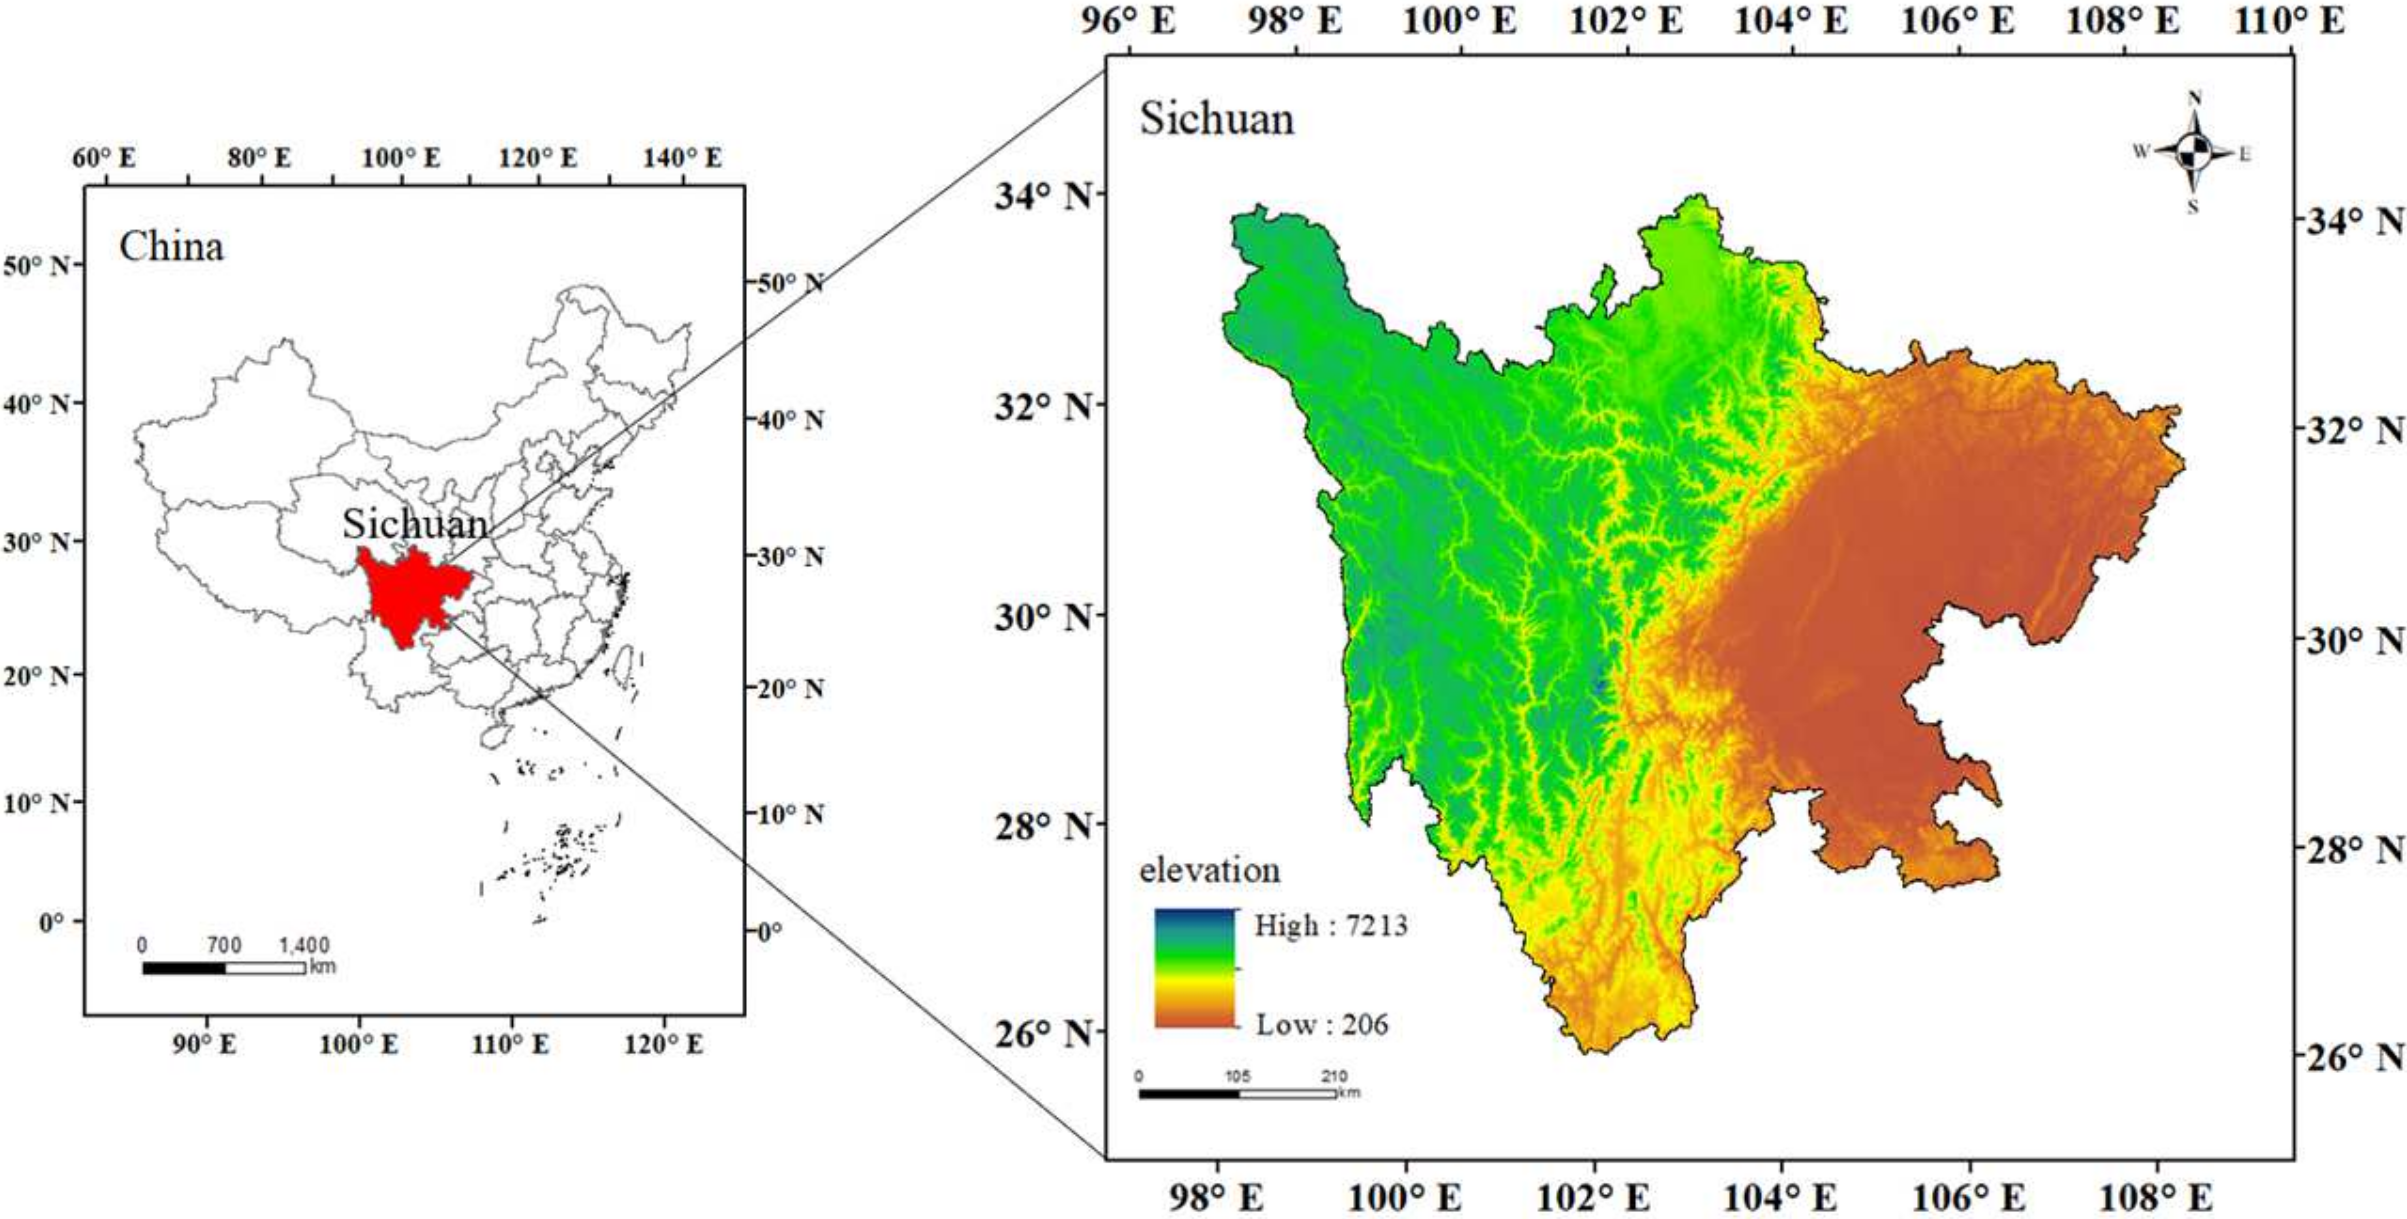
2.1. Study Area
2.2. Data
2.2.1. Land Transfer Transaction Data at the Plot-Level
2.2.2. Statistical Data of Social and Economic Development
2.3. Methods
2.3.1. Visualization of Spatial Differentiation of Farmland Rent
2.3.2. Drivers of Differentiation in Farmland Rent
2.3.3. Calculation of Net Profit of Cultivated Land
3. Results
3.1. Spatiotemporal Variations in Farmland Rents
3.1.1. Time Variations in Farmland Rents
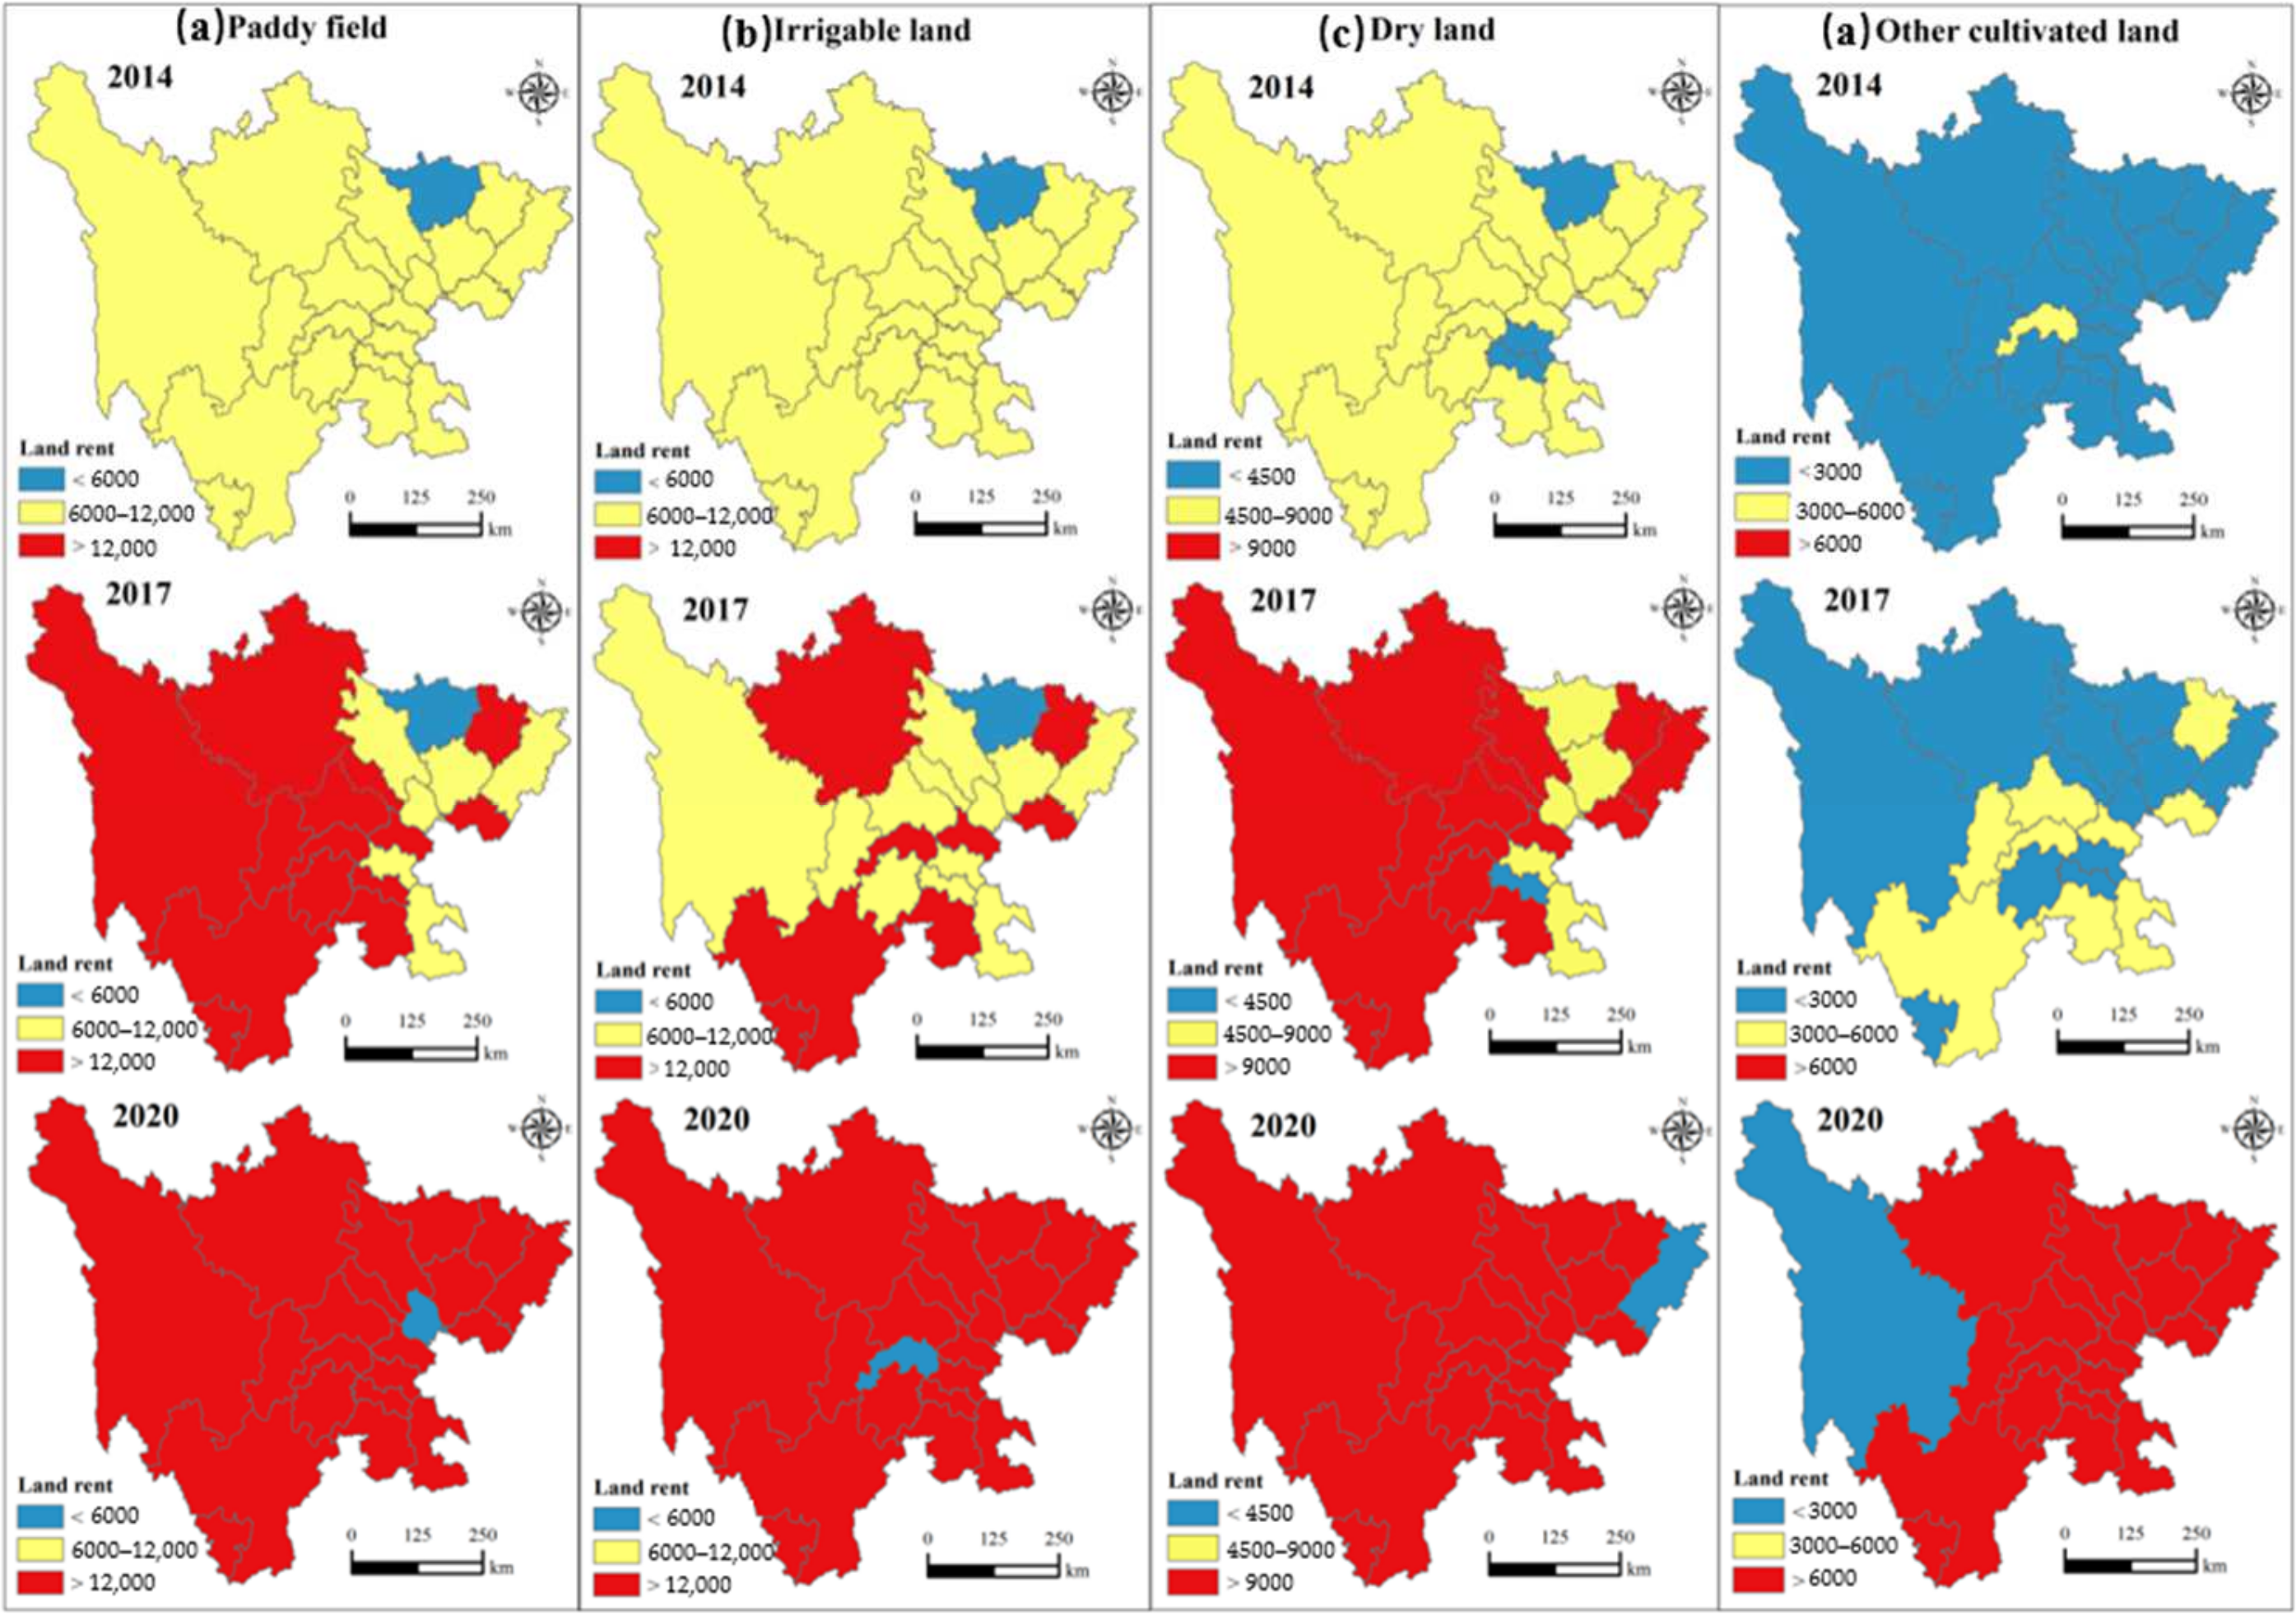
3.1.2. Spatiotemporal Variations in Different Types of Farmland Rents
3.2. Driving Factors of Differences in Farmland Rent
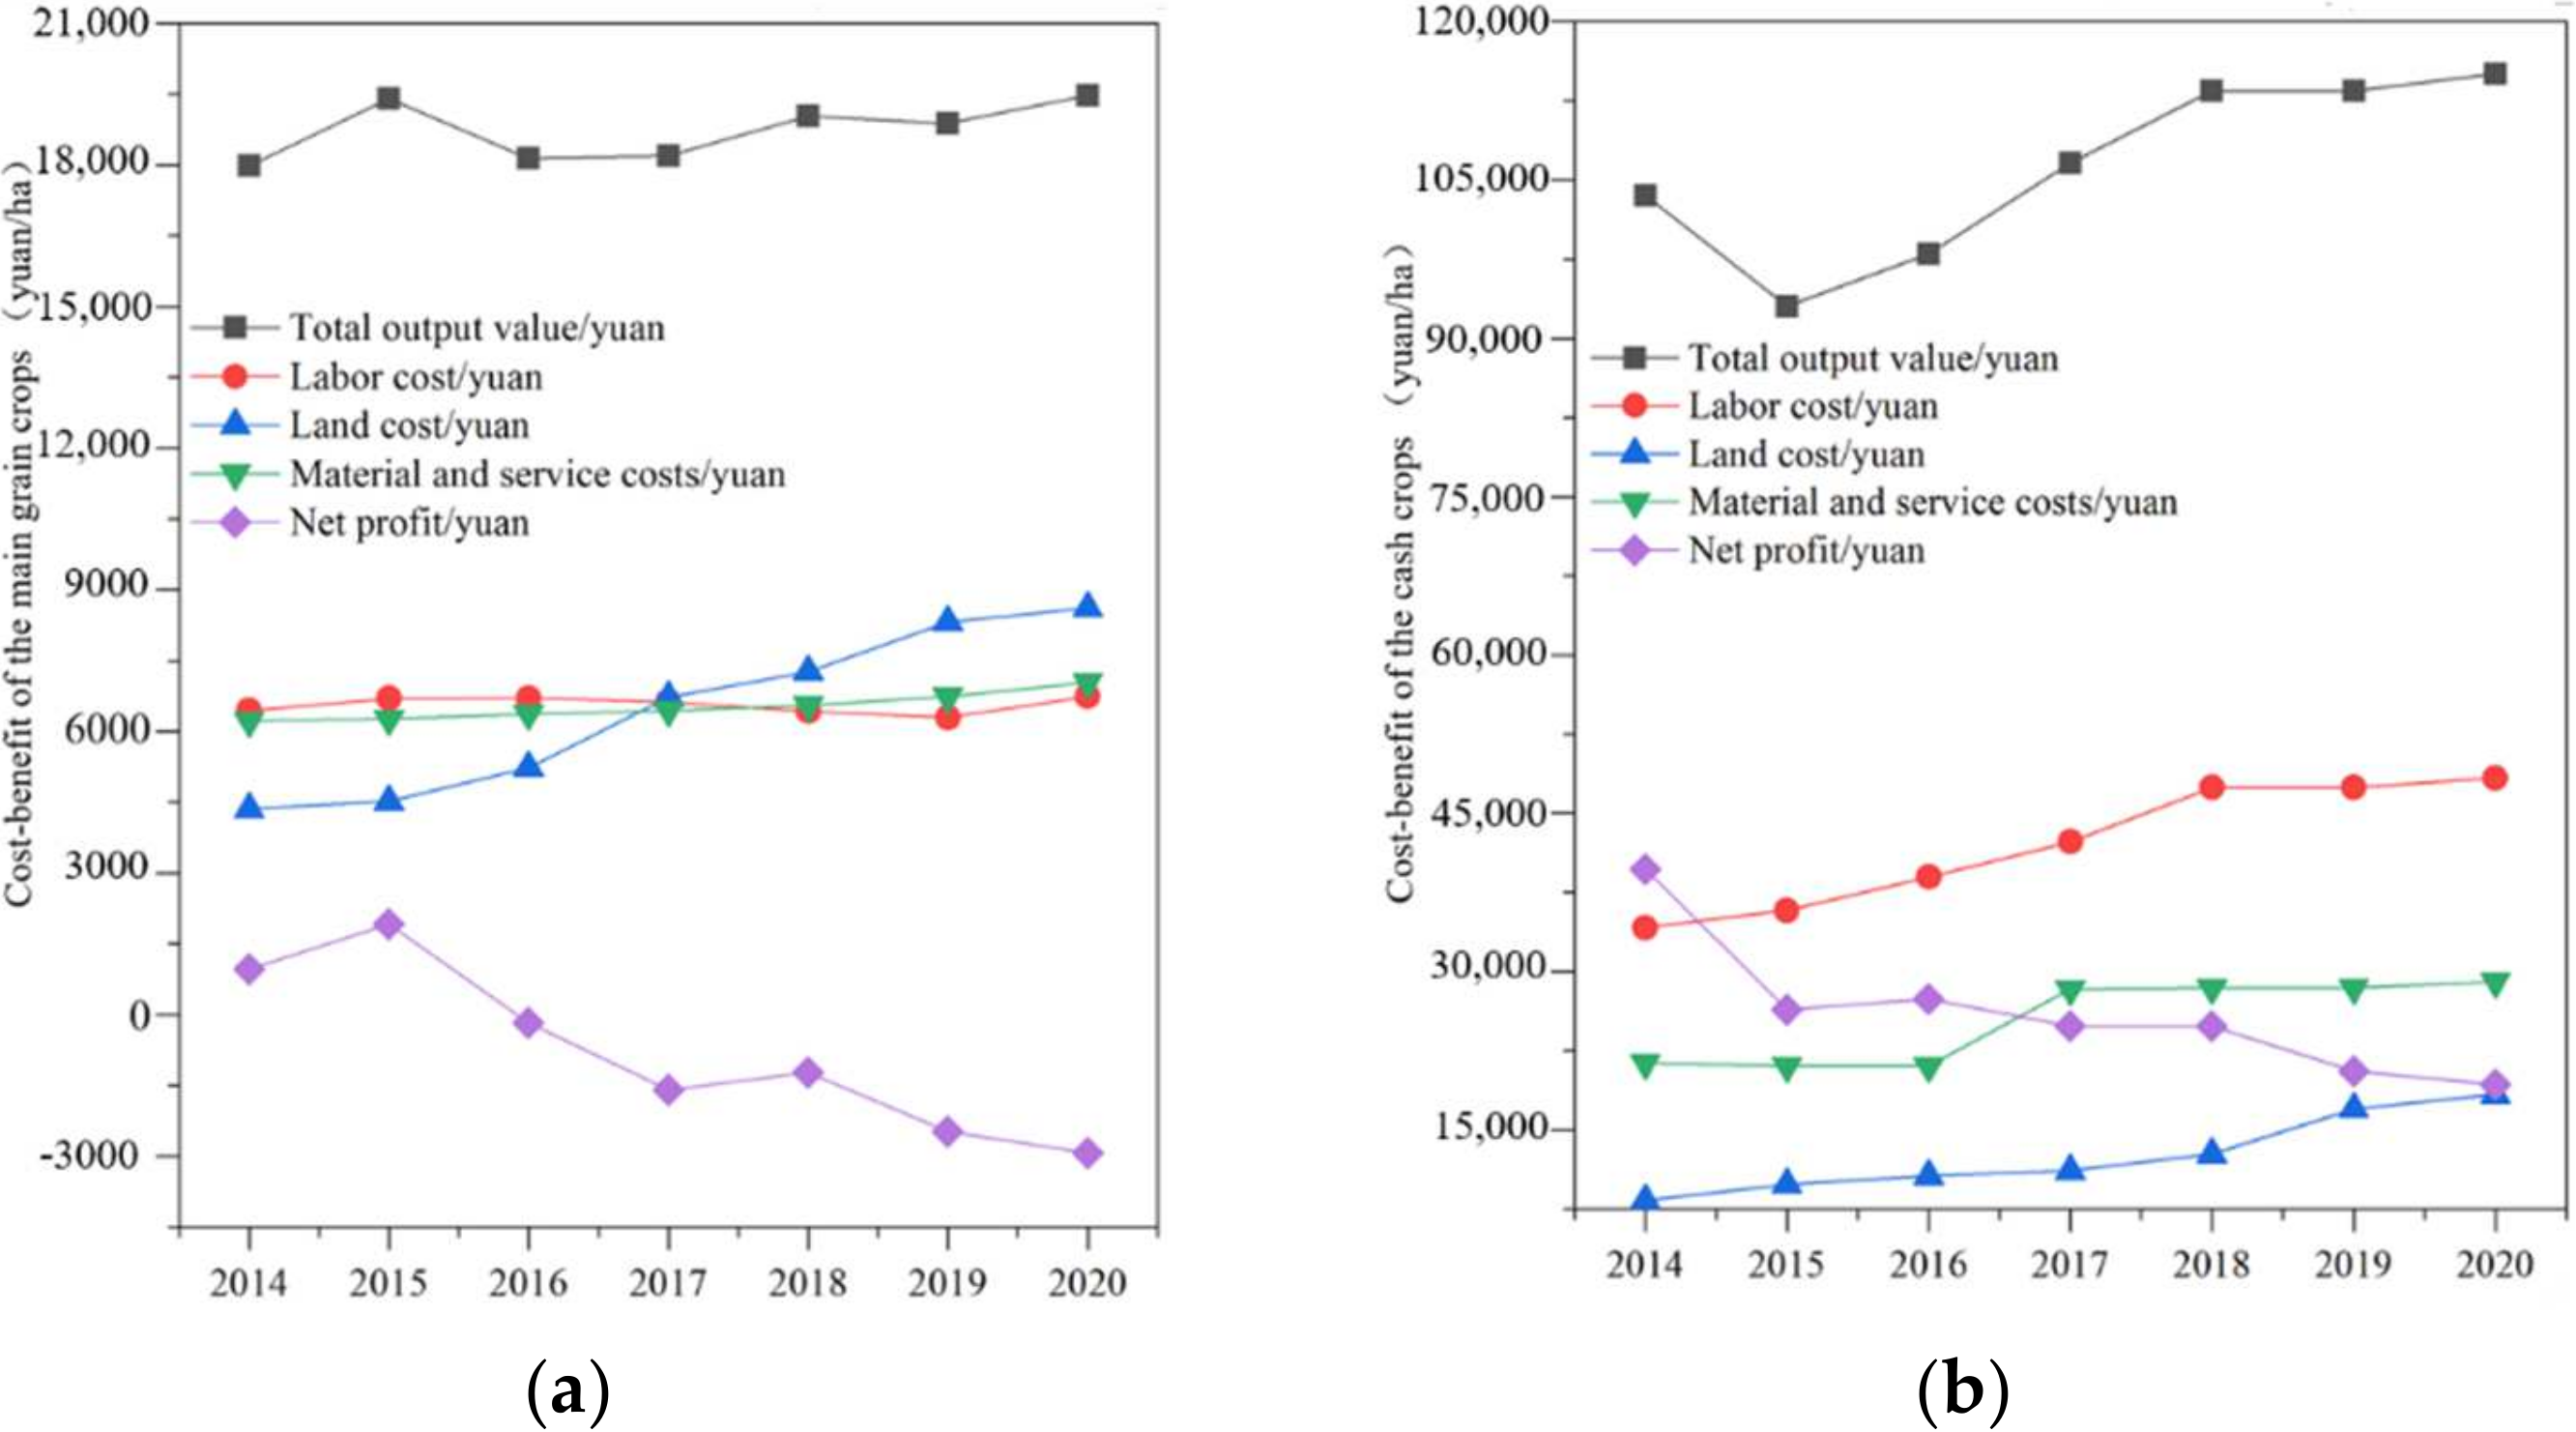
3.3. Cost–benefit of Farmland at Different Utilization Modes
4. Discussion
4.1. Fact of Overcapitalization of Farmland
4.2. Local Practices of Reducing the Operating Cost of the Land System
4.3. Research Limitations
5. Conclusions and Implications
Author Contributions
Funding
Informed Consent Statement
Data Availability Statement
Conflicts of Interest
References
- Xia, Q.; Chen, Y. Rural Household Income and Its Poverty Evolution in China. Consum. Econ. 2021, 37, 12–21. [Google Scholar]
- Wang, Y.; Li, X.; Lu, D.; Yan, J. Evaluating the Impact of Land Fragmentation on the Cost of Agricultural Operation in the Southwest Mountainous Areas of China. Land Use Policy 2020, 99, 105099. [Google Scholar] [CrossRef]
- Ruan, W. Organic connection between small farmers and modern agricultural development-empirical evidence, prominent contradictions and path choice. China Rural. Surv. 2019, 1, 15–32. [Google Scholar]
- Liu, J.; Jin, X. Influential Factors and Classification of Cultivated Land Fragmentation, and Implications for Future Land Consolidation: A Case Study of Jiangsu Province in Eastern China. Land Use Policy 2019, 88, 104185. [Google Scholar] [CrossRef]
- Zhang, S. Rural Land Circulation and Resource Integration and the Transformation of Land Value Driven by It. Ph.D. Thesis, Southwest University, Chongqing, China, 2014. [Google Scholar]
- Du, T.; Zhu, D. Spatial Differentiation and Formation Mechanism Analysis of Cultivated Land Transfer Price in Henan Province. J. Agric. Eng. 2016, 32, 9. [Google Scholar]
- Du, T.; Zhu, D. Study on the spatio-temporal evolution and macro-mechanism of land circulation price in China. Resour. Sci. 2018, 40, 2202–2212. [Google Scholar]
- Kung, J.K. Choice of Land Tenure in China: The Case of a County with Quasi-Private Property Rights. Econ. Dev. Cult. Change 2002, 50, 793–817. [Google Scholar] [CrossRef]
- Brandt, L.; Whiting, S.H. Changing Property-Rights Regimes: A Study of Rural Land Tenure in China. China Q. 2017, 232, 1026–1049. [Google Scholar] [CrossRef]
- Wang, Y.; Li, X. Land Titling Program and Farmland Rental Market Participation in China: Evidence from Pilot Provinces. Land Use Policy 2018, 74, 281–290. [Google Scholar] [CrossRef]
- Liu, Y.; Lu, H. Evolution trend and influence analysis of agricultural land cost in China. J. Jiangxi Univ. Financ. Econ. 2019, 2, 48–61. [Google Scholar] [CrossRef]
- Quan, S.; Hu, Y. On the Excessive Capitalization of Rural Land in China. Chinese Rural. Econ. 2018, 8, 2–18. [Google Scholar]
- Liu, Y.; Yan, B. Will Land Transfer Always Increase Technical Efficiency in China?—A Land Cost Perspective. Land Use Policy 2019, 82, 414–421. [Google Scholar] [CrossRef]
- Xu, Y.; Li, X. The Differentiation Characteristics and Influencing Factors of Farmland Scale Transfer Rent in China. J. Geogr. 2021, 76, 11. [Google Scholar]
- Wang, Y.; Liu, X. Spatiotemporal Changes in Chinese Land Circulation between 2003 and 2013. J. Geogr. Sci. 2018, 28, 707–724. [Google Scholar] [CrossRef] [Green Version]
- Du, T.; Zhu, D. Study on Cultivated Land Transfer Price in Gansu Province Based on Spatial Econometric Model. Resour. Environ. Arid. Areas 2018, 32, 7. [Google Scholar]
- Xu, N.; Zhang, L. Who Gets More Agricultural Subsidies—A Study Based on the Impact of Agricultural Subsidies on Land Rent. J. Harbin Inst. Technol. Soc. Sci. Ed. 2018, 20, 7. [Google Scholar]
- Wang, Q.; Dang, H. How Does Grain Price Affect Land Circulation Rent and Income Distribution?—Based on the Panel Data of Peasant Household Survey from 2013 to 2019. China Land Sci. 2021, 35, 10. [Google Scholar]
- Gao, J.; Song, G.; Sun, X. Does Labor Migration Affect Rural Land Transfer? Evidence from China. Land Use Policy 2020, 99, 99. [Google Scholar] [CrossRef]
- Huang, J.; Gao, L. The Effect of Off-Farm Employment on the Decisions of Households to Rent out and Rent in Cultivated Land in China. China Agric. Econ. Rev. 2012, 4, 5–17. [Google Scholar] [CrossRef]
- Pu, L. Research on the influence of farmers’ trust on land circulation and its price. Price Theory Pract. 2020, 3, 48–51. [Google Scholar]
- Luo, K.; Liu, Y. Research on bargaining power and influencing factors of both parties in China’s agricultural land leasing market—Data from China’s household tracking survey. China Land Sci. 2021, 35, 46–56. [Google Scholar]
- Li, Z.; Shi, D. The influence of relationship network on land transfer behavior and rent—an analysis based on the perspective of strong and weak relationship network. Agric. Technol. Econ. 2020, 7, 106–116. [Google Scholar]
- Xu, W.; Jin, X. Analysis of Influencing Factors of Cultivated Land Fragmentation Based on Hierarchical Linear Model: A Case Study of Jiangsu Province, China. Land Use Policy 2021, 101, 105119. [Google Scholar] [CrossRef]
- Song, J.; Jin, X. Analysis of the influencing factors of urban land price level and change in China. J. Geogr. 2011, 66, 1045–1054. [Google Scholar]
- Wang, S.; Lei, H. Research on the impact of rising land transfer cost on grain production—From the perspective of adjustment of planting structure, adjustment of crop quality and substitution of factors. China Agric. Resour. Zoning 2019, 40, 58–65. [Google Scholar]
- Liu, Y.; Zhou, Y. The influence of rent change of grain land on grain-growing behavior adjustment. J. South China Agric. Univ. Soc. Sci. Ed. 2021, 20, 85–96. [Google Scholar]
- Leng, Z.; Wang, Y.; Hou, X. Structural and Efficiency Effects of Land Transfers on Food Planting: A Comparative Perspective on North and South of China. Sustainability 2021, 13, 3327. [Google Scholar] [CrossRef]
- Wang, Y.; Li, X. The phenomenon of zero rent in the process of land transfer in mountainous areas and its explanation—from the perspective of transaction costs. Resour. Sci. 2019, 41, 1339–1349. [Google Scholar]
- Zhang, J.; Mishra, A.K. Factors Affecting Farmland Rental in Rural China: Evidence of Capitalization of Grain Subsidy Payments. Land Use Policy 2020, 90, 104275. [Google Scholar] [CrossRef]
- Xin, L.; Li, X. Rental Rates of Grain Land for Consolidated Plots and Their Determinants in Present-Day China. Land Use Policy 2019, 86, 421–426. [Google Scholar] [CrossRef]
- Huang, J.; Wang, X. Subsidies and Distortions in China’s Agriculture: Evidence from Producer-Level Data: Subsidies and Distortions in China’s Agriculture. Aust. J. Agric. Resour. Econ. 2011, 55, 53–71. [Google Scholar] [CrossRef] [Green Version]
- Qiu, S. Enlightenment of rural land fragmentation management and system reform—A practical exploration of “one household with one field” in Huaiyuan County, Anhui Province. West Forum 2017, 27, 30–36. [Google Scholar]
- Zhong, Z. Social Service: The Key to Agricultural Modernization with Chinese Characteristics in the New Era—Based on Theory and Policy. Political Econ. Rev. 2019, 10, 92–109. [Google Scholar]


| Variables | Definitions | Mean | S.D. | N |
|---|---|---|---|---|
| Farmland rent | Farmland rent per ha (CNY) | 10,500 | 10,849.8 | 3547 |
| Plot-level characteristics | ||||
| Plot area | Plot area, ha | 4.99 | 4.65 | 3547 |
| Years of land transfer | Years of land transfer, years | 20.78 | 14.28 | 3547 |
| Land right confirmation | Whether the land ownership and other rights are confirmed; yes = 1, no = 0 | 0.63 | 0.34 | 3547 |
| Type of land transfer | The method of land transfer: renting out = 1, other ways (exchange, subcontract, etc.) = 0 | 0.46 | 0.5 | 3547 |
| Type of land planting | Type of land planting: cash crop = 1, food crop = 0 | 0.16 | 0.36 | 3547 |
| Plain | Is it plain: yes = 1, no = 0 | 0.33 | 0.47 | 3547 |
| Paddy field | Is the land type a paddy field: yes = 1, no = 0 | 0.25 | 0.43 | 3547 |
| Irrigable land | Is the land type an irrigable land: yes = 1, no = 0 | 0.25 | 0.43 | 3547 |
| Dry land | Is the land type a dry land: yes = 1, no = 0 | 0.25 | 0.43 | 3547 |
| Regional level characteristics | ||||
| per capita GDP | Gross domestic product per capita | 56,255 | 18,864 | 183 |
| Ratio of mountains | Ratio of mountainous area in the counties | 0.36 | 0.33 | 183 |
| Variables | Model 1 Zero Model | Model 2 Non-Null Model | Model 3 Fixed-Effect Model | Model 4 Random-Effect Model |
|---|---|---|---|---|
| Plot-level characteristics | ||||
| Plot area | 0.322 *** | 0.541 *** | 0.421 *** | |
| (3.13) | (5.53) | (3.89) | ||
| Plot area^2 | 0.007 | 0.024 *** | 0.023 | |
| (−0.73) | (−2.73) | (−1.43) | ||
| Year of land transfer | 0.051 *** | 0.067 *** | 0.055 *** | |
| (8.34) | (9.23) | (5.93) | ||
| Years of land transfer^2 | −0.001 *** | −0.001 *** | −0.001 *** | |
| (−5.24) | (−6.94) | (−3.54) | ||
| Land right confirmation | 0.243 *** | 0.311 *** | 0.282 *** | |
| (3.29) | (3.31) | (3.89) | ||
| Types of land transfer | 0.543 *** | 0.645 *** | 0.554 *** | |
| (10.43) | (11.23) | (9.23) | ||
| Types of land planting | 0.164 ** | 0.178 ** | 0.163 *** | |
| (2.32) | (2.34) | (2.32) | ||
| Plain | 0.385 *** | 0.923 *** | ||
| (9.43) | (4.88) | |||
| Paddy field | 0.463 *** | 0.792 *** | ||
| (3.13) | (4.13) | |||
| Irrigated land | 0.265 *** | 0.462 *** | ||
| (3.43) | (3.83) | |||
| Dry land | 0.102 ** | 0.284 ** | ||
| (2.12) | (2.32) | |||
| Regional characteristics | ||||
| Log (per capita GDP) | 0.323 *** | 0.321 *** | 0.722 *** | |
| (4.23) | (4.53) | (4.12) | ||
| Ratio of mountains | −0.242 | −0.241 | −0.244 | |
| (−1.11) | (−1.21) | (−1.21) | ||
| Regional dummies | Yes | Yes | Yes | |
| Year dummies | Yes | Yes | Yes | |
| Constant | 5.973 *** | 7.354 *** | 5.311 *** | 8.221 *** |
| (80.52) | (29.67) | (7.43) | (34.33) | |
| 0.431 | 0.973 | |||
| 1.189 | 0.984 | 0.984 | ||
| Rho | 0.113 | 0.495 | ||
| R2_within | 0.311 | 0.243 | ||
| Number of samples | 3547 | 3547 | 3547 | 3547 |
Publisher’s Note: MDPI stays neutral with regard to jurisdictional claims in published maps and institutional affiliations. |
© 2022 by the authors. Licensee MDPI, Basel, Switzerland. This article is an open access article distributed under the terms and conditions of the Creative Commons Attribution (CC BY) license (https://creativecommons.org/licenses/by/4.0/).
Share and Cite
Yang, A.; Wang, Y. Spatiotemporal Variations in Farmland Rents and Its Drivers in Rural China: Evidence from Plot-Level Transactions. Land 2022, 11, 229. https://doi.org/10.3390/land11020229
Yang A, Wang Y. Spatiotemporal Variations in Farmland Rents and Its Drivers in Rural China: Evidence from Plot-Level Transactions. Land. 2022; 11(2):229. https://doi.org/10.3390/land11020229
Chicago/Turabian StyleYang, Aoxi, and Yahui Wang. 2022. "Spatiotemporal Variations in Farmland Rents and Its Drivers in Rural China: Evidence from Plot-Level Transactions" Land 11, no. 2: 229. https://doi.org/10.3390/land11020229