Abstract
As a national strategy, the development of the Yangtze River Economic Belt (YREB) and the ecological protection and high-quality development (HQD) of the Yellow River Basin (YRB) are of great significance for promoting the HQD of the regional economy. Based on the panel data in the YRB and the YREB from 2006 to 2019, this paper constructed an evaluation index system of HQD with five dimensions of “innovation development, coordination development, green development, openness development, and sharing development”, and we used the entropy weight method, kernel density method, and Tobit panel model to analyze the differences in the HQD and the similarities and differences of the influencing factors between the two regions. The research findings were as follows: (1) The HQD of the YRB and the YREB was consistent with the national trend, showing a fluctuating upward trend. The HQD of the YRB was always lower than that of the YREB. The kernel density curves in both regions had a rightward trailing pattern, with polarization and unbalanced development. (2) From the perspective of the spatial distribution pattern, the HQD of the YRB presented a spatial distribution characteristic of “high at both ends and low in the middle”. In contrast, the HQD of the YREB maintained the characteristic of “high in the east and low in the west”. (3) The level of human capital, the level of foreign direct investment, and the economic scale played a significant positive role in improving the HQD of the YRB. The level of human capital, urbanization, foreign direct investment, and economic scale significantly improved the HQD of the YREB.
1. Introduction
The river basin is the birthplace of human civilization, and the major river basins worldwide bear and witness the vast history of the evolution and development of the human economic division of labor. The current global environmental changes and economic integration profoundly impact the relationship between the opening up of river basin economic systems and sustainable development. In modern economic growth, a developed river basin economy is an essential component of the regional system for developing national economic activities [1]. The river basin is an open system with complex natural geography, and the river basin economic system is an economic regional system with external open boundaries and complex internal interactions. In other words, the river basin economy is a regional economy with unique spatial attributes [2]. From the experience of international river basin economic development, many countries or regions are facing similar economic regional development differences and challenges. The research on the river basin economy can be divided into several aspects. Some scholars study the river basin economy from the perspective of ecosystem evolution [3], mainly focusing on water environment governance [4] and water carrying capacity [5]. More research focuses on the coordinated development of river basin ecosystems and economic development [6], and the high-quality development (HQD) of the river basin economy is considered the key to promoting the coupling and coordination of the ecological economy [7]. Especially under the Sustainable Development Goals, high-quality economic development has become a meaningful way to promote economic transformation and ecological protection. From this, the HQD of a river basin is related to a country’s overall coordinated regional development.
As the two mother rivers of China, the Yellow River Basin (YRB) and the Yangtze River Economic Belt (YREB) span the eastern, central, and western regions with unique geographical advantages and great potential for development. There are differences between the YRB and the YREB regarding resource elements, economic level, human resource level, and environmental capacity. The regional economy shows robust segmentation and diversity [6]. As the HQD of the YRB and the YREB have been listed as a major national strategy, the two river basins are also considered China’s necessary river-based economic and ecological protection belt, which is essential for China to promote HQD construction. Therefore, the YRB and the YREB have distinct north–south regional characteristics and representation, which is an excellent case for studying regional differences. The economic development gap between the YRB and YREB has widened in the past two decades. The GDP of the YRB has been consistently lower than that of the YREB. In addition, the YRB and the YREB have different characteristics regarding natural resource endowment, the ecological environment, and the technological level. The YREB has a good foundation for economic development, mature ecological civilization construction, and a rich resource endowment. The HQD of the YREB has achieved specific results. However, the HQD in the YRB started relatively late, and the quality still needs further improvement. The purpose of the HQD in the YRB is to break through the challenging constraints of the environment and achieve the strategic goal of poverty alleviation [8]. However, the YRB also faces problems such as water shortage, ecological frangibility, and insufficient livelihood protection [9].
China has put forward a series of policies to promote the sustainable development of river basins and narrow the gap between the two major river basins. In the 1990s, the YREB was first included in a primary national development strategy. A strategic concept of “developing the economy of the Yangtze River Delta and the regions along the Yangtze River” was proposed at the national level. In June 2011, the “National Main Functional Area Plan” was officially released. The plan clearly states that the YREB has become vital in promoting the formation of primary functional areas and striving to build the “three strategic patterns” of land space [10]. In the past decade, China has successfully issued several policies, such as the Guiding Opinions on Promoting the Development of the Yangtze River Economic Belt by Relying on the Golden Waterway and the Outline of the Yangtze River Economic Belt Development Plan. These policies aim to promote the HQD of the YREB [11]. In September 2019, the symposium on the ecological protection and HQD in the YRB proposed that the ecological protection and HQD in the YRB should be elevated to a major national strategy [12]. The above policies indicate that the two major river basins have become essential pillars for the HQD of China’s economy.
As a regional economic complex system, the watershed economy has unique strategic value for regions and countries in world economic development [13]. The essence of HQD is an increase in economic development, which includes various aspects such as financial and social development, human resource improvement, and social well-being [14]. Therefore, this paper constructed a theoretical framework based on the general theoretical connotation of the HQD in river basins and the practical characteristics of the HQD in the new era. In the river basin economic development process, the contradiction between traditional industrialization, urbanization, and resource environment is the main obstacle that restricts the HQD of river basins [15]. Achieving green development under the balance of the development paradox of the environment and economy and resolving the contradictions and conflicts between resources, the environment, and human land relations are vital to achieving high-quality river basin economy development. For large watershed economies with relatively loose economic and geographical ties, the key to HQD is integrating regional differences brought about by the boundaries of administrative regions [16]. Through overall planning and coordination, we can continuously promote the integration and aggregation of elements within the river basin and achieve the open development of the entire river basin, increasing the radiation diffusion effect in the growth pole areas within the river basin and solving the problem of inadequate and unbalanced coordinated development of the whole river basin [17]. Therefore, from the perspective of new development concepts, this paper constructed an indicator system to measure the HQD of the YREB and YRB and analyzed the spatiotemporal difference, spatial distribution, and influencing factors of the HQD in the two regions. According to the empirical results, this paper proposes recommendations to promote the HQD in the two regions. The conclusions of this paper have theoretical and practical significance in promoting the HQD of the two major river basins by the country. The results also provide policy recommendations for addressing international watershed conservation and sustainable development issues and achieving the HQD of watershed economies.
The possible marginal contributions of this paper are as follows. First, previous scholars in the division of research areas usually focused on fixed research areas, often staying at excavating the surface of the phenomenon while ignoring the similarities and differences between watersheds. The research on HQD also needs to start from the perspective of coordinated regional economic development, consider regional heterogeneity, and compare and analyze each region’s economic development status and resource endowment. Therefore, this paper compared and analyzed the differences in the HQD status between the YRB and the YREB, explored the HQD path of the river basin, and formulated reasonable HQD policies for different regions. Second, previous studies mainly focused on the national or provincial level, measuring cross-sectional or short-term HQD, lacking the measurement and spatial analysis of watershed and city-level data. This paper constructed a more-comprehensive indicator system of HQD based on prefecture-level city data. Third, in terms of indicator selection, many scholars have considered the selection of indicators from the perspectives of economic development level, industrial structure level, and economic development speed. However, there is little research on the indicators reflecting improving people’s living standards regarding whether the development quality can meet their living needs. Because of the multi-dimensional nature of HQD, this paper used the entropy weight method to calculate and analyze HQD. Then, this paper used a nonparametric estimation of kernel density estimation to study the overall distribution and dynamic evolution trend of HQD. The Tobit panel model was used to explore the factors that affect the level of HQD. The in-depth discussion of this issue will help provide a reference for scientific interpretation of the HQD of China’s two major river basins in the new era and a reference for developing countries to promote HQD through development collaboration between river basins.
The structure of the paper is as follows. The second part is the literature review. The third part is the materials and methods, which mainly introduces the study area, the data source, the HQD index system, the empirical model setting, and the variable selection. The fourth part reports the empirical results. The fifth part is the discussion. The sixth part is the conclusion and policy recommendations.
2. Literature Review
HQD is a new concept proposed at the 19th National Congress of the Communist Party of China. It is a major judgment based on the current situation and problems encountered in China’s economic development, reflecting the basic demands and directions of China’s economic development in the future. There is no concept of HQD in countries other than China, but scholars put forward the concept of “quality of economic growth” [18,19,20], and green total factor productivity is often used to measure the quality of economic growth in research [21]. Many scholars have conducted in-depth interpretations and analyses of the connotation and definition of HQD. HQD refers to the overall socio-economic development reaching an endogenous, ecological, and sustainable development state [22]. HQD is driven by innovation to achieve stable economic growth [23]. Some scholars believe that HQD refers to the fact that economic development does not simply pursue quantitative expansion, but achieves simultaneous improvement in quantity and quality [7]. Therefore, HQD is measured in terms of growth stability, environmental sustainability, and social well-being [24], reflected in the economy’s vitality and creativity and the unified development of the economy and the ecosystem [25]. HQD aims to promote good interaction and unified development among the economy, society, and ecosystem [26]. This paper believes sharing, openness, coordination, innovation, and green development are essential for HQD.
There are two main methods for measuring HQD. One is based on a single indicator, and the other is based on a comprehensive indicator system. The most-usual method among single indicators is to use TFP to characterize the level of economic development [21,27]. Its advantages are simple and clear, but it has difficulty reflecting the multi-dimensional characteristics of HQD. Some scholars believe that the rate of added value is closely related to the quality of economic growth [28,29]. Some scholars use real per capita GDP to characterize HQD [30,31,32]. In addition, some scholars use indicators such as investment efficiency and labor productivity growth to measure HQD [33,34]. Many scholars have proposed indicators of green/ecological TFP based on the concept of TFP [35,36]. There is no unified indicator evaluation system to measure the comprehensive index of HQD.
The existing research has mostly constructed an evaluation index system based on the new development concept of “innovation, coordination, green, openness, and sharing” [37,38]. Hong et al. [16] measured the national economic index of HQD and found that the overall index was not high, but showed an upward trend. Li et al. [39] believed that the development of the YRB should follow the strategic thinking of “jointly focusing on major protection and promoting major governance” and build a strategic support system from the five aspects of effectiveness, coordination, innovation, stability, and sharing. Many scholars have conducted a comparative analysis of the YRB and the YREB from different perspectives. Yang and Zhang [40] compared the ecological TFP in the YRB and the YREB. Fang et al. [41] studied the main factors affecting ecosystem services in the two regions. Yang and Xu [42] analyzed the green efficiency of water resources in two major river basins. The HQD of the river basins is systematic and holistic, so promoting the HQD of river basins must deepen the implementation of “innovation, coordination, green, openness, and sharing” [25,43,44]. Geng et al. [45] believed that promoting high-quality river basin development should take ecological environment protection as the premise and new development concepts as the guidance further to build a sound legal system and other support systems. Xiong et al. [46] pointed out that it is necessary to actively adjust the industrial structure, increase protection efforts for areas with important ecological functions, and strengthen the water conservancy infrastructure system.
Scholars have conducted research on the HQD of river basins from different perspectives. In the study of high-quality development in the YRB, Xin and Liu [47] believed that the HQD in the YRB requires strict ecological comprehensive management, strengthening regional division of labor, promoting transportation infrastructure construction, and enhancing technological innovation capabilities. Li et al. [48] explored the impact of industrial development on the ecological environment of the YRB and proposed the need to handle the relationship between the industrial development layout and the carrying capacity of river basin resources and the environment, to promote HQD. In a study of the HQD in the YREB, Zha et al. [49] pointed out that specialized industrial agglomeration plays a vital role in promoting the quality of economic development. Tang [50] believed that the digital economy has a spatial diffusion effect on the HQD of tourism in the YREB.
The existing research provides an essential theoretical basis for this paper, but some shortcomings need further in-depth analysis. First, the existing literature mainly focuses on the YRB or the YREB, lacking comparative analyses between different river basins. The empirical research on the two major watersheds lacks a comparative analysis perspective, which can mask the differences between cities in the watersheds and cannot identify the heterogeneous effects of different external factors. Second, existing research has conducted many explorations in measuring HQD. However, the theoretical basis for constructing HQD is still incomplete. In addition, most of the existing research is qualitative and less quantitative. Third, many scholars focus on economic development, industrial structure, and green development in indicator selection. There is a lack of attention to whether the development quality can meet people’s living needs, and few relevant indicators reflect the improvement of people’s livelihood. Third, the existing research mainly measures HQD based on the panel data of the province and lacks the construction of the evaluation index system of HQD based on the prefecture level. Therefore, this paper attempted to break through the stereotyped thinking of the inherent research area and take the YRB and the YREB as the research objects for comparative research. This paper constructed an evaluation index system with five dimensions of “innovation, coordination, green, openness, and sharing” development and measured the HQD of 78 prefecture-level cities in the YRB and 108 prefecture-level cities in the YREB from 2006 to 2019. This paper used the entropy and kernel density methods to analyze the level of HQD from the time scale and regional distribution. This paper used the Tobit panel model to identify the impact of different external factors on the HQD of the two regions and identify the existing problems and weaknesses. Finally, we summarize the main conclusions of this paper and propose targeted policy implications.
3. Materials and Methods
3.1. The Study Area
The YRB flows through 9 provinces, Qinghai, Sichuan, Gansu, Ningxia, Inner Mongolia, Shanxi, Shanxi, Henan, and Shandong, making it the second-largest river in China (Figure 1). The YRB plays a crucial strategic role in the national economic and social development and ecological civilization construction pattern. However, the natural ecology of the YRB is fragile; the water resources are scarce; there are significant regional differences in resource endowments such as land, energy, minerals, and biology. At present, the overall economic and social development of the YRB is lagging, making it a key and complex region for ecological security and economic and social development in China. The YRB spans three natural landmarks in the eastern, central, and northwestern regions of China, with significant differences in natural ecological environment endowment and economic development among each region.

Figure 1.
Map of the study area.
The YREB covers 11 provinces and cities. Its spatial and temporal differences are large, with 21% of China’s land carrying 42.8% of China’s total population and creating 41.5% of China’s GDP [39]. In addition, the carrying capacity of the resources and environment and the suitability of land development in the YREB differ significantly in space. However, the increasing density of economic activities in the YREB has led to increasingly prominent ecological problems in the surrounding areas, for example environmental pollution, resource scarcity, and frequent environmental accidents between the upstream and downstream. Promoting the development of the YREB is a major regional development strategy in China. The study area is shown in Figure 1.
3.2. Data Source
This paper took 108 prefecture-level cities in the YREB and 78 prefecture-level cities in the YRB as the research objects, and the research period was from 2006 to 2019. The data were from the China Statistical Yearbook, China Urban Statistical Yearbook, China Environmental Statistical Yearbook, and the statistical yearbooks of provinces and cities. The missing values in individual years were supplemented by interpolation.
3.3. The High-Quality Development Index System
3.3.1. Index System Construction
The evaluation of HQD in existing studies usually involved two types. One is to use ecological efficiency, total factor productivity, labor productivity, and other indicators for alternative measurement, and the other is that scholars build a comprehensive evaluation index system according to the research objectives [21,40]. Regarding comprehensive indicator measurement, some scholars have constructed a system framework from the perspective of ecological carrying capacity, including three primary indicators of ecological environment, ecological society, and ecological economy and twelve basic indicators [51]. Based on the dynamic and long-term perspective, Yuan et al. [52] built a high-quality urban economic development evaluation index system of five secondary indicators, including initial condition, development efficiency, and development results, according to the different stages of urban development. The new development concept of innovation, coordination, green, openness, and sharing is an in-depth understanding of economic development laws and a vital evaluation standard for measuring HQD [43]. Therefore, this paper constructed indicators for measurement based on the new development concept, which is more comprehensive than previous single indicators and a supplement to comprehensive indicators.
Innovation solves the problem of development dynamics. The essence of innovation is to release new demand and create new supply by improving the productivity of labor, capital, and land, by transforming the economic growth mode, improving economic growth’s supply side, and ultimately promoting HQD [53]. The HQD of the river basin needs the support of industrial modernization and transformation. Relying on technological innovation can achieve green change in energy- and resource-intensive industries [54].
Coordination is the essence of sustainable development, and its purpose is to fundamentally address the imbalance and inadequacy of development and improve the overall level of development [25]. The connotation of coordination in the process of the HQD of the river basin aims to transform the gradually increasing gaps between the upstream, middle, and downstream, to build a development system with complementary advantages upstream, midstream, and downstream.
Green development emphasizes the sustainable development of humans and ecosystems, abandoning the traditional way of pollution first and then governance. According to the theory that green waters and green mountains are golden and silver mountains, the unity of environmental and social benefits can be achieved [38]. Ecological protection is a prerequisite for the HQD of river basins. Therefore, ecological protection and governance force watershed development to follow the core concept of green development.
Opening up and developing are the only ways for a region to prosper. Open development requires making full use of the open economy, seizing opportunities for internationalization, giving full play to internal and external resources, developing internal and external markets, and reaping the dividends of globalization [55]. At the same time, high-quality opening up, in addition to economic development, also has world identity and cultural self-confidence driven by cultural prosperity.
Being “people-oriented” is the core of sharing. Only by attributing the results of development to the people can we maximize the people’s enthusiasm for joint discussion and construction [56]. Overall, the overall development status of the YRB is relatively lagging, with many poor people. We must improve people’s living standards and ensure the orderly development of the upstream, middle, and downstream regions.
This paper took 108 prefecture-level cities in the YREB and 78 prefecture-level cities in the YRB as the research objects, and the research period was from 2006 to 2019. Referring to the indicator system constructed by relevant scholars [10,54], this paper established an indicator system of HQD that included five dimensions and 18 indicators, as shown in Table 1.

Table 1.
High-quality development evaluation index system.
3.3.2. Calculation of High-Quality Development
The entropy weight method is an evaluation method that calculates the weight of indicators through the internal relationship of objective values, which can reduce the adverse impact of subjective bias on the evaluation results to a certain extent [57]. This paper drew on existing research [51,58] and used the entropy weight method to evaluate HQD, and the specific steps were as follows.
First, considering that different dimensions of indicators can lead to significant errors, this paper used the threshold method to perform dimensionless processing on the data. The positive index was , and the negative index was , where is the index value of the original data and is the standardized index value. Then, it calculated the contribution of the evaluation object under the index with the formula . Next, it calculated the entropy value with the formula , where . Later, it calculated the weight of the indicator with the formula . Lastly, it calculated the index of the evaluation object with the formula .
3.3.3. Kernel Density Estimation Method
This paper used a nonparametric kernel density estimation method to study the overall distribution and dynamic evolution trend of the HQD in the YRB and the YREB. Unlike parametric model estimation, kernel density estimation uses the characteristics and properties of the data themselves without relying on existing experience with the data distribution, thereby avoiding the subjectivity of functional form settings [59,60,61]. The specific formula is as follows.
where n is the number of observations, is the mean value, is the kernel function, and h is the smoothing parameter.
3.4. Empirical Model Setting
The HQD of the YRB and the YREB measured by the entropy weight method in this paper was between 0 and 1, which belongs to the “restricted explained variable”. Using the least-squares method (OLS) will lead to inconsistent estimates. Therefore, this paper used the Tobit model for empirical analysis. The model settings were as follows:
where HQDit represents the HQD of the ith region, LnHUM, URB, FDI, LnGDP, and IND are the factors that affect the HQD to be verified in this paper, i represents the region, t represents time, and is a random perturbation term.
3.5. Variable Selection and Descriptive Statistics
3.5.1. Explained Variable
The explanatory variable in this paper was the level of HQD. The level of HQD was between 0 and 1, and when the value approaches 0, the HQD level in the region worsens. When the value approaches 1, the higher the degree of HQD in the region is. For the selection and calculation method of HQD indicators, please refer to Section 3.3.1 and Section 3.3.2 for details.
3.5.2. Explanatory Variables
This paper refers to existing literature research [62,63] and selected the following explanatory variables: (1) Human capital (HUM). As a special factor of production, human capital can be combined with technological innovation and institutional innovation to affect HQD. Human capital can be measured in terms of years of education or the proportion of people in higher education. This paper measured human capital by the number of students enrolled in regular institutions of higher learning per 10,000 people. (2) Urbanization level (URB). The factors of the agglomeration effect and spatial spillover effect generated during urbanization are conducive to reducing production costs and promoting HQD. This paper measured the urbanization level by the proportion of urban residents in the total population. (3) Foreign direct investment (FDI). This paper used the proportion of foreign investment of the regional GDP. (4) Economic scale (GDP). The level of economic development is the material foundation for HQD in a region. As long as people’s material requirements are met, they will consider the harmonious development of humans and ecological nature. This paper measured the economic scale by using the GDP. (5) Industrialization level (IND). The industrial structure reflects the development of advanced industries and the level of social services. Only when the level of social services reaches a certain level can HQD be reflected. This paper measured the industrialization level by the ratio of the output value of the secondary industry to the GDP. Table 2 lists the descriptive statistical analysis of each variable.
Table 2.
Descriptive statistics.
4. Empirical Results
4.1. Differences in High-Quality Development
4.1.1. Timing Differences in High-Quality Development
Figure 2 and Table 3 show the changing trend of the HQD in the YRB, the YREB, and the whole country from 2006 to 2019. Overall, the HQD of the YRB and the YREB was consistent with the national trend, showing a trend of fluctuating growth. The HQD of the YRB was always lower than that of the YREB, which was consistent with the economic development level of the two river basins. From 2006 to 2010, the HQD of the YRB decreased from 0.147 to 0.128, and the HQD of the YREB decreased from 0.157 to 0.140. During the “11th Five Year Plan” period, due to the impact of the extensive economic development model of high consumption, high pollution, and high emissions, the overall level of HQD in China showed a downward trend. At the regional level, the HQD of the YREB was at the same level as the national level at the initial stage. However, it exceeded the national level at the later stage, and the gap showed a growth trend. There was a significant decline in 2006–2012 and a strong rebound in 2013–2019. From 2006 to 2012, China’s economy was rapidly growing, and various regions attached greater importance to the GDP than environmental quality and public services. After 2012, China’s economy entered a new normal. The 18th National Congress of the Communist Party of China proposed building a new system for modern industrial development and vigorously promoting the construction of ecological civilization, which are conducive to improving the HQD of the YREB. The HQD of the YRB has always been lower than the national level, and the gap has narrowed. The HQD of the YRB showed a downward trend from 2006 to 2010, while the HQD of the YRB was only 0.127 in 2010. After 2011, it showed an upward trend. The provinces and cities in the YRB have gradually changed their focus on economic development while ignoring environmental protection, improving the overall level of HQD. In 2019, the HQD of the YRB increased to 0.149, a significant increase.
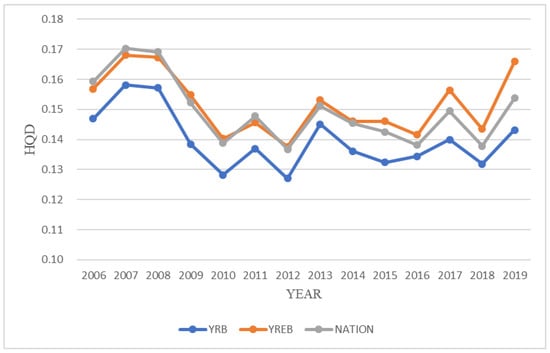
Figure 2.
Trends in high-quality development in the Yellow River Basin, the Yangtze River Economic Belt, and the country from 2006 to 2019.
Table 3.
High-quality development of the Yellow River Basin and the Yangtze River Economic Belt from 2004 to 2019.
4.1.2. Kernel Density Analysis of High-Quality Development Levels
To further analyze the HQD in the YRB and the YREB, this paper used kernel density estimation to explore the dynamic evolution of HQD. This paper selected cross-sectional data from 2006, 2009, 2012, 2015, 2018, and 2019 and conducted nonparametric estimation to reflect the temporal variation and trend of HQD. The dynamic evolution characteristics of the HQD in the YRB are shown in Figure 3. From the perspective of the evolution of the distribution position of the kernel density curve, the peak value of the kernel density curve from 2006 to 2019 moved first to the left and then to the right. This result indicated that the HQD of the YRB decreased during the observation period, but the overall trend was increasing. The width of the kernel density curve narrowed first and then widened. The results showed that the absolute difference in the level of HQD gradually widened after experiencing a slight reduction. Regarding the curve polarization trend, the kernel density curve gradually evolved from a “double peak” distribution to a “single peak” distribution. The curve polarization trend indicated that the HQD of the YRB illustrated a significant polarization feature, but this polarization characteristic weakened over time. Regarding curve extensibility, the kernel density curve presented a right-trailing characteristic, indicating an uneven development of HQD in the YRB.
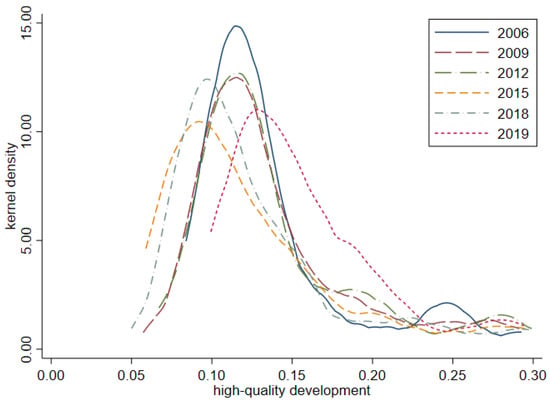
Figure 3.
Kernel density of the Yellow River Basin.
The dynamic evolution characteristics of HQD in the YREB are shown in Figure 4. Regarding the movement of the peak center position of the kernel density curve, the kernel density curve gradually moved to the right, showing that the overall level of HQD has improved. The increasing width of the density curve indicated that the absolute difference in HQD was gradually widening. From the perspective of the current evolution of wave peaks, 2006–2012 showed prominent “double peak” characteristics, and 2015–2019 showed “single peak” characteristics. The characteristics of peak evolution indicated that the overall level of HQD exhibited a polarization trend over time. Regarding curve extensibility, the kernel density curve had a rightward-trailing pattern, indicating that many areas within the YREB were far above the average level of HQD. Overall, the fluctuation and differentiation characteristics of the HQD of the YREB were better than those of the YRB. The two regions should focus on improving overall HQD and consider regional coordination and balanced development.
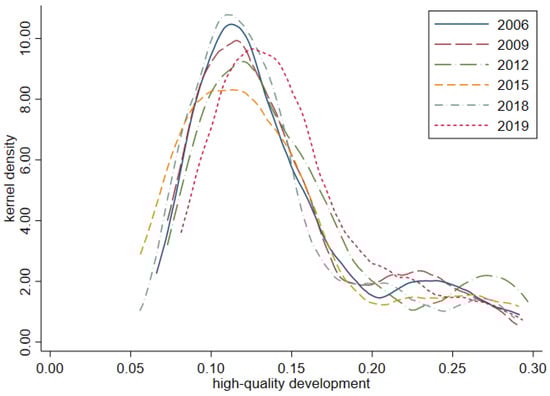
Figure 4.
Kernel density of the Yangtze River Economic Belt.
4.1.3. Spatial Pattern Evolution and Evolution Characteristics of High-Quality Development
To further explore the spatial pattern evolution of HQD, the natural breakpoint classification method was used to divide the HQD of the YRB region and the YREB region into four regions: low-level, medium-level, medium-high-level, and high-level. To better reflect the spatial distribution rules of changes in HQD, the ArcGIS 10.8 software was used to conduct spatial visualization analysis based on the years 2006, 2010, 2015, and 2019. The specific results are shown in Figure 5 and Figure 6.
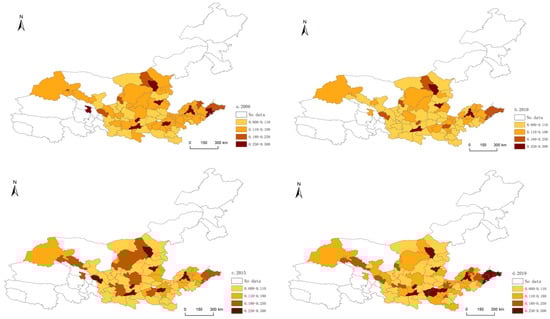
Figure 5.
Evolution of spatial distribution pattern of high-quality development level in the Yellow River Basin in 2006, 2010, 2015, and 2019.
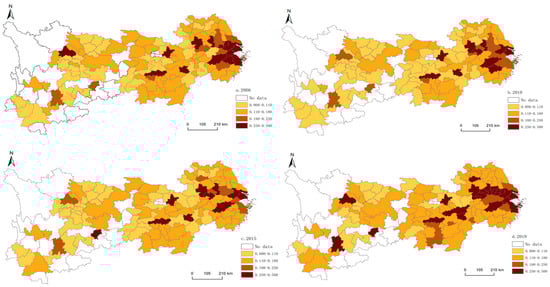
Figure 6.
Evolution of the spatial distribution pattern of high-quality development in the Yangtze River Economic Belt in 2006, 2010, 2015, and 2019.
As can be seen from Figure 5, the HQD of the YRB has maintained the spatial distribution characteristics of “high at both ends and low in the middle” during the past 14 years. In 2006, eight high-level cities were scattered in the middle and lower reaches of the YRB, including Xi’an, Lanzhou, and Chengdu. There was a total of six medium- and high-level cities, mainly scattered in the coastal areas of the YRB and the surrounding areas of Gansu. Low-level cities were dotted in the middle and lower reaches of the YRB. In 2006 and 2010, the spatial distribution pattern of HQD in the YRB changed relatively little, and the number of high-level cities remained unchanged. In 2010, the spatial distribution pattern of the HQD in the YRB changed significantly, with a significant increase in medium- and high-level cities concentrated in the upper and middle reaches. In 2019, cities at all four levels increased by varying degrees. The number of high-level cities rose to 11, concentrated in the Shandong and Henan regions, while the rest were scattered in the middle and lower reaches of the YRB. The overall HQD of the upstream region was relatively low. On the one hand, the resource and environmental carrying capacity limited the transformation and upgrading of the coal chemical industry and the development of the new energy industry; on the other hand, the lack of cutting-edge human capital limited the development of modern industries in the upstream regions [64]. However, the current economic development in the middle reaches of the region is still dominated by the coal chemical industry and low-end manufacturing, making it challenging to optimize and promote the industrial structure. The unreasonable industrial structure has led to the occupation of ecological space and low ecological quality [45]. The development of the modern industrial system in the downstream region is relatively complete, and the advantages of human resources and talents are obvious, conducive to the flow of essential factors between regions and the aggregation of external resource elements.
Generally, the spatial distribution pattern of the HQD in the YRB presented the following characteristics. First, high-level cities and medium- to high-level cities in the YRB are concentrated in the downstream regions, medium- and low-level cities in the upstream regions, and low-level cities in the middle reaches. The overall HQD presented a spatial distribution characteristic of “high at both ends and low in the middle”. Secondly, the spatial distribution pattern of the HQD in the YRB had the characteristics of circle layer diffusion. High- and medium- to high-level cities are distributed in the downstream regions of Shandong and Henan, driving the HQD of surrounding cities through continuous radiation diffusion. Third, the overall level of HQD in the YRB has improved, with medium-level cities constantly shifting spatially to medium- and high-level cities. However, most urban development is still concentrated in medium-level cities. The overall level of the HQD in the YRB is still relatively low, with a large room for improvement in cities in the upper and middle reaches.
As can be seen from Figure 6, the HQD of the YREB has maintained the spatial distribution characteristics of “high in the east and low in the west” during the past 14 years. From 2006 to 2019, low-level cities gradually transformed into medium- to high-level cities, and the number of high-level and medium- to high-level cities continued to increase. High-level areas in the downstream region are densely distributed, and low-level areas are cleared. This result may be due to the early stage of economic development and superior economic conditions in the downstream regions. It is located in a coastal area, with a relatively rich resource endowment [65]. The overall level of the HQD in the midstream region is relatively high, but there is still a large gap compared to the downstream region.
From the perspective of the YREB, there were also differences in the distribution of HQD. The downstream regions have good geographical advantages and economic foundation conditions, with rapid economic development, and attach importance to investment in talent cultivation [31]. The downstream region is dominated by the development of environmentally friendly tertiary industries. From 2006 to 2019, the gap in the level of HQD among downstream cities decreased, but overall, the level of HQD showed an upward trend. The development momentum of Shanghai and Nanjing in the downstream regions is the most significant, demonstrating the growth trend of the HQD in the downstream regions of the YREB. In the middle reaches, there is a significant phenomenon of hierarchical differentiation between mid- and high-level cities and mid-level cities surrounding high-level cities. Overall, the HQD in the middle reaches is lower than in the downstream regions, and the gap is gradually narrowing. The upstream region’s high- and medium- to high-level cities are mostly provincial central cities. The “center-periphery” phenomenon is characterized by a high level of the HQD in central cities and a low HQD in peripheral cities. This is related to the agglomeration effect of central cities, leading to the concentration of elements and resources in various regions towards the central region, thereby restricting the high-level development of surrounding areas.
4.2. Regression Results and Analysis
Based on the panel Tobit model, this paper used the Stata17 statistical software and prefecture-level city data from the YRB and the YREB from 2006 to 2019 to explore the factors affecting HQD. The regression results of the influencing factors for HQD are reported in Columns (1) to (8) of Table 4.
Table 4.
Regression results of influencing factors for high-quality development.
Columns (1) and (5) of Table 4 report the regression results for the entire sample of the YRB and YREB. LnHUM positively impacts the HQD of the YRB and the YREB. The YRB is significant at a statistical level of 1%, and the YREB is significant at a statistical level of 5%, indicating that the promotion of HQD in the YRB is superior to the YREB. URB positively impacts the HQD of the YREB, but has no significant relationship with the YRB. FDI is significant at the statistical level of 1% for both the YRB and the YREB. The introduction of foreign capital is beneficial for the government to mobilize external resources to support the HQD in the region, and improving foreign direct investment promotes HQD. LnGDP is significant at the statistical level of 1% for both the YRB and the YREB, but the coefficient of the YREB is greater than that of the YRB. IND is significantly negative at the statistical level of 1% for the YRB, indicating that the enhancement of industrialization has inhibited the HQD of the YRB. IND has promoted the HQD of the YREB, but it is not significant.
Columns (2) to (4) and (6) to (8) of Table 4 analyze the regression results of heterogeneity in the YRB and the YREB. For the YRB, LnHUM, FDI, and LnGDP positively impact the HQD of the entire river basin. An increase in the proportion of the secondary industry will inhibit HQD. Improving URB inhibits the HQD of the middle and lower reaches, but can significantly improve the HQD of the upstream. For the YREB, LnHUM, FDI, and LnGDP positively impact the HQD in the entire river basin. Improving URB will promote the HQD in the middle and lower reaches, but will hurt the HQD of the upstream. The increase in the proportion of the secondary industry has an inhibiting effect on the HQD in the upstream and midstream and will promote the HQD in the downstream, but not significantly.
5. Discussion
The YREB and the YRB are essential regions in China, and their HQD levels are significant for China’s economic and social development. Existing research has focused chiefly on macro national and urban levels, with few studies based on regional comparative perspectives [9,12]. The empirical research on the two major watersheds lacks a comparative analysis perspective, which can mask the differences between cities in the watersheds and cannot identify the heterogeneous effects of different external factors. Therefore, this paper took prefecture-level cities in two major river basins as samples following the essence of HQD, built a comprehensive indicator system, and used the entropy method to measure the level of HQD. This paper compared and analyzed the spatiotemporal and spatial differentiation characteristics of the HQD in two major watersheds using kernel density and ArcGIS. This paper used the Tobit model to study the influencing factors and improvement paths of HQD quantitatively.
This paper confirmed that human capital positively impacts the HQD of both YRB and YREB, but it has a greater impact on the YREB than on the YRB. On the one hand, improving human capital can promote technical advancement and industrial upgrading. Improving human capital enables the effective utilization of resources, thereby improving economic efficiency. On the other hand, people with high educational backgrounds have a stronger awareness of environmental protection, so their willingness to pay for the environment is stronger. Meanwhile, people with high educational backgrounds have more opportunities to engage in industries or residential areas with high added value and low pollution. This behavior helps to improve the local environmental quality and improves the HQD of the region [66]. Compared with the YREB, the economic development of the YRB is lagging, with insufficient innovation and poor production levels. Therefore, the promotion effect of human capital improvement on the YRB is more obvious. The level of urbanization has a positive impact on the HQD of the YREB, but has no significant relationship with the YRB. The main reason lies in the agglomeration effect and the spatial spillover effect generated by the improvement of the urbanization level, which have driven the improvement of production efficiency and economic growth [67]. However, the environmental endowment of the YRB is poor, and the positive impact of transaction cost reduction and economies of scale driven by the development of urbanization is not obvious. The economic scale is significant at the statistical level of 1% for both the YRB and the YREB, but the coefficient of the YREB is greater than that of the YRB. With the development of the economic scale of the YREB, the requirements for the environment are becoming increasingly high. These requirements will change the industrial structure and lead to enterprises that generate more pollution investing in advanced environmental technologies [68]. High environmental requirements enable enterprises to actively pursue profits while reducing regional pollutant emissions, thereby improving the level of HQD [22,42]. The enhancement of industrialization has inhibited the HQD of the YRB. The YRB relies on heavy industries such as the coal chemical industry. The increase in the proportion of secondary industry will bring about increased economic output and benefits, as well as greater pollution emissions, which will exacerbate environmental degradation. The level of industrialization has promoted the HQD of the YREB. The YREB has a sound economic foundation and a rich resource endowment. With the improvement of green technology, the cost of treating pollution is reduced, making it possible to improve HQD.
This paper had the following limitations, which can be further improved in the future. Firstly, although this paper attempted to establish a scientific and reasonable indicator system for the HQD of two major watersheds, and there are significant differences in resource endowments between the two watersheds. Whether the same indicator system framework can be used to measure these two watersheds is still a question that needs to be explored. Therefore, further improvements can be considered in the future based on further integration with relevant research. Secondly, due to data availability, this paper took 108 prefecture-level cities in the YREB and 78 prefecture-level cities in the YRB as the research objects, so the results may be biased. Future research can choose counties for further detailed analysis to make the results more representative. Finally, this paper deeply analyzed the influencing factors of the HQD in river basins and drew some valuable conclusions. However, the transmission mechanism was not analyzed and can be supplemented in this regard in the future.
6. Conclusions and Policy Recommendations
Based on the new development concept, this paper constructed an evaluation system of HQD. Based on the measurement of the HQD in the YRB and the YREB, the temporal and spatial distribution characteristics of the HQD in the two regions were explored. In addition, this paper constructed a panel Tobit model to identify the impact of different external factors on the HQD of the two regions. The main findings are summarized as follows.
First, the HQD of the YRB and the YREB was consistent with the national trend, showing a fluctuating upward trend, and the HQD of the YRB has always been lower than the YREB. In addition, the kernel density curves in both regions had a rightward-trailing pattern, with polarization and unbalanced development between and within regions. Second, from the perspective of the spatial distribution pattern, the HQD of the YRB presented the spatial distribution characteristics of “high at both ends, low in the middle”. The advantage of the HQD in the lower reaches of the Yellow River was obvious. The upstream of the Yellow River has obvious advantages in resources and environment, but its HQD needs further improvement. From the perspective of spatial evolution, the overall pattern of the HQD in various cities in the YRB remained stable from 2006 to 2019, but the spatial differences widened. The HQD of the YREB maintained the spatial distribution characteristic of “high in the east and low in the west”, with obvious spatial evolution characteristics. Third, the regression results of the panel Tobit model showed similarities and significant differences in the impact of external factors on the HQD of the two regions. From a regional perspective, human capital, foreign direct investment, and the economic scale had a significant positive impact on improving the HQD of the YRB, which is more consistent with the research of Cui et al. [35]. The level of urbanization had a promoting effect on HQD, but it was not significant. The industrialization level hurt the improvement of HQD. During the investigation period, the level of human capital, urbanization, foreign direct investment, and economic scale significantly promoted the improvement of the HQD of the YREB.
Based on the above conclusions, the following policy recommendations are put forward.
First, the YREB and the YRB should promote regional sustainable development based on the heterogeneity of the upstream and downstream. Social, economic, and environmental differences exist between the upstream and downstream, as well as in the development stages and governance levels. Therefore, it is vital to promote HQD processes based on local conditions while respecting the natural operating laws of the ecosystem. Regarding regions, the upper reaches of the YRB need to increase the transformation of scientific and technological innovation achievements while maintaining their ecological advantages. The middle reaches belong to ecologically fragile regions, and soil and water conservation needs to be strengthened. While pursuing economic development, downstream regions should strengthen their awareness of and efforts to protect the ecosystem. By reducing the proportion of secondary industry, the ecosystem can be restored while vigorously developing green industries. Due to the relatively developed market mechanism, scientific research and innovation capabilities exist in the downstream regions. Therefore, the intensity of environmental regulations can be moderately increased, thereby increasing the entry threshold for enterprises and forcing them to innovate in technology. Second, the YREB and the YRB should rely on regional human capital to optimize the regional industrial structure. Therefore, optimizing the regional industrial structure needs to rely more on regional human capital. Substituting human capital for natural capital allows the industrial and human capital structures to adapt and promote each other. It is necessary to take improving employment levels, improving labor productivity, and optimizing the income distribution effect of industries as an important guide for optimizing industrial structure. The core of optimizing the industrial structure is to provide a foundation for the efficient flow of factors to promote regional coordinated and integrated development. Improving the efficiency of using production factors and the efficiency of industrial space layout can promote industrial and population accumulation, thereby increasing the protection of reserved ecological space.
Author Contributions
Y.W.: conceptualization, data analysis, methodology, and writing—original draft. N.Y.: conceptualization, methodology, data analysis, supervision, writing—review and editing. All authors have read and agreed to the published version of the manuscript.
Funding
This work was supported by the Youth Project of the Humanities and Social Science Fund of Ministry of Education of China (22YJC790153) and the National Natural Science Foundation of China Youth Project (72203212).
Data Availability Statement
All the data used for analysis in this study are available from the corresponding author upon request.
Conflicts of Interest
The authors declare no conflict of interest.
References
- Cheng, G.; Li, X.; Zhao, W.; Zhao, W.Z.; Xu, Z.M.; Feng, Q.; Xiao, S.C.; Xiao, H.L. Integrated study of the water–ecosystem–economy in the Heihe River Basin. Natl. Sci. Rev. 2014, 1, 413–428. [Google Scholar] [CrossRef]
- Wang, W.; Shan, C. Sustainable development of basin economy and marine economy. J. Coast. Res. 2020, 115, 602–605. [Google Scholar] [CrossRef]
- Cloern, J.E.; Abreu, P.C.; Carstensen, J.; Chauvaud, L.; Elmgren, R.; Grall, J.; Greening, H.; Johansson, J.O.R.; Kahru, M.; Sherwood, E.T.; et al. Human activities and climate variability drive fast-paced change across the world’s estuarine–coastal ecosystems. Glob. Chang. Biol. 2016, 22, 513–529. [Google Scholar] [CrossRef] [PubMed]
- Zheng, B.; Zhao, J.; You, D. Study on the coupling relationship between water environment and social economy in Ganjiang River basin. Desalin. Water Treat. 2018, 122, 14–19. [Google Scholar] [CrossRef]
- Wang, T.; Jian, S.; Wang, J.; Yan, D. Dynamic interaction of water–economic–social–ecological environment complex system under the framework of water resources carrying capacity. J. Clean. Prod. 2022, 368, 133132. [Google Scholar] [CrossRef]
- Liu, Y.; Zhang, X.; Pan, X.; Ma, X.; Tang, M. The spatial integration and coordinated industrial development of urban agglomerations in the Yangtze River Economic Belt, China. Cities 2020, 104, 102801. [Google Scholar] [CrossRef]
- Jiang, L.; Zuo, Q.; Ma, J.; Zhang, Z. Evaluation and prediction of the level of high-quality development: A case study of the Yellow River Basin, China. Ecol. Indic. 2021, 129, 107994. [Google Scholar] [CrossRef]
- Li, H.; Jiang, Z.; Dong, G.; Wang, L.; Huang, X.; Gu, X.; Guo, Y. Spatiotemporal Coupling Coordination Analysis of Social Economy and Resource Environment of Central Cities in the Yellow River Basin. Discret. Dyn. Nat. Soc. 2021, 2021, 6637631. [Google Scholar] [CrossRef]
- Chen, X.; Li, F.; Wu, F.; Xu, X.; Zhao, Y. Initial water rights allocation of Industry in the Yellow River basin driven by high-quality development. Ecol. Model. 2023, 477, 110272. [Google Scholar] [CrossRef]
- Wu, R.; Possingham, H.; Yu, G.; Jin, T.; Wang, J.; Yang, F.; Zhao, H. Strengthening China’s national biodiversity strategy to attain an ecological civilization. Conserv. Lett. 2019, 12, e12660. [Google Scholar] [CrossRef]
- Sun, J.; Tang, D.; Kong, H.; Boamah, V. Impact of Industrial Structure Upgrading on Green Total Factor Productivity in the Yangtze River Economic Belt. Int. J. Environ. Res. Public Health 2022, 19, 3718. [Google Scholar] [CrossRef]
- Chen, Y.; Fu, B.; Zhao, Y.; Wang, K.; Zhao, M.M.; Ma, J.; Wu, J.; Xu, C.; Liu, W.; Wang, H. Sustainable development in the Yellow River Basin: Issues and strategies. J. Clean. Prod. 2020, 263, 121223. [Google Scholar] [CrossRef]
- Zhang, Z.; Hu, Z.; Zhong, F.; Cheng, Q.; Wu, M. Spatio-Temporal Evolution and Influencing Factors of High Quality Development in the Yunnan–Guizhou, Region Based on the Perspective of a Beautiful China and SDGs. Land 2022, 11, 821. [Google Scholar] [CrossRef]
- Ma, D.; Zhu, Q. Innovation in emerging economies: Research on the digital economy driving high-quality green development. J. Bus. Res. 2022, 145, 801–813. [Google Scholar] [CrossRef]
- Zhang, S.; Zhong, Q.; Cheng, D.; Xu, C.; Chang, Y.; Lin, Y.; Li, B. Coupling Coordination Analysis and Prediction of Landscape Ecological Risks and Ecosystem Services in the Min River Basin. Land 2022, 11, 222. [Google Scholar] [CrossRef]
- Hong, Y.; Liu, W.; Song, H. Spatial econometric analysis of effect of New economic momentum on China’s high-quality development. Res. Int. Bus. Financ. 2022, 61, 101621. [Google Scholar] [CrossRef]
- Wang, F.; Wang, R.; He, Z. The impact of environmental pollution and green finance on the high-quality development of energy based on spatial Dubin model. Resour. Policy 2021, 74, 102451. [Google Scholar] [CrossRef]
- Li, Q. Evaluation Method of Economic Growth Quality of Tourism-Driven Real Estate Based on AHP. Wirel. Commun. Mob. Comput. 2022, 2022, 7252544. [Google Scholar] [CrossRef]
- Hayat, A. Foreign direct investments, institutional quality, and economic growth. J. Int. Trade Econ. Dev. 2019, 28, 561–579. [Google Scholar] [CrossRef]
- Jing, F.Z.; Zhao, H. Research on coupling relationship between environmental quality and regional economic growth based on VAR model. Clust. Comput. 2019, 22, 5881–5891. [Google Scholar] [CrossRef]
- Song, Y.; Liu, H. Internet development, economic level, and port total factor productivity: An empirical study of Yangtze River ports. Int. J. Logist. Res. Appl. 2020, 23, 375–389. [Google Scholar] [CrossRef]
- Wu, Y.; Zhang, S. Research on the evolution of high-quality development of China’s provincial foreign trade. Sci. Program. 2022, 2022, 3102157. [Google Scholar] [CrossRef]
- Zhang, J.; Fu, X.; Morris, H. Construction of indicator system of regional economic system impact factors based on fraction-al differential equations. Chaos Solitons Fractals 2019, 128, 25–33. [Google Scholar] [CrossRef]
- Reyes-Riveros, R.; Altamirano, A.; De, F.; Rozas-Vásquez, D.; Vieli, L.; Meli, P. Linking public urban green spaces and human well-being: A systematic review. Urban For. Urban Green. 2021, 61, 127105. [Google Scholar] [CrossRef]
- Li, J.; Sun, W.; Li, M.; Meng, L. Coupling coordination degree of production, living and ecological spaces and its influencing factors in the Yellow River Basin. J. Clean. Prod. 2021, 298, 126803. [Google Scholar] [CrossRef]
- Li, W.; Yi, P. Assessment of city sustainability—Coupling coordinated development among economy, society and environment. J. Clean. Prod. 2020, 256, 120453. [Google Scholar] [CrossRef]
- Chimeli, A.; Braden, J. Total factor productivity and the environmental Kuznets curve. J. Environ. Econ. Manag. 2005, 49, 366–380. [Google Scholar] [CrossRef]
- Hafner, K. Growth-instability frontier and industrial diversification: Evidence from European gross value added. Pap. Reg. Sci. 2019, 98, 799–824. [Google Scholar] [CrossRef]
- Ding, Y.; Zhang, H.; Tang, S. How does the digital economy affect the domestic value-added rate of Chinese exports? J. Glob. Inf. Manag. JGIM 2021, 29, 71–85. [Google Scholar] [CrossRef]
- Ren, X.; Yang, S. Technological innovation, industrial structure upgrading and high-quality economic development: Analysis based on the measurement of independent effects and synergistic effects. East China Econ. Manag. 2020, 11, 72–80. [Google Scholar]
- Guo, F.; Wang, J. Measuring the development of China’s digital financial inclusion: Index compilation and spatial characteristics. China Econ. Q. Int. 2020, 4, 1401–1418. [Google Scholar]
- Ge, H.; Wu, F. Digital economy empowers high-quality economic development: Theoretical mechanism and empirical evidence. Nanjing J. Soc. Sci. 2021, 1, 24–33. [Google Scholar]
- Ercolani, M.; Wei, Z. An empirical analysis of China’s dualistic economic development: 1965–2009. Asian Econ. Pap. 2011, 10, 1–29. [Google Scholar] [CrossRef]
- Wang, P.; Wu, J. Impact of environmental investment and resource endowment on regional energy efficiency: Evidence from the Yangtze River Economic Belt, China. Environ. Sci. Pollut. Res. 2022, 29, 5445–5453. [Google Scholar] [CrossRef]
- Li, T.; Liao, G. The heterogeneous impact of financial development on green total factor productivity. Front. Energy Res. 2020, 8, 29. [Google Scholar] [CrossRef]
- Zhang, J.; Lu, G.; Skitmore, M.; Ballesteros-Pérez, P.A. critical review of the current research mainstreams and the influencing factors of green total factor productivity. Environ. Sci. Pollut. Res. 2021, 28, 35392–35405. [Google Scholar] [CrossRef] [PubMed]
- Ren, S.; Li, X.; Yuan, B.; Li, D.; Chen, X. The effects of three types of environmental regulation on eco-efficiency: A cross-region analysis in China. J. Clean. Prod. 2018, 173, 245–255. [Google Scholar] [CrossRef]
- Li, B.; Liu, Z. Measurement and evolution of high-quality development level of marine fishery in China. Chin. Geogr. Sci. 2022, 32, 251–267. [Google Scholar] [CrossRef] [PubMed]
- Li, X.; Lu, Y.; Huang, R. Whether foreign direct investment can promote high-quality economic development under environmental regulation: Evidence from the Yangtze River Economic Belt, China. Environ. Sci. Pollut. Res. 2021, 28, 21674–21683. [Google Scholar] [CrossRef]
- Yang, W.; Zhang, Z. Comparative Study on Ecological Total Factor Productivity between the Yellow River Basin and the Yangtze River Economic Belt. J. Manag. 2020, 33, 26–37. [Google Scholar]
- Fang, L.; Wang, L.; Chen, W.; Sun, J.; Cao, Q.; Wang, S.; Wang, L. Identifying the impacts of natural and human factors on ecosystem service in the Yangtze and Yellow River Basins. J. Clean. Prod. 2021, 314, 127995. [Google Scholar] [CrossRef]
- Yang, Q.; Xu, Q. Comparative Study on Green Efficiency of Water Resources between the Yangtze River Economic Belt and the Yellow River Basin. Rev. Econ. Manag. 2022, 38, 49–62. [Google Scholar]
- Cui, X.; Cai, T.; Deng, W.; Zheng, R.; Jiang, Y.; Bao, H. Indicators for Evaluating High-Quality Agricultural Development: Empirical Study from Yangtze River Economic Belt, China. Soc. Indic. Res. 2022, 164, 1101–1127. [Google Scholar] [CrossRef]
- Yu, S.; Lu, H. Relationship between urbanization and pollutant emissions in transboundary river basins under the strategy of the Belt and Road Initiative. Chemosphere 2018, 203, 11–20. [Google Scholar] [CrossRef]
- Geng, W.; Li, Y.; Zhang, P.; Yang, D.; Jing, W.; Rong, T. Analyzing spatio-temporal changes and trade-offs/synergies among ecosystem services in the Yellow River Basin, China. Ecol. Indic. 2022, 138, 108825. [Google Scholar] [CrossRef]
- Xiong, Y.; Xu, W.; Lu, N.; Huang, S.; Wu, C.; Wang, L.; Kou, W. Assessment of spatial–temporal changes of ecological environment quality based on RSEI and GEE: A case study in Erhai Lake Basin, Yunnan province, China. Ecol. Indic. 2021, 125, 107518. [Google Scholar] [CrossRef]
- Xin, Y.; Liu, X. Coupling driving factors of eco-environmental protection and high-quality development in the yellow river basin. Front. Environ. Sci. 2022, 10, 951218. [Google Scholar] [CrossRef]
- Li, X.; Tan, Y.; Tian, K. The Impact of Environmental Regulation, Industrial Structure, and Interaction on the High-Quality Development Efficiency of the Yellow River Basin in China from the Perspective of the Threshold Effect. Int. J. Environ. Res. Public Health 2022, 19, 14670. [Google Scholar] [CrossRef] [PubMed]
- Zha, Q.; Liu, Z.; Song, Z.; Wang, J. A study on dynamic evolution, regional differences and convergence of high-quality economic development in urban agglomerations: A case study of three major urban agglomerations in the Yangtze river economic belt. Front. Environ. Sci. 2022, 10, 1012304. [Google Scholar] [CrossRef]
- Tang, R. A study of the effects and mechanisms of the digital economy on high-quality tourism development: Evidence from the Yangtze River Delta in China. Asia Pac. J. Tour. Res. 2022, 27, 1217–1232. [Google Scholar] [CrossRef]
- Chen, Y.; Zhu, M.K.; Lu, J.L.; Zhou, Q.; Ma, W.B. Evaluation of ecological city and analysis of obstacle factors under the background of high-quality development: Taking cities in the Yellow River Basin as examples. Ecol. Indic. 2020, 118, 106771. [Google Scholar] [CrossRef]
- Yuan, X.Y.; Li, S.R.; Li, Z.P. Setting standards for urban development: Review of the construction of urban high-quality development evaluation system. J. Xi’an Jiaotong Univ. Soc. Sci. 2021, 41, 18–24. [Google Scholar]
- Cooke, P. The role of research in regional innovation systems: New models meeting knowledge economy demands. Int. J. Technol. Manag. 2004, 28, 507–533. [Google Scholar] [CrossRef]
- Miao, C.; Duan, M.; Zuo, Y.; Wu, X. Spatial heterogeneity and evolution trend of regional green innovation efficiency--an empirical study based on panel data of industrial enterprises in China’s provinces. Energy Policy 2021, 156, 112370. [Google Scholar] [CrossRef]
- Ma, D.; Zhang, J.; Wang, Z.; Sun, D. Spatio-Temporal Evolution and Influencing Factors of Open Economy Development in the Yangtze River Delta Area. Land 2022, 11, 1813. [Google Scholar] [CrossRef]
- Chen, M.; Gong, Y.; Lu, D.; Ye, C. Build a people-oriented urbanization: China’s new-type urbanization dream and Anhui model. Land Use Policy 2019, 80, 1–9. [Google Scholar] [CrossRef]
- Sun, C.; Tong, Y.; Zou, W. The evolution and a temporal-spatial difference analysis of green development in China. Sustain. Cities Soc. 2018, 41, 52–61. [Google Scholar] [CrossRef]
- Cunha-Zeri, G.; Guidolini, J.; Branco, E.; Omettoa, J. How sustainable is the nitrogen management in Brazil? A sustainability assessment using the Entropy Weight Method. J. Environ. Manag. 2022, 316, 115330. [Google Scholar] [CrossRef]
- Ding, L.; Yang, Y.; Wang, L.; Calin, A. Cross Efficiency Assessment of China’s marine economy under environmental governance. Ocean Coast. Manag. 2020, 193, 105245. [Google Scholar] [CrossRef]
- Fu, L.; Liu, B.; Zhu, Z.; Cao, J.; Sun, C.; Yu, Z. Analysis of the coupling coordinated development and evolutionary trend of digital economy and ecological environment. Front. Environ. Sci. 2022, 10, 1006354. [Google Scholar] [CrossRef]
- An, X.; Li, Y.; Wang, L.; Dong, G.; Dai, B.; Liang, M. The Spatial and Temporal Distribution of High-Quality Urbanization Development in Yellow River Basin Provinces. Sustainability 2022, 14, 10355. [Google Scholar] [CrossRef]
- Chen, X.; Liu, X.; Zhu, Q. Comparative analysis of total factor productivity in China’s high-tech industries. Technol. Forecast. Soc. Chang. 2022, 175, 121332. [Google Scholar] [CrossRef]
- Gao, D.; Li, G.; Yu, J. Does digitization improve green total factor energy efficiency? Evidence from Chinese 213 cities. Energy 2022, 247, 123395. [Google Scholar] [CrossRef]
- Zhang, D.; Mohsin, M.; Rasheed, A.; Chang, Y.; Taghizadeh-Hesary, F. Public spending and green economic growth in BRI region: Mediating role of green finance. Energy Policy 2021, 153, 112256. [Google Scholar] [CrossRef]
- Zeng, S.; Shu, X.; Ye, W. Total Factor Productivity and High-Quality Economic Development: A Theoretical and Empirical Analysis of the Yangtze River Economic Belt, China. Int. J. Environ. Res. Public Health 2022, 19, 2783. [Google Scholar] [CrossRef]
- Yang, N.; Sun, X.; Qi, Q. Impact of factor quality improvement on agricultural carbon emissions: Evidence from China’s high-standard farmland. Front. Environ. Sci. 2022, 10, 989684. [Google Scholar] [CrossRef]
- An, D.; Shen, C.; Yang, L. Evaluation and Temporal-Spatial Deconstruction for High-Quality Development of Regional Marine Economy: A Case Study of China. Front. Mar. Sci. 2022, 9, 916662. [Google Scholar] [CrossRef]
- Yang, N.; Liu, Z.; Lin, Y.; Yang, Y. Does environmental regulation improve public health? Evidence from China’s Two Control Zones policy. Front. Public Health 2023, 11, 1059890. [Google Scholar] [CrossRef]
Disclaimer/Publisher’s Note: The statements, opinions and data contained in all publications are solely those of the individual author(s) and contributor(s) and not of MDPI and/or the editor(s). MDPI and/or the editor(s) disclaim responsibility for any injury to people or property resulting from any ideas, methods, instructions or products referred to in the content. |
© 2023 by the authors. Licensee MDPI, Basel, Switzerland. This article is an open access article distributed under the terms and conditions of the Creative Commons Attribution (CC BY) license (https://creativecommons.org/licenses/by/4.0/).