Article

The Spatial Association of Rural Human Settlement System Resilience with Land Use in Hunan Province, China, 2000–2020

1
School of Business, Hunan First Normal University, Changsha 410205, China
2
School of Public Administration, Guangxi University, Nanning 530004, China
3
Institute of Geographic Sciences and Natural Resources Research, Chinese Academy of Sciences, Beijing 100101, China
4
School of Public Policy and Urban Affairs, Northeastern University, Boston, MA 02115, USA
*
Authors to whom correspondence should be addressed.
Land 2023, 12(8), 1524; https://doi.org/10.3390/land12081524
Submission received: 30 June 2023 / Revised: 27 July 2023 / Accepted: 27 July 2023 / Published: 31 July 2023

Abstract

:
In China, the rural human settlement system (RHSS) reflects the relationship between rural people and land but is affected by land use and land cover change (LUCC). Maintaining a harmonious development between RHSS resilience (RHSSR) and LUCC is an important rural development issue. However, the spatial association between LUCC and RHSSR remains unclear, constraining effective land use and rural policymaking. The association between RHSSR and LUCC was assessed from a spatial perspective. Using county-level spatial panel data for Hunan Province, China (2000–2020), an evaluation indicator system was established to measure RHSS and analyze the spatiotemporal evolution of RHSSR using a geospatial analysis and geodetector model. The average RHSSR level increased from 0.158 to 1.406. The RHSSR generally presented a three-level stepped spatial distribution feature of high in the east and low in the west, with a belt-like distribution. Additionally, the RHSSR was consistent with land use intensity (LUI), but there was significant spatial heterogeneity in the spatial relationship between LUI and RHSSR. The evolution of RHSSR occurred through industrial development, medical service improvement, increased income, and environmental protection. This has important implications for future rural development strategies, the sustainable development of rural land, and the integration of RHSS into regional planning.

1. Introduction

Due to the rapid changes in the global natural and social environment since the middle of the last century, people are increasingly recognizing the importance of the capacity of individuals and local areas to respond to and recover from significant shocks to human society such as climate change, epidemic outbreaks, socio-political transformations, and economic fluctuations [1,2,3]. Against this background, the concept of resilience has received increasingly widespread international attention from academics and crossed research disciplines, theories, policies, and practical applications, with a strong adaptability [4,5].
Rural areas have become increasingly important in human communities due to their role in providing food and natural space for human survival but are relatively vulnerable to various forces compared to urban areas [6]. In particular, the environmental pressures brought on by rapid industrialization and urbanization far exceed the ability of most villages to regulate themselves. Against this background, the concept of resilience has gained significant attention in the field of rural studies since the new millennium, with the aim of improving the ability of rural areas to adapt to change and self-transform [2]. Several studies have been conducted in terms of conceptual connotation, typology, influential factors, and quantitative measures [7,8,9,10]. And some researchers understand rural resilience in terms of a single subsystem of the rural area (e.g., economic viability) and rural sustainability, but rural resilience focuses more on the adaptive capacity of the system itself [11,12]. This has shifted from the study of a single natural ecosystem to complex social–ecological systems [13]. Based on these, this paper argues that rural resilience refers to the ability of rural areas to withstand certain disturbances and shocks, to respond quickly to natural disasters and extreme events, as well as to adapt quickly to new environments and restore their internal vitality without affecting future development in the medium to long term.
As an important component of the rural territorial system, the rural human settlement system (RHSS) plays an important role in providing material and non-material support for villagers, but it is the most tense and dynamic of human–land relationships in rural areas. Research on human settlement began in urban planning, with pioneering theories such as “idyllic city” and “ekistics” [14,15]. Studies on human settlement in Europe and America have gone through four stages: “emphasizing quantity, emphasizing quality, emphasizing both quantity and quality, and emphasizing the quality of ecological environment”. At present, the construction of rural human settlement is especially reflected in respect to people and the natural environment, planning and design, settlement and infrastructure construction, and governance and maintenance of the environment [16]. It also centers on upgrading the quality of life and production of farmers by improving rural infrastructure and living environment, in order to promote the sustainable development of the country-side and urban–rural integration [17]. Researchers have carried out studies from the aspects of the spatial behavior of farmers, regional culture, development model, spatial planning, and “3S” technology, finding that RHSS does not exist in isolation. Instead, it is subject to shocks and disturbances from various factors, such as natural hazards, urbanization, regional microclimate, industrial pollution, blind urban expansion, deforestation, and land use changes in agricultural development [18,19,20]. These factors have an impact on the harmonious development of the relationship between rural people and land and can reduce the stability and adaptability of the RHSS. In addition, many researchers hold the view that the RHSS is composed of the five major subsystems (natural, human, residential, supporting, and social) and that changes in any subsystem element will cause corresponding changes in other elements, forming a chain reaction and leading to changes in the system state [10,13]. Several studies have also assessed the comprehensive quality and development potential of RHSS from the perspectives of sustainable development [21], rural tourism [22], rural migration [23], rural landscape maintenance [24], and rural system vulnerability [25]. Such studies have used a combination of qualitative and quantitative methods, including a geographic information system (GIS)-based spatial econometric analysis [26] and villager participatory surveys [27].
Rural human settlement system resilience (RHSSR) is the basis for maintaining the healthy and stable operation of RHSS and the establishment of a sustainable evolutionary path [13]. The way in which to investigate RHSSR and further promote the system resilience has become an important issue, but only a relatively small amount of attention is currently focused on this topic [28,29]. Additionally, land use, as a mirror of socio-economic development, can reflect the spatiotemporal distribution patterns and development problems of rural human settlement [30], which means there is a close relationship between land use and RHSSR. Therefore, comprehending the spatial heterogeneity or homogeneity of RHSSR and its relationship with land use change can deepen the research on rural resilience at the theoretical level, and, at the practical level, can provide scientific guidance for the formulation of sustainable-development-oriented rural strategies and land use policies.
As global urbanization has accelerated in recent decades, the corresponding rural decline has been significant, becoming a common challenge for most countries around the world, especially in developing countries such as China [31]. In this context, China has implemented the rural revitalization strategy, which seeks to comprehensively improve the resilience and modern development of the countryside in terms of industry, ecology, culture, governance, and the living environment. To cope with the rural decline in Hunan Province, the Chinese central government, as well as governments at all levels in Hunan Province, have already made substantial efforts to improve RHSSR, but adjustments in sustainable land use are still needed. At the core of these policy documents is an emphasis on promoting the revitalization and sustainable development of rural areas by enhancing the RHSSR.
Based on the above analysis, the research question proposed in this article is as follows: what spatial relationship exists between RHSSR and land use in Hunan Province, China, and how can it be measured? Given that the county-level rural land use structure in Hunan Province has undergone significant changes from 2000 to 2020 [32,33], this study took counties (cities, districts) in Hunan Province as the research unit. To achieve this goal, this study constructed an index system to measure RHSSR from five main subsystems of rural human settlements, revealing the spatiotemporal evolution pattern of RHSSR in various counties of Hunan Province from 2000 to 2020. In addition, we accurately analyzed the explanatory power of each of the driving factors in the five subsystems in different geographic regions and the influence mechanism of multi-factor interactions to reduce the spatial heterogeneity caused by the socioeconomic development of different districts and counties, which is crucial for exploring the driving mechanism of RHSSR evolution. Therefore, this study used the geographic detector model to identify the influencing factors that restrict the improvement of the regional rural human settlement environment system and the influencing mechanism of multi-factor interactions in order to overcome the limitations of traditional econometric models that cannot effectively deal with the spatiotemporal heterogeneity in the analysis of driving forces.

2. Materials and Methods

2.1. Data Sources

This study used a land use and land cover change (LUCC) dataset for the period of 2000–2020 with a resolution of 30 m. It was provided by the Data Center for Resources and Environmental Sciences, Chinese Academy of Sciences (RESDC) (http://www.resdc.cn, accessed on 3 May 2023) [34]. The LUCC data in 2000, 2005, and 2010 were generated based on Landsat-TM/ETM remote sensing images, while the LUCC data for 2015 and 2020 were updated based on Landsat 8 remote sensing images, and then generated by a manual visual interpretation. Land use types included six first-class and 25 s class types. Because the accuracy of the first-level land use classification data was greater than 94.3%, the overall accuracy of the second-level land use classification data was higher than 91.2% [35]. Therefore, this study used the first-level land use classification standard to divide land use into six primary types: cultivated land, forestland, grassland, water bodies, built-up land, and unused land. Additionally, socioeconomic and natural environment data were obtained from the China County Statistical Yearbook, ERA5-Land dataset, and China City Statistical Yearbook from 2000 to 2020, as well as the National Economic and Social Development Statistical Bulletin of counties and cities in Hunan Province from 2000 to 2020.

2.2. Methods

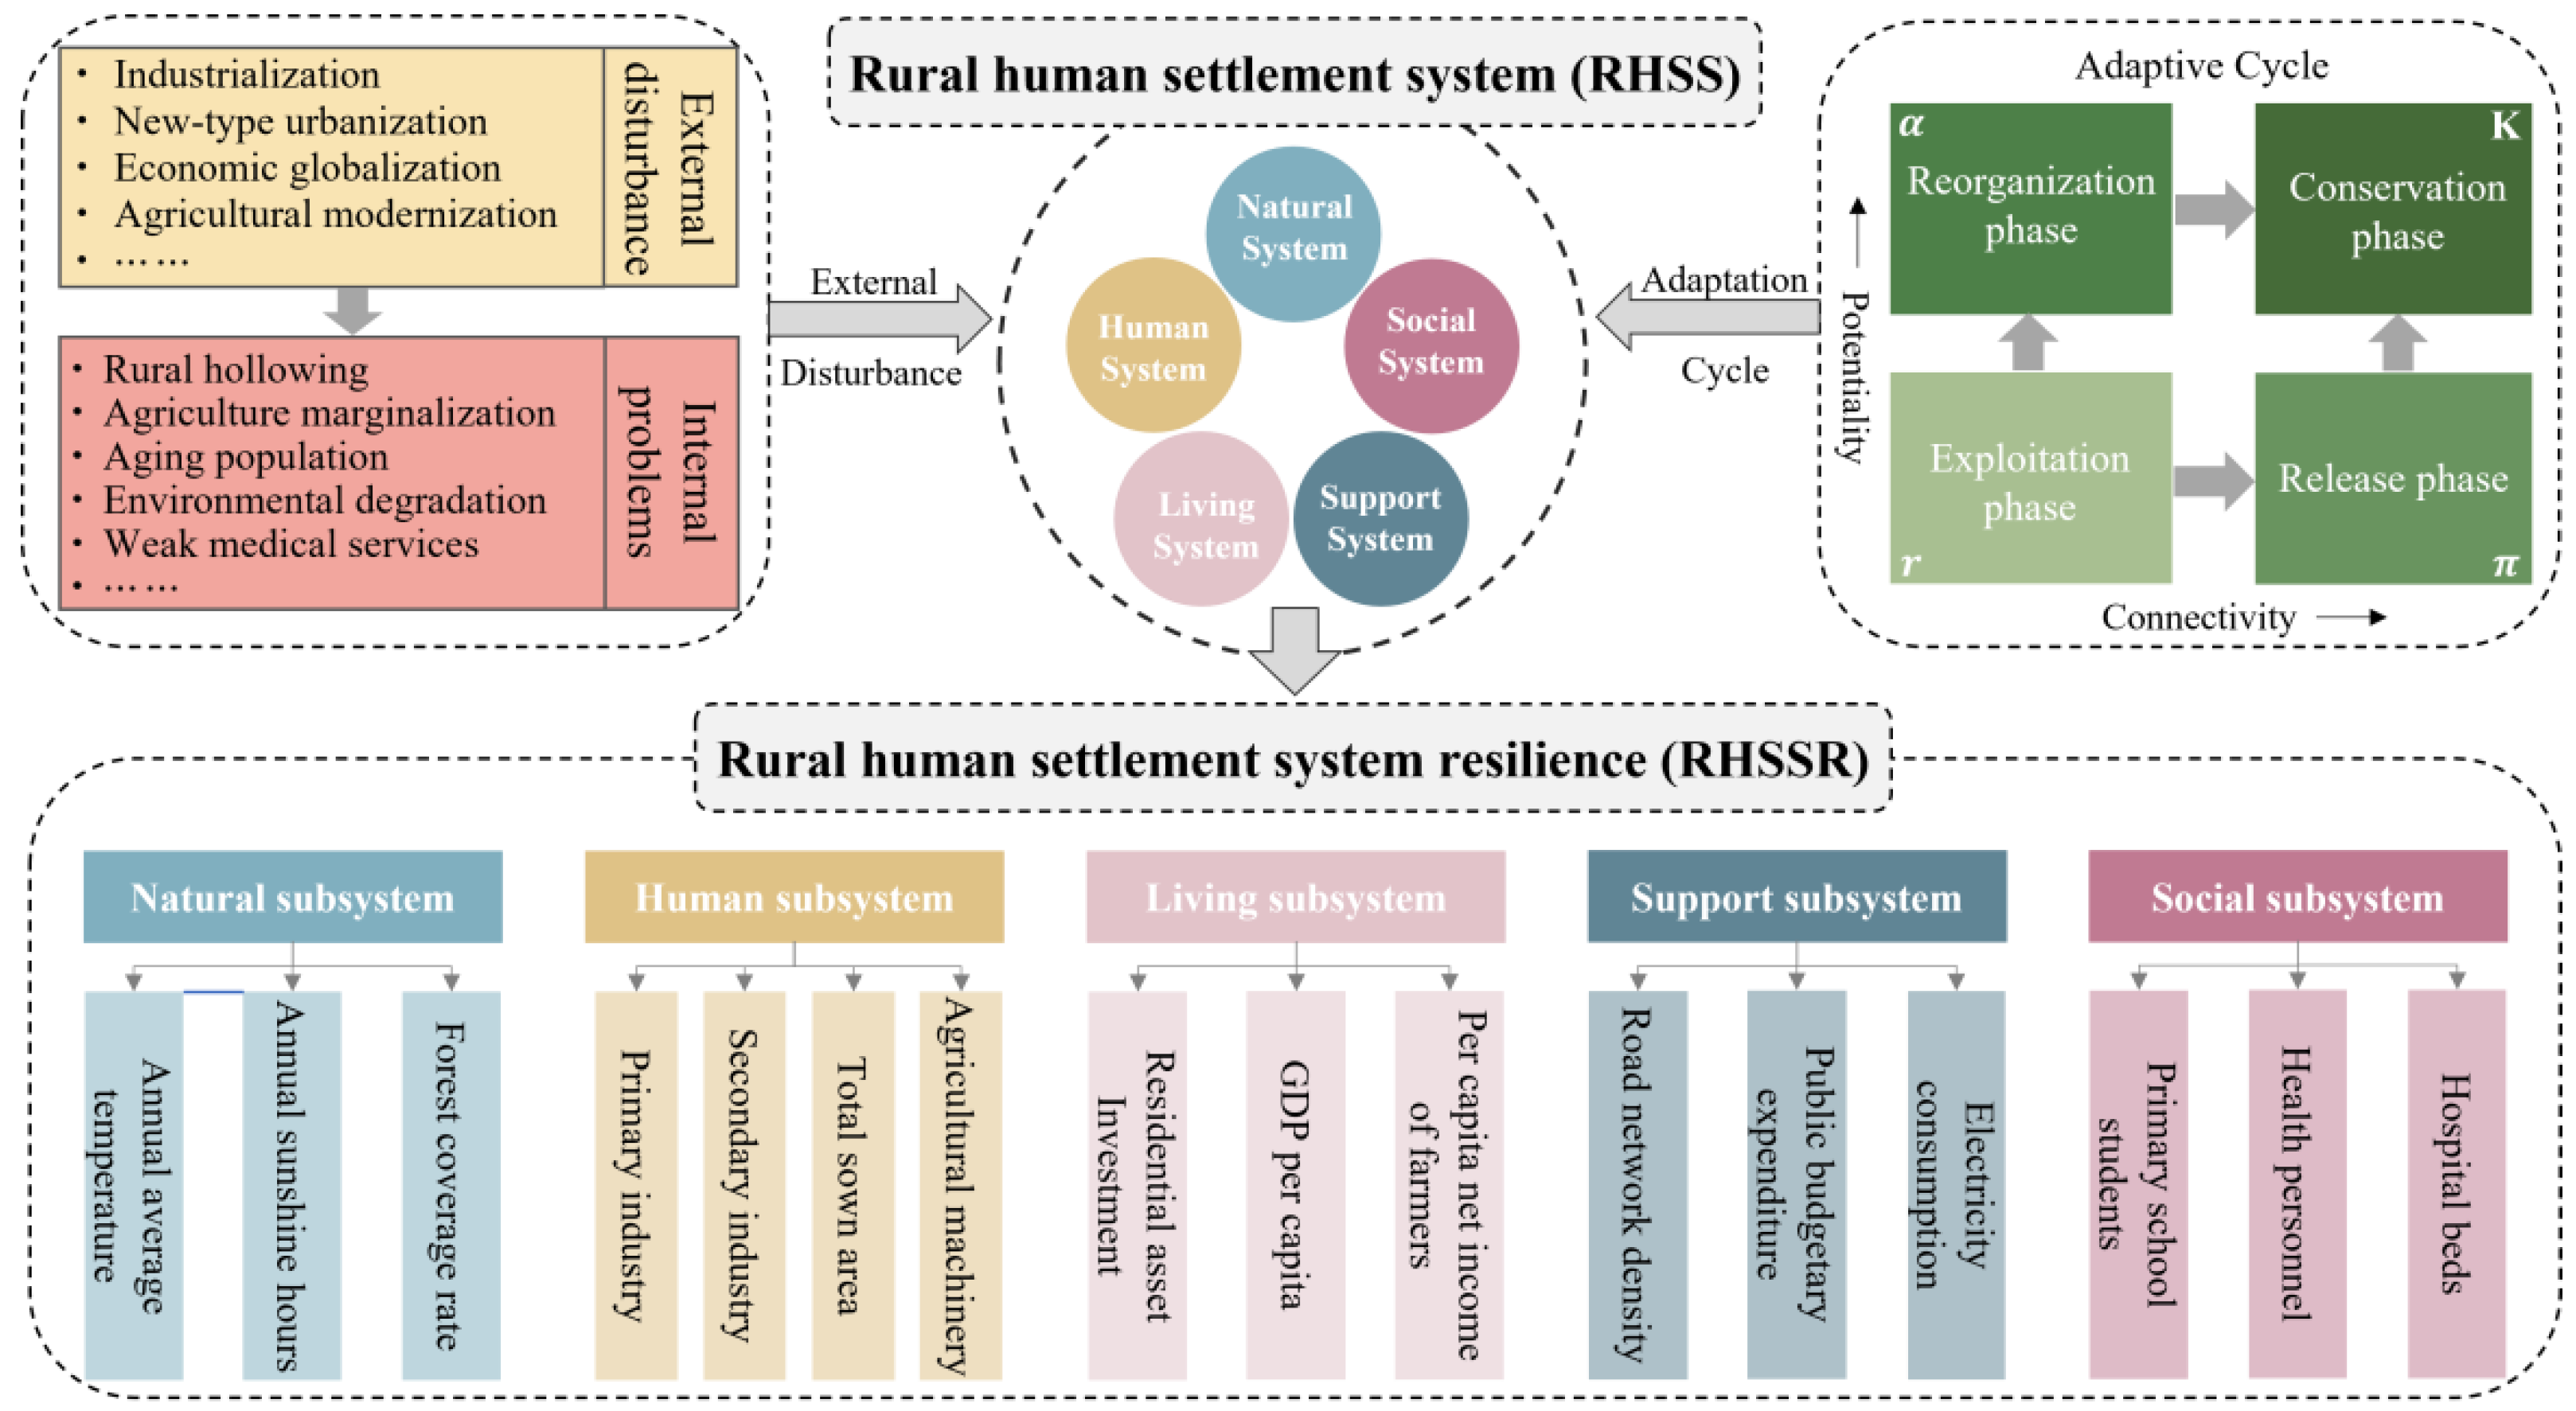
2.2.1. Quantifying RHSSR

The RHSS includes five subsystems: natural, human, residential, supporting, and social subsystems [10,13,36]. This study expanded on the existing research, starting from these five subsystems of rural human settlement, and an evaluation index system for quantifying RHSSR was constructed (Figure 1). First, because each evaluation index involved different dimensions, an increase in the positive index will improve the RHSSR, and an increase in the negative index will reduce the RHSSR. Therefore, the range method was used to process the data from different evaluation indicators in a dimensionless manner. The calculation was as follows:
Z i j t = X i j t m i n X i j m a x X i j m i n X i j ,   i f X i j 0 m a x X i j X i j t m a x X i j m i n X i j ,   i f X i j < 0  
where Z i j t is the standardized value of the j -th evaluation index in the i index layer of t year, and X i j t is the j -th index value in the i index layer of t year.
Second, the weights of the evaluation index of RHSSR were determined through the objective combination weighting method, which combined the entropy method, the distance optimal square sum method, and the mean square deviation method. The entropy method is based on information entropy, which mainly reflects the degree of variation of the indexes, and the smaller the value, the greater the weight. In contrast, the sum of the squared distance weighting method is used to determine the degree of comprehensive influence of the index, and the mean square deviation method reflects the dispersion degree of the indexes. The larger the value of both, the larger the weight [37,38]. Then, the average of the indicator weights obtained by the three objective assignment methods was calculated to obtain the final weights of each indicator. The specific calculation was as follows:
W j t e v m = 1 + k i = 1 n D i j t ln ( D i j t ) j = 1 m ( 1 + k i = 1 n D i j t ln ( D i j t ) ) W j t d o s s = i = 1 n ( Z i j t 1 ) j = 1 m i = 1 n ( Z i j t 1 ) W j t m s s = 1 n i = 1 n ( Z i j t 1 n Z i j t ) 2 j = 1 m 1 n i = 1 n ( Z i j t 1 n Z i j t ) 2 W j t = ( W j t e v m + W j t d o s s + W j t m s s ) / 3
where   D i j t = Z i j t / i = 1 n Z i j t   represents the proportion of the j-th evaluation index in the i-th index layer in the t-th year; k = 1 / ln n , where n is the number of index layers; m is the number of evaluation indexes; W j t e v m is the weight determined by the entropy value method; W j t d o s s is the weight determined by the distance superiority sum of squares method; W j t m s s is the weight determined by the mean square error method; and W j t is the final weight of the j-th evaluation index in the t-th year.
Finally, according to the comprehensive weight and the standardized value obtained by the range standardization method, the weighted sum method was used to calculate the resilience index of the five subsystems of the human settlement environment. Then, the RHSSR level was calculated according to the weight index that was obtained:
N i t = j = 1 m N i j W j t H i t = j = 1 m H i j W j t L i t = j = 1 m L i j W j t S i t = j = 1 m S i j W j t K i t = j = 1 m K i j W j t T i t = N i t + H i t + L i t + S i t + K i t  
where N i t , H i t , L i t , S i t , and K i t are the resilience index values of the natural, human, residential, support, and social subsystems in the RHSS of the i-th county in the t-th year, respectively. N i j , H i j , L i j , S i j , and K i j are the standardized values of the j-th evaluation index in the i-th county, respectively. T i t is the RHSSR level of the i-th county in the t-th year.

2.2.2. Quantifying LUCC

Land use and land cover change are important tools for investigating the interaction of human activities with natural ecological environments [39]. Land use and land cover change directly affect the structure and function of a rural human settlement system. Previous studies have quantified LUCC from the aspects of land use dynamic degree, land use intensity (LUI), and land use diversity [40,41,42,43]. Land use dynamics only reflect the dynamic transfer process of land use types within a region, while land use diversity mainly describes the complexity of different land use types [40,42]. Compared with land use dynamics and land use diversity, LUI can better reflect the adaptability of rural human settlement systems to changing physical and socioeconomic environments. To avoid double counting between different measurement indicators, LUI was selected to represent LUCC.
Land use intensity (LUI) reflects the degree of disturbance of human activities on land use patterns and can be determined as a response to material and energy flows between natural and human systems [44,45]. Land use intensity not only reveals the biophysical constraints of land use in different regions but also reflects the increase in output per unit of the land area caused by regional socioeconomic activities [46,47]. Due to the great differences in the economic benefits of different land use types, there is an impulse to change the urban and rural land use structure. Therefore, LUI is commonly estimated by classifying the intensity coefficient grades of different land use types according to the natural equilibrium state of land under the influence of different socioeconomic factors [48,49]. The initial classification standard of the LUI coefficient was used to recombine all land use types in the original land classification system into four new land types according to the material and energy inputs of each land type [50]. To evaluate LUI more accurately, Li et al. [49] improved the original LUI coefficient classification standard and subdivided the original four LUI scoring coefficients into 10 grades of scoring standards (Table 1). Because the secondary land use type in this study included the above 10 scoring standards, the LUI was calculated by referring to the classification standard of Li et al. [49]. Land use intensity was expressed as follows:
L U I = i = 1 6 L U C i ,   t i = 1 6 L U C i ,   t × D i  
where L U C i ,   t represents the area of land use type i at time t, and D i is the LUI coefficient assigned to land use type i.

2.2.3. Spatial Autocorrelation Analysis

Geographical objects usually have spatial dependence and a spatial autocorrelation analysis of the spatial interdependencies between adjacent objects can be used to measure the spatial correlation [39]. The global and local spatial autocorrelations were exploited to explore the spatial clustering and dispersion patterns between LUCC and RHSSR. The global Moran’s I index was used to measure and test the global spatial autocorrelation between LUCC and RHSSR in Hunan Province. Although the global spatial autocorrelation could analyze the aggregation effect, it cannot distinguish the high and low values of agglomeration in different counties [51]. The local Moran’s I index could effectively identify the spatial dependence and heterogeneity of the elastic formation level of rural human settlement, which revealed the local features hidden in the global spatial autocorrelation. The specific calculation formula was as follows:
Global   Moran s   I = n i = 1 n j = 1 n ω i j y i y ¯ y j y ¯ i = 1 n j = 1 n ω i j i = 1 n y i y ¯ 2 = i = 1 n j = 1 n ω i j y i y ¯ y j y ¯ S 2 i = 1 n j = 1 n ω i j
Local   Moran s   I = n i = 1 n j = 1 n ω i j y i y ¯ y j y ¯ i = 1 n j = 1 n ω i j i = 1 n y i y ¯ 2 = i = 1 n j = 1 n ω i j y i y ¯ y j y ¯ S 2 i = 1 n j = 1 n ω i j  
where n is the number of counties in the study area; ω i j is the spatial weight matrix; and y is the attribute value of spatial units y ¯ = 1 / n i = 1 n y i S 2 = 1 / n i = 1 n y i y ¯ 2 . The value range of the Moran’s I is [−1, 1], where a value greater than 0 indicates a positive correlation, and a value less than 0 indicates a negative correlation. If I equals 0, there is no spatial correlation. The Z score and p-value were used to determine whether the calculated index value was significant. According to the calculation results, a local indicators of spatial association (LISA) cluster map revealed five types of aggregation: high–high (H-H), high–low (H-L), low–low (L-L), low–high (L-H), and insignificant aggregation.

2.2.4. The Geodetector Model

Geodetector is a statistical method to explore the spatial differentiation of data and analyze its driving factors. It has four distinct functions: factor detection, interaction detection, risk detection, and ecological detection. The R package “GD” was used to identify the factors that caused changes in RHSSR. The factor detector not only detected the spatial variation of attribute value Y but also the extent to which each factor X explained the spatial variation of the attribute value Y. The interaction detector was used to analyze whether the interaction of any two influencing factors would increase or decrease the explanatory power of RHSSR [52]. The risk detector was used to spatially superimpose each impact factor X to compare whether the difference was significant. The extent to which the influencing factors explained RHSSR variation was measured by the q-statistic of the factor detector [53]:
q = 1 h = 1 L N h σ h 2 N σ 2 = 1 S S W S S T  
where h (1… L) is the number of classifications of the influencing factor; N h and N are the number of units in subregion h and the whole area, respectively; σ h 2 and σ 2 are the variance of Y values in subregion h and the whole area, respectively; and SSW and SST are the sum of the variance within a layer and the total variance of the whole area, respectively. The q-statistic ranges from 0 to 1, and the greater the q-statistic value is, the stronger the explanatory power of the independent variable X on the attribute Y.

3. Results

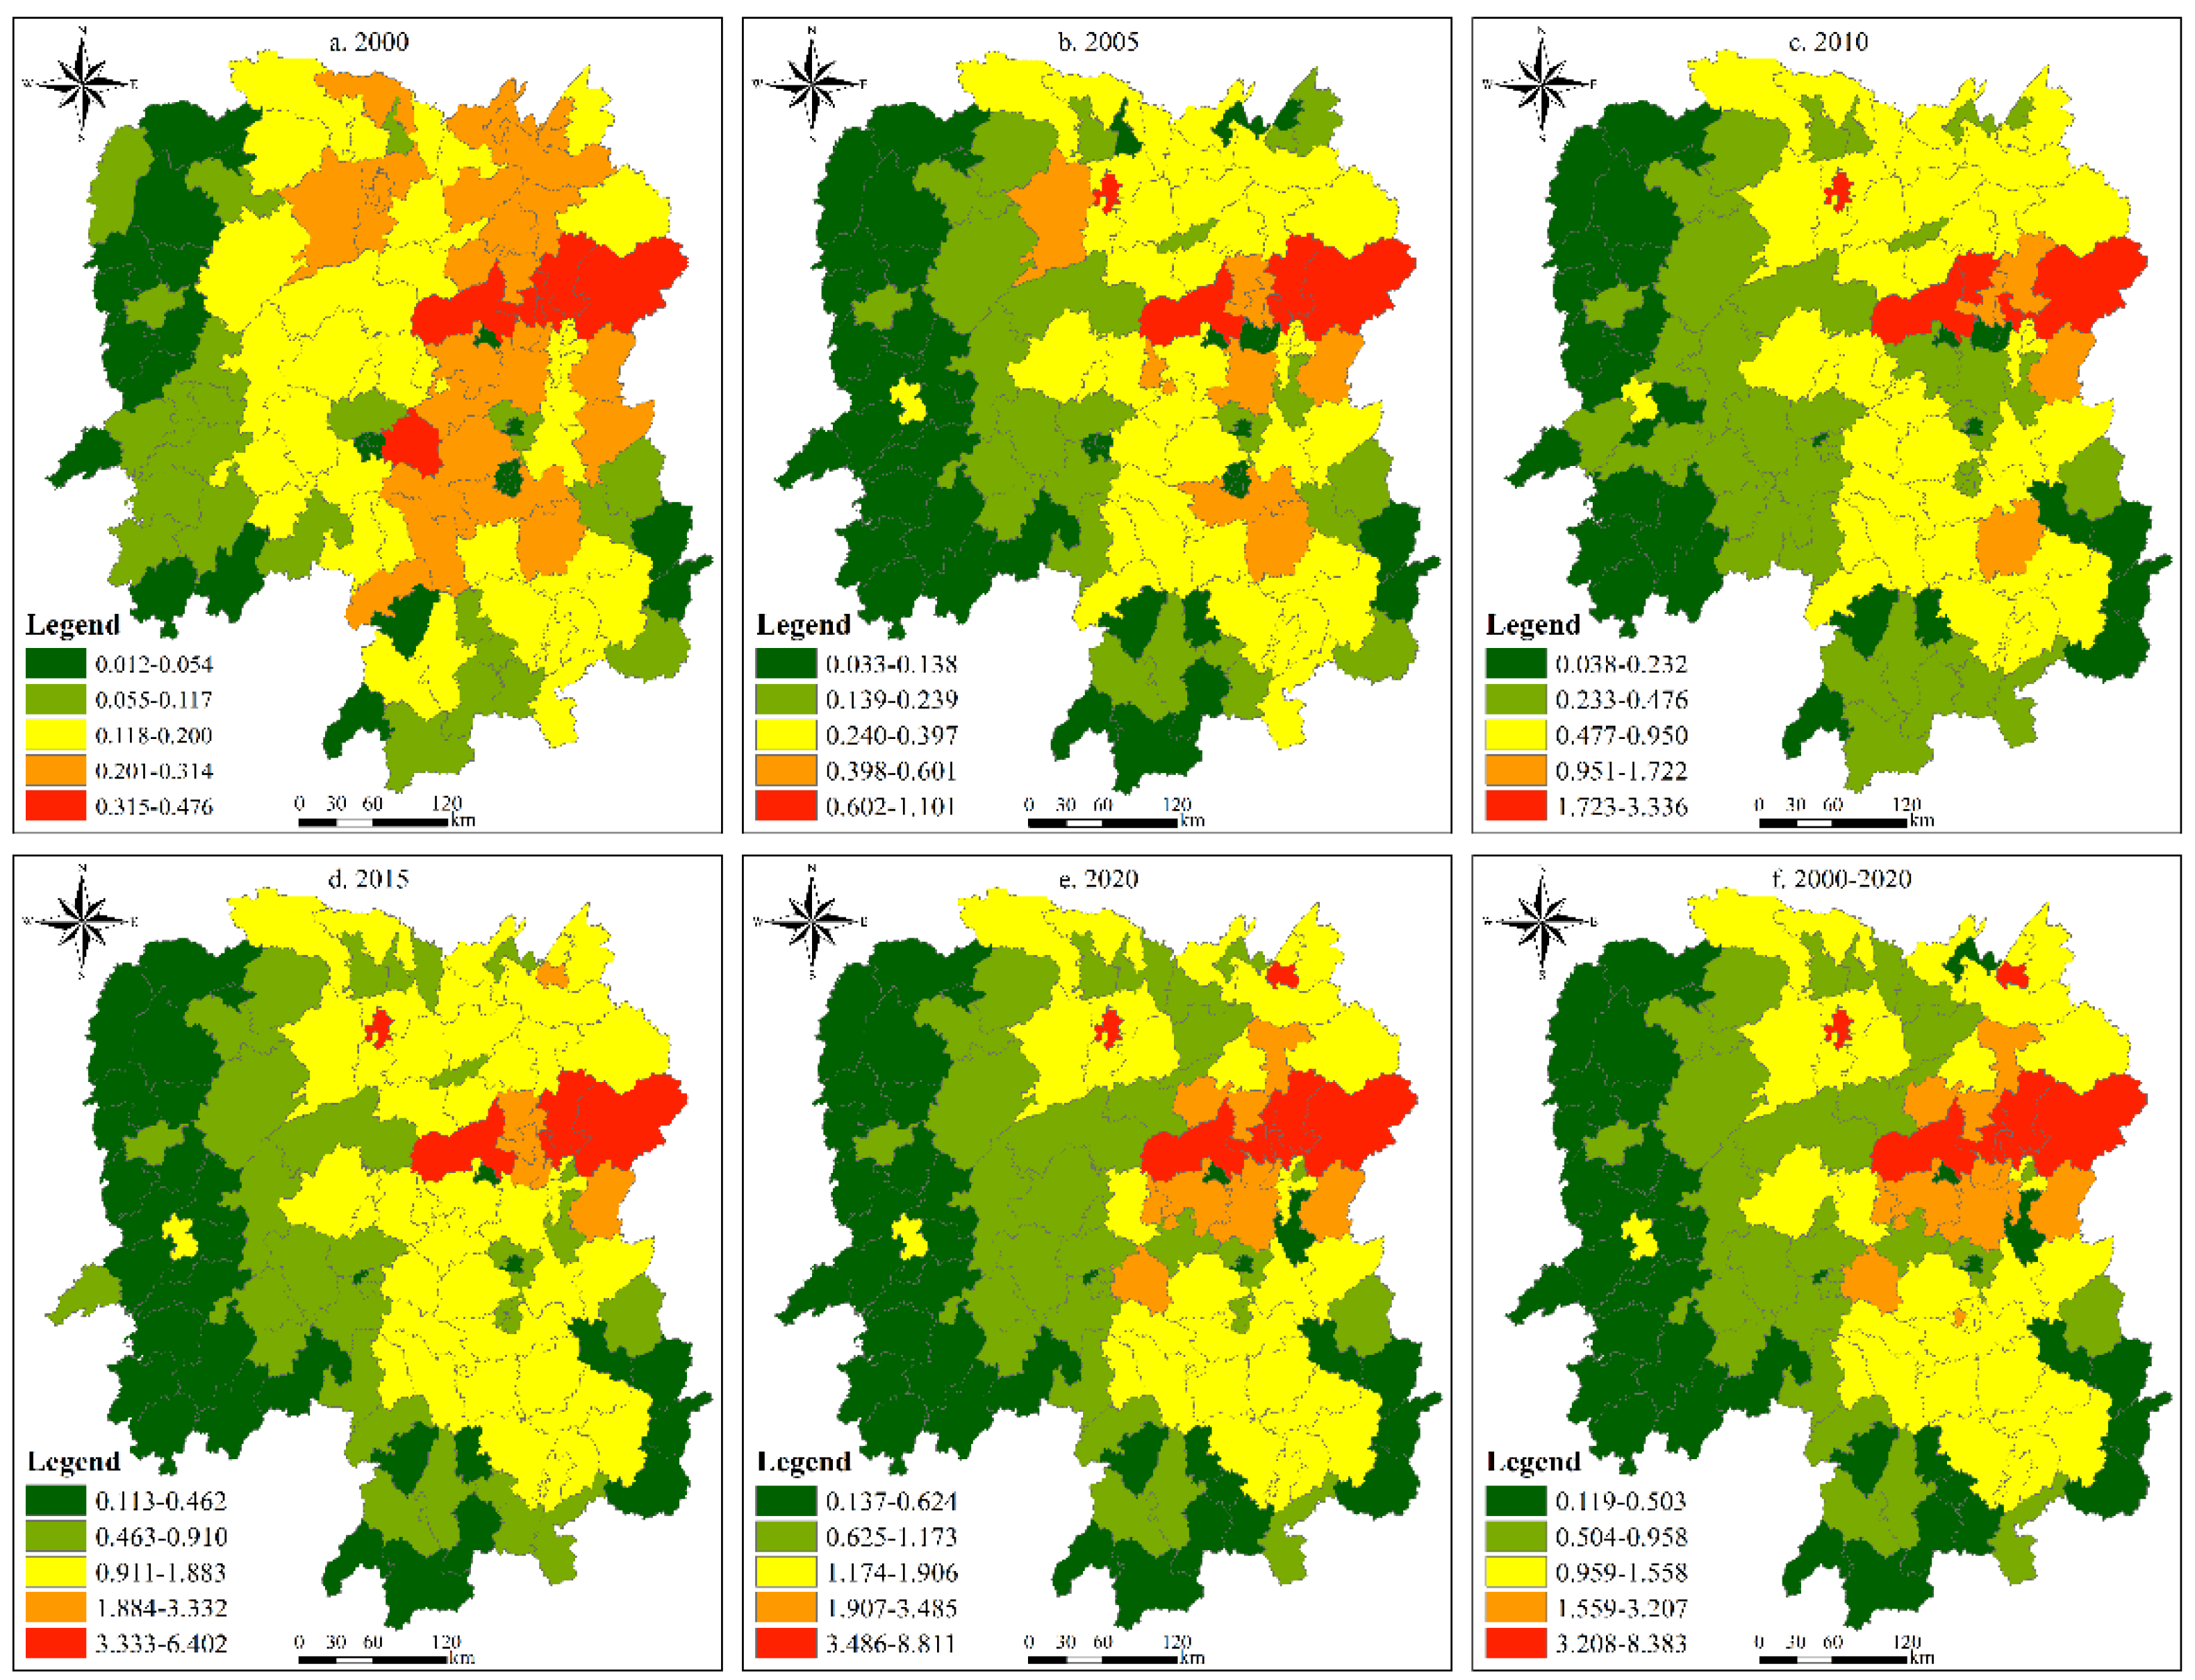
3.1. Spatiotemporal Distribution Patterns of RHSSR

From 2000 to 2020, the RHSSR level in Hunan Province displayed an overall upward trend, with the average value increasing from 0.158 to 1.406, and the growth rate reached 123.37% from 2005 to 2010, before gradually slowing down (Figure 2). In 2000, the RHSSR level in all counties was lower than 0.5. In the following five years, the RHSSR level slowly increased. The levels of RHSSR around the Changsha urban agglomeration and Wuling District exceeded 0.5 but were still generally lower than 1. However, in 2010, the RHSSR level increased rapidly in most counties. This is because in 2010, at the end of the 11th Five-Year Plan of Hunan Province, a series of policies supported new urbanization, agricultural modernization, resource conservation, and environmental friendly promoted the transformation and upgrading of the county-level human settlements. There were 12 counties with RHSSR scores over 1, and counties with levels over 0.5 accounted for 44.26% of the total. These areas were mainly distributed in the northeast, east, and southeast of Hunan Province, with the characteristics of “low-value areas distributed in high-value areas”. The number of counties with RHSSR levels exceeding 1 in 2000–2010 and 2015–2020 were 51 and 60, respectively, and the highest values were still concentrated around the Changsha urban agglomeration and Wuling District.
From a spatial perspective, the RHSSR level in Hunan Province generally presented a three-level stepped spatial distribution feature of “high in the east and low in the west, with a banded distribution”. There was a significant similarity with the spatial distribution of LUI in China. During the study period, there were low RHSSR levels in western Hunan with no significant improvement, which was mainly due to the weak economic development, under-developed rural infrastructure, serious hollowing out of villages, and low openness of the resident ethnic minorities to the outside world, resulting in relatively low RHSSR levels. In contrast, the RHSSR level in the Changsha–Zhuzhou–Xiangtan region increased annually over the study period, with the increases led by Changsha followed by Hengyang, Yueyang, Changde, Chenzhou, and Yiyang. This was mainly because eastern Hunan is a pioneering area for economic development, especially under the influence of Hunan Province’s regional development strategy of “highlighting the core, developing on a point axis, and strengthening the driving role of the Changsha–Zhuzhou–Xiangtan metropolitan area”. The construction rate of rural human settlement far exceeded the construction rate in non-central urban areas.

3.2. Analysis of LUCC in Hunan Province from 2000 to 2020

3.2.1. Analysis of Landscape Type Changes

In 2000, forest land accounted for the largest proportional land cover (62.02%) in Hunan Province, followed by cultivated land (29.35%), while the other four LUCC types (grassland, water bodies, built-up land, and unused land) accounted for only 8.63% of the total area. During the period of 2000–2020, various land cover types in Hunan Province changed significantly (total changed area of 7258.05 km2, equivalent to 3.43% of the province). During the study period, the area of cultivated land and grassland continuously decreased, with total decreases of 2948.01 and 682.88 km2, respectively, while the area of other land cover types increased (Figure 3a). The area of built-up land increased annually. Compared with 2000, the area of built-up land in 2020 had expanded by 3.4 times. In contrast, rural residential areas displayed a fluctuating trend of first increasing, then decreasing and then increasing, with an increase of only 16.24 km2 from 2000 to 2020. The area of unused land increased rapidly during 2005–2010, with a growth rate of 40.8%. In contrast, there was little fluctuation in forest land.
Figure 3b shows that from 2000 to 2020, the main types of land cover transferred out from Hunan Province were cultivated land and forestland, with areas of 8429.31 and 7996.2 km2 transferred, respectively. From 2000 to 2005, the transfer of land cover accounted for only 8.26% of the total transferred area during the study period. Over this time, cultivated land was mainly transferred to forestland (56.24%), water bodies (17.33%), and built-up land (23.56%), while the area of forestland transferred to cultivated land and built-up land accounted for 65.99% and 21.27%, respectively. The characteristics of land cover transfer in other research periods were also dominated by the conversion between cultivated land and forest land. Notably, from 2005 to 2010, a large area of water bodies was converted into cultivated land (44.88%) and unused land (39.73%), and a large amount of grassland was converted into forestland (83.15%). Compared with previous periods, many different land use types transitioned into cultivated land and forestland in 2020, resulting in significant increases in these land use types. In addition, in the area in which farmland was returned to forest in 2020, cultivated land and grassland accounted for 90.3% of the total transferred. At the same time, the increased area of built-up land was mainly due to conversions from cultivated land, forestland, and water bodies, while the area of water bodies was mainly converted from cultivated land, forest land, and unused land.

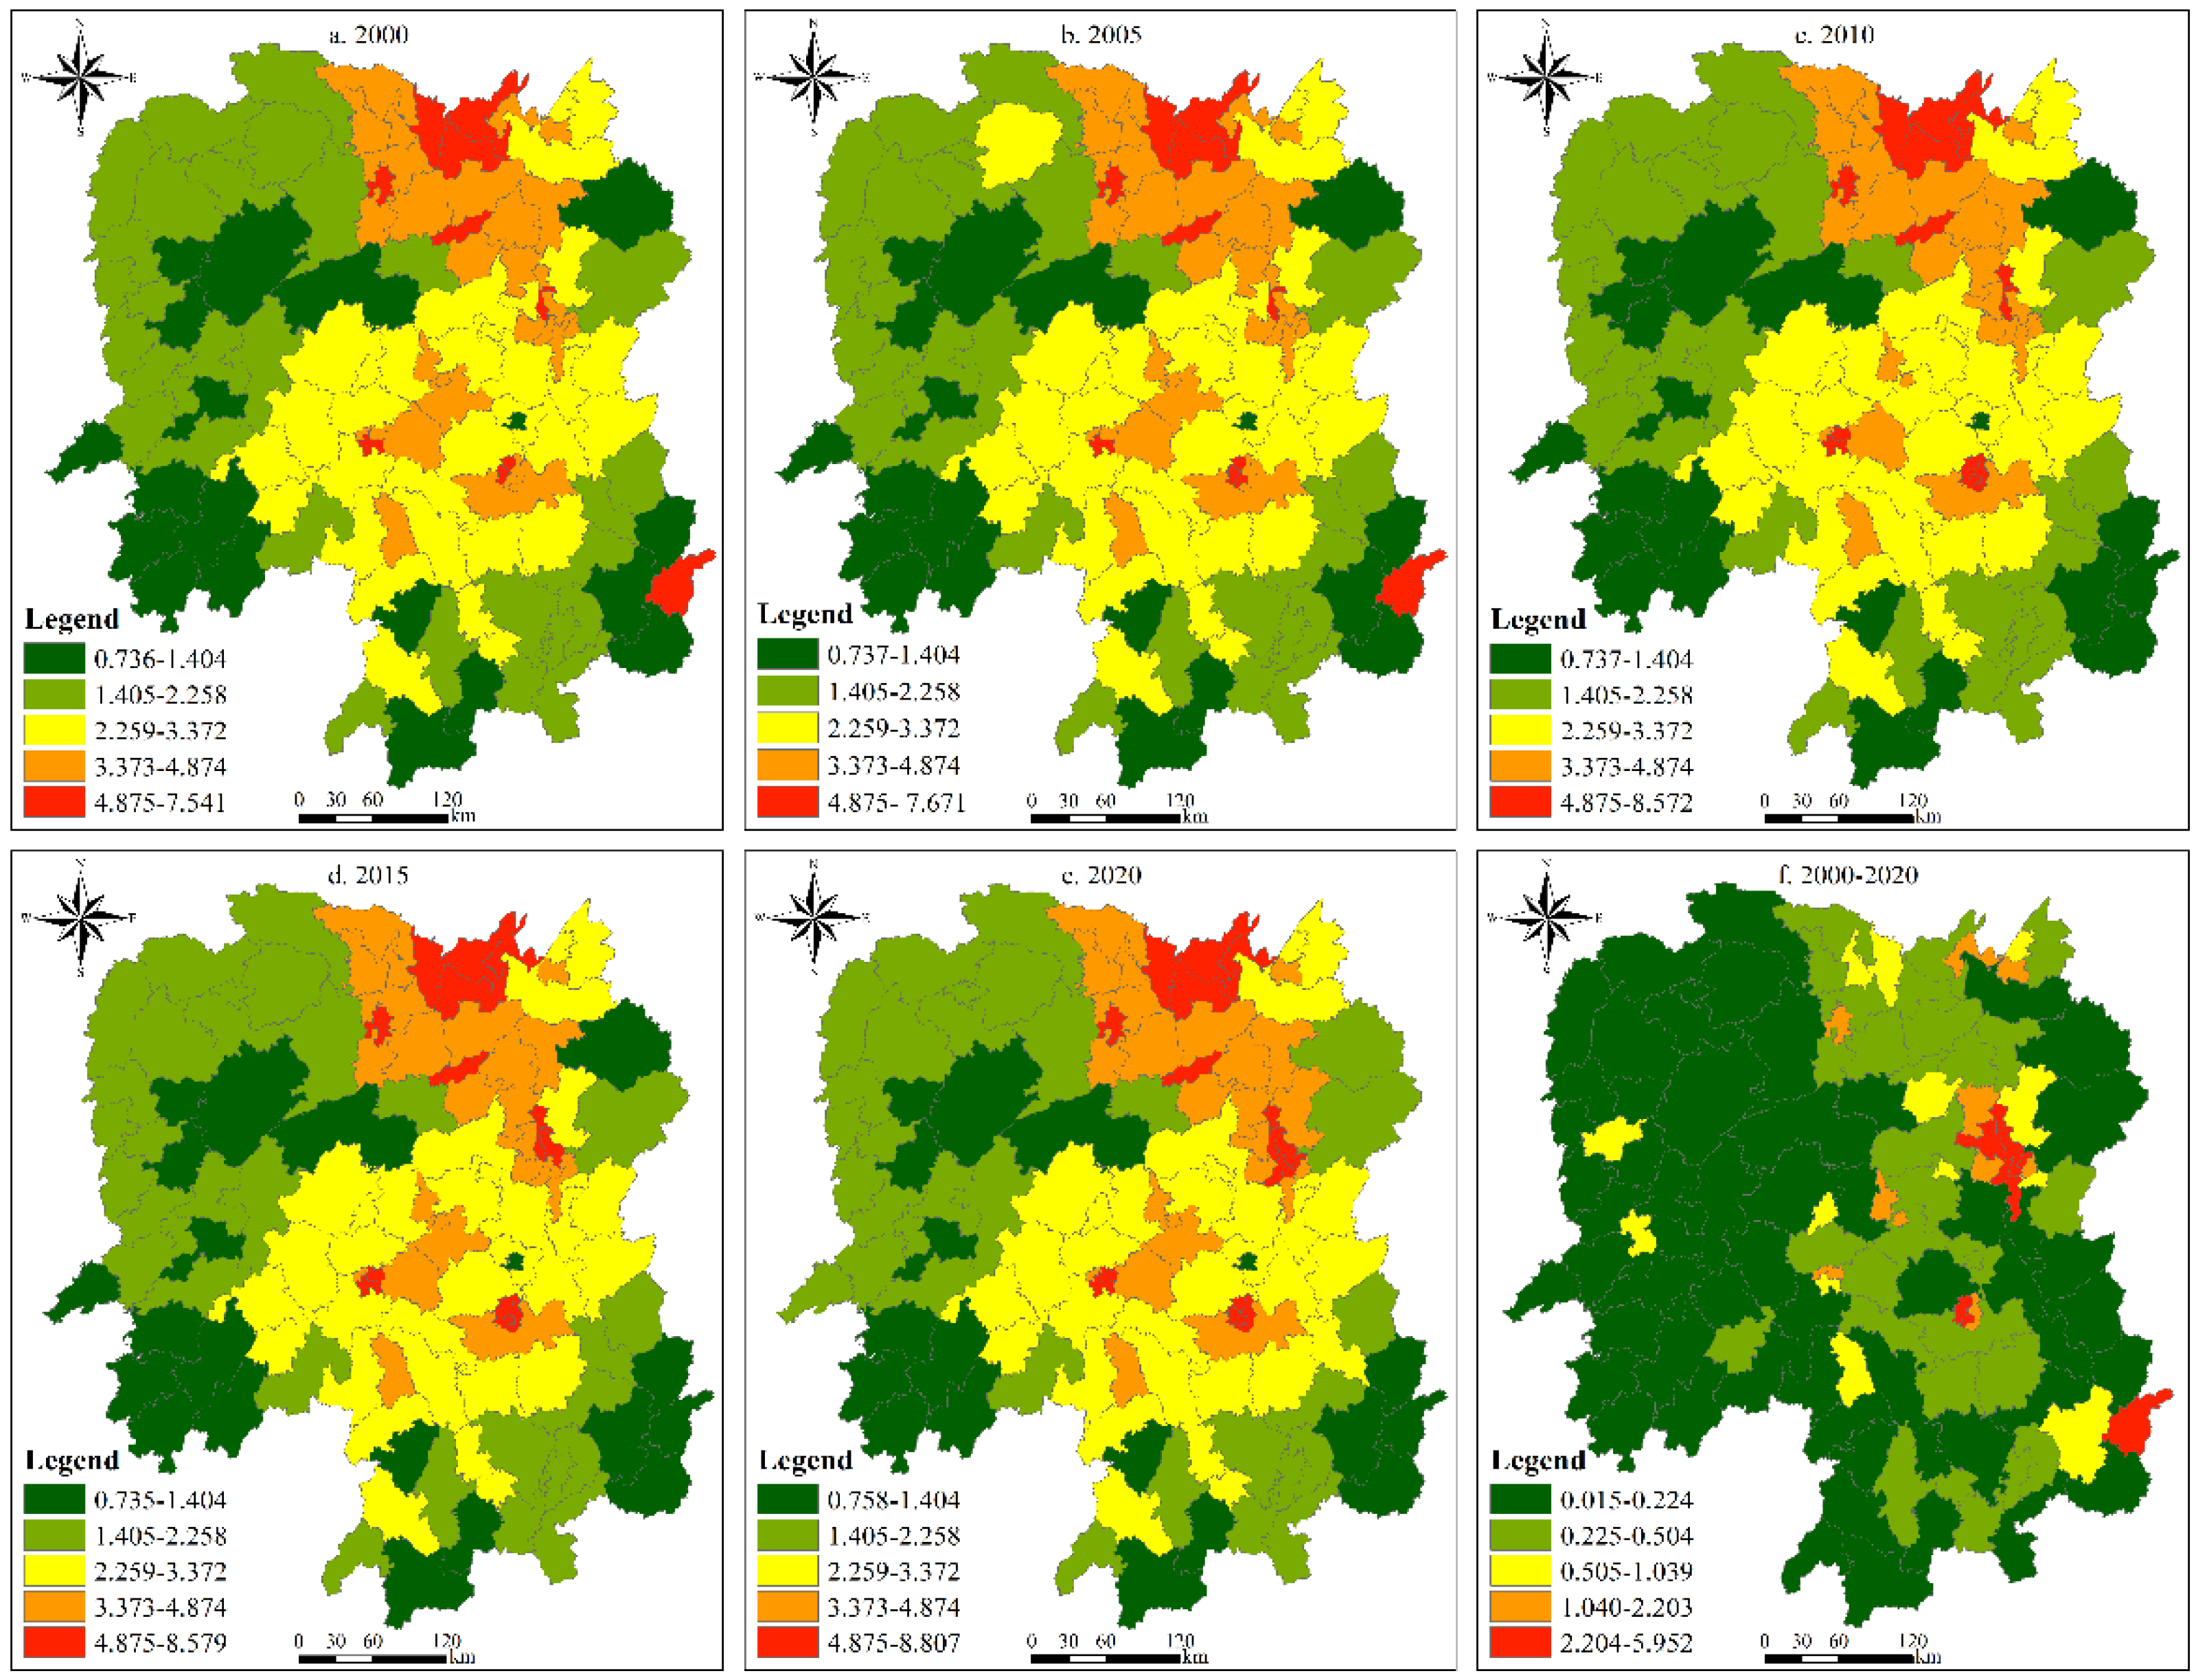
3.2.2. Spatiotemporal Distribution Patterns of LUI

In 2000, 2005, 2010, 2015, and 2020, the LUIs in Hunan Province were 2.311, 2.317, 3.676, 3.785, and 3.809, respectively, displaying an overall upward trend. The counties that had the highest LUI during 2000–2010 were mainly distributed in the Dongting Lake Basin, Changsha City, Hengyang City, Shaoyang City, Loudi City, and their surrounding areas. The LUI gradually weakened in the subsequent period but was still dominated by urban agglomerations and urban centers. From the spatial perspective, during 2000–2020, the LUI was significantly higher in the east than in the west, with a spatial distribution pattern of high in the northeast and low in the southwest (Figure 4). The distribution of LUI in the northeastern region was characterized by low-value areas distributed in high-value areas, and in the southwestern region by high-value areas distributed in low-value areas.
The specific (LUI) changes in each study period (Figure 4) can be summarized as follows. First, the Dongting Lake Basin, as well as urban areas of Changsha, Shaoyang, and Hengyang, were dominant in each study period, while there was no change in LUI in the western Hunan region. Second, there was a fluctuating trend of low–medium LUI values in some counties in southern and central Hunan, including Ningyuan County, Zixing City, Guidong County, Anren County, Shaoyang County, Wugang City, and Qidong County. Third, the high-value area of LUI was not located in the surrounding areas of the provincial capital Changsha City but in the surrounding counties and cities of the Dongting Lake Basin. Except for the Dongting Lake Basin, the LUI of the counties at the junction was generally low, and the median LUI values were distributed in the central Hunan area.

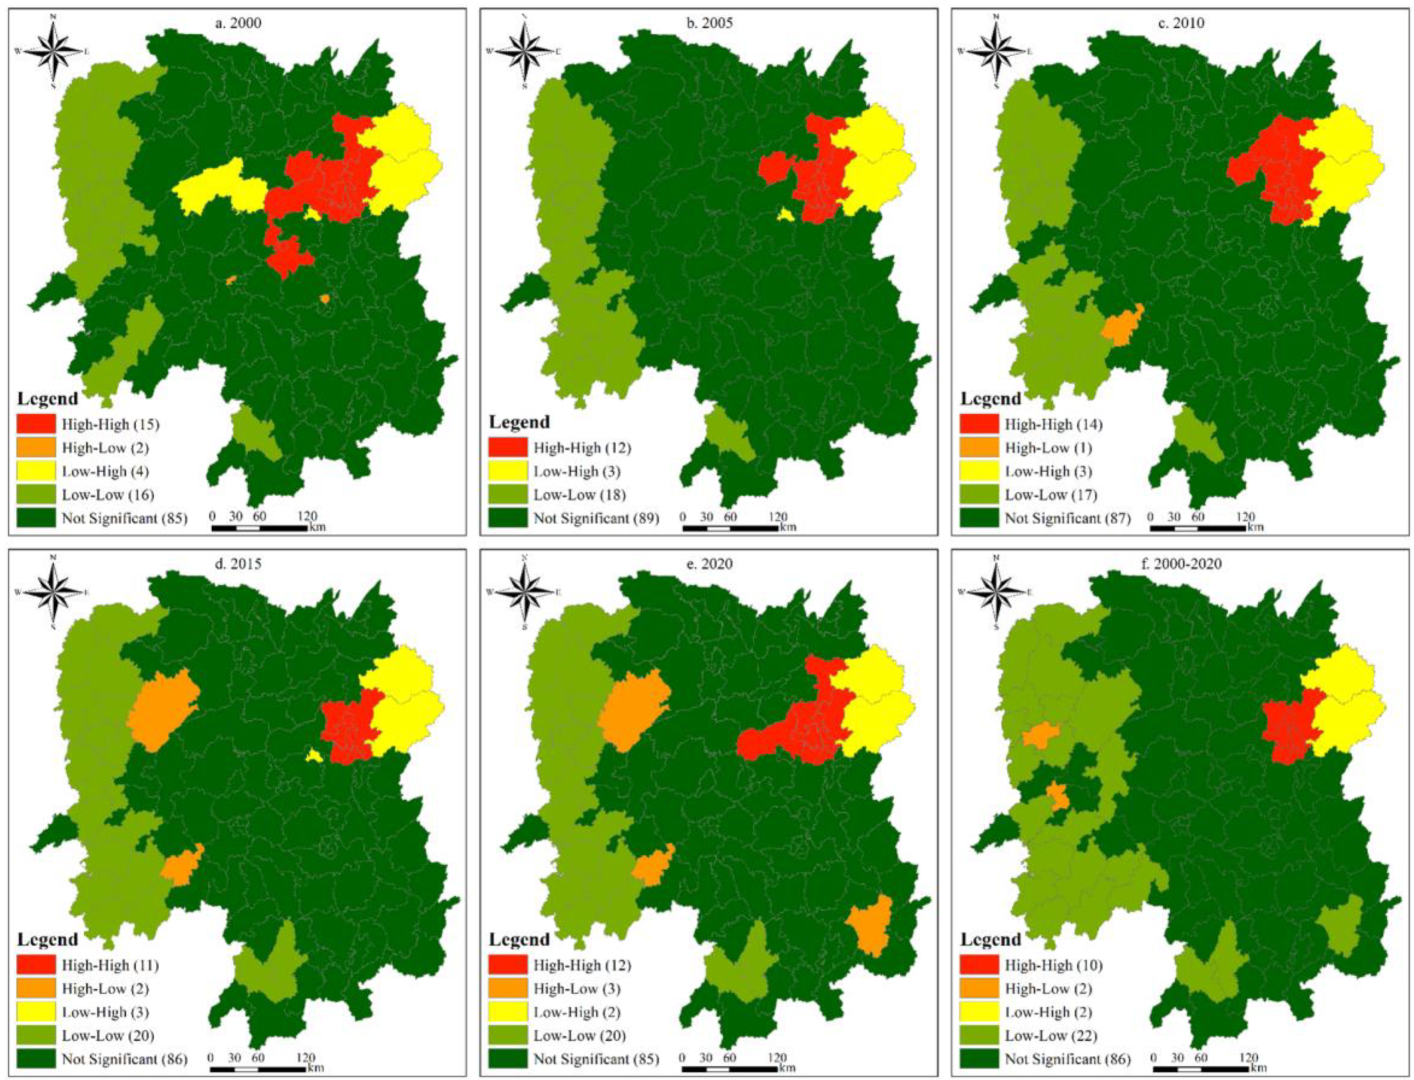
3.3. Spatial Association of RHSSR with LUI

The Rook spatial weight matrix was established using GeoDa 1.20 software, and the calculated result from Formula (5) passed the significance test at the level of p < 0.01. During 2000, 2005, 2010, 2015, and 2020, the Moran’s I values for the RHSSR and LUI association in Hunan Province were 0.577, 0.493, 0.443, 0.545, and 0.56, respectively (p < 0.001), indicating a strong positive spatial correlation, and the agglomeration effect was significant. To further clarify the spatial correlation between RHSSR and LUCC, a bivariate spatial autocorrelation analysis was performed on RHSSR and LUI. We found that the bivariate spatial autocorrelation coefficients of RHSSR and LUI in Hunan Province in 2000, 2005, 2010, 2015, and 2020 were 0.378, 0.341, 0.372, 0.388, and 0.423, respectively. The spatial relationship between RHSSR and LUI displayed a gradually significant positive correlation, indicating that the increase in LUI not only led to an enhancement of RHSSR in the adjacent area but also to an overall increase in the surrounding area.
The spatial interaction relationship between RHSSR and LUI in each period was analyzed by a bivariate spatial autocorrelation, and a LISA aggregation map of the evolution of RHSSR and LUI from 2000 to 2020 was constructed (Figure 5). We found a significant spatial heterogeneity (p < 0.05) in the spatial relationship between RHSSR and LUI in Hunan Province. In particular, the high–high- and low–low-type agglomerations were very prominent, with the low–low-type having the largest area, mainly in Xiangxi Tujia Autonomous Prefecture and Huaihua City, showing a zonal distribution. Combining the RHSSR and LUI of Xiangxi and Huaihua, it was observed that the LUI in the two places was relatively low, and the impact on RHSSR was relatively small, thus highlighting the main clustering characteristics of low LUI and low RHSSR. We also observed that due to the spatial proximity effect, a low–high agglomeration developed immediately adjacent to the Changzhou–Zhuzhou–Xiangtan high–high agglomeration, mainly in Pingjiang County and Liuyang City. This suggested that the rapid economic development of Changzhou–Zhuzhou–Xiangtan in the last 20 years had a significant impact on the increase in RHSSR levels in the urban periphery.

3.4. The Driving Forces of RHSSR

From the five RHSS subsystems, 13 single factors were selected for a driving force detection analysis, and the q-statistics of each factor were calculated by the factor detector to reveal their relative influence on the change of RHSSR intensity. The results are shown in Table 2. From the perspective of time series changes in the importance of the driving factors, the ranges of q values from 2000 to 2020 were 0.282, 0.209, 0.342, 0.392, and 0.294, showing a fluctuating trend. Except for the GDP per capita in 2005, the total power of agricultural machinery in 2020, as well as the primary school students in 2010–2020, all other influencing factors had a significant impact on RHSSR (p < 0.05). Among all the factors, the explanatory power of the added value of secondary industry was always the highest (more than 34%). In 2000, the q value was dominated by the total sown area, health personnel, hospital beds, and the added value of primary industry, which could be attributed to the rapid development of the human and social subsystems. In 2005, the dominant driving factors of the q value were public budgetary expenditure, hospital beds, health personnel, and total sown area. In 2010, the q value was dominated by the total power of agricultural machinery, public budgetary expenditure, per capita net income of farmers, and forest cover rate, which could be attributed to the development of agricultural modernization, government regulation, residents’ income and expenditure, and environmental protection. In 2015, the leading driving factors of the q value were the number of beds in hospitals and health centers, per capita net income of farmers, health workers, and annual sunshine hours. In 2020, the q value was dominated by hospital beds, forest cover rate, GDP per capita, and the per capita net income of farmers, which could be attributed to the overall improvement of the natural, residential, and social subsystems.
The interaction effect of each pair of factors on the change of RHSSR was calculated by an interaction detection analysis. The results very clearly showed that the interaction q-statistics for paired factors were larger than the corresponding individual-factor interaction q-statistics, suggesting that the explanatory power of individual factors may be enhanced when interacting with other factors [52]. As shown in Figure 6, across all interactions, 15, 27, 33, 32, and 34 pairs exhibited a non-linear enhancement (red numbers) in 2000, 2005, 2010, 2015, and 2020, respectively, while the numbers of bivariate enhancements (black numbers) were 63, 51, 44, 45, and 42 pairs, respectively. From 2000 to 2020, the interaction effects between the added value of the secondary industry and other factors were greater than 0.38, but over time the interaction effects gradually decreased. In addition, during 2000–2005, variables related to medical services were the dominant factors affecting RHSSR, while variables related to residents’ income and expenditure had a lower impact on RHSSR. However, from 2010 to 2020, the interaction between household income and expenditure and other factors gradually strengthened, and the interaction between agricultural development and other factors gradually weakened. This shows that increasing the sources of income to include activities other than agriculture would be an effective measure to improve the RHSSR level.

4. Discussion

To deal with social problems such as ecological pollution, deteriorating living environment, lack of public services, and rural hollowing accompanied by rural decline, the Chinese government began to focus on the development of “agriculture, rural areas, and farmers” from the aspects of environmental governance and policies to benefit farmers. This approach gradually evolved into rural strategic actions such as improvement of the rural human settlement, beautiful countryside, targeted poverty alleviation, and rural revitalization [54,55]. This means that the determinant factors affecting RHSSR are not unique, and we found that there is obvious temporal heterogeneity in the strength of different influencing factors on RHSSR. Among them, industrial development, medical services, farmers’ income, and living environment have significant correlations with RHSSR, which is consistent with the results of Zhao et al. [56] and Ge et al. [10], confirming the applicability of the RHSSR analysis framework.
Land use is a mirror of rural social and economic development, and changes in rural social and economic development will be reflected in land use. The results of this study show that there is a significant positive spatial correlation between LUI and RHSSR, especially in western Hunan, where RHSSR is closely related to unused land reclamation, ecological industrial land improvement, and the construction of mountainous green agricultural production projects. Although the LUI reveals the natural balance of the land use system in natural and unnatural situations, it still cannot fully explain whether the internal land use of the rural human settlement system is reasonable [40]. Based on the comprehensive index, the level of RHSSR in Hunan Province shows a significant improvement trend, which is consistent with recent research and can be attributed to the implementation of policies such as targeted poverty alleviation and improvement of rural human settlements [57]. Second, the development of natural subsystems, residential subsystems, and support subsystems lags that of human subsystems and social subsystems. Industrial development and medical services are the key to improving the human subsystems and social subsystems, respectively. In recent years, the improvement of RHSSR in Hunan Province mainly depends on these two aspects. However, there is heterogeneity in the intensity of land use change and the degree of socioeconomic development at different scales, and the explanatory power of the subsystems that constitute the rural human settlement environment also varies with the research scale [58]. In addition, the geographical detector model was used to explore the driving mechanism of RHSSR changes at the county-level unit scale. It not only focused on the strength of a single influencing factor on RHSSR and its temporal change trend but also explored the strength and change trend of multi-factor interactions on RHSSR, which are often ignored in traditional econometric model studies.
At the same time, this study makes us realize that RHSSR is the result of a combination of factors, and that the dominant factors vary in different periods and regions. Scholars should further trace the origin and implement measures according to the principle of grading, classifying, and zoning. Combined with the results of the study on the large differences in the level and spatial pattern of RHSSR in Hunan Province and the many driving factors, the following suggestions are put forward for the practice of optimizing the human settlement system in Hunan Province: (1) Refine the resilience classification and degree of grading at the village and town scale, identify the dominant driving factors, and implement graded and classified precision policy. For low-value units, key supervision and control should be carried out to scientifically prevent all kinds of risks from the perspective of resilience and rationally control the development and utilization within the system. For high-value units, the stability of the resilience system and its self-regulation ability should be continuously strengthened, and the efficient and green utilization mode of resource elements should be explored in order to actively promote the development and transformation of the surrounding units. (2) Implement interregional linkage regulation and zonal differentiated governance based on comprehensive consideration of natural geography, infrastructure, and industrial scale. And then, it would be useful to give full play to the advantages of Changsha City and its neighboring areas, which are close and in good condition in terms of fast resilience formation and strong elasticity, as well as to overflow the strong resilience effect to other areas through the network of transportation facilities and modern communication technology. Meanwhile, regarding the peripheral villages in western Hunan, where there is a lack of rapid formation of resilient conditions, to dig deeper into the local natural and human resources to find relative advantages and breakthrough paths; establish all-round cooperation in industry, culture, and trade with developed areas; and improve regional collaborative governance network and the urban–rural integration development system.

5. Conclusions

The RHSS is a complex mega-system that integrates human activity, nature, the economy, and society, consisting of many elements that together form a coupled symbiosis of mutual influence and interaction. Based on county-level spatial panel data for Hunan Province from 2000 to 2020, a system of RHSSR evaluation indicators was constructed, and the spatiotemporal evolution pattern of RHSSR was analyzed using a geospatial analysis method and the geodetector model. The degree of spatial differentiation of natural, human, and socio-economic factors associated with RHSSR was analyzed as well as the driving mechanism of RHSSR evolution. The following conclusions were reached.
(1)
The area of built-up land in Hunan Province increased annually, and the area of built-up land has expanded by 3.4 times in the past 20 years, while the rural residential areas showed a fluctuating trend of first increasing, then decreasing, and then increasing. This shows that rapid urbanization has caused major changes in the pattern of urban and rural residential areas. At the same time, the RHSSR level increased, with the average value increasing from 0.158 to 1.406, indicating that human activities have changed various elements of the human settlement system, resulting in a more pleasant natural environment, better infrastructure, more convenient public services, a more harmonious cultural environment, and more habitable housing conditions.
(2)
From 2000 to 2020, the resilience level of the rural human settlement in Hunan Province generally presented a three-level stepped spatial distribution feature of “high in the east and low in the west, with a belt-like distribution”. The RHSSR was highly consistent with LUI, with both having the characteristics of “low value areas are distributed in high value areas” and “high value areas are distributed in low value areas”. During 2000–2020, there was significant spatial heterogeneity in the spatial relationship between LUI and RHSSR, with high–high and low–low agglomerations being particularly prominent.
(3)
The evolution of RHSSR is the result of factors such as industrial development, improvements in medical services, increased income, and environmental protection. As a pillar of early rural economic development, the role of influencing factors such as the sown area, total agricultural machinery power, value added of primary industry, and primary school students on RHSSR gradually diminished with the transformation of agriculture, establishment of road construction projects, and human settlement improvements. Interactions between improved health services, population income, industrial development, and other factors can enhance the impact of RHSSR evolution.
This study also has some deficiencies. Firstly, the measure of LUI in this study was an expert-based weight assignment of different land use types, and the evaluation result was slightly subjective. Future weight assignments need to consider more physical factors (e.g., elevation, slope, and climate) and socioeconomic factors [40]. Secondly, only the relationship between the dominant morphology of LUCC and the RHSSR was considered, but not the effect of recessive morphology (e.g., property rights, output capacity, and land use function) from the microscopic level lacking [59,60]. Lastly, the empirical data mainly come from statistical data, and future research should include micro-level survey data to improve the RHSSR evaluation index system [27].
In addition, future research can focus on the following aspects. (1) LUI is significantly correlated with RHSSR and shows an increasing trend year by year, and regional land use transformation has become a key point to optimize urban and rural human settlements. At present, the spatial mismatch contradiction of global land resources remains prominent, resulting in the urban and rural habitat systems facing the “paradox” of congested urban space and hollowed-out rural space, respectively. In order to cope with this practical dilemma, it is urgent to clarify the coupling points and interaction mechanisms between different regions, different types of land use, and urban–rural habitat systems, as well as how to optimally regulate the land use transitions by comprehensively applying economic, social, and engineering technological means and methods [61], thereby enhancing RHSSR. (2) The RHSSR of urban and rural have spatial proximity and spatial spillover effects, which will affect the surrounding units over time. This regional linkage model, which is extended from the spatial spillover effect, has jumped out of the constraints of traditional administrative divisions to a certain extent and provided new ideas for the optimization of the regional human settlement environment. However, its limited spillover distance and scope make it difficult to match the current trend of external globalization and internal urban–rural integration. Facing the telecoupled world with increasingly close regional connections [62], how can remote villages seize the opportunities of the flow of external resources, information, technology, and other types of factors, as well as utilize external forces to open up the closed loop of the rural human settlements system? Can the city establish a remote collaborative governance mechanism with the rural system through means such as transfer payment, thus alleviating the pressure of population, environment, and transportation in the urban human settlement system? These questions need to be studied further.

Author Contributions

Conceptualization, L.T., Y.H. and Y.J.; methodology, L.T. and Y.H.; software, Y.H.; validation, L.T., Y.H., Y.J. and D.F.; formal analysis, Y.H.; investigation, L.T.; resources, L.T.; data curation, L.T., Y.H., Y.J. and D.F.; writing—original draft preparation, L.T. and Y.H.; writing—review and editing, L.T., Y.H., Y.J. and D.F.; visualization, L.T. and Y.H.; supervision, L.T., Y.H. and Y.J.; project administration, L.T.; funding acquisition, L.T. All authors have read and agreed to the published version of the manuscript.

Funding

“This research was funded by National Natural Science Foundation of China, Grant No. 42101214 and 41971216”; “The China Postdoctoral Science Foundation, Grant No. 2021M703177”; and “The Hunan Provincial Natural Science Foundation, Grant No. 2022JJ30187”.

Data Availability Statement

Not applicable.

Acknowledgments

The authors extend great gratitude to the anonymous reviewers and editors for their helpful reviews and critical comments.

Conflicts of Interest

The authors declare no conflict of interest.

References

  1. Argent, N. Rural geography II: Scalar and social constructionist perspectives on climate change adaptation and rural resilience. Prog. Hum. Geogr. 2019, 43, 183–191. [Google Scholar] [CrossRef]
  2. Li, Y. A systematic review of rural resilience. China Agric. Econ. Rev. 2023, 15, 66–77. [Google Scholar] [CrossRef]
  3. Zhao, X.; Xiang, H.; Zhao, F. Measurement and Spatial Differentiation of Farmers’ Livelihood Resilience Under the COVID-19 Epidemic Outbreak in Rural China. Soc. Indic. Res. 2023, 166, 239–267. [Google Scholar] [CrossRef] [PubMed]
  4. Holling, C.S. Resilience and Stability of Ecological Systems. Annu. Rev. Ecol. Evol. Syst. 1973, 4, 1–23. [Google Scholar] [CrossRef] [Green Version]
  5. Bristow, G. Resilient Regions: Re-‘place’ing Regional Competitiveness. Camb. J. Reg. Econ. Soc. 2009, 3, 153–167. [Google Scholar] [CrossRef]
  6. Yang, Y. Research hotspots and evolution trends of rural resilience in the perspective of biodiversity—Based on citespace’s visual analysis of bibliometrics. Front. Environ. Sci. 2022, 10, 1029510. [Google Scholar] [CrossRef]
  7. Li, Y.; Song, C.; Huang, H. Rural Resilience in China and Key Restriction Factor Detection. Sustainability 2021, 13, 1080. [Google Scholar] [CrossRef]
  8. Gallopín, G.C. Linkages between vulnerability, resilience, and adaptive capacity. Glob. Environ. Chang. 2006, 16, 293–303. [Google Scholar] [CrossRef]
  9. Heijman, W.; Hagelaar, G.; van der Heide, M. Rural resilience as a new development concept. In EU Bioeconomy Economics and Policies; Dries, L., Heijman, W., Jongeneel, R., Purnhagen, K., Wesseler, J., Eds.; Springer International Publishing: Cham, Switzerland, 2019; Volume II, pp. 195–211. [Google Scholar] [CrossRef]
  10. Ge, D.; Zheng, Y.; Zhang, S.; Fu, J.; Su, F. Spatio-temporal pattern and influence mechanism of rural human settlements system resilience: Case from China. Sustainability 2022, 14, 14533. [Google Scholar] [CrossRef]
  11. Huang, X.; Li, H.; Zhang, X.; Zhang, X. Land use policy as an instrument of rural resilience-the case of land withdrawal mechanism for rural homesteads in China. Ecol. Indic. 2018, 87, 47–55. [Google Scholar] [CrossRef]
  12. Olsson, L.; Jerneck, A.; Thorén, H.; Persson, J.; O’Byrne, D. Why resilience is unappealing to social science: Theoretical and empirical investigations of the scientific use of resilience. Sci. Adv. 2015, 1, 1400217. [Google Scholar] [CrossRef] [PubMed] [Green Version]
  13. Wang, C.; Dai, R.; Chen, J.; Shen, Y.; Ji, M. Research on the evolution law and promotion pathway of rural human settlements system resilience: A case study of Western Chongqing, a national pilot area for urban-rural integration. J. Nat. Resour. 2022, 37, 645–661. [Google Scholar] [CrossRef]
  14. Howard, E. Garden Cities of Tomorrow; S. Sonnenschein & Co., Ltd.: London, UK, 1902. [Google Scholar]
  15. Doxiadis, K. Ekistics: An Introduction to the Science of Human Settlements; Oxford University Press: Oxford, UK, 1968; Volume 60, p. 147. [Google Scholar]
  16. Greber, K.; Shelton, G. Assessment of neighborhood satisfaction by residents of three housing types. Soc. Indic. Res. 1987, 19, 303–315. [Google Scholar] [CrossRef]
  17. Li, Y.; Zhang, X.; Chen, Y. The impact of human settlement quality on rural development: A quantitative analysis based on the cross-sectional data of sampled villages in Jiangsu province. China Popul. Res. Environ. 2020, 30, 158–167. (In Chinese) [Google Scholar]
  18. Tang, L.; Long, H.; Ge, D. Spatial differentiation characteristics and mechanism of rural human settlement resilience formation: A case study of Dongting Lake area. Acta Geogr. Sin. 2023, 78, 1339–1354. (In Chinese) [Google Scholar]
  19. Qu, Y.; Dong, X.; Ping, Z.; Guan, M. Quality evaluation and improvement strategies of rural residential areas utilization from the perspective of human and land coordination. Trans. Chin. Soc. Agric. Eng. 2021, 37, 252–262. (In Chinese) [Google Scholar]
  20. Zhu, Y.; Zhou, X.; Luo, J. Spatio-temporal evaluation of rural human settlements quality and its differentiations in urban agglomeration in the middle reaches of the Yangtze River. Econ. Geogr. 2021, 41, 127–136. (In Chinese) [Google Scholar]
  21. Lin, S.; Hou, L. SDGs-oriented evaluation of the sustainability of rural human settlement environment in Zhejiang, China. Heliyon 2023, 9, e13492. [Google Scholar] [CrossRef]
  22. Ciolac, R.; Adamov, T.; Iancu, T.; Popescu, G.; Lile, R.; Rujescu, C.; Marin, D. Agritourism—A Sustainable Development Factor for Improving the ‘Health’ of Rural Settlements. Case Study Apuseni Mountains Area. Sustainability 2019, 11, 1467. [Google Scholar] [CrossRef] [Green Version]
  23. Qu, Y.; Zhan, L.; Jiang, G.; Ma, W.; Dong, X. How to Address “Population Decline and Land Expansion (PDLE)” of rural residential areas in the process of Urbanization: A comparative regional analysis of human-land interaction in Shandong Province. Habitat Int. 2021, 117, 102441. [Google Scholar] [CrossRef]
  24. Amit-Cohen, I.; Sofer, M. Integrated rural heritage landscapes: The case of agricultural cooperative settlements and open space in Israel. J. Rural. Stud. 2017, 54, 98–110. [Google Scholar] [CrossRef]
  25. Yang, J.; Gao, Y.; Yang, X. Study on the integration of vulnerability and resilience of rural human settlements system based on Grounded theory: Evolutionary characteristics, paths and theoretical model. Geogr. Res. 2023, 42, 209–227. (In Chinese) [Google Scholar]
  26. Ma, R.; Wang, T.; Zhang, W.; Yu, J.; Wang, D.; Chen, L.; Jiang, Y.; Feng, G. Overview and progress of Chinese geographical human settlement research. J. Geogr. Sci. 2016, 26, 1159–1175. [Google Scholar] [CrossRef]
  27. Wang, Y.; Zhu, Y. Exploring the effects of rural human settlement on rural development: Evidence from Xianju County in Zhejiang Province, China. Environ. Dev. 2023, 46, 100845. [Google Scholar] [CrossRef]
  28. Zhang, R.; Zhang, X. Spatial Pattern Evolution and Driving Mechanism of Rural Settlements in Rapidly Urbanized Areas: A Case Study of Jiangning District in Nanjing City, China. Land 2023, 12, 749. [Google Scholar] [CrossRef]
  29. Tian, Y.; Jiang, G.; Zhou, D.; Zhou, T.; Ma, W. A Refined Rural Settlements Simulation Considering the Competition Relationship among the Internal Land Use Types: A Case Study of Pinggu District. Land 2022, 11, 661. [Google Scholar] [CrossRef]
  30. Long, H. Land Use Transitions and Rural Restructuring in China; Springer: Singapore, 2020. [Google Scholar]
  31. Liu, Y.; Li, Y. Revitalize the world’s countryside. Nature 2017, 548, 275–277. [Google Scholar] [CrossRef] [Green Version]
  32. Tang, H.; Wu, Y.; Chen, J.; Deng, L.; Zeng, M. How Does Change in Rural Residential Land Affect Cultivated Land Use Efficiency? An Empirical Study Based on 42 Cities in the Middle Reaches of the Yangtze River. Land 2022, 11, 2263. [Google Scholar] [CrossRef]
  33. Chen, W.; Zhou, T.; Liang, J. Urbanization, ecosystem services, and their interactive coercive relationship in Hunan Province, China. Environ. Sci. Pollut. Res. 2023, 30, 3416–3431. [Google Scholar] [CrossRef]
  34. Xu, X.; Liu, J.; Zhang, S.; Li, R.; Yan, C.; Wu, S. China Multi-Period Land Use Remote Sensing Monitoring Dataset (CNLUCC). Resource and Environmental Science Data Registration and Publishing System. 2018. Available online: http://www.resdc.cn/DOI (accessed on 3 May 2023).
  35. Liu, J.; Zhang, Z.; Xu, X.; Kuang, W.; Zhou, W.; Zhang, S.; Li, R.; Yan, C.; Yu, D.; Wu, S.; et al. Spatial patterns and driving forces of land use change in China during the early 21st century. J. Geogr. Sci. 2010, 20, 483–494. [Google Scholar] [CrossRef]
  36. Tang, L.; Ruth, M.; He, Q.; Mirzaee, S. Comprehensive evaluation of trends in human settlements quality changes and spatial differentiation characteristics of 35 Chinese major cities. Habitat Int. 2017, 70, 81–90. [Google Scholar] [CrossRef]
  37. Sun, X.; Zhou, Z.; Chen, Q. Study on the Coupling and Coordination Development of Population-economic-ecological Environment in Key Ecological Function Areas: A Case of Yanhe County of Guizhou. J. Chongqing Norm. Univ. (Nat. Sci. Ed.) 2017, 34, 127–134. (In Chinese) [Google Scholar]
  38. Huang, J.; Zhang, X. Research on Enterprise Patents Quality Evaluation Based on Objective Combination Weighting Model: Taking the Knowledge-intensive Enterprises in Wuzhong District of Suzhou City as an Example. Sci. Technol. Manag. Res. 2020, 40, 133–141. (In Chinese) [Google Scholar]
  39. Pan, N.; Guan, Q.; Wang, Q.; Sun, Y.; Li, H.; Ma, Y. Spatial Differentiation and Driving Mechanisms in Ecosystem Service Value of Arid Region: A case study in the middle and lower reaches of Shule River Basin, NW China. J. Clean. Prod. 2021, 319, 128718. [Google Scholar] [CrossRef]
  40. Chen, W.; Chi, G.; Li, J. The spatial association of ecosystem services with land use and land cover change at the county level in China, 1995–2015. Sci. Total Environ. 2019, 669, 459–470. [Google Scholar] [CrossRef]
  41. Chen, W.; Zeng, J.; Li, N. Change in land-use structure due to urbanisation in China. J. Clean. Prod. 2021, 321, 128986. [Google Scholar] [CrossRef]
  42. Li, D.; Wang, X. Land-Use Change and Efficiency in Laos’ Special Economic Zones. Land 2021, 10, 1012. [Google Scholar] [CrossRef]
  43. Zheng, Y.; Cheng, L.; Wang, Y. Measuring the Spatial Conflict of Resource-Based Cities and Its Coupling Coordination Relationship with Land Use. Land 2022, 11, 1460. [Google Scholar] [CrossRef]
  44. Xu, F.; Chi, G. Spatiotemporal variations of land use intensity and its driving forces in China, 2000–2010. Reg. Environ. Chang. 2019, 19, 2583–2596. [Google Scholar] [CrossRef]
  45. Felipe-Lucia, M.R.; Soliveres, S.; Penone, C.; Fischer, M.; Ammer, C.; Boch, S.; Boeddinghaus, R.S.; Bonkowski, M.; Buscot, F.; Fiore-Donno, A.M.; et al. Land-use intensity alters networks between biodiversity, ecosystem functions, and services. Proc. Natl. Acad. Sci. USA 2020, 117, 28140–28149. [Google Scholar] [CrossRef]
  46. Erb, K.; Haberl, H.; Jepsen, M.R.; Kuemmerle, T.; Lindner, M.; Müller, D.; Verburg, P.H.; Reenberg, A. A conceptual framework for analysing and measuring land-use intensity. Curr. Opin. Environ. Sustain. 2013, 5, 464–470. [Google Scholar] [CrossRef] [Green Version]
  47. Yang, J.; Zeng, C.; Cheng, Y. Spatial influence of ecological networks on land use intensity. Sci. Total Environ. 2020, 717, 137151. [Google Scholar] [CrossRef] [PubMed]
  48. Liu, J. Land Use in Tibet Autonomous Region; Science Press: Beijing, China, 1992. [Google Scholar]
  49. Li, S.; Wu, J.; Gong, J.; Li, S. Human footprint in Tibet: Assessing the spatial layout and effectiveness of nature reserves. Sci. Total Environ. 2018, 621, 18–29. [Google Scholar] [CrossRef]
  50. Xu, F.; Wang, Z.; Chi, G.; Zhang, Z. The impacts of population and agglomeration development on land use intensity: New evidence behind urbanization in China. Land Use Policy 2020, 95, 104639. [Google Scholar] [CrossRef]
  51. Li, L.; Fan, Z.; Feng, W.; Yuxin, C.; Keyu, Q. Coupling coordination degree spatial analysis and driving factor between socio-economic and eco-environment in northern China. Ecol. Indic. 2022, 135, 108555. [Google Scholar] [CrossRef]
  52. Huo, H.; Sun, C. Spatiotemporal variation and influencing factors of vegetation dynamics based on Geodetector: A case study of the northwestern Yunnan Plateau, China. Ecol. Indic. 2021, 130, 108005. [Google Scholar] [CrossRef]
  53. Wang, J.; Xu, C. Geodetector: Principle and prospective. Acta Geogr. Sin. 2017, 72, 116–134. (In Chinese) [Google Scholar]
  54. Zhang, H.; Xue, G. Changes of policies in relation to rural human settlement environment governance in China: Characteristics and evolution. J. Arid. Land Resour. Environ. 2022, 36, 8–15. (In Chinese) [Google Scholar]
  55. Jiang, Y.; Long, H.; Tang, Y.; Deng, W.; Chen, K.; Zheng, Y. The impact of land consolidation on rural vitalization at village level: A case study of a Chinese village. J. Rural. Stud. 2021, 86, 485–496. [Google Scholar] [CrossRef]
  56. Zhao, X.; Sun, H.; Chen, B.; Xia, X.; Li, P. China’s rural human settlements: Qualitative evaluation, quantitative analysis and policy implications. Ecol. Indic. 2019, 105, 398–405. [Google Scholar] [CrossRef]
  57. Peng, P.; Gu, D.; Zhou, G. Spatio-temporal pattern of rural human settlement vulnerability and influencing mechanism of response index in Hunan Province. Econ. Geogr. 2022, 42, 168–178. (In Chinese) [Google Scholar]
  58. Gao, B.; Hu, Z. What Affects the Level of Rural Human Settlement? A Case Study of Tibet, China. Sustainability 2022, 14, 10445. [Google Scholar] [CrossRef]
  59. Long, H.; Zhang, Y.; Ma, L.; Tu, S. Land Use Transitions: Progress, Challenges and Prospects. Land 2021, 10, 903. [Google Scholar] [CrossRef]
  60. Jiang, Y.; Long, H.; Ives, C.D.; Deng, W.; Chen, K.; Zhang, Y. Modes and practices of rural vitalisation promoted by land consolidation in a rapidly urbanising China: A perspective of multifunctionality. Habitat Int. 2022, 121, 102514. [Google Scholar] [CrossRef]
  61. Long, H. Theorizing land use transitions: A human geography perspective. Habitat Int. 2022, 128, 102669. [Google Scholar] [CrossRef]
  62. Liu, J.; Dietz, T.; Carpenter, S.R.; Alberti, M.; Folke, C.; Moran, E.; Pell, A.N.; Deadman, P.; Kratz, T.; Lubchenco, J. Complexity of Coupled Human and Natural Systems. Science 2007, 317, 1513–1516. [Google Scholar] [CrossRef] [Green Version]
Figure 1. Rural human settlement system resilience (RHSSR) and its logical framework.
Land 12 01524 g001
Figure 2. The spatiotemporal pattern of the rural human settlement system resilience (RHSSR) level in Hunan Province.
Land 12 01524 g002
Figure 3. The (a) areas of different land use types and (b) land use transfer trajectories in Hunan Province, 2000–2020.
Land 12 01524 g003
Figure 4. Land use intensity (LUI) in Hunan Province.
Land 12 01524 g004
Figure 5. A local indicators of spatial association (LISA) cluster map of rural human settlement system resilience (RHSSR) and land use intensity (LUI) in Hunan Province, 2000–2020.
Land 12 01524 g005
Figure 6. Interactive effects of pair-wise factors on changes in rural human settlement system resilience (RHSSR). Black, red, and blue values indicate that the interaction relationship between explanatory variables is bivariate enhanced, nonlinear enhanced, and univariate weakened, respectively. From dark blue to light blue, the influence of different explanatory variables interacting changes from large to small.
Land 12 01524 g006
Table 1. Land use types and human influence scores assigned for each land use type (source: Li et al. [49]).
Land Use TypeDescriptionScore
Built-up landUrban land and other built-up land10
Rural human settlementLand used for settlements in villages8
Reservoirs/pondsMan-made facilities for water storage8
Cultivated landCultivated lands for crops, including paddy land and dry land7
Dense grasslandGrassland with canopy cover greater than 50%2
Moderate grasslandGrassland with canopy cover between 20 and 50%1
Sparse grasslandGrassland with canopy cover between 5 and 20%0
ForestlandLand used for growing trees, including arbor, shrub, and bamboo0
Water bodiesLand covered by natural water bodies, including rivers, lakes, permanent ice and snow, mudflats0
Unused landLand with no practical use or that is difficult to use, including sandy land, Gobi, saline areas, swampland, bare soil, bare rock, and others0
Table 2. The q-statistics of factors influencing rural human settlement system resilience (RHSSR) changes in each period.
Variable20002005201020152020
Natural subsystem
Annual average temperature0.206
(0.0001)
0.134
(0.0044)
0.111
(0.0131)
0.141
(0.003)
0.141
(0.0027)
Annual sunshine hours0.171
(0.0045)
0.206
(0.0000)
0.171
(0.012)
0.235
(0.0000)
0.15
(0.002)
Forest cover rate0.249
(0.0001)
0.192
(0.0015)
0.21
(0.0009)
0.224
(0.0003)
0.242
(0.0001)
Human subsystem
Primary industry0.267
(0.0001)
0.204
(0.0014)
0.117
(0.0265)
0.152
(0.0045)
0.174
(0.012)
Secondary industry0.447
(0.0000)
0.343
(0.0000)
0.364
(0.0000)
0.437
(0.0000)
0.367
(0.0000)
Total sown area0.330
(0.0000)
0.210
(0.0003)
0.187
(0.0011)
0.188
(0.0013)
0.149
(0.0046)
Total power of agricultural machinery0.258
(0.0001)
0.193
(0.0081)
0.276
(0.0023)
0.222
(0.0019)
0.066
(0.3268)
Residential subsystem
GDP per capita0.218
(0.0039)
0.118
(0.0832)
0.177
(0.008)
0.208
(0.0026)
0.216
(0.0003)
Per capita net income of farmers0.166
(0.002)
0.205
(0.0021)
0.227
(0.0001)
0.292
(0.0000)
0.196
(0.001)
Support subsystem
Public budgetary expenditure0.248
(0.0023)
0.276
(0.0001)
0.274
(0.0001)
0.186
(0.0246)
0.163
(0.0223)
Social subsystem
Primary school students0.165
(0.0083)
0.134
(0.0186)
0.022
(0.6651)
0.045
(0.3306)
0.072
(0.0915)
Health personnel0.322
(0.0000)
0.226
(0.0001)
0.176
(0.0055)
0.252
(0.0002)
0.19
(0.0014)
Hospital beds0.249
(0.0001)
0.231
(0.0079)
0.174
(0.0058)
0.299
(0.0000)
0.243
(0.0002) 1
1 The numbers in parentheses indicate the p-values.
Disclaimer/Publisher’s Note: The statements, opinions and data contained in all publications are solely those of the individual author(s) and contributor(s) and not of MDPI and/or the editor(s). MDPI and/or the editor(s) disclaim responsibility for any injury to people or property resulting from any ideas, methods, instructions or products referred to in the content.

