1. Introduction
In the rapid process of urbanization, urban residents are enjoying numerous conveniences in both production and daily life. However, simultaneously, cities are not neglecting the increasingly pronounced health issues stemming from their built environment. According to the World Health Organization (WHO), a lack of physical activity (PA) has been identified as one of the top ten global risk factors for mortality, contributing to the burden of non-communicable diseases and exerting profound impacts on global health. Research has demonstrated that insufficient PA is associated with an elevated risk of various non-communicable diseases [
1]. Based on this understanding, existing studies encourage residents to actively engage in PA, enhancing physical fitness and reducing the risk of chronic diseases [
2,
3].
Over the past three decades, a plethora of empirical research conducted worldwide has gradually reached a consensus: urban green spaces play a positive role in improving the health of urban residents. Multiple studies indicate that urban green spaces contribute to enhancing the health of populations [
4,
5]. This consensus underscores the significance of urban green spaces in promoting community well-being, manifesting predominantly in three aspects: enhancing the material living environment [
6,
7], fostering social behavior changes [
8,
9], and providing opportunities for emotional regulation [
10,
11].
Urban parks, serving as outdoor activity venues, play a pivotal role in the lives of urban residents [
12]. Furthermore, there has been a growing consensus regarding the influence of urban parks on PA [
13,
14,
15,
16,
17].
Green vegetation, as a crucial component of urban parks, may influence the occurrence of PA. Numerous studies confirm that access to green spaces promotes PA among children and adults, providing spaces for walking, jogging, cycling, and other activities. Some studies find that individuals residing in areas rich in green spaces are more likely to achieve daily activity targets. For instance, Mytton et al. [
18] indicate that people living in areas with more greenery are more likely to achieve recommended activity levels compared to those in less green areas. Another study suggests a positive correlation between plant diversity within parks and the frequency of PA [
19]. Visual exposure to greenery also plays a significant role in promoting PA [
20]. Moreover, research suggests a link between plant diversity and PA diversity, with seasonal factors potentially influencing PA levels [
17]. It is worth noting that factors affecting residents’ PA are multifaceted, including facilities [
21], park accessibility [
22], and so on.
PA density and diversity represent two distinct aspects of PA. Certain features of public spaces attract a higher number of visitors (density), while other features facilitate interactions and diversity among visitors. Therefore, we hypothesize that various features of parks could influence different aspects of PA, with some features promoting broader and diverse PA, thus yielding greater societal benefits. Thus, we have incorporated both the density and diversity of PA into our study framework. PA density refers to the density of individuals engaging in PA within the park, while PA diversity reflects the variety of PA types. By considering both these aspects, we aim to comprehensively depict the influence of parks on PA. Given that PA density and diversity represent distinct facets of PA, we believe it’s essential to simultaneously consider both concepts when investigating residents’ PA patterns.
While numerous studies have explored the impact of urban green spaces on PA, most have focused on an urban scale. There has been relatively less investigation into the influence of greenery within parks on PA. Some studies suggest that the greenery surrounding parks might impact visitor numbers within the park [
23], indicating a potential competition between internal and external greenery. Furthermore, despite the confirmed positive relationship between urban parks and PA, previous research has yielded inconsistent results. This discrepancy may be attributed to the use of cross-sectional study methods, which might not fully capture the fluctuations in PA patterns due to short-term data collection [
17]. Therefore, this study aims to explore the correlation between internal and surrounding greenery levels of parks and PA to better understand this influence.
To address these critical gaps, we have selected three urban parks and conducted on-site observations of resident PA over a year. We aim to address three key questions:
- (1)
To what extent are the greenery levels surrounding and within parks correlated with PA?
- (2)
Which specific greenery indicators are significantly associated with PA density and diversity?
- (3)
Do the greenery level surrounding parks interfere with the influence of greenery levels within park plots on PA?
This study aims to explore the correlation between internal and surrounding greenery levels of parks and PA. The objective is not to prove that park greenery is the sole determinant of PA but to investigate to what extent these factors relate to changes in PA. The findings are expected to shed light on the complex relationship between greenery and PA, ultimately providing insights for urban planning and design strategies aimed at promoting healthy and active lifestyles among urban residents.
2. Methodology
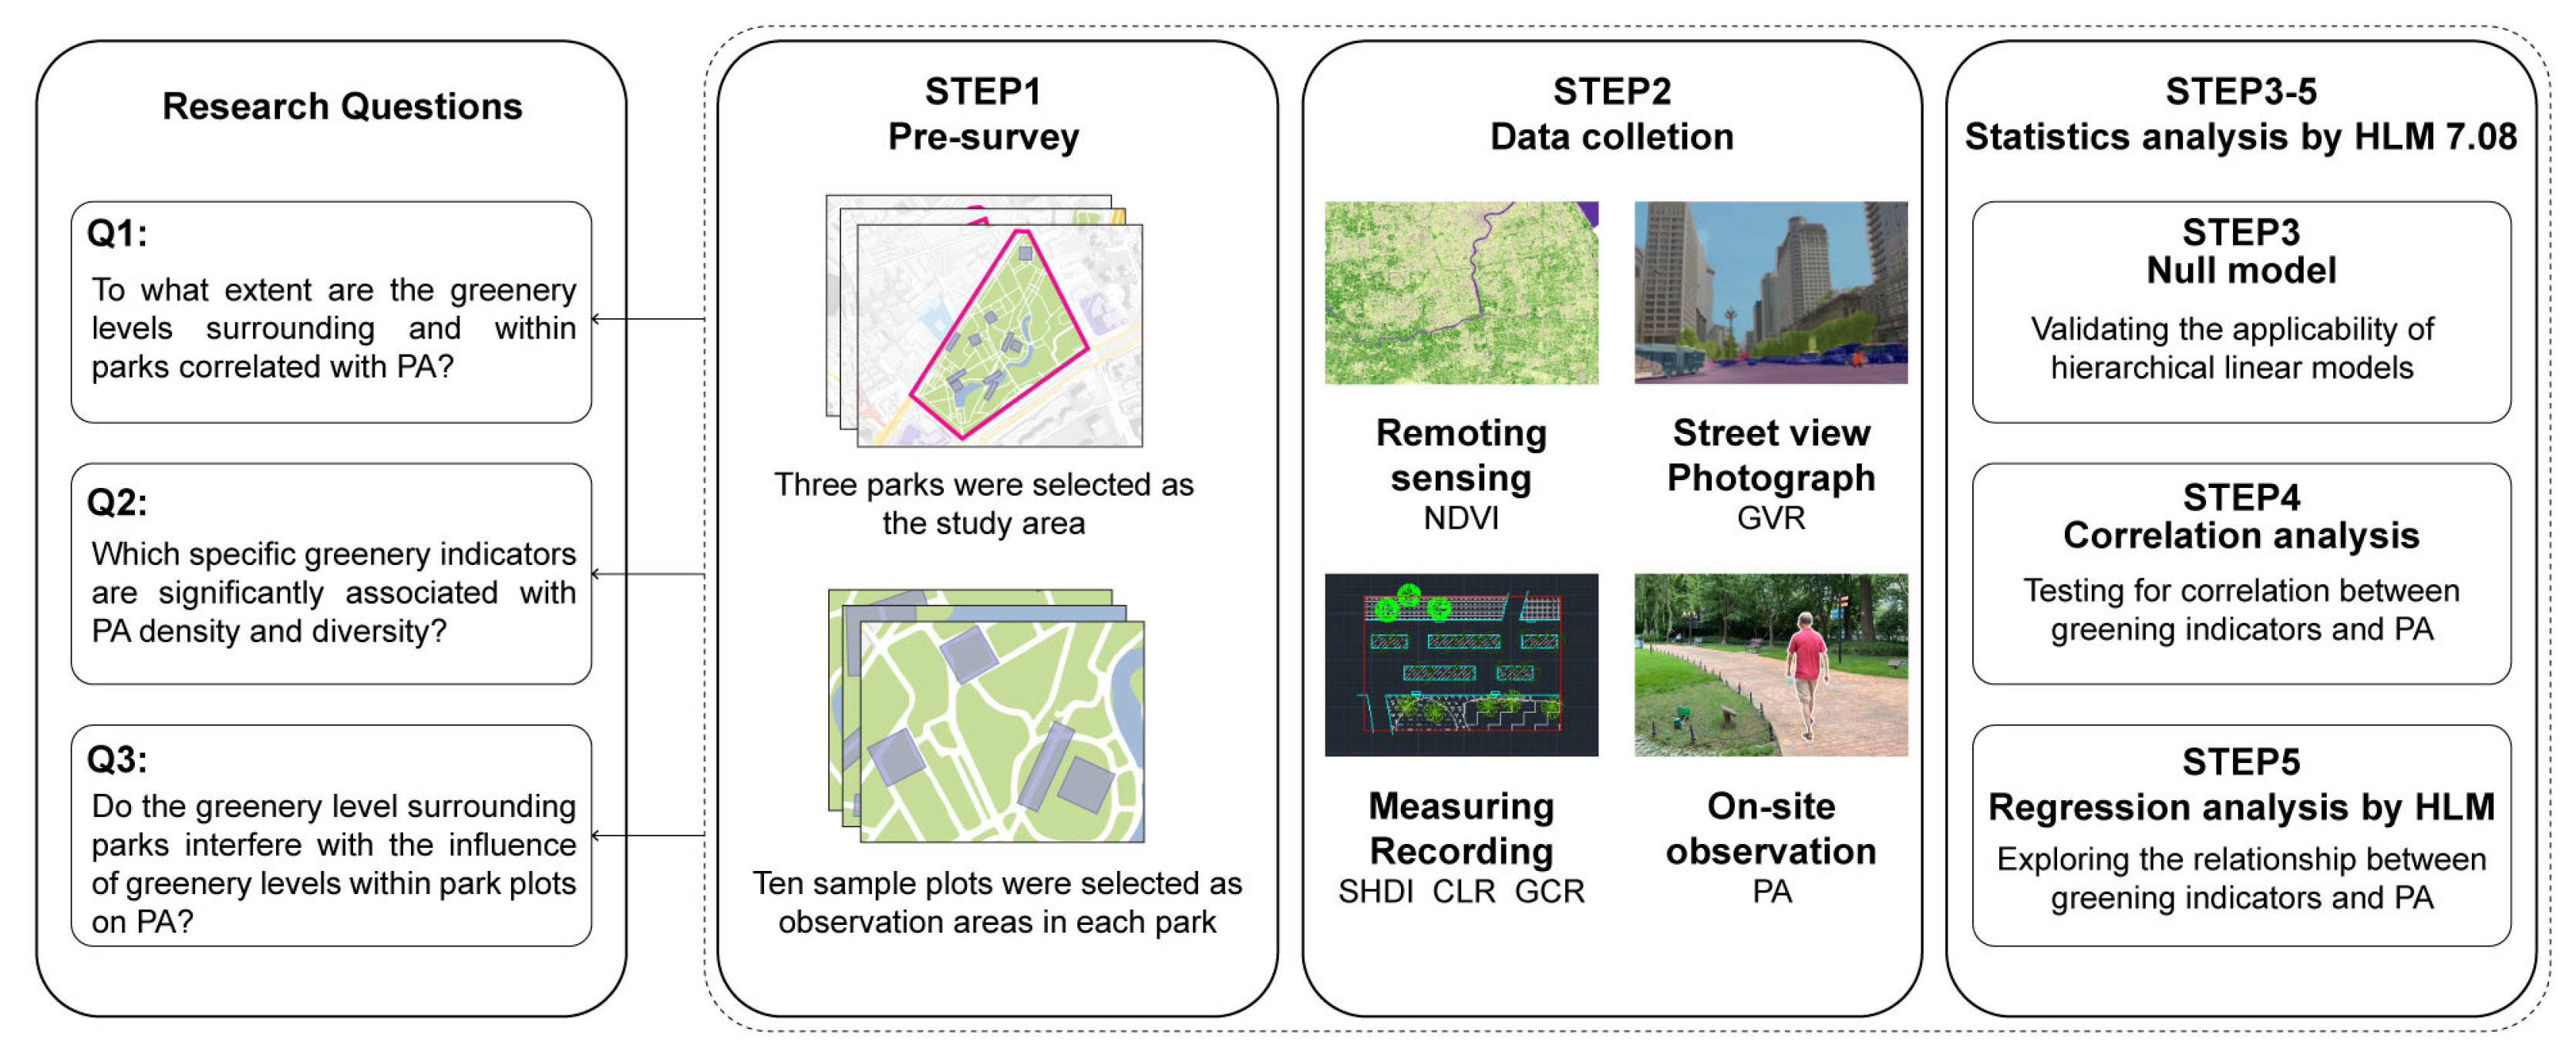
Figure 1 provides an illustrative overview of the research workflow. To address the three research questions, we initiated the process by conducting preliminary explorations and, subsequently, selected Xujiahui Park, Fuxing Park, and Lujiazui Central Green Space as study sites. Employing diverse methods such as remote sensing, street view maps, and on-site observations, we procured data concerning both greenery and PA. Subsequently, we established a null model to ascertain the suitability of the hierarchical linear model (HLM).
Consequently, we undertook correlation analysis to assess the potential relationship between independent and dependent variables. The results of this analysis were then integrated into the statistical regression model to facilitate appropriate adjustments. With the goal of obtaining a more comprehensive understanding of the impact of park greenery levels on PA, we considered park greenery levels as independent variables and PA density and diversity as dependent variables. Leveraging HLM 7.08, we conducted model calculations to validate our questions.
2.1. Study Sites
Shanghai, situated in the core of the Yangtze River Delta region, stands as a pivotal city in China and is the nation’s second-largest metropolis. Covering an area of 6300 square kilometers and housing a population of 24 million, Shanghai ranks as the world’s third-most populous city. The population density within its central urban area reaches 34,000 individuals per square kilometer.
In this study, three parks were selected as research sites: Xujiahui Park, Fuxing Park, and Lujiazui Central Green Space. These three parks are all located within Shanghai and serve as urban green spaces in the city center, attracting a diverse user base. They are also similar in size, but their surrounding environments differ. Lujiazui Central Green Space is situated within the financial district, surrounded by predominantly commercial areas, while Fuxing Park and Xujiahui Park may be closer to residential neighborhoods. These location and land use differences contribute to variations in the greenery surrounding the parks and offer potential insights into the impact of park-level indicators on PA patterns.
It is important to note that a minimum sample size of 30 groups, each containing at least 30 individuals, is required for estimating regression coefficients [
24]. Within each park, we designated 10 sample plots for data collection. These plots were distributed throughout the park to ensure comprehensive coverage of the entire park area. Additionally, each sample plot encompassed at least one complete activity zone. The geographical placement of the three parks and the designated sample plots is illustrated in
Figure 2.
2.2. Data Collection
2.2.1. Physical Activity
From January to December 2021, on three days per month (comprising two weekdays and one weekend day) with clear weather conditions, field observations and recordings were carried out. Sample plots were established within each park, and a total of 30 sample plots were observed.
Researchers divided each day into five time intervals: 6:00–8:00, 8:00–10:00, 11:00–13:00, 14:00–16:00, and 18:00–20:00. Within these time intervals, the number of individuals within the sample plots and their specific activity types were documented. This observational approach ensured a comprehensive and detailed understanding of park usage patterns and PA conducted by visitors. The choice of clear-weather days and varying time intervals adds depth to the data collection process, providing insights into different PAs during distinct time periods.
2.2.2. Park Greenery Level
Normalized difference vegetation index (NDVI) and green coverage ratio (GCR) are used to assess vegetation characteristics from a two-dimensional perspective [
17] (Wang et al., 2021). The Shannon’s diversity index (SHDI) was employed in this study to evaluate plant diversity. The green view ratio (GVR) represents the proportion of green visible within the field of view, while the color-leaf plant ratio (CLR) refers to the ratio of plant species that exhibit distinct seasonal changes among all plant species.
Through on-site surveys, plant species and quantities within sample plots were recorded, and calculations were performed to determine the SHDI, GCR, and CLR. The GVR of each plot was determined by capturing photographs from 8 different angles and using the MXNet framework in conjunction with the GlunoCV model for computation. The green view ratio within the 400 m buffer zone (400 mGVR) was obtained through Baidu Street View imagery, which was also utilizing the GlunoCV model. Definitions are summarized in
Table 1.
This methodology allows for a comprehensive evaluation of vegetation characteristics and the overall greenery perception within the studied parks and their surroundings. The combination of field surveys, image analysis, and statistical summaries ensures a robust understanding of the park environments.
2.3. Statistical Analysis
Due to the nested relationship between observed PA data and parks at the sampling points, there exists a certain level of correlation within PA data from the same park. The assumption of sample independence in traditional multiple regression analysis is challenged by this scenario. To mitigate errors stemming from differing levels, this study incorporates error terms into different hierarchical data layers to construct a hierarchical linear model for analysis.
The hierarchical linear model holds advantages in dealing with non-independent data with nested structures. Furthermore, this approach efficiently bridges data from the plot level and macro-environmental data surrounding the parks, effectively distinguishing between within-group and between-group effects of residuals. In contrast to single-level regression models, the hierarchical model maximizes the utilization of data variations at each level. It can include virtual variables representing specific higher-level entities, along with other variables associated with those entities. The model consists of two levels, namely the sample plot level (level 1) and the park level (level 2).
For each model, non-standardized coefficients, standard errors, t-values, and
p-values are computed to display the associations between each greenery indicator and PA. The Level 1 model expression is provided below:
Yij represents the PA density or diversity of the ith individual within the jth group; Xij denotes the greenery indicators of the ith plot within the jth park. β0j and β1j stand for the slope and intercept within the jth group, which are the random effects at level 2, representing the variability between individuals and groups. εij signifies the error term, accounting for unexplained random errors.
The expression for the level 2 model is as follows:
Wj represents the explanatory variable for the jth group level. γ00, γ01, γ10, and γ11 are fixed effects within level 2, indicating the influence of explanatory variables on the slope and intercept. u0j and u1j are the random error terms within the jth group, reflecting individual differences in random slope and intercept.
3. Results
3.1. Descriptive Statistics
Table 2 presents statistical data regarding the characteristics of sample plots and parks. At the sample plot level, the sample plot area ranges from 50 square meters to 1600 square meters, with an average of 377.005 square meters and a standard deviation of 316.2. PA density varies from 0.013 people per square meter to 7.072 people per square meter, with a mean of 1.218 people per square meter and a standard deviation of 1.067. PA diversity ranges from 0.040 to 0.680, with a mean of 0.284 and a standard deviation of 0.115. Additionally, Shannon’s diversity index (SHDI, Min = 0.245, Max = 2.446, Mean = 1.357, and SD = 0.519), green coverage ratio (GCR, Min = 0.150, Max = 0.950, Mean = 0.673, and SD = 0.228), green view ratio (GVR, Min = 0.068, Max = 0.909, Mean = 0.552, and SD = 0.194), and color-leaf plant ratio (CLR, Min = 0.100, Max = 0.700, Mean = 0.460, and SD = 0.145) also exhibit variations within certain ranges.
At the park level, the park area ranges from 8.660 hectares to 9.470 hectares, with an average of 9.007 hectares and a standard deviation of 0.341. The NDVI within the 400 m buffer zone (400 mNDVI) varies from 0.035 to 0.088, with an average of 0.064 and a standard deviation of 0.022. Similarly, the green view ratio within the 400 m buffer zone (400 mGVR) also falls within the range of 0.250 to 0.426, with an average of 0.357 and a standard deviation of 0.077.
3.2. Null Model
Prior to constructing the model, a null model devoid of any variables was established. This null model comprised deterministic and random intercepts along with residuals, excluding other variables. Its purpose was to ascertain the applicability of multilevel data analysis. The park was used as a grouping criterion, and the intraclass correlation coefficient (ICC) for PA density and diversity was computed to assess the magnitude of between-park variation relative to total variation.
As depicted in
Table 3, when PA density is the dependent variable, the within-group correlation coefficient is 0.099. This implies that park-level variation, in the absence of other park-level variables, can account for 9.9% of the total variation. For PA diversity as the dependent variable, the within-group correlation coefficient is 0.231, indicating that park-level variation can explain 23.1% of the total variation. When ICC exceeds 0.059, there is a moderate or higher within-group correlation. The impact of within-group correlation on estimated regression coefficients and standard errors cannot be ignored. Therefore, the establishment of the HLM was appropriate.
Furthermore, the model calculates deviance, a statistical measure reflecting model fit. Deviance was used to assess the goodness-of-fit by comparing the deviance of a model with that of the null model. A smaller deviance value suggests a better fit of the model to the data.
3.3. Multilevel Analysis of Greenery and PA
We constructed park-level models, plot-level models, and full models to address PA density and diversity. The regression coefficients, t-values,
p-values, and deviance for these six models are presented in
Table 4 and
Table 5. Notably, all models exhibit deviance values lower than those of the null model. Moreover, models incorporating only plot-level variables yield a better fit compared to models containing only park-level variables, with the full model demonstrating the highest explanatory power.
Models 1 and 4 elucidate the influence of park-level external variables on PA. These models exclusively incorporate park-level variables. Results reveal that, when solely considering external park variables’ impact on PA, 400 mNDVI significantly correlates with lower PA density but exhibits no substantial impact on PA diversity. Meanwhile, 400 mGVR displays significant positive effects on both PA density and diversity, consistent with outcomes from the full models (models 3 and 6).
Models 2 and 5 shed light on plot-level variables’ impact on PA. These models solely include plot-level variables. Findings indicate that SHDI significantly reduces PA density but bears no significant effect on PA diversity. Conversely, GCR demonstrates contrasting effects on density (positive) and diversity (negative). Plot-level GVR significantly negatively affects PA diversity but lacks significant influence on PA density. CLR negatively impacts PA density, with no significance regarding PA diversity.
Models 3 and 6 encompass all variables and explore whether park-level greenery interferes with plot-level greenery’s influence on PA by introducing interaction terms between park and plot variables. For the density full model (model 3), all variables prove significant. Negative effects stem from 400 mNDVI, SHDI, GVR, and CLR on PA density. Meanwhile, positive impacts originate from 400 mGVR and GCR. Cross-interaction effects reveal that 400 mNDVI negatively interferes with the influence of GCR on PA density, analogous to 400 mGVR negatively interfering with the impact of GVR on PA density. Interestingly, 400 mNDVI positively interferes with the effect of GVR on PA density, while 400 mGVR positively interferes with the influence of GCR on PA density.
Regarding diversity full models, only 400 mGVR from the surroundings promotes PA diversity within parks. Moreover, 400 mGVR diminishes the negative impact of plot-level GVR on PA diversity. In other words, higher external 400 mGVR correlates with reduced negative effects of internal GVR on PA diversity. Negative influences on PA diversity stem from GCR, CLR, and GVR. Although 400 mNDVI lacks a direct effect on PA diversity, it indirectly influences it by interfering with the plot-level GVR effect.
3.4. Seasonal Effects on PA
To comprehensively explore the influence of seasonal factors on PA, we meticulously constructed eight distinct seasonal models, with the t-values and significance elegantly showcased in
Figure 3.
The findings distinctly illuminate the pronounced variations in the effects of urban park greenery indicators on PA across the diverse seasons. During the summer and autumn periods, both park-level indicators exhibit statistical significance in influencing PA density, while in the spring and winter months, this influence is notably diminished. Further, 400 mNDVI remarkably manifests a significant negative impact on PA density during the summer and autumn, in contrast to the GVR which notably showcases a significant positive influence. Noteworthy is the consistent positive impact of GCR across all seasons. It is pertinent to observe that the interference of 400 mNDVI consistently yields a significant and positive effect on the GVR, while the influence of the 400 mGVR consistently and adversely affects the GVR. For diversity models, external factors merely exhibit significance during the autumn season, whereas internal factors such as GCR and GVR consistently present a negative influence on PA diversity across all seasons.
4. Discussion
4.1. Interpretation of Significant Greenery Indicators
Greenery indicators at the sample plot level exhibit varying degrees of influence on PA. SHDI significantly diminishes PA density, but its effect on PA diversity is insignificant. Wang et al. [
17] highlight diverse plant types yielding varying effects on PA diversity. In our study, a composite diversity measure for all plants might have overlooked specific plant influences. GCR positively fosters PA density but negatively impacts PA diversity, consistent with [
25] Tsai et al.’s findings. Increased PA often correlates with heightened vegetation coverage; urban parks with higher vegetation density seem more conducive to PA [
26], though multifaceted activity might be constrained in areas with greater vegetation coverage [
27,
28].
GVR negatively affects PA density and diversity. This aligns with Wang et al.’s [
17] findings. Yet, Lu [
29] identified a positive correlation between GVR and PA increase. Another reason could be the nonlinear influence of GVR; an optimal range might exist where excessive GVR raises discomfort [
27] and stress [
30], hindering PA. Similarly, seasonal plant variation negatively impacts PA density and diversity. Abundant vibrant plants could generate a psychological burden, discouraging PA.
At the park level, greenery indicators directly influence PA density and diversity within plots and indirectly affect PA by influencing plot-level greenery indicators. Then, 400 mNDVI negatively affects PA density, diminishing the positive effects of GCR on PA within this range and exacerbating the negative effects of GVR; 400 mGVR promotes PA density and diversity while enhancing the positive impact of vegetation coverage, mitigating the negative GVR effect. We propose that park-level greenery indicators impact PA through dual mechanisms, involving both mutual attraction into parks and potential competitive relationships.
The outcomes underscore the potential influence of both internal and surrounding greenery levels on PA in parks. The research furnishes new empirical evidence and uncovers potential synergistic and competitive relationships among greenery indicators, directly or indirectly shaping residents’ PA behaviors.
4.2. Seasonal Variation in the Influence of Park Greenery on PA
The fluctuation of seasons might contribute to the differential effects of urban park greenery on PA. During the warmer months of summer and autumn, people tend to engage in outdoor PA, rendering park greenery significantly impactful on PA density. Conversely, in the colder seasons of spring and winter, reduced outdoor activity frequencies might diminish the significant impact of park greenery on PA density.
Further, 400 mNDVI exhibits a negative influence on PA density during summer and autumn; 400 mNDVI likely attracts individuals to engage in PA in the greener peripheral areas outside the park, thereby reducing PA density within the park’s interior. Conversely, the positive influence of 400 mGVR on PA density during these seasons suggests that parks often do not have enclosed boundaries within this range. Increased 400 mGVR, combined with other internal greenery indicators, draws more individuals into the park, thereby boosting internal PA density.
Furthermore, GCR demonstrates a consistent positive impact on PA diversity across all seasons. This association might be attributed to the structural attributes of vegetation; for instance, trees provide comfortable spaces such as shaded areas during summer, facilitating varied PA within the park.
Seasonal factors influence the relationship between park greenery indicators and PA, showcasing distinct variations in their effects across seasons. Understanding these nuances is pivotal for effective park planning and design to create diverse and suitable environments for PA. However, further research is needed to comprehensively explore the intricate interplay between seasonal factors and other potential variables, ultimately enhancing our holistic comprehension and promotion of public PA levels.
4.3. Research Contributions and Limitations
This study has delivered notable contributions to the existing body of knowledge. Firstly, it employed a year-long on-site observation approach to scrutinize PA patterns within parks, a methodology aimed at attenuating potential short-term observation errors. Secondly, this study approached PA through the lenses of both density and diversity. Our investigation aimed to capture the multidimensional impact of urban greenery on PA. Thirdly, the study explored relationships between greenery indicators at varying levels—both within specific sites and across entire parks—and their connection to PA. Furthermore, it examined the potential interplay of higher-level greenery on lower-level greenery indicators. This multilevel analysis enriches our comprehension of how diverse greenery indicators influence PA.
However, it is essential to acknowledge certain limitations inherent to this study. Firstly, despite employing a longitudinal and high-frequency observation approach to mitigate confounding variables like seasonality, the research design retains its cross-sectional nature. Consequently, it is imperative to recognize that the establishment of causal relationships between urban park attributes and PA remains constrained, with the study permitting the inference of associations rather than causality [
28,
31]. To address this limitation, longitudinal and prospective research designs hold promise. Secondly, due to the inherent constraints of on-site observations, certain individual attributes, including age, household income, and socioeconomic status, were not incorporated into the analytical framework. These factors have demonstrated an impact on PA patterns in prior studies [
19,
28,
32]. Third, HLM is capable of effectively handling data with a hierarchical structure, but due to sample size limitations and the need for robust estimation, we were unable to incorporate additional indicators. Future research with larger sample sizes will contribute to addressing this issue.
These findings furnish valuable insights for urban planners and park designers, informing the optimization of greenery allocation within parks to engender environments conducive to diverse forms of PA. Notwithstanding, further nuanced exploration of interrelations among greenery indicators, coupled with the consideration of latent variables, is requisite to achieve a comprehensive understanding and to promote heightened levels of public PA.
5. Conclusions
This study utilized on-site observations in three urban parks to explore patterns of physical activity. It established a relationship between the extent of park greenery and the density and diversity of PA. Furthermore, the study not only examined the influence of park greenery on PA but also assessed the relative significance of these factors across various seasons. The results suggest that both peripheral and internal park greenery are associated with PA, with a more pronounced impact observed for the latter. Park-level indicators exert a direct influence on PA and indirectly affect it through their influence on site-level indicators, highlighting a complex interplay of cooperation and competition.
The study’s findings underscore the pivotal role of park greenery in promoting physical activity. These insights offer invaluable guidance not only to the broader community but also to key stakeholders, including park planners and policymakers. By shedding light on the significant correlation between urban park greenery and PA, this research provides evidence-based support for decision-making processes related to park design, allocation of green spaces, and urban revitalization initiatives. For policymakers, these findings present an opportunity to prioritize investments in urban green spaces, recognizing them as essential components of health-oriented urban planning. By strategically integrating and enhancing greenery within urban parks, policymakers can contribute to the creation of environments that naturally encourage and facilitate increased levels of PA among residents. This not only promotes physical well-being but also contributes to the overall health and vitality of communities.


