Article

Construction of Landscape Ecological Risk Collaborative Management Network in Mountainous Cities—A Case Study of Zhangjiakou

1
School of Public Management, Tianjin University of Commerce, Tianjin 300134, China
2
Beijing Penta Color Gold Soil Information & Technology Co., Ltd., Beijing 100193, China
3
College of Land Science and Technology, China Agricultural University, Beijing 100193, China
*
Author to whom correspondence should be addressed.
Land 2024, 13(10), 1586; https://doi.org/10.3390/land13101586
Submission received: 18 July 2024 / Revised: 26 September 2024 / Accepted: 27 September 2024 / Published: 29 September 2024
(This article belongs to the Special Issue Landscape Ecological Risk in Mountain Areas)

Abstract

:
The prevention of ecological risks is a critical determinant influencing sustainable development. Driven by rapid socio-economic development, the ecosystems of mountainous cities within agro-pastoral transition zones are increasingly vulnerable to complex disturbances, constituting a significant threat to sustainable development and human well-being. To help achieve sustainable development, it is essential to conduct research on addressing and mitigating ecological risks from the perspective of collaborative management networks in mountainous cities. Taking Zhangjiakou as the study area, this paper employed the land use transfer matrix and standard deviation ellipse methods to analyze the dynamic land use changes. Additionally, using Fragstats 4,2 to calculate the landscape indices with land use data, this paper evaluated the landscape ecological risk (LER) from 2000 to 2020. Furthermore, the social network analysis (SNA) method was utilized to explore the spatial correlation characteristics of the LER. The findings indicate that: (1) Cultivated land and grassland were the predominant land use types in Zhangjiakou. During 2000–2020, Zhangjiakou experienced significant changes in land use, dominated by the transfer among cultivated land, forestland, and grassland. It indicated that the issue of unstable ecological land use continued to exist. Affected by human activities, construction land showed a consistent upward trend, primarily concentrated in the urban built-up areas and areas along the Jing-Zhang Railway. (2) The LER of Zhangjiakou was predominantly characterized by low risk, medium risk, and high risk levels. In the transitional areas and foothills, the LER was relatively higher. During 2000–2020, Zhangjiakou showed a declining trend of LER. This suggested that the ecological protection policies in Zhangjiakou were effective, leading to an improvement in the local ecological environment. (3) The LER in Zhangjiakou demonstrated a spatial clustering pattern that exhibited an upward trend, which was supported by both spatial autocorrelation and the SNA analysis. In the LER collaborative management network, Xuanhua, Qiaodong, Qiaoxi, Wanquan and Zhangbei consistently upheld pivotal roles. Based on the number of inward and outward connections, 16 counties in Zhangjiakou were classified into four categories and three zones accompanied by corresponding recommendations. The findings of this study can serve as a valuable reference for subsequent landscape pattern optimization and ecological restoration in Zhangjiakou.

1. Introduction

As an essential part of the biosphere [1], the ecosystems play a pivotal role in material production and energy storage [2]. They can provide various services supporting human life, which are crucial for socio-economic development [3]. However, with the advent of climate change and economic development, ecosystems are confronted with a myriad of pressures and threats, resulting in severe ecological degradation and a significant escalation in ecological risks [2,4,5]. This has prompted profound contemplation on the paradox and synergy between development and conservation globally [6,7]. This issue is especially pronounced in vulnerable mountainous cities. With the increasing intensity of human activities, mountainous cities are facing challenges such as fragmentation of mountainous landscapes, encroachment on ecological spaces, land desertification, and pasture degradation [8,9,10]. Consequently, the self-regulatory and restorative capacities of ecosystems are declining, thereby presenting significant challenges for regional planning in this context. In China, since the initiation of opening-up reform, we have witnessed a rapid urbanization and economic growth. From 1978–2021, the urbanization rate increased from 17.92% to 64.72%, accompanied by a staggering 310 times increase in GDP [11,12]. During this period, there has been excessive exploitation of natural resources. This has given rise to various ecological problems [13], thereby posing significant threats and risks to the human–environment system [14,15]. Therefore, the meticulous execution of ecological risk assessment holds paramount importance for the achievement of sustainable development.
Exploration of ecological risk assessment originated in the 1980s [16], while the formal concept and analytical framework were established by the US Environmental Protection Agency (USEPA) in 1992 [17]. Furthermore, with the publication of ‘Guidelines for Ecological Risk Assessment’ by USEPA in 1998 [18], ecological risk assessments have increasingly been implemented on a global scale. Many scholars have conducted researches on ecological risk of diverse ecosystems, various risk sources, and different regions [19,20,21]. Nevertheless, there are interactions and overlapping effects of multiple risks in the same region. Thus, the ecological risk assessment of single risk source is inadequate for implementing comprehensive regional ecological risk management. Consequently, integrated ecological risk assessments at a regional scale have gained prominence. Landscape ecological risk assessment (i.e., LERA) which integrates landscape ecology and geography, constitutes a pivotal aspect of regional ecological risk research and is currently advancing towards comprehensive ecological risk assessment at large scales and multiple levels [1,16,22]. It refers to the evaluation of potential adverse impacts on ecological environment and landscape pattern [1,23]. LERA possesses an inherent advantage in addressing large-scale problems through its ability to observe landscape pattern changes and conduct comprehensive assessments of diverse ecological impacts [16,24]. In the 1990s, Hunsaker [25] and Graham [26] explored the application of ecological risk assessment based on landscape ecology. Thereafter, given that land use change could effectively reflect the interaction between natural environment and human activities and is readily accessible [27], scholars have developed frameworks for evaluating LER based on land use data. Subsequently, LERA has emerged as a prominent focal point in contemporary research [28]. In terms of scales, LER researches encompass national [29], basin [30,31], cities [32,33], and metropolitan scales [22,34]. Regarding study areas, there is also extensive research on LER in specific regions such as plateaus [2,35], islands [36,37], protected areas [38,39], and transboundary regions [1,40]. As an important and distinctive complex system, mountainous cities exhibit intricate interactions between human activities and natural ecosystems, embodying both the “urban” developmental characteristics and the backdrop of “mountainous” fragility, which give rise to ecological risks [8,41]. While there have been some studies on the ecological risks in mountainous areas [2,6,35], there still exists a research gap in the understanding of ecological risks in mountainous cities undergoing rapid development within fragile environments, particularly those situated in agro-pastoral transition areas.
Due to the openness and trans-regional nature of ecosystems, the spatial correlation or spillover effect of ecological risk has garnered significant attention from scholars. Methods of spatial autocorrelation and hotspot analysis are commonly employed for examining the spatial distribution or clustering effects of ecological risk [31,42,43]. It is worth noting that the traditional spatial quantitative models have two distinct characteristics: firstly, they are based on the geographical adjacency and heavily rely on the spatial weight matrix [44]; secondly, they typically use attribute data, which solely focus on “quantity”, rather than relational data, thereby limiting their ability to investigate the characteristics of “relationship” [45,46]. These limitations pose challenges in characterizing the inflow and outflow relationships and spatial correlation network features. In addition, the Minimum Cumulative Resistance (MCR) model has been also widely employed to construct spatial ecological networks [24,47]. These approaches typically use specific ecological source areas and corridors as micro-level components to construct ecological networks, offering guidance for the management of particular ecological spaces. Nevertheless, ecological risks are characterized by regional diffusion and exhibit significant externalities. Fundamentally, the management of ecological risks constitutes a collective action in the management of public goods. While in terms of management, policy measures and control implementations are primarily conducted by administrative units. Therefore, it is crucial to analyze the ecological risk relationships between administrative units and to establish a collaborative management network for LER. Compared with the limitations mentioned above, the Social Network Analysis (SNA) method focuses on examining the spatial network characteristics by considering the network formed by “point-to-point” relationship data [48]. The SNA enables a more precise understanding of interaction patterns and their underlying formation mechanisms. Thus, it has been widely applied in various subjects such as carbon emissions [49,50,51], energy consumption [52], air pollution [53], and environmental regulation [54]. Therefore, this paper employed the SNA method to examine the spatial correlation network of LER, aiming to further establish a collaborative management network for LER at county level and region level.
This study chose to assess the LER in Zhangjiakou City (hereafter Zhangjiakou) in Hebei Province from 2000 to 2020. The primary reasons for this choice are outlined as follows. (1) The complexity of terrain and geomorphology: the transitional area of Inner Mongolia Plateau–Yanshan Mountain–North China Plain. The Yinshan, Yanshan, and Taihang Mountains form the macro topographic pattern of Zhangjiakou; concurrently, influenced by climatic conditions, these ranges contribute to a complex landform encompassing plateaus, valley basins, and mountains [55]. (2) Typical ecologically important and vulnerable region within the agro-pastoral transition zone: Zhangjiakou is recognized as an ecologically fragile area in China [56], and also serves as a significant water conservation area and ecological barrier in the Beijing–Tianjin region [57]. (3) Proximal to the capital with rapid economic development: In recent years, Zhangjiakou has experienced rapid development, particularly driven by economic spillover from Beijing and the hosting of the Winter Olympics. (4) Temporal stages: The Grain for Green Project (GFGP) initiated in 2002, which aimed at converting agricultural land back to forested areas; the Guidelines for the Coordinated Development of the Beijing–Tianjin–Hebei Region was released in 2015; in addition, Beijing was granted the opportunity to host the 2022 Winter Olympics, and established three competition venues in Zhangjiakou.
Given by the aforementioned statements, this study addressed the limitations of LERA in mountainous cities within agro-pastoral transition zone and aimed to establish a collaborative management network of LER at the level of administrative units. The objectives of this research were (i) to evaluate and analyze land use changes in Zhangjiakou at grid level; (ii) to evaluate and analyze the LER in Zhangjiakou at grid level; (iii) to construct an LER social network using the SNA model and analyze relations between administrative units and their own roles at county-level; and (iv) to divide all counties into different zones according to LER social network results, in order to provide policies for promoting collaborative network management of LER at region level (Figure 1 and Figure 2).

2. Materials and Methods

2.1. Analytical Framework

The analytical framework is illustrated in Figure 2. Firstly, land use transfer matrix and standard deviational ellipse were used to analyze the land use changes at grid level. Secondly, the assessment of LER was conducted by constructing a LERA model, analyzing the quantitative and spatial changes of LER. Thirdly, the LER social network model was constructed, and indicators of SNA were used to measure the overall network and individual counties. Finally, zoning of counties based on LER social network was conducted; policies for collaborative network management of LER were proposed.

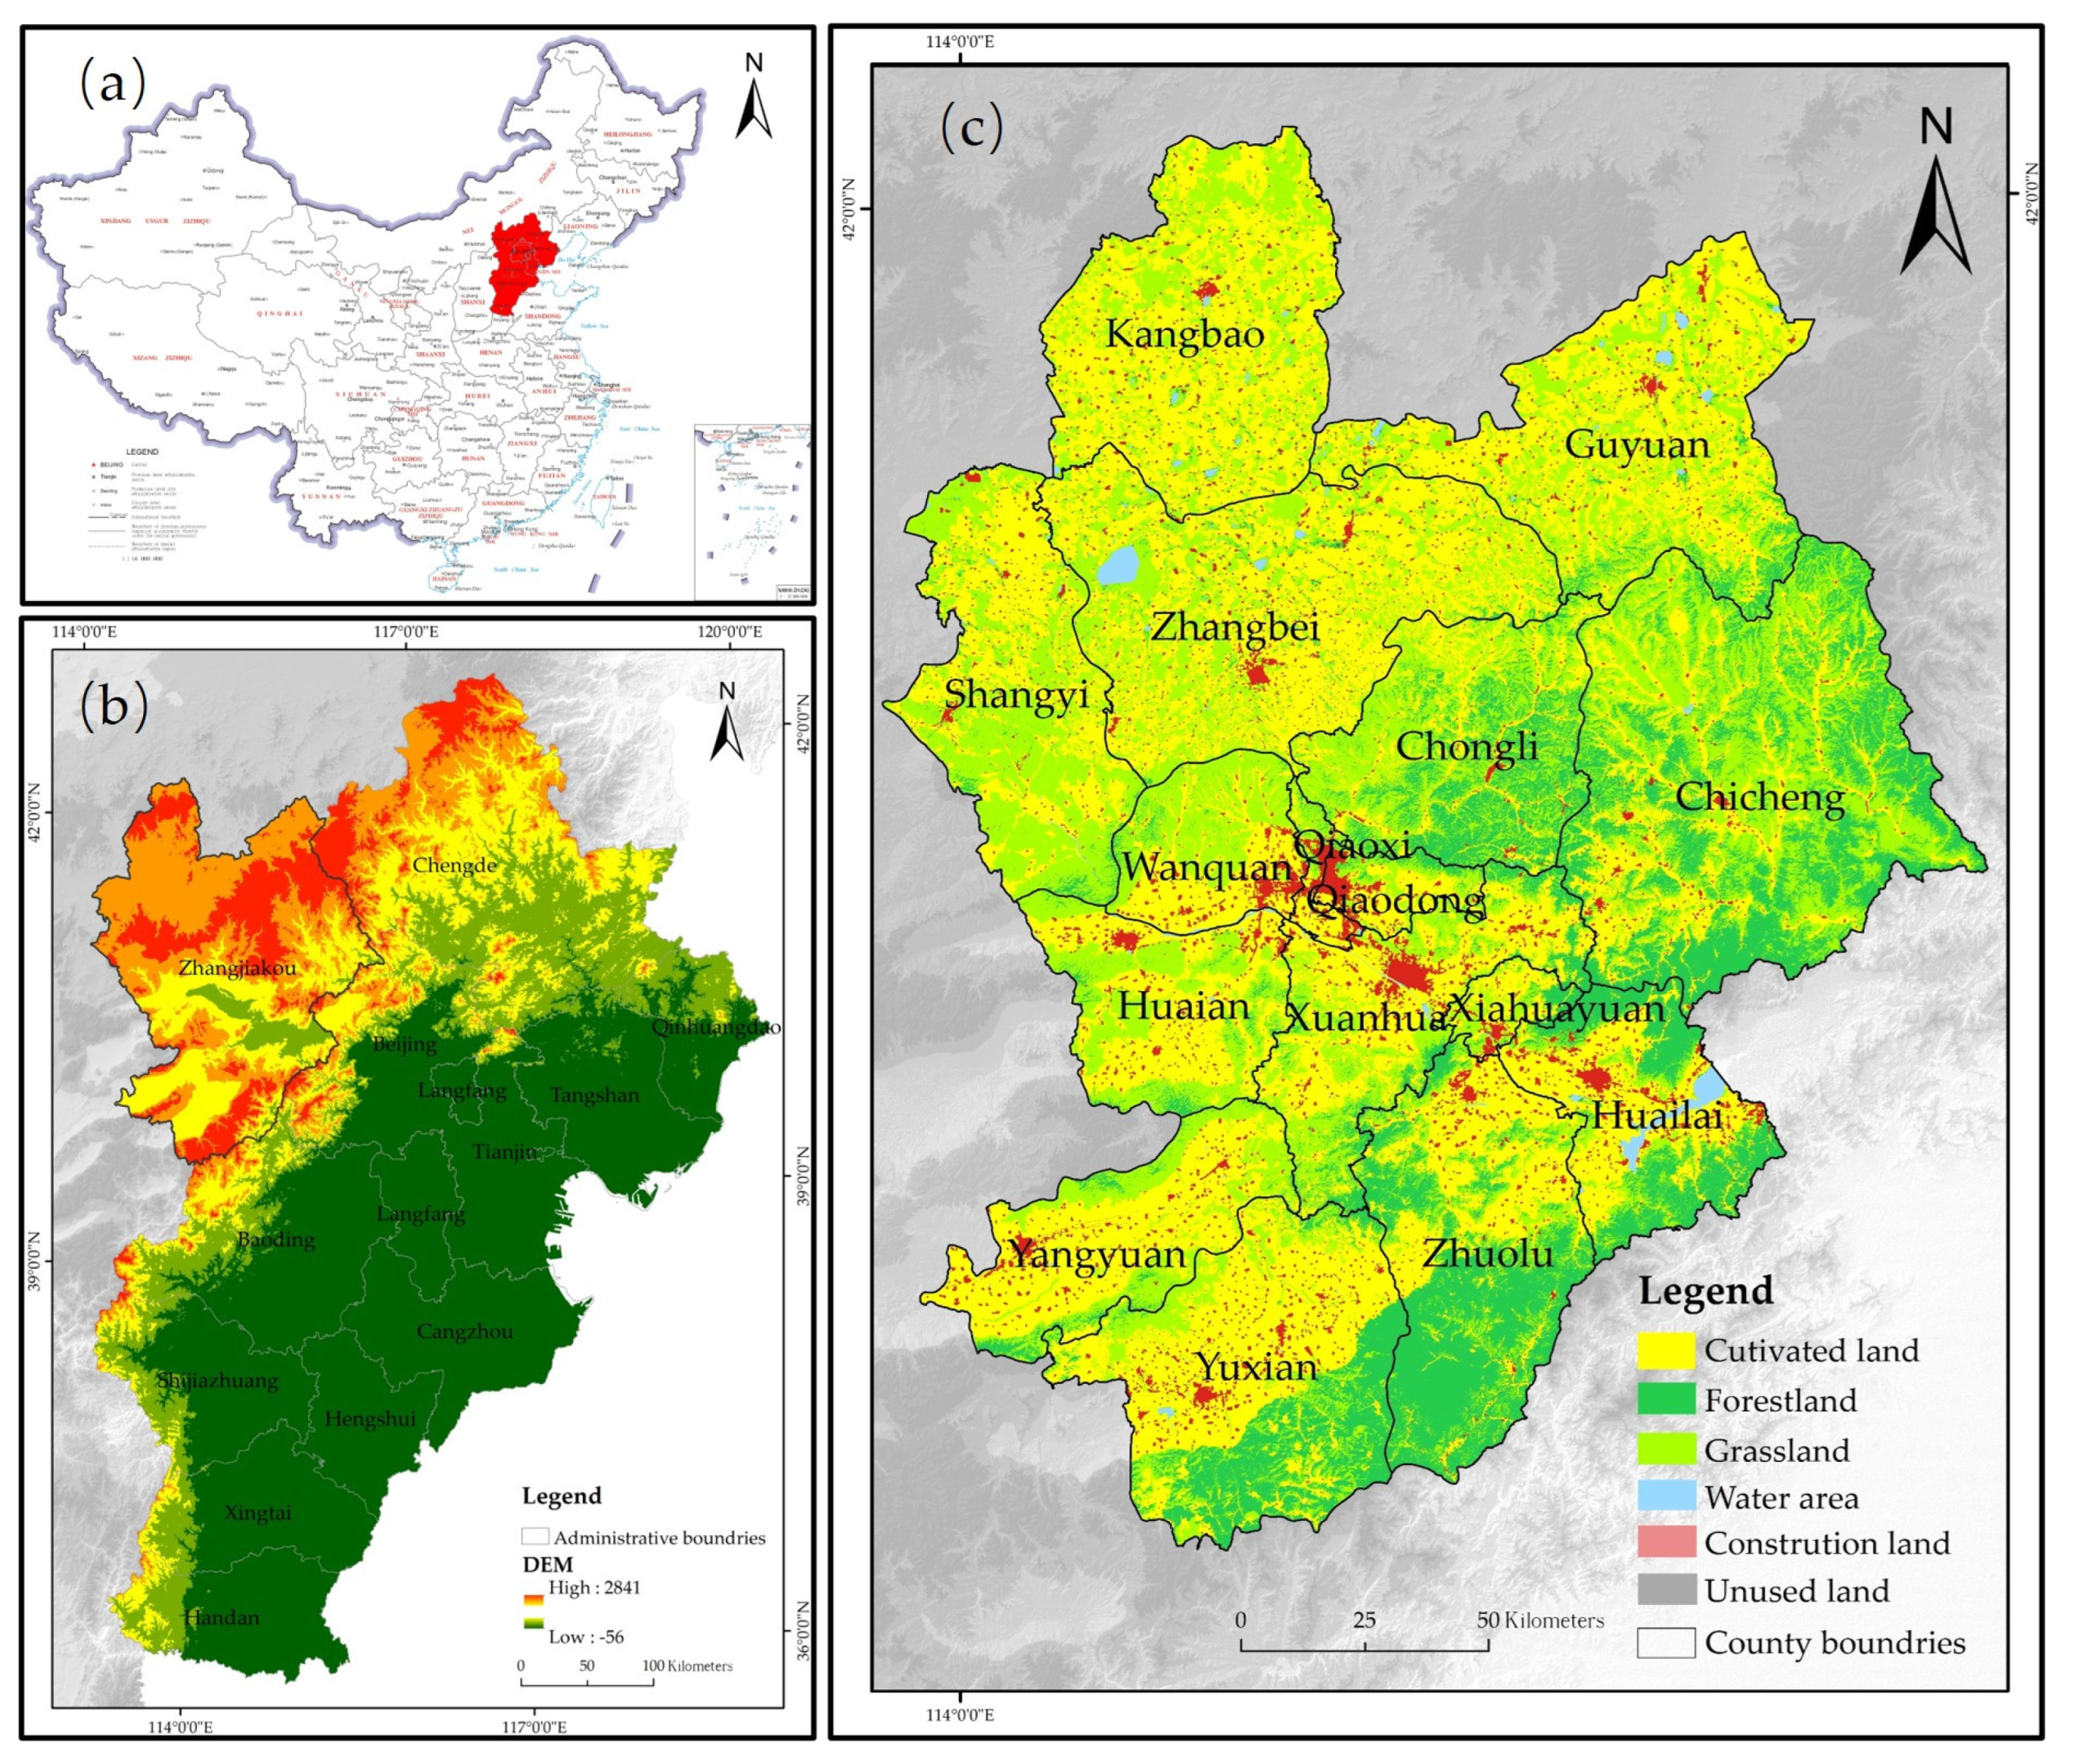
2.2. Overview of the Study Area

Zhangjiakou, with a total area of 3.68 × 10⁴ km2, is situated in the northern Hebei Province, serving as a pivotal junction connecting Beijing, Hebei, Shanxi, and Inner Mongolia. It constitutes the main part of the poverty belt around Beijing–Tianjin–Hebei [58]. The geographical coordinates of Zhangjiakou range from 39°30′–42°10′ N to 113°50′–116°30′ E, with a lower terrain in the southeast and higher elevation in the northwest. Zhangjiakou’s topography is complex. The eastern part of the Yinshan Mountains traverses the central-northern region, dividing Zhangjiakou into two distinct parts: Bashang Plateau and Baxia Basin. The Yanshan Mountains form a unique mountainous landform in central-eastern Zhangjiakou, while the Taihang Mountains are situated to the south. Because of its uniqueness of geographical location, Zhangjiakou has historically always been a military stronghold [8]. In history, nomads used to travel from Datong Basin eastward along the Sanggan River, then through the hilly basin between the Yanshan Mountains and the Taihang Mountains, finally into the North China Plain. In addition, the northwest–southeast flowing Yang River and Sanggan River converge to the Yongding River, whose valley is also a connection between the Bashang Plateau with the North China Plain.
Recently, due to the implementation of the coordinated development strategy for the Beijing–Tianjin–Hebei region, the “Implementation Opinions on the Construction Planning of Zhangjiakou Capital Water Conservation Functional Area and Ecological Environment Support Area (2019–2035)”, and the hosting of the 2022 Winter Olympics Games [58], the land use and ecological risk of Zhangjiakou have been intensified. In this context, the continuous advancement ecological civilization construction in China necessitates the adoption of an efficient and environmentally friendly pathway to achieve future sustainable development. Under the new development concept, revealing a precise understanding of ecological risk has emerged as a pivotal measure for effectively coordinating the intricate relationship between development and ecological preservation in Zhangjiakou.

2.3. Data Source

This paper evaluated the LER based on the land use data of Zhangjiakou, necessitating the precision of the land use data. Therefore, the GlobeLand30 (https://www.webmap.cn/commres.do?method=globeIndex, accessed on 3 August 2023) datasets developed by the National Geomatics Center of China were used in this paper. These datasets, with a spatial resolution of 30 m, were derived from over 20,000 Landsat and HJ1 images using a hierarchical classification method that included pixel-based classification, object-oriented post-processing, and knowledge-based validation [59,60]. They contain land use data of three years of 2000, 2010, and 2020, and their overall accuracy and the kappa coefficient achieve 85.72% and 0.82, respectively [61]. The land use types are classified into 10 categories in the GlobeLand30 datasets, including cultivated land, forest, grassland, shrub land, wetland, water bodies, tundra, artificial surfaces, bare land, and permanent snow and ice. Zhangjiakou encompasses eight land categories, excluding tundra and permanent snow and ice. According to the requirements of this study and with reference to existing research [4,62], the original land use data was reclassified into six types: cultivated land, forestland (forest and shrub land), grassland, water area (wetland and water bodies), construction land (artificial surfaces), and unused land (bare land).
Furthermore, in order to investigate the spatial correlation network of LER in Zhangjiakou using the SNA method, this study utilized county-level socio-economic data (population and GDP) obtained from the Zhangjiakou Statistical Yearbooks for 2001, 2011, and 2021, respectively.

2.4. Methods

2.4.1. Land Use Changes Analysis

(1)
Land Use Transfer Matrix
The land use transfer matrix could provide a quantitative assessment of the transformation between different land use types within the study area, thereby revealing the dynamic transfer characteristics. Conversion land often exhibits instability, potentially leading to landscape fragmentation and increased ecological risks. Land use transfer can reveal the conversion dynamics among various land types, offering comprehensive evidence to explain changes in ecological risks. By comparing the land use transfer matrix of Zhangjiakou during the periods 2000–2010 and 2010–2020, more precise reflection of the quantitative and spatial characteristics of land use transformation can be achieved, thereby facilitating rational planning of diverse land use types and promoting sustainable development. The calculation formula for the land use transfer matrix is as follows:
S i j = [ S 11 S 1 n S n 1 S n n ]
where Si and Sj denote land use areas at the beginning and end of the study period, respectively, representing the pre- and post- land use transfer conditions; n denotes the number of land-use types.
(2)
Geographical Distribution Measurement
To depict the spatial and directional characteristics of land use transfer patches in Zhangjiakou during the period, this paper employed the geospatial analysis techniques of mean center and standard deviational ellipse in the ArcGIS 10.8 platform. This method can be employed to elucidate the primary distribution trends of unstable land.
Mean center can be used to identify the geographic center for land use transfer patches, whose coordinates are the average x- and y- of all land use transfer patches, respectively.
The main results from the standard deviational ellipse include a long axis, a short axis, and rotation. The directionality of the land use transfer patches becomes more obvious as the ratio of the long and short axes deviates further from 1. The rotation refers to the clockwise rotation from the north direction to the long axis, which quantifies the degree of spatial distribution deviation in land use transfer patches. The number of standard deviations that expressed 68% of the total data was calculated using the ArcGIS 10.8 platform. Detailed formulas of these two methods refer to reference [63].

2.4.2. Landscape Ecological Risk Assessment

In this study, considering the findings from previous research and the actual conditions in the study area [22,29,34,38], this study constructed a LERA model based on the landscape loss index for assessing the landscape ecological risk index (LER). The calculation formula is as follows:
L E R k = i = 1 N A k i A k R i
where LERk represents the landscape ecological risk index for the unit k; Aki denotes the area of land use type i in the unit k; Ak represents the total area of unit k; and Ri denotes the landscape loss index for the land use type i. The evaluation model involves six landscape pattern indices, namely the landscape fragmentation (Ci), landscape separation (Ni), landscape fractal dimension index (Di), landscape disturbance (Ei), landscape vulnerability (Vi), and landscape loss (Ri). The ecological meaning and calculations are shown in Table 1 in detail. These landscape pattern indices were performed using Fragstats 4.2.
Based on the above calculation, the Geostatistics analysis module of ArcGIS 10.8 was employed further to perform Kriging interpolation in order to derive the spatial distribution of LER at grid scale for 2000, 2010, and 2020. Subsequently, we employed the natural determination method to categorize the LER into 5 types, namely lower risk, low risk, medium risk, high risk, and higher risk (hereafter abbreviated as LRR, LR, MR, HR, HRR, respectively) in ascending order.

2.4.3. Spatial Analysis Methods

(1)
Global Spatial Autocorrelation
The global spatial autocorrelation is an important approach for examining the spatial clustering characteristics of features. It enables an overall depiction of the spatial distribution characteristics of the LER throughout the entire Zhangjiakou. In this study, the widely used Moran’s I index was employed for assessing the spatial autocorrelation. The Moran’s I index is capable of reflecting the overall spatial correlation degree with its significance of all research units within the study area. The calculation formula is as follows [42,50]:
I = N i = 1 N j = 1 N W ( i , j ) ( X i X ¯ ) ( X j X ¯ ) i = 1 N j = 1 N W ( i , j ) ( X i X ¯ ) i 2
where, N represents the number of research units; Xi is the observed value for each unit; X ¯ is the average value of Xi; and W(i,j) is the spatial weight matrix where adjacency is assigned a value of 1, otherwise 0. Formula (4) represents the z-score, where E(I) is the average value of I and var(I) is the variance of I.
Z ( I ) = I E ( I ) var ( I )
If I > 0 and is statistically significant, it indicates the positive spatial autocorrelation. clustering. If I < 0, it implies negative spatial autocorrelation, and if I = 0, it indicates no spatial correlation.
(2)
Social Network Analysis (SNA) Method
The Social Network Analysis (SNA) has become a prevalent research method in sociology and economic subjects in recent years. It focuses on analyzing the inherent connections among social actors for forming a network further [51]. In this study, the 16 counties in Zhangjiakou were considered as 16 nodes, each representing an actor. The connecting lines between two nodes were used to describe the connections between each node, thus forming the entire correlation network.
For the analysis of social network, the determination of connections between nodes in the network is crucial [49]. The gravity model is considered as a typical method for measuring spatial interactions between regions [52]. Due to varying research objectives, scholars opt for different evaluation indices. In order to accurately reflect the spatial correlation of LER among 16 counties in Zhangjiakou, this study employed a modified gravity model to quantify the connections between regions, based on existing researches [50,51,52,53]. The formula is as follows:
G i j = k i j P i G i C i 3 × P j G j C j 3 D i j 2
k i j = C i C i + C j
where Gij represents the gravitation of LER from county i and county j; Pi and Gi denote the population and gross domestic product (GDP), respectively; Ci represents the LER of county i, calculated as the average LER of each county in ArcGIS; Kij represents the gravity coefficient of LER from county i to county j.
According to Equations (5) and (6), the gravity matrix of county-level LER can be constructed. To facilitate network characterization, the LER gravity matrix was binarized in this study. When Gij is greater than the critical value, which was calculated as the average value of Gij in each row, it is denoted as 1, indicating the existence of the connection from county in row i to county in column j. Otherwise, it is denoted as 0, indicating no connection between county i and j.
G i j = G 16 × 16 = [ X 1.1 X 1 , 16 X 16 , 1 X 16 , 16 ]
In terms of network analysis, this study employed the indices of network density, network efficiency, network connectedness, and degree centrality to characterize the network structure. Their respective formulas are as follows:
D t = R t / [ n × ( n 1 ) ]
where Dt represents the network density, reflecting the degree of closeness in the LER network; Rt represents the actual connections of the entire network; n is the number of counties in Zhangjiakou; and n(n − 1) represents the maximum possible number of connections in the network. Dt, with values ranging from [0, 1], increases as the connections between counties become closer.
D e = 1 [ M / max ( m ) ]
where De represents the network efficiency, reflecting the degree of redundancy in the network, and is an inverse index. A lower value of De indicates a higher level of network efficiency. M represents the number of redundant lines, and max(m) is the maximum number of possible redundant lines in the network.
Network connectedness is employed to indicate the robustness and vulnerability of the network.
C c = 1 ( v / [ n × ( n 1 ) / 2 ] )
where Cc represents the network connectedness; n is the number of counties in network; and v is the number of unreachable counties in the network.
At the individual level, this study employed outdegree, indegree, and degree centrality to characterize each network unit.
C d = i = 1 n ( I n d i + O u t d i ) / ( 2 n 2 )
where Cd represents the degree centrality of county i, reflecting its position in the network. Indi denotes the indegree of the county i, which means the number of lines from other counties to county i; Outdi represents the outdegree of county i, which means the number of lines from county i to other counties; and n denotes the number of counties.
For further exploring the characteristic of LER network, this paper calculated the average values of outdegree and average indegree, respectively. Then, the position of each county in the quadrant could be determined by comparing its outdegree and indegree with the respective average values. All counties were divided into four categories: (1) The counties in the first quadrant were characterized by both outdegrees and indegrees exceeding the average values. (2) In the second quadrant, the indegrees of these counties exceeded the average value, while the outdegrees were lower than the corresponding average value. (3) The counties in the third quadrant were characterized by both outdegrees and indegrees were lower than average values. (4) The outdegrees of counties in the fourth quadrant exceeded the average value, while their indegrees were lower than the corresponding average value.

3. Results

3.1. Spatiotemporal Analysis of Land Use Changes in Zhangjiakou

Based on the results, the predominant land use types in Zhangjiakou were cultivated land and grassland, accounting for 43.66% and 34.55% of the total area in 2020, respectively. The areas of forestland and construction land accounted for a relatively lower proportions, reaching 16.97% and 4.05%, respectively, while the scale of water area and unused land accounted for the smallest proportion, amounting to only 0.77% of the total area.
In the spatial analysis, the land use distribution in Zhangjiakou exhibited a distinct heterogeneity. As shown in Figure 3, cultivated land was widespread across the entire study area. However, there existed three primary clusters of cultivable land, encompassing the southwestern, midwestern, and southeastern regions. In terms of the distribution of forestland, it was predominantly concentrated in the Taihang Mountains, encompassing southeastern areas of Weixian, Zhuolu, and Huailai. Additionally, in Chicheng and Chongli, located in the central and eastern regions, the land use pattern exhibited a complex mosaic of forestland and grassland intertwined with each other. The northern regions of Zhangjiakou, characterized by higher elevations, relatively flat terrain, and lower precipitation, were part of the agro-pastoral transitional areas in China. Consequently, the land use pattern showed an interlaced distribution of cultivated land and grassland in this region. In terms of construction land, it was primarily concentrated in the urban built-up areas of Zhangjiakou. Additionally, there was a concentration belt of construction land along the Jing-Zhang Railway which connects Zhangjiakou to Beijing. Apart from these concentration areas, there were scattered parcels in the urban areas of each county. Overall, the spatial distribution pattern showed an alternation of cultivated land and grassland in the northern region, a blend of forestland and grassland in the eastern region, a concentration of forestland in the southeastern region, and a dispersed arrangement of construction land.
During the period of 2000–2020, Zhangjiakou has experienced varying degrees of land use changes (Figure 4). The area of construction land in Zhangjiakou exhibited a consistent upward trend, with its proportion increasing from 1.9% to 4.05%. The growth rate of construction land during the period of 2010–2020 (50.64%) was higher compared to that observed in the previous period (41.32%). According to the land use transfer matrix (Figure 5), the increase in construction land during the entire study period primarily originated from cultivated land and grassland. To be more precise, between 2000–2010, the transfer from grassland to construction land exhibited a significantly larger scale compared to that from cultivated land, while the conversion of cultivated land to construction land exceeded that of grassland between 2010–2020. In conclusion, the growth rate of construction land expansion accelerated, primarily resulting from the conversion from cultivated and grassland.
The area of cultivated land decreased initially and then slightly increased subsequently, whereas the forestland and grassland areas exhibited an initial increase followed by a subsequent decrease (Figure 4). Furthermore, based on the land use transfer matrix results (Figure 5), during 2000–2010, cultivated land emerged as the primary outflow type, followed by grassland and forestland. In terms of inflows, grassland exhibited the highest level, followed by cultivated and construction land. Specifically, 91.15% of the cultivated land outflow direction was towards grassland. Meanwhile, cultivated land served as the main contributor to the transfer-in of grassland, accounting for 89.17% of the grassland inflow areas.
Nevertheless, between 2010–2020, grassland became the main source of transfer-out land use type, followed by cultivated land and forestland (Figure 5). At the same time, grassland was identified as the predominant inflow type, followed by cultivated land, forestland, and construction land. Notably, both inflows and outflows of grassland were majorly attributed to cultivated land and forestland transformation. In conclusion, this indicated that the transfer among cultivated land, forestland, and grassland significantly dominated the land use transfer in Zhangjiakou.
Spatially, this paper displayed the overall spatial distribution of all land use transfer grids from 2000 to 2020, as shown in Figure 6a–c. According to the results of the standard deviation ellipses and mean center analysis of land use transfer between 2000–2010 and 2010–2020, it was revealed that there was a consistent directional trend of “the long axis extended in the northeast–southwest direction, and the short axis extended in the northwest–southeast direction” in the two periods. It could be suggested that there was a stronger tendency of land use transfer along the northeast–southwest direction compared to the other direction. However, there were changes in the distances and rotation angles of both axes. Compared to the previous period, the distance of the long axis in 2010–2020 decreased, indicating a pronounced clustering trend of land use transfer along this direction. The short axis, meanwhile, exhibited a slightly increase, indicating a dispersion of land use transfer along the direction of short axis. The change in the rotation angle indicated a further shift in the distribution of land use transfer towards the northeast–southwest direction. Furthermore, it is noteworthy that the mean center exhibited an eastward movement, reinforcing the previous finding of eastward shifting. This observation could be further supported by Figure 6a,b, which clearly illustrate a significant expansion of land use transfer (primarily transfer-in of forestland) in Chicheng and Chongli during the period of 2010–2020. In summary, the results indicated a widespread occurrence of land use transfer throughout Zhangjiakou, with a clear trend towards spatial expansion in further. And the ecological land transfer in the Yanshan Mountains significantly contributed to the reconfiguration of the overall land use pattern.
For analyzing the spatial pattern of land use transfer more precisely, this paper presented the detailed maps illustrating transfer-in and transfer-out of four primary land use transfer types between 2000–2020 (Figure 6e–h). As shown in Figure 6e,g, the northern agro-pastoral transition areas represented a focal region characterized by a significant decline in cultivated land and a corresponding increase in grassland. Moreover, there was a notable expansion trend of construction land along the Jing-Zhang Railway (Figure 6h). It is evidently apparent that both the width and length of this construction land belt experienced expansion, accompanied by a significant reduction in cultivated land within its surrounding regions. In addition, the transfer of forestland remained predominantly concentrated in the Yanshan and Taihang Mountains (Figure 6f), especially in Chongli and Chicheng. This suggested that the transfer of various land use types exhibited distinct spatial heterogeneity.

3.2. Spatiotemporal Analysis of Landscape Ecological Risk (LER) Changes in Zhangjiakou

3.2.1. Overall Analysis on LER

As shown in Figure 7, the predominant LER levels in Zhangjiakou were LR, MR, and HR levels, with relatively fewer occurrences of LRR and HRR levels. Throughout the study period, the areas of LRR and LR levels continued to increase, experiencing increments of 793 km2 and 4731 km2, respectively. These increasing areas accounted for 15.1% of the total area of Zhangjiakou. Conversely, the areas of MR, HR, and HRR levels experienced reductions of 3743 km2, 1550 km2, and 248 km2, respectively. Both of changes indicated a decrease in the overall level of LER in Zhangjiakou.
For better understanding the dynamic change of LER, this study presented the LER transfer matrix from 2000 to 2020 (Figure 8). The results revealed that changes in LER were primarily characterized by transfers between adjacent levels, with a rare occurrence of abrupt changes in LER. Specifically, during 2000–2010, the predominant transfers were related to MR and HR levels, constituting 63.6% and 19.6% of the total transfer areas respectively. Within these transfers, 64.74% of the MR transfers shifted to LR level, while 34.77% shifted to HR level. Moreover, 95.4% of the HR transfers shifted to MR level. From 2010 to 2020, although the MR and HR remained the primary transfer types, there was a notable increase in transitions of HR level, accounting for 38.5% of the total transitions. It is noteworthy that 92.87% of HR transfers transitioned to MR level. The proportion of MR transfers decreased, yet it still accounted for 42.66% of all transfer areas, indicating its continued prevalence, with 87.65% of these transitions shifting to LR level. In general, from 2000 to 2020, the LER in Zhangjiakou predominantly transferred from MR to LR level and shifted from HR to MR level. The overall LER level in the entire region primarily decreased in both two periods.

3.2.2. Distribution of Land Use Types in LER

Utilizing the zonal statistics tool in ArcGIS, we obtained the proportions of different land use types within each LER areas during 2000–2020. Figure 9a–c demonstrates that forestland was the dominant land use type in LRR areas, followed by grassland and cultivated land, while in LR and MR areas, cultivated land predominated, followed by grassland and forestland. In addition, HR areas exhibited a predominant presence of both cultivated land and grassland, with forestland behind; and HRR areas are primarily dominated by grassland, with cultivated land as a secondary type.
Throughout the period from 2000 to 2020, the proportion of cultivated land in LRR and LR areas exhibited an upward trend, increasing from 14.37% and 47.28% to 20.89% and 48.06%, respectively. From the perspective of proportions of different levels of LER in cultivated land, it is noteworthy that areas with LRR and LR levels exhibited a smaller yet expanding characteristic. The proportion of cultivated land in the MR area was consistently the highest from both perspectives. Nevertheless, there has been an overall decrease in this proportion. The proportions of cultivated land in HRR and HR areas have exhibited a consistent decline. Consequently, the overall LER of cultivated land has demonstrated a discernible decline.
As presented in Figure 9d–f, the results demonstrated a decline in the proportion of HR and HRR areas within forestland, from 33.38% in 2000 to 31.64% in 2020, while concurrently witnessing an increase in the proportion of LR and LRR areas from 48.07% to 53.46%. These findings suggest a gradual decline in LER associated with forestland.
The proportion of MR and HR areas in the entire grassland accounted for the highest, reaching approximately 60%-70%. This revealed a concerning situation in which a significant portion of grassland were at a relatively high risk. However, the results (Figure 9d–f) also indicated a downward trend in the percentage of these areas.
As for construction land, owing to its rapid expansion, almost all of the proportions of construction land in different LER levels have increased (Figure 9d–f). Notably, the proportions of MR, HR, and HRR areas in all construction land reduced, indicating a decline in its LER.

3.2.3. Spatial Analysis on LER

The spatial distribution characteristics of the LER in Zhangjiakou in 2000 are presented in Figure 10a. The HRR areas exhibited the smallest scale, which were mainly located in Shangyi on the western Bashang Plateau, as well as in the Jinlianshan-Heilong Hilly Area connected to Chicheng and Guyuan in the northeast. Within these areas, grassland and cultivated land were the dominant landscape types, exhibiting higher susceptibility to landscape losses following frequent anthropogenic disturbances. There were three concentrated regions characterized by HR level. The first region encompassed the Zhangbei Plateau, which was predominantly located in the northern part of Shangyi, the western part of Zhangbei, and the southern part of Kangbao. The second region comprised the mountainous areas encompassing Chongli, Chicheng, and Guyuan. The third concentration region was situated in central cities such as Xuanhua, Zhuolu, Yangyuan, and Weixian, characterized by a predominant landscape of cultivated land. The significant landscape loss in this area could be attributed to the substantial impact of human cultivation activities. Furthermore, the MR areas were primarily concentrated in the central region of Zhangjiakou, surrounded by the peripheries of the HR areas. The LR areas were mainly located in the northern and southeastern parts of Zhangjiakou. While characterized by extensive forested landscapes, regions in the southern Taihang Mountains of Weixian and Zhuolu were identified as concentration areas with the lower level of risk.
Compared to 2000, the areas of HRR witnessed a decrease in 2010, while its spatial distribution remained largely unchanged. In addition, there were areas experiencing transfer from HRR to HR level, which were mainly located in the western Bashang Plateau. As shown in Figure 10b, the HR areas have witnessed an expansion, with the most significant change in merging from three areas into two. Firstly, the contiguous region encompassing plateau area and northwest mountain area has expanded. Secondly, there was a contraction in the contiguous region consisting of Xuanhua, Zhuolu, Yangyuan and Weixian within the central areas. In addition, the MR areas in central cities (Wanquan, Huai’an, Xuanhua, Huailai) and southern cities (Yangyuan and Yuxian) predominantly transitioned into LR level, leading to a significant reduction in their overall spatial extent. It was demonstrated that the LR areas were mainly concentrated in the northern, central, and southern areas, while the LRR areas remained relatively stable, with only a portion of areas in the northern part of Kangbao transitioning into the LR level. In summary, the most significant change observed during 2000–2010 was the expansion of HR areas in the northern region.
In 2020, the overall change in the HRR areas was not significant. However, there was a certain reduction in the spatial distribution of these areas specifically in northeastern Guyuan County. Additionally, there was a notable decrease in the HR areas at the junction of Inner Mongolia and northwest Zhangjiakou. In terms of the MR areas, it experienced transfers in and transfers out at the same time while exhibiting an overall declining trend. Precisely, the increase in the MR areas primarily resulted from the declassification of the initial HR areas, while the reduction was attributed to their transformation into LR level. In addition, the LR and LRR areas demonstrated consistent growth and the spatial distribution has become more contiguous. In the central and southern regions, the areas of these two levels have been integrated into a closed loop. During this period, the most significant changes included the conversion of HR to MR level in the northwest and an increase in LRR areas within the central region.
In summary, based on the analysis of the spatial distribution characteristics of LER in Zhangjiakou from 2000 to 2020, it can be observed that the LER has been gradually decreased, which was in line with the functional positioning of itself. Regions with a relatively high LER levels were primarily located in the transitional regions from northwestern Bashang Plateau to the northeastern mountainous and hilly areas.
This paper also computed the Moran’s I index using Geoda software 1.2, to explore the spatial clustering characteristic of the LER in Zhangjiakou. As shown in Figure 11, the results of the Moran’s I values for LER in the years 2000, 2010, and 2020 were 0.871, 0.893, and 0.877, respectively. All values were greater than 0 and statistically significant, indicating a strong positive spatial correlation in the distribution of LER in Zhangjiakou. In other words, there was a distinct spatial clustering characteristic in the distribution of LER.

3.3. Social Network Analysis of LER

3.3.1. Analysis on Overall Network and Individual Counties

To enhance the comprehension of spatial correlation of LER, this study employed the social network analysis (SNA) method to examine its correlation network characteristic. Based on the modified gravity model, a spatial correlation matrix for LER in Zhangjiakou was constructed. Then, we utilized the UCINET 6.7 and Gephi 10.1 software to calculate network indicators and visualize the network.
The results showed that, from 2000 to 2020, the network connectedness of LER in Zhangjiakou remained at 1, indicating the absence of any independent county. In other words, all counties were found to be interconnected within the spatial correlation network, demonstrating varying degrees of spatial correlation and spillover effects among them. The network density was 0.3, 0.34, and 0.32 in 2000, 2010, and 2020, respectively, indicating a certain level of correlation among various counties of Zhangjiakou. It is worth noting that, during 2000–2020, the network density exhibited an initial increase followed by a subsequent decline, indicating a temporal pattern of increasing spatial correlation followed by weakening. Nevertheless, the overall network density was enhanced. The network efficiency decreased from 0.68 to 0.59, indicating a robust and gradually improving stability of the correlation network, accompanied by an abundance of spillover effects. Overall, the findings indicated that the LER impacts among the counties was progressively intensifying.
As shown in Figure 12, the correlation level of each county exhibited distinct variations. Xuanhua, Qiaodong, Qiaoxi, Wanquan, and Zhangbei consistently served as pivotal nodes in the network, exhibiting a consistently high degree centrality level. Within these counties, Xuanhua, Qiaodong, and Qiaoxi were primarily influenced by indegree relationships (Figure 12b,e,h), suggesting that they were predominantly impacted by other counties within the LER network. Both Qiaodong and Qiaoxi showed an increasing trend in degree centrality and indegree value, indicating an augmented level of connectivity and influx with other counties. In addition, the trend exhibited by Qiaoxi was similar to that of Qiaodong, albeit at a comparatively lower magnitude. Xuanhua exhibited the highest degree centrality, with a moderate level of outdegree and a higher level of indegree. This suggested that it maintained extensive connections with other counties while being significantly influenced by them. In contrast to Xuanhua, Qiaodong, and Qiaoxi, Zhangbei and Wanquan exhibited distinct characteristics with a comparable level of outdegree and indegree, suggesting their susceptibility not only to external influences but also to spillover effects on other counties. Notably, these two counties demonstrated a relative stability throughout the entire research period. Additionally, despite exhibiting a stronger outward relationship compared to the inward relationship, Chongli, Guyuan, Shangyi, Kangbao, and Chicheng demonstrated distinct different characteristics. Kangbao, Chicheng, Guyuan, and Shangyi exhibited an increase spillover effects, while the outward and inward of Chongli decreased, indicating a weakened connection with other counties. Generally, the degree of interconnection among network nodes exhibited variability. The key nodes maintained relatively stable, while the direction of their connection varied.

3.3.2. Zoning of Counties Based on LER Social Network

According to the aforementioned classification method (Section 2.4.3), we categorized the 16 counties into four categories. Based on the results (Figure 13), there were two counties (Wanquan and Zhangbei) in the first category, whose outdegrees and indegrees both exceeded their respective average values. Within this category, the cumulative indegrees of these two counties amounted to 10, while the total number of outdegrees reached 12. This indicated a relatively strong interconnection between these two counties and other counties. Zhangbei clearly exhibited a higher level of LER, accompanied by the surrounding counties also demonstrating relatively high LER levels, resulting in a significant degree of outdegree and indegree. Both counties showed relatively high levels of effects on external entities while simultaneously being influenced by others.
In terms of the second category, it included four counties (Qiaoxi, Xuanhua, Huailai, and Qiaodong), which were characterized by above-average indegrees and below-average outdegrees. It was notably worthy that counties in this category were distinguished by their significantly higher indegrees, accounting for 43. This observation indicated that these counties primarily experienced LER influx relationships originating from other counties within the spatial correlation network. The counties in this category generally exhibited a relatively lower LER value and a higher level of socio-economic development. These counties were predominantly influenced by other units, while their outward influence on these units was relatively low.
In the third category, there were three counties (Chongli, Xiahuayuan, and Zhuolu) with both outdegrees and indegrees below the respective average values. The total number of outdegrees and indegrees of these counties were eleven and nine, respectively. Counties in this category exhibited a relatively lower degree of interconnectivity with other counties. Nevertheless, it should be noted that the outdegree in each county was approximately equal to the indegree within its own county. Consequently, these counties demonstrated a relatively limited spillover effect on other counties, while reciprocally being influenced by them as well. Nevertheless, the degree of reciprocal influence among these counties remained relatively low.
The fourth category comprised seven counties (Chicheng, Guyuan, Huaian, Kangbao, Shangyi, Yuxian, and Yangyuan), which represented the largest number among all categories. These counties demonstrated significantly higher levels of both outdegrees and indegrees, with the outward connections reaching 40, which was substantially greater than the corresponding inward connections. In general, these counties predominantly exhibited a higher LER, resulting in significant spatial spillover effects. Notably, Yuxian stood out as a distinct county, characterized by a relatively lower LER. In comparison to the surrounding counties, Yuxian exhibited a higher population and GDP, thereby leading to the spillover of socio-economic factors that could potentially pose ecological risks on other regions. In order to facilitate the proposition of a macro control strategy, based on the characteristics of these four categories, we reclassified the counties into three zones, namely bidirectional correlation zone, primary beneficial zone, and primary spillover zone (shown in Figure 13). Overall, these counties had a pronounced impact on other counties.

4. Discussion

4.1. Multi-Dimensional Influencing Factors of Land Use Change

This study has presented empirical evidence for the effect of intricate interplay between natural conditions and human activities on land use distribution [47]. The natural environmental conditions, such as elevation, slope, precipitation, and temperature, etc., decide the basic spatial distribution of land use cover. For instance, the elevation and slope are the key factors of land reclamation and development, and the precipitation is important to vegetation growth [58]. However, the dynamic changes of land use are closely related to human activities.
Because of its uniqueness of geographical location, which is the transitional area of Inner Mongolia Plateau–Yanshan Mountain–North China Plain, Zhangjiakou has always been a military stronghold [8]. The Bashang Plateau has historically been characterized by the dominance of a nomadic civilization, which has determined grassland as a primary land use type in this region. Since the settlement of the Han Nationality after Ming and Qing dynasties, farming civilization was introduced and spread here, leading to a large amount of land transformation from grassland to cultivated land. Subsequently, a stable agro-pastoral area was gradually formed, which was characterized by interlaced distribution of cultivated land and grassland. Additionally, despite the high elevation and steep slope (Figure 14a,b), the southern and eastern regions of Zhangjiakou exhibited a substantial presence of forestland with enhanced vegetation coverage (Figure 14c,d) [55]. In terms of the spatial distribution of cultivated land, it exhibited a strong correlation with rivers and geomorphology, primarily concentrated in the southwest hills of Yanshan Mountains, basins between Yanshan Mountains and Taihang Mountains, and surrounding areas along major rivers such as the Yang River, Sanggan River, Yongding River, Huliu River, etc. These areas, characterized by relatively low elevation, gentle slope, and dense river networks offered favorable conditions for agricultural activities (Figure 14a,b).
Previous researches considered the human activities such as urbanization, economic development, and policies as important factors of the dynamic land use change [58,64]. During 2000–2020, the land use changes in Zhangjiakou mainly focused on the transformation among cultivated land, forestland, grassland, and construction land. Firstly, as for construction land, with the progress of urbanization and economic development, regions with high population density, convenient transportation, and advanced economy have witnessed an expansion in construction land [65]. On one hand, considering the external environment, the unique location in close proximity to Beijing has rendered Zhangjiakou profoundly impacted by the spillover effects of Beijing’s urban expansion. Particularly due to the relocation of non-capital functions from Beijing, some secondary industrial enterprises had been displaced to Zhangjiakou, resulting in a more significant impact. Additionally, Zhangjiakou leveraged the 2022 Winter Olympic Games to accelerate the construction of sports facilities within region, thereby significantly amplifying the expansion of construction land in 2010–2020. Conversely, considering its internal development dynamics, Zhangjiakou has undergone rapid urbanization and socio-economic development, resulting in correspondingly increasing demand of construction land. In spatial analysis, it is notable that there was a significant expansion of construction land along the Jing-Zhang Railway. The Winter Olympics facilitated the enhancement of transportation infrastructure, augmenting the increase of construction land along the corridor. Secondly, with regard to agricultural land, it was found that there was a strong spatial correlation between the decrease in cultivated land and the increase in grassland, particularly in northwestern Zhangjiakou (Figure 6e,g). In addition, the Yanshan and Taihang Mountains represented key regions for the transfer in of forestland. This could be primarily attributed to policies. For instance, in order to combat desertification and to enhance the water retention capacity, the government has implemented a series of policies such as the Grain for Green Program (GFGP), the Beijing–Tianjin Sandstorm Control Program [9,58], and so on. These policies promoted the conversion of cultivated land to forestland and grassland by providing farmers with cash and food subsidies, as well as tax incentives.

4.2. Driving Factors of Spatiotemporal Pattern of LER

The LER was also the results of the joint influence of many factors [6]. Owing to the complex topography and ecologically fragile environment, mountainous cities are more susceptible to natural factors (e.g., frequent natural disasters, broken terrain, concentrated rainfall etc.) and human activities (e.g., overgrazing, steep slope reclamation, and urbanization development and policies) [41,65,66]. Zhangjiakou is also considered as an ecologically fragile area in China [10].
This paper demonstrated that the LER in the transitional areas between Bashang Plateau and Baxia Plain and foothills (e.g., Shangyi, Zhangbei, Chongli, Chicheng) exhibited higher than other regions, which aligned with previous research findings [2,67]. This disparity can be attributed to the ecological instability prevalent in these specific areas. Similar to prior research studies, the LER exhibited a relatively lower level in urban built-up areas. These built-up areas were typically situated in flat and abundant areas, characterized by relatively ecological stability [2]. Nevertheless, some scholars contend that this traditional approach primarily focuses on urban expansion as a means to enhance connectivity and mitigate vulnerability in the context of construction land. However, this view overlooks its own ecological impact [15]. In line with previous studies, this investigation revealed that forestland and unused land exhibited the lowest and highest levels of LER respectively [6]. Cultivated land demonstrated a relatively lower LER level, while construction land and grassland displayed comparatively higher levels. When focusing on the two primary distribution areas of forestland, located in the regions of Yanshan Mountains (southern areas) and Taihang Mountains (eastern areas), significant differences were observed between them. The LER in Taihang Mountain exhibited a comparatively lower level when compared to that of the Yanshan Mountains. In the Yanshan Mountains areas, for example, Chicheng, cultivated land and forestland were distributed alternately, resulting in a relatively fragmented landscape structure with limited stability and recovery ability [22]. Conversely, in the Taihang Mountains areas (e.g., Yuxian and Zhuolu), forestland with high vegetation coverage was concentrated and continuously distributed, leading to a favorable ecological environment.
This paper demonstrates that the overall LER in Zhangjiakou has shown a decline. This could be attributed to the decline in the fragmentation of forestland and grassland which was closely associated with the effective implementation of GFGP and the Beijing–Tianjin Sandstorm Control Program. In addition, the enforcement of the Grazing Restriction Program further improved the self-restoration and risk resilience of grassland [8]. Forestland and grassland are widely recognized for their substantial contributions to ecosystem services, making the optimization of landscape patterns in these areas a crucial factor in reducing LER in Zhangjiakou [65]. Furthermore, the average patch area of the water area has witnessed an increase from 10.69 ha in 2000 to 89.27 ha in 2020, owing to the comprehensive management and ecological restoration project in the Yongding River Basin implemented by Zhangjiakou. This endeavor has significantly enhanced the water ecological environment through an external water replenishment.

4.3. Explanations and Comparisons of Spatial Autocorrelation and Social Network Analysis

The first law of geography states that the spatial location of a region exerts influence over both its own landscape and that of its adjacent regions [43]. Numerous studies have unequivocally demonstrated the presence of spatial correlations in LER [31,42]. This paper reanalyzed the spatial correlations using the SNA method, which has been previously employed in related studies of similar subject. The SNA method has demonstrated its inherent advantages in analyzing the spatial correlation of LER. SNA expresses spatial connections through “point-to-point” relationships, whereas spatial autocorrelation describes spatial characteristics by spatial adjacency [50]. Some studies have suggested that SNA could be regarded as an extension and development of spatial autocorrelation [52]. In this study, the findings of the two methodologies exhibited a certain degree of concurrence. Both the Moran’s I index and network density showed a similar temporal trend characterized by an initial increase followed by a subsequent decrease in 2000–2020.
The human–environment system represents a dynamic interplay between natural processes and socio-economic activities. Upon reaching this consensus, the spatial correlation network of LER essentially could be considered as the distribution of flowing natural and social elements (such as air, water, wind, and human) across non-flowing land [68]. This leads to regional variations in ecological risk transmission, ultimately resulting in a complex spatial network that combines points, lines, and regions. Therefore, the connection from one point to another could be comprehended in two different ways. Firstly, the observed relations could be interpreted as a spillover effect originating from a region with higher LER, resulting in the spatial transfer of ecological risk. Secondly, the inward relations could be ascribed to the attractiveness of regions experiencing an influx of capital and population. Consequently, these relationships could exacerbate land fragmentation and pose a threat to ecological integrity. In this paper, the connections from counties in the primary spillover zone (e.g., Shangyi, Guyuan) to other counties predominantly belonged to the first type. Conversely, counties with influx connections in the primary beneficial zone (e.g., Qiaodong, Qiaoxi) tend to be characterized by the latter approach. During the process of regional integration, the synergistic effects of market mechanisms and collaborative management by governments enable coordinated prevention of ecological risks among different administrative units [69].

4.4. Policy Implications for Collaborative Network Management of LER

According to the findings of this study, we presented several policy implications as follows. In this study, the effective implementation of various ecological protection policies during the study period has been demonstrated to result in a significant reduction in LER in Zhangjiakou. Due to the unique economic location, ecologically vulnerable environment, and significant capacity for ecosystem services of Zhangjiakou, this study suggested that policies aiming at ecological protection should be reinforced in response to the corresponding challenges. Given the spatial heterogeneity and correlation of LER, this study advocated for the development of a comprehensive and targeted proposal that took into account various scales, including grid-level, county-level, and region-level.
For the primary beneficial zone, it should be noted that mitigating ecological risks is not solely the responsibility of HR areas but rather a crucial measure that impacts the entire region. Therefore, it is imperative to implement approaches in various respects, such as intercounty transfer payments policies (e.g., carbon emission trading systems, fiscal transfer payment mechanisms, transfer of development rights), counterpart-assistance program, and support for the provision of necessary professional assistance [46,70]. In addition, these counties were mainly characterized by the rapid expansion of construction land. Thus, during its own developmental process, it is crucial to steer the population and construction activities towards centralized built-up areas, thereby averting expansion into ecologically vulnerable regions. These measures can mitigate the LER associated with land fragmentation and the occupation of ecologically vulnerable areas.
In the primary spillover zone, the spillover effect of the LER in these counties tends to be higher, particularly for those situated in the Bashang Plateau. Therefore, the emphasis of these counties should be placed on mitigating their own LER. Firstly, it is essential to persist in implementing policies aiming at safeguarding forestland and grassland, while mitigating fragmentation and instability. It is recommended that these counties take the initiative in establishing a collaborative alliance for ecological risk prevention and control, and collectively implement measures to mitigate ecological risks alongside other counties. It is imperative to draw on the experiences and technologies of developed regions to enhance the introduction and transformation of technology [71].
Counties in the bidirectional correlation zone not only accept risks but also contribute to risk spillover within the LER network, with these two factors being nearly equivalent. Therefore, these counties should focus on both mitigating the spillover of risks and preventing the inflow of risks. The recommendation is for them to assume an intermediary role within the network, actively engaging in cooperation and providing guidance to facilitate consensus among the involved counties. They should act as an intermediary to facilitate the transmission of information between primary beneficial and spillover zones, foster the establishment of horizontal multilateral relationships, promote regional collaboration, and enhance interactions with other regions [72].

4.5. Research Limitations and Future Directions

The findings of this study can serve as a valuable reference for subsequent landscape pattern optimization and ecological restoration in Zhangjiakou. Utilizing land use change data and landscape indicators, this paper conducted research on LER assessment. Nevertheless, this paper overlooked the potential risks arising from the environmental conditions of the ecological system [42]. Therefore, it is essential to enhance the ecological risk assessment from a more holistic perspective in future research. Although this paper discussed the factors influencing the spatiotemporal evolution of land use and LER, this study primarily examined the effects of natural and socio-economic factors on LER changes from a qualitative and comparative perspective. It is imperative to employ quantitative methods to analyze the underlying influencing mechanisms, aiming at providing more detailed and reliable policy recommendations [35,73].
In addition, the SNA method solely considers the quantity of relationships between counties. However, in the field of ecological risk research, it is important to investigate the magnitude of spillover effects. It is possible that there are instances where the number of inter-county relationships is limited, yet their impact may be substantial. The inaccuracies in cumulative ecological impact assessments hinder the formulation and implementation of more effective policy recommendations. Future research may adopt relevant methodologies derived from the study of ecosystem service flow to explore a network analysis framework that integrates both the quantitative and qualitative dimensions of relationships [74].

5. Conclusions

This study analyzed the spatiotemporal dynamic evolution of land use change and assessed the LER in Zhangjiakou, which is a typical mountainous city. Additionally, the spatial correlation network characteristics of LER in Zhangjiakou was explored. The primary findings are as follows:
(1)
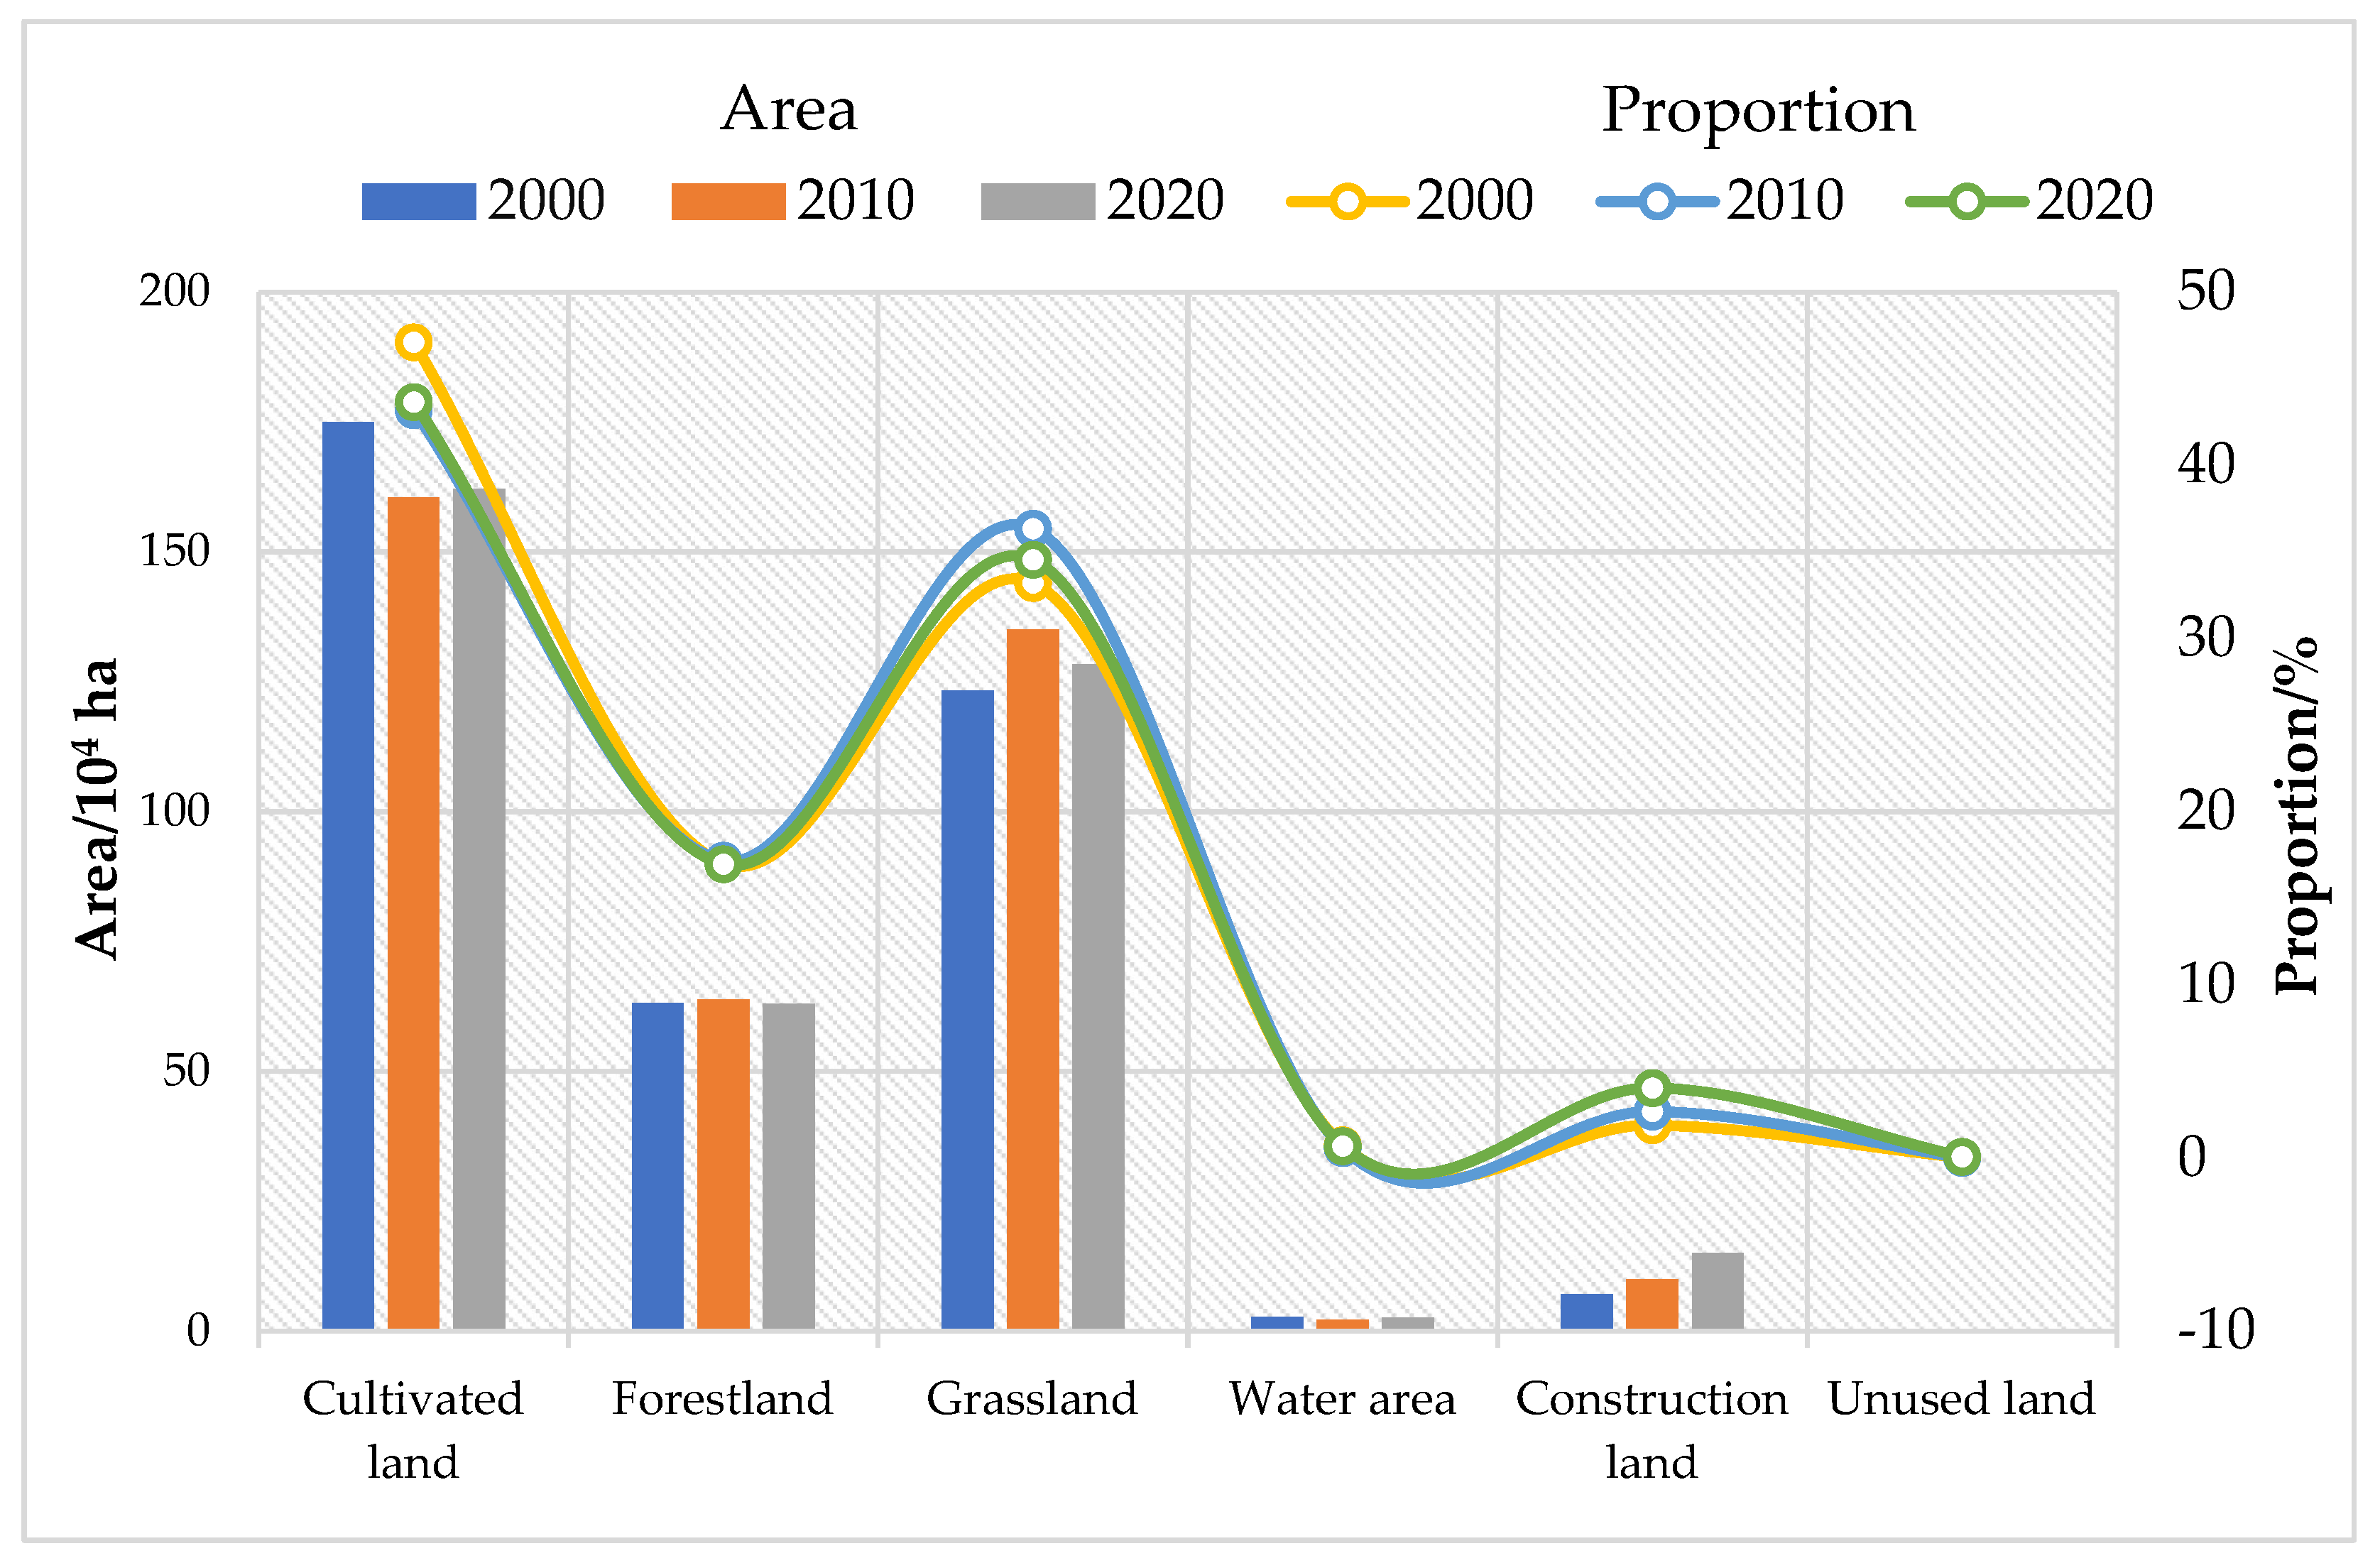
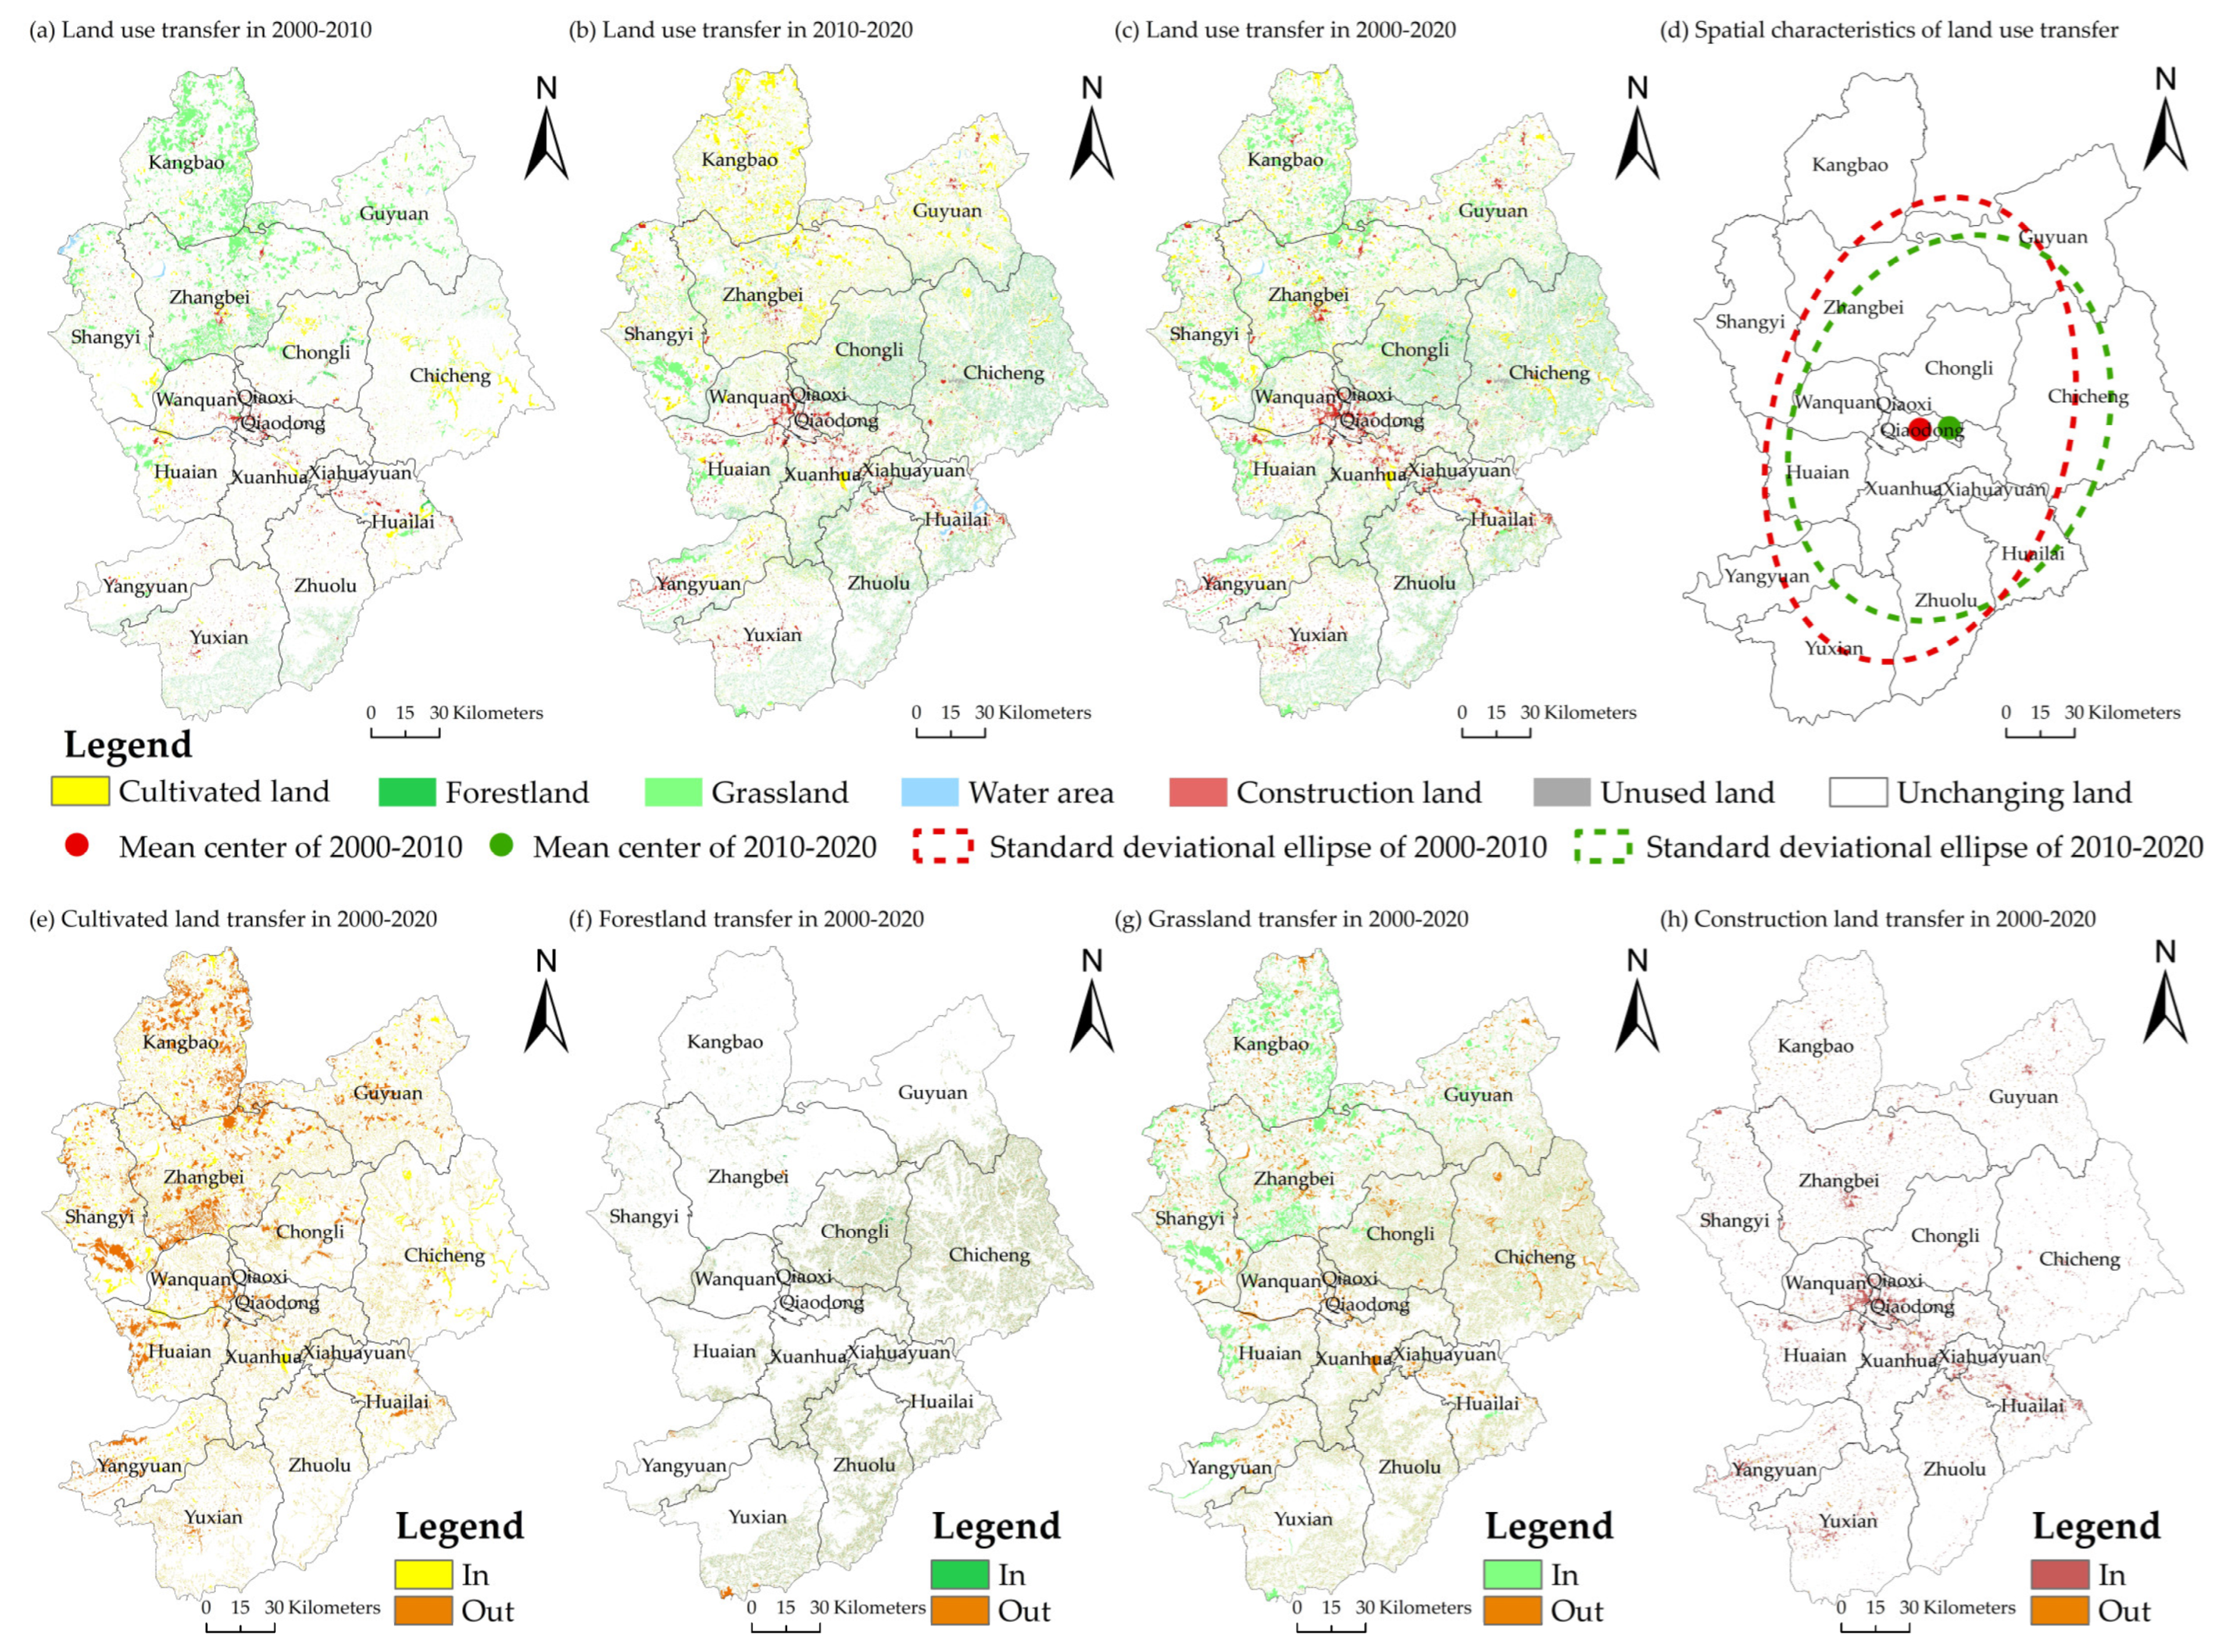
From 2000 to 2020, the transfer among cultivated land, forestland, and grassland significantly dominated the land use change in Zhangjiakou. Construction land exhibited the most substantial expansion, which was primarily concentrated in the urban built-up areas and areas along the Jing-Zhang Railway.
(2)
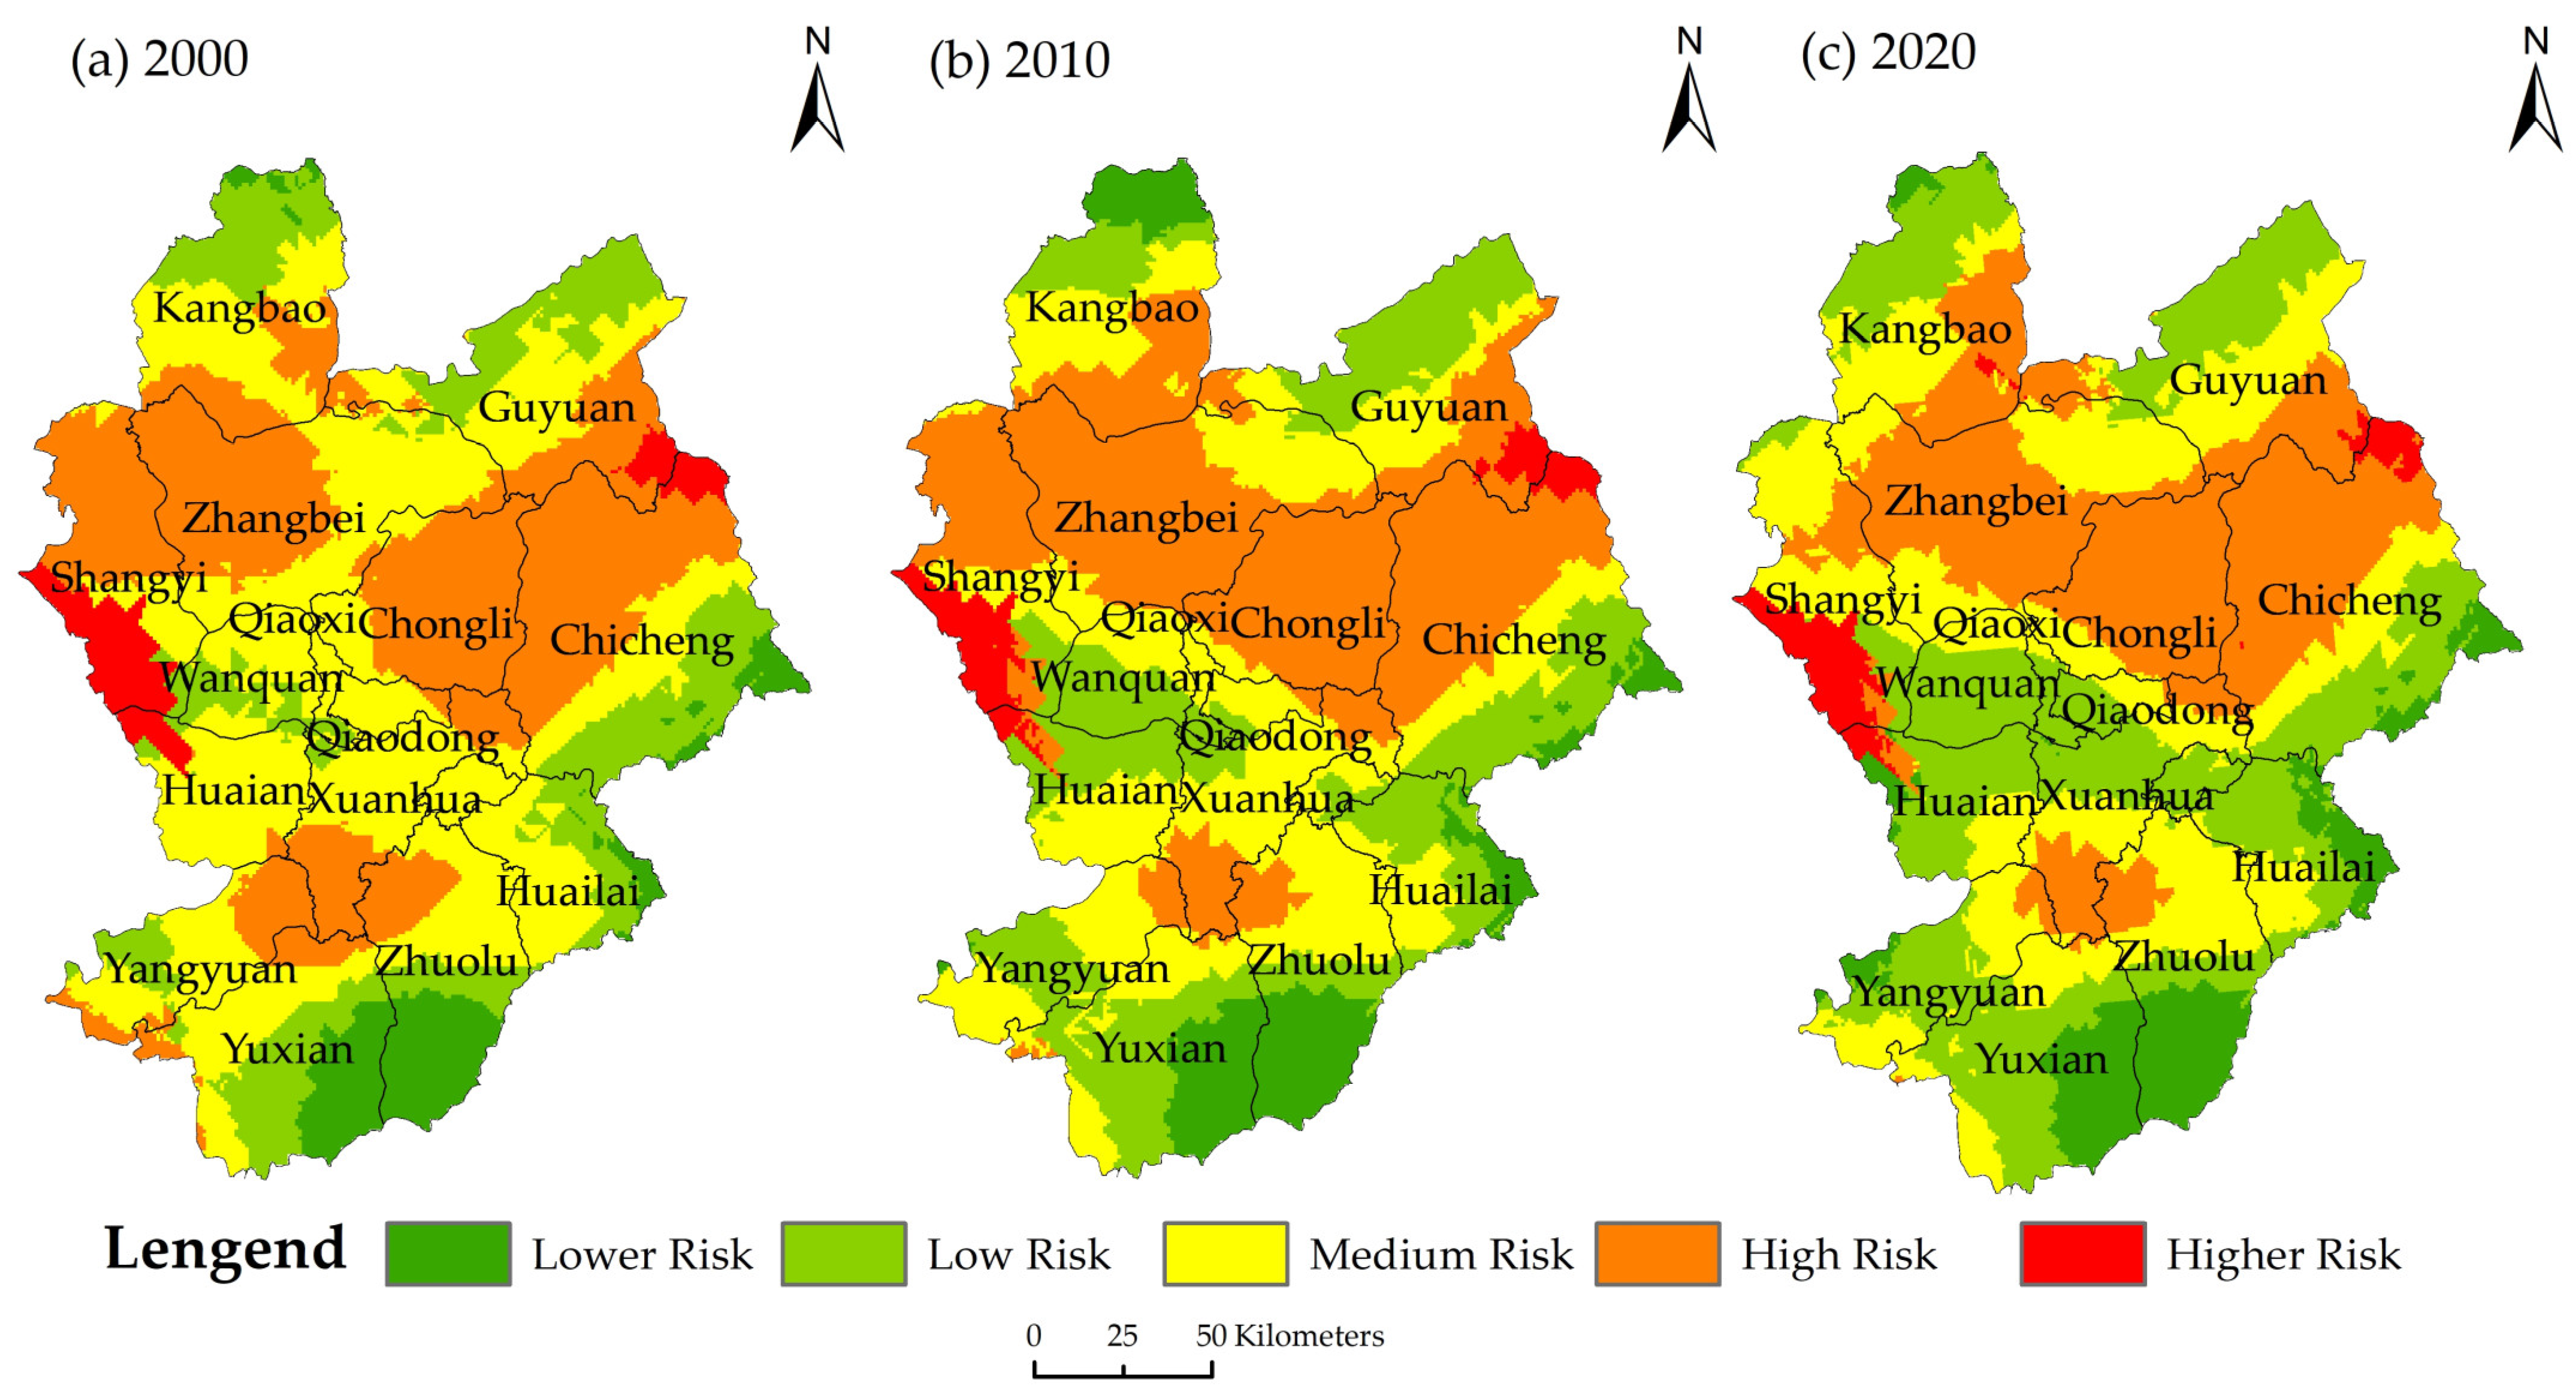
During the study period, the LER in Zhangjiakou exhibited a decline trend. In spatial analysis, the overall distribution pattern of LER in Zhangjiakou demonstrated a relatively stable yet dynamic trend. The LER in the transitional areas between Bashang Plateau–Baxia Plain and the foothills exhibited relatively higher level. Throughout the study period, Zhangjiakou consistently exhibited a spatial clustering of the LER, which demonstrated an overall upward trend.
(3)
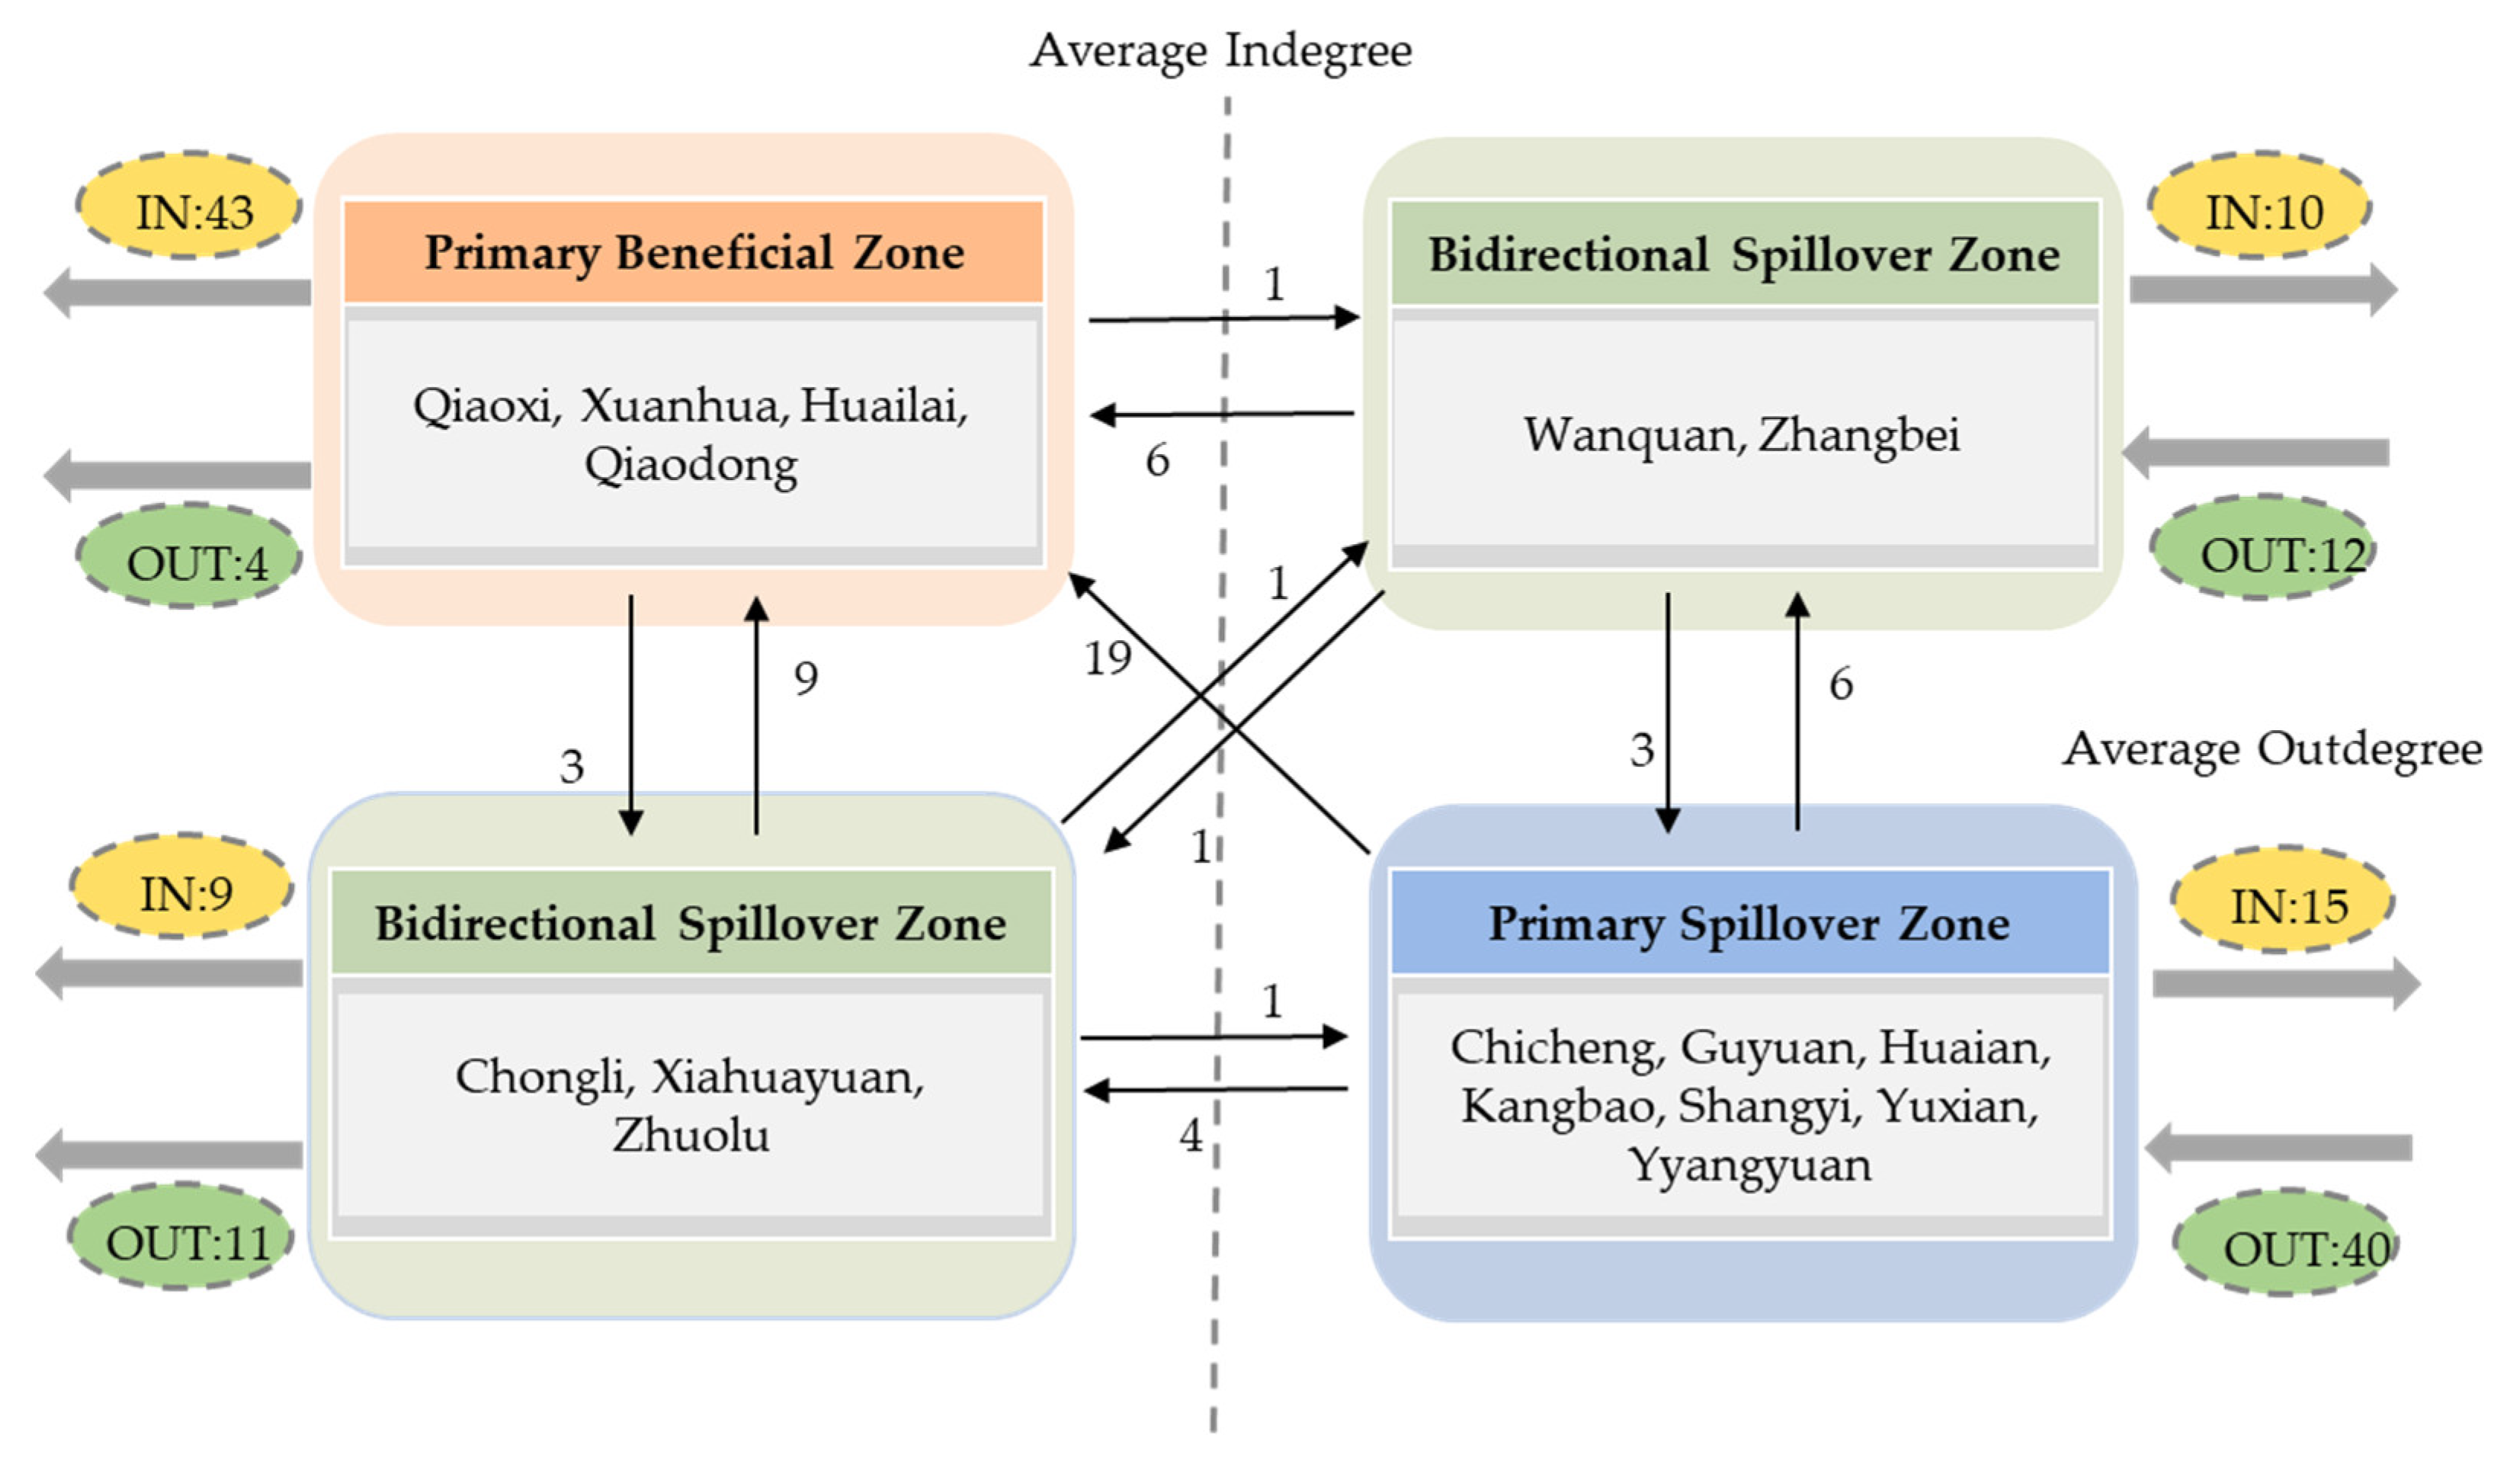
Xuanhua, Qiaodong, Qiaoxi, Wanquan, and Zhangbei hold a crucial position in the LER collaborative management network. Based on the SNR results, counties of Zhangjiakou were classified into three zones. Counties in primary spillover zone should prioritize measures to mitigate the local LER. While counties in the primary beneficial zone should consider implementing policies such as intercounty transfer payments, counterpart-assistance programs, and support for the provision of necessary professional assistance. Meanwhile, counties in the bidirectional correlation zone should act as intermediaries, actively promoting cooperation and consensus-building among counties.

Author Contributions

Conceptualization, M.L. and Q.S.; methodology, M.L. and L.Z.; software, M.L. and L.Z.; validation, M.L. and Y.C.; formal analysis, M.L. and L.Z.; investigation, M.L. and S.L.; resources, M.L. and Q.S.; data curation, M.L. and Y.C.; writing—original draft preparation, M.L. and L.Z.; writing—review and editing, M.L.; visualization, M.L. and M.C.; supervision, Q.S.; project administration, M.L.; funding acquisition, M.L. All authors have read and agreed to the published version of the manuscript.

Funding

This research was funded by the Tianjin Philosophy and Social Science Research Planning Project (grant number TJGL21-030).

Data Availability Statement

The data presented in this study are openly available (see Section 2.3).

Conflicts of Interest

Author Lingli Zhang was employed by the company Beijing Penta Color Gold Soil Information & Technology Co., Ltd. The remaining authors declare that the research was conducted in the absence of any commercial or financial relationships that could be construed as a potential conflict of interest.

References

  1. Cui, B.; Zhang, Y.; Wang, Z.; Gu, C.; Liu, L.; Wei, B.; Gong, D.; Rai, M.K. Ecological Risk Assessment of Transboundary Region Based on Land-Cover Change: A Case Study of Gandaki River Basin, Himalayas. Land 2022, 11, 638. [Google Scholar] [CrossRef]
  2. Qu, Z.; Zhao, Y.; Luo, M.; Han, L.; Yang, S.; Zhang, L. The Effect of the Human Footprint and Climate Change on Landscape Ecological Risks: A Case Study of the Loess Plateau, China. Land 2022, 11, 217. [Google Scholar] [CrossRef]
  3. Bing, Z.; Qiu, Y.; Huang, H.; Chen, T.; Zhong, W.; Jiang, H. Spatial distribution of cultural ecosystem services demand and supply in urban and suburban areas: A case study from Shanghai, China. Ecol. Indic. 2021, 127, 10772. [Google Scholar] [CrossRef]
  4. Zhang, W.; Chang, W.J.; Zhu, Z.; Hui, Z. Landscape ecological risk assessment of Chinese coastal cities based on land use change. Appl. Geogr. 2020, 117, 102174. [Google Scholar] [CrossRef]
  5. Sobhani, P.; Esmaeilzadeh, H.; Barghjelveh, S.; Sadeghi, S.M.M.; Marcu, M.V. Habitat Integrity in Protected Areas Threatened by LULC Changes and Fragmentation: A Case Study in Tehran Province, Iran. Land 2021, 11, 6. [Google Scholar] [CrossRef]
  6. Shen, W.; Zhang, J.; Wang, K.; Zhang, Z. Identifying the spatio-temporal dynamics of regional ecological risk based on Google Earth Engine: A case study from Loess Plateau, China. Sci. Total Environ. 2023, 873, 162346. [Google Scholar] [CrossRef] [PubMed]
  7. Carriger, J.F.; Parker, R.A. Conceptual Bayesian networks for contaminated site ecological risk assessment and remediation support. J. Environ. Manag. 2021, 278, 111478. [Google Scholar] [CrossRef] [PubMed]
  8. Ji, Z.; Liu, C.; Xu, Y.; Sun, M.; Wei, H.; Sun, D.; Li, Y.; Zhang, P.; Sun, Q. Quantitative identification and the evolution characteristics of production–living–ecological space in the mountainous area: From the perspective of multifunctional land. J. Geogr. Sci. 2023, 33, 779–800. [Google Scholar] [CrossRef]
  9. Wang, X.; Zhang, X.; Feng, X.; Liu, S.; Yin, L.; Chen, Y. Trade-offs and Synergies of Ecosystem Services in Karst Area of China Driven by Grain-for-Green Program. Chin. Geogra. Sci. 2020, 30, 101–114. [Google Scholar] [CrossRef]
  10. Sun, P.; Xu, Y.; Yu, Z.; Liu, Q.; Xie, B.; Liu, J. Scenario simulation and landscape pattern dynamic changes of land use in the poverty belt around Beijing and Tianjin: A case study of Zhangjiakou city, Hebei province. J. Geogr. Sci. 2016, 26, 272–296. [Google Scholar] [CrossRef]
  11. Liu, Y. Realizing China’s urban dream. Nature 2014, 509, 158–160. [Google Scholar]
  12. National Bureau of Statistics of China. China Statistical Yearbook; China Statistics Press: Beijing, China, 2022. [Google Scholar]
  13. Yuan, Y.; Chen, D.; Wu, S.; Mo, L.; Tong, G.; Yan, D. Urban sprawl decreases the value of ecosystem services and intensifies the supply scarcity of ecosystem services in China. Sci. Total Environ. 2019, 697, 134170. [Google Scholar] [CrossRef] [PubMed]
  14. Gomes, E.; Inácio, M.; Bogdzevič, K.; Kalinauskas, M.; Karnauskaitė, D.; Pereira, P. Future land-use changes and its impacts on terrestrial ecosystem services: A review. Sci. Total Environ. 2021, 781, 146716. [Google Scholar] [CrossRef] [PubMed]
  15. Guo, H.; Cai, Y.; Li, B.; Wan, H.; Yang, Z. An improved approach for evaluating landscape ecological risks and exploring its coupling coordination with ecosystem services. J. Environ. Manage. 2023, 348, 119277. [Google Scholar] [CrossRef] [PubMed]
  16. Peng, J.; Dang, W.; Liu, Y.; Zong, M.; Hu, X. Review on landscape ecological risk assessment. Acta Geogr. Sin. 2015, 70, 664–677. [Google Scholar]
  17. U.S. Environmental Protection Agency. Framework for Ecological Risk Assessment; EPA/630/R-92/001; Risk Assessment Forum, U.S. Environmental Protection Agency: Washington, DC, USA, 1992. [Google Scholar]
  18. U.S. Environmental Protection Agency. Guidelines for Ecological Risk Assessment; EPA/630/R-95/002F; Risk Assessment Forum, U.S. Environmental Protection Agency: Washington, DC, USA, 1998. [Google Scholar]
  19. Betrollo, P. Assessing landscape health: A case study from northeastern. Ital. Environ. Manag. 2001, 27, 349–365. [Google Scholar]
  20. Maanan, M.; Saddik, M.; Maanan, M.; Chaibi, M.; Assobhei, O.; Zourarah, B. Environmental and ecological risk assessment of heavy metals in sediments of Nador lagoon, Morocco. Ecol. Indic. 2015, 48, 616–626. [Google Scholar] [CrossRef]
  21. Bhuiyan, M.; Karmaker, S.; Bodrud-Doza, M.; Rakib, M.; Saha, B. Enrichment, sources and ecological risk mapping of heavy metals in agricultural soils of dhaka district employing SOM,PMF and GIS methods. Chemosphere 2021, 263, 128339. [Google Scholar] [CrossRef] [PubMed]
  22. Zeng, C.; He, J.; He, Q.; Mao, Y.; Yu, B. Assessment of Land Use Pattern and Landscape Ecological Risk in the Chengdu-Chongqing Economic Circle, Southwestern China. Land 2022, 11, 659. [Google Scholar] [CrossRef]
  23. Qian, Y.; Dong, Z.; Yan, Y.; Tang, L. Ecological risk assessment models for simulating impacts of land use and landscape pattern on ecosystem services. Sci. Total Environ. 2022, 833, 155218. [Google Scholar] [CrossRef] [PubMed]
  24. Li, S.; He, W.; Wang, L.; Zhang, Z.; Chen, X.; Lei, T.; Wang, S.; Wang, Z. Optimization of landscape pattern in China Luojiang Xiaoxi basin based on landscape ecological risk assessment. Ecol. Indic. 2023, 146, 109887. [Google Scholar] [CrossRef]
  25. Hunsaker, C.T.; Graham, R.L.; Suter, G.W.; O’Neil, R.V.; Barnthouse, L.W.; Gardner, R.H. Assessing ecological risk on a regional scale. Environ. Manag. 1990, 14, 325–332. [Google Scholar] [CrossRef]
  26. Graham, R.L.; Hunsaker, C.T.; O’Neil, R.V.; Jackson, B.L. Ecological risk assessment at the regional scale: Ecological archives A005-001. Ecol. Appl. 1991, 1, 196–206. [Google Scholar] [CrossRef] [PubMed]
  27. Sun, X.; Yang, P.; Tao, Y.; Bian, H. Improving ecosystem services supply provides insights for sustainable landscape planning: A case study in Beijing, China. Sci. Total Environ. 2022, 802, 149849. [Google Scholar] [CrossRef]
  28. Li, W.; Wang, Y.; Xie, S.; Sun, R.; Cheng, X. Impacts of landscape multifunctionality change on landscape ecological risk in a megacity, China: A case study of Beijing. Ecol. Ind. 2020, 117, 106681. [Google Scholar] [CrossRef]
  29. Bi, Y.; Zheng, L.; Wang, Y.; Li, J.; Yang, H.; Zhang, B. Coupling analysis of land use change with landscape ecological risk in China: A multi-scenario simulation perspective. Ecol. Indic. 2023, 146, 109871. [Google Scholar] [CrossRef]
  30. Xie, H.; Wen, J.; Chen, Q.; Wu, Q. Evaluating the landscape ecological risk based on GIS: A case-study in the poyang lake region of China. Land Degrad. Dev. 2021, 32, 2762–2774. [Google Scholar] [CrossRef]
  31. Du, L.; Dong, C.; Kang, X.; Qian, X.; Gu, L. Spatiotemporal evolution of land cover changes and landscape ecological risk assessment in the Yellow River Basin, 2015–2020. J. Environ. Manag. 2023, 332, 117149. [Google Scholar] [CrossRef]
  32. Gao, L.; Tao, F.; Liu, R.; Wang, Z.; Leng, H.; Zhou, T. Multi-scenario simulation and ecological risk analysis of land use based on the PLUS model: A case study of Nanjing. Sustain. Cities Soc. 2022, 85, 104055. [Google Scholar] [CrossRef]
  33. Li, Z.; Zhu, K.; Song, D.; Guan, D.; Cao, J.; Su, X.; Zhang, Y.; Zhang, Y.; Ba, Y.; Wang, H. Analysis of Spatial Relationship Based on Ecosystem Services and Ecological Risk Index in the Counties of Chongqing. Land 2023, 12, 1830. [Google Scholar] [CrossRef]
  34. Wang, L.; Wang, M. Chengdu-Chongqing Urban Landscape Ecological Risk Evolution Analysis. Resour. Environ. Yangtze Basin 2023, 32, 626–637. [Google Scholar]
  35. Wang, S.; Tan, X.; Fan, F. Landscape Ecological Risk Assessment and Impact Factor Analysis of the Qinghai–Tibetan Plateau. Remote Sens. 2022, 14, 4726. [Google Scholar] [CrossRef]
  36. Ai, J.; Yu, K.; Zeng, Z.; Yang, L.; Liu, Y.; Liu, J. Assessing the dynamic landscape ecological risk and its driving forces in an island city based on optimal spatial scales: Haitan Island, China. Ecol. Indic. 2022, 137, 108771. [Google Scholar] [CrossRef]
  37. Zhou, B.; Xu, J.; Yu, H.; Wang, L. Comprehensive assessment of ecological risks of Island destinations—A case of Mount Putuo Island, China. Ecol. Indic. 2023, 154, 110783. [Google Scholar] [CrossRef]
  38. Wolf, I.D.; Sobhani, P.; Esmaeilzadeh, H. Assessing Changes in Land Use/Land Cover and Ecological Risk to Conserve Protected Areas in Urban–Rural Contexts. Land 2023, 12, 231. [Google Scholar] [CrossRef]
  39. Wang, H.; Liu, X.; Zhao, C.; Chang, Y.; Liu, Y.; Zang, F. Spatial-temporal pattern analysis of landscape ecological risk assessment based on land use/land cover change in Baishuijiang National nature reserve in Gansu Province, China. Ecol. Indic. 2021, 124, 107454. [Google Scholar] [CrossRef]
  40. Zhang, X.; Yao, L.; Luo, J.; Liang, W. Exploring Changes in Land Use and Landscape Ecological Risk in Key Regions of the Belt and Road Initiative Countries. Land 2022, 11, 940. [Google Scholar] [CrossRef]
  41. Shi, Z.; Deng, W.; Zhang, S. Spatio-temporal pattern changes of land space in Hengduan Mountains during 1990–2015. J. Geogr. Sci. 2018, 28, 529–542. [Google Scholar] [CrossRef]
  42. Zhang, Y.; Hu, X.; Wei, B.; Zhang, X.; Tang, L.; Chen, C.; Wang, Y.; Yang, X. Spatiotemporal exploration of ecosystem service value, landscape ecological risk, and their interactive relationship in Hunan Province, Central-South China, over the past 30 years. Ecol. Indic. 2023, 156, 111066. [Google Scholar] [CrossRef]
  43. Ren, D.; Cao, A. Analysis of the heterogeneity of landscape risk evolution and driving factors based on a combined GeoDa and Geodetector model. Ecol. Indic. 2022, 144, 109568. [Google Scholar] [CrossRef]
  44. Yu, Z.; Chen, L.; Tong, H.; Chen, L.; Zhang, T.; Li, L.; Yuan, L.; Xiao, J.; Wu, R.; Bai, L.; et al. Spatial correlations of land-use carbon emissions in the Yangtze River Delta region: A perspective from social network analysis. Ecol. Indic. 2022, 142, 109147. [Google Scholar] [CrossRef]
  45. He, Y.; Wei, Z.; Liu, G.; Zhou, P. Spatial network analysis of carbon emissions from the electricity sector in China. J. Clean. Prod. 2020, 262, 121193. [Google Scholar] [CrossRef]
  46. Huo, T.; Cao, R.; Xia, N.; Hu, X.; Cai, W.; Liu, B. Spatial correlation network structure of China’s building carbon emissions and its driving factors: A social network analysis method. J. Environ. Manag. 2022, 320, 115808. [Google Scholar] [CrossRef] [PubMed]
  47. Qiao, Q.; Zhen, Z.; Liu, L.; Luo, P. The Construction of Ecological Security Pattern under Rapid Urbanization in the Loess Plateau: A Case Study of Taiyuan City. Remote Sens. 2023, 15, 1523. [Google Scholar] [CrossRef]
  48. Zhang, M.; Liu, X.; Peng, S.; Zhang, Y.; Chen, Y.; Wen, L. Evolution Characteristics and Formation Mechanism of Spatial Correlation Network of Provincial Land Use Carbon Emission Efficiency in China. China Land Sci. 2023, 37, 91–101. [Google Scholar]
  49. Jiang, Q.; Ma, X. Spillovers of environmental regulation on carbon emissions network. Technol. Forcast Soc. 2021, 169, 120825. [Google Scholar] [CrossRef]
  50. Shen, W.; Liang, H.; Dong, L.; Ren, J.; Wang, G. Synergistic CO2 reduction effects in Chinese urban agglomerations: Perspectives from social network analysis. Sci. Total Environ. 2021, 798, 149352. [Google Scholar] [CrossRef]
  51. Sun, L.; Qin, L.; Taghizadeh-Hesary, F.; Zhang, J.; Mohsin, M.; Chaudhry, I.S. Analyzing carbon emission transfer network structure among provinces in China: New evidence from social network analysis. Environ. Sci. Pollut. Res. Int. 2020, 27, 23281–23300. [Google Scholar] [CrossRef]
  52. Liu, H.; Liu, C.; Sun, Y. Spatial correlation network structure of energy consumption and its effects in China. China Ind. Econ. 2015, 5, 83–95. [Google Scholar]
  53. Li, J. Structural Characteristics and Evolution Trend of Collaborative Governance of Air Pollution in “2 + 26” Cities from the Perspective of Social Network Analysis. Sustainability 2023, 15, 5943. [Google Scholar] [CrossRef]
  54. Chong, Z.; Qin, C.; Ye, X. Environmental Regulation and Industrial Structure Change in China: Integrating Spatial and Social Network Analysis. Sustainability 2017, 9, 1465. [Google Scholar] [CrossRef]
  55. Ji, Z.; Xu, Y.; Sun, M.; Liu, C.; Lu, L.; Huang, A.; Duan, Y.; Liu, L. Spatiotemporal characteristics and dynamic mechanism of rural settlements based on typical transects: A case study of Zhangjiakou City, China. Habitat. Int. 2022, 123, 102545. [Google Scholar] [CrossRef]
  56. Huang, A.; Xu, Y.; Sun, P.; Zhou, G.; Liu, C.; Lu, L.; Xiang, Y.; Wang, H. Land use/land cover changes and its impact on ecosystem services in ecologically fragile zone: A case study of Zhangjiakou City, Hebei Province, China. Ecol. Indic. 2019, 104, 604–614. [Google Scholar] [CrossRef]
  57. Pan, T.; Zuo, L.; Zhang, Z.; Zhao, X.; Sun, F.; Zhu, Z.; Liu, Y. Impact of land usechange on water conservation: A case study of Zhangjiakou in Yongding River. Sustainability 2020, 13, 22. [Google Scholar] [CrossRef]
  58. Liu, C.; Xu, Y.; Lu, X.; Han, J. Trade-offs and driving forces of land use functions in ecologically fragile areas of northern Hebei Province: Spatiotemporal analysis. Land Use Policy 2021, 104, 105387. [Google Scholar] [CrossRef]
  59. Chen, J.; Cao, X.; Peng, S.; Ren, H. Analysis and Applications of GlobeLand30: A Review. Int. J. Geo-Inf. 2017, 6, 230. [Google Scholar] [CrossRef]
  60. Wang, Y.; Zhang, J.; Liu, D.; Yang, W.; Zhang, W. Accuracy Assessment of GlobeLand30 2010 Land Cover over China Based on Geographically and Categorically Stratified Validation Sample Data. Remote Sens. 2018, 10, 1213. [Google Scholar] [CrossRef]
  61. Chen, J.; Ban, Y.; Li, S. China: Open access to Earth land-cover map. Nature 2014, 514, 434. [Google Scholar]
  62. Zhu, K.; He, J.; Zhang, L.; Song, D.; Wu, L.; Liu, Y.; Zhang, S. Impact of Future Development Scenario Selection on Landscape Ecological Risk in the Chengdu-Chongqing Economic Zone. Land 2022, 11, 964. [Google Scholar] [CrossRef]
  63. ESRI ArcGIS Desktop. Available online: https://desktop.arcgis.com/zh-cn/arcmap/10.3/tools/spatial-statistics-toolbox.htm (accessed on 31 August 2023).
  64. Liu, Y.; Liao, H.; Li, T.; Cai, J.; Li, J.; He, T.; Luo, G. Spatio-temporal diversity and influencing factors of multi-functionality of land use in mountainous regions. Trans. Chin. Soc. Agr. Eng. 2019, 35, 271–279. [Google Scholar]
  65. Li, Y.; Liu, W.; Feng, Q.; Zhu, M.; Yang, L.; Zhang, J.; Yin, X. The role of land use change in affecting ecosystem services and the ecological security pattern of the Hexi Regions, Northwest China. Sci. Total Environ. 2023, 855, 158940. [Google Scholar] [CrossRef] [PubMed]
  66. Lin, L.; Wei, X.; Luo, P.; Wang, S.; Kong, D.; Yang, J. Ecological Security Patterns at Different Spatial Scales on the Loess Plateau. Remote Sens. 2023, 15, 1011. [Google Scholar] [CrossRef]
  67. Yan, J.; Li, G.; Qi, G.; Qiao, H.; Nie, Z.; Huang, C.; Kang, Y.; Sun, D.; Zhang, M.; Kang, X.; et al. Landscape ecological risk assessment of farming-pastoral ecotone in China based on terrain gradients. Hum. Ecol. Risk Assess. 2021, 27, 2124–2141. [Google Scholar] [CrossRef]
  68. Yuan, S.; Huang, J.; Zhu, C.; Mei, Z. Characteristics and Formation Mechanisms of Spatial Correlation Network of Production-Living-Ecological Functions in Metropolitan Areas: Taking Hangzhou Metropolitan Area as an Example. China Land Sci. 2024, 38, 56–67. [Google Scholar]
  69. Zhang, Y.; Dai, Y.; Ke, X. Spatial Correlation Network Characteristics of New-type Urbanization and Its lmpact on the Land Use Eco-efficiency in China: A Perspective of Network Centrality. China Land Sci. 2023, 37, 117–129. [Google Scholar]
  70. Gai, M.; Xu, J.; Yue, P. Characteristics and formation mechanism of spatial association network of coastal human-nature system resilience in the Bohai Rim region. Resour. Sci. 2024, 46, 565–582. [Google Scholar]
  71. Hai, X.; Zhan, X.; Wang, X. Study on the Characteristics of Carbon Emission Spatial Interconnection Networks at the Provincial Level in the Context of the ‘Double Carbon’ Target. Stat. Decis. 2024, 40, 85–89. [Google Scholar]
  72. Li, Z.; Guo, H.; Hu, Y.; Xu, L. Spatial correlation network structure and influencing factors of tourism ecological security in China. Acta Ecol. Sin. 2024, 44, 1–13. [Google Scholar]
  73. Lin, X.; Wang, Z. Landscape ecological risk assessment and its driving factors of multi-mountainous city. Ecol. Indic. 2023, 146, 109823. [Google Scholar] [CrossRef]
  74. Su, D.; Cao, Y.; Dong, X.; Wu, Q.; Fang, X.; Gao, Y. Evaluation of ecosystem services budget based on ecosystem services flow: A case study of Hangzhou Bay area. Appl. Geogr. 2024, 162, 103150. [Google Scholar] [CrossRef]
Figure 1. Flowchart of the full text. Note: LER and SNA are the abbreviation of landscape ecological risk and social network analysis, respectively.
Land 13 01586 g001
Figure 2. Framework of this study. Note: LER is the abbreviation of landscape ecological risk.
Land 13 01586 g002
Figure 3. Location of Zhangjiakou in China. Map inspection number GS (2019)1686 (a); elevation distribution of Beijing–Tianjin–Hebei (b); and land use types of Zhangjiakou in 2020 (c).
Land 13 01586 g003
Figure 4. Land use changes in Zhangjiakou during 2000–2020.
Land 13 01586 g004
Figure 5. Sankey diagram of land use transfer from 2000 to 2020.
Land 13 01586 g005
Figure 6. Land use transfer of Zhangjiakou in 2000–2010 (a); land use transfer of Zhangjiakou in 2010–2020 (b); land use transfer of Zhangjiakou in 2000–2020 (c); land use transfer of Zhangjiakou in 2000–2010 (a); changes in standard deviation ellipse and mean center of land use transfer in 2000–2010 and 2010–2020 (d); cultivated land transfer of Zhangjiakou in 2000–2020 (e); forestland transfer of Zhangjiakou in 2000–2020 (f); grassland transfer of Zhangjiakou in 2000–2020 (g); construction land transfer of Zhangjiakou in 2000–2020 (h).
Land 13 01586 g006
Figure 7. Areas of different levels of LER in Zhangjiakou during 2000–2020.
Land 13 01586 g007
Figure 8. LER transfer of Zhangjiakou in 2000–2010 (a); LER transfer of Zhangjiakou in 2010–2020 (b); LER transfer of Zhangjiakou in 2000–2020 (c).
Land 13 01586 g008
Figure 9. Changes of proportions of land use types in each LER area in 2000 (a), 2010 (b), 2020 (c); changes of proportions of various LER areas in each land use type in 2000 (d), 2010 (e), 2020 (f). CLL—Cultivated land; FL—Forestland; GL—Grassland; WA—Water area; CSL—Construction land; UL—Unused land.
Land 13 01586 g009
Figure 10. Spatial distribution of LER of Zhangjiakou from 2000 to 2020.
Land 13 01586 g010
Figure 11. Global autocorrelation scatter plot of LER of Zhangjiakou in 2000 (a), 2010 (b) and 2020 (c).
Land 13 01586 g011
Figure 12. LER network of Zhangjiakou based on different indicators from2000–2020: Displayed by the degree centrality (a), indegree (b), outdegree (c) in 2000; displayed by the degree centrality (d), indegree (e), outdegree (f) in 2010; displayed by the degree centrality (g), indegree (h), outdegree (i) in 2020. The larger the node, the higher was its correspondingly indicator. The color of a line representing a connection corresponded to the color of the county from which the relationship originated.
Land 13 01586 g012
Figure 13. The relationships of the four categories within the spatial correlation network of LER. The numbers adjacent to the arrows denoted the cumulative number of outward connections from all counties within one category to those within another category.
Land 13 01586 g013
Figure 14. Spatial distribution of various natural factors in Zhangjiakou.
Land 13 01586 g014
Table 1. Ecological meaning and calculation of each landscape index.
IndexSymbolCalculationEcological Meaning of Index
Landscape fragmentation Ci C i = n i / A i Ci reflects the degree to which a landscape is fragmented, indicating the complexity of its spatial structure and the extent of human disturbance to landscape. In the equation: ni is the number of patches of landscape type i and Ai is the total area of landscape type i.
Landscape separationNi N i = A n · n i / 2 A i Ni represents the degree of separation among individual patches within a specific landscape type. In the equation: ni denotes the number of patches of landscape type i, Ai represents the total area of landscape type I, and An indicates the total area of the region.
Landscape fractal dimensionDi D i = 2 ln ( P i / 4 ) / ln A i Di represents the complexity of the shape of patches within a specific landscape type, reflecting the extent of human impacts on the landscape. In the equation: Pi denotes the perimeter of landscape type i and Ai represents the total area of landscape type i.
Landscape disturbanceEi E i = a C i + b N i + c D i Ei reflects the degree of disturbance experienced by different landscape ecosystems. A smaller disturbance index is more favorable for biological survival. The weights for Ci, Ni, and Di are represented by the coefficients a, b, and c, respectively, with the condition that a + b + c = 1. Based on existing researches and thorough analysis, it is concluded that the fragmentation index holds primary significance, followed by separation degree and fractal dimension; the weights are determined as a = 0.5, b = 0.3, and c = 0.2.
Landscape vulnerability ViNormalizing processingVi reflects the sensitivity of different landscape types to external disturbances, with higher values indicating a weaker resistance to external interference. Drawing on previous research findings, the landscape vulnerability is assigned values as: unused land = 6, water area = 5, cultivated land = 4, grassland = 3, forestland = 2, construction land = 1. After the normalizing treatment, the Vi of each landscape type was obtained.
Landscape lossRiRi = Ei × ViRi reflects the degree of loss of different landscape types when exposed to both natural and human disturbance. This is constructed using Ei and Vi.
Disclaimer/Publisher’s Note: The statements, opinions and data contained in all publications are solely those of the individual author(s) and contributor(s) and not of MDPI and/or the editor(s). MDPI and/or the editor(s) disclaim responsibility for any injury to people or property resulting from any ideas, methods, instructions or products referred to in the content.

