Abstract
The Rurality Index is an important reference for the formulation of rural development strategies and policies, but the evaluation of the rurality of megacities based on the township scale is relatively limited. Based on the perspective of spatial governance, this study constructed the evaluation index system of Shanghai’s rurality and carried out the evaluation of Shanghai’s rurality at the township scale from 2005 to 2020. The article adopts the MGWR model to analyze the driving effects of five key driving factors (the proportion of foreign population, per capita industrial output value, public finance revenue, social fixed asset investment, and rail transit coverage), and adopts the Geo-Detector model to analyze the interactive driving effects of two factors. The results indicate that the rurality index of megacities and townships as a whole shows a weakening trend, and the above factors have a predominantly negative impact on rurality, with differences in the intensity of the impact in different periods. There is an obvious interactive additive effect between the factors. When formulating policies for township development, government departments need to take into account the functional positioning of the region and comprehensively adopt targeted policies on population, industry, transportation, finance and investment to regulate and guide the transformation or sustainable development of the countryside.
1. Introduction
The gradual decline of the countryside is a common problem facing urban development worldwide. Rapid industrialization and urbanization have led to a concentration of spatial governance problems in megacities [1] and a continuous weakening of the rural character. The disorderly use of rural space, the hollowing out and emptying of living space, the homogenization and inefficiency of production space, the defacement of ecological space, and the rapid dissolution of traditional features and customs have become key problems and important shortcomings that hinder the revitalization of the countryside and the sustainable development of mega-cities. Reasonable policy measures can promote rural land use structure adjustment, habitat improvement, and public infrastructure facilities upgrading to promote the transformation and development of the countryside, but it will also change the traditional way of life and production in the countryside to a certain extent, affecting the protection of the traditional rural landscape and ecological quality, and weakening the characteristics of the countryside. In the process of promoting rural governance, how to reasonably protect the characteristics of rurality has become an important research topic for the sustainable development of the countryside. Mega-cities are ahead of other regions in terms of socio-economic development, have experienced rapid urbanization and industrialization, and urgently need to take effective measures to stop and slow down the weakening of the rurality, and rationally guide the transformation and development of villages.
The rurality index is the basic reference basis for the formulation of rural development strategies and various rural development policies, which is used to solve the problem of rural sustainability [2,3]. Depending on the objective of the evaluation, the rurality index has been applied to diverse areas such as rural health [4,5,6,7], rural planning and resource allocation [8,9,10,11], equity and poverty reduction issues [12,13,14], migration [15], education [6], and agricultural policy [16]. In China, the rurality index is mostly applied to the evolution and optimization of the spatial pattern of rurality [17,18,19], the transformation of rural territorial functions [20,21], urban-rural spatial identification [22,23], the division of rural development types [24,25], the development of rural tourism [26], and so on. However, in China, the application of rurality in rural development policy is still relatively small and needs to be further explored and researched.
In China, the township government is the smallest unit of government that formulates rural development policies. The evaluation of township-scale rurality and the analysis of rurality driving mechanisms can provide the basis for the scientific division of rural development types, regional planning, and the formulation of differentiated rural development strategies [27,28], which is conducive to the support and service of rural transformation and rural revitalization, and is of great practical significance.
This study takes the township of Shanghai as the object of evaluation, constructs a rurality evaluation index system based on the perspective of spatial governance, and carries out an evaluation of the rurality of the townships of Shanghai from 2005 to 2020, in order to better grasp the overall situation and trend of change of the rurality. By analyzing the driving factors of rurality in the townships of Shanghai, the study will find out the key factors that cause changes in rurality, so as to provide the basis for the township government to formulate rural development policies in a targeted manner. The main contents of this paper are as follows: Section 2 provides a literature review of the rurality evaluation and introduces the study area. Section 3 introduces the index system of rurality evaluation, data sources and research methods. Section 4 presents the results of the rurality evaluation and the analysis of the drivers of rurality. The Section 5 contains conclusions and discussion.
2. Background and Research Areas
2.1. Literature Review
Cloke first constructed the rurality index [29] and carried out rurality evaluation for measuring the degree of rural development, which was later applied and promoted by other scholars. Xiaolin Zhang introduced the concept of rurality into China and proposed a model for calculating the rurality index based on the viewpoint of urban-rural continuum [30], which used linear weighted summation to calculate the rurality index, laying the foundation for the quantitative evaluation of rurality in China. Most of the rurality evaluations are measured by linear weighted summation [31] or average value [4], and the calculation process involves the standardization of indicators and the determination of indicator weights. At present, the indicator standardization method mainly adopts the extreme value method, and individual studies have adopted the deviation standardization method. The indicator weight determination method mainly adopts entropy weight method [32,33,34], Telfer method [19,35], principal component analysis method [8,27,36,37], hierarchical analysis method [38], coefficient of variation method [39], mean squared deviation empowerment method [40], neural network method [11,41], and so on. Some scholars [32,42,43,44] combine subjective judgement with objective analysis, exploring the use of two or more methods to comprehensively measure indicator weights. The evaluation of rurality is more based on the administrative scale of cities and counties [9,12,37,45], and some studies have been conducted on the scales of census tracts [5], postal code districts [46], and neighborhoods [6,14]. Due to the diversification and complexity trend of the areas involved in the evaluation of rurality, a unified system of rurality indicators has not yet been formed. Early on, the evaluation of rurality was mainly measured quantitatively through population density, employment patterns, and distance from towns and cities [29,37,47,48,49], and with the expansion of areas covered by the study, indicators such as public infrastructure [5,50], healthcare [6,9,36], and education [12,36,51] began to be included in the evaluation index system. In general, indicators such as population size and density, location, accessibility, proportion of agricultural production, land use structure, degree of land development, settlement size, and non-farm employment are commonly used indicators for the quantitative evaluation of rurality [3]. With the deepening of the concept of ecological sustainable development, individual scholars have begun to incorporate ecological indicators such as ecosystem service value [52], bioconcentration index [53], and normalized vegetation index [27], which have enriched the indicators for the evaluation of rurality. At present, the rapid development of urbanization and industrialization has brought great pressure on the ecological environment, and rural areas, as the strategic backyard of urban development, are more responsible for the functions of food security, vegetable security and ecological security; these indicators are still relatively few in the evaluation of rurality.
Some scholars study that the change of rurality is the result of the comprehensive drive of natural, economic, social, ecological, technological, policy and other multi-dimensional factors. For example, increasing public financial investment and social fixed asset investment will change the regional infrastructure condition, science and technology level, which is conducive to labor pooling, secondary and tertiary industry development, and urban construction level, thus reducing the level of regional rurality [27]. Industrial development will increase the demand for construction land, increase the regional economic income, which has a significant negative correlation on the rurality [54,55,56]. The outflow of rural population will trigger problems of farmland de-agrarianization and farmers abandoning their farms, leading to a decline in the overall level of rurality [56]. Improvement of the transportation infrastructure in rural areas contributes to the transformation and sustainable development of rural areas [57]. At present, the study of the drivers of rurality is mainly based on qualitative analysis, and quantitative analysis is still relatively scarce. In addition, there is a lack of relevant analysis of the interactions between the drivers.
2.2. The Study Area
Located at the eastern edge of the Yangtze River Delta, Shanghai is one of the four municipalities directly under the central government in China, and belongs to the core city of the world-class city cluster of the Yangtze River Delta and China’s mega-city. Shanghai contains seven central urban areas, nine suburban districts and some island beaches. The degree of land development in the seven central urban areas and the suburban districts of Pudong New Area, Minhang District, Baoshan District, and Jiading District is relatively high, followed by the remote suburban districts of Songjiang District and Jinshan District. The degree of development of land in Qingpu District, Fengxian District and Chongming District is relatively low; and there is a large amount of agricultural land in Chongming District, Fengxian District, Jinshan District and Pudong New Area. As a backup strategic space for urban development, the function of Shanghai’s rural areas has changed from a simple function of guaranteeing agricultural products to a diversified composite function, with the following general spatial functions: important ecological guarantee function for mega-cities [58], guarantee function for important agricultural products (food and vegetables), and guarantee function for the life and residence of countryside residents. It also undertakes the functions of leisure and recreation for urban residents, inheritance of rural aesthetic and cultural values, and development of new urban industries. However, with rapid urbanization, the rural space of Shanghai has been gradually compressed (In 2020, the forest coverage rate of Shanghai is 18.49%, much lower than that of London, Paris, and Chicago. Status quo cultivated land is heavily fragmented, with 38% of the cultivated land map area under 15 acres), the production function of the countryside has been weakened (In 2020, Shanghai’s arable land area and total grain production will have declined by 54% and 51% compared to 1980), the income gap between urban and rural residents has been widening (Income ratio of urban and rural residents in Shanghai expanded from 1.59 in 1980 to 2.19 in 2020), the landscape and style of the Jiangnan Water Town has been gradually dissolved [58], and there is still a big gap between the positioning and goals of the rural development of the mega-city. Thus, there is an urgent need to follow the law of the development of the countryside, optimize rural spatial governance, and take the lead in exploring the formation of a path of revitalization and sustainable development for the countryside of the mega city.
3. Materials and Methods
3.1. Indicators and Data
Existing studies have shown that the evaluation of rurality needs to combine the evaluation goal orientation and the functional characteristics of the countryside of the evaluation object to construct a suitable indicator system, reflecting application-oriented evaluation results [5,43]. For this reason, combining the functional positioning of the Shanghai mega-city and considering the accessibility and updatability of the indicator data [13], this paper constructs the indicator system of Shanghai’s rurality evaluation based on the spatial governance perspective from the four dimensions of land use, rural production, rural life, and rural ecology (Table 1). Shanghai has a relatively flat topography, small area, and little difference in the related natural environment, but it has a large flow of foreign population, developed industry, rapid development of rail transport, and strong local financial strength, so this study focuses on the proportion of foreign population, per capita gross industrial output value, public financial income, social fixed asset investment, and rail transport coverage as the main driving factors for analysis (Table 2). Among the evaluation indicators, the land use data are obtained from the raster data with 30-m resolution from the China Multi-period Land Use/Land Cover Remote Sensing Monitoring Database of the Institute of Geographic Sciences and Resources of the Chinese Academy of Sciences (IGSR) for the four periods of 2005, 2010, 2015, and 2020, which are vectorized and collated by ArcMap 10.5. The socio-economic data come from the Shanghai Statistical Yearbook, Shanghai Suburban Statistical Yearbook, Shanghai Rural Statistical Yearbook, and the 9 suburban statistical yearbooks of Pudong New Area, Minhang District, Baoshan District, Jiading District, Songjiang District, Qingpu District, Jinshan District, Fengxian District, Chongming District, etc. The missing data of individual towns and villages are converted by the method of the average of the previous and subsequent years. The vector data of Shanghai rail transit stations are combined with the sky map of Shanghai geographic information public service platform, and made on the vector map; the opening time of the rail transit stations was formed after Baidu querying the opening time of the stations.

Table 1.
Indicators for the evaluation of rurality.

Table 2.
Key driving factors of the rurality.
3.2. Research Methodology
The rurality index evaluation model [29,30] is used to calculate the rurality index by the linear weighted sum method. In the calculation process, the polar value method is used to standardize the index [63], and the entropy weight method is used to determine the index weights.
The exploratory spatial data analysis method was used to analyse the characteristics of the spatial pattern of rurality. Moran’s I index and global G-statistics were used to explore the degree of aggregation or heterogeneity in the overall space, and the local Getis-Ord Gi* index was used to reveal the characteristics of high and high agglomeration and low and low agglomeration in the local area [17,27,32].
Comparing the results of the least squares regression, geographically weighted regression, and multi-scale geographically weighted regression [64] models, the optimal analysis model was selected. Geo-Detector [65,66] was used to analyse the interaction between two of the drivers.
4. Results
4.1. Evaluation Results and Spatio-Temporal Pattern Characteristics
4.1.1. Spatio-Temporal Differentiation Characteristics
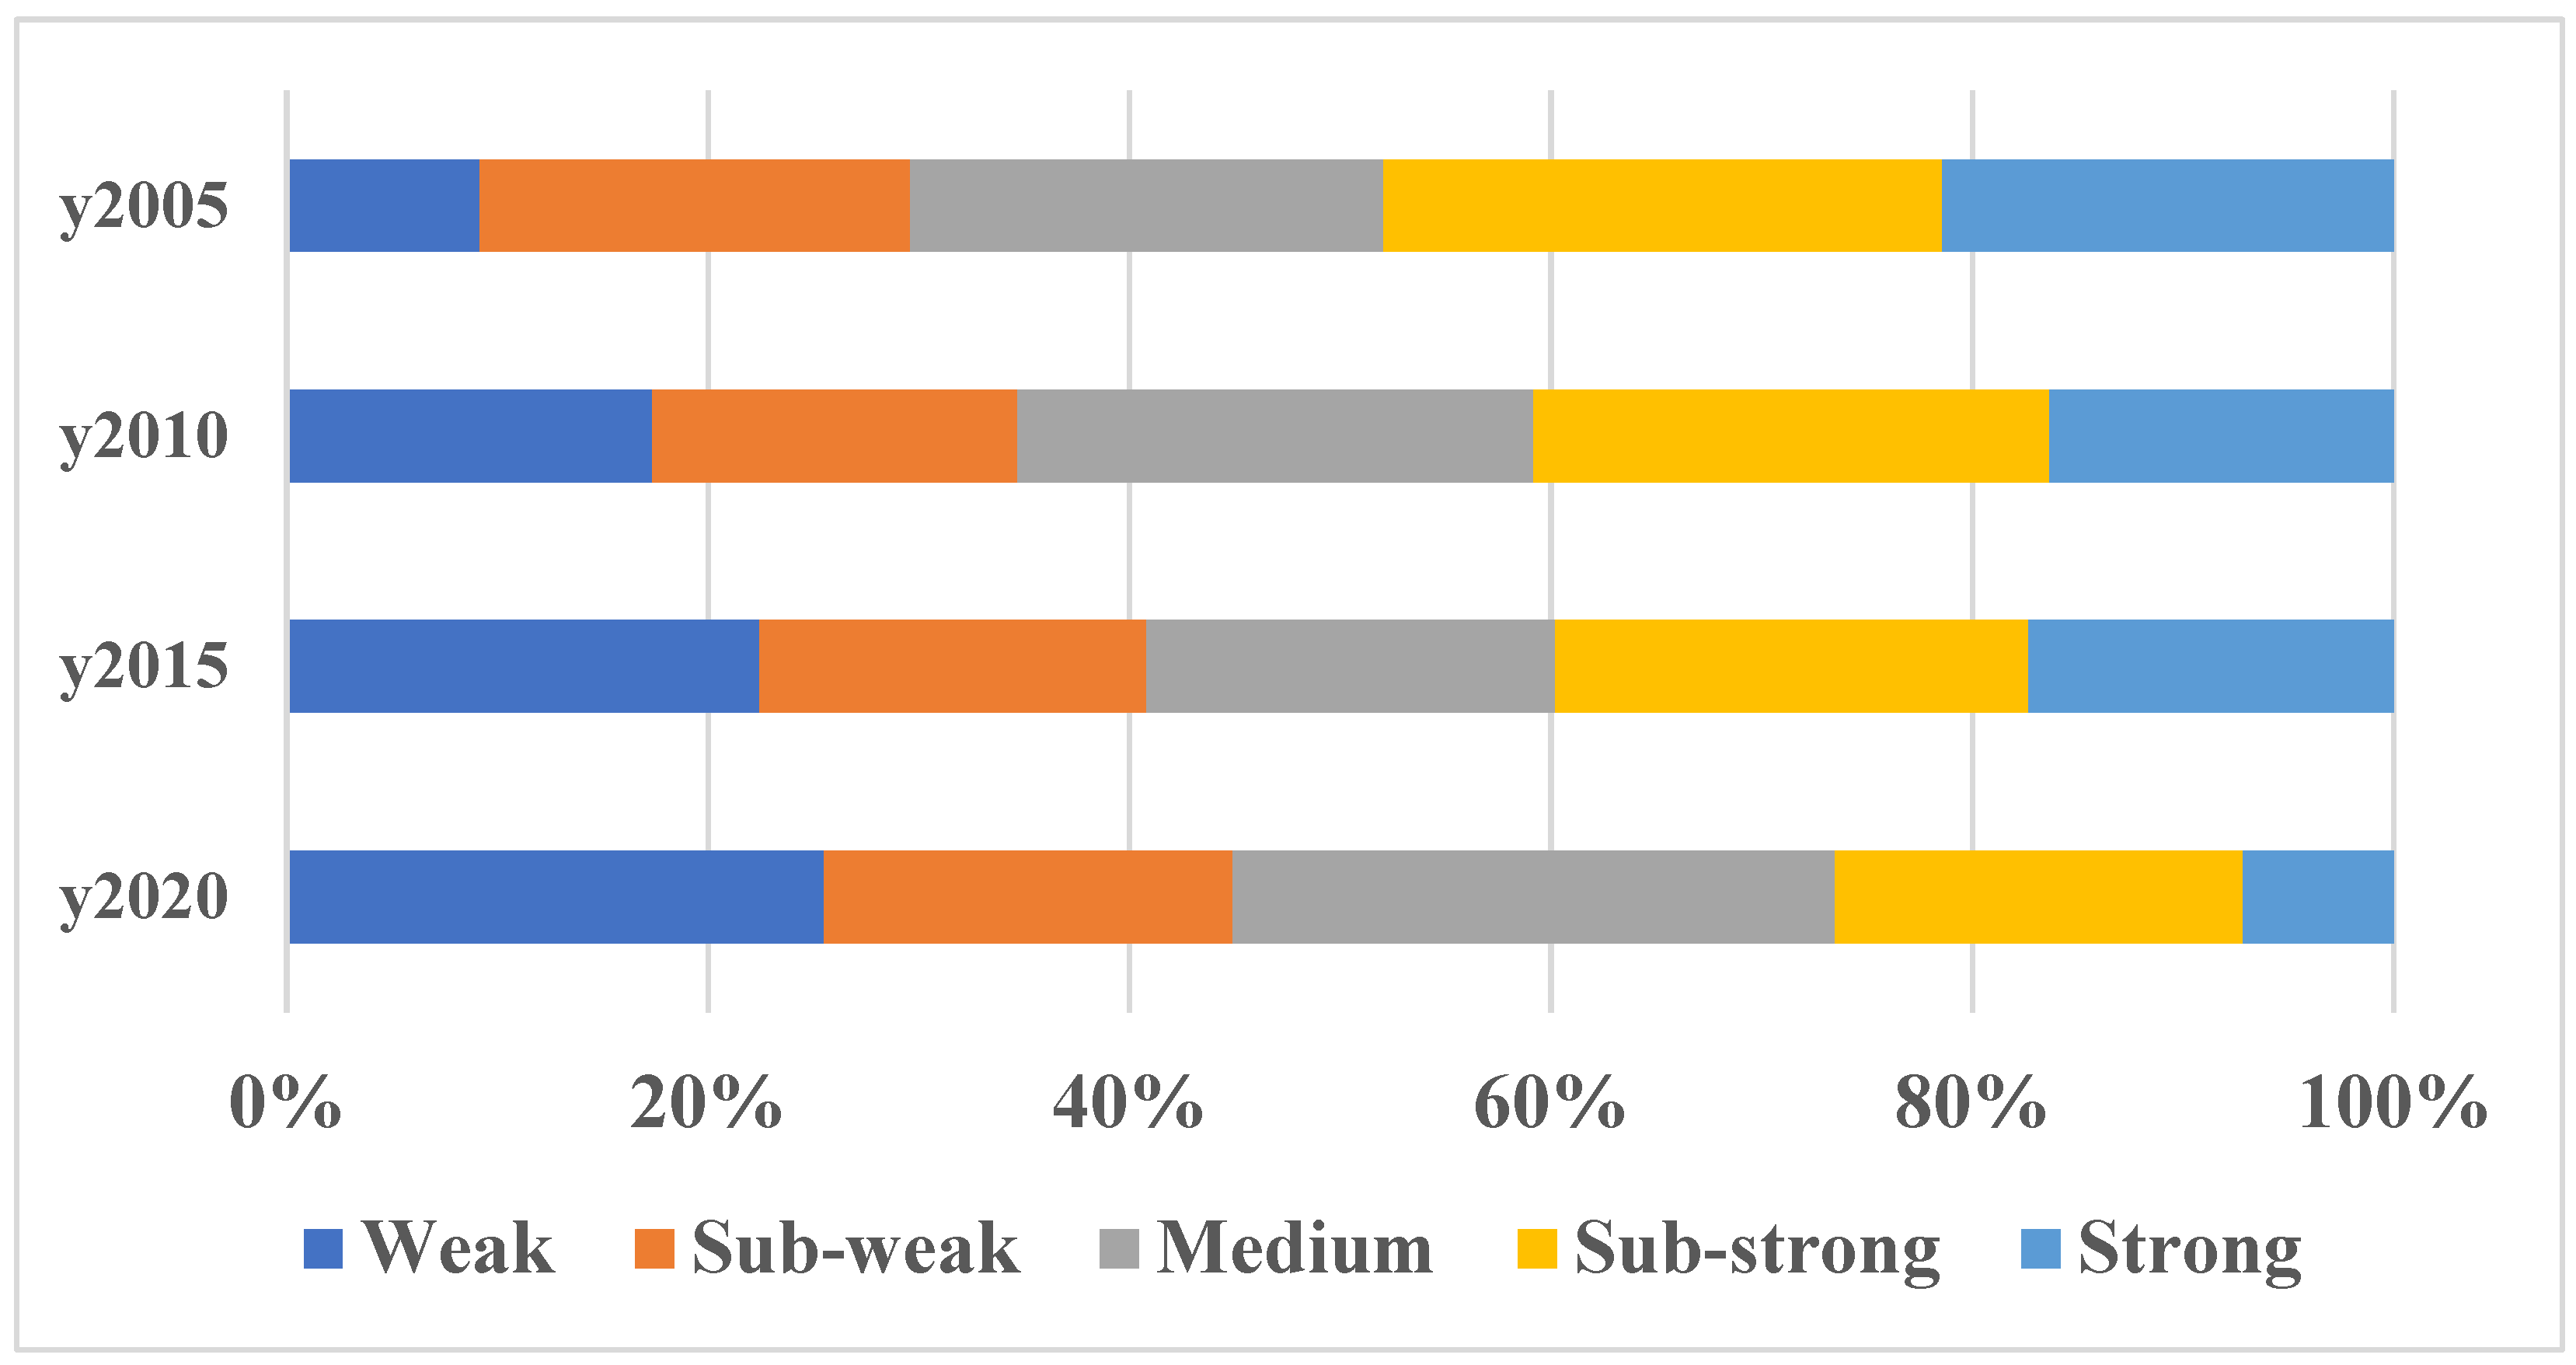
ArcMap10.5 software was used to visualize and analyze the rurality of 98 townships in Shanghai from 2005 to 2020, and the best natural break method was adopted to divide the rurality in this way into Weak (RI ≤ 0.062), Sub-weak (0.062 < RI ≤ 0.137), Medium (0.137 < RI ≤ 0.214), Sub-strong 0.214 < RI ≤ 0.299), and Strong (RI > 0.299) in five grades. From a quantitative point of view, the level of rurality of townships in Shanghai as a whole shows a decreasing trend, with a significant increase in the number of townships with weak rurality and a significant decrease in the number of townships with strong rurality (Figure 1); from the point of view of spatial changes, townships with low levels of rurality in Shanghai are mainly distributed around the central urban area of the city of Shanghai and are expanding outwards over time; townships with high levels of rurality are mainly distributed in the Chongming District and the southern region of Shanghai, and are weakening with the changes over time. Rurality is weakening as a whole. A few areas, such as Jinze, Zhujiajiao, and Liantang townships in the southwest of Qingpu District, as well as Chenjia, Zhongxing, Xianghua, and Gangyan townships in Chongming District, have always been relatively stable and have a strong level of rurality.
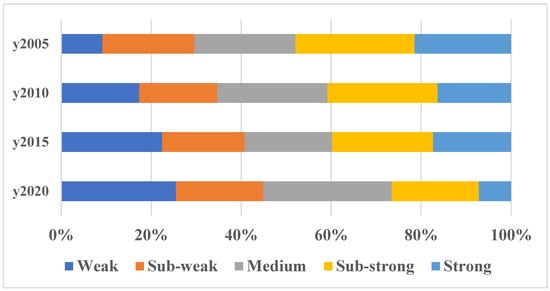
Figure 1.
Distribution structure of the rurality of townships in Shanghai from 2005 to 2020.
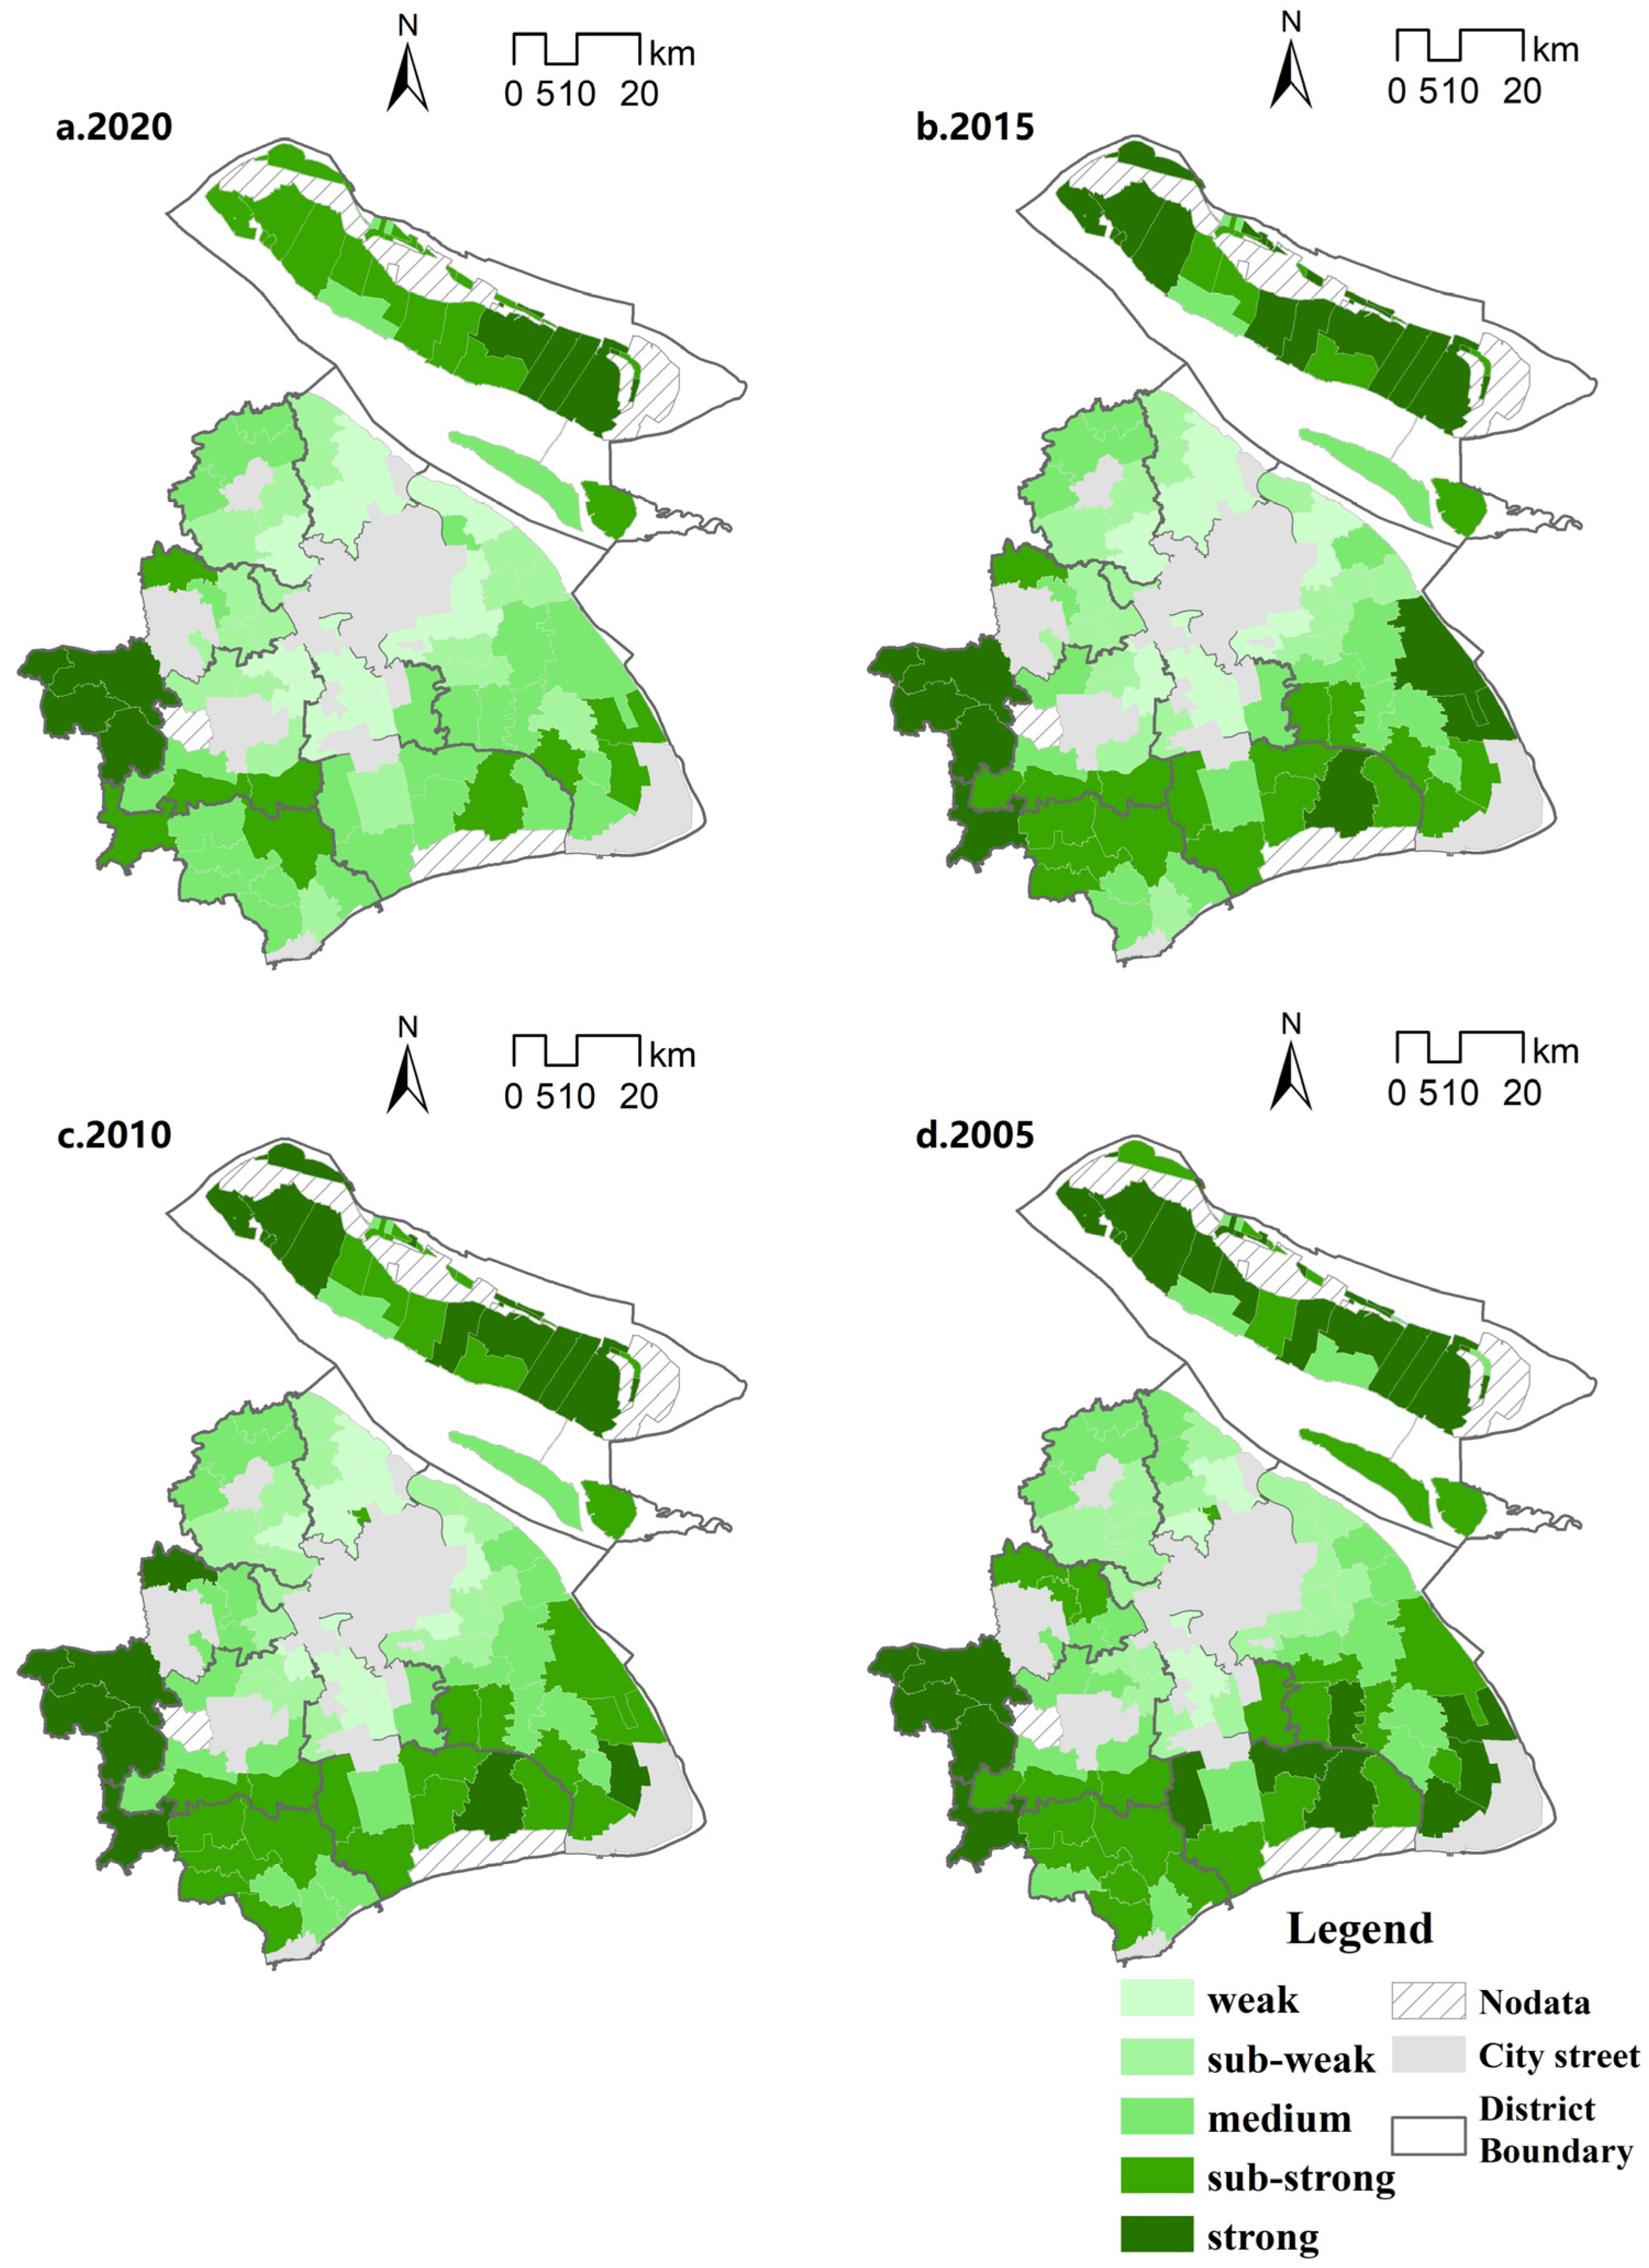
From the viewpoint of each period, there are differences in the spatial distribution of the level of rurality at different stages. In 2005, from the viewpoint of the overall spatial layout of Shanghai, the rurality of the townships showed an overall trend of gradually increasing with the center of the city as the origin, and in addition to the center of the city and the suburban urban areas, the rurality of the suburban districts, such as Minhang, Pudong, Baoshan, Jiading, and other areas adjacent to the center of the city, were in a weak or weaker state; the rurality of the townships of the southwestern Shanghai and Chongming districts was weak or relatively weak (Figure 2). In 2010, the rural nature of Shanghai was weakened in general, and from a spatial point of view, the rural nature of suburban districts such as Minhang, Baoshan, Jiading, and the northern part of Pudong, which are close to the center of the city, had a greater change and the rural nature was weakened. This is closely related to the development of urbanization and industrialization in Shanghai; in the far suburbs, except for the weakening of the rural nature of some towns, most of the rural nature has not changed much, and the far suburban towns are still in the state of relatively inefficient development. Compared with 2010, the overall pattern of the rural nature has not changed much, and the rural nature of a small number of towns close to the central urban area and the suburban urban areas has become weaker, which is mainly due to the expansion of the land used in urbanization and construction. In 2020, compared with 2015, rurality will be further weakened, with only the Jinze, Zhujiajiao, and Liantang townships in the three southwestern townships of Qingpu District, and Chenjia, Zhongxing, Xianghua, and Gangyan townships in Chongming District remaining as areas with strong rurality; they are relatively stable.
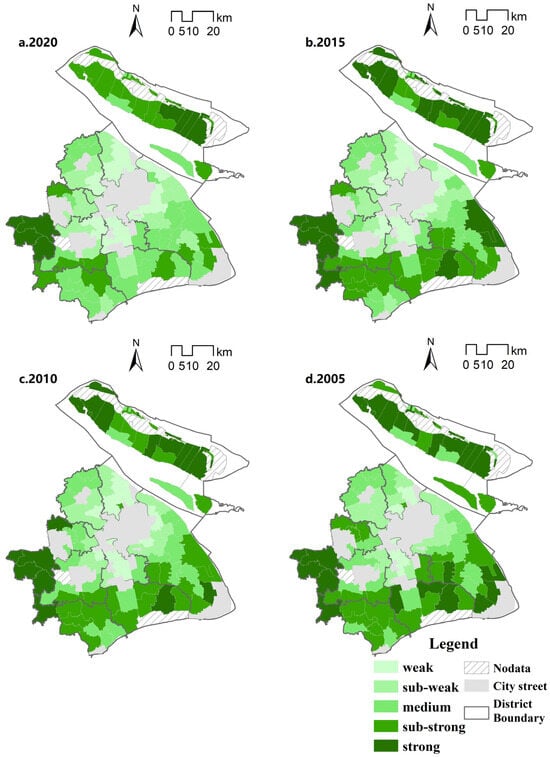
Figure 2.
Distribution of rurality index.
4.1.2. Overall Spatial Correlation
As can be seen from the table, from 2005 to 2020, the Moran’s I index values of the rurality of Shanghai townships are all positive, and the Z(I) values are all greater than 2.58 at 99% confidence level, indicating that the rurality of Shanghai townships in general tends to be spatially clustered (Table 3). The Moran’s I index under the four periods nodes increase sequentially, reflecting that the overall degree of spatial agglomeration gradually strengthens. In the global G statistics, the Z(G) value is negative in all years, but the Z(G) value gradually decreases from 2005 to 2020, and the confidence level is also decreasing, indicating that the significance of the characteristics of the low-low agglomeration of the rurality of the townships in Shanghai is weakening, and the state of low-low agglomeration is also weakening.

Table 3.
Moran’s index of rurality in Shanghai townships, 2005–2020.
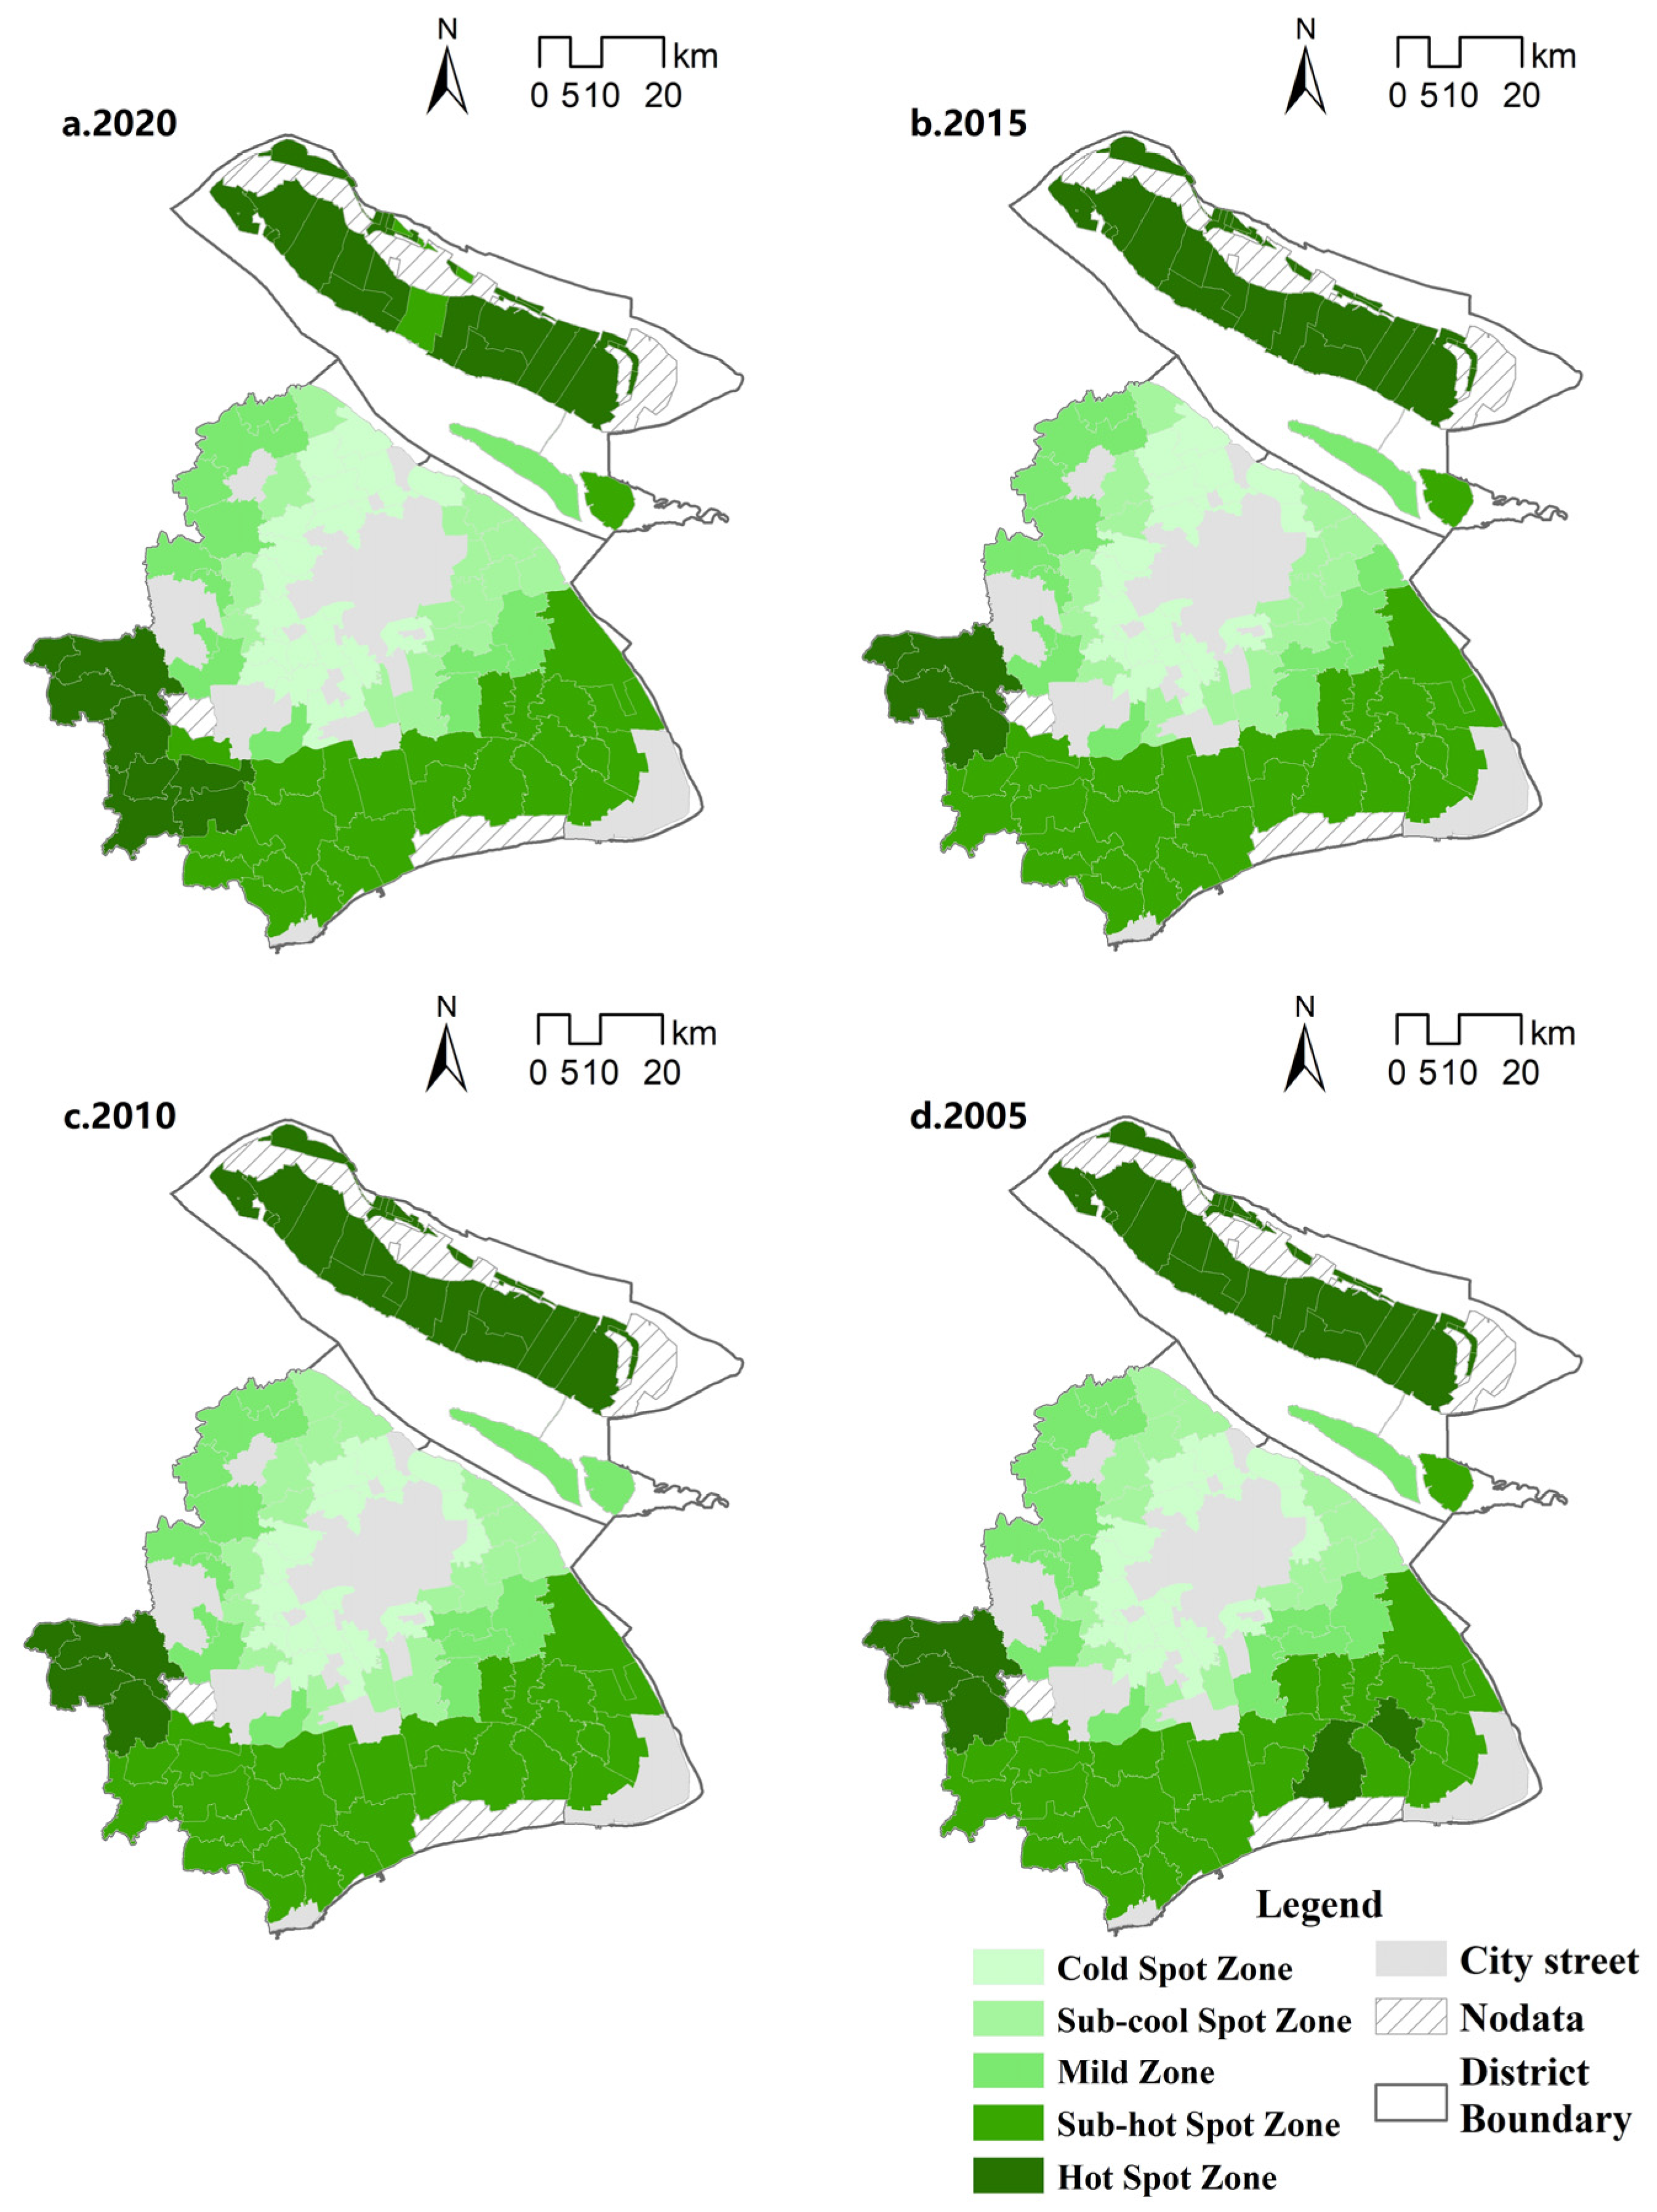
With the help of ArcMap10.5, the local Getis-Ord Gi* index analysis was carried out, and the area was classified into five types; namely, cold spot area, sub-cold spot area, mild area, sub-hot spot area and hot spot area in order, according to the Jenks optimal natural fracture method. Generally speaking, the rural nature of townships in Shanghai is characterised by the spatial pattern of ‘1 cold and 2 hots’, with ‘1 cold’ being the townships around the central urban area, and the rural nature presenting the characteristics of low-low agglomeration, and ‘2 hots’ being the townships of Chongming District and three townships in the western part of Qingpu District (Zhujiajiao Town, Jinze Town and Liantang Town), with high and high agglomeration characteristics of rurality (Figure 3). Shanghai townships have high and high agglomeration in mainly far suburban areas, showing a trend of shrinking and then expanding. Among them, the three townships (Zhujiajiao Township, Jinze Township and Liantang Township) in the western part of Chongming and Qingpu Districts have relatively obvious characteristics of high and high agglomeration, which are relatively stable. Hotspot areas decreased in the period of 2005–2015 as a whole, and the hotspots that have changed considerably are Daituan Township of Pudong New Area and Fengxian Fengcheng Township of Fengxian District, which have changed from hotspots to sub-hotspots. This is closely related to the accelerated development of urbanization of these two areas. In 2015–2020, the number of hotspots will increase, with Jinshan District’s Zhujing Town and Fengjing Town and Songjiang District’s Xinbang Town and Mao Town changing from sub-hotspots to hotspots. Rural low agglomerations are mainly located in the townships around the central city, expanding outwards from the central city as the origin. Overall, from 2005 to 2020, Baoshan Yuepu and Luodian Townships, Jiading Nanxiang Township, Minhang Maqiao Township, and other townships around the central city changed from sub-hotspots to hotspots. This is mainly due to the expansion of the urban area and the development of urbanization, and the hotspot areas are slowly expanding to the north. Chongming District, which is separated from the urban area by the Yangtze River, has weaker links with the central urban area than other regions, and has been positioned as an international eco-island, with agriculture and eco-construction as the main functions, and has a higher level of rurality. The three western towns of Qingpu District, which are farther away from the central urban area, belong to an area densely covered by rivers and lakes, with freshwater lake Dianshan, the largest freshwater lake in Shanghai. The industrial structure is based on agriculture, with a better ecological base.
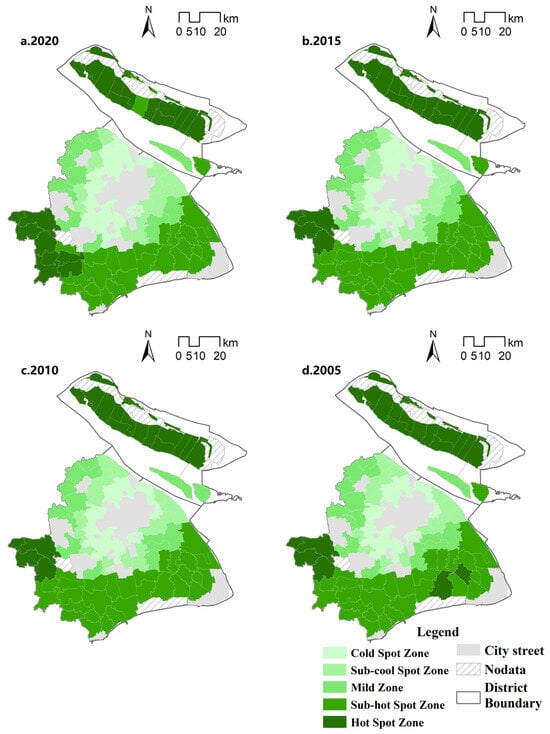
Figure 3.
Distribution of cold and hot spots of rurality index.
4.2. Analysis of Driving Factors
4.2.1. Diagnosis of Indicator Covariance
Using stata17.0 software, multiple covariance detection is carried out for five key factors, and the detection results show that the VIF value of each influence factor is less than 10, and there is no obvious covariance between key factors (Table 4).

Table 4.
Covariance detection results for the key driving factors of the rurality.
4.2.2. Comparison of OLS, GWR and MGWR Models
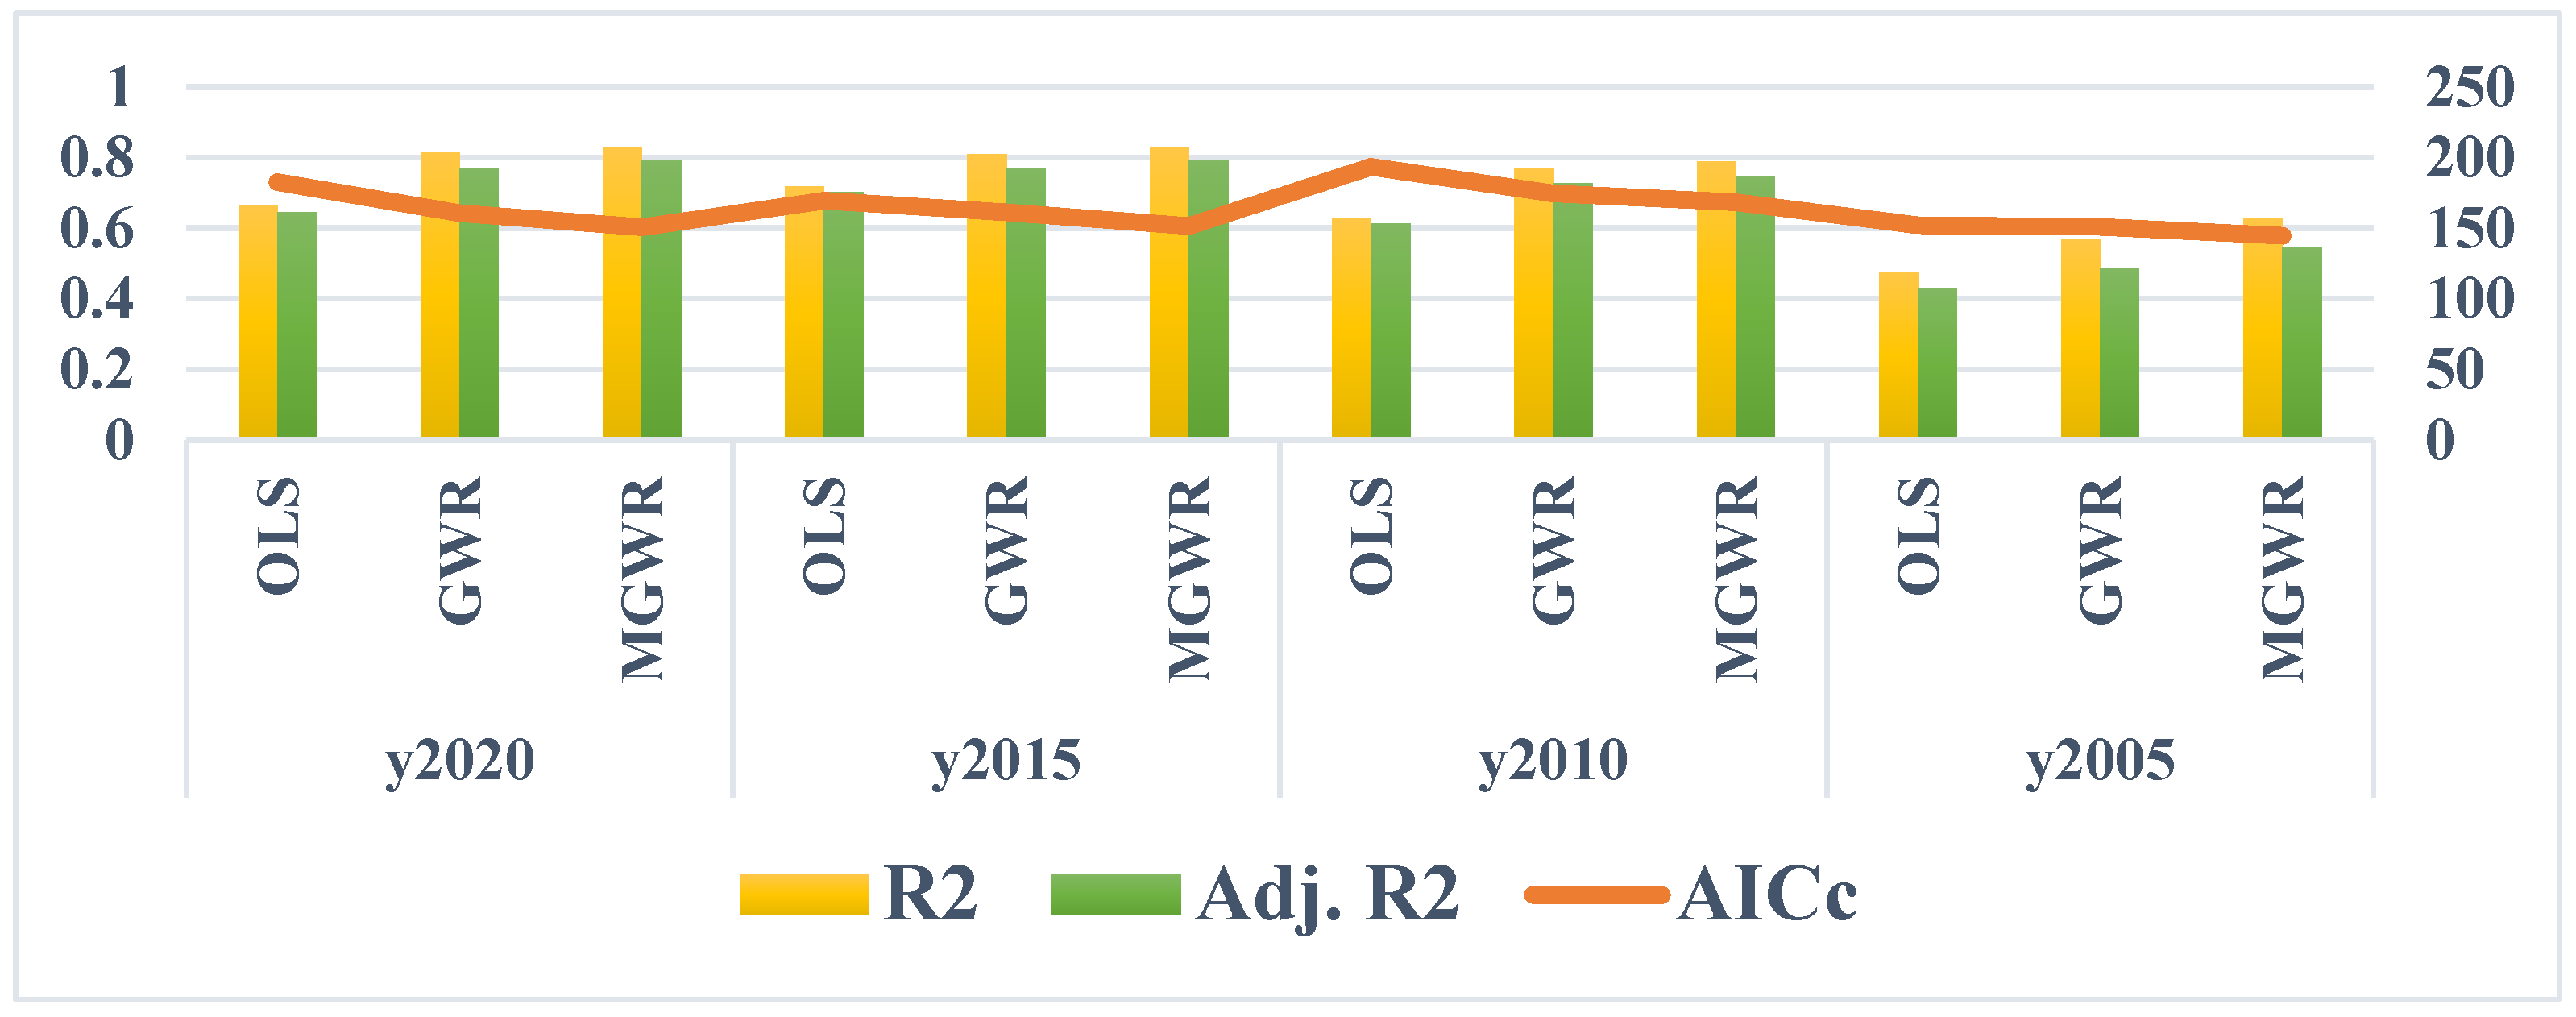
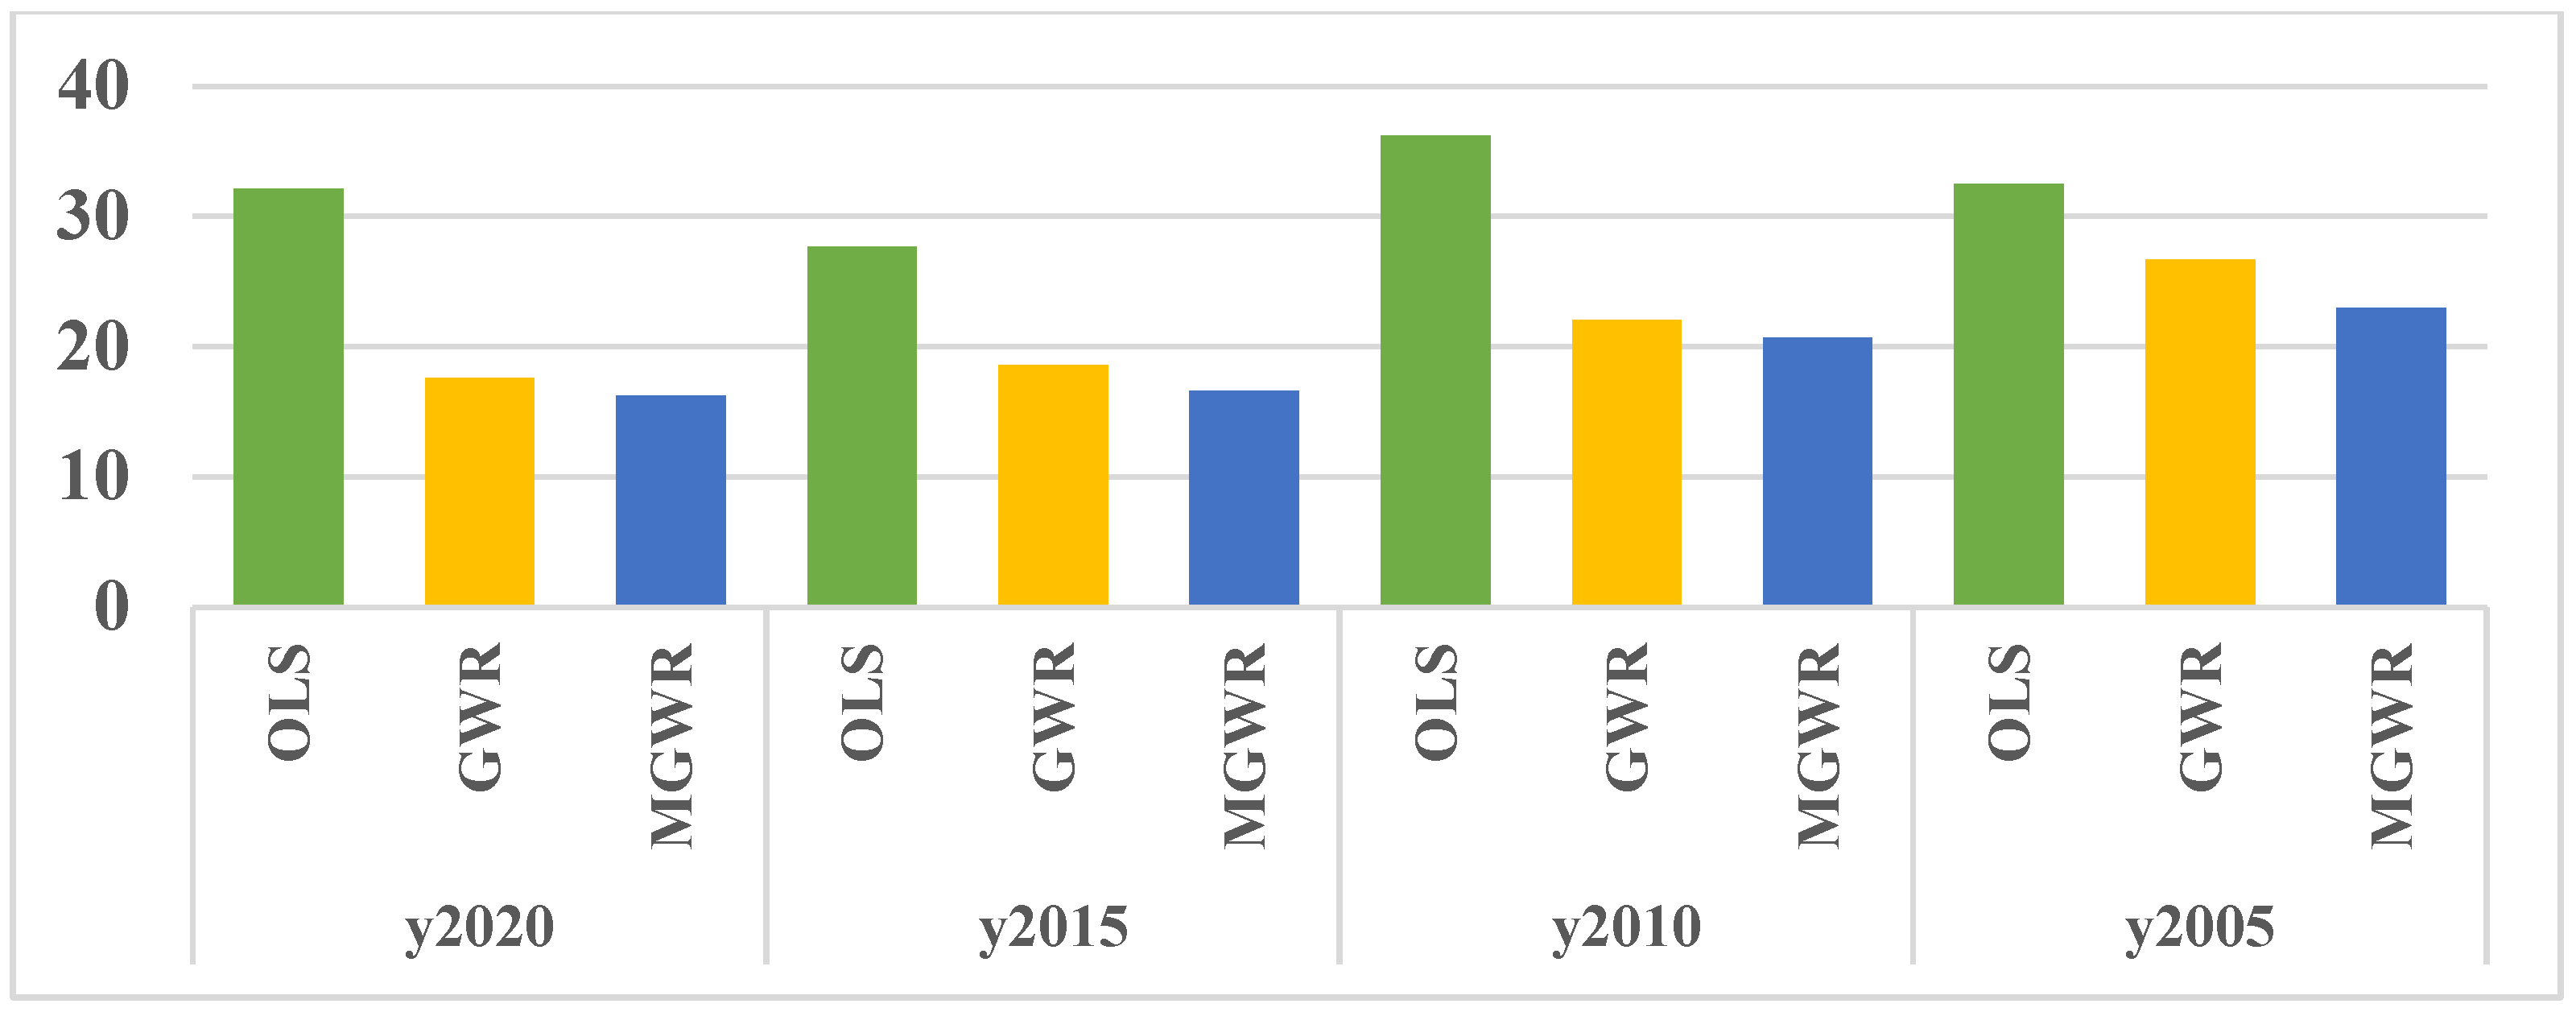
OLS, GWR and MGWR models are adopted to fit the drivers of rurality of Shanghai townships in the four periods of 2005-2010-2015-2020. The results show that the values of multiple decidable coefficients R2 and Adj. R2 of the MGWR model in the four periods are higher than those of the GWR model and the OLS model, and the values of AICc and RSS of the MGWR model in the four periods are lower than those of the GWR model and the OLS model, which indicates that the MGWR model performs best in the analyses of the drivers of rurality in the townships and villages of Shanghai (Table 5, Figure 4 and Figure 5).

Table 5.
Comparison of the effects of OLS, GWR and MGWR.
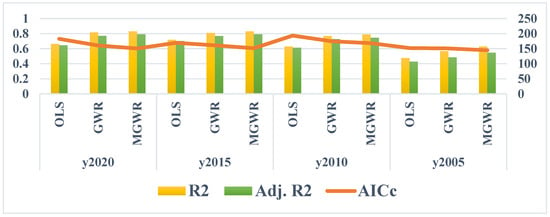
Figure 4.
Comparison of the fitting effect of OLS, GWR, and MGWR.
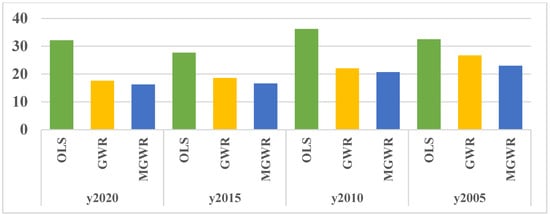
Figure 5.
Comparison of residual values of OLS, GWR, and MGWR.
4.2.3. Based on the Results of MGWR Single-Factor Analysis
Related studies have also shown that the MGWR model adopts different spatial scales (bandwidths) and kernel functions for different independent variables, which can better reflect the heterogeneity of spatial distribution of independent variable differentiation compared with the GWR model [1,67,68]. Based on the comparative analysis of the above models and existing studies, this paper selects the MGWR model to carry out the analysis of the drivers of rurality in different periods. The analysis of the driving factors of rurality in different periods shows that there are differences in the main driving factors of rurality in different periods (Table 6): in 2020, the main driving factors affecting rurality were the proportion of foreign population and the railway coverage rate, which are negative, with influence coefficients of −0.349 and −0.33, respectively. In 2015, the main drivers affecting rurality were the railway coverage rate, the proportion of foreign population, and the per capita industrial output value, with an influence coefficient of −0.349 and −0.33, respectively. Ratio and per capita industrial output value are all negative, with impact coefficients of −0.373, −0.277, and −0.195, respectively. In 2010, the main drivers of rurality were rail coverage, public revenue, foreign population ratio, and per capita industrial output value, all negative, with impact coefficients of −0.295, −0.199, −0.182, and −0.18, respectively; in 2005, the main driver of rurality was the rail coverage, public finance, and the per capita industrial output value. In 2005, the main driver of rurality was the per capita gross industrial output value, which was negative, with an impact coefficient of −0.499.

Table 6.
Statistics of regression coefficients of the MGWR model in different periods.
The results of the driver analysis show that the negative effect of the proportion of foreign population on the effect of rurality is gradually increasing, the negative effect of rail coverage on the effect of rurality is generally increasing, and the negative effect of per capita industrial output value on the effect of rurality is gradually weakening, which is related to the enhancement of the policy of attracting the resident population to promote the construction of new towns and cities, the vigorous promotion of the construction of urban rail transport, the gradual shift of township industries to industrial parks in the late stage of industrialization, the gradual promotion of the construction of new towns and urban rail transport in the city of Shanghai, and the gradual promotion of the reduction of inefficient industrial land in townships.
4.2.4. Results of Two-Factor Interaction Analysis Based on Geo-Detector
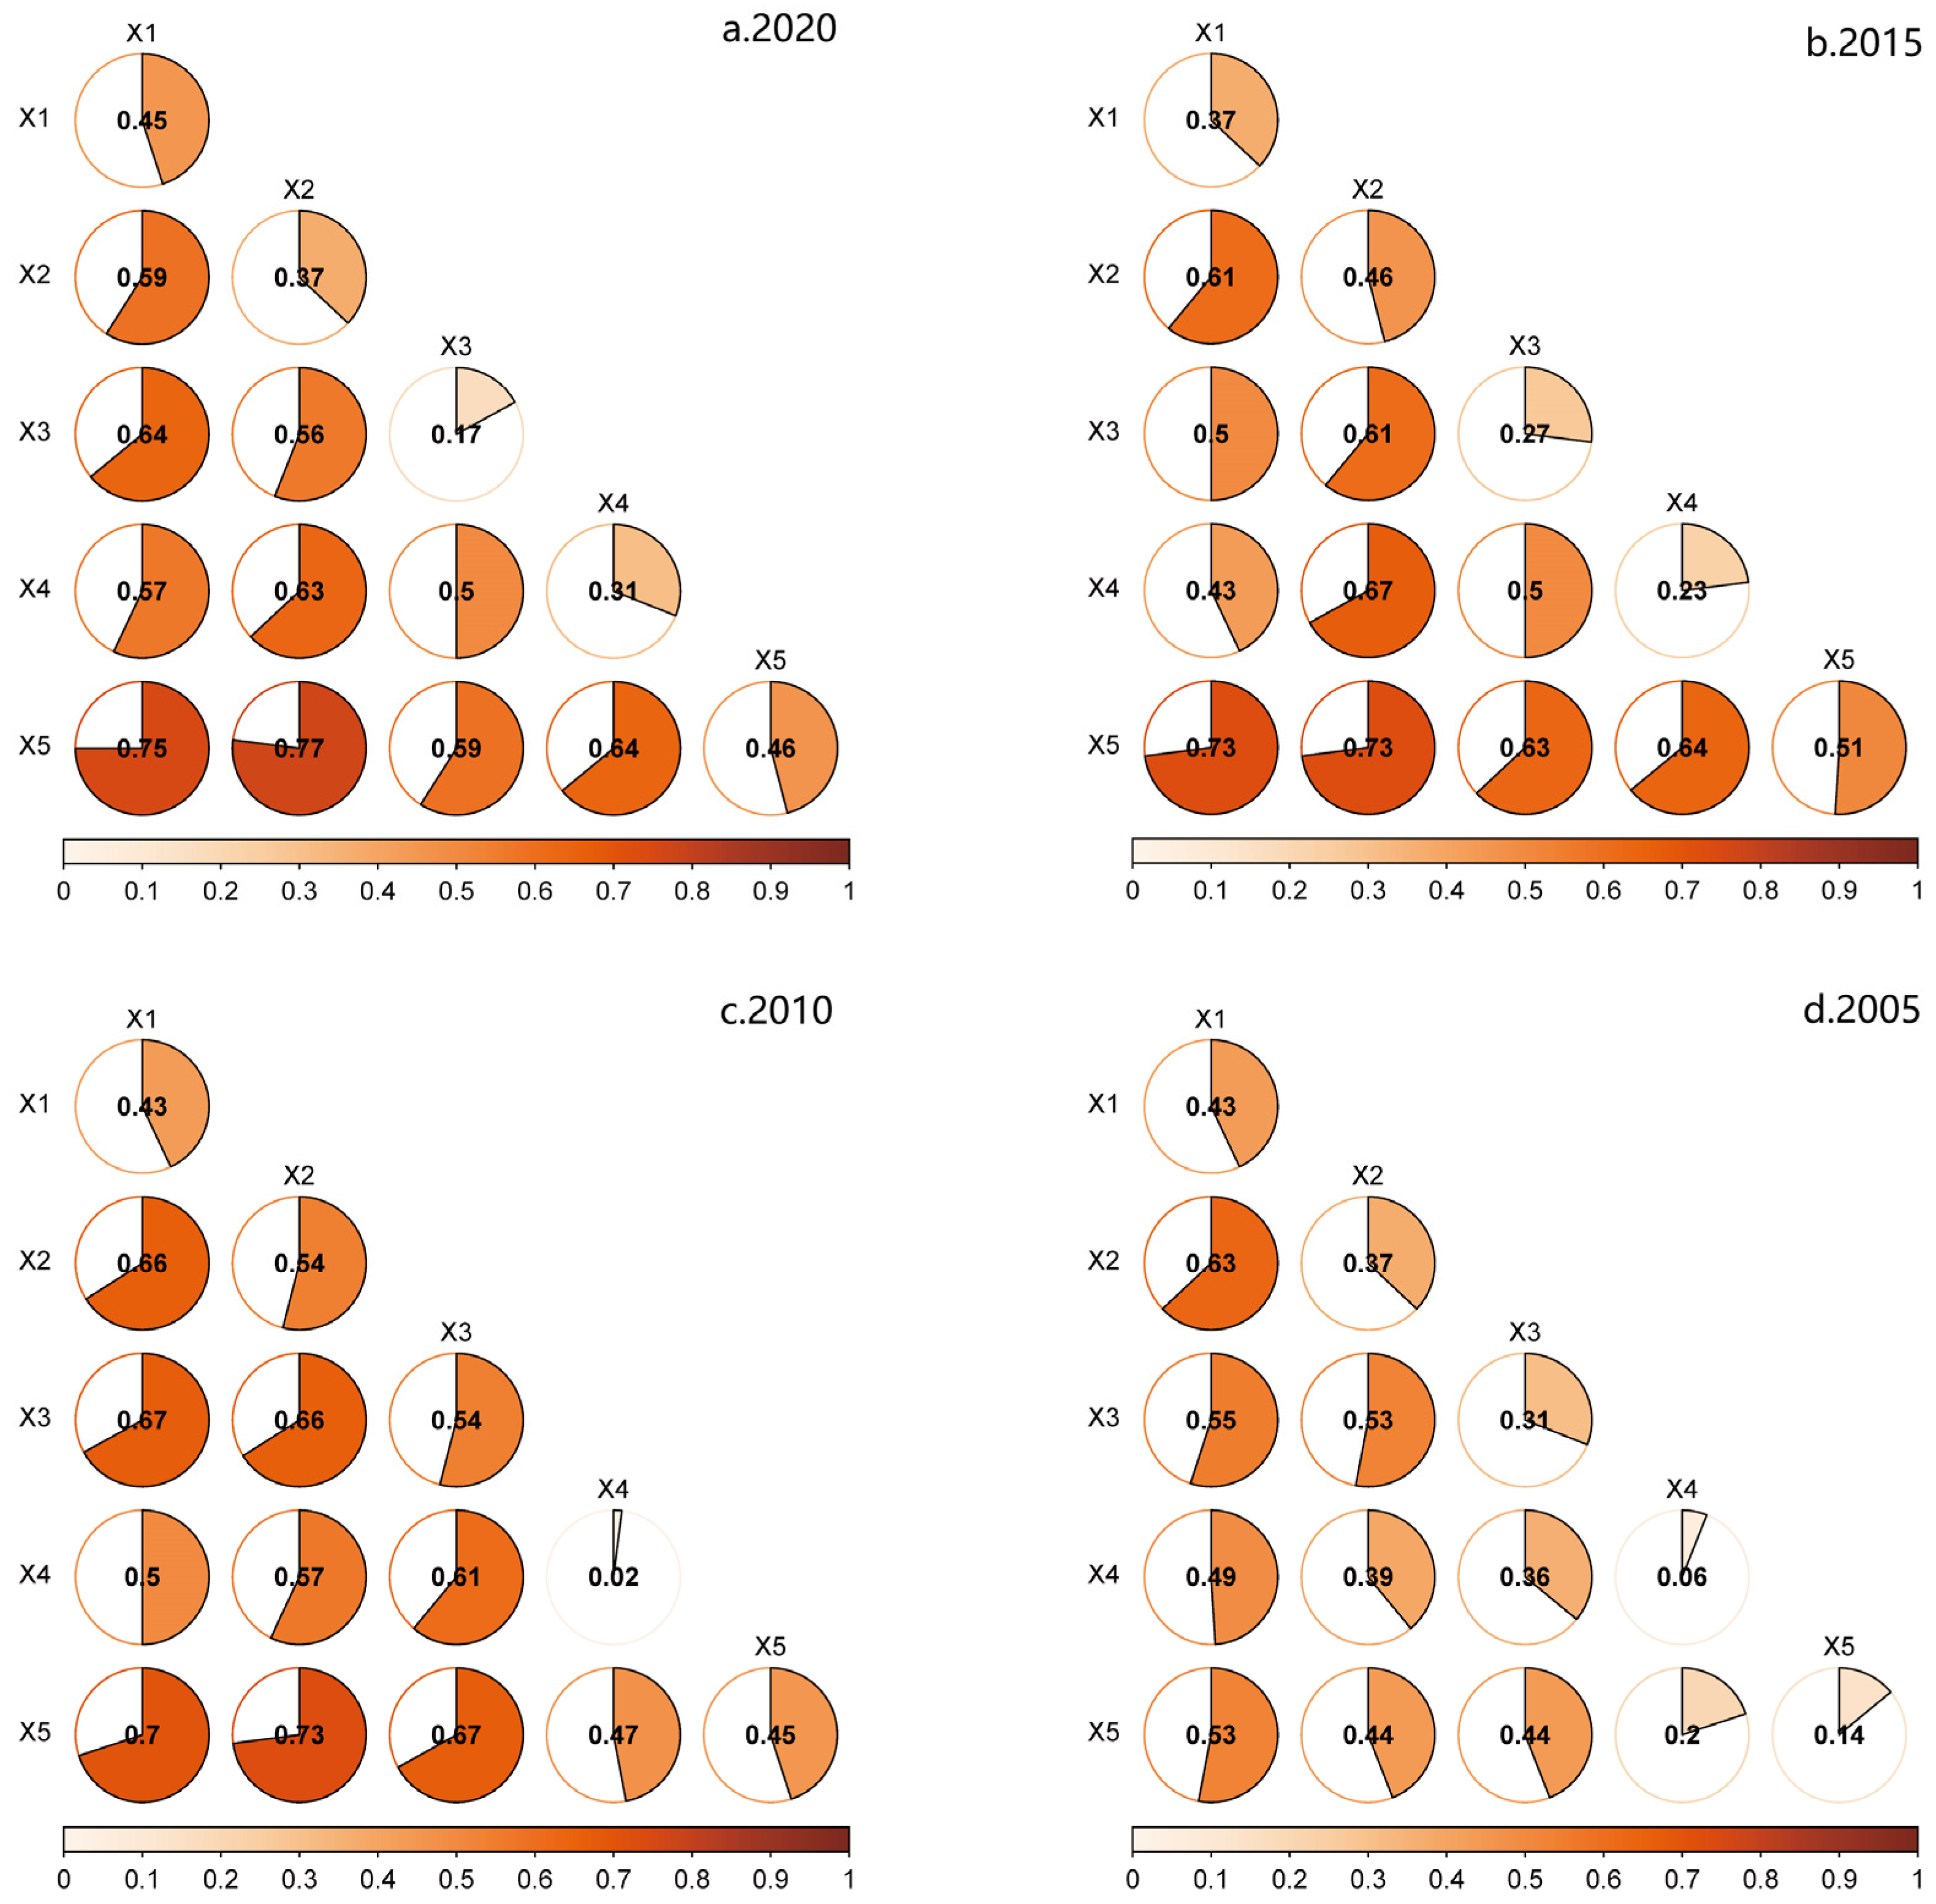
Using ArcMap10.5 software with Jenks natural breaks, the above five independent variables for each of the four time periods 2005-2010-2015-2020 were divided into five types, and then the Geo-Detector software was used to detect the interaction effects of the above five drivers on rurality in different periods. The results of interaction detection show that the interaction effect of any two drivers on rurality is greater than that of a single driver alone, indicating that there is an obvious two-by-two interactive additive effect of different drivers on the change of rurality (Figure 6). There are differences in the two-by-two interaction effects of the drivers on the change of rurality in different periods: in 2020, the two-by-two interaction effects of public finance revenue, the proportion of foreign population and the per capita industrial output value are more obvious; and in 2010, the two-by-two interaction effects of social fixed asset investment, the proportion of foreign population and the public finance revenue are more obvious.
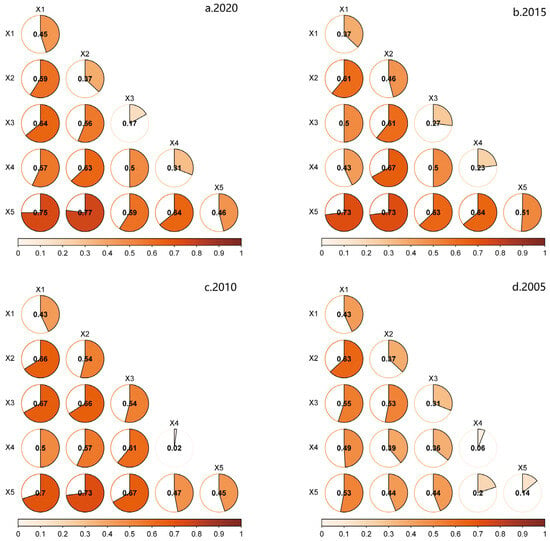
Figure 6.
Plot of the interaction detection results of the drivers of rurality. (a) The years 2020, (b) 2015, (c) 2010, (d) 2005 represent the two-by-two interaction effect plots of each driver on rurality in 2020, 2015, 2010, and 2005. ×1 represents Mig-population; ×2 represents Ind-value; ×3 represents Pub-revenue; ×4 represents Fix-investment; ×5 represents Rail-coverage.
5. Conclusion and Discussion
5.1. Conclusions and Recommendations
The level of rurality in Shanghai is generally at a declining trend, and spatially it is gradually increasing outwards with the central urban area as the origin. This characteristic may be closely related to urban expansion. The closer the townships are to the central city, the more likely they are to be affected by the spillover effects of population and industry in the central city, and more land is acquired for urban development and construction and industrial development, thus promoting the transformation of the countryside into towns. This is also more in line with the findings of related urban expansion studies. Therefore, considering the influence of the development trend of urbanization, the townships around the central city should strictly control the disorderly expansion of the scale of construction land by drawing the ecological red line and the red line of arable land protection. At the same time, the governance of ecological space is actively promoted to mitigate the impact of urbanization development on the reduction of ruralness.
Differences in the main drivers affecting rurality in different periods may be due to differences in the focus of urban construction and development in different periods. During the period 1990–2010, the focus of urban construction in Shanghai focused on suburban urbanization and industrialization, actively attracting foreigners to settle in the city, promoting the outward relocation of industry from the central city to the townships and rapidly advancing the construction of rail transit, etc. The implementation of these policies and actions led to a rapid weakening of rurality in townships in Shanghai in that period. After 2015, Shanghai promoted the reduction and reclamation of industrial land in townships, and the negative impact of township industries on rurality weakened. The continued rapid construction of rail transit has led to a significant increase in the residential population in townships, so the ratio of foreign population and the coverage of rail transit are still the key factors influencing the weakening of rurality in townships in this period. Therefore, it is necessary for us to conduct regular rurality evaluations to keep abreast of the main drivers of rurality change, so that we can take relevant measures to regulate the level of regional rurality.
The government’s macro-planning positioning of rural areas directly affects the level of rurality. Chongming District has been positioned as an international eco-island, and the three towns in the western part of Qingpu District have been assigned to the Yangtze River Delta Green Ecological Integration Demonstration Zone, maintaining a relatively high level of rurality. The government can consider the status of the rurality level of the townships as the main reference basis for the compilation of territorial spatial planning, and plan the areas with relatively high rurality levels to be the key objects of rural revitalization and development. In these areas, key measures such as improvement of the human habitat, transformation of the agricultural production structure, and ecological protection, restoration and landscape optimization can be taken to promote the return of the rural population and the reshaping of industries, as well as to promote comprehensive revitalization and sustainable development of the countryside.
Rural areas are complex systems, affected by population, industry, finance, investment, transportation, and other factors, and the analysis results based on the Geo-Detector model also show that there is an interactive and additive effect between different factors. In practice, local governments can consider adopting a combination of population, industry, finance, investment, transportation, and other policies and measures, or implementing comprehensive actions such as comprehensive land improvement in the whole region, in order to regulate and guide the transformation or sustainable development of the countryside. In addition, it is necessary to strengthen the long-term dynamic monitoring of rural indicators in order to keep abreast of changes in the status of rurality and to assess the effectiveness of policies, so as to improve the relevance and effectiveness of rural development policies.
5.2. Contributions and Limitations
5.2.1. Contribution
There are many studies on rurality evaluation and driving factors, but relatively few analyses of rurality evaluation and driving factors have been carried out in combination with the characteristics of megacities. This paper constructs a rurality evaluation index system based on the perspective of spatial governance by combining the characteristics of rural functions in megacities, and carrying out rurality evaluation from a township scale, which complements the existing studies in terms of research objects and research scales. Less attention has been paid to the impact of rail transit construction on regional rurality; this paper combines the characteristics of developed rail transit in megacities and selects rail transit coverage as a driving factor. Analyses find that rail transit coverage has an obvious negative effect on the change of rurality. Existing studies analyzing the drivers of rurality have mainly focused on the effects of individual factors, but have not yet considered the interactive effects among factors. This study analyzes both the effects of individual factors on rurality and the interaction effects between different factors, which can provide a basis for the government to take comprehensive measures to guide the transformation of rurality. Different stages of urban development, different locations of the countryside, and its rural development positioning, functions, and development trends are also different. As a city at the forefront of China’s socio-economic development, Shanghai has gone through different stages of development. Taking Shanghai as an example, the study analyses the driving effects of the proportion of foreign population, per capita industrial output value, public financial income, social fixed asset investment, and rail coverage on the change of rurality in mega-cities, and finds that the results of the study can be used as a reference for the development of rural villages in other cities at different stages of development and in different locations.
5.2.2. Limitations
Due to the difficulty of micro-data collection and knowledge limitations, this paper has the following limitations: (1) Due to the lack of continuous biodiversity, rural landscape, and cultural heritage data at the township level, ecological indicators are not sufficiently considered, and indicators such as landscape and culture are not taken into account for the time being. (2) The driving factors affecting rurality involve multi-dimensional factors such as nature, economy, society, technology, and policy, and only some of these factors have been analyzed in this study. In future research, in order to support government departments to formulate relevant policies more precisely and serve rural transformation or sustainable rural development, the following are recommended: (1) Explore the establishment of a relatively unified statistical indicator database for townships, add relevant indicators such as culture, landscape, biodiversity, etc., and carry out an all-around evaluation of rurality. (2) Carry out a long time-series evaluation of rurality and multi-dimensional analysis of driving factors. (3) Explore the evaluation of rurality and the study of driving factors at the village scale.
Author Contributions
X.X.: Writing—original draft, Writing—review and editing, Supervision, Formal analysis, Software, Methodology, Conceptualization. Y.D.: Writing—original draft, Writing—review and editing, Validation. X.H.: Writing—review and editing, Supervision, Resources, Project administration, Funding acquisition. All authors have read and agreed to the published version of the manuscript.
Funding
This study was financially supported by the major programs of the National Social Science Foundation of China (23&ZD099).
Institutional Review Board Statement
Not applicable.
Informed Consent Statement
Not applicable.
Data Availability Statement
The data that support the findings of this study are available from the corresponding author upon reasonable request.
Conflicts of Interest
The authors declare no conflict of interest.
References
- Li, T.; Li, Y.; Yan, Y.; Wang, B. Measuring urban sprawl and exploring the role planning plays: A shanghai case study. Land Use Policy 2017, 67, 426–435. [Google Scholar]
- Brown, D.G.; Johnson, K.M.; Loveland, T.R.; Theobald, D.M. Rural land-use trends in the conterminous United States, 1950–2000. Ecol. Appl. 2005, 15, 1851–1863. [Google Scholar] [CrossRef]
- Nelson, K.S.; Nguyen, T.D.; Brownstein, N.A.; Garcia, D.; Walker, H.C.; Watson, J.T.; Xin, A. Definitions, measures, and uses of rurality: A systematic review of the empirical and quantitative literature. J. Rural Stud. 2021, 82, 351–365. [Google Scholar] [CrossRef]
- Cohen, S.A.; Cook, S.K.; Kelley, L.; Foutz, J.D.; Sando, T.A. A Closer Look at Rural-Urban Health Disparities: Associations Between Obesity and Rurality Vary by Geospatial and Sociodemographic Factors. J. Rural Health 2017, 33, 167–179. [Google Scholar] [CrossRef] [PubMed]
- Doogan, N.J.; Roberts, M.E.; Wewers, M.E.; Tanenbaum, E.R.; Mumford, E.A.; Stillman, F.A. Validation of a new continuous geographic isolation scale: A tool for rural health disparities research. Soc. Sci. Med. 2018, 215, 123–132. [Google Scholar] [CrossRef] [PubMed]
- Liang, M.; Stacciarini, J.M.R.; Smith, R.; Wiens, B. An individual-based rurality measure and its health application: A case study of latino immigrants in North Florida, USA. Soc. Sci. Med. 2015, 147, 300–308. [Google Scholar]
- Weinert, C.; Boik, R.J. MSU rurality index: Development and evaluation. Res. Nurs. Health 1995, 18, 453–464. [Google Scholar] [CrossRef]
- Beynon, M.J.; Crawley, A.; Munday, M. Measuring and understanding the differences between urban and rural areas. Environ. Plan. B Plan. Des. 2016, 43, 1136–1154. [Google Scholar] [CrossRef]
- Bogdanov, N.; Meredith, D.; Efstratoglou, S. A typology of rural areas in serbia. Econ. Ann. 2008, 53, 7–29. [Google Scholar] [CrossRef]
- Caschili, S.; De Montis, A.; Trogu, D. Accessibility and rurality indicators for regional development. Comput. Environ. Urban Syst. 2015, 49, 98–114. [Google Scholar] [CrossRef]
- Romano, S.; Cozzi, M.; Viccaro, M.; Persiani, G. A geostatistical multicriteria approach to rural area classification: From the European perspective to the local implementation. Agric. Agric. Sci. Procedia 2016, 8, 499–508. [Google Scholar] [CrossRef][Green Version]
- Cleland, C.L. Measuring Rurality. Hum. Serv. Rural Environ. 1995, 18, 13–18. [Google Scholar]
- Li, Y.; Long, H.; Liu, Y. Spatio-temporal pattern of China’s rural development: A rurality index perspective. J. Rural Stud. 2015, 38, 12–26. [Google Scholar] [CrossRef]
- Zhao, J.; Ameratunga, S.; Lee, A.; Browne, M.; Exeter, D.J. Developing a New Index of Rurality for Exploring Variations in Health Outcomes in Auckland and Northland. Soc. Indic. Res. 2019, 144, 1–26. [Google Scholar] [CrossRef]
- Jacquet, J.B.; Guthrie, E.; Jackson, H. Swept out: Measuring rurality and migration intentions on the Upper Great Plains. Rural Sociol. 2017, 82, 601–627. [Google Scholar] [CrossRef]
- Mitchell, M.; Doyle, C. Spatial distribution of the impact of agricultural policy reforms in rural areas. Scott. Geogr. Mag. 1996, 112, 76–82. [Google Scholar] [CrossRef]
- Wu, Q.; Ye, J.; Chen, Y. The spatial differentiation of rurality in developed coastal regions of eastern China based on rural revitalization: The case of Zhejiang Province. Sci. Geogr. Sin. 2022, 42, 466–475. [Google Scholar]
- Lyu, M.; Cao, X. The spatial characteristics of rurality and its relationship with the transportation accessibility in the Loess Plateau. Sci. Geogr. Sin. 2020, 40, 248–260. [Google Scholar]
- Zhang, R.; Zhang, X.; Li, C. Evolvement and mechanism of spatial pattern of rurality in Jiangsu province on county scale. Hum. Geogr. 2013, 28, 91–97. [Google Scholar]
- Yuan, Y.; Zhao, W.; Li, H.; Mu, H. Analyzing the Driving Mechanism of Rural Transition from the Perspective of Rural–Urban Continuum: A Case Study of Suzhou, China. Land 2022, 11, 1146. [Google Scholar] [CrossRef]
- Zhou, H.; Wang, B. Analysis of the coupling rurality index and rural transformation development of Jiangsu Province in China in the early 21st century. China Popul. Resour. Environ. 2013, 23, 48–55. [Google Scholar]
- Chen, Y.; Li, W.; Ma, R.; Li, J.; Ren, L. Spatial differentiation of rurality and analysis of its driving factors in Zhejiang province. Econ. Geogr. 2014, 34, 133–139. [Google Scholar]
- Han, D.; Qiao, J.; Ma, Y. Rurality spatial differentiation mechanism in the New Era based on the perspective of spatial interface: A case study of Gongyi city, Henan province. Prog. Geogr. 2018, 37, 655–666. [Google Scholar]
- Zhang, R.; Jiao, H.; Zhang, X. Rural development types and rurality in the Yangtze River Delta. J. Nanjing Norm. Univ. (Nat. Sci. Ed.) 2014, 37, 132–136. [Google Scholar]
- Zhou, Y.; Hao, X.; Liu, Y.; Gao, Y.; Ren, Y. Assessment of rural development types and rurality at county level in Henan Province. Res. Agric. Mod. 2014, 35, 447–452. [Google Scholar]
- Feng, S.; Sha, R. Evaluation model of countryside tourism’s rural feature: A case study of Wuyuan in Jiangxi Province. Geogr. Res. 2007, 26, 616–624. [Google Scholar]
- Dong, Y.; Guo, Y.; Li, Z.; Lin, S. Spatio-temporal differentiation and driving mechanism of rurality in the Yangtze River Economic Belt. J. Nat. Resour. 2022, 37, 378–395. [Google Scholar] [CrossRef]
- Ma, L.; Li, T.; Li, T.; Long, D.; Chen, Y. Spatial distribution of rurality and types of rural development in farming-pastoral ecotone in Northern China. Econ. Geogr. 2015, 35, 126–133. [Google Scholar]
- Cloke, P.J. An index of rurality for England and Wales. Reg. Stud. 1977, 11, 31–46. [Google Scholar] [CrossRef]
- Zhang, X. Discrimination of rural definitions. Acta Geogr. Sin. 1998, 53, 79–85. [Google Scholar]
- Nelson, K.S.; Nguyen, T.D. Community assets and relative rurality index: A multi-dimensional measure of rurality. J. Rural Stud. 2023, 97, 322–333. [Google Scholar] [CrossRef]
- Shi, Y.; Zhang, Y.; Hao, J. Research on the rural development types and rurality evaluation in Hebei province under the background of rural revitalization. Chin. J. Agric. Resour. Reg. Plan. 2021, 42, 18–28. [Google Scholar]
- Niu, Z.; Zhou, Z.; Zhu, C.; Chen, Q. Rurality spatial distribution and types of rural development in karst mountains: A case of Panzhou city in Guizhou province. Res. Soil Water Conserv. 2021, 28, 316–324. [Google Scholar]
- Jiang, L.; Luo, J.; Zhang, C.; Tian, L.; Chen, G.; Wu, Y. Spatial distribution of rurality at county level in Hubei province based on major function-oriented zoning location. Chin. J. Agric. Resour. Reg. Plan. 2020, 41, 58–66. [Google Scholar]
- Long, H.L.; Liu, Y.S.; Zou, J. Assessment of rural development types and their rurality in Eastern Coastal China. Acta Geogr. Sin. 2009, 64, 426–434. [Google Scholar]
- Madu, I.A. The structure and pattern of rurality in Nigeria. Geojournal 2010, 75, 175–184. [Google Scholar] [CrossRef]
- Smith, B.J.; Parvin, D.W. Defining and measuring rurality. J. Agric. Appl. Econ. 1973, 5, 109–113. [Google Scholar] [CrossRef]
- Wang, Y.; Zhou, X.; Li, G. The rurality appraisal and characteristics of different types of traditional villages in Southern Jiangsu province: Based on surveys of 12 traditional villages in Suzhou. Geogr. Res. 2019, 38, 1311–1321. [Google Scholar]
- Cai, X.; Zhang, L. Research on the Type of Rural Development and Rural Spatial and Temporal Evolution in Fujian Province. Southeast Acad. J. 2019, 6, 118–126. [Google Scholar]
- Li, X.; Yang, H.; He, Y.; Liu, C.; Luo, J.; Li, M. Assessment of rural development types and their rurality in Shaanxi province. J. Shandong Agric. Univ. (Nat. Sci. Ed.) 2016, 47, 225–230. [Google Scholar]
- Blunden, J.R.; Pryce, W.T.R.; Dreyer, P. The classification of rural areas in the European context: An exploration of a typology using neural network applications. Reg. Stud. 1998, 32, 149–160. [Google Scholar] [CrossRef]
- Feng, Y.; Liang, Z.; Wang, F. Spatial and Temporal Change of Rurality in Towns Based on Land Use:A Case of Panyu District and Conghua District in Guangzhou. Sci. Geogr. Sin. 2018, 38, 1499–1507. [Google Scholar]
- Li, X.; Li, Y.; Cheng, G.; Weng, C. Assessing the County’s Rurality in the Three Gorges Reservoir area of Chongqing. Econ. Geogr. 2013, 33, 125–131. [Google Scholar]
- Meng, H.; Li, T.; Yu, Z.; Li, F. Rurality and acorrelation analysis of the cuunty economy in Anhui Province. Econ. Geogr. 2013, 33, 144–148, 185. [Google Scholar]
- Isserman, A.M. In the national interest: Defining rural and urban correctly in research and public policy. Int. Reg. Sci. Rev. 2005, 28, 465–499. [Google Scholar] [CrossRef]
- Inagami, S.; Gao, S.S.; Karimi, H.; Shendge, M.M.; Probst, J.C.; Stone, R.A. Adapting the Index of Relative Rurality (IRR) to estimate rurality at the ZIP code level: A rural classification system in health services research. J. Rural Health 2016, 32, 219–227. [Google Scholar] [CrossRef]
- Halfacree, K.H. Locality and social representation: Space, discourse and alternative definitions of the rural. J. Rural Stud. 1993, 9, 23–37. [Google Scholar] [CrossRef]
- Harrington, V.; O’Donoghue, D. Rurality in England and Wales 1991: A replication and extension of the 1981 rurality index. Sociol. Rural. 1998, 38, 178–203. [Google Scholar] [CrossRef]
- Woods, M. Rural geography: Processes, responses and experiences in rural restructuring. Rural Geogr. Process. Responses Exp. Rural Restruct. 2005, 7, 494–496. [Google Scholar]
- Fang, L.; Wang, Y. Multi-Disciplinary Determination of the Rural/Urban Boundary: A Case Study in Xi’an, China. Sustainability 2018, 10, 2632. [Google Scholar] [CrossRef]
- Hedlund, M. Mapping the socioeconomic landscape of rural Sweden: Towards a typology of rural areas. Reg. Stud. 2016, 50, 460–474. [Google Scholar] [CrossRef]
- Li, Z.; Zhang, X.; Li, H.; Fan, L. Research on rurality at village scale and rural development model: A case of Jintan City, Jiangsu Province. Sci. Geogr. Sin. 2017, 37, 1194–1202. [Google Scholar]
- Yang, H.; Chen, S. Town scale rurality spatial differentiation and rural development strategy under background of rural revitalization: Taking Dehua County of Fujian Province as an example. Chin. J. Agric. Resour. Reg. Plan. 2021, 42, 23–32. [Google Scholar]
- Nie, X.; Shi, P.; Zhang, X.; Lyu, R.; Zhu, Y.; Wei, W. Research on rurality evaluation and the driving mechanism in aridregions of Northwest China: A case study of Wuwei city in Gansu province. Sci. Geogr. Sin. 2017, 37, 585–594. [Google Scholar]
- Sun, Y.; Cheng, Y.Q.; Zhang, P.Y. Spatio-temporal dynamics of rurality in Northeast China. Geogr. Res. 2015, 34, 1864–1874. [Google Scholar]
- Liu, J.; He, W. Evolvement and Mechanism of Spatial Distribution of Rurality in Sichuan Province on County Scale. J. Sichuan Norm. Univ. (Nat. Sci.) 2018, 41, 122–130. [Google Scholar]
- Li, K.; Li, K.; Liu, Y.; Yue, L.; Jiang, X. Transition Characteristics and Driving Mechanisms of Rural Settlements in Suburban Villages of Megacities under Policy Intervention: A Case Study of Dayu Village in Shanghai, China. Land 2023, 12, 1999. [Google Scholar] [CrossRef]
- Wang, L.; Ge, M.; Chen, N.; Ding, J.; Shen, X. An Evaluation Model of Riparian Landscape: A Case in Rural Qingxi Area, Shanghai. Land 2022, 11, 1512. [Google Scholar] [CrossRef]
- Ministry of Environmental Protection of the People’s Republic of China. Technical Criterion for Ecosystem Status Evaluation (HJ192-2015); Ministry of Environmental Protection of the People’s Republic of China: Beijing, China, 2015. [Google Scholar]
- Xie, G.; Xiao, Y.; Zhen, L.; Lu, C. Study on ecosystem service value of food production in China. Chin. J. Eco-Agric. 2005, 13, 10–13. [Google Scholar]
- Hess, D.B.; Almeida, T.M. Impact of proximity to light rail rapid transit on station area property values in Buffalo, New York. Urban Stud. 2007, 5, 1041–1068. [Google Scholar] [CrossRef]
- Gutiérrez, J.; Cristóbal, C.; Gómez, G. Accesibilidad peatonal a lared de metro de Madrid: Efectos del plan de ampliación 1995–1999. An. Geogr. Univ. Complut. 2000, 20, 363–376. [Google Scholar]
- Huang, X.; Li, H.; Zhang, X.; Zhang, X. Land use policy as an instrument of rural resilience—The case of land withdrawal mechanism for rural homesteads in China. Ecol. Indicat. 2018, 87, 47–55. [Google Scholar] [CrossRef]
- Fotheringham, A.S.; Yang, W.; Kang, W. Multiscale Geographically Weighted Regression (MGWR). Ann. Am. Assoc. Geogr. 2017, 107, 1247–1265. [Google Scholar] [CrossRef]
- Wang, J.; Li, X.; Christakos, G.; Liao, Y. Geographical detectors-based health risk assessment and its application in the neural tube defects study of the Heshun region, China. Int. J. Geogr. Inf. Sci. 2010, 24, 107–127. [Google Scholar] [CrossRef]
- Wang, J.; Hu, Y. Environmental health risk detection with GeogDetector. Environ. Model. Softw. 2012, 33, 114–115. [Google Scholar] [CrossRef]
- Huang, Z.; Li, S.; Peng, Y.; Gao, F. Spatial Non-Stationarity of Influencing Factors of China’s County Economic Development Base on a Multiscale Geographically Weighted Regression Model. ISPRS Int. J. Geo-Inf. 2023, 12, 109. [Google Scholar] [CrossRef]
- Tran, D.X.; Pearson, D.; Palmer, A.; Lowry, J.; Gray, D.; Dominati, E.J. Quantifying spatial non-stationarity in the relationship between landscape structure and the provision of ecosystem services: An example in the New Zealand hill country. Sci. Total Environ. 2022, 808, 152126. [Google Scholar] [CrossRef]
Disclaimer/Publisher’s Note: The statements, opinions and data contained in all publications are solely those of the individual author(s) and contributor(s) and not of MDPI and/or the editor(s). MDPI and/or the editor(s) disclaim responsibility for any injury to people or property resulting from any ideas, methods, instructions or products referred to in the content. |
© 2024 by the authors. Licensee MDPI, Basel, Switzerland. This article is an open access article distributed under the terms and conditions of the Creative Commons Attribution (CC BY) license (https://creativecommons.org/licenses/by/4.0/).

