Article

Soil Water Capacity and Pore Size Distribution in Different Soil Tillage Systems in the Spring Barley Crop

by
Aušra Sinkevičienė
1,*,
Inesa Sinkevičiūtė
1,
Karolina Jackevičienė
1,
Kęstutis Romaneckas
1,
Jovita Balandaitė
1,2,
Augustas Sederevičius
1 and
Rasa Kimbirauskienė
1
1
Department of Agroecosystems and Soil Sciences, Agriculture Academy, Vytautas Magnus University, Studentu Str. 11, Kaunas reg., LT-53361 Akademija, Lithuania
2
Bioeconomy Research Institute, Agriculture Academy, Vytautas Magnus University, Kaunas reg., 44001 Kaunas, Lithuania
*
Author to whom correspondence should be addressed.
Land 2024, 13(12), 2198; https://doi.org/10.3390/land13122198
Submission received: 30 September 2024 / Revised: 27 November 2024 / Accepted: 7 December 2024 / Published: 16 December 2024

Abstract

:
Barley is an important cereal crop with versatile uses: barley grains are part of the human diet and are also used for animal feed, while the potential to use barley for ethanol production provides this grain with a promising bioenergy potential. As scientific research in the field of bioenergy progresses, barley may play an even greater role in meeting the world’s future energy needs. The challenge facing today’s barley growers, and one that will undoubtedly be addressed by future generations of grain farmers, is how to grow higher yields with lower costs while minimizing damage to the soil. One way to achieve this is by using simplified tillage methods, thereby avoiding soil compaction, structural degradation, and erosion. Moreover, studies have shown that when soil is cultivated using simplified methods, crop yields may actually increase. Our research was conducted in a long-term stationary field experiment, which was located at the Vytautas Magnus University Agriculture Academy Experimental Station. The aim of the investigation was to determine the effect of conservation tillage and deep plowing systems on soil water capacity and pore size distribution in spring barley cultivation. Comparing simplified tillage systems with deep plowing (DP), it can be concluded that the no-tillage (NT) technology most significantly improved the studied indicators, while the deep plowing (DP) technology exhibited the poorest results.

1. Introduction

Currently, the agriculture sector faces the challenge of supplying a constantly growing population with safe food products while the climate is getting warmer and, to achieve this goal, using the soil without damaging or affecting the environment [1]. One of the main challenges for the growing world population is to stably supply it with food products. The production gained from agriculture takes the most important place in this food supply chain. However, farmers find it difficult to maintain a stable agriculture production. When crops are not protected and are always under threat by biotic and abiotic effects, mistakes while tilling soil cause the loss of soil quality, in addition to the disturbance of climate change [2]. Soil tilling is an essential part of practical soil preparation in agriculture, which influences various soil parameters [3]. Soil is one of the most important parts of the ecosystem. The processes in the soil have significant impacts on the environment. Various phenomena, such as climate warming, ozone depletion, and air and water pollution, depend in part on the processes taking place in the soil [2]. There are constant processes happening in the soil, and there are many microorganisms, although it is a system responsible for transporting nutrients and water to the plant. Nevertheless, higher temperatures, due to reduced precipitation, destroy soil aggregates, increase soil compaction, and reduce biological activity [4]. In addition to the impacts of climate and environment on the soil, it is also affected by other factors due to humans [5]. However, in order to understand all of it, scientific research must be carried out, which could explain different factors’ impacts on the soil [6]. The physical properties of the soil play an essential part in plant root growth morphology, which is why roots can efficiently absorb nutrients from soil [7]. The importance of soil’s hydrophysical property studies emerges, but the effects of climate change or new soil tilling methods are not well known or studied [8]. Soil’s water sorption, respiration, porosity, and water content depend on soil tilling methods [9]. Heavyweight soil tilling machines decrease the porosity of the soil and could significantly change the structure of pores by driving over it. The depletion of long pores is usually determined in these soils. The long pores are responsible for optimal properties for plant root growth as they ensure the flow of water in the soil [10]. When the standard soil tilling method is applied, the soil is usually compacted, and that could potentially negatively impact the root growth [11]. The compaction of the soil decreases aeriation and increases its density, shifts the size distribution of the pores, and crushes macroaggregates [12]. Soil type and land management are among the main factors that have an influence over the parameters of macropores in the soil [13]. The characteristics of soil macropores are important for a wide range of essential soil properties, such as friability [14].
The aim of the investigation was to determine the effects of conservation tillage and deep plowing systems on soil water capacity and pore size distribution in spring barley cultivation.

2. Materials and Methods

2.1. Experimental Site

A constant field experiment that has been ongoing for many years was conducted at the Vytautas Magnus University Agricultural Academy (former Aleksander Stulginskis University) Test Station (54°52′ N, 23°49′ W). The field stationary experiment was started in 1988 and in 2001 and was modified to include a direct seeding treatment. The research data in this article covered the period of 2022–2023. The soil in the experimental field (in 2022) was silty loam (45.6% sand, 41.7% silt, 12.7% clay) Planosol [15]. The tillage layer was 0–30 cm in depth. The soil surface pHKCL was 6.4–7.7, the available phosphorus content ranged from 194 to 384 mg kg−1, and the available potassium content ranged from 85 to 206 mg kg−1. Reference [16] found that in 2019, at 0–30 cm, the soil pH (determined using the potentiometric method (in KCl extract with a glass electrode) (ISO 10390:2005)) [16] was the following: in deep plowing, 7.2; in shallow plowing, 6.9; in deep cultivation, 7.1; in shallow cultivation, 6.9; and in no tillage, 6.5. The available phosphorus (mg kg−1) (determined by the Egner-Rim-Domingo (A–L) method) was the following: in deep plowing, 238.8; in shallow plowing, 258.4; in deep cultivation, 264.9; in shallow cultivation, 252.1; and in no tillage, 330.7. The available potassium (mg kg−1) (determined by the Egner-Rim-Domingo (A–L) method) was the following: in deep plowing, 295.4; in shallow plowing, 400.8; in deep cultivation, 330.9; in shallow cultivation, 357.9; and in no tillage, 572.3. The total nitrogen (%) (determined by the Kjeldahl method) was the following: in deep plowing, 0.111; in shallow plowing, 0.134; in deep cultivation, 0.126; in shallow cultivation, 0.126; and in no tillage, 0.163. Organic carbon (g kg−1) (determined by Heraeus (%)) was the following: in deep plowing, 14.6; in shallow plowing, 18.3; in deep cultivation, 16.8; in shallow cultivation, 18.7; and in no tillage, 22.0 [17].

2.2. Experimental Design and Agricultural Practices

The experimental setup (as shown in Table 1 and Figure 1) consisted of four randomized main plots with four replications: spring barley (Hordeum vulgare L.), winter rape (Brassica napus L.), faba bean (Vicia faba L.) with plant residues, and winter wheat (Triticum aestivum L.) with plant residues and cover crops. Five tillage treatments were applied in the subplots: conventional plowing (DP) at 22–25 cm depth (control), shallow plowing (SP) at 12–15 cm, deep cultivation (DC, chiselling) at 25–30 cm, shallow cultivation (SC, chiselling) at 10–12 cm, and no tillage (NT) (Table 1, Figure 1).
The experiment consisted of 16 main plots, each covering an area of 126 m2 (14 × 9 m), surrounded by a 1 m protection zone. Soil samples for this study were taken exclusively from the spring barley field. The plots were randomly distributed. The experimental plots were separated by a 1 m wide buffer strip and the blocks by a 9 m wide buffer strip. The spring barley crop was divided into 20 subplots of 70 m2 (10 m × 7 m) each. Autumn tillage agricultural techniques were carried out in September–October.
Under NT treatment, no-tillage cultivation was carried out in spring, and the crops were sown directly. In addition, weeds were chemically controlled with the herbicide Glyphogan 360 SL. The main tillage operations were performed in September–October (2022 and 2023). A Gamega PP-3-43 plow (Gamega Ltd., Garliava, Lithuania) was used for DP and SP plowing. A chisel cultivator KRG-3.6 (Laumetris Ltd., Keleriškės village, Kėdainiai reg., Lithuania) was used for DC and SC tillage. Pre-sowing tillage was carried out in April–May with a KLG-3.6 complex cultivator (Laumetris Ltd., Keleriškės village, Kėdainiai reg., Lithuania). Spring barley (variety “Crescendo”) was sown at 12.5 cm row spacing, at 3 cm depth, and at a rate of 180 kg ha−1 (4 million units) with a Väderstad Rapid 300C Super XL drill (Väderstad AB, Väderstad, Sweden) from April to May. NPK (16:16:16) and ammonium nitrate (N 34.4) fertilizers were applied at rates of 300 kg ha−1 and 200 kg ha−1, respectively. The content of nitrogen as an active substance is 118 kg ha−1, phosphorus is 48 kg ha−1, and potassium is 48 kg ha−1. The same rate was applied in all plots. The determinate cultivated plants were sprayed with the insecticide Karate Zeon 5 CS (50 g L−1 lamda cyhalothrin), as well as with the herbicide Elegant 2FD (florasulam 6.25 g L−1 + 2.4-D 300 g L−1) and the fungicide Mirador 250 SC (azoxystrobin 250 g L−1 (22.81%)). Plant protection products (insecticides and herbicides) were applied twice during the plant growing season.

2.2.1. Assessment of Soil Properties

Soil samples were taken in 2022 and 2023 after sowing spring barley. Intact core samples were taken with stainless steel rings (100 cm3 volume) from depths of 0–5, 5–10, and 15–20 cm to determine the soil water release characteristics (hPa) in six replicates. The water release characteristics were determined at −4, −10, −30, and −100 hPa (in a sandbox) and −300 hPa (in a plate extractor at 15 bar). Loose soil samples were used to determine the water content at a tension of −15,500 hPa using a high-pressure membrane apparatus [19,20]. The water content at pressures of −100 and −15,500 hPa was taken as the field capacity (prevailing in Europe) and the permanent wilting point, respectively. The soil pore space distribution of the contents was determined in micropores of 30 µm as a percentage of total porosity at the depths of 0–5 cm, 5–10 cm, and 15–20 cm. The water content between these two intakes was determined to be the moisture content available to the plant. From the collected data, the soil pore space distribution and the soil water retention capacity were determined. The dry bulk density of the soil in undisturbed monolithic samples was discovered with stainless steel rings (monolith volume of 100 cm3) from the middle of each profile. The samples were dried for 48 h in an oven heated to 105 °C [21,22].

2.2.2. Statistical Analysis

The two-year results were calculated using a one-way analysis of variance (ANOVA) using the SPSS F test of the computer software package [23]. The research data were processed by analysis of variance using the SYSTAT 12 computer program. The significance of the differences between the means of the variants was assessed with an LSD test at 95.99% and 99.9% confidence levels. Correlations between traits were assessed by correlation analysis, by calculating the correlation coefficient r and its reliability at 95 and 99% confidence levels, and by calculating regression equations with the STAT computer program from the program package SELECTION [24].
In case of a significant difference between a given variant and the control, its confidence level is denoted as follows:
* for p ≤ 0.050 > 0.010 (the differences are significant at the 95% confidence level);
** for p ≤ 0.010 > 0.001 (differences are significant at the 99% confidence level);
*** for p ≤ 0.001 (differences are significant at the 99.99% confidence level).
p > 0.050, no significant differences (differences significant at less than 95% confidence level).
The research data statistical analysis revealed a significant interaction between years in most cases, and therefore, the data for each year are presented separately.

2.3. Meteorological Conditions

The experimental site’s climate was classified as boreal (subarctic). Over the last 100 years, the average annual temperature has risen from 6.3 to 6.7 °C, and precipitation has increased from 590 to 625 mm. The length of the growing season at active temperatures (SAT, ≥10 °C) was around six months. SATs of 2132 °C were registered in 1990, 2371 °C was registered in 1995, and 2965 °C was registered in 2018. The 24 h average air temperatures and precipitation rates are given in Table 2 and Table 3.
In 2022 at the beginning of the crop growing season, it was colder than the long-term average, so the amount of precipitation increased. July and August were warmer that year. Precipitation was similar to the long-term average. In 2023, in May, the temperature was cooler, and there was very little rainfall. In June and August, temperatures and precipitation were similar to long-term average, but July had very low precipitation and lower temperatures.
Research data from 2022 and 2023 showed that the temperatures were cooler at the beginning of the growing season and warmer at the end of the growing season.
In 2022, precipitation increased in May, June, and July but decreased sharply in April. The results obtained in 2023 showed that the opposite trends were found compared with previous years.

3. Results

3.1. Soil Pore Size Distributiom

When examining soil macropores (100–750 µm) in the upper soil layer (0–5 cm) during the study years (2022–2023), the amount of macropores increased in all simplified tillage treatments compared with deep plowing (DP) fields (Table 4). In the no-tillage fields (NT), the amount of mesopores (0.2–30 µm) tended to increase (by 1.1 to 1.6 times) in all the study years. When investigating the amount of micropores (<0.2 µm) in 2022–2023, the number of micropores decreased (by 1.1 to 1.6 times) in deep cultavation (DC), shallow cultivation (SC), and no-tillage (NT) treatments compared with the deep plowing (DP) fields. In 2023, a significant decrease (by 1.6 times) in the amount of micropores was observed in the shallow cultivation (SC) fields.
A very strong positive and statistically significant (r = 0.927, y = −4.97 + 0.24x, p < 0.050) linear correlation was found between the amount of macropores and soil moisture content, with macropore sizes of 300–750 µm in the 0–5 cm soil layer.
A very strong negative and statistically significant (r = −0.932, y = 61.53 − 34.39x, p < 0.050) linear correlation was found between macropores and soil density >750 µm in the 0–5 cm soil layer.
In the middle (5–10 cm) soil layer, during the study years (2022–2023), the amount of macropores (>750 µm) increased (by 1.1 to 7.2 times) with deep cultivation (DC), shallow cultivation (SC), and no tillage (NT) (Table 5). The amount of macropores (30–300 µm) also increased with shallow cultivation (SC) and no tillage (NT). In 2022, the amount of macropores (300–750 µm) in shallow plowing (SP), shallow cultivation (SC), and no-tillage (NT) fields decreased (by 1.1 to 1.4 times) compared with deep plowing (DP) fields. A significant increase (by 1.3 to 1.7 times) in macropores (100–300 µm) was observed in deep cultivation (DC) and shallow cultivation (SC) fields.
When examining the amount of mesopores (10–30 µm), an increase was observed in all fields where simplified tillage was applied. Shallow plowing (SP) and deep cultivation (DC) increased the amount of mesopores (0.2–30 µm). In 2023, shallow plowing (SP) significantly increased the amount of mesopores (0.2–10 µm) by 1.6 times compared with deep plowing (DP).
All simplified tillage methods reduced the soil microporosity. In 2022, the amount of micropores significantly decreased (by 1.3 to 1.4 times) in the deep cultivation (DC) and no-tillage (NT) fields compared with the control variant (DP).
A very strong negative and statistically significant (r = −0.908, y = 20.55 − 56.41x, p < 0.050) linear correlation was found between soil macropores and water retention, with macropore sizes of 300–750 µm in the 5–10 cm soil layer.
In the deepest (15–20 cm) studied soil layer, the amount of macropores (>30 µm) increased with shallow plowing (SP) (Table 6). In 2022, a significantly higher (by 1.7 to 4.1 times) amount of macropores (>750 µm, 30–300 µm) was found in the shallow cultivation (SC) fields compared with deep plowing (DP).
In the deep cultivation (DC) and no-tillage (NT) fields, the amount of macropores (30–300 µm) significantly increased. Upon examining the amount of macropores (30–100 µm), all simplified tillage methods significantly increased macroporosity (by 3.6 to 4.3 times).
In the deep cultivation (DC), shallow cultivation (SC), and no-tillage (NT) fields, the amount of mesopores (10–30 µm) increased. In 2022, mesoporosity significantly increased (by 1.5 to 1.6 times) in these tillage treatments. However, in 2023, the amount of mesopores (0.2–10 µm) decreased in all simplified tillage treatments.
During the study years of 2022–2023, all applied simplified tillage methods reduced the amount of micropores (<0.2 µm), except in 2022 in the shallow plowing (SP) fields.
A very strong negative and statistically significant (r = −0.935, y = 282.41 − 681.99x, p < 0.050) linear correlation was found between soil water retention and mesopores, with sizes of 0.2–10 µm, in the 15–20 cm soil layer.

3.2. Soil Pore Structure

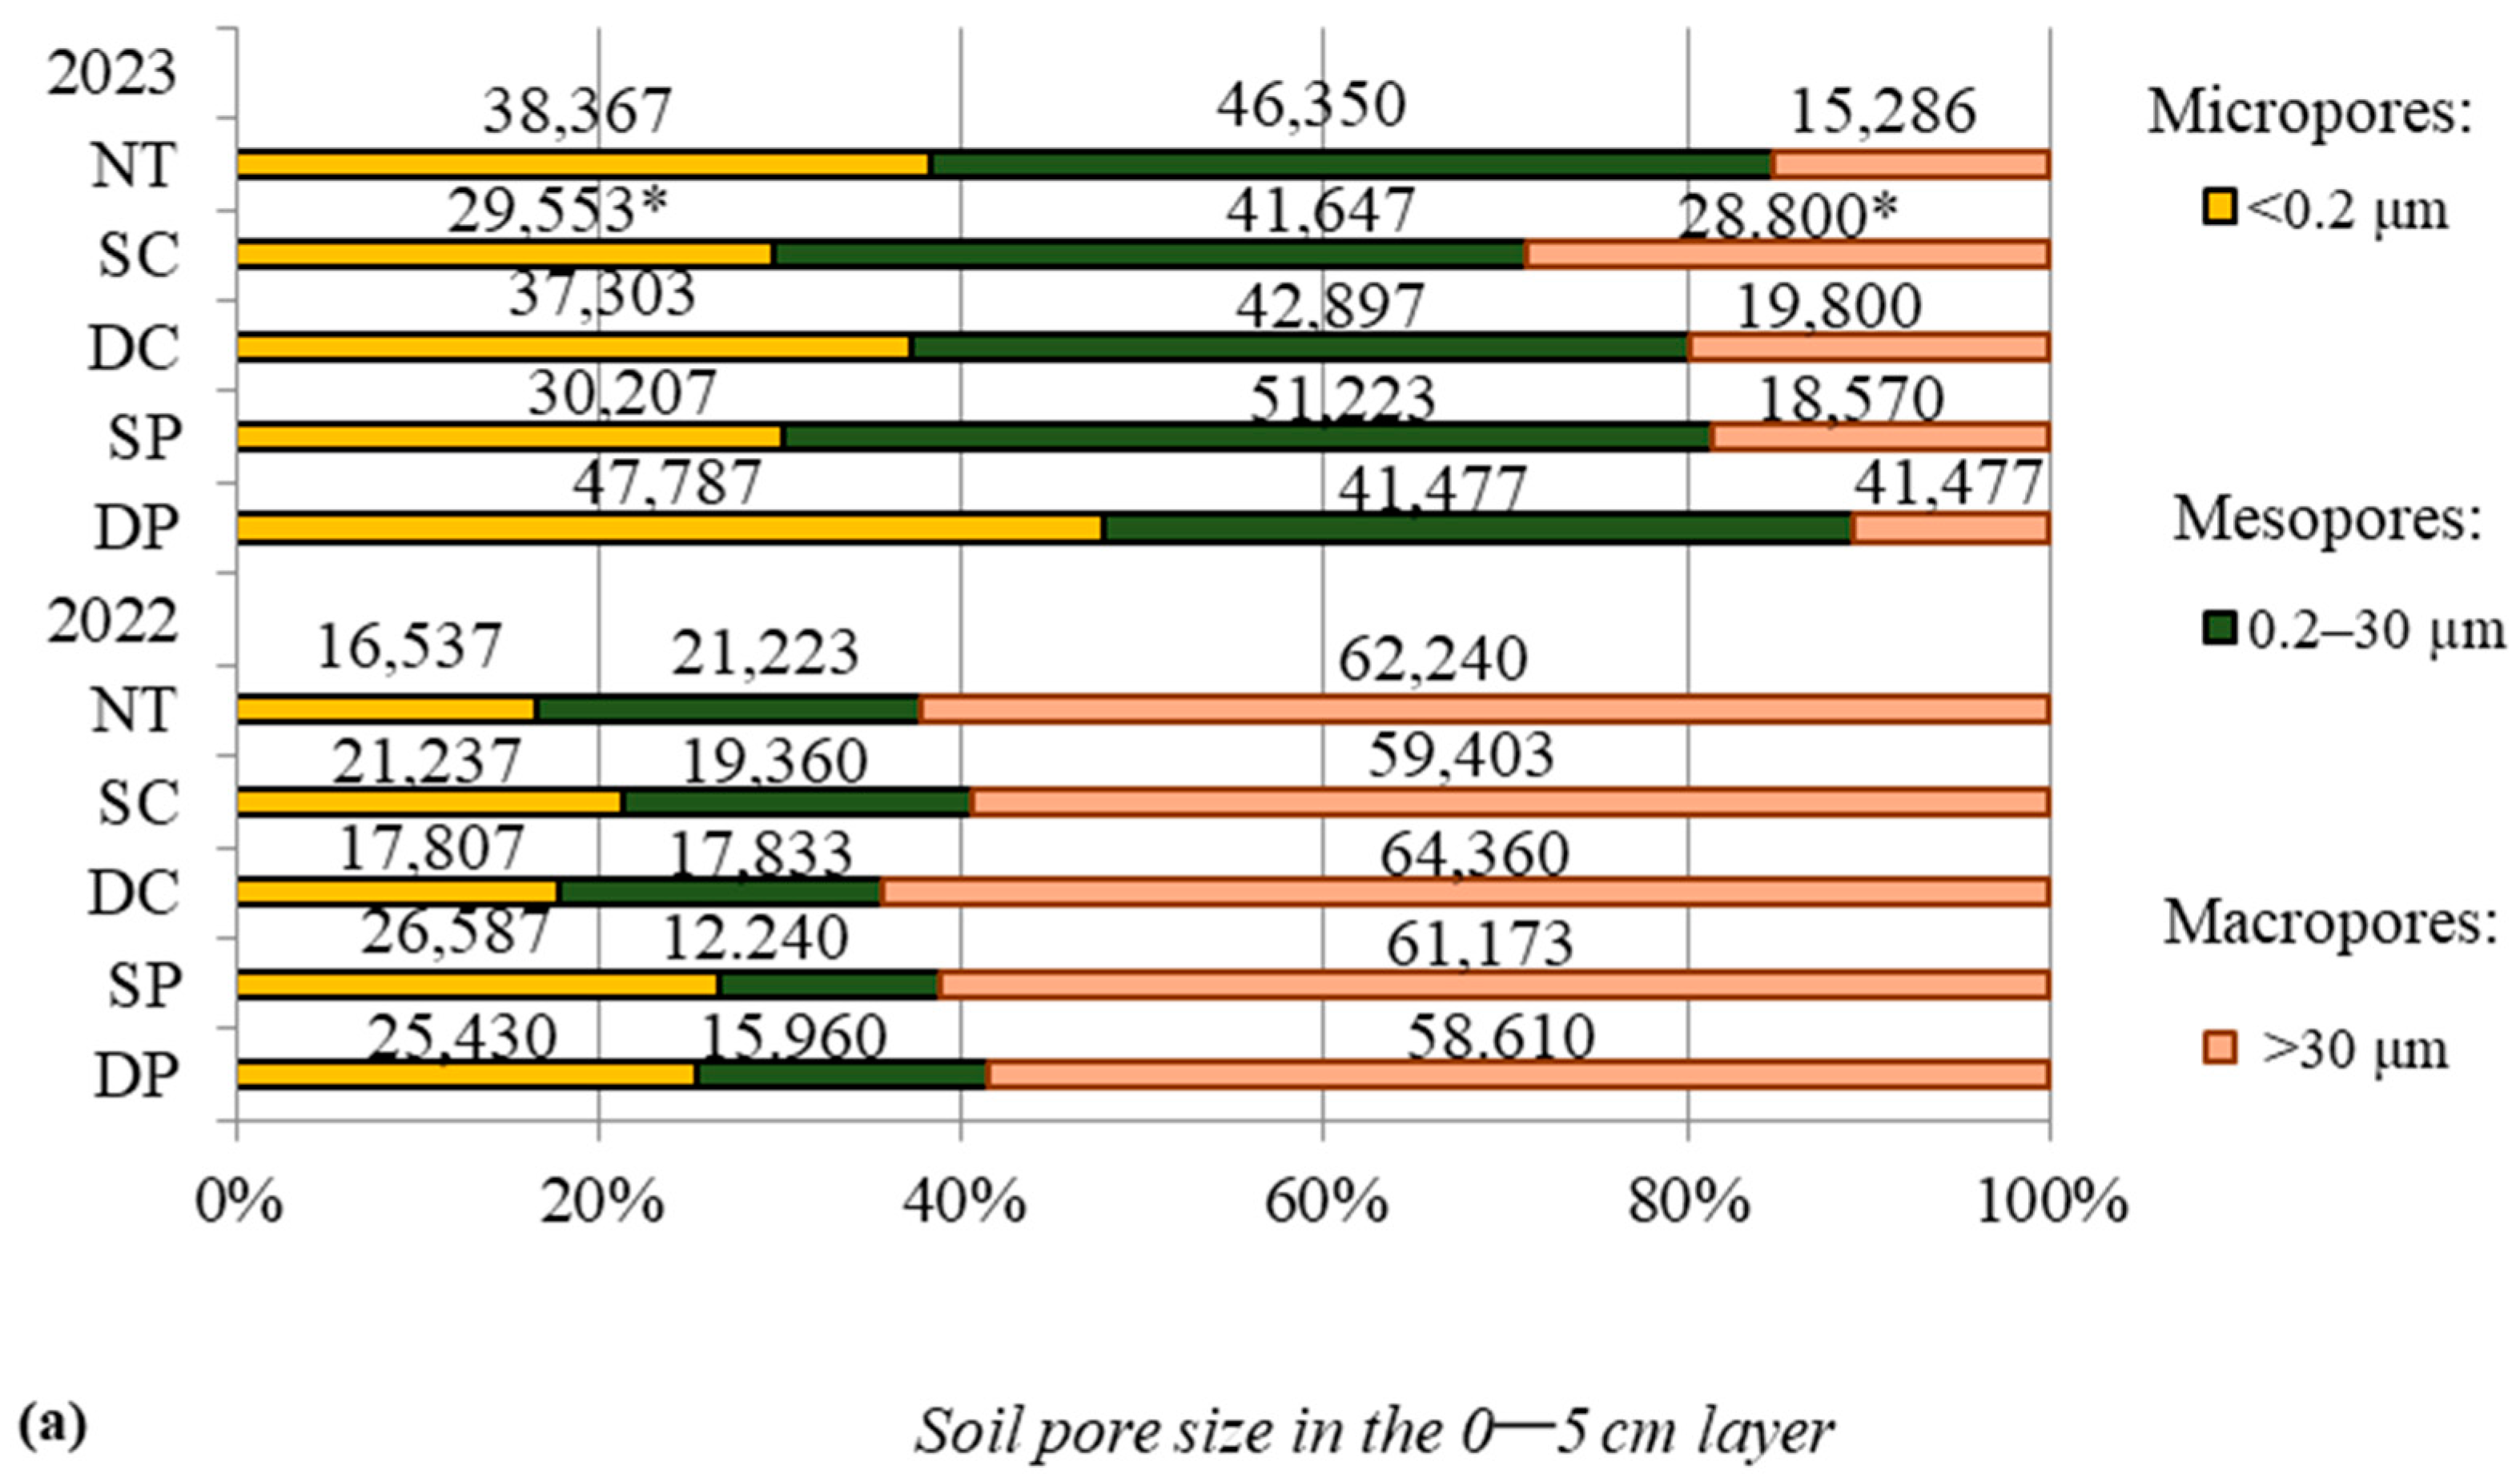
In the study years, a lower amount of micropores, ranging from 4.193 to 18.234%, was found in the deep cultivation (DC), shallow cultivation (SC), and no-tillage (NT) fields in the upper 0–5 cm soil layer compared with the deep plowing (DP) fields (Figure 2a). The opposite trend was observed for mesopores. In all fields where simplified tillage was applied, the amount of macropores increased by 0.793 to 18.064% compared with the control fields.
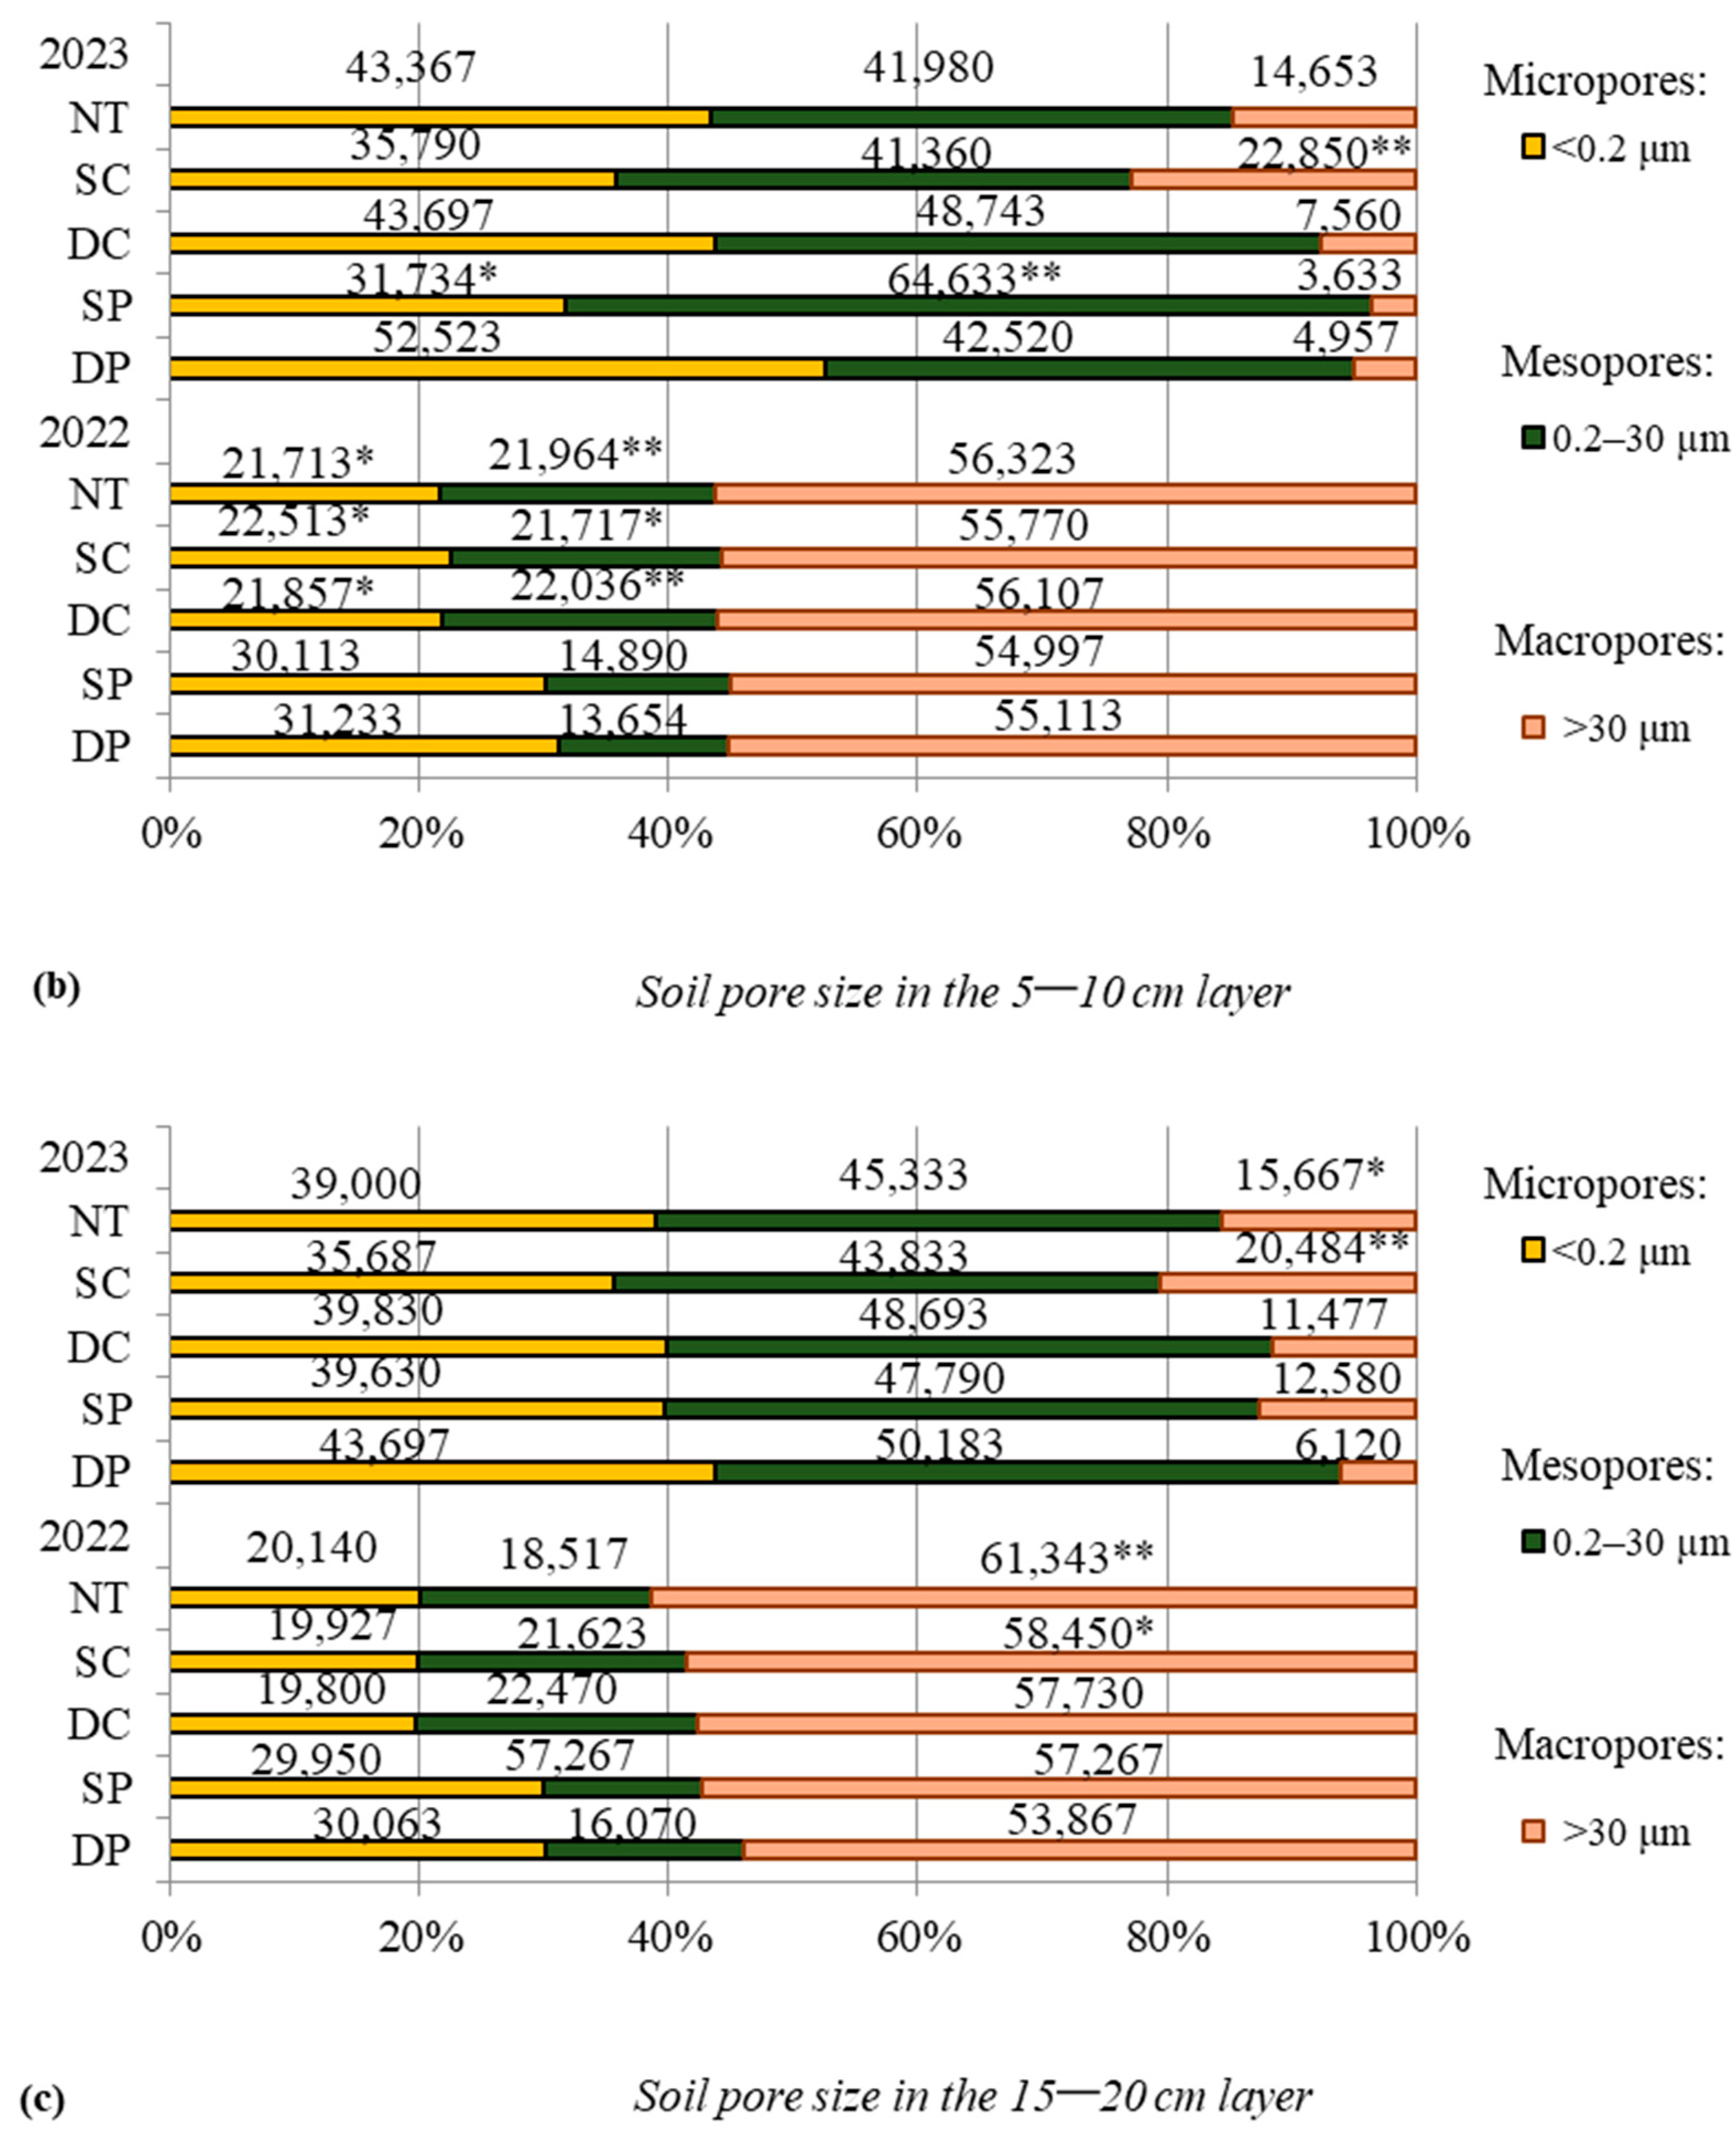
In 2022 and 2023, in the deeper (5–10 cm) soil layer, microporosity decreased in all fields where simplified tillage was applied, and in 2022, it significantly decreased (by 8.720 to 9.520%) compared with deep plowing (DP) (Figure 2b). Mesoporosity increased (by 1.236 to 22.113%) only in the shallow plowing (SP) and deep cultivation (DC) fields. Other applied tillage methods had varying effects on mesoporosity. The amount of macropores increased in the deep cultivation (DC), shallow cultivation (SC), and no-tillage (NT) fields. However, in the shallow plowing (SP) fields, the amount of macropores decreased (by 0.120 to 1.324%) compared with traditional deep plowing (DP).
In the deepest (15–20 cm) studied soil layer, similar trends were observed to those in other soil layers (Figure 2c). All applied simplified tillage methods tended to reduce microporosity by 0.113 to 10.263%. In 2022, the amount of mesopores increased (by 2.447 to 5.553%) in the deep cultivation (DC), shallow cultivation (SC), and no-tillage (NT) fields, but in 2023, a decrease in these pores was observed. In all fields where simplified tillage technologies were applied, the amount of macropores increased. A significant increase in macropores (by 4.583 to 14.364%) was observed in the shallow cultivation (SC) and no-tillage (NT) fields compared with the deep plowing (DP) fields.
A very strong positive and statistically significant (r = 0.912, y = −61.21 + 5.22x, p < 0.050) linear correlation was found between soil micropores and soil moisture content. The pore size was 0.2–10 µm in the 15–20 cm soil layer.

3.3. Total Porosity

In 2022 and 2023, shallow plowing (SP) and shallow cultivation (SC) increased the overall soil porosity by 1.21 to 21.28% in all studied soil layers (Table 7). In the upper (0–5 cm and 5–10 cm) soil layers, the overall soil porosity increased (by 1.69 to 12.82%) in the deep-cultivation (DC) and no-tillage (NT) fields compared with the deep plowing (DP). In 2022, in the upper (0–5 cm) soil layer, the overall soil porosity significantly increased (by 5.89% and 6.63%) in the deep cultivation (DC) and no-tillage (NT) fields. A very strong positive and statistically significant (r = 0.961, y = 0.17 + 0.01x, p < 0.010) linear correlation was found between the soil moisture content and the overall porosity in the 0–5 cm soil layer. In 2023, all applied simplified tillage methods increased the overall soil porosity by 1.89 to 21.62% in the studied soil layers compared with the deep plowing (DP).
A very strong positive and statistically significant (r = 0.992, y = 0.04 + 0.02x, p < 0.010) linear correlation was found between the soil moisture content and the overall porosity in the 5–10 cm soil layer.
A very strong positive and statistically significant (r = 0.996, y = 0.10 + 0.01x, p < 0.010) linear correlation was found between the soil moisture content and the overall porosity in the 15–20 cm soil layer.

3.4. Density

In 2022 and 2023, shallow plowing (SP), shallow cultivation (SC), and no tillage (NT) reduced the soil density in all studied soil layers (Table 8). In 2023, all applied simplified tillage methods decreased soil density in the studied soil layers compared with the deep plowing (DP). In the studied soil layers, the soil density significantly decreased (by 9.64 to 14.36%) in the shallow cultivation (SC) fields.
A very strong negative and statistically significant (r = −0.932, y = 61.53 34.39x, p < 0.050) linear correlation was found between the soil density and macropores larger than 750 µm in the 0–5 cm soil layer.
A very strong negative and statistically significant (r =−0.913, y = 57.87 − 22.13x, p < 0.050) linear correlation was found between the soil density and the moisture content in the 0–5 cm soil layer when the applied pressure was −30 hPa.
A very strong negative and statistically significant (r = −0.961, y = 3.09 − 3.87x, p < 0.010) linear correlation was found between the soil density and the moisture content in the 15–20 cm soil layer when a pressure of −4 hPa was used.
A very strong negative and statistically significant (r = −0.934, y = 38.47 − 10.35x, p < 0.050) linear correlation was found between the soil density and the moisture content in the 15–20 cm soil layer when a pressure of −100 hPa was applied.

3.5. Soil Water Capacity

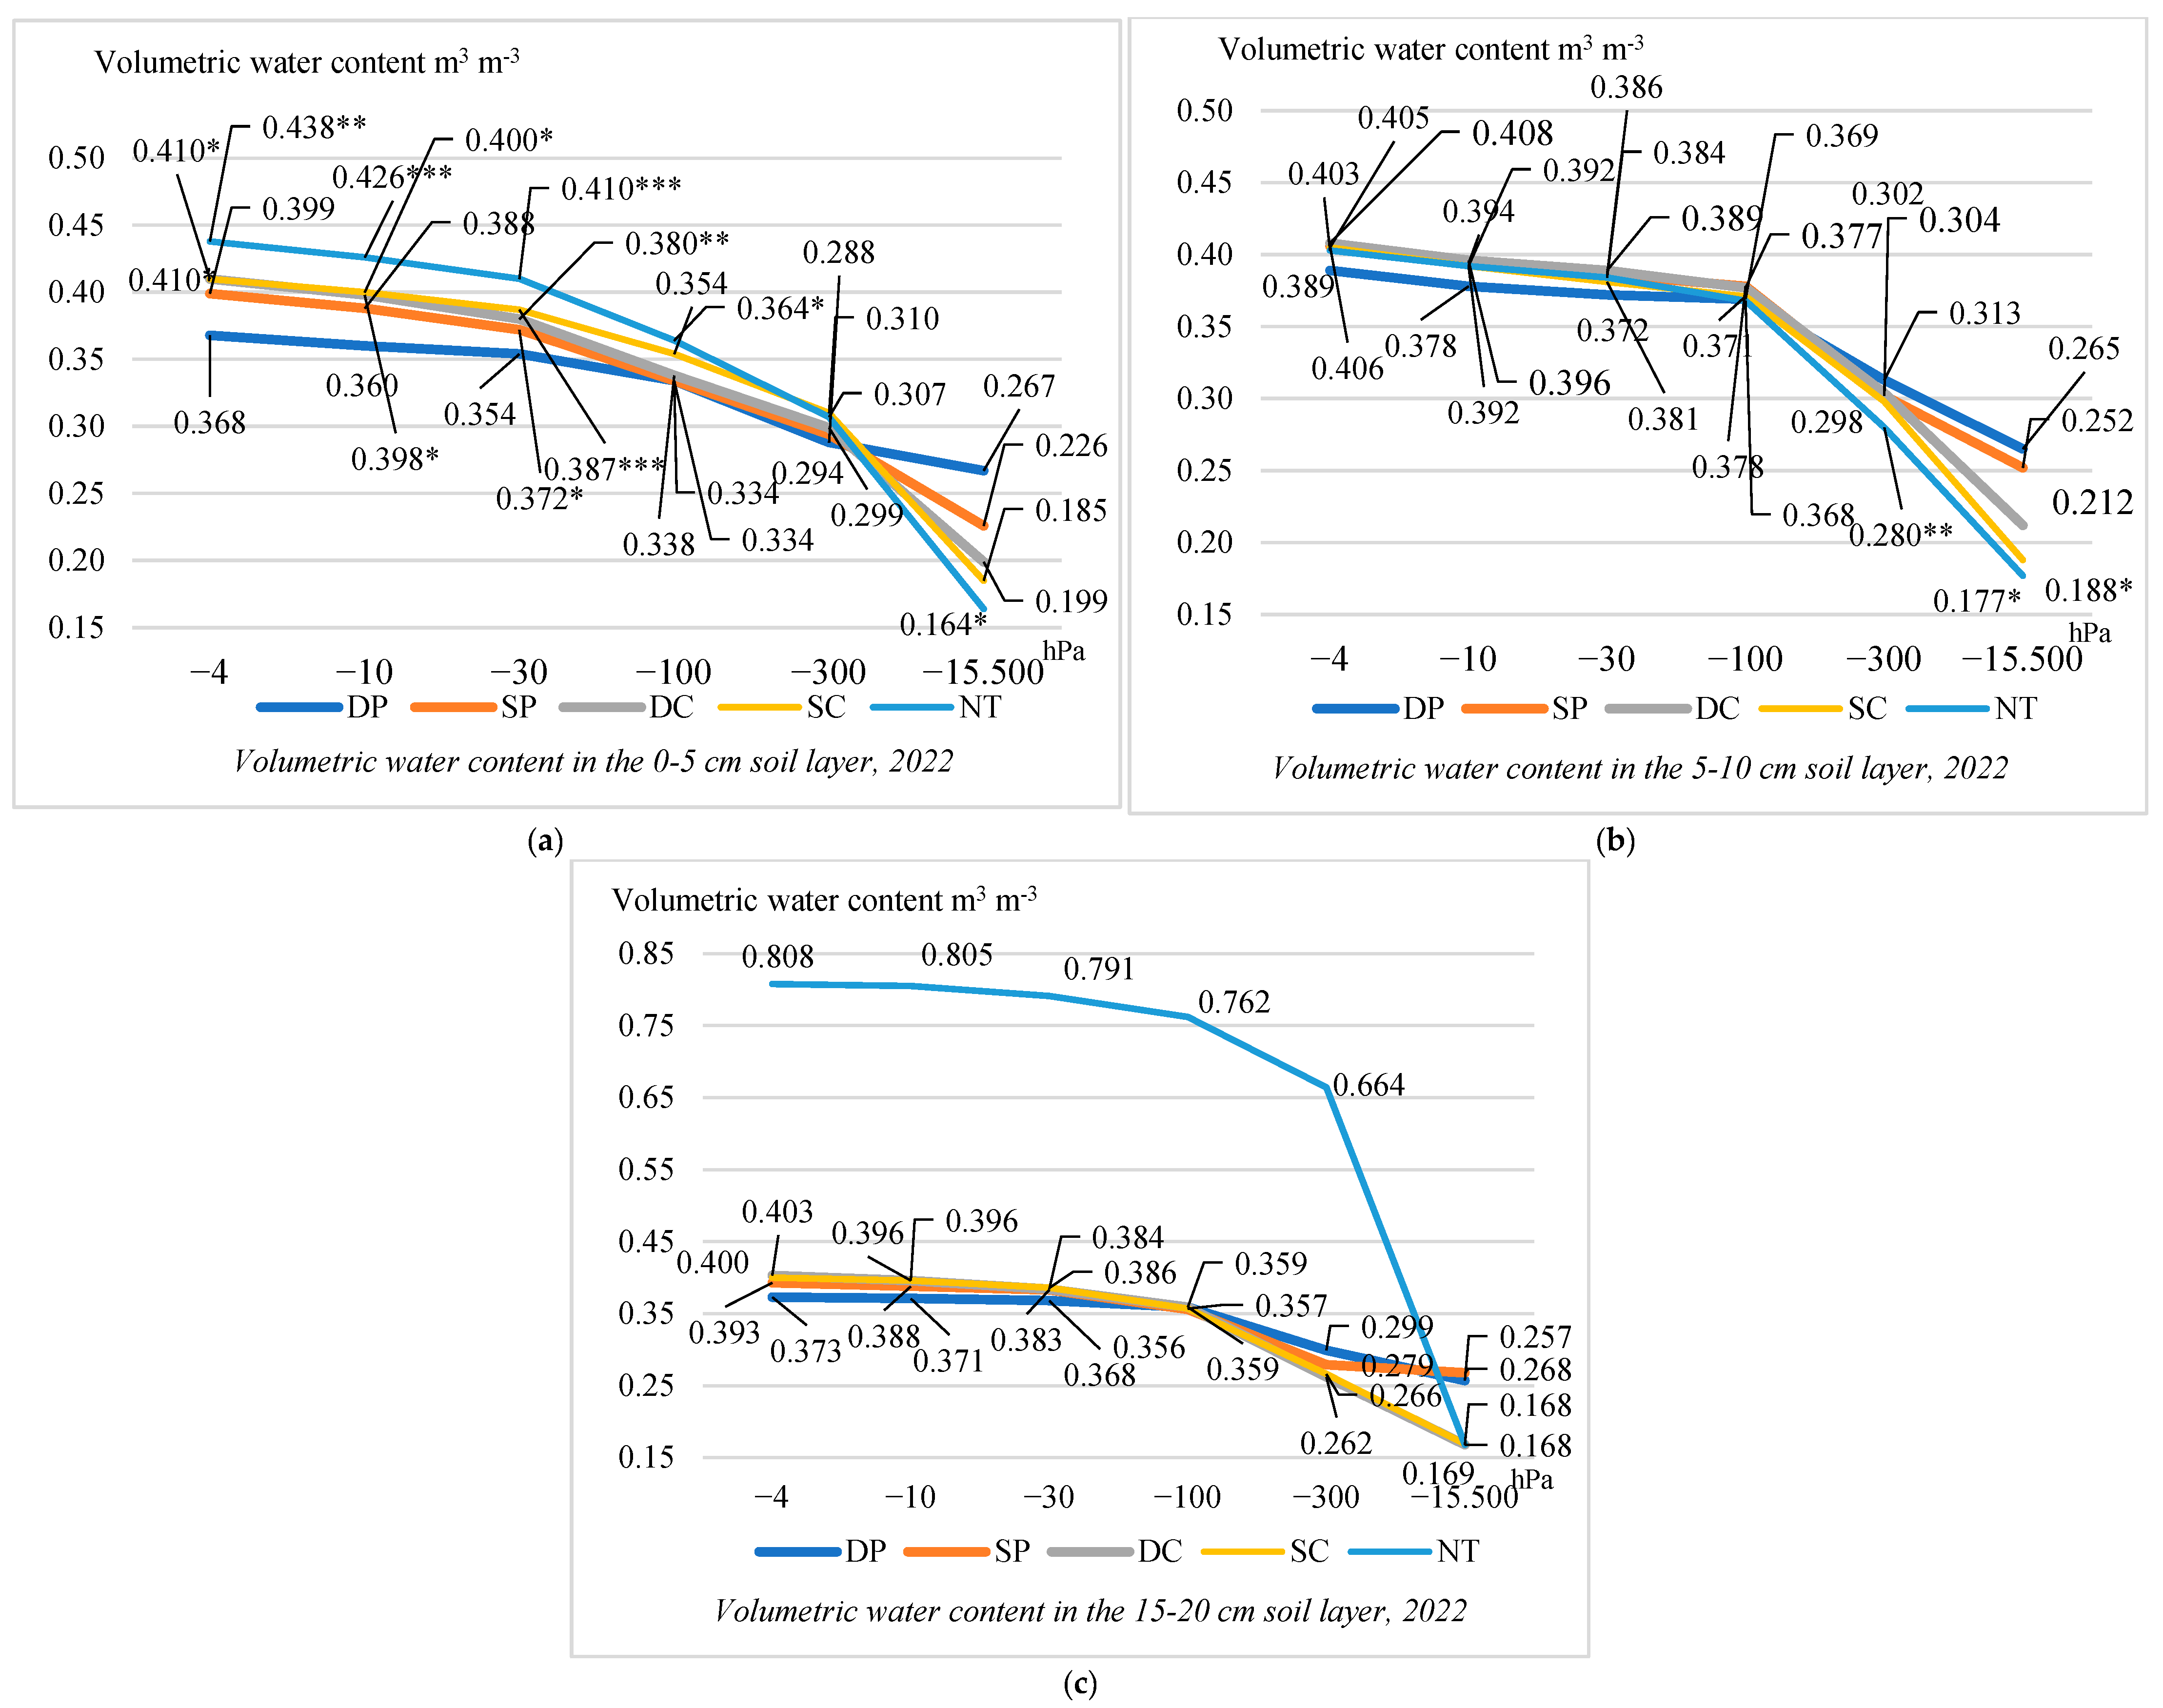
Data from studies conducted in 2022 show that by applying different simplified tillage technologies in the fields, the upper (0–5 cm) studied soil layer better preserved moisture as the pressure increased from −4 to −100 hPa compared with deep-plowed fields (Figure 3a). The applied simplified tillage technologies in the studied soil layer, under a pressure of −30 hPa, significantly increased the soil moisture from 5.08% to 15.82% compared with deep plowing fields (DP). In all fields where simplified tillage technologies were applied using the maximum pressure of −15,500 hPa, the soil moisture content decreased from 15.36% to 38.58% compared with traditional tillage (DP).
A very strong positive and statistically significant (r = 0.917, y = −0.22 + 1.64x, p < 0.050) linear correlation was found between the soil water content and the total porosity in the 0–5 cm cm soil layer when the applied pressure was −4 hPa.
Based on the data from the conducted studies, it can be stated that in all fields where simplified tillage technologies were applied, in the middle (5–10 cm) studied soil layer, as the pressure increased from −4 hPa to −30 hPa, the soil moisture increased from 2.42% to 4.88% compared with deep-plowed fields (Figure 3b). A strong negative and statistically significant correlation was found (r = −0.879, y = 3.60 − 5.33x, p < 0.050) between the soil water capacity and the density in the 5–10 cm soil layer when the pressure was −30 hPa. In all fields where simplified tillage technologies were applied, using the maximum pressures of −300 hPa and −15,500 hPa, the soil moisture content decreased.
In the studied 15–20 cm soil layer, applying pressures from −4 hPa to −30 hPa in shallow plowing (SP), deep cultivation (DC), and shallow cultivation (SC) fields, the soil moisture content increased from 4.07% to 8.04% compared with traditional tillage (DP). In direct-seeded fields, applying pressure from −4 hPa to −300 hPa, a higher moisture content was found, ranging from 2.12 to 2.22 times more.
The data from the conducted studies showed that when applying different simplified tillage technologies in the fields, in the upper (0–5 cm) studied soil layer, as the pressure increased from −4 to −30 hPa, moisture retention improved (from 1.63% to 10.72%) compared with deep-plowed fields (Figure 4a). In no-tillage (NT) fields, soil moisture significantly increased from 8.99% to 11.42% under pressures of −10 hPa and −100 hPa, compared with deep plowing (DP) fields. In all fields where simplified tillage technologies were applied, in the studied soil layer, using the maximum pressure of −15,500 hPa, the soil moisture content decreased from 3.68% to 30.00% compared with traditional tillage (DP).
In all fields where simplified tillage technologies were applied, in the studied middle (5–10 cm) soil layer, using the maximum pressure of −15,500 hPa, the soil moisture content decreased from 10.15% to 27.41% compared with traditional tillage (Figure 4b).
Data from the conducted studies showed that as the pressure increased from −4 hPa to −30 hPa, in the lower (15–20 cm) studied soil layer, all fields where simplified tillage technologies were applied exhibited an increase in soil moisture content ranging from 1.94% to 10.89%, compared with deep-plowed fields (Figure 4c). A significant increase in soil moisture from 7.08% to 10.89% was observed in shallow plowing (SP) and shallow cultivation (SC) fields compared with deep-plowed fields (DP).
A strong negative and statistically significant (r = −0.888, y = 3.26 − 4.38x, p < 0.050), linear correlation was found between soil water content and density in the 15–20 cm soil layer when the applied pressure was −10 hPa.

4. Discussion

Toth et al. [3] note that the no-tillage system and mulching improved soil quality, particularly the amount of soil organic carbon (SOC) and physical soil indicators (e.g., water retention and large pores). The available phosphorus (mg kg−1), available potassium (mg kg−1), total nitrogen (%), and organic carbon (g kg−1) in deep plowing the lowest amounts were determined, when significantly higher amounts of these elements were determined in the no-tillage fields. Our research data were confirmed by Sinkevičius’s results. The researcher claims that in no-tillage fields, higher amounts of available potassium, available phosphorus, total nitrogen, and organic carbon were determined, compared with deep plowing fields [25].
The results of our experiment showed that in no-tillage fields (NT) in all years of the study, the amount of mesopores increased (1.1–1.6 times), and the amount of micropores (<0.2 µm) decreased (1.1–1.6 times) with deep cultivation (DC), shallow cultivation (SC), and no tillage (NT). According to Klopp et al. [26], intensive tillage had negative effects on soil properties compared with conservation tillage systems.
The results of our study showed that in different soil layers, conservation tillage systems had reduced soil density compared with deep tillage. Wang et al. [27] obtained the opposite results and reported that the no-till system significantly increased the soil water content and bulk density at 0–5 cm (1.6%) and 5–10 cm (2.2%) depths, while the soil porosity decreased at 0–5 cm (1.4% and 5–10 cm (2.0%)) compared with conventional tillage.
In 2023, in the soil layers at 0–5 cm and 5–10 cm, we found that deep cultivation (DC) and shallow plowing (SP) increased the amount of mesopores (0.2–30 µm). Sinkevičius found similar results. In a 2019 study by Sinkevičius [25], in the 5–10 cm soil layer, it was found that mesopores increased in all simplified tillage systems compared with deep plowing (DP). Our results in 2022 showed tillage (DC), shallow tillage (SC), and no tillage (NT) increased the amount of macropores (>0.30 µm). Wang et al. [27] found that no tillage increased macropores (>0.25 mm) and improved the soil structure compared with conventional tillage. Our research data confirmed the results of Andruškaitė and Steponavičienė. In a 2020 study by Andruškaitė [28], it was found that the most macropores formed in the no-tillage fields in the 0–5, 5–10, and 15–20 cm soil layers compared with the deep plowing (DP) fields. In a 2013 study by Steponavičienė [29], it was found that in the 15–20 cm soil layer, the highest amount of micropores was in the deep plowing (DP) fields.
The moisture content in the soil indicates the soil’s water capacity. This is the maximum amount of water that is retained in the soil pores, which are divided into capillary and non-capillary [30].
In 2022, our obtained results showed that the lowest soil density was determined in all studied soil layers when applying the no-tillage (NT) system, and in 2023, a decreasing trend of soil density compared with the deep plowing (DP) system was determined. According to Awe et al. [31], experimental data showed that the NT system had significantly (p < 0.05) the lowest degree of soil compaction (87%); the highest soil air capacity (0.104 cm3 cm⁻3), air capacity to total capacity ratio, and porosity (0.261); and better water retention characteristics. Our results confirmed those of Awe et al.’s [31] study results. Applying the no-tillage (NT) system in the studied soil layers (0–5 and 5–10 cm) increased the total porosity of the soil and the amount of soil moisture (−4 to −300 hPa). Similar results were found by Steponavičienė [29] in 2015. in the conducted research, it was found that soil moisture was better preserved in direct seeded fields compared with deep plowed fields. Other researchers found opposite results in which soil water content (θ) was higher under intensive tillage than under a no-till system at a higher soil water matrix potential (Ψ ≥ −3 cm H2O), while the opposite was observed at a lower Ψ (≤−50 cm H2O) location [32].
Canet-Marti et al. [33] showed that the more intensive the tillage, the lower the water content in the soil. Furthermore, tracing winter precipitation minimums in the water within soil profiles indicated deeper water penetration in conventional tillage plots, suggesting a greater water flow rate using conventional tillage compared with other tillage alternatives. Rocco et al. [34] found that applying the no-tillage system improved soil moisture retention at a depth of 0–10 cm; however, NT soils resulted in poorer soil structural quality compared with deep plowing.
All the studied indicators had an influence on spring barley yield. More information is available in our article (according to Sinkevičienė et al. [35]). However, Kauppi et al. [36] conducted an experiment with spring barley and found that the barley grain yield was significantly lower when using the no-tillage (NT) system compared with deep plowing or other simplified tillage methods. Additionally, the reduction in yield increased the N and P balance, indicating a higher risk of nutrient loss. For this reason, the authors argued that ensuring a higher yield was important to mitigate negative effects on the soil. Hofbauer et al. [37] obtained opposite results, stating that shallow tillage compared with deep plowing caused root growth-limiting soil compaction in untilled soil layers up to 6 cm deep and restricted nitrogen uptake until spring. It is likely that both effects led to a significant reduction in winter rye yield.

5. Conclusions

  • In the years 2022–2023, it was determined that in the upper soil layers (0–5 cm and 5–10 cm) of deep tillage plots (DC), the quantity of mesopores (0.2–30 µm) increased. In most cases, the amount of micropores (<0.2 µm) in the studied soil layers decreased, while the amount of macropores (>30 µm) increased when applying simplified tillage systems.
  • In the studied years (2022–2023), comparing reduced intensity tillage systems with deep plowing (DP) technology, it can be stated that in most cases in the examined soil layers, the fields with simplified tillage technologies showed a decrease in soil density and total soil porosity, and water retention capacity (with pressures from −4 to 30 hPa) had a tendency to increase. However, when applying the maximum pressure (15,000 hPa), the opposite trends were observed. In no-tillage (NT) plots, applying different pressures revealed higher soil moisture content compared with deep plowing (DP) plots.
  • Comparing simplified tillage systems with deep plowing (DP), it can be concluded that the no-tillage (NT) technology most significantly improved the studied indicators, while the deep plowing (DP) technology exhibited the poorest results.

Author Contributions

Conceptualization, R.K., I.S., A.S. (Aušra Sinkevičienė), K.J., J.B., A.S. (Augustas Sederevičius) and K.R.; methodology, A.S. (Aušra Sinkevičienė); software, R.K.; formal analysis, A.S. (Aušra Sinkevičienė); investigation, K.J. and J.B.; data curation, A.S. (Aušra Sinkevičienė); writing—original draft preparation, A.S. (Aušra Sinkevičienė) and R.K.; writing—review and editing, K.R.; visualization, I.S. All authors have read and agreed to the published version of the manuscript.

Funding

This article is one of the results of the activities carried out within the project “Development of the Bioeconomy Research Center of Excellence” (BioTEC). This project has received funding from the Ministry of Education, Science and Sports of the Republic of Lithuania and Research Council of Lithuania (LMTLT), Agreement No. S-A-UEI-23-14. The funding program is the “University Excellence Initiative” (No. V-940).

Data Availability Statement

The data presented in this study are available from the corresponding author upon request.

Conflicts of Interest

The authors declare no conflicts of interest.

References

  1. Lal, R. Managing soils for negative feedback to climate change and positive impact on food and nutritional security. Soil Sci. Plant Nutr. 2020, 66, 1–9. [Google Scholar] [CrossRef]
  2. Majeed, M.T. Information and communication technology (ICT) and environmental sustainability in developed and developing countries. Pak. J. Comer. Soc. Sci. 2018, 12, 758–783. [Google Scholar]
  3. Toth, M.; Stumpp, C.; Klik, A.; Strauss, P.; Mehdi-Sculz, B.; Liebhard, G.; Strohmeier, S. Long-term effects of tillage systems on soil health of a silt loam in Lower Austria. Soil Till. Res. 2024, 241, 106120. [Google Scholar] [CrossRef]
  4. Badagliacca, G.; Benítez, E.; Amato, G.; Badalucco, L.; Giambalvo, D.; Laudicina, V.A.; Ruisi, P. Long-term no-tillage application increases soil organic carbon, nitrous oxide emissions and faba bean (Vicia faba L.) yields under rain-fed Mediterranean conditions. Sci. Total Environ. 2018, 639, 350–359. [Google Scholar] [CrossRef]
  5. White, H.J.; León-Sánchez, L.; Burton, V.J.; Cameron, E.K.; Caruso, T.; Cunha, L.; Caplat, P. Methods and approaches to advance soil macroecology. Glob. Ecol. Biogeogr. 2020, 29, 1674–1690. [Google Scholar] [CrossRef]
  6. Jian, J.; Du, X.; Stewart, R.D. Quantifying cover crop effects on soil health and productivity. Data Brief. 2020, 29, 105376. [Google Scholar] [CrossRef]
  7. de Melo, M.L.A.; van Lier, Q.D.J. Revisiting the Feddes reduction function for modeling root water uptake and crop transpiration. J. Hydrol. 2021, 603, 126952. [Google Scholar] [CrossRef]
  8. Jaagus, J.; Aasa, A.; Aniskevich, S.; Boincean, B.; Bojariu, R.; Briede, A.; Zahradniček, P. Long-term changes in drought indices in eastern and central Europe. Int. J. Climatol. 2022, 42, 225–249. [Google Scholar] [CrossRef]
  9. Romaneckas, K.; Pilipavičius, V.; Trečiokas, K.; Šarauskis, E.; Liakas, V. Agronomijos pagrindai: Vadovėlis; Vytautas Magnus University: Kaunas, Lithuania, 2011. [Google Scholar]
  10. Pagliai, M.; Pelegrini, S.; Vignozzi, N.; Rausseva, S.; Grasseli, O. The quantification of the effect of subsoil compaction on soil porosity and related physical properties under conventional to reduced managment practices. Adv. Soil Geoecol. 2000, 32, 305–313. [Google Scholar]
  11. Marasca, I.; Lemos, S.V.; Silva, R.B.; Guerra, S.P.S.; Lancas, K.P. Soil compaction curve of an Oxisol under sugarcane planted after in-row deep tillage. R. Bras. Ci. Solo. 2015, 39, 1490–1497. [Google Scholar] [CrossRef]
  12. Li, J.; Chen, L.; Zhang, C.; Ma, D.; Zhou, G.; Nin, Q.; Zhang, J. Combining rotary and deep tillage increases crop yields by improving the soil physical structure and accumulating organic carbon of subsoil. Soil Till. Res. 2024, 244, 106252. [Google Scholar] [CrossRef]
  13. Luo, L.; Lin, H.; Li, S. Quantification of 3-D soil macropore networks in different soil types and land uses using computed tomography. J. Hydrol. 2010, 393, 53–64. [Google Scholar] [CrossRef]
  14. Munkholm, L.J.; Heck, R.J.; Deen, B.; Zidar, T. Relationship between soil aggregate strength, shape and porosity for soils under different long-term management. Geoderma 2016, 268, 52–59. [Google Scholar] [CrossRef]
  15. World Reference Base for Soil Resources (WRB). International Soil Classification System for Naming Soils and Creating Legends for Soil Maps; Food and Agriculture Organization: Rome, Italy, 2015. [Google Scholar]
  16. Andruškaitė, I. Dirvožemio Tvarumas Didinant Anglies Sankaupų Sluoksniavimąsi Armenyje Skirtingo Žemės Dirbimo Sąlygomis. Ph.D. Thesis, Vytautas Magnus University, Kaunas, Lithuania, 2022. [Google Scholar]
  17. Buragienė, S. Impact of Different Soil Tillage Technologies on the Environment. Ph.D. Thesis, Aleksandras Stulginskis University, Kaunas, Lithuania, 2013. [Google Scholar]
  18. Romaneckas, K.; Adamavičienė, A.; Sinkevičienė, A.; Kimbirauskienė, R.; Bogužas, V.; Šarauskkis, E.; Butkus, V.; Jasinskas, A.; Buragienė, S.; Čekanauskas, S. Influence of five tillage patters on faba bean productivity parameters. In Proceedings of the Proceedings of the 48th International Symposium: Actual Tasks on Agricultural Engineering, Zagreb, Croatia, 2–4 March 2021; pp. 183–190. [Google Scholar]
  19. Klute, A. Water retention: Laboratory methods. In Methods of Soil Analysis: Part 1 Physical and Mineralogical Methods; Wiley: Hoboken, NJ, USA, 1986; Volume 5, pp. 635–662. Available online: https://acsess.onlinelibrary.wiley.com/doi/abs/10.2136/sssabookser5.1.2ed.c26 (accessed on 27 November 2024).
  20. Gijsman, A.J.; Jagtap, S.S.; Jones, J.W. Wading through a swamp of complete confusion: How to choose a method for estimating soil water retention parameters for crop models. Int. J. Agr. 2002, 18, 77–106. [Google Scholar] [CrossRef]
  21. Schjønning, P.; Munkholm, L.J.; Moldrup, P.; Jacobsen, O.H. Modelling soil pore characteristics from measurements of air exchange: The long-term effects of fertilization and crop rotation. Eur. J. Soil Sci. 2002, 53, 331–339. [Google Scholar] [CrossRef]
  22. Kadžiene, G.; Munkholm, L.J.; Mutegi, J.K. Root growth conditions in the topsoil as affected by tillage intensity. Geoderma 2011, 166, 66–73. [Google Scholar] [CrossRef]
  23. SPSS. Instat 10; Statistics I.; SPSS: Chicago, IL, USA, 2000. [Google Scholar]
  24. Raudonius, S. Statistikos taikymas augalų ir pasėlių tyrimuose: Svarbūs klausimai. Zemdirb. Agric. 2017, 104, 377–382. [Google Scholar] [CrossRef]
  25. Sinkevičius, A. Žemės Dirbimo Technologijų Ilgalaikis Poveikis Agroekosistemų Tvarumui. Ph.D. Thesis, Vytautas Magnus University, Kaunas, Lithuania, 2023; p. 54. [Google Scholar]
  26. Klopp, H.W.; Blanco-Canqui, H.; Creech, C.F.; Easterly, A.C. Identifying the best tillage system to maintain soil properties and crop yields after Conservation Reserve Program grassland conversion. Soil Till. Res. 2024, 239, 106060. [Google Scholar] [CrossRef]
  27. Wang, Y.; Zou, L.; Lou, C.; Geng, X.; Zhang, S.; Chen, X.; Zhang, Y.; Huang, D.; Liang, A. No-tillage with straw retention influenced maize root growth morphology by changing soil physical properties and aggregate structure in Northeast China: A ten-year field experiment. Geoderma Reg. 2024, 38, 840. [Google Scholar] [CrossRef]
  28. Andruškaitė, I.; Bogužas, V. Impact of tillage intensity with vertical soil stratification on soil physical quality indexes. In Proceedings of the AgroEco 2020: 3rd International Scientific Virtual Conference: Agroecosystem Sustainability: Links between Carbon Sequestration in Soils, Food Security and Climate Change, Kaunas, Lithuania, 2–3 December 2020; Vytautas Magnus University Agriculture Academy: Kaunas, Lithuania, 2020. [Google Scholar]
  29. Steponavičienė, V. Agroekosistemų Tvarumas ir Anglies Sankaupos Dirvožemyje Taikant Ilgalaikes Kompleksines Priemones. Ph.D. Thesis, Vytautas Magnus University, Kaunas, Lithuania, 2017; p. 145. [Google Scholar]
  30. Phogat, V.; Petrie, P.R.; Collins, C.; Bonada, M. Plant-available water capacity of soils at a regional scale: Analysis of fixed and dynamic field capacities. Pedosphere 2024, 34, 590–605. [Google Scholar] [CrossRef]
  31. Awe, G.O.; Fontanela, G.; Reichert, J.M. Degree of compaction, aeration, and soil water retention indices of a sugarcane field without soil disturbance after initial tillage. Can. J. Soil Sci. 2023, 104, 91–107. [Google Scholar] [CrossRef]
  32. Talukder, R.; Plaza-Bonilla, D.; Cantero-Martinez, C.; Wendroth, O.; Lampurlanes, J. Soil hydraulic properties and pore dynamics under different tillage and irrigated crop sequences. Geoderma 2023, 430, 116293. [Google Scholar] [CrossRef]
  33. Canet-Marti, A.; Morales-Santos, A.; Nolz, R.; Langergraber, G.; Stumpp, C. Quantification of water fluxes and soil water balance in agricultural fields under different tillage and irrigation systems using water stable isotopes. Soil Till. Ress. 2024, 231, 105732. [Google Scholar] [CrossRef]
  34. Rocco, S.; Munkholm, L.J.; Jensen, J.L. Long-term soil quality and C stock effects of tillage and cover cropping in a conservation agriculture system. Soil Till. Res. 2024, 241, 106129. [Google Scholar] [CrossRef]
  35. Sinkevičienė, A.; Romaneckas, K.; Jackevičienė, K.; Petrikaitė, T.; Balandaitė, B.; Kimbirauskienė, R. Long-term effect of tillage systems on planosol physical properties, CO2 emissions and spring barley productivity. Land J. 2024, 13, 1289. [Google Scholar] [CrossRef]
  36. Kauppi, K.; Kaseva, J.; Jalli, M.; Palojarvi, A.; Alakukku, L. Long-term nitrogen and phosphorus balances for spring barley (Hordeum vulgare L.) cultivation as affected by primary tillage of a Nordic clay soil. Eur. J. Agron. 2024, 155, 127131. [Google Scholar] [CrossRef]
  37. Hofbauer, M.; Bloch, R.; Bachinger, J.; Gerke, H.H. Effects of shallow non-inversion tillage on sandy loam soil properties and winter rye yield in organic farming. Soil Till. Res. 2022, 222, 105435. [Google Scholar] [CrossRef]
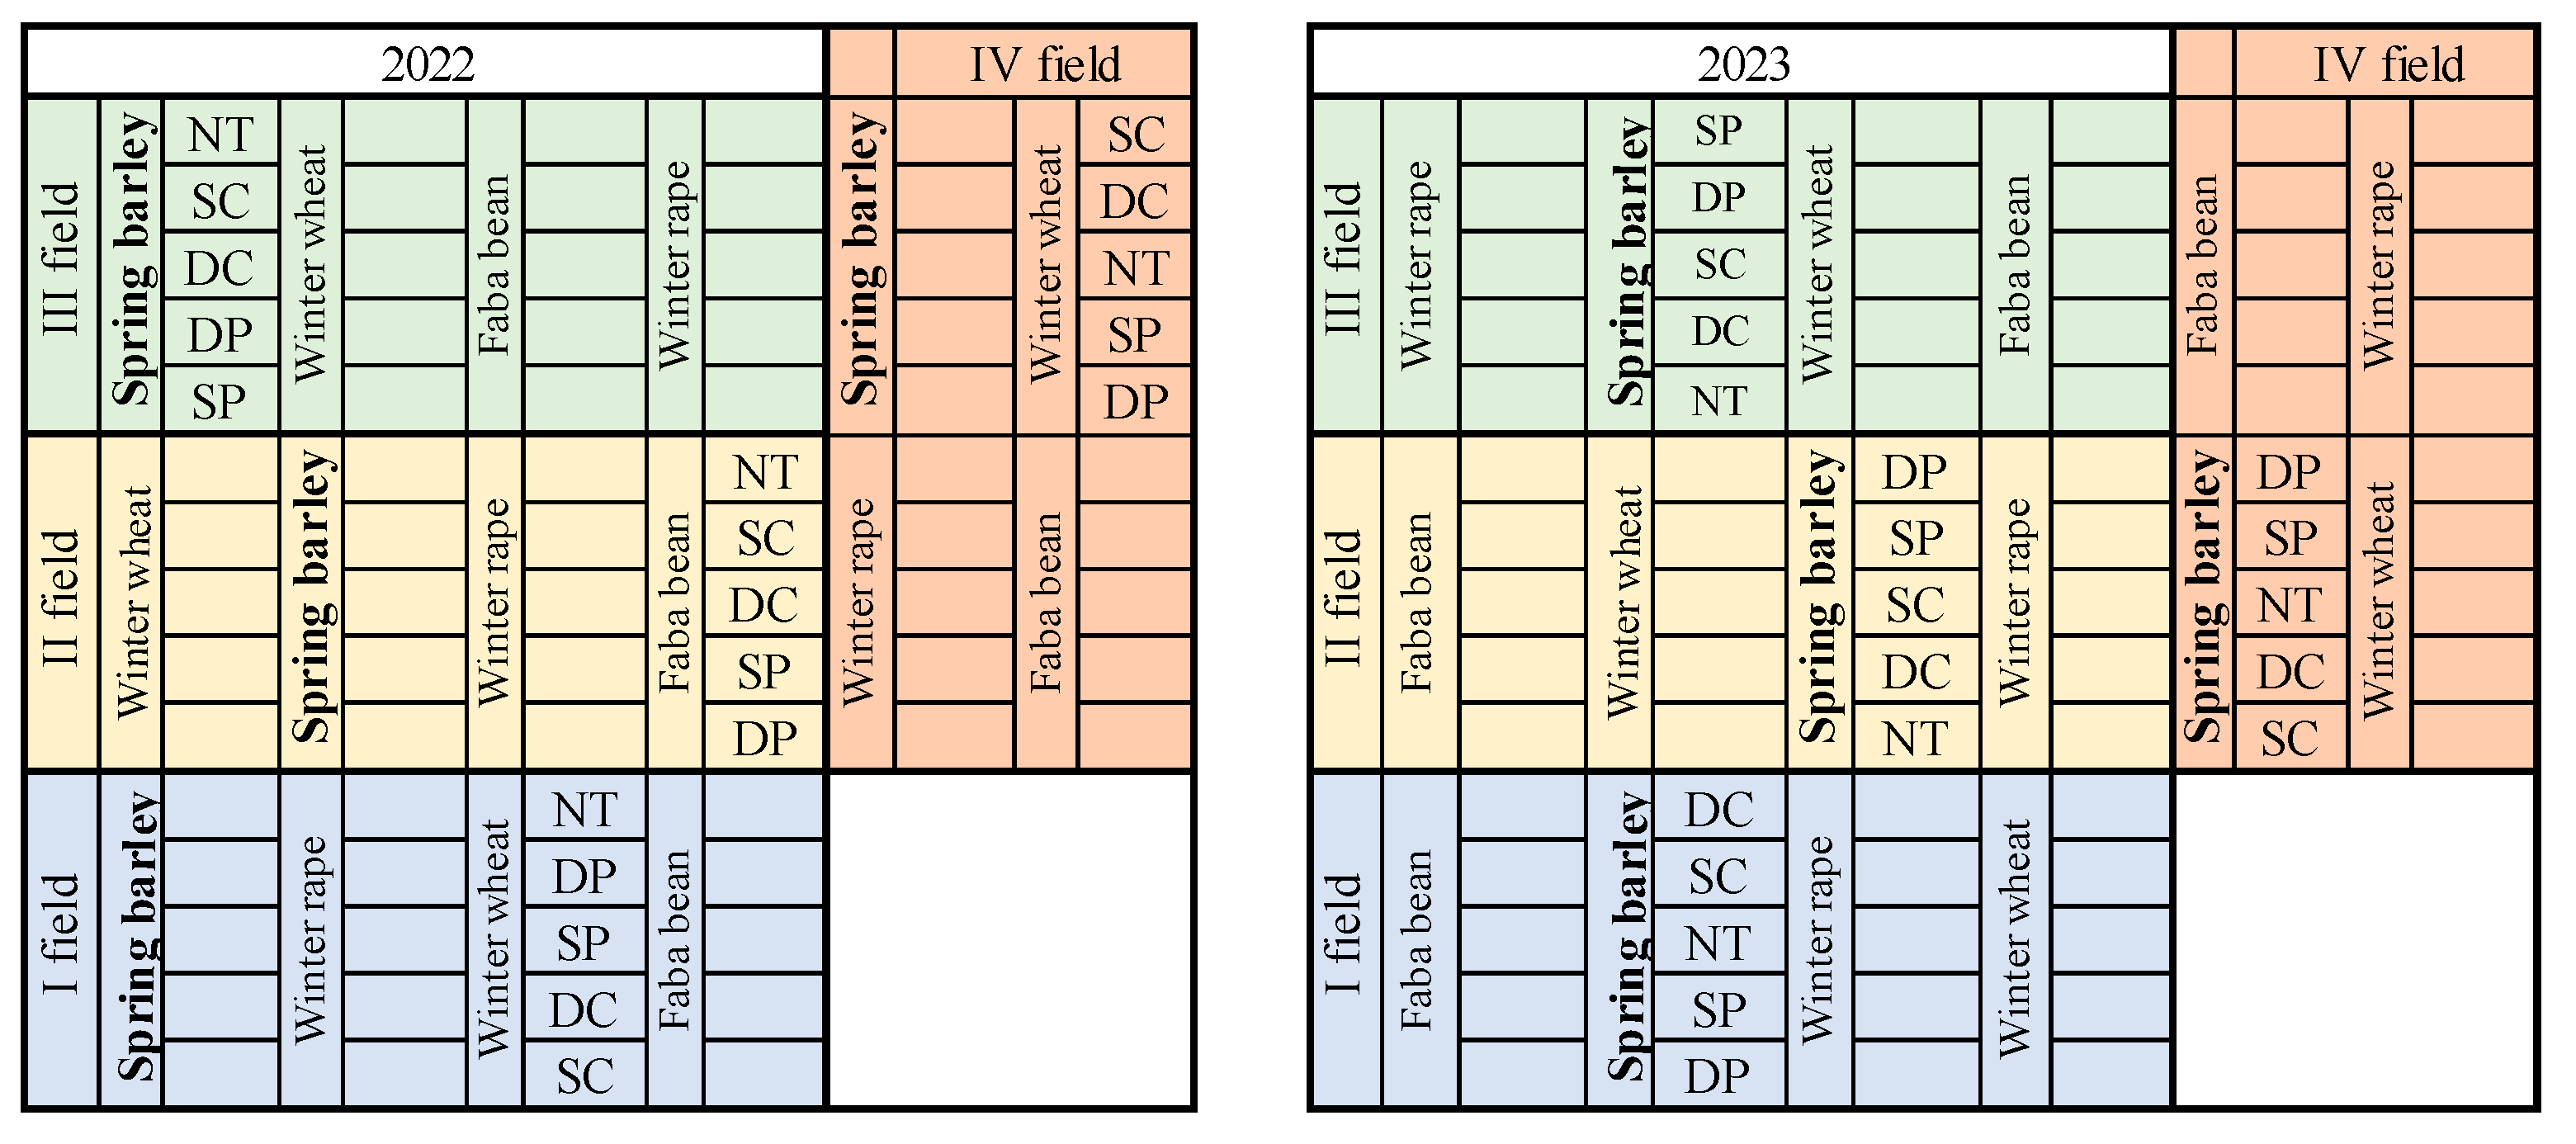
Figure 1. The experiment plan of spring barley crop rotation (in 2022–2023). Note: NT, no tillage; SC, shallow plowing; DC, deep cultivation; DP, deep plowing; SP, shallow plowing.
Land 13 02198 g001
Figure 2. (ac) Soil pore distribution (amount of micropores, mesopores, and macropores as a percentage of total porosity) applying different tillage in the spring barley crop. Note: confidence levels of significant difference: * p ≤ 0.050; ** p ≤ 0.010. Factor: 1. deep plowing, 22–25 cm depth (DP) (control—comparable variant); 2. shallow plowing, 12–15 cm depth (SP); 3. deep cultivation (chisel cultivator), 25–30 cm depth (DC); 4. shallow cultivation (chisel cultivator), 10–12 cm depth (SC); 5. no tillage (NT).
Land 13 02198 g002aLand 13 02198 g002b
Figure 3. (ac) Soil water retention capacity different tillage in spring barley crop at different soil depths (2022) Notes. A confidence level of significant difference: * p ≤ 0.050; ** p ≤ 0.010; *** p ≤ 0.001. Factor: 1. deep plowing, 22–25 cm depth (DP) (control—comparable variant); 2. shallow plowing, 12–15 cm depth (SP); 3. deep cultivation (chisel cultivator), 25–30 cm depth (DC); 4. shallow cultivation (chisel cultivator), 10–12 cm depth (SC); 5. no tillage (NT).
Land 13 02198 g003
Figure 4. (ac) Soil water retention capacity different tillage in spring barley crop at different soil depths (2023) Notes: confidence levels of significant difference: * p ≤ 0.050; ** p ≤ 0.010. Factor: 1. deep plowing, 22–25 cm depth (DP) (control—comparable variant); 2. shallow plowing, 12–15 cm depth (SP); 3. deep cultivation (chisel cultivator), 25–30 cm depth (DC); 4. shallow cultivation (chisel cultivator), 10–12 cm depth (SC); 5. no tillage (NT).
Land 13 02198 g004
Table 1. Tillage practice in the experiment (according to Romaneckas et al. [18]).
Tillage SystemStubble TillagePrimary TillageImplementDepth of Tillage (cm)
Deep plowingYesInversionMoldboard plow22–25
Shallow plowingYesInversionMoldboard plow12–15
Deep cultivationYesNon-inversionChisel cultivator25–30
Shallow cultivationYes, twiceNoChisel cultivator10–12
No tillageNoNoNone0
Table 2. The 24 h average air temperatures during spring barley growing seasons, Kaunas Meteorological Station.
Year/MonthMayJuneJulyAugust
202211.017.718.020.8
202312.617.317.920.2
Long-term (1974–2023) average13.216.118.717.3
Table 3. Precipitation (mm) during spring barley growing seasons, Kaunas Meteorological Station.
Year/MonthMayJuneJulyAugust
202284.077.6100.538.7
202314.364.036.896.2
Long-term (1974–2023) average61.776.996.688.9
Table 4. Effect of different tillage on soil pore size distribution 0–5 cm, μm.
Soil Pores,
μm
YearsTillage System
Deep Plowing (DP)Shallow Plowing (SP)Deep Cultivation (DC)Shallow Cultivation (SC)No Tillage (NT)
Macropores (>30 µm)
>75020220.0320.0340.0490.0260.040
20230.0570.0880.0860.1410.104
300–75020220.0080.0110.0150.0100.011
20230.0030.0110.0130.0230.009
100–30020220.0050.0160.0240.0130.017
20230.0040.0370.0140.0570.013
30–10020220.0250.0380.0480.0330.045
20230.0390.0470.0870.0860.027
Mesopores (0.2–30 µm)
10–3020220.0440.0400.0380.0440.056
20230.1360.1190.1980.1570.157
0.2–1020220.0870.0680.1290.1250.143
20230.2790.3830.2310.2600.306
Micropores (<0.2 µm)
<0.220220.2080.2260.1700.1850.156
20230.4780.3020.3730.296 *0.414
Note: confidence level of significant difference: * p ≤ 0.050. Factor: 1. deep plowing, 22–25 cm depth (DP) (control—comparable variant); 2. shallow plowing, 12–15 cm depth (SP); 3. deep cultivation (chisel cultivator), 25–30 cm depth (DC); 4. shallow cultivation (chisel cultivator), 10–12 cm depth (SC); 5. no tillage (NT).
Table 5. Effects of different tillage on soil pore size distribution 5–10 cm, μm.
Soil Pores,
μm
YearsTillage System
Deep Plowing (DP)Shallow Plowing (SP)Deep Cultivation (DC)Shallow Cultivation (SC)No Tillage (NT)
Macropores (>30 µm)
>75020220.0130.0130.0180.0140.020
20230.0130.0030.0320.0940.046
300–75020220.0140.0130.0140.0130.010
20230.0050.0010.0030.0140.006
100–30020220.0070.0070.009 ***0.012 ***0.008
20230.0100.0070.0000.0310.024
30–10020220.0250.0380.0480.0330.045
20230.0180.0160.0180.0900.071
Mesopores (0.2–30 µm)
10–3020220.0640.0720.0720.0730.089
20230.1200.1320.1640.1830.141
0.2–1020220.0500.0540.1170.1100.096
20230.3050.495*0.3240.2310.278
Micropores (<0.2 µm)
<0.220220.2580.2520.187 *0.1880.183 *
20230.5230.3010.4370.3560.434
Note: confidence levels of significant difference: * p ≤ 0.050; *** p ≤ 0.001. Factor: 1. deep plowing, 22–25 cm depth (DP) (control—comparable variant); 2. shallow plowing, 12–15 cm depth (SP); 3. deep cultivation (chisel cultivator), 25–30 cm depth (DC); 4. shallow cultivation (chisel cultivator), 10–12 cm depth (SC); 5. no tillage (NT).
Table 6. Effect of different tillage on soil pore size distribution 15–20 cm, μm.
Soil Pores,
μm
YearsTillage System
Deep Plowing (DP)Shallow Plowing (SP)Deep Cultivation (DC)Shallow Cultivation (SC)No Tillage (NT)
Macropores (>30 µm)
>75020220.0180.0270.0220.031*0.024
20230,0350.0390.0280.0790.037
300–75020220.0040.0060.0060.0040.003
20230.0030.0050.0060.0080.015
100–30020220.0030.0040.012 ***0.009 *0.018 ***
20230.0120.0420.0060.0420.063
30–10020220.0070.029 ***0.025 ***0.029 ***0.030 ***
20230.0080.0370.0650.0750.039
Mesopores (0.2–30 µm)
10–3020220.0610.0600.097 *0.092 *0.091 *
20230.1120.1780.2700.1940.217
0.2–1020220.0740.0540.0940.0970.031
20230.3900.3000.2170.2440.237
Micropores (<0.2 µm)
<0.220220.2570.2680.1680.1750.168
20230.4370.3960.3980.3570.390
Note: confidence levels of significant difference: * p ≤ 0.050; *** p ≤ 0.00. Factor: 1. deep plowing, 22–25 cm depth (DP) (control—comparable variant); 2. shallow plowing, 12–15 cm depth (SP); 3. deep cultivation (chisel cultivator), 25–30 cm depth (DC); 4. shallow cultivation (chisel cultivator), 10–12 cm depth (SC); 5. no tillage (NT).
Table 7. The effect of tillage system on soil total porosity (2022–2023).
Tillage SystemSoil Layer, cmTotal Porosity, m3 m−3
20222023
Deep plowing (DP)0–50.4090.390
5–100.4140.370
15–200.4250.377
Shallow plowing (SP)0–50.4330.427
5–100.4210.395
15–200.4470.405
Deep cultivation (DC)0–50.474 *0.433
5–100.4290.377
15–200.4250.393
Shallow cultivation (SC)0–50.4360.473
5–100.4190.450
15–200.4380.433
No tillage (NT)0–50.477 *0.440
5–100.4210.410
15–200.3650.400
Note: confidence level of significant difference: * p ≤ 0.050. Factor: 1. deep plowing, 22–25 cm depth (DP) (control—comparable variant); 2. shallow plowing, 12–15 cm depth (SP); 3. deep cultivation (chisel cultivator), 25–30 cm depth (DC); 4. shallow cultivation (chisel cultivator), 10–12 cm depth (SC); 5. no tillage (NT).
Table 8. The influence of tillage intensity on soil bulk density (2022–2023).
Tillage SystemLayer, cmDensity, Mg m−3
20222023
Deep plowing (DP)0–51.6041.623
5–101.6021.673
15–201.6241.660
Shallow plowing (SP)0–51.5031.520
5–101.5421.625
15–201.5341.585
Deep cultivation (DC)0–51.6071.497
5–101.6931.657
15–201.5251.607
Shallow cultivation (SC)0–51.4941.390 *
5–101.5381.460 **
15–201.6121.500 **
No tillage (NT)0–51.3831.533
5–101.5341.563
15–201.1151.600
Note: confidence levels of significant difference: * p ≤ 0.050; ** p ≤ 0.010. Factor: 1. deep plowing, 22–25 cm depth (DP) (control—comparable variant); 2. shallow plowing, 12–15 cm depth (SP); 3. deep cultivation (chisel cultivator), 25–30 cm depth (DC); 4. shallow cultivation (chisel cultivator), 10–12 cm depth (SC); 5. no tillage (NT).
Disclaimer/Publisher’s Note: The statements, opinions and data contained in all publications are solely those of the individual author(s) and contributor(s) and not of MDPI and/or the editor(s). MDPI and/or the editor(s) disclaim responsibility for any injury to people or property resulting from any ideas, methods, instructions or products referred to in the content.