Abstract
China’s rural population flowing into highly urbanized areas has led to the spatial reconstruction of urban–rural land use. Exploring the laws and trends of urban–rural land use in highly urbanized areas is of great significance in promoting rural transformation. This paper takes the southern Jiangsu region as a research area and uses a system dynamics (SD) model to simulate the demand for different land types based on economic, social, policy, and environmental (ESPE) factors. Future land use simulation (FLUS) is used to simulate the spatial evolution trend of urban–rural land use based on point–axis elements. The results show that the agricultural production space is severely squeezed by the urban living space. Under the scenario of rapid expansion, the decrease in arable land quantity and the demand area for rural residential areas are the largest. Under the scenario of high-quality development, the decrease in arable land area and the demand for land in rural residential areas are lowest. Based on the spatial simulation, it is reported that the areas with more intense land use spatial reconstruction in the three scenarios are mainly concentrated in the region’s urban–rural border areas. The future evolution of urban–rural land is summarized into three models: (1) single-center-driving expansion, (2) patchy expansion near the city center, and (3) multi-center-driving expansion. This paper proposes targeted policy recommendations to provide a scientific reference for solving the conflict between urban and rural land use.
1. Introduction
Over the past 40 years of China’s reform and opening, urbanization and industrialization have entered a stage of rapid development. The development of urbanization has seriously changed the original development trajectory of rural areas [1,2]. By the end of 2022, China’s urbanization rate had reached 65.22%, especially in the southern Jiangsu region, where the urbanization level has exceeded 80%. Under the backdrop of rapid urbanization, there are serious problems with land use, which has become an important factor affecting social stability in China. The leasing of construction land can realize great benefits in a short period of time. When faced with huge fiscal deficit pressure, local governments are more inclined to reverse the financial pressure in the short term [3]. Therefore, the rapid expansion of urban construction land in suburban areas has squeezed the development space of rural land. Examples include the non-agriculturalization of cultivated land and the deterioration of the ecological environment of cultivated land. Scientific predictions and the rational planning of land spatial development and utilization are effective means of implementing land resource management. Simulating the spatial patterns of urban–rural land use types in different scenarios can provide a reference basis for rural transformation and development.
Land use cover change (LUCC) is the foundation of resource, environmental, and ecological research and scientific management. Essentially, LUCC provides important background data for land resource planning [4,5,6]. The study of simulating land use changes plays a significant role in revealing the impact of human activities on regional ecological environment change. Such research can also provide support for land management decisions [7,8]. The most important content of LUCC research is land use spatial simulation. Through a relevant driving factor set, the spatial distribution of land use is obtained, which helps to analyze characteristics and hotspots of spatial change. Currently, there are few studies that examine land use spatial simulation in highly urbanized areas. There is also a scarcity of research on seeking policy recommendations for urban–rural transformation in highly urbanized areas. Scholars at home and abroad have achieved fruitful results in simulating and predicting land use change, but these studies have been used to serve the decision-making pertaining to national or regional socioeconomic development. The simulation types are mainly divided into three types: land quantity prediction, land spatial distribution prediction, and comprehensive prediction.
Land quantity simulation models can predict various types of future land use areas based on the current land use status and socioeconomic factors. The most typical prediction models currently include the grey prediction model GM (1,1), multiple regression model, Markov model, and SD simulation model [9,10,11,12]. These prediction models can be combined with man–land relationship theory to predict changes in land quantity in a certain region. The disadvantage of such models is that they can only predict the quantity of land types within specific boundaries, such as administrative boundaries (e.g., provinces, cities, and counties); they cannot predict the spatial distribution of land use. On the contrary, the land spatial distribution prediction model simulates the development of land types in the future. Such a model can simulate the spatial distribution of land use at the micro level; the simulation results also have good spatiotemporal dynamics. However, the land spatial distribution prediction model lacks macro constraints on regional socioeconomic and population development. Moreover, previous studies on land use spatial prediction were mostly based on one or two periods of historical land use spatial data for prediction. In addition, the selection of sample data in previous periods was subjective. The classic models include cellular automata simulation (CA), multi-agent simulation (MAS), and the CLUE-S model, PLUS model, and FLUS model [13,14,15,16,17]. The comprehensive prediction model adopts the method of combining the land quantity prediction model with the land spatial prediction model; the aim is to overcome the inherent limitations of a single model. The FLUS model demonstrates strong simulation capabilities in diverse fields such as urban development planning, land change simulation, and ecological risk prediction. This model has been widely applied at global and regional scales [18,19]. Currently, the SD model is an effective way of simulating future regional land demand, incorporating variables of socioeconomic-influencing factors. The FLUS model, with the advantages of simulating urban development planning, land use change, and ecological risk prediction, is considered to have excellent performance. Thus, the FLUS model can be combined with system dynamics (SD) models to carry out high-resolution, long-term, and high-precision land spatiotemporal change simulations.
The southern region of Jiangsu is located in a highly urbanized area in China. Here, the mechanism of the factors of social and economic transformation is more complex, as well as the spatial reconstruction of land use. Exploring the spatial evolution of land use in typical cities in the southern region of Jiangsu has practical significance. Firstly, this study predicts the land demand in 2035 based on a set of “economic-social-policy-environment” (ESPE) factors. According to different ESPE development situations, inertia development scenarios, high-quality development scenarios, and rapid expansion scenarios are set up. Secondly, combining land demand simulated by the SD, the spatial reconstruction characteristics of land use in 2035 are simulated using the “point–axis” factor. Finally, typical regions are selected for analysis, and targeted recommendations are provided. The contribution of this study mainly includes two aspects: (1) the research work is conducive to exploring mechanisms and methods to alleviate urban–rural land use conflicts in highly urbanized areas; (2) the use of a model combining SD and FLUS for analysis enriches the research methods of land use simulation. Additionally, one of the key issues addressed in the SD-FLUS model is the rational selection of multidimensional indicators and the construction of their relationship with changes in land quantity.
2. Theoretical Framework, Materials, and Methods
2.1. Theoretical Framework
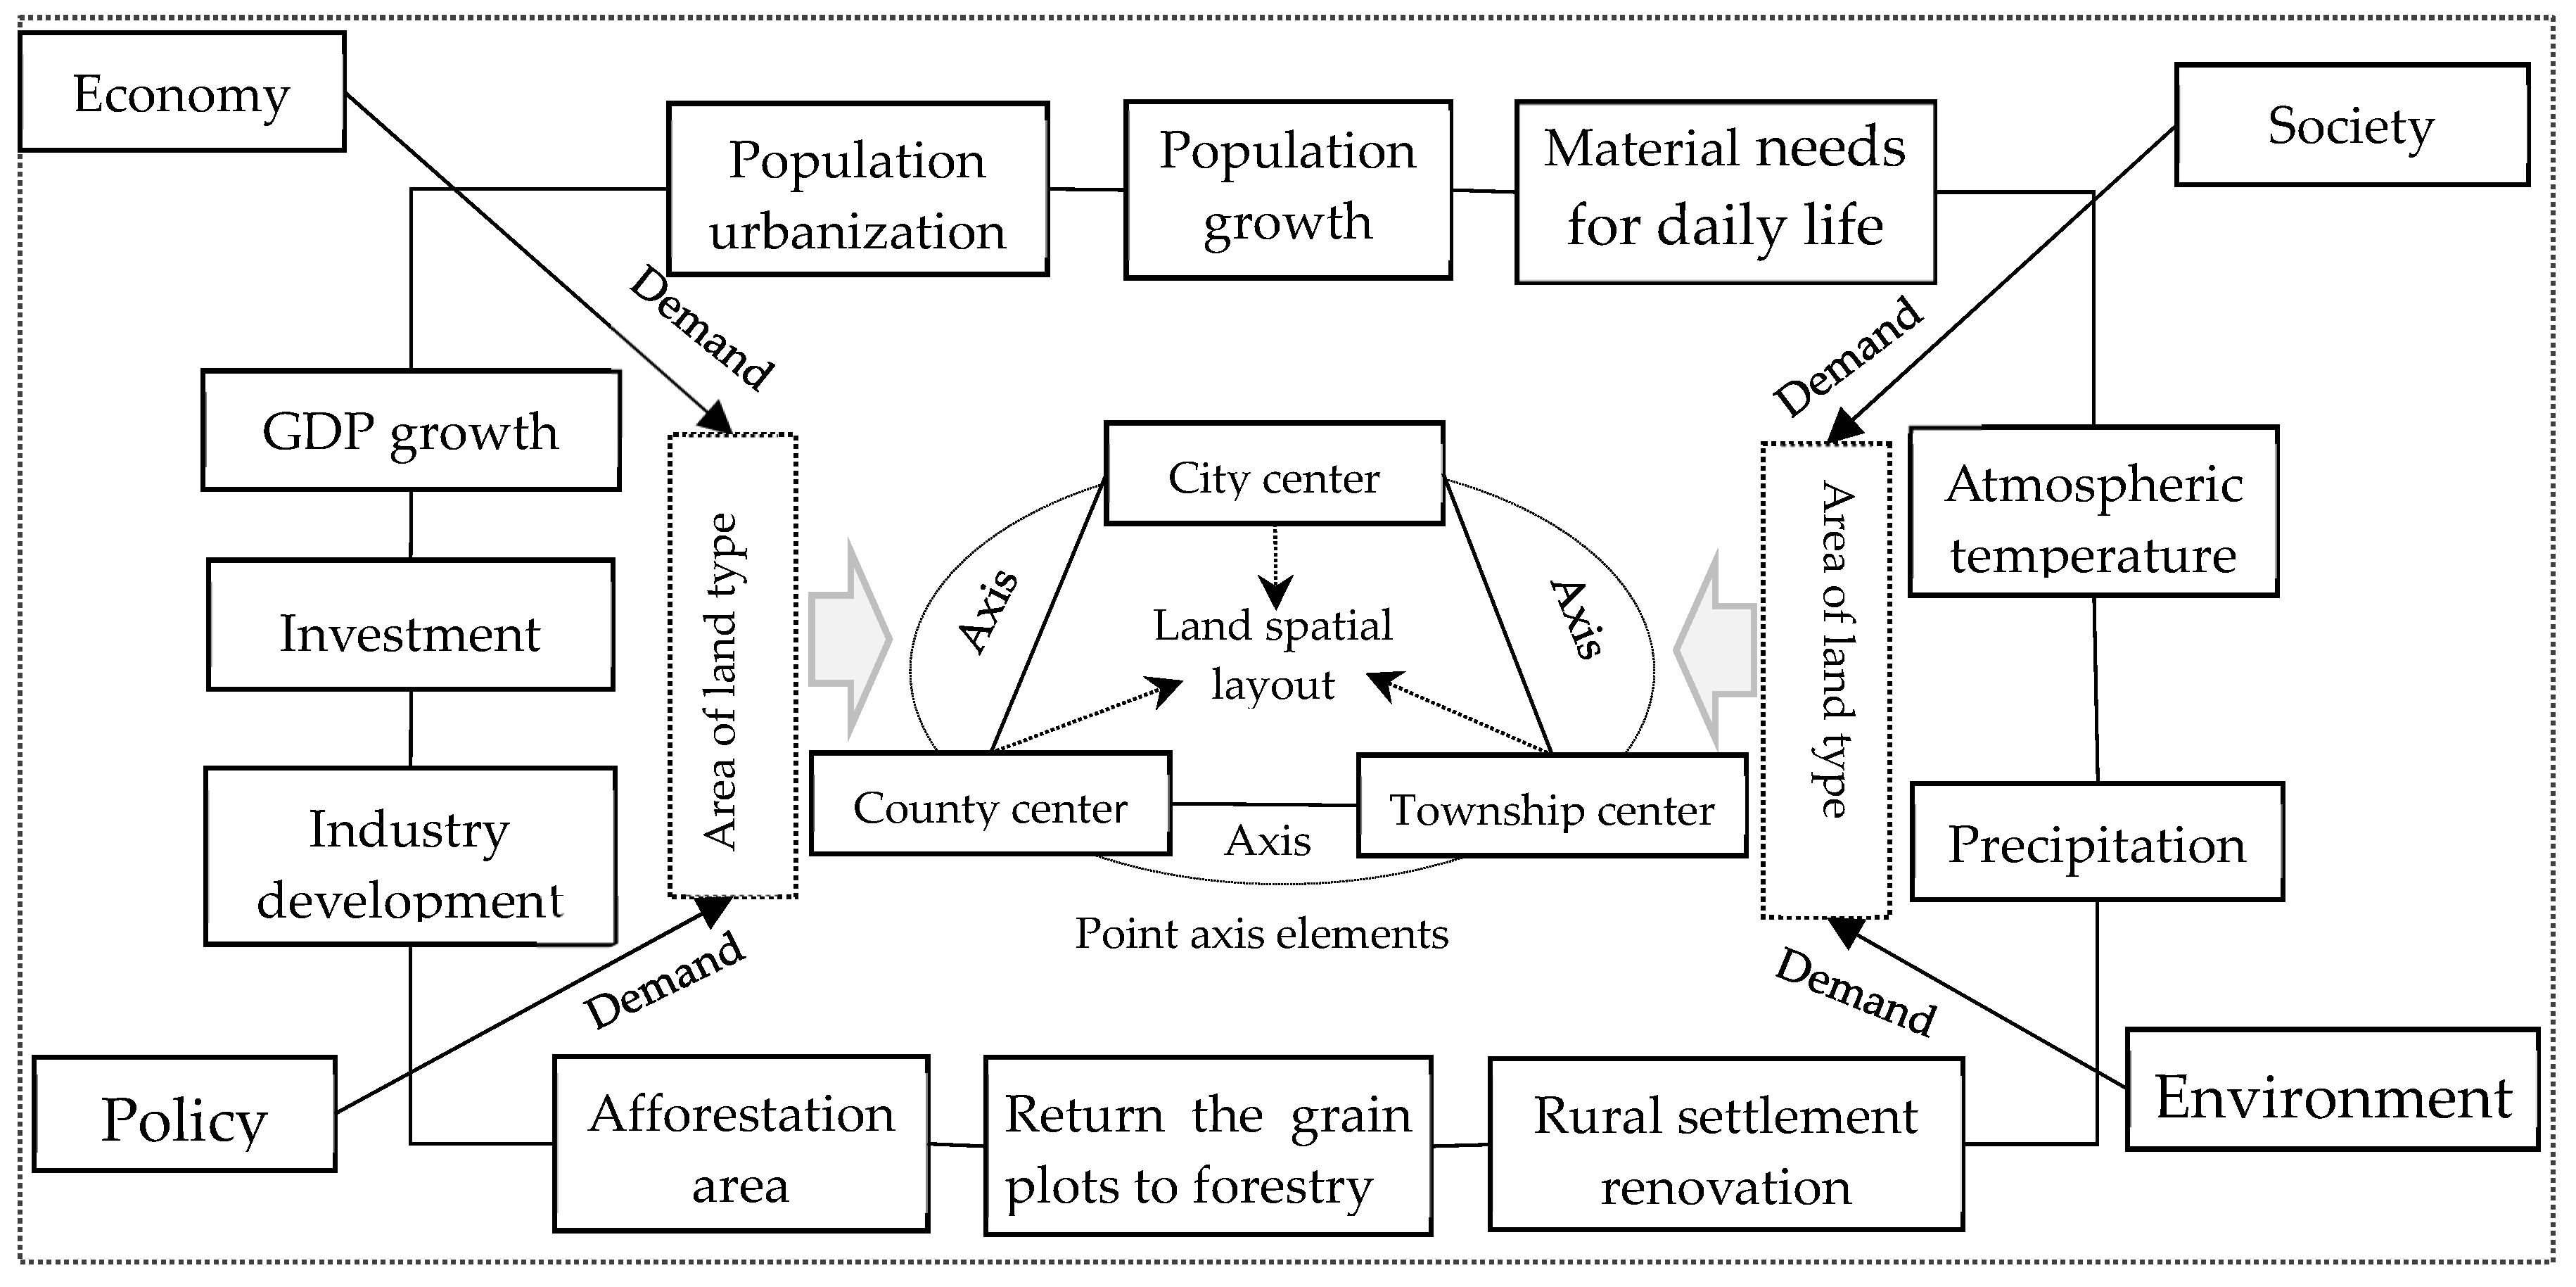
Most of the research above on the factors influencing land use change focuses on the economy, society, policy, and environment. Based on this, a theoretical framework is constructed, as shown in Figure 1. The changes in land elements cannot be separated from the driving force of economic factors. Due to the development of the urban economy, the agglomeration of production scale has led to the expansion of urban boundaries. Moreover, the investment in fixed assets is becoming increasingly active, which increases the demand for construction land [20,21]. With the transfer of labor from the primary industry to the secondary and tertiary industries, more agricultural land has also been converted into non-agricultural construction land. For social factors, population change is the main cause of land use change. In the process of urbanization, people’s various material needs for daily life form various construction land demands such as production space, public facility land, and infrastructure land. Land use changes will ultimately be based on policy systems. The relevant departments have implemented measures such as returning farmland to forests and renovating rural residential areas to meet regional planning goals. Climate change will affect vegetation growth and agricultural production, and natural factors determine the material basis of different land uses.
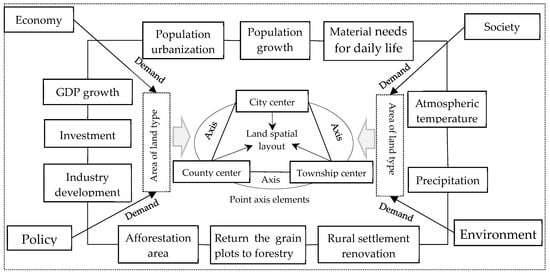
Figure 1.
Theoretical framework.
Factors such as economy, society, policy, and environment can have a direct impact on the quantity of land use. However, the spatial changes in different land use types tend to be based more on point and axis elements. The point–axis development mode basically conforms to the objective laws of productivity spatial motion. The economic center is always first concentrated in a few areas with better conditions, such as the central areas of cities, counties, and townships. Due to the exchange of production factors requiring transportation routes and water supply lines, points are connected to form an axis. The development of a social economy is often arranged according to the point–axis development model, and land resources are an important carrier of the point–axis system. The axis elements in the southern Jiangsu region are dense, mainly including highways, railways, pilot roads, and rivers. Point–axis elements are important factors in the spatial layout of land use.
2.2. Overview of the Study Area
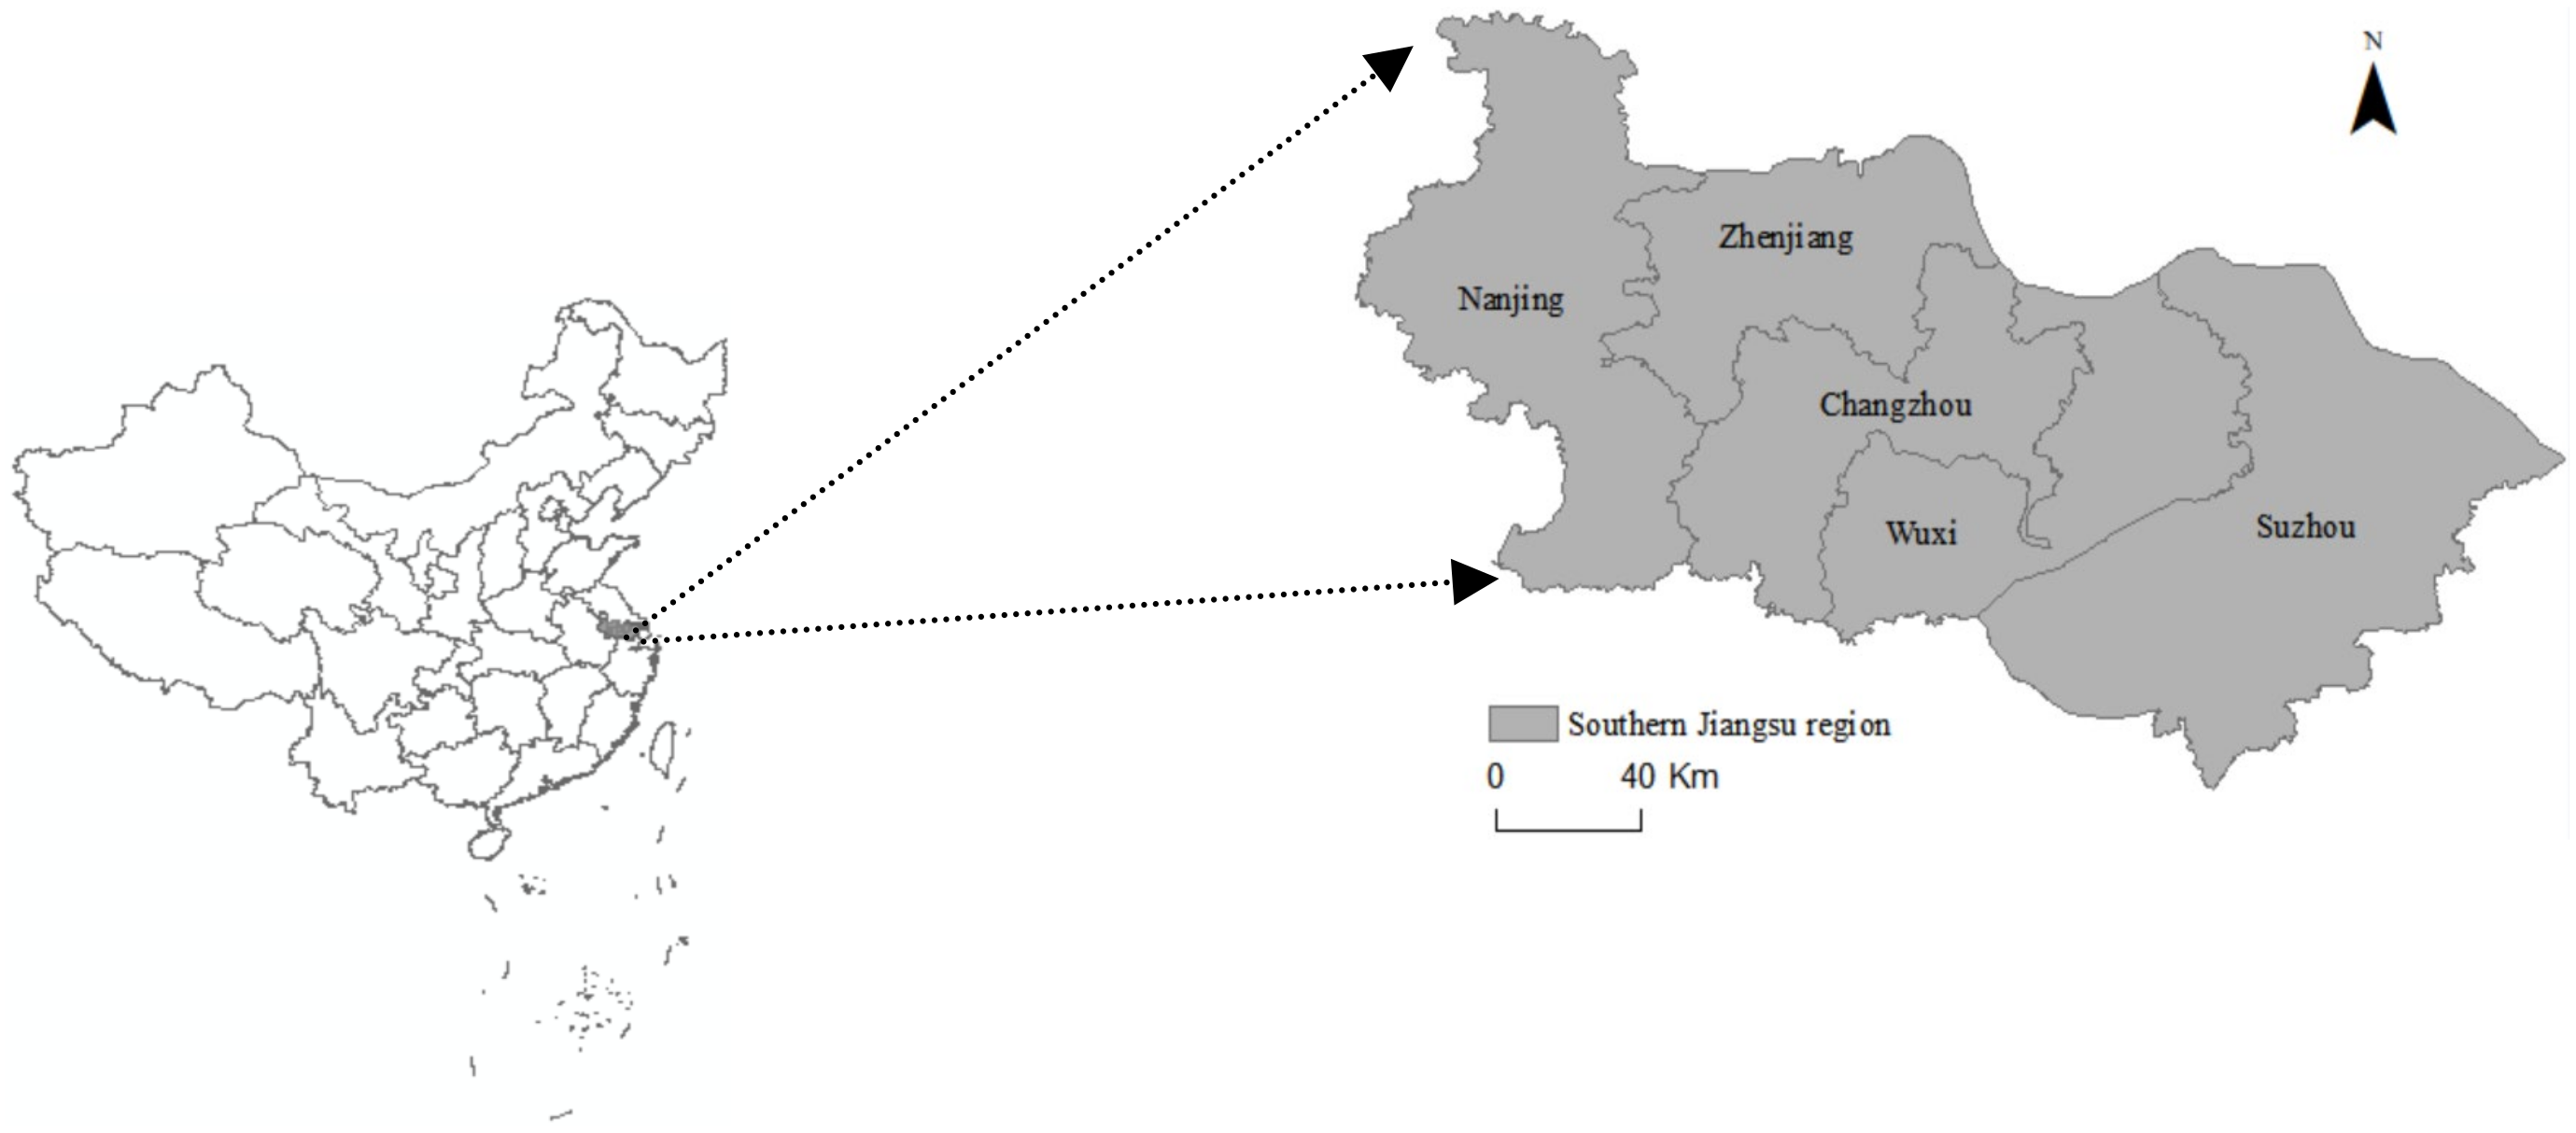
The southern region of Jiangsu Province includes five cities—Nanjing, Suzhou, Wuxi, Changzhou, and Zhenjiang—with a land area of 28,000 km2 (Figure 2). Southern Jiangsu is one of the regions with the highest population and economic density in China and is also the birthplace of the “Sunan Model” [22,23,24]. At present, the urbanization rate in some cities in the southern Jiangsu region has reached 80%. For example, in Nanjing, the urbanization rate of the permanent resident population is 86.8%, which exceeds the average urbanization rate of developed countries. Meanwhile, the output value of the tertiary industry accounted for about 55% of GDP.
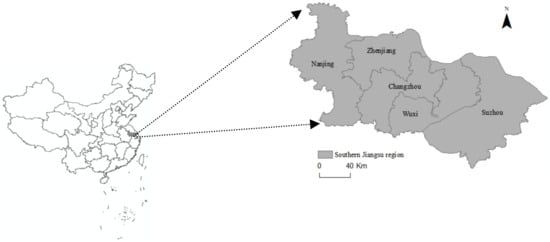
Figure 2.
Study area.
2.3. Model Logic and Data Sources
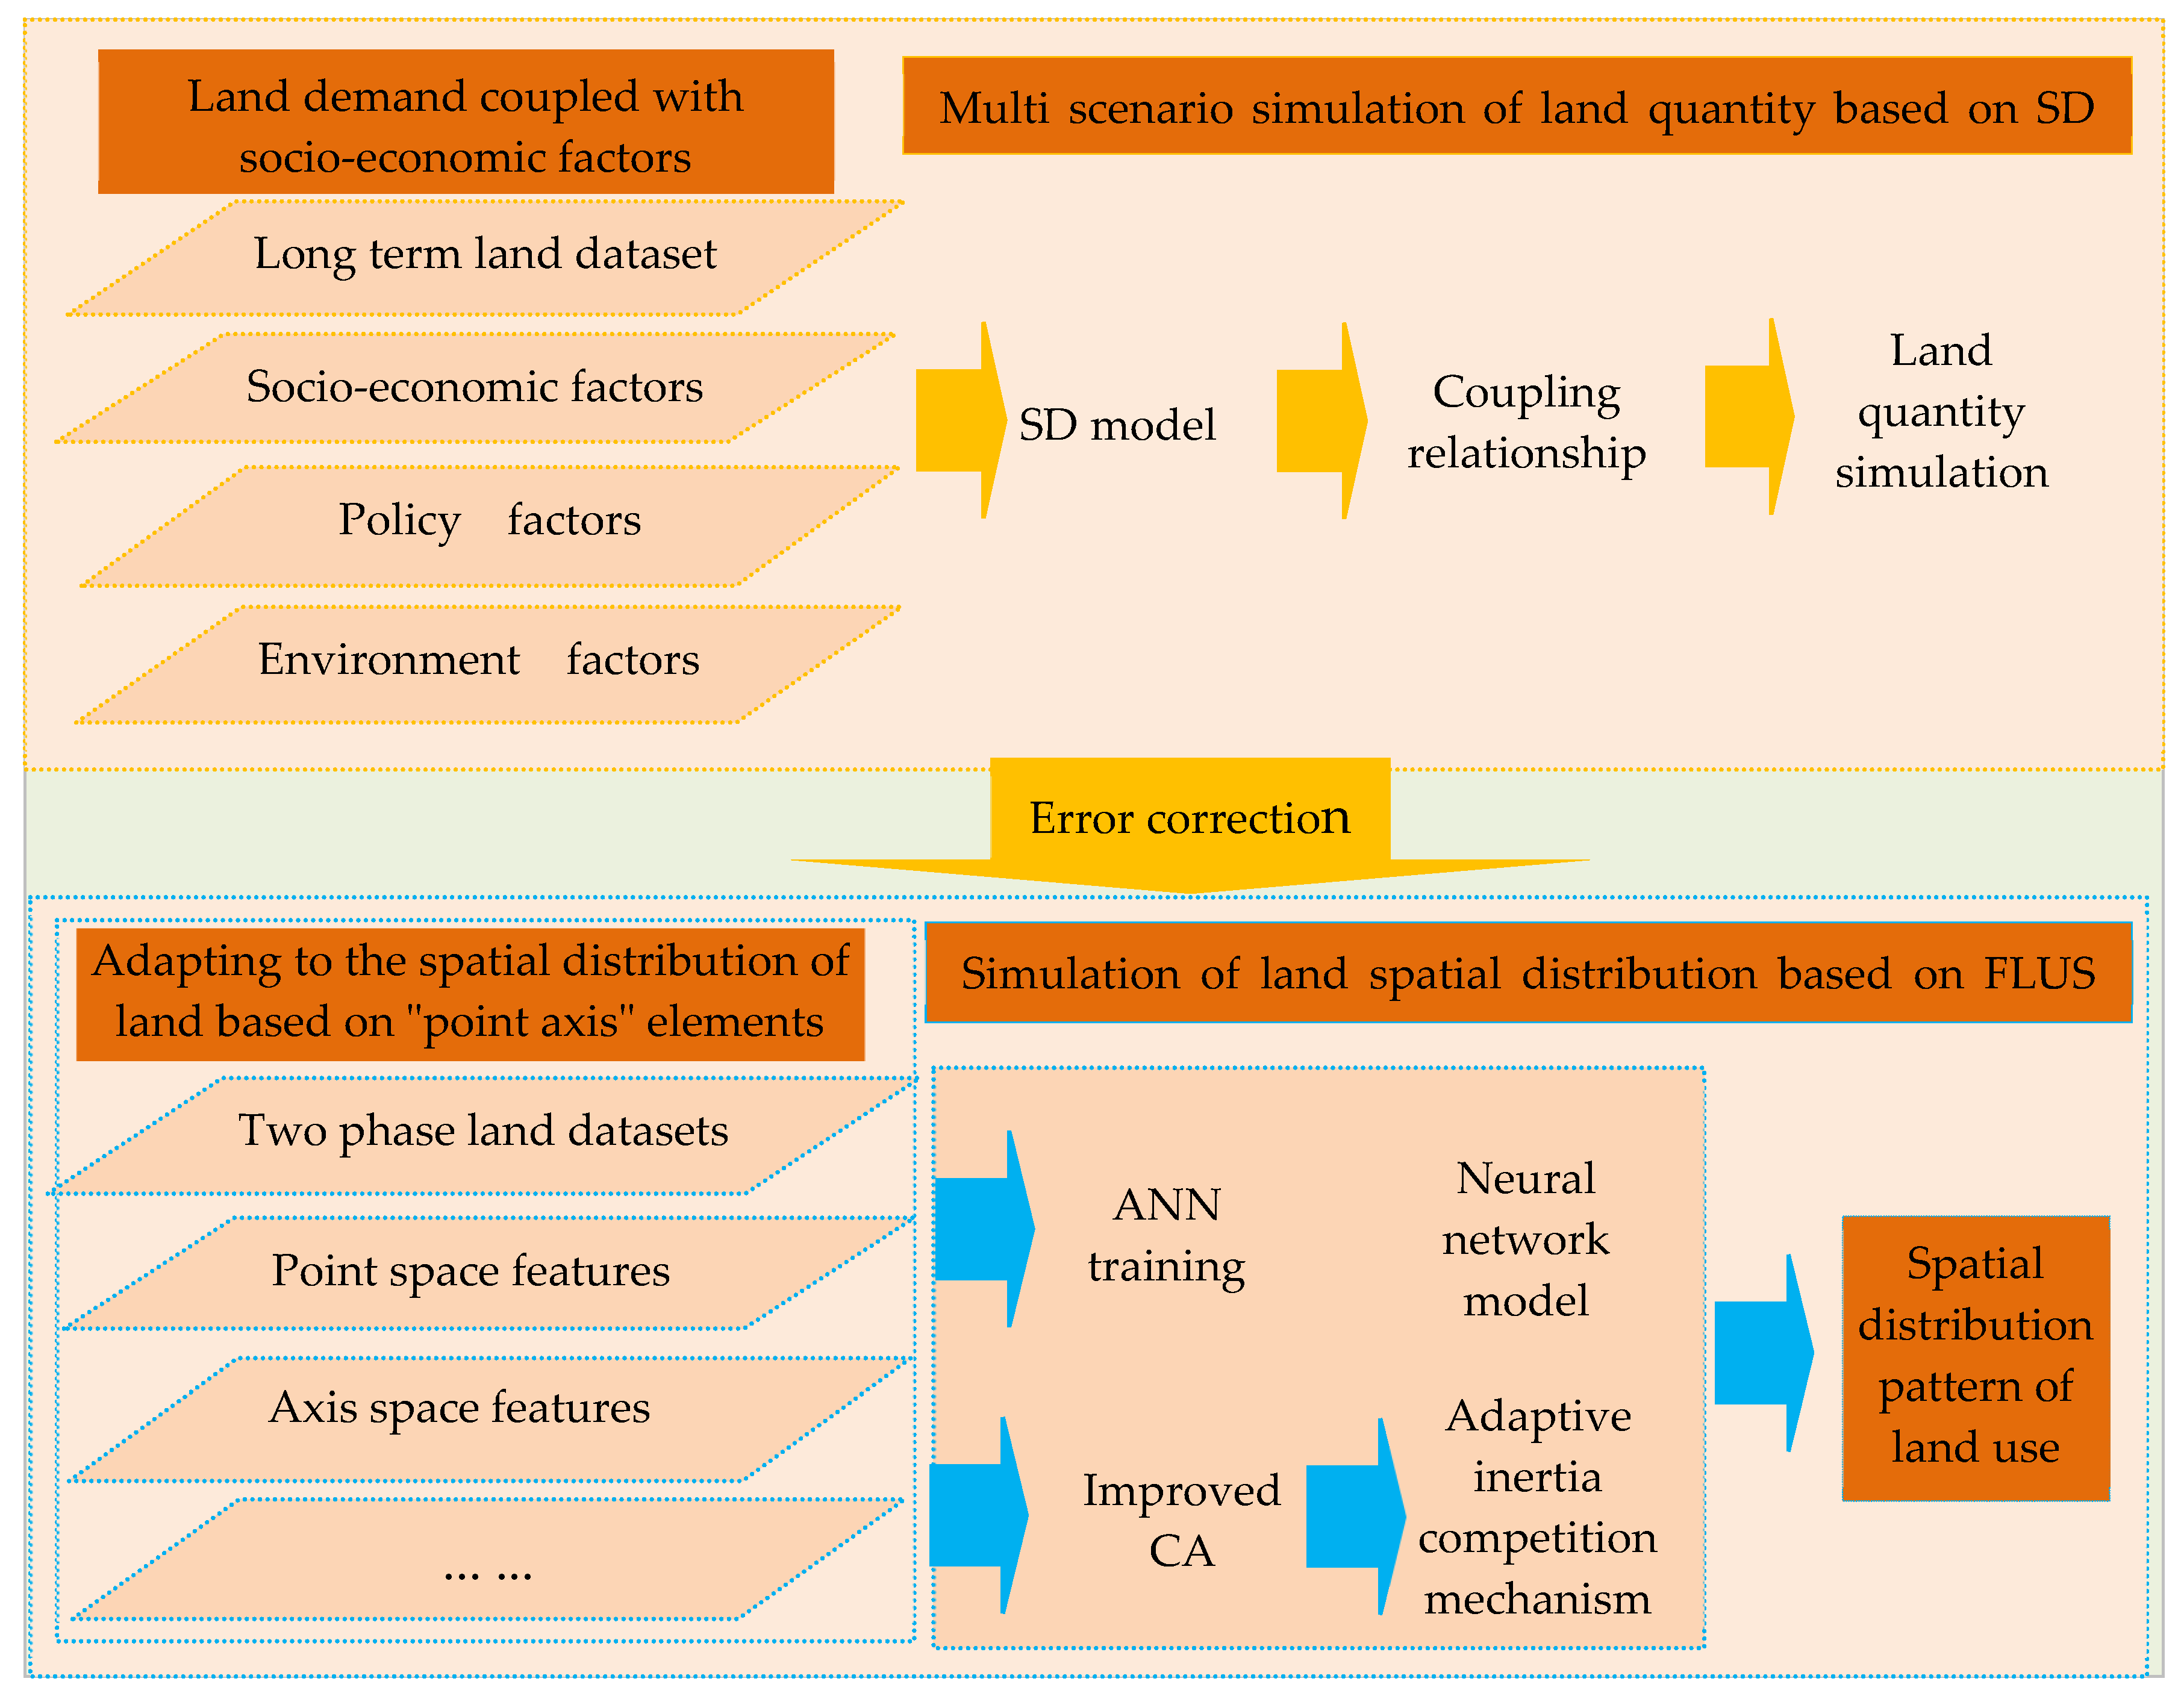
The simulation process coupling socioeconomic factors and the mechanism of “point–axis” spatial factors is shown in Figure 3 below. This paper forms a cause-and-effect diagram and a flow–storage diagram of the socioeconomic factors related to the spatial reconstruction of land use. This is done by simulating the demand for different types of land and the evolution scenarios in the region. Then, using the land demand predicted by the SD model combined with the FLUS model, the future evolution of the spatial pattern of urban–rural land use in southern Jiangsu is simulated.
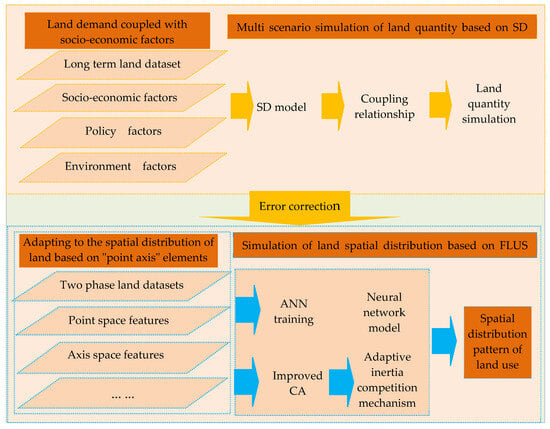
Figure 3.
Simulation process based on the SD-FLUS model.
The SD model of the demand for spatial reconstruction of land use is constructed, with driving factors including “economic-social-policy-environment” dimensions (Table 1). Economic factors include fixed assets investment, GDP growth rate, agricultural investment proportion, secondary industry added value, and real estate investment proportion. Social factors include population growth rate, urbanization rate, total population, per capita demand for meat, per capita demand for aquatic products, and the driving force of agricultural mechanization. Policy factors include the afforestation area, returning farmland to forests, and rural settlement improvement. Environmental factors include temperature and precipitation. The four elements “economic-social-policy-environment” (ESPE) simultaneously act on the land use system. The SD is used to simulate the demand for different types of land use in the southern Jiangsu region under different scenarios. The spatial simulation of land use based on the FLUS model uses “point–axis” driving factors for simulation [25]. The “point–axis” factors mainly include the distance to prefecture-level cities, distance to railways, distance to county centers, distance to national highways, distance to towns, distance to county roads, and distance to rivers.

Table 1.
Factors driving spatial reconstruction of urban–rural land use in southern Jiangsu.
The data on ESPE factors are from the statistical yearbooks and official websites of various cities. The spatial driving factors are sourced from the OpenStreetMap website. Land use data comes from the resource and environmental science data center of the Chinese Academy of Sciences.
2.4. Model Settings
2.4.1. The SD Model
Land use system refers to an organic whole with a certain structure and function that is formed by the mutual influence of subsystems in a region, such as population, land resources, land environment, economy, society, and management regulation [26,27]. Therefore, the land use system is a comprehensive and extremely complex system. The SD method, as a simulation method that is based on feedback control theory, can precisely simulate the complexity of land use systems. Specifically, the SD method uses the analysis and research of information feedback to solve and understand system problems [28]. Due to the high complexity of land use systems with many state variables, constructing a corresponding SD model around the “land demand” is difficult. Therefore, there is a need to find the main relationship structure and grasp the key elements rather than try to reflect the entire system in detail. The spatial boundary of the SD model is set for the southern Jiangsu region. The simulation base year is 2010, with a time step of one year. After obtaining the simulated values of land use demand from 2010 to 2020, this study compares them with the actual values until the accuracy requirements are met (i.e., when the error between the actual and simulated values is within 15%) [29]. Then, the base period and the end of the system simulation are adjusted to obtain the quantity of land use demand in 2035. The ultimate aim is to explore the spatial change trend of cultivated land and rural settlements.
2.4.2. The FLUS Model
The FLUS model has made significant improvements based on traditional CA [19]. Based on the neural network algorithm (ANN), the probability of each land use type in each pixel of the research area is calculated [30,31]. This paper extracts land use data for southern Jiangsu in 2010 and 2020 and applies the PLUS model CA module. The land use data and the “point–axis” factor set for southern Jiangsu in 2010 are inputted. This study input the following into the self-adaptive inertia and competition mechanism CA module: the 2010 land use status map of the southern Jiangsu region, the 2010 land use development suitability atlas, the restricted conversion area, the actual values of the various land types in 2020, the conversion rules, and the neighborhood weights. The FLUS model simulation is based on the GeoSOS-FLUS V1.0 Beta platform [32,33], and the Kappa coefficient and Figure of Merit index are used to verify the simulation’s accuracy. The Kappa coefficient of this simulation is 0.89, and the overall simulation accuracy is 0.92, far exceeding the basic value of 0.75 for the model’s operational accuracy.
3. Results
3.1. Spatial and Temporal Evolution Characteristics of Land Use
In Figure 4, the types of land use included cultivated land (CL), rural residential areas (RS), urban construction land (UCL), woodland (WL), grassland (GL), water areas (WTA), and unused land (UL). It shows the spatial distribution of land use in southern Jiangsu in 2000, 2010, and 2020. In 2000, the change of construction land was mainly distributed throughout the urban areas of Nanjing, Wuxi, and Suzhou. Meanwhile, the urban areas of Changzhou and Zhenjiang had relatively small areas of construction land. In 2010, the construction land in the southern Jiangsu region increased significantly, mainly around the urban expansion of Nanjing, Wuxi, Suzhou, and Changzhou. However, the construction land in Zhenjiang did not increase significantly. Compared with the expansion of urban construction land from 2000 to 2010, the expansion speed of urban construction land in southern Jiangsu decreased from 2010 to 2020. However, the expansion of construction land is still obvious near the Taihu Lake area. During the period from 2010 to 2020, a series of measures, e.g., permanent basic farmland, urban development boundaries, and ecological red lines, were gradually introduced, thereby defining the scope of permanent agricultural land and ecological areas. During the study period, the ecological space in southern Jiangsu, including inland waters, forest land, and grassland, did not change significantly.

Figure 4.
Spatial distribution of land use in southern Jiangsu.
3.2. Simulating Land Demand in Southern Jiangsu Based on SD
3.2.1. Establishment of SD Model
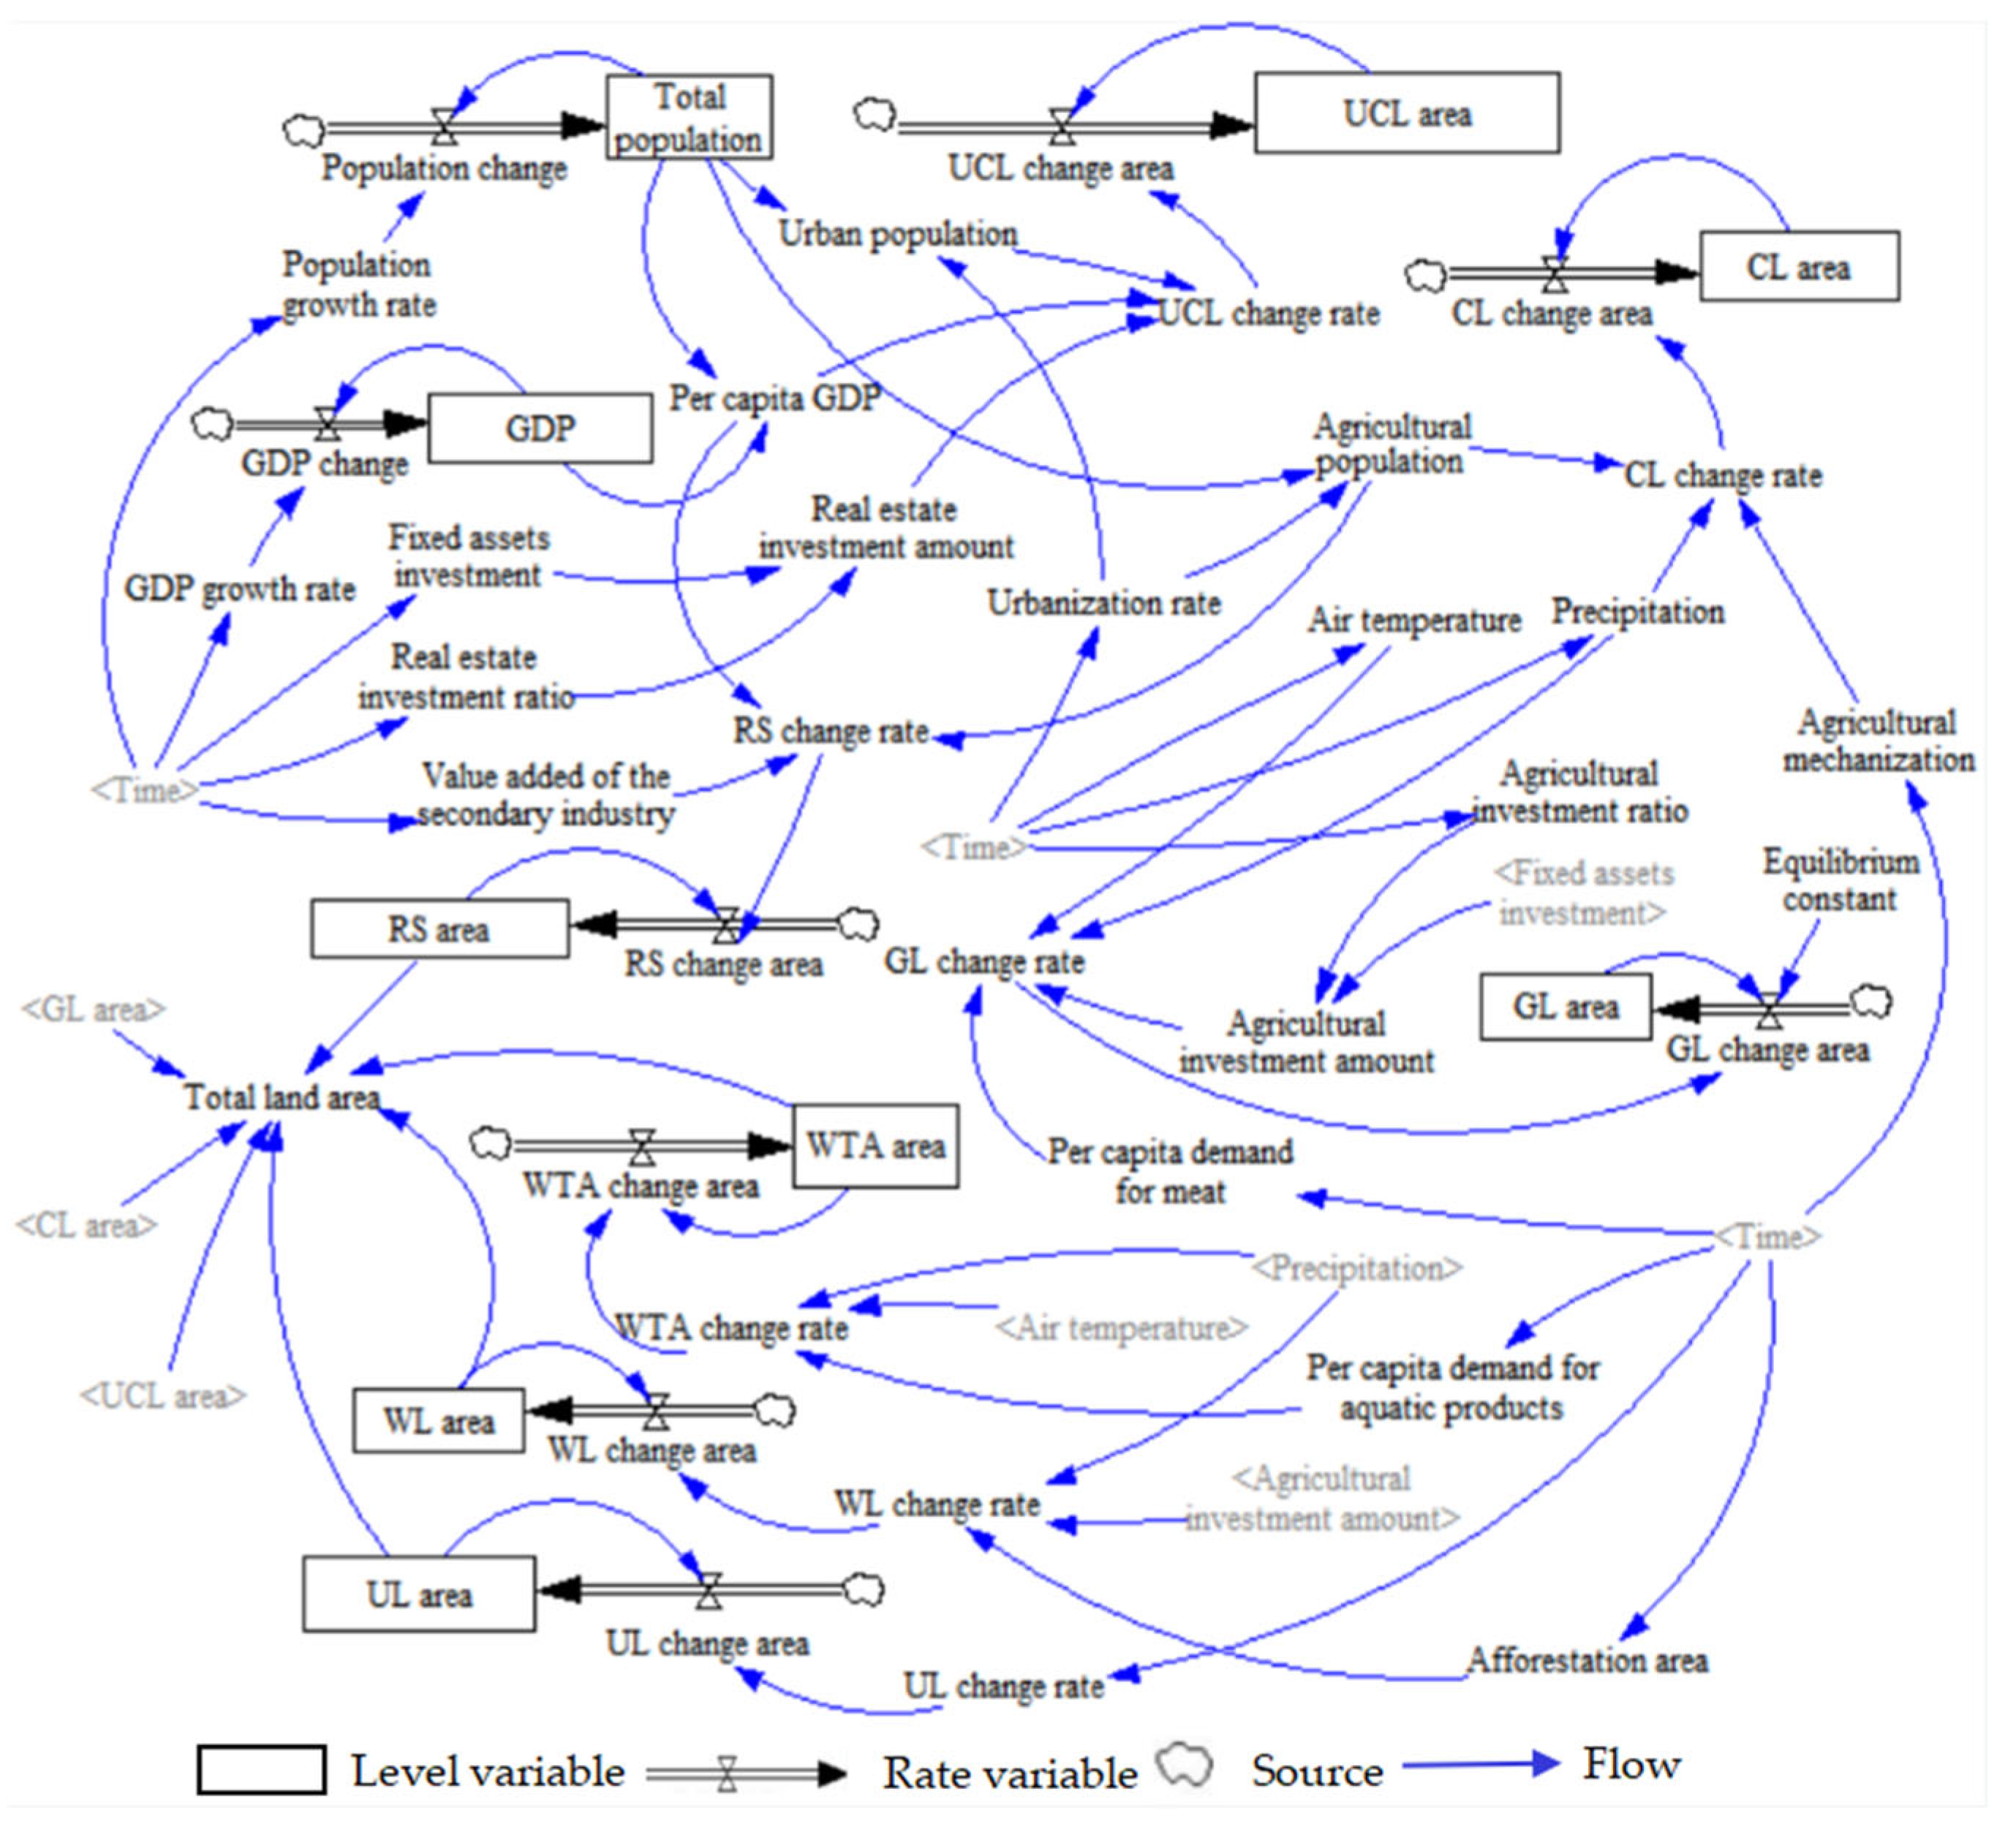
The purpose of constructing the SD model is mainly to reflect the relationship between the set of socioeconomic factors and the demand for various land types. The most directly relevant factors must be selected as key variables. To avoid the over-sized and complex high-order models in the simulation system, this paper has conducted a more detailed classification of socioeconomic factors. Also, the key variables have been mainly constructed based on typical references. The prediction results of the SD model can provide data support for the next step of land use spatial simulation under different scenarios. The variables in the SD model mainly involve the table function with LOOKUP. The key role of the equilibrium constant is to fine-tune the variation trend and error. The adjustment coefficient is used to couple the relationship between the independent variable and the dependent variable, and the dimension is adjusted to satisfy the regression relationship between variables. The SD model mainly includes two parts of formulas for land area change and other variables, with the formulas involving key variables as follows:
| Regional GDP = INTEG (GDP change, Initial value: 25,270.6) (unit: CNY 100 million) Change in GDP = regional GDP ∗ GDP growth rate (unit: CNY 100 million) GDP growth rate = With LOOKUP (Time) (unit: %) Total population = INTEG (population change, initial value: 2368.14) (unit: 10,000 people) Population change = total population ∗ population growth rate (unit: 10,000 people) Population growth rate = With LOOKUP (Time) (unit: %) Temperature = With LOOKUP (Time) (unit: °C) Precipitation = With LOOKUP (Time) (unit: mL) Agricultural mechanization power = With LOOKUP (Time) (unit: 10,000 kWh) Per capita meat demand = With LOOKUP (Time) (unit: Kg/person) Afforestation area = With LOOKUP (Time) (unit: Km2) Area of rural residential areas = INTEG (change in rural residential areas, initial value: 2486.43) (unit: Km2) Change amount of rural residential areas = rural residential area ∗ change rate of rural residential areas—Rural residential area remediation intensity (unit: Km2) Area of arable land = INTEG (area of arable land change, initial value: 13,323.3) (unit: Km2) Area of arable land change = arable land area ∗ arable land change rate—Intensity of returning farmland to forests (unit: Km2) Area of urban construction land = INTEG (area of urban construction land change, initial value: 4141.55) (unit: Km2) Area of urban construction land change = urban construction land area ∗ urban construction land change rate (unit: Km2) The total area of regional land = the area of rural residential areas + the area of arable land + the area of urban construction land + the area of forest land + the area of grassland + the area of water area + the area of unused land |
This paper sets rural residential areas, cultivated land, urban construction land, forest land, grassland, water areas, and unused land as stocks. There are minimal errors in the area of each land use type in the land use status map. In this study, the ratio of the simulated total area to the actual total area each year is used to correct the simulated area of each land use type. The relationship between the change rate of each land use type and the driving factor is adjusted using SPSS22.0. Then, the adjustment coefficient and constant are obtained and are further modified to meet the prediction accuracy. After setting all equations, a flow diagram of the SD model for predicting land demand in southern Jiangsu is obtained, as shown in Figure 5.
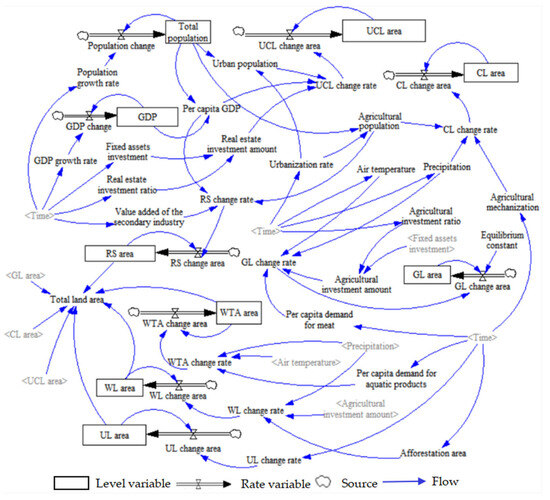
Figure 5.
Flowchart of SD model for predicting land demand in southern Jiangsu.
3.2.2. Land Use Demand Forecast Under Different Scenarios
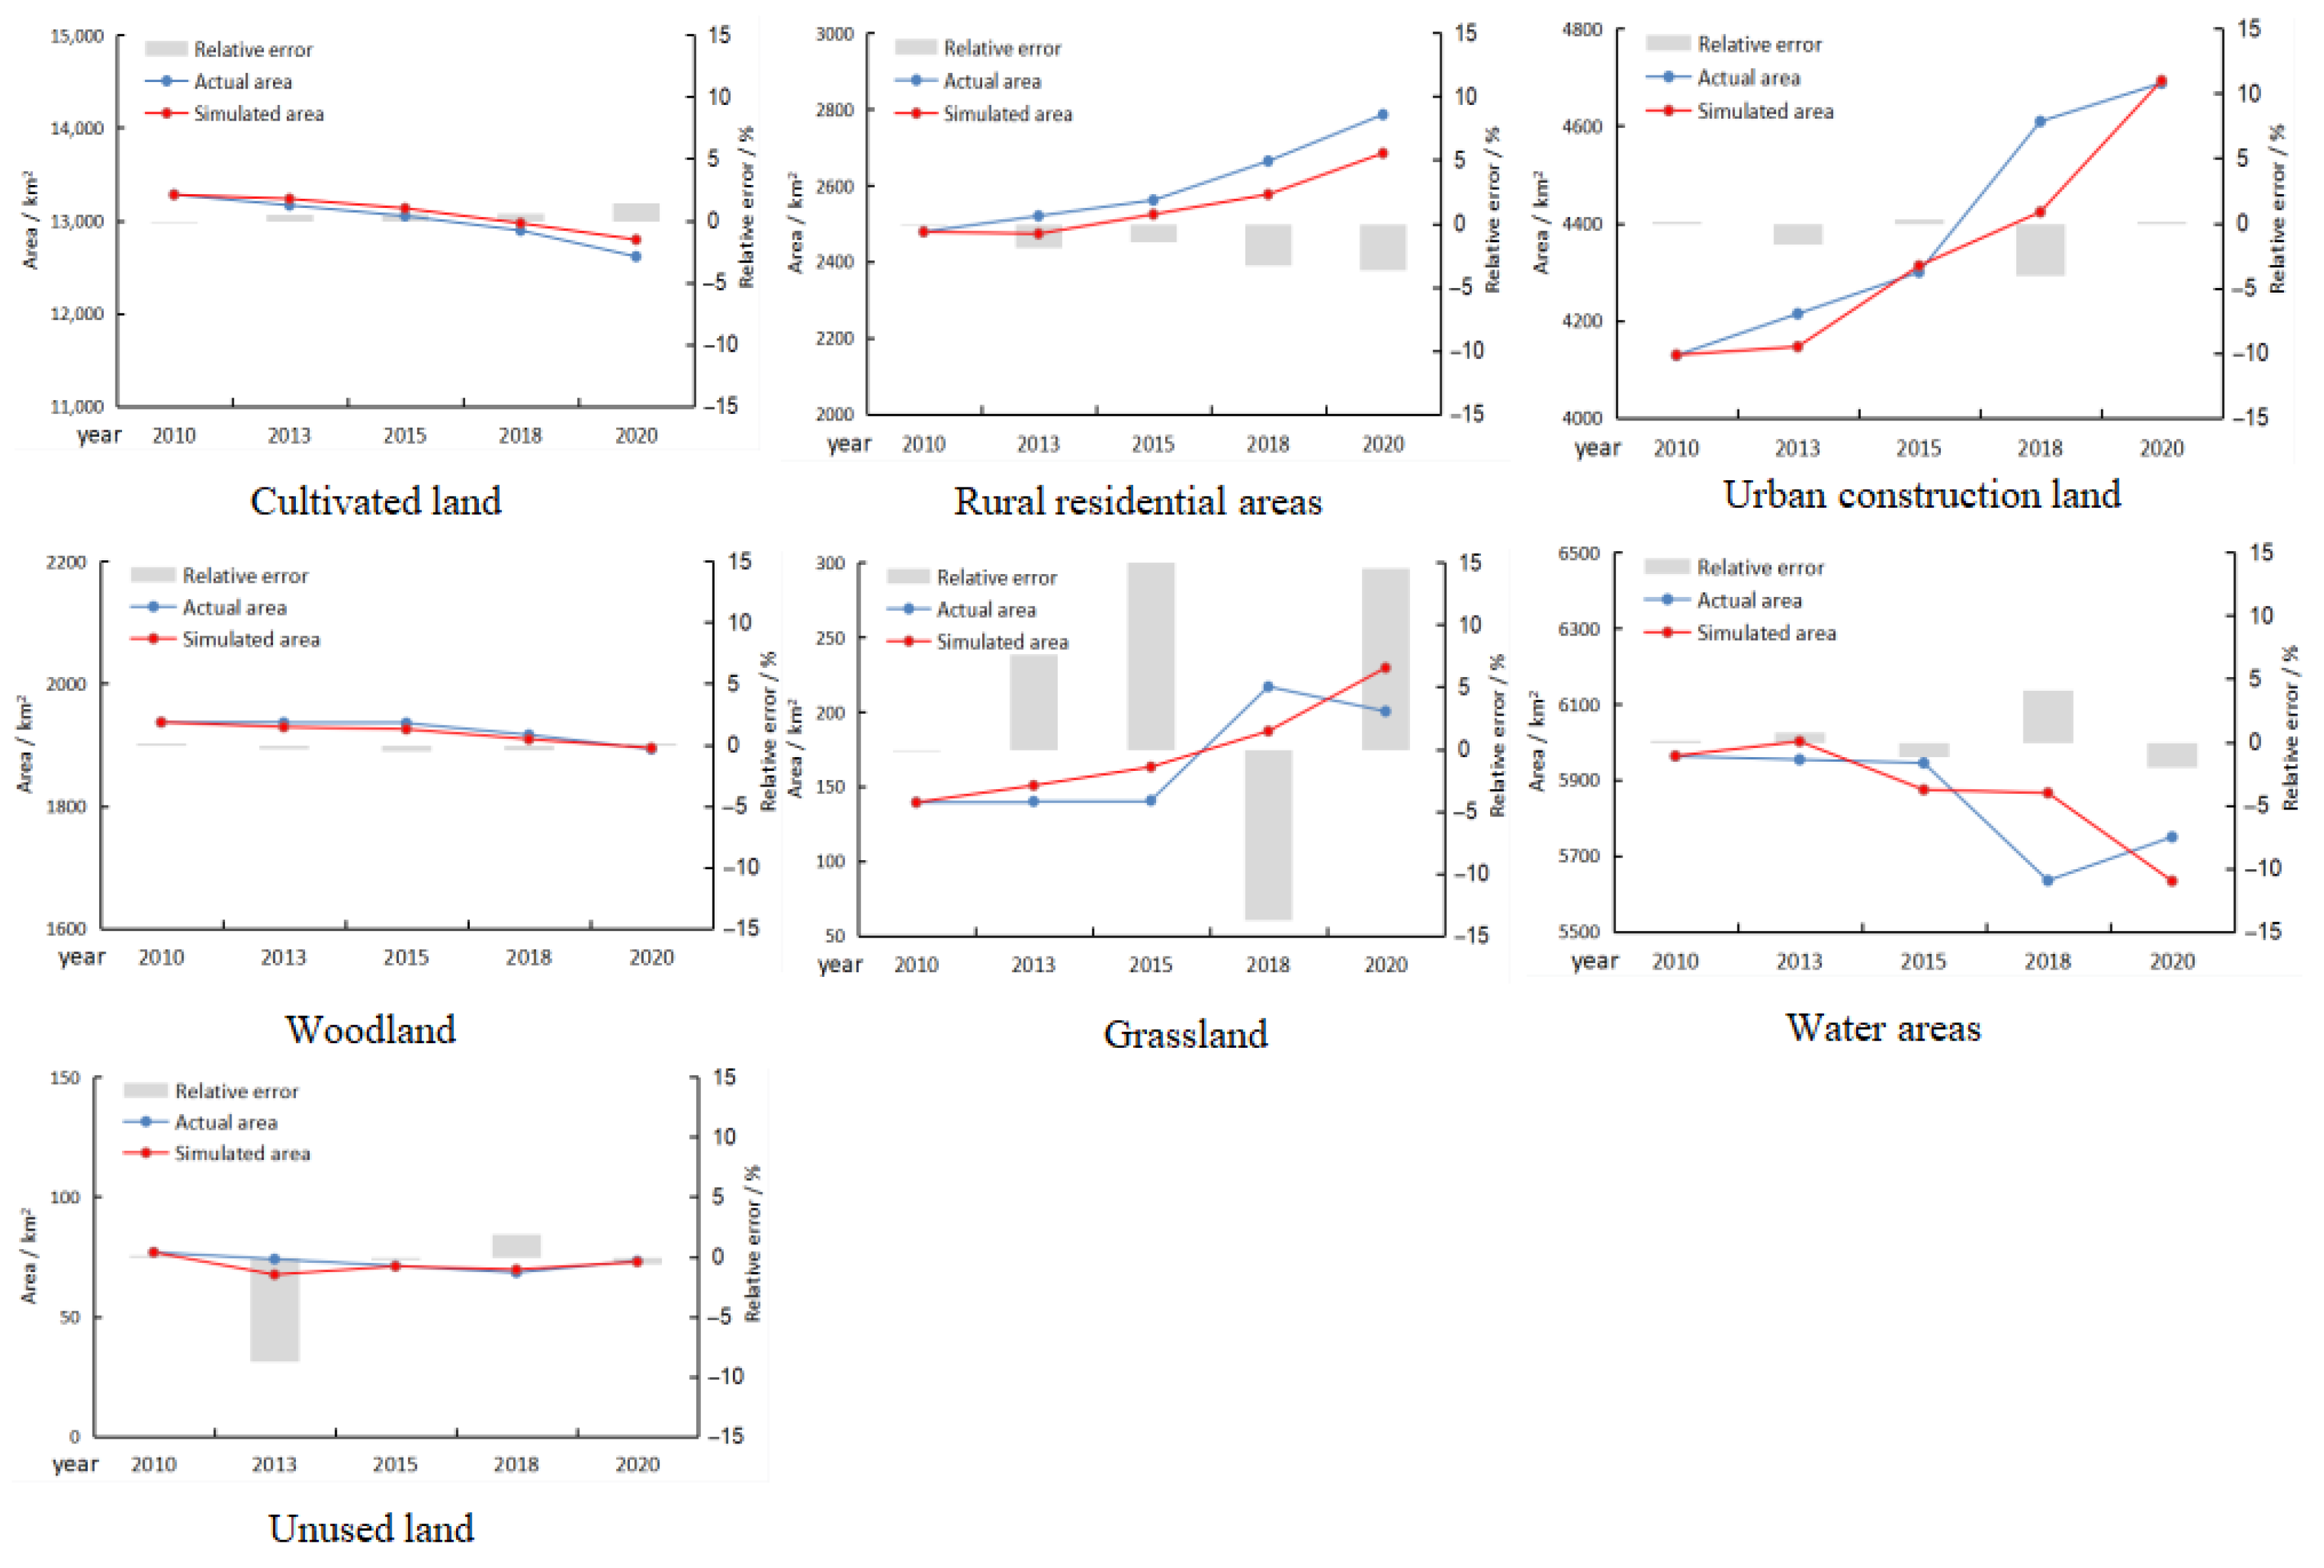
Based on the establishment of the SD model, this study compared the errors between the actual and simulated land quantities in the southern Jiangsu region in the past. The results are shown in Figure 6.
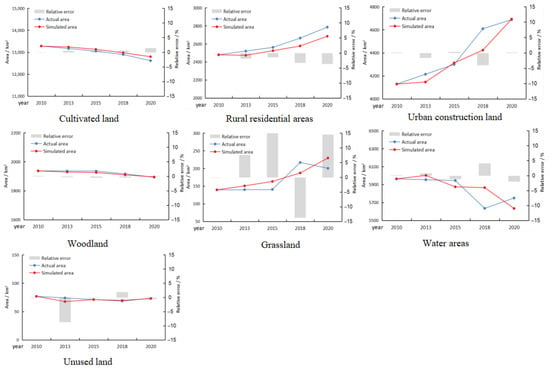
Figure 6.
Relative error between actual area and simulated area.
Due to the relatively small size of grassland and unused land and the large change rate of those land types in historical periods, the simulation error value of grassland is relatively large. Except for 2013, the error of unused land is within ±4%. The error values of the main land types in this paper are all within ±5%; thus, the simulation error is acceptable. The SD model of land demand in southern Jiangsu is affected by parameter settings. In order to explore the land use demand in southern Jiangsu under different development scenarios, we set up an inertial growth scenario: (A) a high-quality development scenario and (B) a rapid expansion scenario (C) based on socioeconomic factors. The specific parameter settings are shown in Table 2.

Table 2.
Parameter settings under different development scenarios.
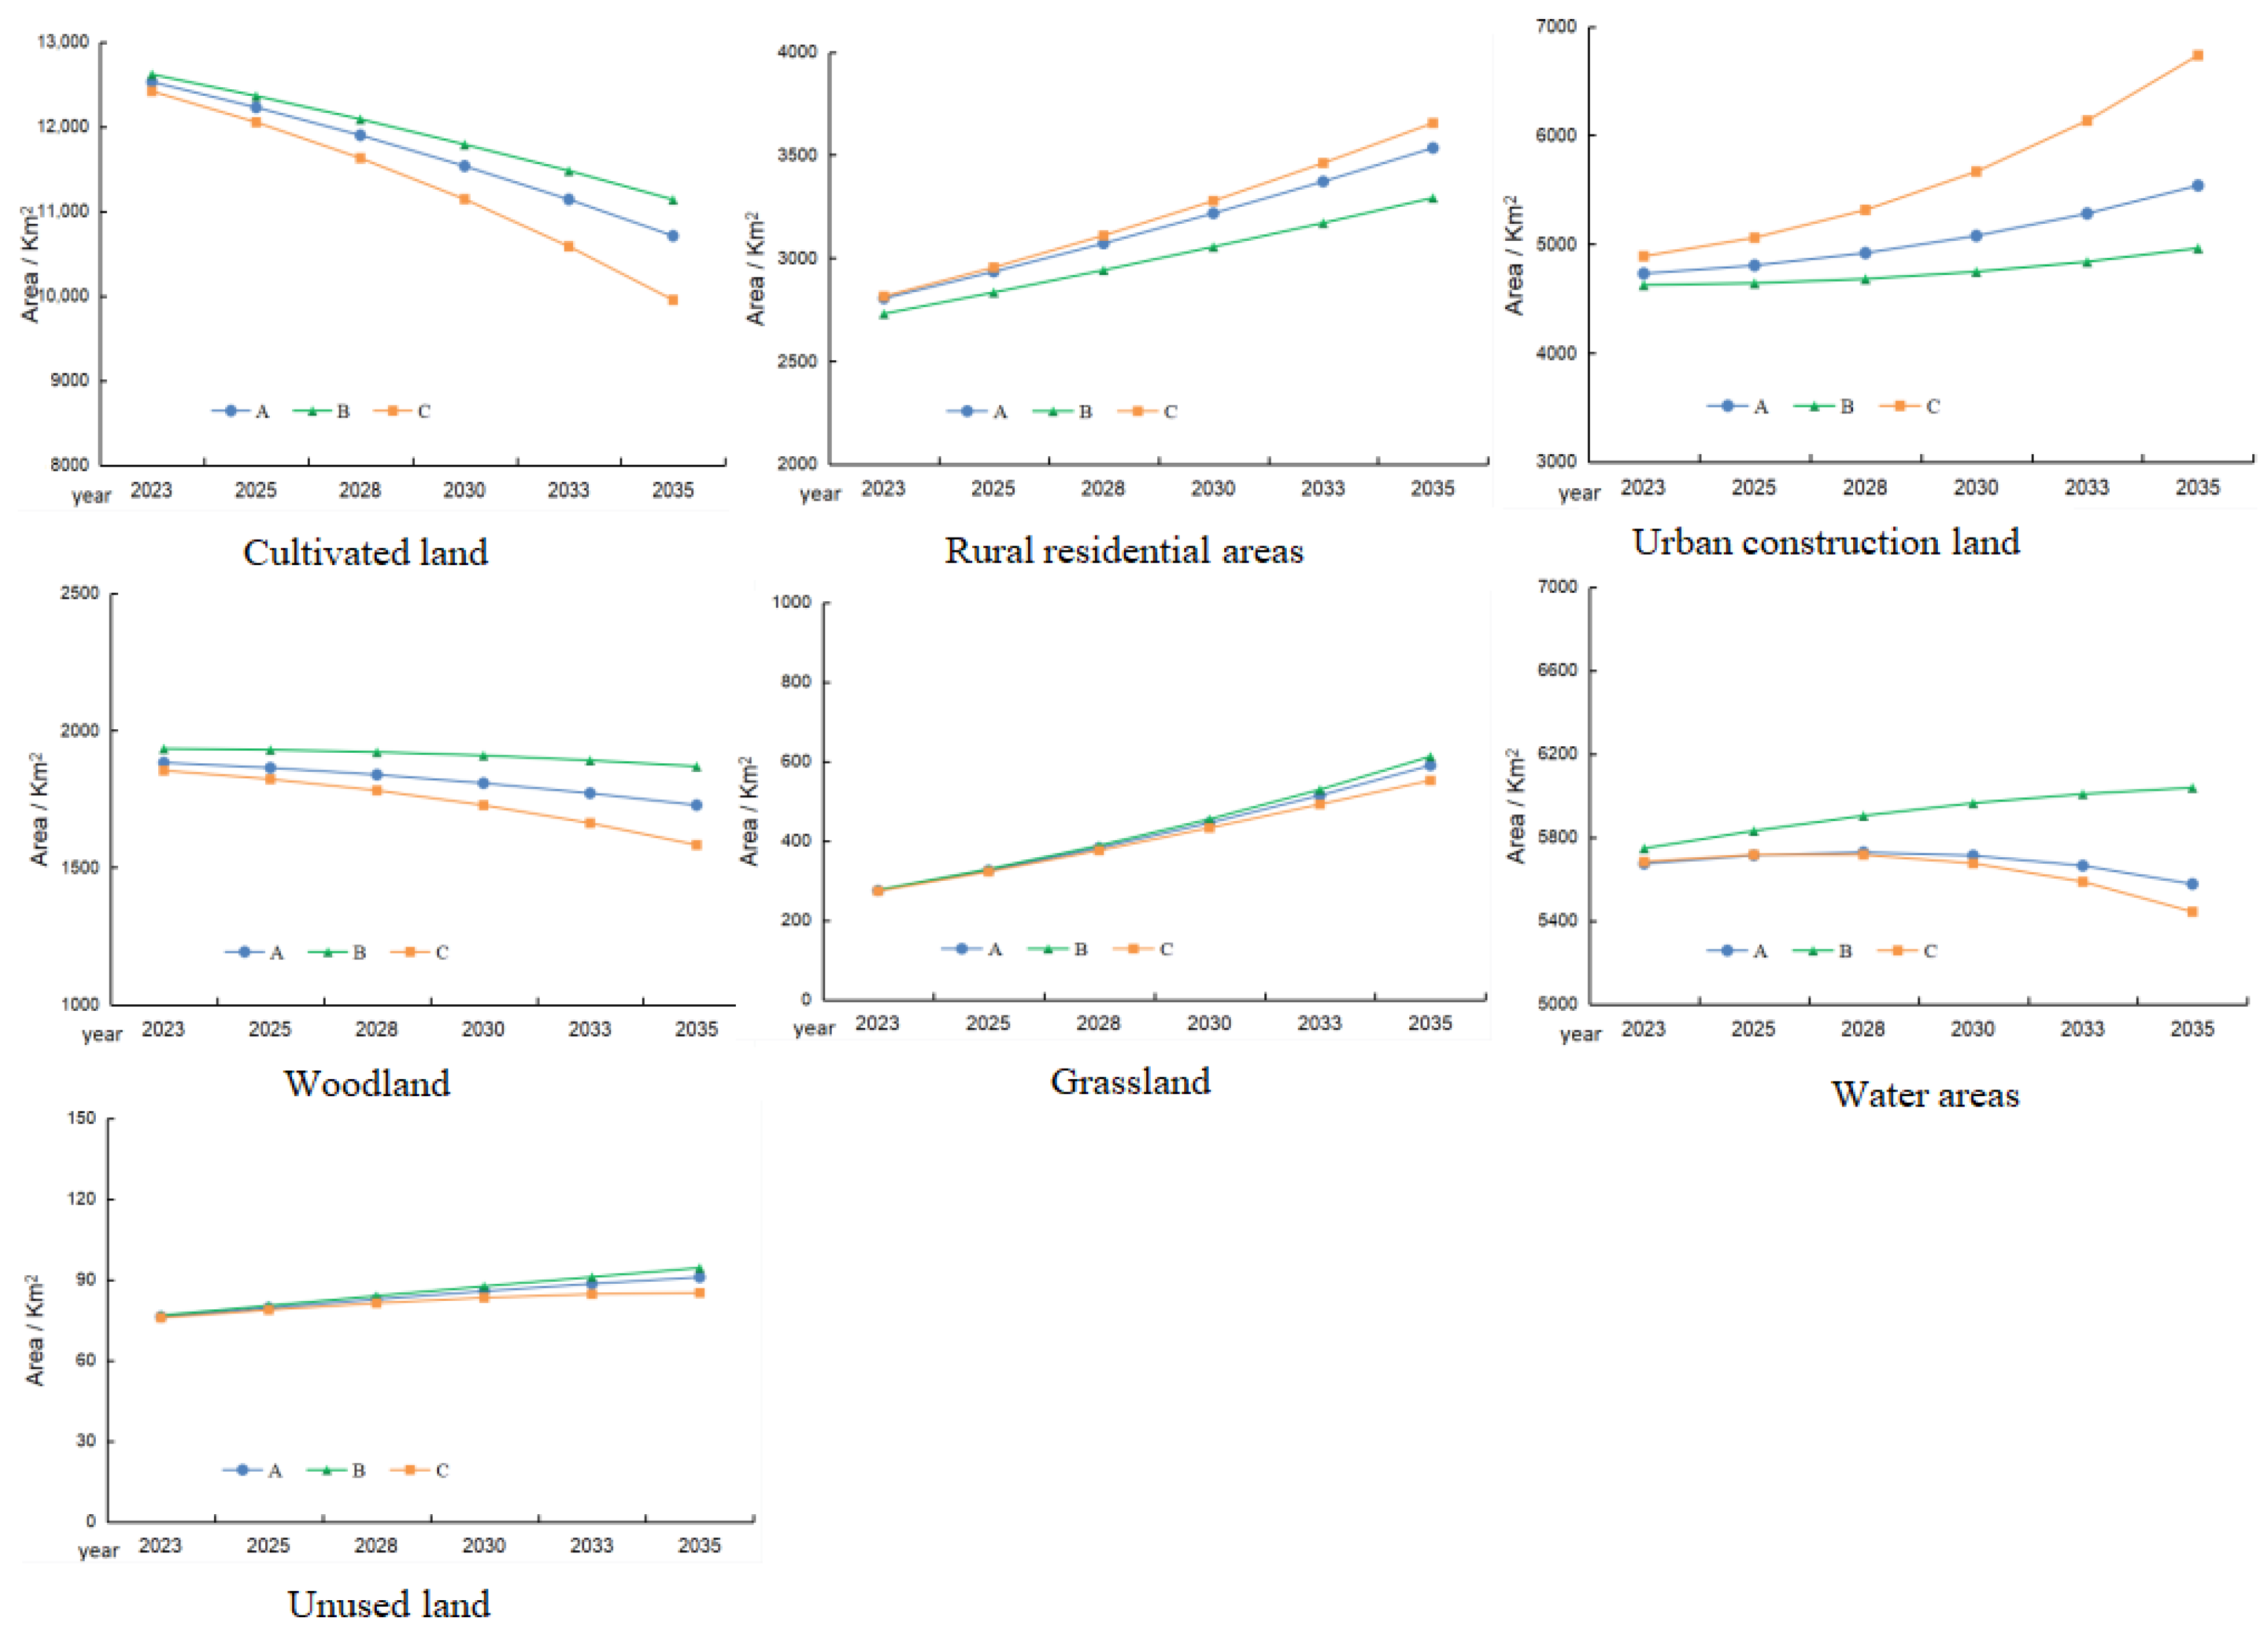
The changes in the spatial reconstruction characteristics of land use in scenarios A–C are very obvious (Figure 7). In terms of the change in land demand for rural settlements, the demand in Scenario B is the lowest, while the demand area in Scenario C is the largest. The differences in the demand for different types of land in the three scenarios are relatively low at the beginning of the simulation, but the difference in land area demand gradually increases over time.
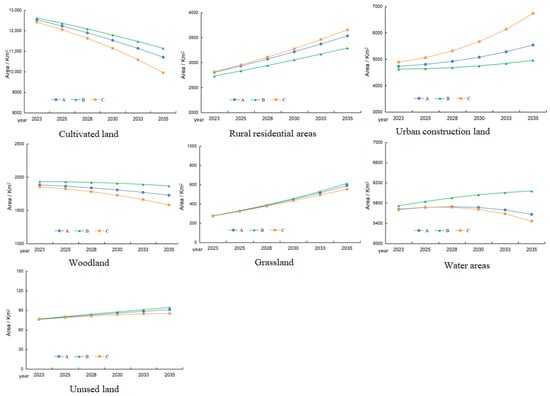
Figure 7.
Simulated changes in the area of various land types in 2035.
In Scenario A, the quantity change of land use in southern Jiangsu presents the characteristics of continuous growth in urban construction land, rural residential areas, and unused grassland areas, while the areas of cultivated land, woodland, and water areas mainly show a series of decreasing trends. This study mainly analyzes the quantity and area of rural residential areas, cultivated land, woodland, and urban construction land. During the period from 2010 to 2020, the cultivated land in the southern Jiangsu region decreased by 4.91%, the woodland decreased by about 2.15%, and the water areas decreased by about 3.45%. The number and area of rural residential areas increased by 12.55%, and the area of urban construction land increased by 13.40%. During the simulation period, the annual average decrease in cultivated land was about 150 km2, the annual average decrease in woodland was about 12 km2, the number and area of rural residential areas increased by 50 km2, and the area of urban construction land increased by 17.1%.
Scenario B is characterized by the construction of ecological civilization as the main goal. In this scenario, local governments formulate practical ecological protection policies based on territorial space planning. These measures have contributed to the formulation of urban–rural development policies that are in line with regional sustainable development. Under Scenario B, the change rate of various land areas in southern Jiangsu is relatively low. In addition, although rural residential areas will also increase in an inertial growth manner, the area’s growth is the smallest among the three scenarios. Simultaneously, compared with the initial simulation period, the increase in urban construction land area is 7.3%, and the change in cultivated land area is −11.73%. The water areas and grasslands will increase slightly on the original basis, while the woodland area remains relatively stable, with a change rate of −3.32%.
In Scenario C, the main pursuit of social and economic development is to implement a relatively relaxed land use policy. Compared with Scenario A and B, the restrictions on land use in Scenario C are relatively few. The area of each land type is also significantly affected by regional population growth and economic development. This pattern is mainly manifested in a large decrease in the area of arable land and a large increase in the area of urban construction land in the later stages of the simulation. Compared to urban construction land, the simulated area of rural residential areas has the largest proportion of changes under the three scenarios. This may be due to the fact that, in the context of rapid socioeconomic expansion, contiguous rural settlements have gradually transited to urban construction land. The reduction in woodland is relatively large. In the early stage of the simulation, the proportions of cultivated land, rural residential areas, and urban construction land areas were 44.34%, 10.05%, and 17.46%, respectively. At the end of the simulation, the proportions of cultivated land, rural residential areas, and urban construction land areas were 35.54%, 13.05%, and 24.05%, respectively.
3.3. Multi-Scenario Simulation of Land Spatial Distribution Based on the FLUS Model
3.3.1. FLUS Model Parameter Settings
The land use conversion rules are represented in the form of a cost matrix in the self-adaptive inertia and competition mechanism CA module. The values are represented as 0 or 1. Specifically, 0 indicates that transformation cannot occur between two land types, and 1 indicates that transformation can occur between two land types. In Scenario A, this study sets a large-scale water surface as a restricted conversion zone. This study takes geological parks, forest parks, and nature reserves as point elements and sets a buffer zone with a radius of 1 km as a restricted conversion zone. The land conversion rules and restriction zone settings in Scenarios A and C are the same as those in this paper. Only the future spatial layout of land use under different socioeconomic development scenarios is compared. For Scenario B, the land use conversion rules are relatively strict, strictly controlling the conversion of various ecological land use to urban construction land and rural residential areas.
3.3.2. Land Use Spatial Layout Under Different Scenarios
The simulation results of the spatial reconstruction evolution characteristics of land use under Scenarios A–C are shown in Figure 8. Under Scenario A, the conversion of cultivated land and rural residential areas to urban construction land mainly occurs in the Jiangning district in the southern part of Nanjing and the border area between Jiangning district in Nanjing and Jurong in Zhenjiang. The land use transformation in Changzhou is concentrated in the eastern part of Liyang and Wujin district. Under Scenario C, urban construction land has expanded to the surrounding areas on the basis of the original scope. This is specifically manifested as urban construction land squeezing arable land and rural residential areas, while water areas land shows a certain degree of stability and no obvious change characteristics. The scope of urban construction land in Scenario C is the largest and most extensive. Also, urban construction land further squeezes ecological land, and this land transformation performance is highly active. In the following three scenarios, the change in cultivated land area is the least under Scenario B. In particular, the distribution of rural residential areas is similar to that under Scenario A. The woodland, grassland, and water areas remain stable (on the original basis in 2020), which is in line with the simulation goal of high-quality development.

Figure 8.
Land use spatial layout under different scenarios in southern Jiangsu in 2035.
4. Discussion
4.1. Simulation Analysis of the Spatial Evolution of Urban–Rural Land Use in Typical Regions
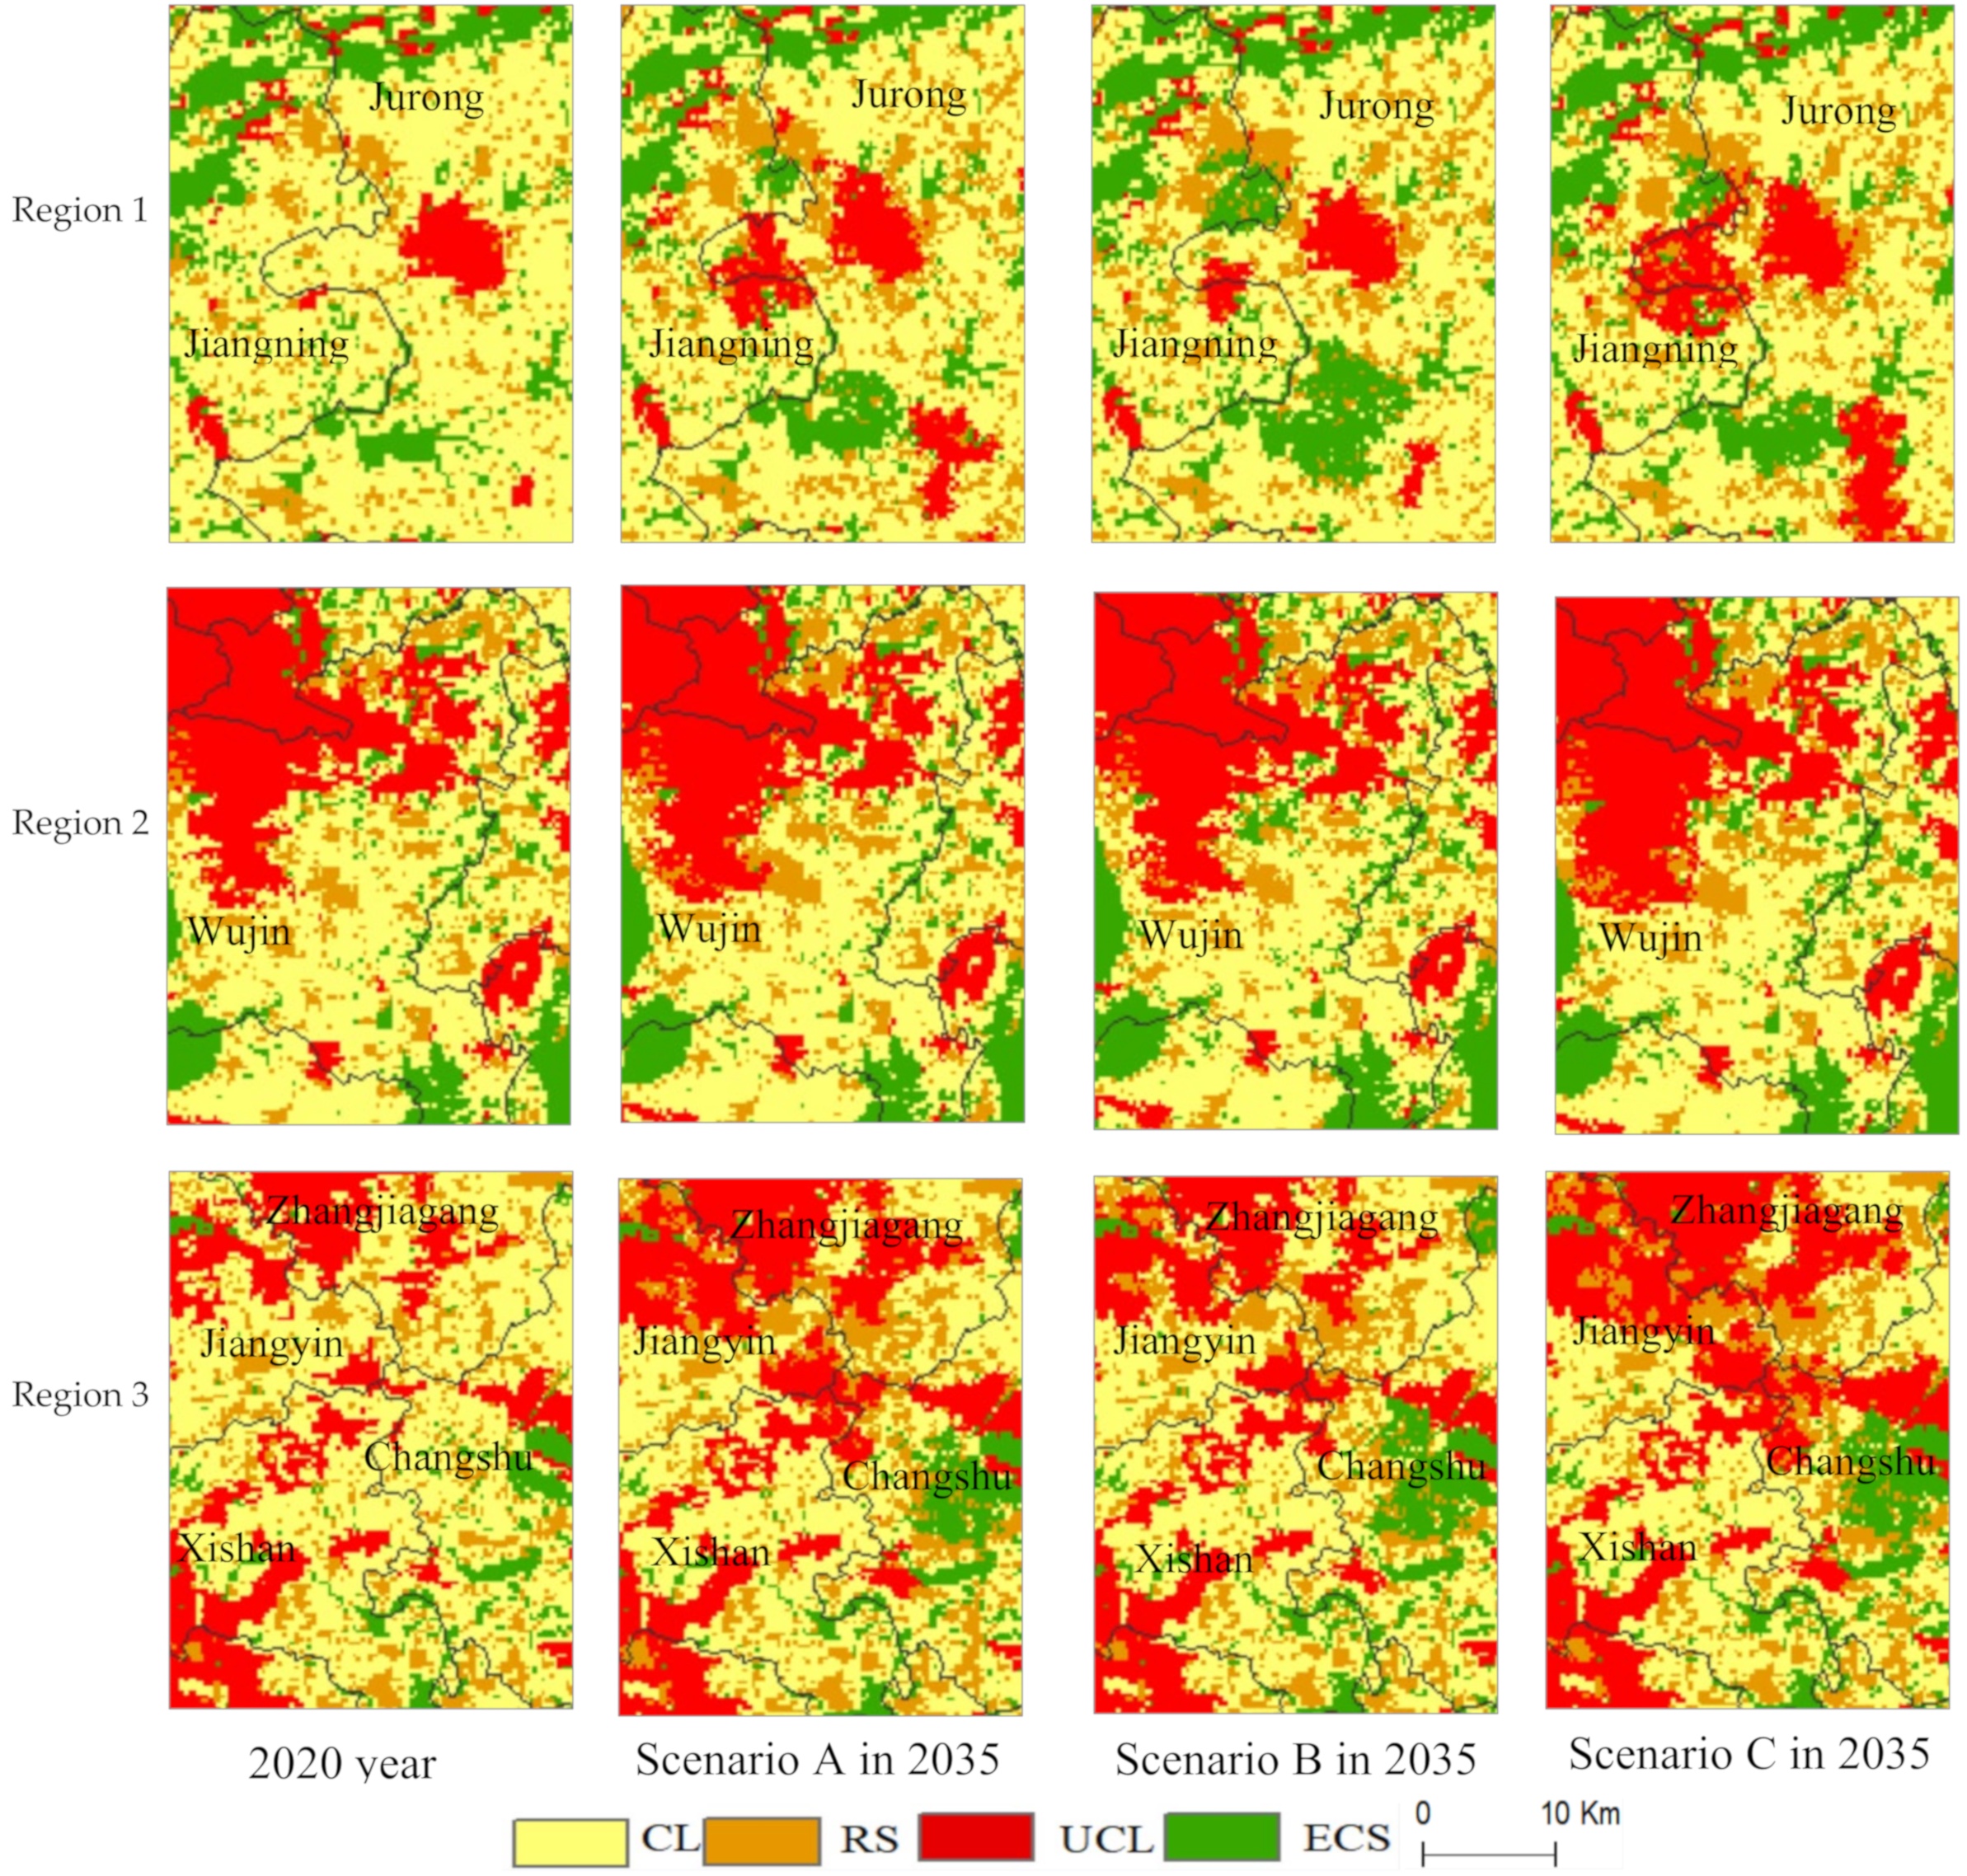
This study chooses the three typical regions above for further analysis and explores the laws and characteristics of urban–rural land use spatial reconstruction. To make the studied cultivated land and rural residential areas more prominent, land use is divided into agricultural living space, rural living space, urban living space, and ecological space (ECS). The three selected areas are marked in Figure 8, while the detailed land use spatial simulations are shown in Figure 9.
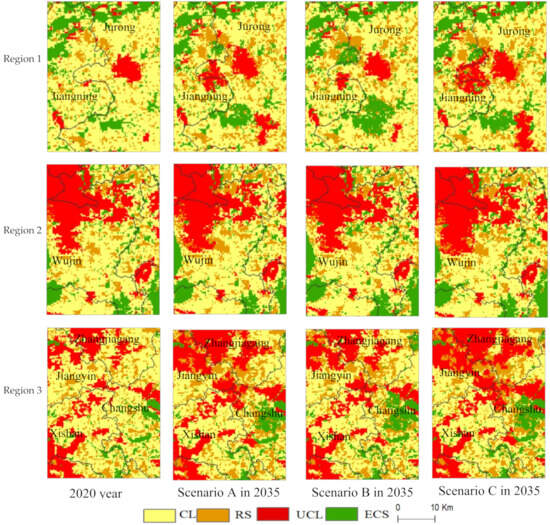
Figure 9.
Simulation of rural land use spatial reconstruction in typical regions by 2035.
Region 1 is located at the junction of Jiangning district and Jurong City. According to the analysis of land use status in 2020, rural residential areas are concentrated in the northern border area of Region 1, distributed in a long strip shape. The rural residential areas in other regions are relatively scattered, while agricultural production spaces are mainly distributed in Jurong. The urban construction land is mainly concentrated in the urban area of Jurong, while the distribution proportion of urban construction land in Jiangning is low. In Scenario A, by 2035, the expansion of urban construction land will have severely squeezed rural residential areas. Based on the original urban area in 2020, northward expansion has squeezed agricultural production space. Scenario B is mainly characterized by the squeezing of agricultural living space by ecological space and rural residential areas. In Scenario C, the proportion of agricultural production space to urban living space in the southeast of Jurong is relatively large. In summary, for rural land, the rural residential areas in all three scenarios show a trend of squeezing agricultural production space, but the spatial evolution difference is relatively low in all three scenarios. Under the three development scenarios, significant differences are seen in the area and layout of agricultural production space. Scenario B strictly restricts the expansion of urban construction land, resulting in a relatively stable development trend of agricultural production space. However, in Scenario B, ecological space will squeeze agricultural production space.
Region 2 mainly includes most areas of Wujin in Changzhou. Wujin is adjacent to the urban area of Changzhou, with a large area of urban construction land in the northwest of Wujin. Agricultural production space is mainly distributed in the southeast of Wujin, while ecological space is mainly concentrated in the eastern and western regions of Region 2. From analyzing Scenario A, the transformation of agricultural production space into urban land is mainly located in the southern part of the actual distribution of urban construction land. Meanwhile, the proportion and spatial layout of land types in other regions are relatively stable. The squeezing of agricultural production space by rural residential areas is mainly concentrated in two areas. The first area is located at the junction of the northern area of Wujin and Tianning, adjacent to the urban area of Changzhou. The probability of rural residential areas squeezing agricultural production space in this area is relatively high. The second area is located in most of the southeastern part of Wujin, especially in areas close to urban construction land. This is where the characteristics of rural residential areas transforming into urban construction land are more obvious. The number and structure of rural land use types in areas far from the urban area of Wujin are relatively stable. The ecological land in Region 2 exhibits stable characteristics under all three development scenarios with no significant changes.
Region 3 belongs to the Wuxi area, which is the border area between Zhangjiagang, Jiangyin, Xishan, and Changshu. In the 2035 land use simulation, the spatial reconstruction characteristics and laws of rural land use are extraordinarily complex. In Scenario A, the areas where urban construction land squeezes agricultural production space are mainly located in Jiangyin and Zhangjiagang and the border area between the four abovementioned cities. No significant change occurs in the agricultural production space between Xishan and Changshu. The areas where agricultural production space is transformed into rural residential areas are mainly concentrated in Jiangyin and Zhangjiagang. For Scenario C, urban–rural living spaces in Region 3 are severely squeezing agricultural production space. The construction land area in Jiangyin, Zhangjiagang, and Changshu is expanding and gradually converging at the administrative boundaries of the three regions. Notably, under Scenario C, the continuous expansion of rural residential areas gradually integrates with urban living spaces, forming contiguous construction land. In short, for rural land in Region 3, the urban–rural living spaces in Jiangyin and Zhangjiagang are severely squeezing agricultural production space in all three scenarios, with urban living space squeezing the most severely. The transformation of rural land in Xishan and Changshu is mainly concentrated at the junction of administrative boundaries.
4.2. Extracting the Model of Future Urban–Rural Land Use Reconstruction
There is relatively little research on simulating land use changes in the southern Jiangsu region. In land use simulation studies in other regions, few scholars have summarized typical characteristics. This study summarizes three development models, namely single-center-driving expansion, patchy expansion near the city center, and multi-center pole-driving expansion. The three urban–rural land development models are shown in Figure 10. Region 1 (single-center-driving expansion) represents the development of construction land in another area near the center of the original built-up area, driven by the central pole. The area of agricultural production space turning into urban living space is relatively concentrated. Rural living space shows expansion in its original spatial location, while other expansion areas are concentrated near urban construction land. Region 2 (patchy expansion near city center) represents the urban living space surrounding the built-up areas of large cities squeezing agricultural production space. Here, the urban living space expands in a patchy pattern. The areas where rural residential areas have undergone changes are concentrated near the built-up areas of large cities. Meanwhile, in areas far from existing built-up areas, the types of rural land remain stable. Region 3 (multi-center-driving expansion) can represent the complex characteristics of rural land use changes surrounding urban living spaces. Under the influence of multi-center poles, rural land gradually transforms into urban land, ultimately forming contiguous areas. In the future, the above three driving forms can be adopted to promote rural transformation. However, relevant departments should also take relevant measures to prevent the intensification of urban–rural land restructuring.

Figure 10.
Urban–rural land use restructuring models in southern Jiangsu in 2035.
4.3. Policy Choices for Reducing Land Contradiction in Southern Jiangsu
This paper summarizes simulation results of urban–rural land evolution in various scenarios. The results mean to draw the following implications of policy choices that can be proposed regarding land development and ecological protection.
Firstly, efforts should be made to coordinate urban and village planning and to refine guidance strategies, from overall planning to detailed planning. County towns are the backbone of China’s urbanization development and a key hub for the socioeconomic connection between urban and rural areas [34,35]. Government departments should establish a four-level spatial unit system of “county district—County functional area—Township—Administrative village”, which would help to achieve systematic step-by-step guidance. In rural areas outside the boundaries of urban development, one or several administrative villages are currently used as units [36]. The township government organizes the preparation of a practical village plan that integrates multiple plans. For administrative villages that include a large number of natural villages for cluster improvement (or some administrative villages with high construction demand), village planning implementation could be accelerated. Administrative villages that include a large number of urban–rural integration of natural villages near the urban core living and cultural circle could also be included in the comprehensive planning of urban control and other detailed planning. The rural land use planning of administrative villages, which includes a large number of relocation, demolition, and merger villages, should adopt flexible management methods.
Secondly, the government should strictly control the scale of construction land and practically increase the quality and efficiency of cultivated land increments. For villages with urban–rural integration or agglomeration improvement, a “series”, “cluster”, and “satellite town” layout should be adopted. High-quality arable land should be strictly avoided, and the planned indicators for new construction land should be gradually reduced. On the premise of the strict protection of arable land, especially basic farmland, the government should fully leverage the regulatory role of the overall land use plan. According to the requirements of “industrial concentration in industrial parks, agricultural concentration in ecological areas, population concentration in urban areas, and residential concentration in communities”, efforts should be made to coordinate the layout of land for various industries. Towns near core urban areas should strictly delineate and permanently protect basic farmland [37] and strengthen the balance between the quantity and quality of cultivated land occupation and compensation.
Finally, decision-makers should adhere to the bottom-line thinking of land planning and strictly implement the regional management of ecological space control. On the one hand, ecological space control areas in urban–rural areas should be both established and improved [38,39]. These ecological space control areas should focus on the protection of the rural ecological environment. Also, the delineation of ecological space should follow the characteristics of “concentration and contiguous, similar functions” in urban–rural ecological space control areas. This approach can make the ecological space control areas relatively complete. On the other hand, the red line of ecological protection [40,41] should ensure the systematization and integrity of ecological functions, guaranteeing that “ecological functions are not reduced, the area is not reduced”. Additionally, there is an absolute need to fully leverage the regulatory role of land policies in industrial and economic restructuring and to strictly control high-emission projects.
5. Conclusions
As one of the more active regions in China’s economic development, the evolution of land use patterns in the southern Jiangsu region is full of research significance. This paper uses a combination of the SD model and the FLUS model to simulate the spatial reconstruction of land use. Based on system theory, this study predicts land demand in 2035 by using a set of socioeconomic factors. Scenarios A–C are then set up according to different socioeconomic factors. Then, combined with the SD model to simulate land demand, the “point–axis” factors are used to simulate the spatial reconstruction characteristics of land use. Furthermore, typical regions are selected to conduct an in-depth analysis of the spatial reconstruction characteristics of rural land use, and policy choices are discussed. The conclusions drawn from the above research results are as follows:
From 2000 to 2010, there was a significant increase in urban construction land in the southern Jiangsu region, mainly focused on the expansion of urban areas in Nanjing, Wuxi, Suzhou, and Changzhou. From 2010 to 2020, the spatial structure of urban–rural land use was relatively stable. Under scenario A, the area of urban construction land and rural residential areas continues to grow up to 2035. The area of cultivated land, forest land, and water bodies will mainly show a decreasing trend. However, there is little difference in the changes in rural residential areas between Scenario A and Scenario C. In Scenario B, the change rate of land area in various regions is relatively low. The areas with significant changes in the spatial structure of urban–rural land use in 2035 mainly include the border area between Jiangning in Nanjing and Jurong in Zhenjiang, the border area between Wujin and Liyang in Changzhou and Wuxi, Taicang in Suzhou along the Yangtze River, and the border area between Taicang and Kunshan. Considering the simulation of land use, the future evolution of urban–rural land is summarized into three models: single-center-driving expansion, patchy expansion near the city center, and multi-center-driving expansion. In order to reduce the future conflicts and contradictions between urban and rural land use, this paper proposes policy recommendations around land use planning, basic farmland construction, and ecological space.
This research also has some limitations. The selection of driving factors is subjective, and although we have referred to a large number of studies in the literature, the choice of different driving factors can affect the research results slightly. In the SD simulation, due to the limitations of remote sensing technology, it is difficult to form accurate continuous time series data from existing land use data. In addition, the expansion of urban construction land is likely to result in rural residential areas being converted to urban land, which this study did not take into account. In the future, we will attempt to screen and construct a scalable driving factor system based on literature dose methods. Also, we will attempt to collaborate with government departments to obtain accurate land use data over a longer period of time. Exploring the interaction mechanism between rural residential areas and urban construction land at the urban–rural boundary through micro-case studies is also one of our future research plans.
Author Contributions
Conceptualization, C.J. and H.C.; methodology, C.J.; software, C.J.; validation, C.J. and H.C.; formal analysis, C.J.; investigation, C.J.; resources, C.J.; data curation, C.J.; writing—original draft preparation, C.J.; writing—review and editing, C.J. and H.C.; supervision, H.C.; project administration, H.C.; funding acquisition, H.C. All authors have read and agreed to the published version of the manuscript.
Funding
This research was funded by the Social Science Foundation of Jiangsu Province, grant number 23ZXZB022, and Supported by the Fundamental Research Funds for the Central Universities, grant number SKYZ2024014.
Data Availability Statement
Some or all data, models, or code that support the findings of this study are available from the corresponding author upon reasonable request.
Acknowledgments
The Corresponding author acknowledges survey support from the Agricultural and Rural Bureau, Natural Resources and Planning Bureau of Wujin District, Changzhou City.
Conflicts of Interest
The authors declare no conflicts of interest.
References
- Jiang, C.J.; Li, J.T.; Liu, J.L. Does urbanization affect the gap between urban and rural areas? Evidence from China. Socio-Econ. Plan. Sci. 2022, 82, 101271. [Google Scholar] [CrossRef]
- Wen, S.S.; Xiao, Q.; Li, J.J.; Li, J.P. The Impact of Agricultural Insurance on Urban-Rural Income Gap: Empirical Evidence from China. Agriculture 2023, 13, 1950. [Google Scholar] [CrossRef]
- Jiang, C.J.; Li, Y.X. The Effect of Government Environmental Concern Strength and Differential Supply of Construction Land on Urban Environmental Protection Pressure. J. Urban Plan. Dev. 2023, 149, 05023033. [Google Scholar] [CrossRef]
- Fan, Y.; Yu, G.M.; He, Z.Y.; Yu, H.L.; Bai, R.; Yang, L.R.; Wu, D. Entropies of the Chinese Land Use/Cover Change from 1990 to 2010 at a County Level. Entropy 2017, 19, 51. [Google Scholar] [CrossRef]
- He, C.Y.; Zhang, J.X.; Liu, Z.F.; Huang, Q.X. Characteristics and progress of land use/cover change research during 1990-2018. J. Geogr. Sci. 2022, 32, 537–559. [Google Scholar] [CrossRef]
- Chen, G.Z.; Zhuang, H.M.; Liu, X.P. Cell-level coupling of a mechanistic model to cellular automata for improving land simulation. Giscience Remote Sens. 2023, 60, 2166443. [Google Scholar] [CrossRef]
- Varga, O.G.; Pontius, R.G.; Szabó, Z.; Szabó, S. Effects of Category Aggregation on Land Change Simulation Based on Corine Land Cover Data. Remote Sens. 2020, 12, 1314. [Google Scholar] [CrossRef]
- Xu, Q.L.; Wang, Q.; Liu, J.; Liang, H. Simulation of Land-Use Changes Using the Partitioned ANN-CA Model and Considering the Influence of Land-Use Change Frequency. Int. J. Geo-Inf. 2021, 10, 346. [Google Scholar] [CrossRef]
- Jiao, M.Y.; Hu, M.M.; Xia, B.C. Spatiotemporal dynamic simulation of land-use and landscape-pattern in the Pearl River Delta, China. Sustain. Cities Soc. 2019, 49, 101581. [Google Scholar] [CrossRef]
- Liu, B.C.; Sun, X.B.; Liu, C.H.; Xiang, J. Supercapacitor module quality prewarning based on the improved whale optimization algorithm and GM (1,1) gray prediction model. Control Eng. Appl. Inform. 2023, 25, 52–59. [Google Scholar] [CrossRef]
- Fu, F.; Jia, X.; Zhao, Q.J.; Tian, F.Z.; Wei, D.; Zhao, Y.; Zhang, Y.Z.; Zhang, J.; Hu, X.; Yang, L.C. Predicting land use change around railway stations: An enhanced CA-Markov model. Sustain. Cities Soc. 2024, 101, 105138. [Google Scholar] [CrossRef]
- Han, Z.; Li, B.D.; Han, Z.P.; Wang, S.Y.; Peng, W.Q.; Liu, X.B.; Benson, D. Dynamic Simulation of Land Use and Habitat Quality Assessment in Baiyangdian Basin Using the SD-PLUS Coupled Model. Water 2024, 16, 678. [Google Scholar] [CrossRef]
- Mei, Z.X.; Wu, H.; Li, S.Y. Simulating land-use changes by incorporating spatial autocorrelation and self-organization in CLUE-S modeling: A case study in Zengcheng District, Guangzhou, China. Front. Earth Sci. 2018, 12, 299–310. [Google Scholar] [CrossRef]
- Zhong, Y.Q.; Zhang, X.X.; Yang, Y.F.; Xue, M.H. Optimization and Simulation of Mountain City Land Use Based on MOP-PLUS Model: A Case Study of Caijia Cluster, Chongqing. Int. J. Geo-Inf. 2023, 12, 451. [Google Scholar] [CrossRef]
- He, Z.J.; Wang, X.B.; Liang, X.; Wu, L.; Yao, J. Integrating spatiotemporal co-evolution patterns of land types with cellular automata to enhance the reliability of land use projections. Int. J. Geogr. Inf. Sci. 2024, 38, 956–980. [Google Scholar] [CrossRef]
- Ito, J. Impediments to efficient land reallocation in agriculture: Multi-agent simulation model of transaction costs and farm retirement. Land Degrad. Dev. 2024, 35, 1553–1566. [Google Scholar] [CrossRef]
- Pawe, C.K.; Saikia, A. Simulating urban land use change trajectories in Guwahati city, India. Int. J. Environ. Sci. Technol. 2024, 21, 4385–4404. [Google Scholar] [CrossRef]
- Liu, X.P.; Liang, X.; Li, X.; Xu, X.C.; Ou, J.P.; Chen, Y.M.; Li, S.Y.; Wang, S.J.; Pei, F.S. A future land use simulation model (FLUS) for simulating multiple land use scenarios by coupling human and natural effects. Landsc. Urban Plan. 2017, 168, 94–116. [Google Scholar] [CrossRef]
- Liang, X.; Liu, X.P.; Li, X.; Chen, Y.M.; Tian, H.; Yao, Y. Delineating multi-scenario urban growth boundaries with a CA-based FLUS model and morphological method. Landsc. Urban Plan. 2018, 177, 47–63. [Google Scholar] [CrossRef]
- Abdallah, A.-H.; Ayamga, M.; Awuni, J.A. Large-Scale Land Acquisition and Household Farm Investment in Northern Ghana. Land 2023, 12, 737. [Google Scholar] [CrossRef]
- Wu, Y.; Nico, H.; Yu, L.H. Beyond the collateral channel: Real estate prices and manufacturing firm investment in China. Int. Rev. Econ. Financ. 2024, 94, 103352. [Google Scholar] [CrossRef]
- Wei, Y.H.D.; Gu, C.L. Industrial development and spatial structure in Changzhou City, China: The restructuring of the Sunan model. Urban Geogr. 2010, 31, 321–347. [Google Scholar] [CrossRef]
- Yuan, F.; Wei, Y.D.; Chen, W. Economic transition, industrial location and corporate networks: Remaking the Sunan Model in Wuxi City, China. Habitat Int. 2014, 42, 58–68. [Google Scholar] [CrossRef]
- Gao, J.L.; Yang, J.; Chen, C.; Chen, W. From forsaken site to model village: Unraveling the multi-scalar process of rural revitalization in China. Habitat Int. 2023, 133, 102766. [Google Scholar] [CrossRef]
- Ci, F.Y.; Wang, Z.H.; Hu, Q. Spatial pattern characteristics and optimization policies of low-carbon innovation levels in the urban agglomerations in the Yellow River Basin. J. Clean. Prod. 2024, 439, 140856. [Google Scholar] [CrossRef]
- Katusiime, J.; Schütt, B.; Mutai, N. The relationship of land tenure, land use and land cover changes in Lake Victoria basin. Land Use Policy 2023, 126, 106542. [Google Scholar] [CrossRef]
- Mao, W.; Jiao, L. Land-use intensification dominates China’s land provisioning services: From the perspective of land system science. J. Environ. Manag. 2024, 356, 120541. [Google Scholar] [CrossRef] [PubMed]
- Sharma, P.; Ajjarapu, V.; Vaidya, U. Data-driven identification of nonlinear power system dynamics using output-only measurements. IEEE Trans. Power Syst. 2022, 37, 3458–3468. [Google Scholar] [CrossRef]
- Yu, B.; Zhang, C.; Kong, L.; Bao, H.L.; Wang, W.S.; Ke, S.P.; Ning, G.B. System dynamics modeling for the land transportation system in a port city. Simul.-Trans. Soc. Model. Simul. Int. 2014, 90, 706–716. [Google Scholar] [CrossRef]
- Lin, Z.Q.; Peng, S.Y. Comparison of multimodel simulations of land use and land cover change considering integrated constraints- A case study of the Fuxian Lake basin. Ecol. Indic. 2022, 142, 109254. [Google Scholar] [CrossRef]
- Wu, J.Y.; Luo, J.A.; Zhang, H.; Qin, S.; Yu, M.J. Projections of land use change and habitat quality assessment by coupling climate change and development patterns. Sci. Total Environ. 2022, 847, 157491. [Google Scholar] [CrossRef] [PubMed]
- Wang, Y.; Shen, J.; Yan, W.; Chen, C. Backcasting approach with multi-scenario simulation for assessing effects of land use policy using GeoSOS-FLUS software. MethodsX 2019, 6, 1384–1397. [Google Scholar] [CrossRef]
- Ma, R.R.; Zhou, W.; Ren, J.; Huang, Y.H.; Wang, H.Y. Multi-scenario simulation and optimization control of ecological security based on GeoSOS-FLUS model in ecological fragile area in northeast Qinghai-Tibet Plateau, China. Ecol. Indic. 2023, 151, 110324. [Google Scholar] [CrossRef]
- Liu, X.R.; Ma, F.F.; Guo, T.Z.; Ding, Z.W. Spatial pattern of China’s rural digital economy based on subjective–objective evaluation: Evidence from 2085 counties. PLoS ONE 2024, 19, e0292249. [Google Scholar] [CrossRef]
- Zhang, H.; Chen, M.X.; Liang, C. Urbanization of county in China: Spatial patterns and influencing factors. J. Geogr. Sci. 2022, 32, 1241–1260. [Google Scholar] [CrossRef]
- Zhang, L.Y.; Ma, X.C. Analysis on the path of digital villages affecting rural residents’ consumption ppgrade: Based on the investigation and research of 164 administrative villages in the pilot area of digital villages in Zhejiang Province. Comput. Intell. Neurosci. 2022, 2022, 1–9. [Google Scholar] [CrossRef]
- Wang, N.; Hao, J.M.; Zhang, L.; Duan, W.K.; Shi, Y.Y.; Zhang, J.Y.; Wusimanjiang, P. Basic farmland protection system in China: Changes, conflicts and prospects. Agronomy 2023, 13, 651. [Google Scholar] [CrossRef]
- Li, S.N.; Zhao, X.Q.; Pu, J.W.; Miao, P.P.; Wang, Q.; Tan, K. Optimize and control territorial spatial functional areas to improve the ecological stability and total environment in karst areas of Southwest China. Land Use Policy 2021, 100, 104940. [Google Scholar] [CrossRef]
- Chen, Y.D.; Xu, F.F. The optimization of ecological service function and planning control of territorial space planning for ecological protection and restoration. Sustain. Comput.-Inform. Syst. 2022, 35, 100748. [Google Scholar] [CrossRef]
- Hu, P.; Zhou, Y.; Zhou, J.H.; Wang, G.X.; Zhu, G.W. Uncovering the willingness to pay for ecological red lines protection: Evidence from China. Ecol. Indic. 2022, 134, 108458. [Google Scholar] [CrossRef]
- Zhang, Y.; Yang, B.G.; Liu, Y.; Wu, S.; Cui, Y.J.; Xu, T.H. High-precision Ecological Protection Red Line Boundary Optimization for Fangshan District, Beijing, China. Sens. Mater. 2023, 35, 835–854. [Google Scholar] [CrossRef]
Disclaimer/Publisher’s Note: The statements, opinions and data contained in all publications are solely those of the individual author(s) and contributor(s) and not of MDPI and/or the editor(s). MDPI and/or the editor(s) disclaim responsibility for any injury to people or property resulting from any ideas, methods, instructions or products referred to in the content. |
© 2024 by the authors. Licensee MDPI, Basel, Switzerland. This article is an open access article distributed under the terms and conditions of the Creative Commons Attribution (CC BY) license (https://creativecommons.org/licenses/by/4.0/).

