Abstract
The frequency and the accumulation of medium–small flood events can cause severe impacts. In a climate change context, real-time monitoring and a fast risk assessment are needed to support the post-disaster phases. The present work presents a novel methodology that leverages the potential of earth observation data to produce a proof-of-concept for flood vulnerability assessment, serving as the basis for a Map Operational Service for the Lombardy region. The proof-of-concept is related to both flood hazard estimation and vulnerability assessment, considering the evaluation of the potentialities of the synthetic aperture radar data when used to feed a downstream service. Using the city of Pavia (Italy), which was affected by a flood event in November 2019, as a case study, we present an integrated flood impact approach that includes a combination of social and physical parameters. The results contribute to a processing chain designed as a pre-operational service where each data analytic retrieves thematic products to support the exposure and damage estimates based on earth observation-derived hazard products for emergency and recovery responses. Three different satellites covered more than 40 h of the flood’s evolution, supporting the great potential of the multi-sensor approach. Therefore, different sensor configurations in terms of spectral bands (X and C bands) and resolutions (from 10 to 1 m) provide a near real-time view of the event. Comparing the results obtained through the three hazard scenarios, a final social and physical Integrated Impact Index is obtained. The added value information leads to the determination of hotspots with which to prioritize effective interventions during emergency and recovery phases, crucial for capturing inherent conditions that allow communities to absorb impacts and cope with a damaging flood event.
1. Introduction
Disasters are a major problem around the world. Between 2010 and 2022, almost 70% of disasters from natural origins worldwide corresponded to floods and storms [1], with climate change, extreme rainfall events, and a rise in sea level being the leading causes. It is impossible to manage absolute prevention or absolute protection against floods [2,3]. However, a deep investigation of flood-prone areas through remote sensing could enable authorities to manage and reduce existing and emerging risks facilitating flood hazards, exposure, and vulnerability modeling at local and regional levels, or at a national level [4].
Vulnerability is understood and defined differently across scientific disciplines, leading to varied measurement methods [5,6]. In risk assessment, various dimensions of vulnerability have been analyzed, including environmental, ecological, physical, economic, social, institutional, cultural, educative, and political aspects [7,8,9]. The most common approach to quantitatively assessing building vulnerability to floods involves flood damage models, such as vulnerability functions, fragility curves, and less frequently, multivariate methods like expert-based approaches [10,11,12,13,14]. Studies that focus on physical vulnerability pursuing floods [15,16,17] usually lack human components. Similarly, social vulnerability assessment, often using interviews [18,19,20,21] or census data [22,23,24], can provide valuable insights into the socio-economic dynamics of the population. Heuristic models are commonly applied using simple and equal weights [25]. These approaches regularly refer to a weight assignment for different indicators to determine a final level of vulnerability [26,27]; however, the weighting process could be applied using different perspectives. For instance, there are examples of the development of vulnerability indexes [23,28]. Well-known examples include the Social Vulnerability Index (SoVI®) created by the University of South Carolina [28] through the utilization of a varimax rotation in the factor analysis, as well as the Social Vulnerability Index (SVI) [23] that uses percentile ranks. Nonetheless, the robustness of the indexes and the replication of the methodology strictly depend on the intrinsic characteristics of the study area and data availability. Integration of physical and social vulnerability usually leads to inaccurate results at local scale [5,29], with some exceptions for studies in coastal areas [30], or studies focusing on economic and social dimensions [22] or evacuation assistance [31]. Generally, the population in flood-prone urban areas [32,33] is unaware of the danger. Traditional approaches in hazard research and mitigation have concentrated only on hazards [34] and structural vulnerability assessments. Although attempts to include social vulnerability have produced results that could be interesting for regional planning [35], they are not suitable for the emergency management of operational services.
The development of new tools and services that consider social and physical flood-related aspects to minimize risks and related negative consequences is needed [36,37]. In the field of disasters, map services have evolved, enhancing their capabilities since the 1980s and 1990s [38], being closely associated with technological capabilities including new techniques, computation, and software improvement. Some services provide on-demand geospatial information for different purposes [39]. Some examples that can be outlined for their consistent global coverage and importance dealing with all types of disasters are the International Charter on Space and Major Disasters (Space Charter); the Center for Satellite-based Crisis Information (ZKI) from the German Aerospace Center (DLR); the Emergency Management Service (EMS) from the Copernicus Programme; and the I Cube-SERTIT from France. Specifically, regarding floods, there are global services like the Dartmouth Flood Observatory (DFO) and the NASA MODIS Near Real-Time Global Flood Product from the USA, as well as GloFAS Global Flood Monitoring (GFM) from the European Union and the services from the United Nations Satellite Centre (UNOSAT). DFO and NASA provide information on flood extent, duration, and magnitude using Modis and Landsat imagery. GFM and UNOSAT, on the other hand, offer the same services but based on Sentinel 1 (hereafter S1). GFM provides the hazard component analysis of the EMS service. In line with this, in Italy, the Italian Space Agency (ASI, in Italian), as one of the competence centers of the Italian Civil Protection, has been working with the competence center network to produce the Map Italy mapping project [40,41]. This project aims to provide operational services using synthetic aperture radar (SAR) technologies, specifically using X-band from COSMO-Sky Med (hereafter, COSMO) to analyze different types of hazards also related to hydrogeological risk. It consists of obtaining SAR data from around Italy’s territory that are reliable, consistent, and constantly updated to serve different applications. Likewise, at the regional level, the Lombardy region (Italy) aims to produce similar services (i.e., Map Lombardy), launching a 2024 pilot test [42] of a future commercial service, the NOCTUA satellite, and using SAR technology in X-band. Map Lombardy is a service that is currently under development to provide core services to the Lombardy region. Pre-operational services are being tested, starting with the study of water resources and land subsidence monitoring for agricultural areas and flood detection. This satellite is part of the IRIDE Constellation from the Italian Piano Nazionale di Ripresa e Resilienza (PNRR). Sixty-nine satellites and eight macro-services, including one for emergency management, will be available by 2026 under the European Space Agency’s (ESA) management. Two SAR sub-constellations are planned (the first 12 right looking MIO orbit simulated using COSMO, the second two right looking dawn-dusk SSO orbit simulated using TSX), which are derived from a user need analysis that has been performed based on users’ demand and technical considerations [43].This new type of user requirements analysis involving various stakeholders, governments, business, researchers, and other public/private institutions, emerged in response to the growing demand for accurate, timely, and reliable information.
Integrating Earth Observation (EO) data can provide valuable geospatial information for effective emergency and disaster management. EO data play a crucial role in determining flood characteristics, which are then used as input for vulnerability studies, considering both natural and human factors. Optical and microwave technologies are used for flood monitoring; however, the synthetic aperture radar (SAR) offers more accurate real-time data on flood extent and water depth due to its cloud and vegetation penetration capabilities [44,45]. For instance, band C (e.g., Sentinel 1, hereafter S1) and band X (e.g., TerraSar-X, hereafter TSX; COSMO) are among the most used bands for flood detection [46,47]. The availability of multitemporal satellite data allows for continuous flood monitoring through pre-operational and operational services [47,48], where SAR has tripled compared to optical sensors [49]. Between 2016 and 2020, SAR imagery was used 76% of the time for flood detection, compared to only 24% for optical sensors, demonstrating its potential [50]. Integrating these advantages with the new IRIDE like SAR technologies can produce clear and actionable results for disaster response. Multi-sensor approaches usually consider one or two satellites [47,51,52]. Thus, satellite Earth Observation, owing to the wide range of remotely sensed information available, plays a major role in the provision of spatial products and offers the opportunity to map highly vulnerable flood-prone areas.
This study aims to measure both physical vulnerability (degree of building damage) [53] and social vulnerability (socio-economic factors affecting disaster susceptibility) [22,54] by leveraging the potential of EO data. We present a novel proof-of-concept (PoC) methodology for flood vulnerability assessment, serving as the basis for a Map Operational Service (MOS) for MapLombardy, utilizing the simulated IRIDE/dawn-dusk satellite. Our work aims to achieve two main goals: (1) utilize multi-sensor SAR imagery for efficient flood detection in urban areas within pre-operational and operational services, facilitating rapid emergency response and recovery; (2) develop an integrated social and physical vulnerability assessment for potential implementation in a mapping service, supporting risk reduction during the prevention, preparedness, and mitigation phases.
2. Materials and Methods
2.1. Methodology Overview
A detailed step-by-step description of the data and methodology is presented in Figure 1. The main processes include hazard detection, exposure delineation, physical damage, and social vulnerability calculation, in addition to integrated (physical and social) impacts. A final total vulnerability assessment is developed to be implemented as a new potential product into an MOS. The methodology is a processing chain applied to the three sensors, with two of them—COSMO and TSX—being X band sensors that are considered valuable to simulate NOCTUA-like data, and the third—the Sentinel 1—being the only one already operational, enables to guarantee the quality of data and the operational path of the service.
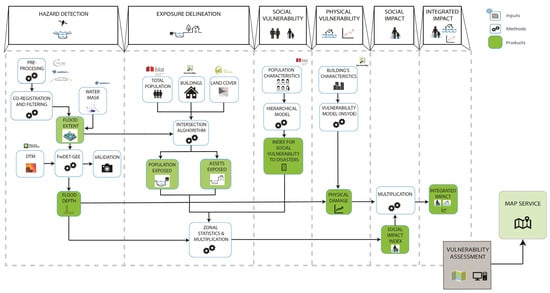
Figure 1.
Vulnerability assessment workflow.
The PoC is related to the entire processing chain, from the flood hazard detection to the vulnerability assessment, considering the evaluation of the potentialities of the data as the first objective when used to feed a downstream service like the one designed using the MapItaly program for the Lombardy region.
2.2. Hazard EstimationDetection—Water Extent and Water Depth
First, we tested the flood’s extension to assess the capacity of different sensors to simulate NOCTUA-like derived products. The three different SAR satellite data imagery sources—COSMO, TSX, and S1—provided the inputs to develop three flood scenarios. For hazard delineation, it was necessary to acquire two sets of data, one prior or post-flood and one during the flood [55]. Two images per sensor were selected, one before or after the event occurrence (pre- or post-flood image) and the other during the flood.
Data pre-processing included radiometric calibration, as well as speckle filtering using a 3 × 3 Lee filter to reduce noise [56,57,58] suitable for high-texture areas like urban zones [59] for S1 and a 3 × 3 Median filter, which was better for noise reduction and for removing blurred effects for TSX and COSMO [60]. Then, a terrain correction procedure was performed using a 5 m digital terrain model (DTM). To determine flooded areas, we have co-registered the images into a stack, performed a pixel-to-pixel difference [59,61], and resampled the data. Finally, a supervised classification (i.e., maximum likelihood) was used to determine flooded areas from the differences in the backscatter (flooded areas usually have lower backscatter values). Additionally, a water mask was created using Sentinel 2 (S2) to determine the water conditions and extension before the event. A combination of spectral indexes was utilized, including the Normalized Difference Water Index (NDWI), Modified Normalized Difference Water Index (MNDWI), Automated Water Extraction Index no shadow (AWEInsh), and Sentinel Water Mask (SWM) [60,62] to finally compute a compound water mask.
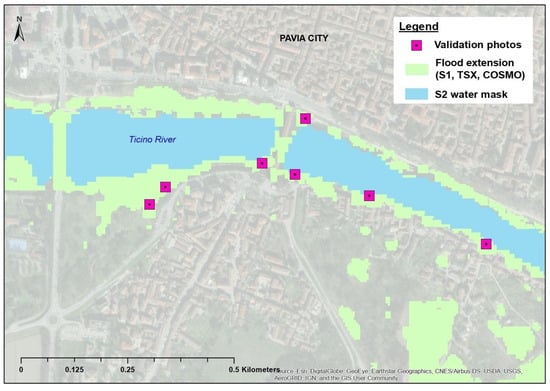
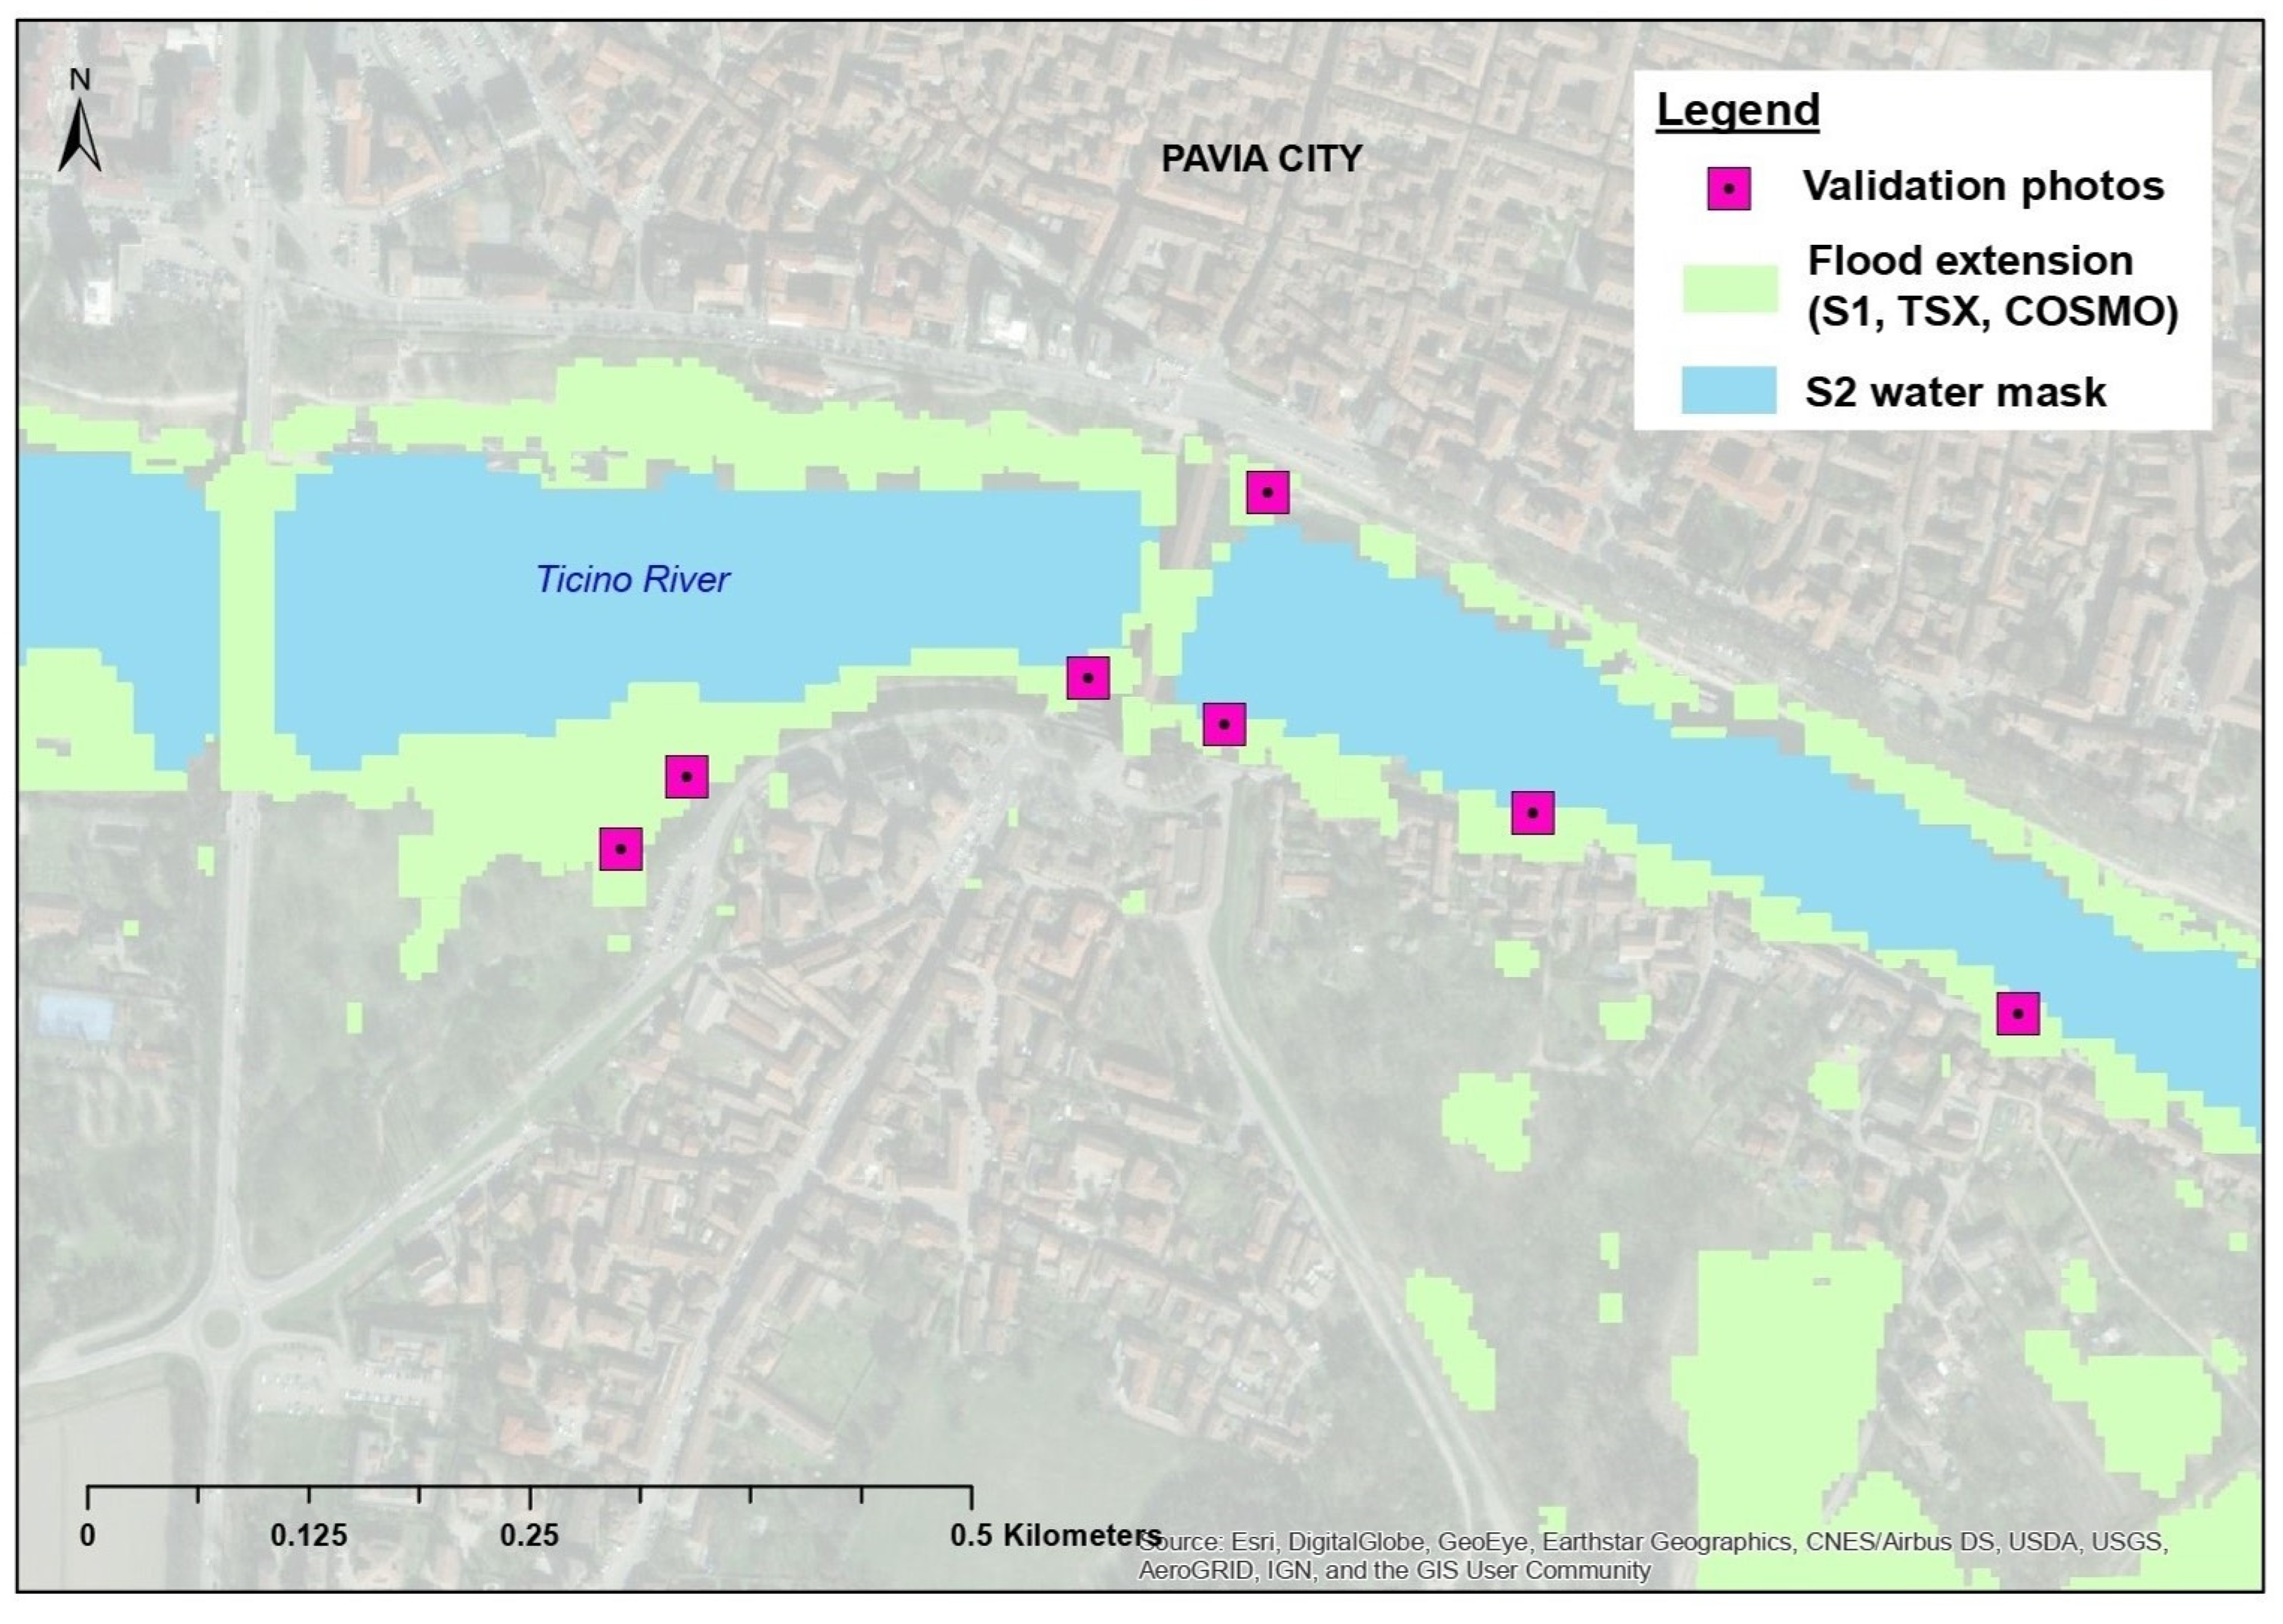
Validation of flood extent was performed by using ground photographs of the days of the event from mass media and local news. Photos taken mainly in the most exposed residential areas have been used to determine the precise position of the water and evaluate the correspondence with the satellite-based flood extent maps.
To determine flood depth, a Floodwater Depth Estimation Tool (FwDET-GEE), produced by the University of Alabama [63,64] and implemented in Google Earth Engine [27,65] was applied. This tool uses DTM as input data. The method extracts the maximum elevation of the water surface from a digital elevation model (DEM) and deduces the elevation of any location along the cross-section.
2.3. Exposure Delineation
People and assets exposed to flood hazards tend to be concentrated in low-lying sites along rivers [66]. Exposed elements, such as buildings and population information, are usually stored in a database using Geographic Information Systems (GISs). Commonly, data gathering includes geoportals, national statistics institutions, and global or federal repositories. To assess the exposed population, polygons were desegregated based on building characteristics Equation (1) to assume the number of people per building.
where Dp = disaggregated population, Tp = total population, To = total buildings, FA = footprint area, and NF = N of floors per building.
Additionally, land cover in raster format was collected. Finally, derived hazard products from S1, COSMO, and TSX (i.e., flood extent and water depth) were overlaid using spatial analyst tools with element at-risk data (i.e., number of buildings, damage, and types of land cover). Statistic parameters like mean, standard deviation, minimum and maximum values of the exposed assets, and population were obtained as added value-added geospatial information.
2.4. Vulnerability Assessment
2.4.1. Social Vulnerability Analysis
Social vulnerability analysis assists in producing insights into the inhabitants social characteristics. For this, heuristic models are commonly applied using simple and equal weights [25]. These approaches regularly refer to a weight assignment for different indicators to determine a final level of vulnerability [26,27]. However, the weighting process could be applied using a different perspective.
The present approach looks to implement an analytical hierarchy process (AHP) [67] to determine social vulnerability. AHP consists of constructing a pair-wise comparison matrix to establish the indicators’ importance by using some reference values (Table 1). Each indicator is compared to the other to determine which one is more relevant based on its inherent importance, i.e., what is the population’s coping capacity against a potential disaster like a flood. Then, a normalization of the values Equation (2) and the calculation of the final weights was performed.
where Nv is the normalized value and Vi = i-th value.

Table 1.
Reference values to determine the importance of each indicator.
An index was created using multiplying absolute and relative indicator values using criteria weights and then classifying them into five categories (very low to very high) and computing the Index for Social Vulnerability against Disasters (ISVD) (Table 2) [68].
Table 2.
Matrix for calculation of the Index for Social Vulnerability against Disasters, considering 5 categories: very low (light green), low, medium, high, and very high (red).
2.4.2. Probabilistic Approach to Physical Vulnerability
Flood damages can be classified as direct (physical contact with humans and assets) [69] or indirect (within areas not directly adjacent to flood zones) [70]. Here, we kept our focus on direct damages. A probabilistic method has been used as a probabilistic flood physical damage model of buildings. We applied the INSYDE model (in-depth synthetic model for flood damage estimation) [71] to calculate buildings’ damage. The model performed a component-by-component analysis (i.e., clean-up, removal, structural parts, finishing, windows and doors, building systems) to determine the absolute damage to the residential buildings.
The INSYDE model includes a reference price list (in EUR) [71] that was used to define the costs derived for the component’s full replacements and, therefore, to calculate the overall total damage per building. The hazard and building characteristics (Appendix A and Appendix B) have been used as input data to estimate only the residential buildings. Direct impacts have been computed using the function observed in Equation (3) [70].
where D represents the direct physical impact, N = nodes that are hit by the hazard, C = direct cost to repair the physical damage [71], Cn = cost of the single node, Hn = hazard intensity that hits the node, Vn = physical vulnerability that hits the node.
2.4.3. Integrated (Physical and Social) Impact
A Social Impact Index was created to estimate the flood’s impact on the population. This index, part of the vulnerability assessment, supports decision-making in flood control [72] by examining the effects of the flood event on individuals [73]. This type of impact represents a quantitative combination of flood depth, population exposure, and the ISVD (Equation (4). It is classified into 5 categories using Natural Breaks classification method from very high to very low. To obtain a single value within the index, we used the flood depth mean value obtained from the multi-sensor computation.
Sii = Social Impact Index, Fd = flood depth, Pe = population exposed.
Finally, integrated impacts [71,74] usually include parameters from heterogeneous types of impacts. The current case deals with building damage (including exposed buildings) and the Social Impact Index, which are computed according to Equation (5). Moreover, using Natural Breaks classification method, 5 categories ranging from very high to very low were used to depict the index.
Iii = to Integrated Impact Index, Tda = mean values of total damage of buildings from S1, COSMO, and TSX.
The current model shows how a combination of simple tools can provide a vulnerability assessment of floods and can be potentially incorporated as an MOS, specifically, at an urban scale.
2.5. Study Case
2.5.1. Location and Flood History
Italy experienced 145 flood-related deaths and 40,000 evacuations between 2010 and 2016 [75], with Lombardy being one of the most affected regions [76]. Within the region, the city of Pavia (9°9′0″; 45°6′0″) is located along the Ticino River (Figure 2), which is part of the Po River basin. The city has 71,159 inhabitants and shows a smooth topography, with elevation values from 60 to 80 m above sea level (ASL). It has a continental climate with significant daily and annual temperature ranges.

Figure 2.
Pavia city administrative area and Ticino River. In red the Lombardy region.
Because of its topographic and climate characteristics, Pavia has a combination of riverine floods and local heavy rainfall events. The most frequent floods occur due to Ticino River overflow. The 2000 event saw the highest water level (6.2 m), and 2019 had several hazardous events, with November 2019 receiving double the average rainfall (279 mm) [77]. Most frequent flood events occur in Pavia due to the Ticino River’s bank overflowing. The historical highest peak was in 2000 when the water height reached 6.2 m over the baseline. Since 2010, the most hazardous events have taken place in 2014, 2016, and 2019 (Figure 3). This study focuses on the November 25 2019 flood in Pavia, analyzing the water flow and its impact. On this day, the water flow height reached 3.81 m. Between 2001 and 2015, Ticino River’s annual average flow was 324.43 m3/s, with November averaging 428.41 m3/s [77]. Official estimates placed the 2019 flood damage at 250,699 EUR [78].
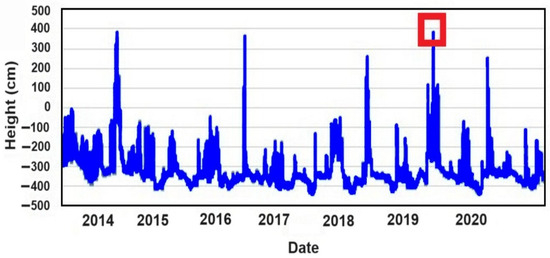
Figure 3.
Water height in the Ticino River from 2014 to 2020, considering local measurement and baseline. In red is the event of November 2019 [76].
2.5.2. Data Sources
Following the detailed step-by-step methodology described in Section 2.2, Section 2.3 and Section 2.4, we first focused on hazard definition (2.2). S1 images were characterized using vertical–vertical (VV) polarization acquired using the interferometric wide swath (IW) mode. The first S1 image was acquired one month before the flood, on 26 October 2019 (Table 3). At the same time, the second S1 image was acquired a few hours before the flood peak occurred between 01:30 and 02:00 PM on 25 November 2019 (Figure 4). Considering the daily mean, this was the closest acquisition to the flood limb matching the product type, polarization, incidence angle, and normal river surface runoff. COSMO images were acquired post-flood (shortly after the peak) and two days after the return to normal runoff conditions using horizontal–horizontal (HH) polarization in the Stripmap mode. Regarding COSMO, the image acquisition occurred only three hours after the flood peak and the second two days after the event, when the Ticino’s River runoff returned to normal values. Both images were acquired with a horizontal–horizontal (HH) polarization using the Stripmap mode. Finally, TSX images were chosen with an HH polarization in the Stripmap mode. The first TSX image was acquired two months before the flood to match the first image with similar characteristics during normal hydrological conditions. Meanwhile, the second TSX image was acquired during the flood falling limb, approximately 40 h after the peak. The Lombardy Geoportal provided the DTM (dated from 2015), and an S2 image from 13 November 2019 was used for land cover analysis. The DTM used within the hazard determination was obtained from the Lombardy Geoportal in 2015 [79]. Finally, the S2 image was from 13 November 2019, when runoff reflected average values.
Table 3.
Characteristics of the SAR imagery used in the study case.
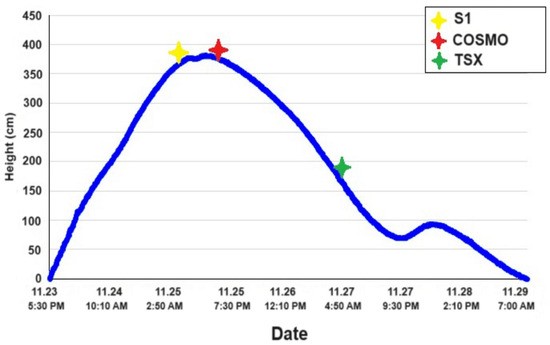
Figure 4.
Water height of Ticino River on the flood event of Pavia in November 2019 and SAR data acquisition time.
Regarding the exposure (2.3), the number and the building type were obtained from the open-source Open Street Map (OSM) [80] and the Geoportal of the Lombardy Region [79]. The latter contains useful indicators like the building area and the number of floors. Land cover from 2018 was obtained from the COPERNICUS Corine Land Cover (CLC) program [81], a raster dataset where the minimum width of linear elements was 100 m.
Social vulnerability data from the Italian National Institute of Statistics [82] included indicators like number of families, young/elderly population, foreigners, education level, and unemployment, aligned with commonly used indicators [83] and accessed at the census tract level, with a length ranging from 20–30 m (urban) to a few km (rural areas).
3. Results
The results of the analyses populate the two main tasks of the research: one related to a deeper understanding of the potential and limitations of different satellite SAR data to produce flood hazard maps and one related to the use of the flood hazard map to develop a vulnerability model able to integrate social and physical components using the city of Pavia flood as showcase. The readiness of the prototype model is presented as a pre-operational service to support emergency and recovery response; therefore, it is organized in a downstream flow from data to the preoperational products, passing through the algorithm implementation.
The data, namely, COSMO, TSX, and Sentinel 1, provided slightly different results from the acquisition moment and from the differences in the tracks and geometry of the three acquisitions. The great potential of the multi-sensor approach is due to the temporal coverage of the event: three images covered more than 40 h of the evolution of the flood extent and depth, supporting the idea that different sensor configurations in terms of polarization (X and C bands) and resolutions (from 10 to 1 m) would support a near-real-time view of the dynamic of the event. In the following results, the first part presents the details in terms of surface estimations obtained with NOCTUA-like sensors (COSMO and TSX) that proved to be able to capture the urban assets better than Sentinel 1, which, instead, probably relates to a different polarization (C-band) that is more suitable to retrieve rural assets (e.g., agriculture-forestry landscapes), providing, again, the potential of operating in synergy.
The processing chain is designed to run on a cloud-based capability, considering the need to be scaled in an operational emergency service. Each data analytic retrieves thematic products to support the exposure and damage estimates based on flood extent and depth. Unless the geospatial analysis is based on the overlapping features of the social vulnerability and the integration of social and physical assets, the damage estimation is a probabilistic chain component. This probabilistic damage estimation is presented for the buildings, and the chain does not include the rural landscape damage estimations. The pre-operational thematic products are presented by comparing the results given using the three hazard scenarios obtained with the three sensors in a final social and physical integrated impact.
3.1. Hazard Detectiont
The application of the FwDET-GEE main hazard results can be seen in Figure 5. In addition, some basic statistics are shown to characterize the flood extent and flood depth of the event (Table 4). On plain areas like Pavia, the specular backscattering of SAR and high-resolution flood mapping is straightforward. The processed pixel size of S1 was 8.9 m; for COSMO, it was 1.9 m, and, for TSX, it was 1.8 m. This denotes some divergences between the distribution and extension. Extracted flood boundaries depend on the spatial resolution, especially at the building scale level. There are also differences due to higher backscatter from flooded vegetation, urban structures, or a rough water surface. Since the S1 pixel is four times bigger than COSMO and TSX, less accuracy is detected. However, polarization also creates divergences in the results because it states how the signal is transmitted; therefore, the final backscatter changes. Current TSX and COSMO imagery is produced and received in HH, while S1 imagery is in VV. Using SAR data, a clear distinction between the variation in coherence from unstable scatterers and the changes caused by a flood event is observed. Fewer misclassifications of water-non water using vertical–vertical (VV) polarization were found [84,85]. The COSMO lower water extent values (247 ha) in comparison to S1 (259.3 ha) are also explained by the fact that the image acquisition was performed as far as 9°13′54″ long; therefore, western areas of the river and the city were not captured. In addition, as discussed above, low TSX values (204.8 ha) are more closely related to the image acquisition, which took place 40 h after the flood peak. Regarding water depth, higher values above the 99th percentile are usually outliers; therefore, to avoid an overestimation, they were not considered in the model [51,86]. The findings show the same mean for TSX and S1 (0.13 m) and slightly less for COSMO (0.09 m). The maximum depth for TSX (2.02 m) is around 10 cm higher than S1 (1.92 m) and COSMO (1.38). Standard deviations were between 0.2 and 0.3 for all three, suggesting that COSMO data are more clustered, while S1 and TSX are more scattered. NOCTUA’s X-band sensor has similar characteristics to TSX, with a spatial resolution of up to 1.5 m. A binary flood classification was compared to reference photos from 25–27 November (Appendix C), strategically chosen across the flooded area.
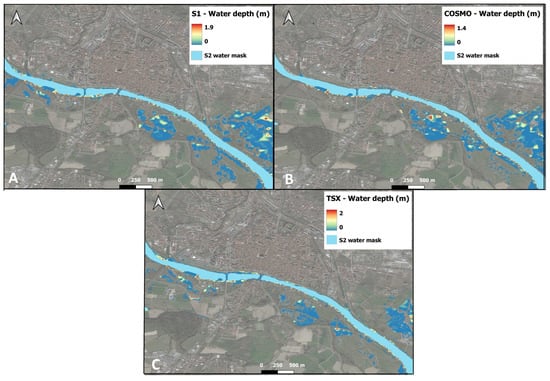
Figure 5.
Flood extension and water depth for S1 (A), COSMO (B), and TSX (C).
Table 4.
Main characteristics of TSX, S1, and COSMO water extent and water depth.
3.2. Exposure Delineation-Assets and Population
A total of 30 residential buildings (4149.18 m2) were affected according to COSMO, 24 according to S1 (3955.17 m2), and 19 according to TSX (3807.95 m2) (Table 5). In total, 125 citizens were affected according to COSMO products, 109 according to S1, and 99 according to TSX. Land use from CLC was divided into six categories: impervious areas, permanent crops (vineyards, fruit trees, olive groves), green urban areas, pastures, forests, and arable lands (annual crops). Overall, considering the CLC classes for COSMO, 238.04 ha was affected, which is similar to S1 (240.95 ha) and slightly less for TSX (184.46 ha). Specifically, the category most affected by the flood for all three sensors was arable lands, followed by forest and then pastures, which, altogether, represented 95.8% for COSMO (47.3% arable, 29.3 forest, 19.2% pastures), 96.53% for S1 (45.8% arable, 29.28% forest, 21.45% pastures), and 94.04% for TSX (56.36% for arable, 21.25% forest, 16.46% pastures). On the other hand, impervious areas represented only 1.4% for COSMO, 1% for S1, and 2.4% for TSX.
Table 5.
Exposed elements considering COSMO, S1, and TSX.
Despite slight differences among the sensors, COSMO detected higher values of population and buildings. When compared with CLC, the general trend is similar, with some differences among class values.
3.3. Vulnerability Assessment
3.3.1. Index for Social Vulnerability against Disasters
The ISVD was created by combining absolute and relative values (Figure 6), following the combination given in Table 2. Very high vulnerability is distributed heterogeneously in the city. Blocks in the central part of the city usually have lower values [87,88], and populations with lower resources are driven to the suburbs of the cities [89]. The results show that, in general, areas along the Ticino River have high or medium vulnerability, except for surrounding rural areas that have low vulnerability.

Figure 6.
The results of the ISVD are shown. Empty areas represent no data on residential population characteristics. The southern part is outside Pavia and excluded from the model.
3.3.2. Probabilistic Approach to Physical Vulnerability
By applying the INSYDE model we obtained residential buildings’ stage–damage curves. For TSX, a total of 1,046,175 EUR of damage was computed, while, for S1, the amount reached 1,266,575 EUR; for COSMO, it was 1,176,595 EUR. By observing the distribution of water depth, the COSMO curve function is much steeper, having a higher increase until 1.1 m (Figure 7) compared to the other. This is likely because the imagery was acquired only three hours after the flood peak encompassing more buildings was exposed. Moreover, the TSX curve function becomes steeper when the water depth exceeds 0.5 m according to the values of the water depth of the built-up areas (Figure 5c) close to the riverbanks. Meanwhile, the S1 curve function steepness after 1 m decreases by nearly 0.5 m of water depth, likely because higher water depth values occur where there is less infrastructure (Figure 5a). The total damage, considering each residential building (Figure 8), produces a multimodal distribution that is slightly skewed on the right, where most of the damage is concentrated.
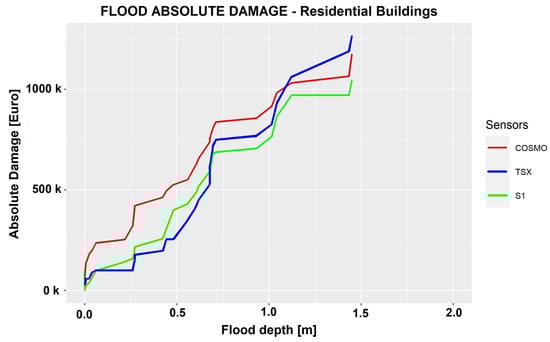
Figure 7.
Accumulative absolute damage of residential buildings considering the flood depth.
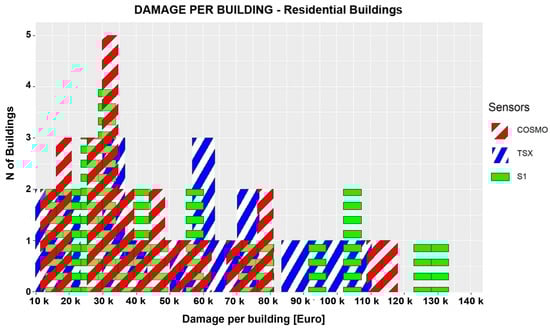
Figure 8.
Absolute damage per building, considering the number of buildings.
3.3.3. Social and Physical Integrated Impact
Social Impact Index results are shown in Figure 9a. As explained in 2.4, social impact was calculated based on census tracks. Prevailing polygons refer to very low categories; however, there are a few that range from low to very high, and they are close to the south side of the river. In studying the impact on structures, the results on integrated impacts (Figure 9b) show differences among the residential buildings along the riverside. Very high and high values are concentrated in the central part of the area, while the low and very low impacts are distributed in the western and eastern areas. No particular impacts were found in the northern part of the riverside, probably because of topographic characteristics (higher elevation), which acted as a barrier, avoiding flood spread.

Figure 9.
This figure shows the results of the social (A) and integrated impacts (B). Empty polygons in (A) did not have ISVD information.
4. Discussion
The configuration and optimization of pre-operational and operational services depend on the application of simple but efficient methods that could lead to quick and accurate mapping products and added value geoinformation to support emergency and post-disaster phases. The development of these services plays a key role in the early warning systems (EWS) and response phase in the disaster risk management framework (DRM). Thus, this paper is oriented to provide added value products to operational emergency services—in particular, to Risk and Recovery Mapping—to support emergency management activities. Particularly, the obtained information on flood extent and water depth would offer a comprehensive assessment of the flood event that is useful in the preparedness and recovery phases, as well as the concept of integrated impacts, which is crucial for capturing inherent conditions that allow communities to absorb impacts and cope with a damaging flood event. These value-added products provide significant geospatial information to create strategic protocols and action plans to address the most severe impacts of a flood-related disaster. This is linked to the already-mentioned MOS for MapLombardy. NOCTUA-based studies serve to develop the dawn-dusk SAR constellation of IRIDE dedicated to security service. Two sub-constellations of X-band SAR will be implemented with a very high revisit time and spatial resolution (1.5 m to 6 m). The security service is entirely tailored to the user’s needs and require the development of new technologies and tools that contribute to consolidating downstream services, especially for the emergency service. These services collect data from multiple sources (EO, proximal, and in situ), considering the existing data and robust models, such as the one developed in this study. Therefore, developed products at local and regional levels can provide new and relevant information that can contribute to the Copernicus EMS’s three service components, such as EMS On-Demand Mapping with Rapid Mapping, Risk and Recovery Mapping, and Validation (all disasters); EMS Early Warning and Monitoring for floods, fires, and droughts; EMS Exposure Mapping.
A methodology has been developed that combines threshold methods for flood detection and heuristics and probabilistic approaches for vulnerability assessment. The readiness of the prototype model is presented as a pre-operational service. This is organized in a downstream flow from data to the pre-operational products passing through the algorithm’s implementation with insights into the fulfillment of users’ operational needs, flood management, and emergency implications.
4.1. Users’ Operational Needs Fulfillment
In the last decade, mission details have been driven by user needs [39]. Particularly, the EO system has a main aim to respond to user needs expressed by the National User Forum: the system must be user-driven. This characteristic is extremely relevant for the downstream segment (MapLombardy and related thematic services), which is directly accessible and benefits the users. Therefore, the service definition and design require the collection of institutional user needs, considered an expression of a qualified demand, their translation into specific technical requirements, and the final definition of operational requirements, ensuring that the services delivered by MapLombardy are fully compliant with user needs and can be easily integrated into their process to accomplish, in the first instance, law obligations at a national and Europe-wide level, as well as to support decision-making processes. IRIDE accounted for 150 user needs, of which 104 are related to SAR constellations [43], where NOCTUA has been contextualized.
Good and exhaustive results at the local scale are somehow easier to achieve by using multiple sources. Local governments should consider using multi-source satellite imagery that could lead to improved monitoring hazard determination, especially for flood events. IRIDE constellation, including NOCTUA, would fulfill part of these requirements. Results can help a wide range of public and private actors such as the National Civil Protection, regional environmental agencies (ARPA, Agenzia Regionale per la Protezione Ambientale), paying agencies, Reclamation Consortia, regional governments, basin authorities, universities and research centers, insurance companies, industries, and others. In particular, we take into consideration the requirements collected within the Copernicus Italian User Forum for SAR products and services reported in several other studies [90,91]. A particular interest in flood-related products has been indicated as part of the Water Resource and Emergency services by the following actors: eGeos, the Regional Agency for the Protection of the Environment (Agenzia Regionale per la Protezione Ambientale—ARPA) (e.g., ARPA Lombardia, ARPAe Abruzzo, ARPA Puglia), TRE ALTAMIRA, Operative Center for Hydrology—Marche region, Guardia di Finanza (Finance Police). The specific interests of these users are detailed in Appendix D, describing the pertinent requirements that the above-mentioned users are interested in and the relevant spatial resolution, temporal frequency, and spectral band needed to monitor the requirement. From this perspective, the results of this paper align with many of the requirements expressed by users and, therefore, fulfill several national and international legislation conditions.
4.2. Hazard Detection and Exposure Delineation
After analyzing the results concerning flood determination by co-registering the images into a stack and performing a pixel-to-pixel comparison, some aspects should be noted that are related to the concepts of latency, revisit time, and spatial resolution. For flood monitoring, medium and small floods are usually unavailable [50] due to latency and revisit time gaps. Whereas, a COSMO time latency of 12 h allows the fastest pre-process imagery; however, its revisit time (16 days) restricts the flood detection probability and imagery acquisition close to the rising and falling limb, which is crucial when estimating flood extent and water depth. In this sense, S1 provides a higher revisit time that is useful to derive a rapid flood footprint. Furthermore, the TSX (1.8 m) and COSMO (1.9 m) higher spatial resolutions influence the level of details produced at the local scale both in terms of water body pixel accuracy and, consequently, of exposed assets and population quantification. NOCTUA satellites are expected to have an even better resolution and, therefore, be able to detect smaller events.
A thorough investigation of floods through satellite monitoring could enable authorities to manage and reduce existing and emerging risks, as the physical elements directly affect society and its economic activities [92]. Flood monitoring systems like GFM have been developed to help prepare and warn people of emanating danger. However, it is essential to know the level of assets potentially affected. Multi-sensor SAR technologies facilitate this type of monitoring of the exposed buildings. The current study case assets exposed were mainly arable, forest, and pasture lands. Summing up, all three categories accomplished between 94 and 96% of the total area. However, it is the impervious areas, including residential buildings and the population, which usually cover a smaller area and receive more damage than rural areas [69,93]. Even though COSMO acquisition was as far as 9° 13′ 54″ long, omitting the western part of Pavia, the image remains the nearest after the flood peak, detecting more buildings and population than S1 and TSX. Still, the consequences could be seen 48 h after the peak, when the TSX overpassed the area, and where 99 people and 19 buildings were surrounded by water.
4.3. Vulnerability Assessment
Social vulnerability models can explain disaster outcomes [24]. Their indexes can be used in all phases of the disaster cycle from mitigation and preparedness through to response and recovery [23]. In the current case, the ISVD was developed, focusing on some of the characteristics of the population, and this is crucial to analyze when facing an emergency due to a flood event. Six indicators were considered, and a pair-wise comparison matrix was completed to obtain a final ISVD. Both relative and absolute values were included to develop the index with heterogeneous results. The selection of absolute and relative values is connected to the fact that only absolute values can mislead which areas are more vulnerable. City managers need to consider both. The results from the ISVD show very high vulnerability randomly distributed around the city, which is derived from the original data. There are census blocks that are critical to monitor, like the ones along the Ticino River, with values from medium to very high.
When dealing with water depth, a series of hurdles have emerged (Figure 7). Affected residential buildings are presented exclusively on the south riverside, correlated with lower DTM values, and, therefore, a widespread flood area. S1 and COSMO present more heterogeneous concentrations of damage, while the affected structures of the TSX results are mainly confined to the areas that remained flooded in the falling limb.. A probabilistic approach using Insyde showed an increase in damage to the infrastructure. Differences are observed when comparing the model damage simulation (between 1000 and 1200 k EUR, depending on the sensor) and that registered by the Municipality (250 k EUR). This discrepancy could be explained by the model not adequately accounting for the protective measures adopted by the local community. In the considered area, residents appear to be periodically exposed to flooding. In response to this threat, people take protective measures such as partially replacing or reconstructing parts of the building (such as doors, walls, or windows), rather than completely overhauling the entire structure. The model may overestimate damages [94] as it likely assumes a complete replacement or reconstruction of the whole building in the event of a flood. It is essential to note that the model may not adequately consider local risk mitigation practices, resulting in overestimating damages. The protective measures adopted by the community, not factored into the model, can lower the physical vulnerability of the building, contributing to an actual reduction in damages compared to the model’s estimates. The current analysis does not cover impacts like chemical or biological actions.
4.4. Flood Management and Emergency Implications
Vulnerability assessment is useful in engaging with policymakers at different levels and furthering national and regional response strategies. More information and communication are always needed to understand the way disasters are outlined [95]. Current results try to emphasize that vulnerability to flood hazards is also seen as a social product, not just regarding the physical location of the assets [66,96], like current EMS deliverables. Vulnerability is a compound phenomenon [97]. The inclusion of qualitative scores quantifying social impacts helps to understand the level of resistance and resilience needed for a better decision-making process during an emergency. Flood management emergency strategies have overlooked the important social dimensions of public hazard understanding and vulnerability. The application of an Integrated Impact Index could lead to the determination of hotspots like polygons and buildings (Figure 9b), which generate added value to a vulnerability assessment and a rapid mapping process. Thus, it could effectively contribute to producing a more accurate EWS. Indeed, during and in the immediate aftermath of a flood, the availability of integrated impacts could support decision-makers and rescue workers who require rapid and detailed status reports to quickly identify affected areas, conduct rescue activities and evacuations, define resource allocation, and implement mitigation measures. Using EO in the last years, global exposure components like built-up areas and population have been developed by the Global Human Settlement Layer (GHSL) from Copernicus, quantifying population at 250 m per pixel and build-up areas up to 30 m. In addition, examples of social vulnerability products such as map services include the Global Earthquake Model (GEM) and social vulnerability map [74]. Still, there are missing integrated impacts that could lead to further improvement in developing a map service for an emergency, especially at the regional and local scales.
Further improvement of the application of the Integrated Impact Index would require the creation of polygons with higher resolution. Usually, in urban areas they are built according to the number of households and the characteristics of the terrain [98], according to Census methodology without considering a risk assessment perspective. These census-based products should be reconsidered according to a building scale, especially in a context where services like MapLombardy seek to produce innovative and exhaustive mapping products. Other aspects should be considered at the local and regional scales, like population growth [99] and increasing urbanization, the decay of the infrastructure, and the potential impact of climate change where more extreme events are expected.
Rivers like Ticino usually produce small or medium floods every 2 or 3 years (Figure 3). Infrequent flood events can create a false sensation of safety in the local population. Therefore, there has been no consideration or determination of the danger of the hazard. Current global map services (Space Charter, EMS, ZKI, ICube-SERIT) in emergencies only provide products when entities and organizations at regional, national, and international levels require an activation, usually when a disaster hits a specific area and severe damage is detected. Medium and small events are usually avoided. National services like MapItaly, which have been acquiring hundreds of thousands of images on a Stripmap mode, or regional like MapLombardy, using the new NOCTUA capabilities, expect to fill those gaps. The output of the MOS flooding component improves the understanding of the social and economic impacts of flood risk at the regional level and contributes as a decision-support tool for cost-effective flood risk reduction and mitigation.
5. Conclusions
The current PoC performed a study of the benefits of multi-sensor SAR imagery-based flood detection analysis by addressing some of their different potentialities at regional and local scales. GFM and UNOSAT, using exclusively S1 imagery, or NASA and DFO, using MODIS, are limited temporally and spatially.
Variations in the spatial resolution, polarization, and exact date of the imagery have provided the key to understanding the determination of the flood extension, flood depth, and assets and population affected. Flooded impervious areas represented only around 1/2% of the assets, but damage per square meter is usually higher than in rural or agricultural areas. A physical model disposed of some steps on all vulnerability curves is used to show the evolution of the absolute damage on residential buildings. Similar patterns were found in S1, COSMO, and TSX, with the total damage ranging between 1000 and 1200 k EUR. Multi-sensor map services can improve the accuracy as well as better understand the evolution of flooding, especially when using SAR images that can be collected during the day, at night, and in any weather conditions. IRIDE’s new constellation will enhance national capabilities in emergencies, where current global map services are covering only a part of hazard events. Furthermore, the NOCTUA SAR sensor provides MOS for MapLombardy, which is currently developing the current flood vulnerability assessment. User requirement analysis has been particularly helpful in determining the products and sensor characteristics among the IRIDE constellation.
Compound vulnerability plays a key role in understanding the social impact analysis as well as the physical components of the current PoC. Pre-operational and operational map services in which disasters are framed lead to establishing further potentialities of vulnerability factors and dynamic temporal and spatial changes. Societies at risk should have the capacity to respond and cope quickly with a disaster. The current Integrated Impact Index for flooded areas, established by the determination of hotspots, should be considered as a priority tool development in the context of Climate Change, where more extreme events are occurring, but also with the increasing number of medium and small flood events. The investment of local government and other skate-holders in this type of rapid mapping services should be a priority.
Author Contributions
Conceptualization, A.T., E.S. and I.G.; methodology, I.G., M.R., M.A. and E.V.; software, I.G.; validation, I.G.; formal analysis, I.G.; investigation, I.G. and S.S.; resources, A.T.; data curation, I.G.; writing—original draft preparation, I.G.; writing—review and editing, I.G., A.T., M.R., M.A., S.S. and A.T.; visualization, I.G.; supervision, A.T. and M.R.; project administration, A.T.; funding acquisition, A.T. All authors have read and agreed to the published version of the manuscript.
Funding
This study has been partially funded by the project NOCTUA “Landscape Monitoring. For Everyone. From Space” funded under the Regional Operative Program (POR) of Lombardy Region 2014–2020, call hub innovation and research (Project ID: 1179775), and by the Italian National Resilience and Recovery Plan (PNRR) M1C2-25—Investment 4.1.2: Satellite Technology and Spatial Economy, Financed by the European Union—NextGenerationEU, Purchase Order N. 5001035211 (Call for Views on the EO PNRR System And/Or Element Architecture).
Data Availability Statement
Sentinel-1 and Sentinel-2 data were obtained from ESA and are freely available from the Copernicus Open Access Hub portal https://dataspace.copernicus.eu/ (accessed on 25 June 2023). TerraSAR-X data were obtained from DLR and are available from the EOWEB GeoPortal https://eoweb.dlr.de/egp/ (accessed on 14 May 2023) with the permission of DLR. COSMO-Sky Med data were obtained from the COSMO Portal https://portal.cosmo-skymed.it/CDMFE/home (accessed on 01 April 2023) with the permission of ASI. Copernicus products were obtained from the Copernicus Land Monitoring Service https://land.copernicus.eu/en/products (accessed on 7 August 2023). Building data were obtained from Open Street Maps https://www.geofabrik.de/data/ (accessed on 4 January 2023). Ground truth damage estimation was obtained from Regione Lombardia https://sicurezza.servizirl.it/web/protezione-civile/rasda (accessed on 5 July 2023) and digital elevation models were freely downloaded from the Regione Lombardia—Open Data Geoportal https://www.geoportale.regione.lombardia.it/home (accessed on 4 August 2023). Population characteristics were obtained from the Italian National Statistical Institute (ISTAT) https://www.istat.it/ (accessed on 29 June 2023). River discharge and precipitation data from ARPA were used https://www.arpalombardia.it/ (accessed on 4 April 2023).
Conflicts of Interest
The authors declare no conflicts of interest.
Appendix A
Hazard parameters considered in Insyde. Adapted from [68].
| Variable | Unit of Measurement | Range | Default Values | Input Values |
| Water depth outside the building (he) | m | ≥0 | [0;0.5] Incremental step: 0.01 | [0–5.5] Incremental step: 0.05 |
| Water depth inside the building (for each floor) (h) | m | [0;1H] | h = f(he, GL) | h = f(he, GL) |
| Max velocity of the water perpendicularly to the building (v) | m/s | ≥0 | 0.5 | 0.5 |
| Sediment load (s) | % on the water volume | [0;1] | 0.05 | 0.05 |
| Duration of the flood event (d) | hours | >0 | 24 | 36 |
| Water quality (presence of pollutants) (q) | - | 0: No 1: Yes | 1 | 1 |
Appendix B
Building characteristics parameters of the Insyde model. Adapted from [68].
| Variable | Unit of Measurement | Range | Default Values | Input Values |
| Footprint area (FA) | m2 | >0 | 100 | [12.6; 23,666.2] |
| Internal area (IA) | m2 | >0 | 0.9xFA | 0.9xFA |
| Basement area (BA) | m2 | ≥0 | 0.5xFA | 0.5xFA |
| External perimeter (EP) | m | >0 | 4xξ | [14.2; 2794.9] |
| Internal perimeter (IP) | m | >0 | 2.5 EP | 2.5 EP |
| Basement perimeter (BP) | m | >0 | 4xξ | 4xξ |
| Number of floors (NF) | - | ≥1 | 2 | [1; 4] |
| Interfloor height (IH) | m | >0 | 3.5 | 3.5 |
| Basement height (BH) | m | >0 | 3.2 | 3.2 |
| Ground floor level (GF) | m | [-IH; >0] | 0.1 | 0.1 |
| Basement level (BL) | m | <0 | -GL-BH-0.3 | -GL-BH-0.3 |
| Building type (BT) | - | 1: Detached house 2: Semi-detached house 3: Apartment house | 1 | [1; 2; 3] |
| Building structure (BS) | - | 1: Reinforced concrete 2: Masonry | 2 | [1; 2] |
| Finishing level (i.e., building quality) (FL) | - | 0.8: low 1: medium 1.2: high | 1.2 | 1.2 |
| Level of maintenance (LM) | - | 0.9: low 1: medium 1.1: high | 1.1 | [0.9; 1; 1.1] |
| Year of construction (YY) | - | ≥0 | 1994 | [1880; 2015] |
| Heating system distribution (PD) | - | 1: centralized 2: distributed | 1 if YY ≤ 1990 2 otherwise | 1 if YY ≤ 1990 2 otherwise |
| Heating system type (PT) | - | 1: radiator 2: pavement | 2 if YY ≥ 2000 and FL > 1 1 otherwise | 2 if YY ≥ 2000 and FL > 1 1 otherwise |
Appendix C
Validation points from 25–27 November. In light green, a combination of flood extensions detected using S1, TSX, and COSMO.
Appendix D
The table from the Italian User Forum indicates operational user requirements, related technical resolutions, and associated policies and laws for water resources using SAR. Includes water resources and emergencies where flooding is one of the main targets.
| Services | Requirement Description | Spatial Resolution | Temporal Frequency | SWAT | Spectral Band | Italian Legislation | EU Legislation |
| Water resource | Products to support hydrological and hydraulic modeling, flood forecasting, and sediment management | 1 m × 1 m | daily | Regional/ Local | NA | D. Lgs. 152/2006 e s.m.i. D. Lgs. 30/2009 D.M. MATTM 260/2010 D.D. MATTM 465/STA (2016) D.M. MATTM 86/2016 D.Lgs. 49/2010 | 2000/60/EC 2006/118/CE COM(2007) 414 final |
| Water resource | Products to support hydrological and hydraulic modeling, flood forecasting, and sediment management | 5 m × 5 m | monthly | NA | X | D. Lgs. 152/2006 e s.m.i. D. Lgs. 30/2009 D.M. MATTM 260/2010 D.D. MATTM 465/STA (2016) D.M. MATTM 86/2016 D.Lgs. 49/2010 | 2000/60/EC 2006/118/CE COM(2007) 414 final |
| Water resource | Products to support hydrological and hydraulic modeling, flood forecasting, and sediment management | 10 m × 10 m | daily | Regional | C/X | D. Lgs. 152/2006 e s.m.i. D. Lgs. 30/2009 D.M. MATTM 260/2010 D.D. MATTM 465/STA (2016) D.M. MATTM 86/2016 D.Lgs. 49/2010 | 2000/60/EC 2006/118/CE COM(2007) 414 final |
| Water resource | Hydromorphological characterization and monitoring of streams. Diachronic analysis of river courses and related water levels; evolution of the reticulum and its anatomization over time—ordinary if not in a flood emergency | 5 m × 5 m | monthly | NA | X | D. Lgs. 152/2006 e s.m.i. D. Lgs. 49/2010 D. Lgs 28/2011 D.M. MATTM 260/2010 D.M. MATTM (2004) D.Lgs 112/98 L. 132/2016 | 2000/60/EC 2007/60/EC 2009/28/EC |
| Water resource | Hydromorphological characterization and monitoring of streams. Diachronic analysis of river courses and related water levels; evolution of the reticulum and its anatomization over time—ordinary if not in a flood emergency | 1 m × 1 m | 15 days | Regional | X | ||
| Water resource | Hydromorphological characterization and monitoring of streams. Diachronic analysis of river courses and related water levels; evolution of the reticulum and its anatomization over time—ordinary if not in a flood emergency | 1 m × 1 m | trimester | Local | X | D. Lgs. 152/2006 e s.m.i. D. Lgs. 49/2010; D. Lgs 28/2011 D.M. MATTM 260/2010 D.M. MATTM (2004) D.Lgs 112/98; L. 132/2016 | 2000/60/EC 2007/60/EC 2009/28/EC |
| Water resource | Services to support identification of target species’ habitat and description of environmental status | <1 m | annual | Regional | C/X | ||
| Water resource | Sub-surface water leakage identification and monitoring; restoration-emergency monitoring | 10 m × 10 m | trimester | Local | L | Water Framework Directive (2000/60/EC) Bathing Water Directive (2006/7/EC) | |
| Water resource | Automatic changes in multi-temporal surface water levels; soil moisture trends for correlations with water balance—ordinary if not flood or drought phases | 1 m × 1 m | daily | Regional | L | D. Lgs. 152/2006 e s.m.i. D. Lgs. 30/2009 D.M. MATTM 260/2010 D.D. MATTM 465/STA (2016) D.M. MATTM 86/2016 D.M. MATTM (2004) | 2000/60/EC 2007/60/EC 2006/118/CE COM(2007) 414 final |
| Water resource | Drought Scenario Assessment by Emergent Status | 1 m × 1 m | daily | Regional | NA | D. Lgs. 152/2006 e s.m.i. D. Lgs. 30/2009 D.M. MATTM 260/2010 D.D. MATTM 465/STA (2016) D.M. MATTM 86/2015 | 2000/60/EC 2006/118/CE COM(2007) 414 final |
| Water resource | Drought Scenario Assessment by Emergent Status | 5 m × 20 m | daily | Regional | NA | D. Lgs. 152/2006 e s.m.i. D. Lgs. 30/2009 D.M. MATTM 260/2010 D.D. MATTM 465/STA (2016) D.M. MATTM 86/2015 | 2000/60/EC 2006/118/CE COM(2007) 414 final |
| Water resource | Drought Scenario Assessment by Emergent Status | 10 m × 10 m | weekly | Regional | NA | D. Lgs. 152/2006 e s.m.i. D. Lgs. 30/2009 D.M. MATTM 260/2010 D.D. MATTM 465/STA (2016) D.M. MATTM 86/2015 | 2000/60/EC 2006/118/CE COM(2007) 414 final |
| Emergency | Mapping the extent of flooding | 1 m × 1 m | daily | Local | X | ° D.Lgs. 139/2006 (artt. 1 e 24) ° DPR 64/2012 (artt.56, 63, 64,65) ° DM 29.1.2019 (Allegato 1) ° D. Lgs. N.1 del 2.1.2018 ° DPCM 20.2.2019 | Direttiva Alluvioni |
| Emergency | Mapping the extent of flooding | 1 m × 1 m | daily | NA | C/X | ° D.Lgs. 139/2006 (artt. 1 e 24) ° DPR 64/2012 (artt.56, 63, 64,65) ° DM 29.1.2019 (Allegato 1) ° D. Lgs. N.1 del 2.1.2018 ° DPCM 20.2.2019 (Azione 20) ° Accordo quadro CNVVFASI ° Circolare DIPVVF n.1/2011 | |
| Emergency | Mapping the extent of flooding | 10 m × 10 m | daily | Local | C/X | ° D.Lgs. 139/2006 (artt. 1 e 24) ° DPR 64/2012 (artt.56, 63, 64,65) ° DM 29.1.2019 (Allegato 1) ° D. Lgs. N.1 del 2.1.2018 (Codice di Protezione Civile Artt. 10, 17, 18, 21) ° DPCM 20.2.2019 (Azione 20) ° Accordo quadro CNVVFASI ° Circolare DIPVVF n.1/2011 | |
| Emergency | Monitoring of flood level over time from SAR data compared with a “0” level referenced to the digital terrain model | <1 m | daily | Local | X | ° D.Lgs. 139/2006 (artt. 1 e 24) ° DPR 64/2012 (artt.56, 63, 64,65) ° DM 29.1.2019 (Allegato 1) ° D. Lgs. N.1 del 2.1.2018 ° DPCM 20.2.2019 (Azione 20) ° Accordo quadro CNVVF-ASI ° Circolare DIPVVF n.1/2011 | |
| Emergency | Monitoring of flood level over time from SAR data compared with a “0” level referenced to the digital terrain model | 1 m × 1 m | daily | NA | X | ° D.Lgs. 139/2006 (artt. 1 e 24) ° DPR 64/2012 (artt.56, 63, 64,65) ° DM 29.1.2019 (Allegato 1) ° D. Lgs. N.1 del 2.1.2018 ° DPCM 20.2.2019 (Azione 20) ° Accordo quadro CNVVF-ASI ° Circolare DIPVVF n.1/2011 |
References
- EM-DAT, the International Disaster Database. CRED/UCLouvain. Available online: https://emdat.be/frontpage (accessed on 6 June 2023).
- Ardaya, A.B.; Evers, M.; Ribbe, L. What influences disaster risk perception? Intervention measures, flood and landslide risk perception of the population living in flood risk areas in Rio de Janeiro state, Brazil. Int. J. Disaster Risk Reduct. 2017, 25, 227–237. [Google Scholar] [CrossRef]
- Scott, M.; White, I.; Kuhlicke, C.; Steinführer, A.; Sultana, P.; Thompson, P.; Minnery, J.; O’Neill, E.; Cooper, J.; Adamson, M.; et al. Living with flood risk/The more we know, the more we know we don’t know: Reflections on a decade of planning, flood risk management and false precision/Searching for resilience or building social capacities for flood risks?/Participatory floodplain management: Lessons from Bangladesh/Planning and retrofitting for floods: Insights from Australia/Neighbourhood design considerations in flood risk management/Flood risk management—Challenges to the effective implementation of a paradigm shift. Plan. Theory Pract. 2013, 14, 103–140. [Google Scholar] [CrossRef]
- Wang, Y. Advances in Remote Sensing of Flooding. Water 2015, 7, 6404–6410. [Google Scholar] [CrossRef]
- Birkmann, J. Risk and vulnerability indicators at different scales: Applicability, usefulness and policy implications. Environ. Hazards 2007, 7, 20–31. [Google Scholar] [CrossRef]
- Shitangsu, P. Vulnerability concepts and its applications in various fields: A review on geographical perspective. J. Life Earth Sci. 2013, 8, 63–81. [Google Scholar] [CrossRef]
- Natenzon, C.; Marlenko, N.; González, S.; Ríos, R.; Barrenechea, J.; Murgida, A.; Boudin, M.; Ludueña, S.; Gentile, E. Vulnerabilidad Social Estructural. In El Cambio Climático en el Río de la Plata; Barros, V., Menéndez y, A., Nagy, G., Eds.; CIMA: Buenos Aires, Argentina, 2005; pp. 121–130. [Google Scholar]
- González, S. Ciudad Visible vs. Ciudad Invisible. Gestión Urbana y Manejo de las Inundaciones en la Baja Cuenca del Arroyo Maldonado. Ph.D. Thesis, Phylosophy and Literature School, University of Buenos Aires, Buenos Aires, Argentina, 2009; 507p. [Google Scholar]
- Birkmann, J.; Cardona, O.D.; Carreño, M.L.; Barbat, A.H.; Pelling, M.; Schneiderbauer, S.; Kienberger, S.; Keiler, M.; Alexander, D.; Zeil, P.; et al. Framing vulnerability, risk and societal responses: The MOVE framework. Nat. Hazards 2013, 67, 193–211. [Google Scholar] [CrossRef]
- Malgwi, M.; Bawa, S.F.; Keiler, M. A generic physical vulnerability model for floods: Review and concept for data-scarce regions. Nat. Hazards Earth Syst. Sci. 2020, 20, 2067–2090. [Google Scholar] [CrossRef]
- Nofal, O.M.; van de Lindt, J.W.; Do, T.Q. Multi-variate and single-variable flood fragility and loss approaches for buildings. Reliab. Eng. Syst. Saf. 2020, 202, 106971. [Google Scholar] [CrossRef]
- Thapa, S.; Shrestha, A.; Lamichhane, S.; Adhikari, R.; Gautam, D. Catchment-scale flood hazard mapping and flood vulnerability analysis of residential buildings: The case of Khando River in eastern Nepal. J. Hydrol. Reg. Stud. 2020, 30, 100704. [Google Scholar] [CrossRef]
- Schröter, K.; Kreibich, H.; Vogel, K.; Riggelsen, C.; Scherbaum, F.; Merz, B. How useful are complex flood damage models? Water Resour. Res. 2014, 50, 3378–3395. [Google Scholar] [CrossRef]
- Wyncoll, D.; Gouldby, B. Integrating a multivariate extreme value method within a system flood risk analysis model. J. Flood Risk Manag. 2013, 8, 145–160. [Google Scholar] [CrossRef]
- Papathoma-Köhle, M.; Kappes, M.; Keiler, M.; Glade, T. Physical vulnerability assessment for alpine hazards: State of the art and future needs. Nat. Hazards 2011, 58, 645–680. [Google Scholar] [CrossRef]
- Zhang, S.; Zhang, L.; Li, X.; Xu, Q. Physical vulnerability models for assessing building damage by debris flows. Eng. Geol. 2018, 247, 145–158. [Google Scholar] [CrossRef]
- Englhardt, J.; de Moel, H.; Huyck, C.K.; de Ruiter, M.C.; Aerts, J.C.; Ward, P.J. Enhancement of large-scale flood risk assessments using building-material-based vulnerability curves for an object-based approach in urban and rural areas. Nat. Hazards Earth Syst. Sci. 2019, 19, 1703–1722. [Google Scholar] [CrossRef]
- Chan, N.; Parker, D.J. Response to dynamic flood hazard factors in peninsular Malaysia. Geogr. J. 1996, 162, 313–325. [Google Scholar] [CrossRef]
- Steinführer, A.; Kuhlicke, C. Social Vulnerability and the 2002 Flood: Country Report Germany (Mulde River). FLOOD Site Report T11-07-08, 2007. Available online: https://repository.tudelft.nl/islandora/object/uuid:c6ba6a90-13aa-488b-a5b3-efd7c816251a?collection=research (accessed on 31 May 2023).
- Brouwer, R.; Akter, S.; Brander, L.; Haque, E. Socioeconomic vulnerability and adaptation to environmental risk: A case study of climate change and flooding in Bangladesh. Risk Anal. 2007, 27, 313–326. [Google Scholar] [CrossRef]
- Ajibade, I.; McBean, G.; Bezner-Kerr, R. Urban flooding in Lagos, Nigeria: Patterns of vulnerability and resilience among women. Glob. Environ. Chang. 2013, 23, 1714–1725. [Google Scholar] [CrossRef]
- Greiving, S.; Fleischhauer, M.; Lückenkötter, J. A methodology for an integrated risk assessment of spatially relevant hazards. J. Environ. Plan. Manag. 2007, 49, 1–19. [Google Scholar] [CrossRef]
- Flanagan, B.E.; Gregory, E.W.; Hallisey, E.J.; Heitgerd, J.L.; Lewis, B. A Social Vulnerability Index for Disaster Management. J. Homel. Secur. Emerg. Manag. 2011, 8, 0000102202154773551792. [Google Scholar] [CrossRef]
- Rufat, S.; Tate, E.; Emrich, C.T.; Antolini, F. How valid are social vulnerability models? Ann. Am. Assoc. Geogr. 2019, 109, 1131–1153. [Google Scholar] [CrossRef]
- Tate, E. Uncertainty analysis for a social vulnerability index. Ann. Am. Assoc. Geogr. 2012, 103, 526–543. [Google Scholar] [CrossRef]
- Taramelli, A.; Valentini, E.; Sterlacchini, S. A GIS-based approach for hurricane hazard and vulnerability assessment in the Cayman Islands. Ocean Coast. Manag. 2015, 108, 116–130. [Google Scholar] [CrossRef]
- Taramelli, A.; Righini, M.; Valentini, E.; Alfieri, L.; Gatti, I.; Gabellani, S. Building-scale flood loss estimation through enhanced vulnerability pattern characterization: Application to an urban flood in Milano, Italy. Nat. Hazards Earth Syst. Sci. 2022, 22, 3543–3569. [Google Scholar] [CrossRef]
- Cutter, S.L.; Boruff, B.J.; Shirley, W.L. Social vulnerability to environmental hazards. Soc. Sci. Q. 2003, 84, 242–261. [Google Scholar] [CrossRef]
- Fekete, A.; Damm, M.; Birkmann, J. Scales as a challenge for vulnerability assessment. Nat. Hazards 2010, 55, 729–747. [Google Scholar] [CrossRef]
- Boruff, B.J.; Emrich, C.; Cutter, S.L. Erosion hazard vulnerability of US coastal counties. J. Coast. Res. 2005, 21, 932–942. [Google Scholar] [CrossRef]
- Chakraborty, J.; Tobin, G.A.; Montz, B.E. Population evacuation: Assessing spatial variability in geophysical risk and social vulnerability to natural hazards. Nat. Hazards Rev. 2005, 6, 23–33. [Google Scholar] [CrossRef]
- Coulibaly, M. Spatial analysis of an urban flash flood survey results. Geocarto Int. 2008, 23, 217–234. [Google Scholar] [CrossRef]
- Klemas, V. Remote sensing of floods and flood-prone areas: An overview. J. Coast. Res. 2015, 31, 1005–1013. [Google Scholar] [CrossRef]
- Mustafa, D. Structural causes of vulnerability to flood hazard in Pakistan. Econ. Geogr. 1998, 74, 289–305. [Google Scholar] [CrossRef]
- Cian, F.; Giupponi, C.; Marconcini, M. Integration of earth observation and census data for mapping a multi-temporal flood vulnerability index: A case study on Northeast Italy. Nat. Hazards 2021, 106, 2163–2184. [Google Scholar] [CrossRef]
- Taramelli, A.; Valentini, E.; Righini, M.; Filipponi, F.; Geraldini, S.; Nguyen Xuan, A. Assessing Po River Deltaic Vulnerability Using Earth Observation and a Bayesian Belief Network Model. Water 2020, 12, 2830. [Google Scholar] [CrossRef]
- Morelli, A.; Taramelli, A.; Bozzeda, F.; Valentini, E.; Colangelo, M.A.; Cueto, Y.R. The disaster resilience assessment of coastal areas: A method for improving the stakeholders’ participation. Ocean Coast. Manag. 2021, 214, 105867. [Google Scholar] [CrossRef]
- Pedersen, J.P.; Seljelv, L.G.; Bauna, T.; Strøm, G.D.; Follum, O.A.; Andersen, J.H.; Wahl, T.; Skøelv, Å. Towards an operational oil spill detection service in the Mediterranean? The Norwegian experience: A pre-operational early warning detection service using ERS SAR data. Spill Sci. Technol. Bull. 1996, 3, 41–46. [Google Scholar] [CrossRef]
- Schiavon, E.; Taramelli, A.; Tornato, A.; Pierangeli, F. Monitoring environmental and climate goals for European agriculture: User perspectives on the optimization of the Copernicus evolution offer. J. Environ. Manag. 2021, 296, 113121. [Google Scholar] [CrossRef]
- Pierdicca, N.; Chini, M.; Pulvirenti, L.; Macina, F. Integrating physical and topographic information into a fuzzy scheme to map flooded area by SAR. Sensors 2008, 8, 4151–4164. [Google Scholar] [CrossRef]
- Milillo, P.; Shanker, A.P.; Pascale, S.; Serio, C.; Sdao, F. Persistent scatterer interferometry based on COSMO-SkyMed imagery. In Proceedings of the 33rd EARSeL Symposium Towards Horizon 2020: Earth Observation and Social Perspectives, Matera, Italy, 3–6 June 2013; pp. 187–194. [Google Scholar]
- Giglio, E.; Dejana, M.; Bevilacqua, M. NOCTUA: Potenzialità innovative per l’Osservazione della Terra. In GEOMEDIA; GEOmedia: San Antonio, TX, USA, 2021; Volume 4, pp. 18–23. [Google Scholar]
- Conti, F.; Eugeni, M.; Bove, M.; Marzioli, P.; Marini, L.; Pasquali, M.; Schiavon, E.; Nguyen Xue, A.; Tornato, A.; Geraldini, S.; et al. A Model-based approach for the preliminary design of the SAR Upstream element for the Italian IRIDE EO constellation based on users’ demand. Adv. Space Res. 2023, accepted. [Google Scholar]
- Martinis, S.; Twele, A.; Voigt, S. Towards Operational near Real-Time Flood Detection Using a Split-Based Automatic Thresholding Procedure on High Resolution TerraSAR-X data. Nat. Hazards Earth Syst. Sci. 2009, 9, 303–314. [Google Scholar] [CrossRef]
- Mason, D.; Davenport, I.; Neal, J.; Schumann, G.; Bates, P. Near Real-Time Flood Detection in Urban and Rural Areas Using High-Resolution Synthetic Aperture Radar Images. Geoscience and Remote Sensing. IEEE Trans. Geosci. Remote Sens. 2012, 50, 3041–3052. [Google Scholar] [CrossRef]
- Cohen, J.; Riihimäki, H.; Pulliainen, J.; Lemmetyinen, J.; Heilimo, J. Implications of boreal forest stand characteristics for X-band SAR flood mapping accuracy. Remote Sens. Environ. 2016, 186, 47–63. [Google Scholar] [CrossRef]
- Pulvirenti, L.; Squicciarino, G.; Fiori, E.; Ferraris, L.; Puca, S. A Tool for Pre-Operational Daily Mapping of Floods and Permanent Water Using Sentinel-1 Data. Remote Sens. 2021, 13, 1342. [Google Scholar] [CrossRef]
- Geraldini, S.; Bruschi, A.; Bellotti, G.; Taramelli, A. User Needs Analysis for the Definition of Operational Coastal Services. Water 2021, 13, 92. [Google Scholar] [CrossRef]
- Taramelli, A.; Valentini, E.; Piedelobo, L.; Righini, M.; Cappucci, S. Assessment of State Transition Dynamics of Coastal Wetlands in Northern Venice Lagoon, Italy. Sustainability 2021, 13, 4102. [Google Scholar] [CrossRef]
- Wania, A.; Joubert-Boitat, I.; Dottori, F.; Kalas, M.; Salamon, P. Increasing Timeliness of Satellite-Based Flood Mapping Using Early Warning Systems in the Copernicus Emergency Management Service. Remote Sens. 2021, 13, 2114. [Google Scholar] [CrossRef]
- Matgen, P.; Hostache, R.; Schumann, G.; Pfister, L.; Hoffmann, L.; Savenije, H.H.G. Towards an automated SAR-based flood monitoring system: Lessons learned from two case studies. Phys. Chem. Earth Parts A/B/C 2011, 36, 241–252. [Google Scholar] [CrossRef]
- Henry, J.; Chastanet, P.; Fellahand, K.; Desnos, Y.-L. Envisat multipolarized ASAR for flood mapping. Int. J. Remote Sens. 2006, 27, 1921–1929. [Google Scholar] [CrossRef]
- Kang, H.; Kim, Y. The physical vulnerability of different types of building structure to debris flow events. Nat. Hazards 2016, 80, 1475–1493. [Google Scholar] [CrossRef]
- Climent-Gil, E.; Aledo, A.; Vallejos-Romero, A. The social vulnerability approach for social impact assessment. Environ. Impact Assess. Rev. 2018, 73, 70–79. [Google Scholar] [CrossRef]
- Wang, Y.; Colby, J.D.; Mulcahy, K.A. An efficient method for mapping flood extent in a coastal flood plain using Landsat TM and DEM data. Int. J. Remote Sens. 2002, 23, 3681–3696. [Google Scholar] [CrossRef]
- Lee, J.S. Digital image enhancement and noise filtering by use of local statistics. IEEE Trans. Pattern Anal. Mach. Intell. 1980, PAMI-2, 165–168. [Google Scholar] [CrossRef]
- Lee, J.S. Digital image smoothing and the sigma filter. Comput. Vis. Graph. Image Process. 1983, 24, 255–269. [Google Scholar] [CrossRef]
- Yang, L.; Driscol, J.; Sarigai, S.; Wu, Q.; Lippitt, C.D.; Morgan, M. Towards Synoptic Water Monitoring Systems: A Review of AI Methods for Automating Water Body Detection and Water Quality Monitoring Using Remote Sensing. Sensors 2022, 22, 2416. [Google Scholar] [CrossRef]
- Sebastianelli, A.; Del Rosso, M.P.; Ullo, S.L.; Gamba, P. A speckle filter for Sentinel-1 SAR ground range detected data based on residual convolutional neural networks. IEEE J. Sel. Top. Appl. Earth Obs. Remote Sens. 2021, 15, 5086–5101. [Google Scholar] [CrossRef]
- Shaikh, M.A.; Khiradeb, P.W.; Sayyada, S.B. Speckle Noise Filtering of Microwave X-Band High Resolution Spotlight Mode TerraSAR-X SAR Image. Bionano Front. 2015, 8, 2320–9593. [Google Scholar]
- Chini, M.; Hostache, R.; Giustarini, L.; Matgen, P. A hierarchical split-based approach for parametric thresholding of SAR images: Flood inundation as a test case. IEEE Trans. Geosci. Remote Sens. 2017, 55, 6975–6988. [Google Scholar] [CrossRef]
- Milczarek, M.; Robak, A.; Gadawska, A. Sentinel Water Mask (SWM)-new index for water detection on Sentinel-2 images. In Proceedings of the 7th Advanced Training Course on Land Remote Sensing, Gödöllo, Hungary, 4–9 September 2017. [Google Scholar]
- Cohen, S.; Brakenridge, G.R.; Kettner, A.; Bates, B.; Nelson, J.; McDonald, R.; Huang, Y.-F.; Munasinghe, D.; Zhang, J. Estimating Floodwater Depths from Flood Inundation Maps and Topography. J. Am. Water Resour. Assoc. 2018, 54, 847–858. [Google Scholar] [CrossRef]
- Cohen, S.; Raney, A.; Munasinghe, D.; Loftis, J.D.; Molthan, A.; Bell, J.; Rogers, L.; Galantowicz, J.; Brakenridge, G.R.; Kettner, A.J.; et al. The Floodwater Depth Estimation Tool (FwDET v2.0) for improved remote sensing analysis of coastal flooding. Nat. Hazards Earth Syst. Sci. 2019, 19, 2053–2065. [Google Scholar] [CrossRef]
- Peter, B.; Cohen, S.; Lucey, R.; Munasinghe, D.; Raney, A. A Google Earth Engine implementation of the Floodwater Depth Estimation Tool (FwDET-GEE). Harv. Dataverse 2020, V5. [Google Scholar] [CrossRef]
- Few, R. Flooding, vulnerability and coping strategies: Local responses to a global threat. Prog. Dev. Stud. 2003, 3, 43–58. [Google Scholar] [CrossRef]
- Saaty, T.L.; Vargas, L.G. Hierarchical analysis of behavior in competition: Prediction in chess. Syst. Res. Behav. Sci. 1980, 25, 180–191. [Google Scholar] [CrossRef]
- SAYDS. Social Vulnerability, Hazards and Risks Social Vulnerability. In Third National Communication from Argentinian Republic to the United Nations Framework Convention on Climate Change Project, Component 2; Centro de Investigaciones del Mar y la Atmósfera: Buenos Aires, Argentina, 2015. [Google Scholar]
- Merz, B.; Kreibich, H.; Schwarze, R.; Thieken, A. Review article “Assessment of economic flood damage”. Nat. Hazards Earth Syst. Sci. 2010, 10, 1697–1724. [Google Scholar] [CrossRef]
- Arosio, M.; Martina, M.L.; Creaco, E.; Figueiredo, R. Indirect Impact Assessment of Pluvial Flooding in Urban Areas Using a Graph-Based Approach: The Mexico City Case Study. Water 2020, 12, 1753. [Google Scholar] [CrossRef]
- Dottori, F.; Figueiredo, R.; Martina, M.L.V.; Molinari, D.; Scorzini, A.R. INSYDE: A synthetic, probabilistic flood damage model based on explicit cost analysis. Nat. Hazards Earth Syst. Sci. 2016, 16, 2577–2591. [Google Scholar] [CrossRef]
- Brouwer, R.; Van Ek, R. Integrated ecological, economic and social impact assessment of alternative flood control policies in the Netherlands. Eco. Econ. 2004, 50, 1–21. [Google Scholar] [CrossRef]
- Di Mauro, M.; De Bruijn, K.M.; Meloni, M. Quantitative methods for estimating flood fatalities: Towards the introduction of loss-of-life estimation in the assessment of flood risk. Nat. Hazards 2012, 63, 1083–1113. [Google Scholar] [CrossRef]
- Burton, C.G.; Silva, V. Integrated risk modelling within the Global Earthquake Model (GEM): Test case application for Portugal. In Proceedings of the Second European Conference on Earthquake Engineering and Seismology, Istanbul, Turkey, 24–29 August 2014; Volume 2529. 10p. [Google Scholar]
- Minotulo, A.; Zampetti, G. Ecosistema Rischio. Monitoraggio sulle Attività delle Amministrazioni Comunali per la Mitigazione del Rischio Idrogeologico; LegAmbiente: Roma, Italy, 2017; pp. 24–25. [Google Scholar]
- AVI Project—Consiglio Nazionale delle Ricerche. Available online: http://avi.gndci.cnr.it/ (accessed on 6 June 2022).
- ARPA Lombardy. Available online: https://www.arpalombardia.it/Pages/ARPA_Home_Page.aspx (accessed on 17 June 2022).
- RASDA—Raccolta Schede Danni—Lombardy Region. Available online: https://www.regione.lombardia.it/wps/portal/istituzionale/HP/DettaglioServizio/servizi-e-informazioni/Enti-e-Operatori/protezione-civile/rasda-raccolta-schede-danni/rasda-raccolta-schede-danni (accessed on 12 August 2022).
- Geoportale Regione Lombardia. Available online: https://www.geoportale.regione.lombardia.it/home (accessed on 15 June 2022).
- Geofabrik, Open Street Maps. Available online: https://www.geofabrik.de/data/ (accessed on 15 June 2022).
- Copernicus Land Monitoring Service. Available online: https://land.copernicus.eu/pan-european/corine-land-cover/clc2018 (accessed on 20 April 2023).
- ISTAT. Istituto Nazionale di Statistica. Available online: https://www.istat.it/it/archivio/104317 (accessed on 10 May 2022).
- Bigi, V.; Comino, E.; Fontana, M.; Pezzoli, A.; Rosso, M. Flood vulnerability analysis in urban context: A socioeconomic sub-indicators overview. Climate 2021, 9, 12. [Google Scholar] [CrossRef]
- Twele, A.; Cao, W.; Plank, S.; Martinis, S. Sentinel-1-based flood mapping: A fully automated processing chain. Int. J. Remote Sens. 2016, 37, 2990–3004. [Google Scholar] [CrossRef]
- Clement, M.; Kilsby, C.; Moore, P. Multi-temporal synthetic aperture radar flood mapping using change detection. J. Flood Risk Manag. 2017, 11, 152–168. [Google Scholar] [CrossRef]
- Tanguy, M.; Chokmani, K.; Bernier, M.; Poulin, J.; Raymond, S. River flood mapping in urban areas combining Radarsat-2 data and flood return period data. Remote Sens. Environ. 2017, 198, 442–459. [Google Scholar] [CrossRef]
- Armaş, I.; Gavriş, A. Census-based social vulnerability assessment for Bucharest. Procedia Environ. Sci. 2016, 32, 138–146. [Google Scholar] [CrossRef]
- Alizadeh, M.; Alizadeh, E.; Asadollahpour Kotenaee, S.; Shahabi, H.; Beiranvand Pour, A.; Panahi, M.; Baharin, B.B.; Saro, L. Social vulnerability assessment using artificial neural network (ANN) model for earthquake hazard in Tabriz city, Iran. Sustainability 2018, 10, 3376. [Google Scholar] [CrossRef]
- Loyola Hummell, B.M.; Cutter, S.L.; Emrich, C.T. Social vulnerability to natural hazards in Brazil. Int. J. Disaster Risk Sci. 2016, 7, 111–122. [Google Scholar] [CrossRef]
- Carbonneau, P.E.; Belletti, B.; Micotti, M.; Lastoria, B.; Casaioli, M.; Mariani, S.; Marchetti, G.; Bizzi, S. UAV-based training for fully fuzzy classification of Sentinel-2 fluvial scenes. Earth Surf. Process. Landf. 2020, 45, 3120–3140. [Google Scholar] [CrossRef]
- Marchetti, G.; Bizzi, S.; Belletti, B.; Lastoria, B.; Comiti, F.; Carbonneau, P.E. Mapping riverbed sediment size from Sentinel-2 satellite data. Earth Surf. Process. Landf. 2022, 47, 2544–2559. [Google Scholar] [CrossRef]
- WHO (World Health Organization). WHO Guidelines for Indoor Air Quality: Dampness and Mould; Druckpartner Mose: Copenhagen, Denmark, 2009; 248p. [Google Scholar]
- Yoon, S.K.; Kim, J.S.; Moon, Y.I. Integrated flood risk analysis in a changing climate: A case study from the Korean Han River Basin. KSCE J. Civ. Eng. 2014, 18, 1563–1571. [Google Scholar] [CrossRef]
- Molinari, D.; Scorzini, A.R.; Arrighi, C.; Carisi, F.; Castelli, F.; Domeneghetti, A.; Gallazzi, A.; Galliani, M.; Grelot, F.; Kellermann, P.; et al. Are flood damage models converging to “reality”? Lessons learnt from a blind test. Nat. Hazards Earth Syst. Sci. 2020, 20, 2997–3017. [Google Scholar] [CrossRef]
- Cardona, O.D.; Van Aalst, M.K.; Birkmann, J.; Fordham, M.; Mc Gregor, G.; Rosa, P.; Pulwarty, R.S.; Schipper, E.L.F.; Sinh, B.T.; Décamps, H.; et al. Determinants of risk: Exposure and vulnerability. In Managing the Risks of Extreme Events and Disasters to Advance Climate Change Adaptation: Special Report of the Intergovernmental Panel on Climate Change; Cambridge University Press: Cambridge, UK, 2012; Volume 9781107025066, pp. 65–108. [Google Scholar] [CrossRef]
- Albrecht, F. Natural hazard events and social capital: The social impact of natural disasters. Disasters 2018, 42, 336–360. [Google Scholar] [CrossRef]
- Brown, J.D.; Damery, S.L. Managing flood risk in the UK: Towards an integration of social and technical perspectives. Trans. Inst. Br. Geogr. 2002, 27, 412–426. [Google Scholar] [CrossRef]
- Gatti, I.; Martin, P.B.; Vargas, E.C.; Gasparotto, M.; Prario, B.E.; Gentile, E.E.; Patané, L.G. An Assessment of Severe Storms, Their Impacts and Social Vulnerability in Coastal Areas: A Case Study of General Pueyrredon, Argentina. In Applied Geomorphology and Contemporary Issues; Mandal, S., Maiti, R., Nones, M., Beckedahl, H.R., Eds.; Geography of the Physical Environment; Springer: Cham, Switzerland, 2022. [Google Scholar] [CrossRef]
- Mesta, C.; Cremen, G.; Galasso, C. Quantifying the potential benefits of risk-mitigation strategies on future flood losses in Kathmandu Valley, Nepal. Nat. Hazards Earth Syst. Sci. 2023, 23, 711–731. [Google Scholar] [CrossRef]
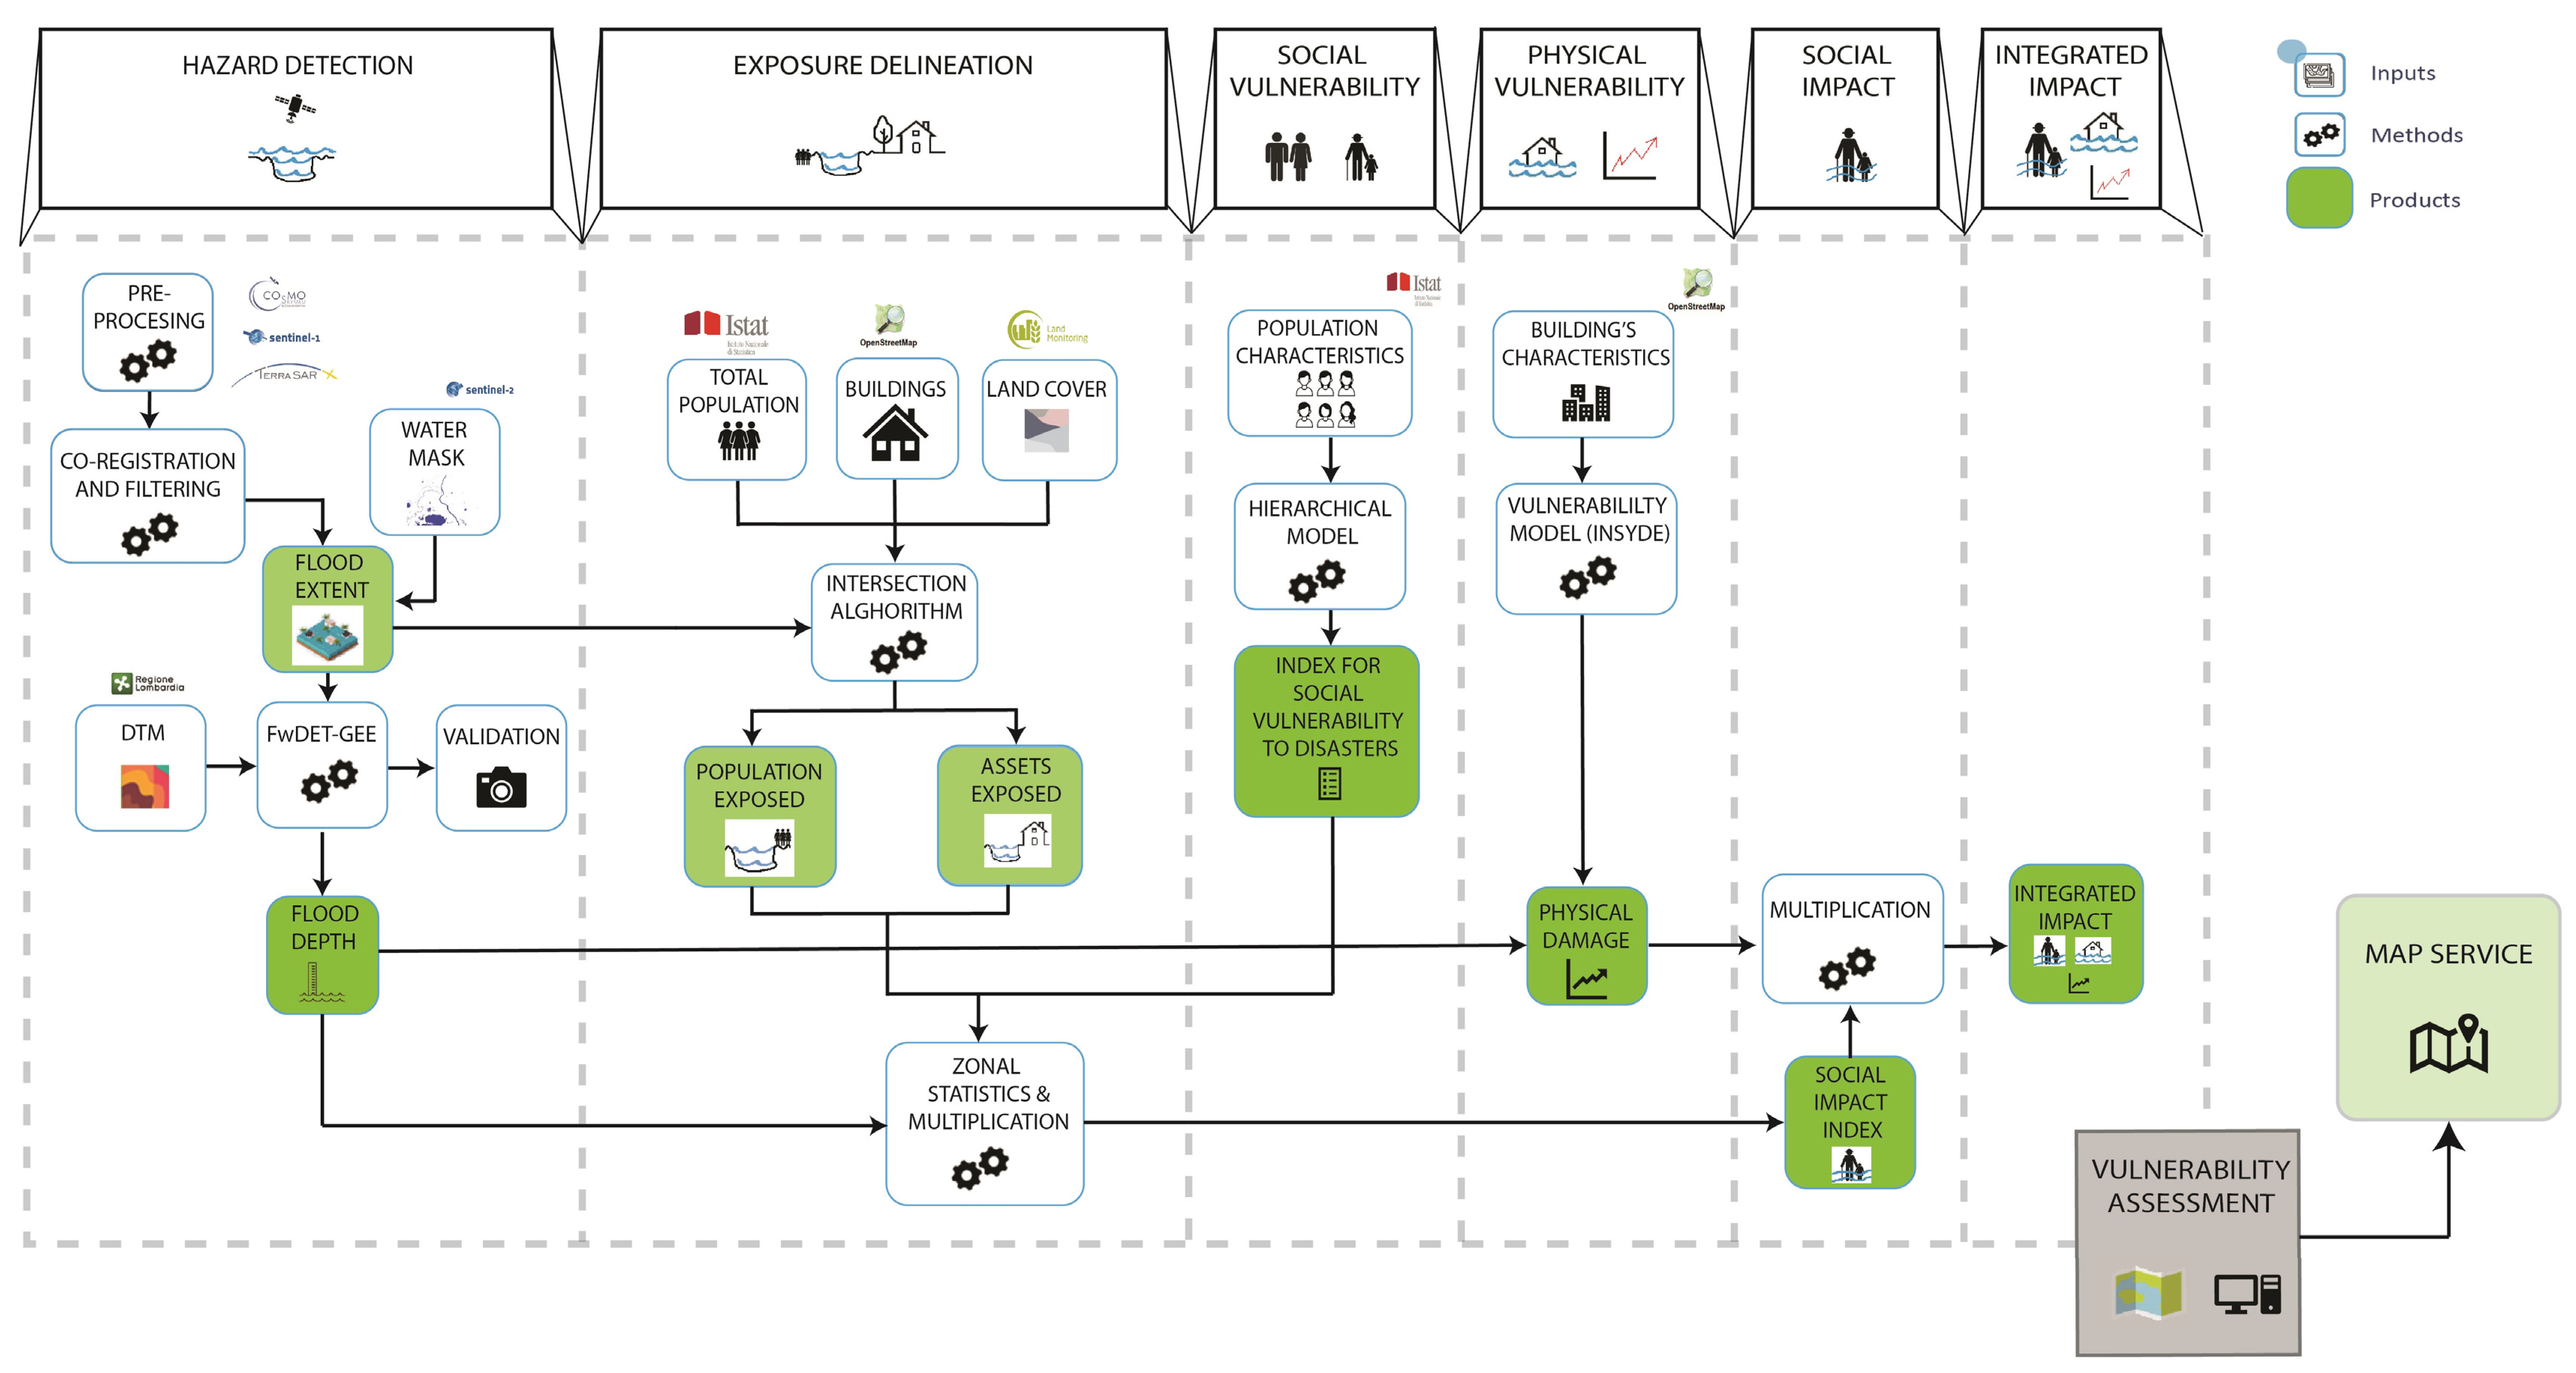
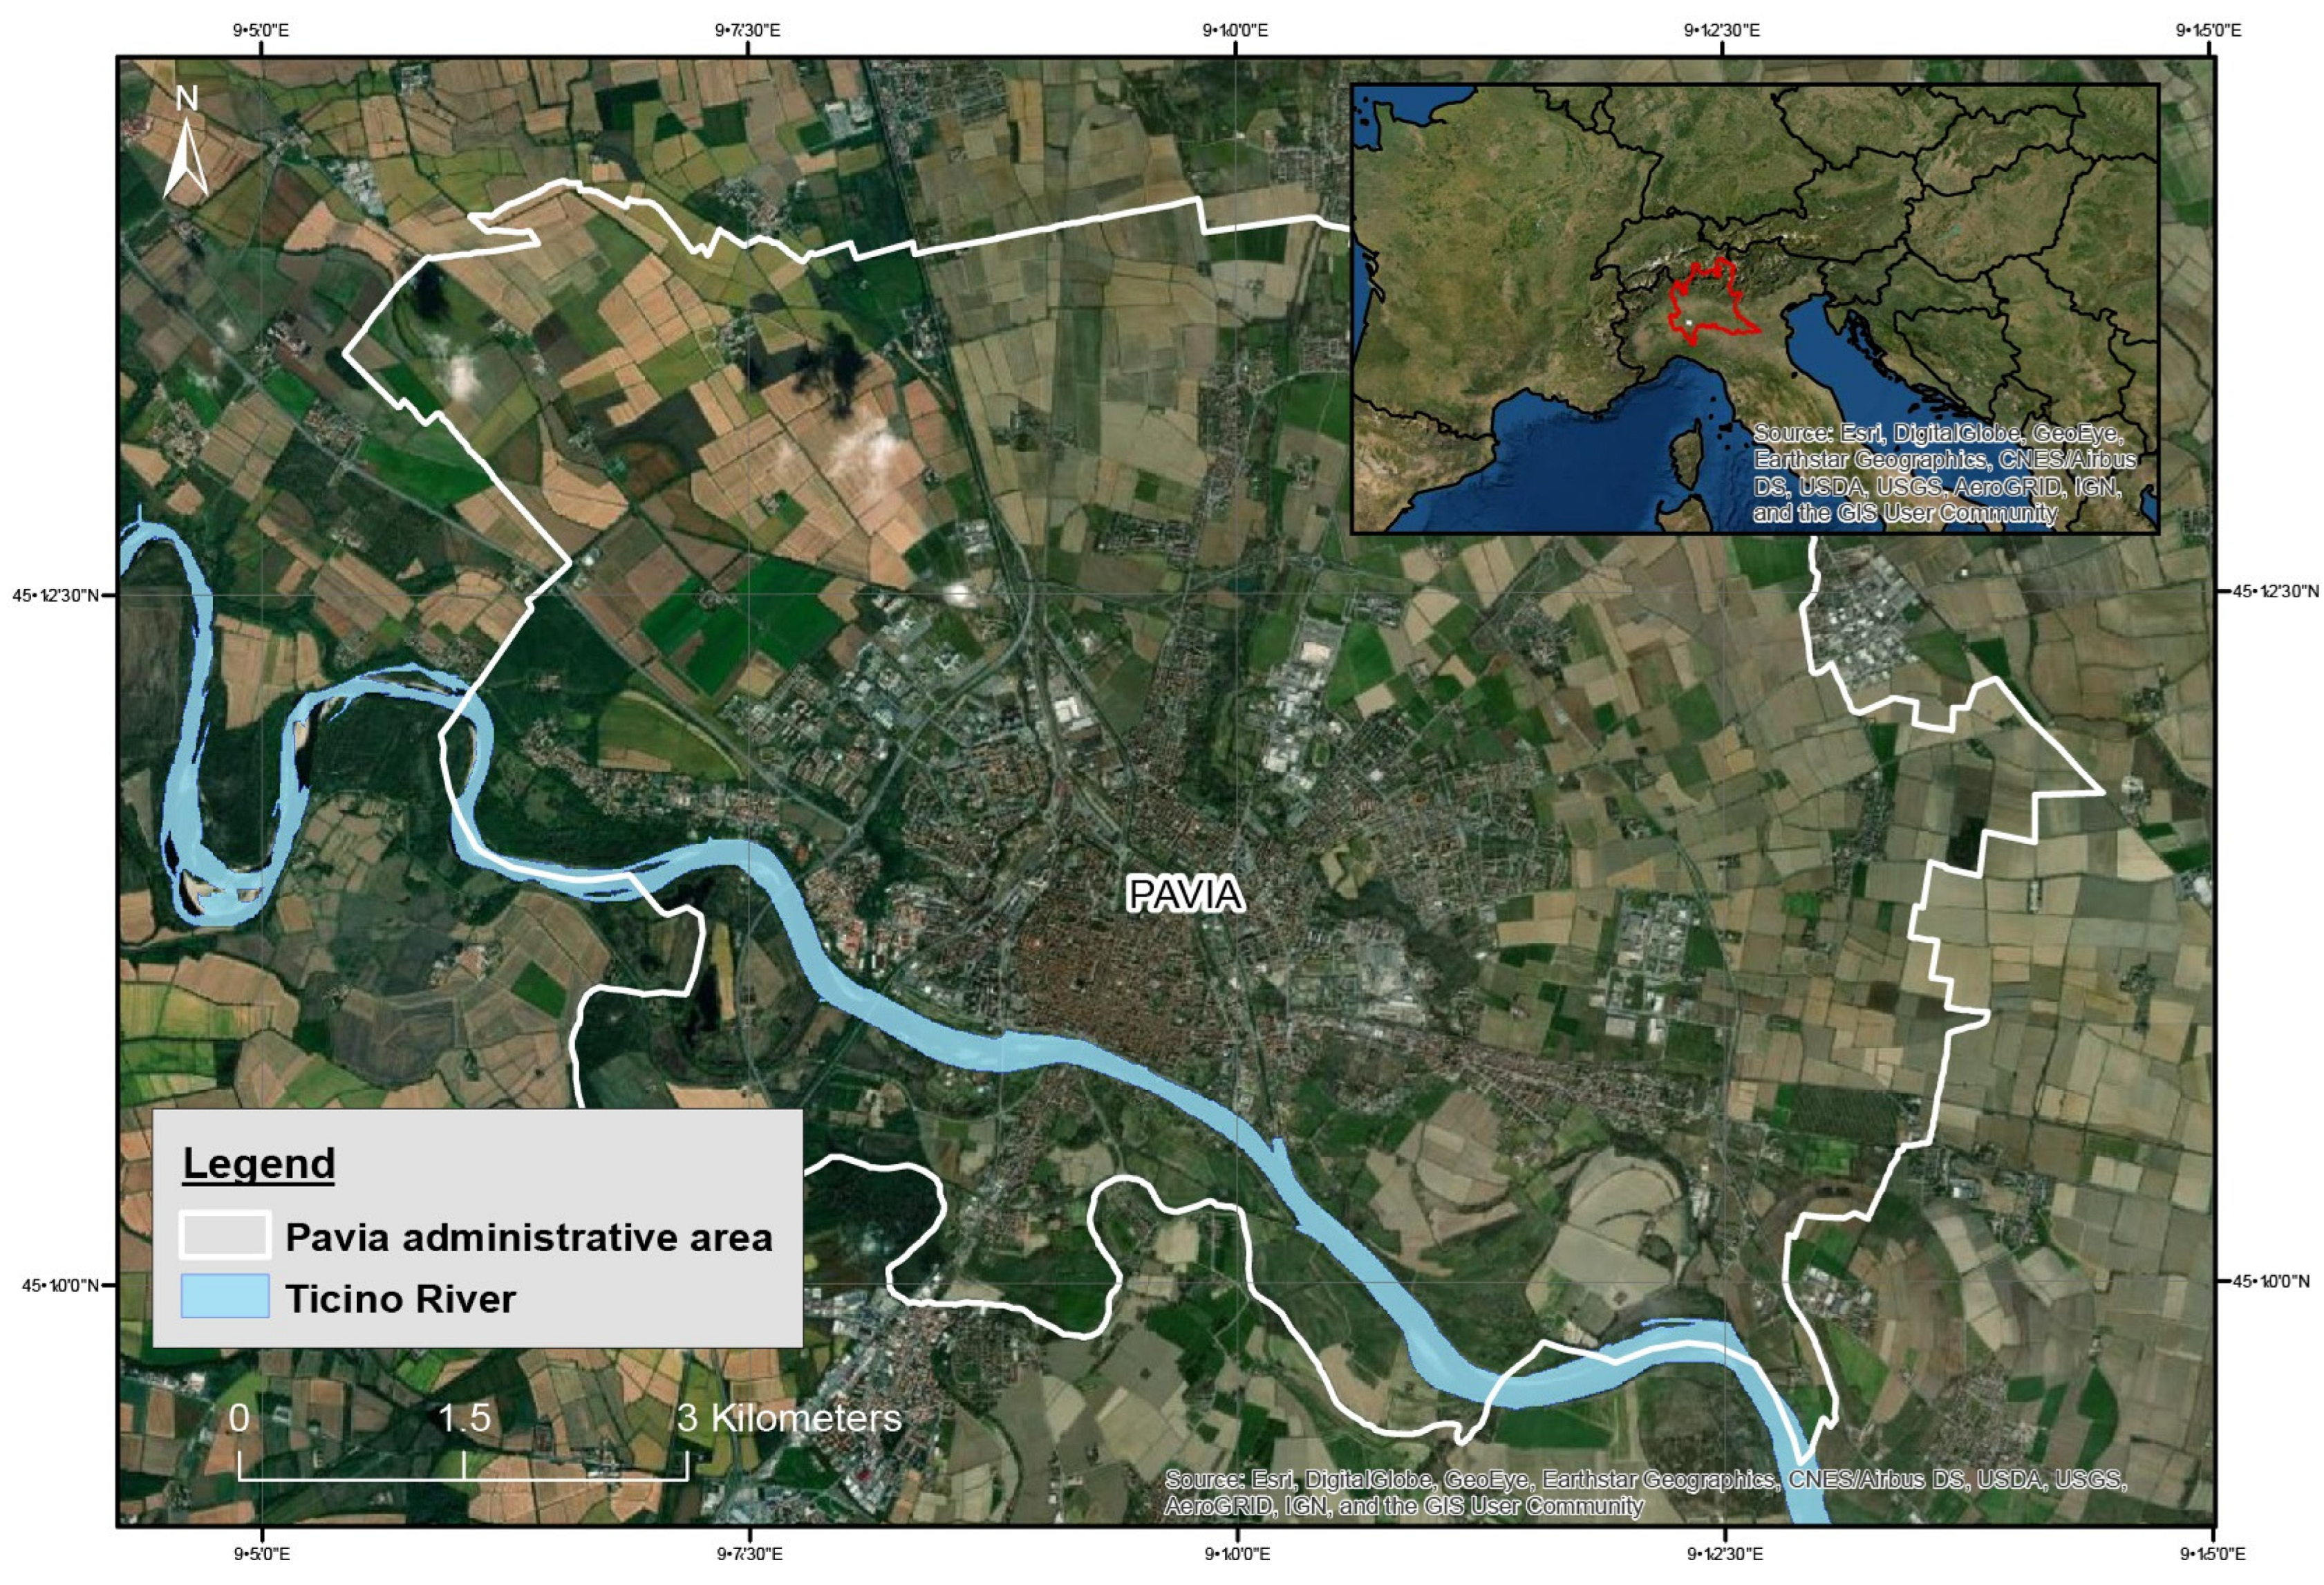


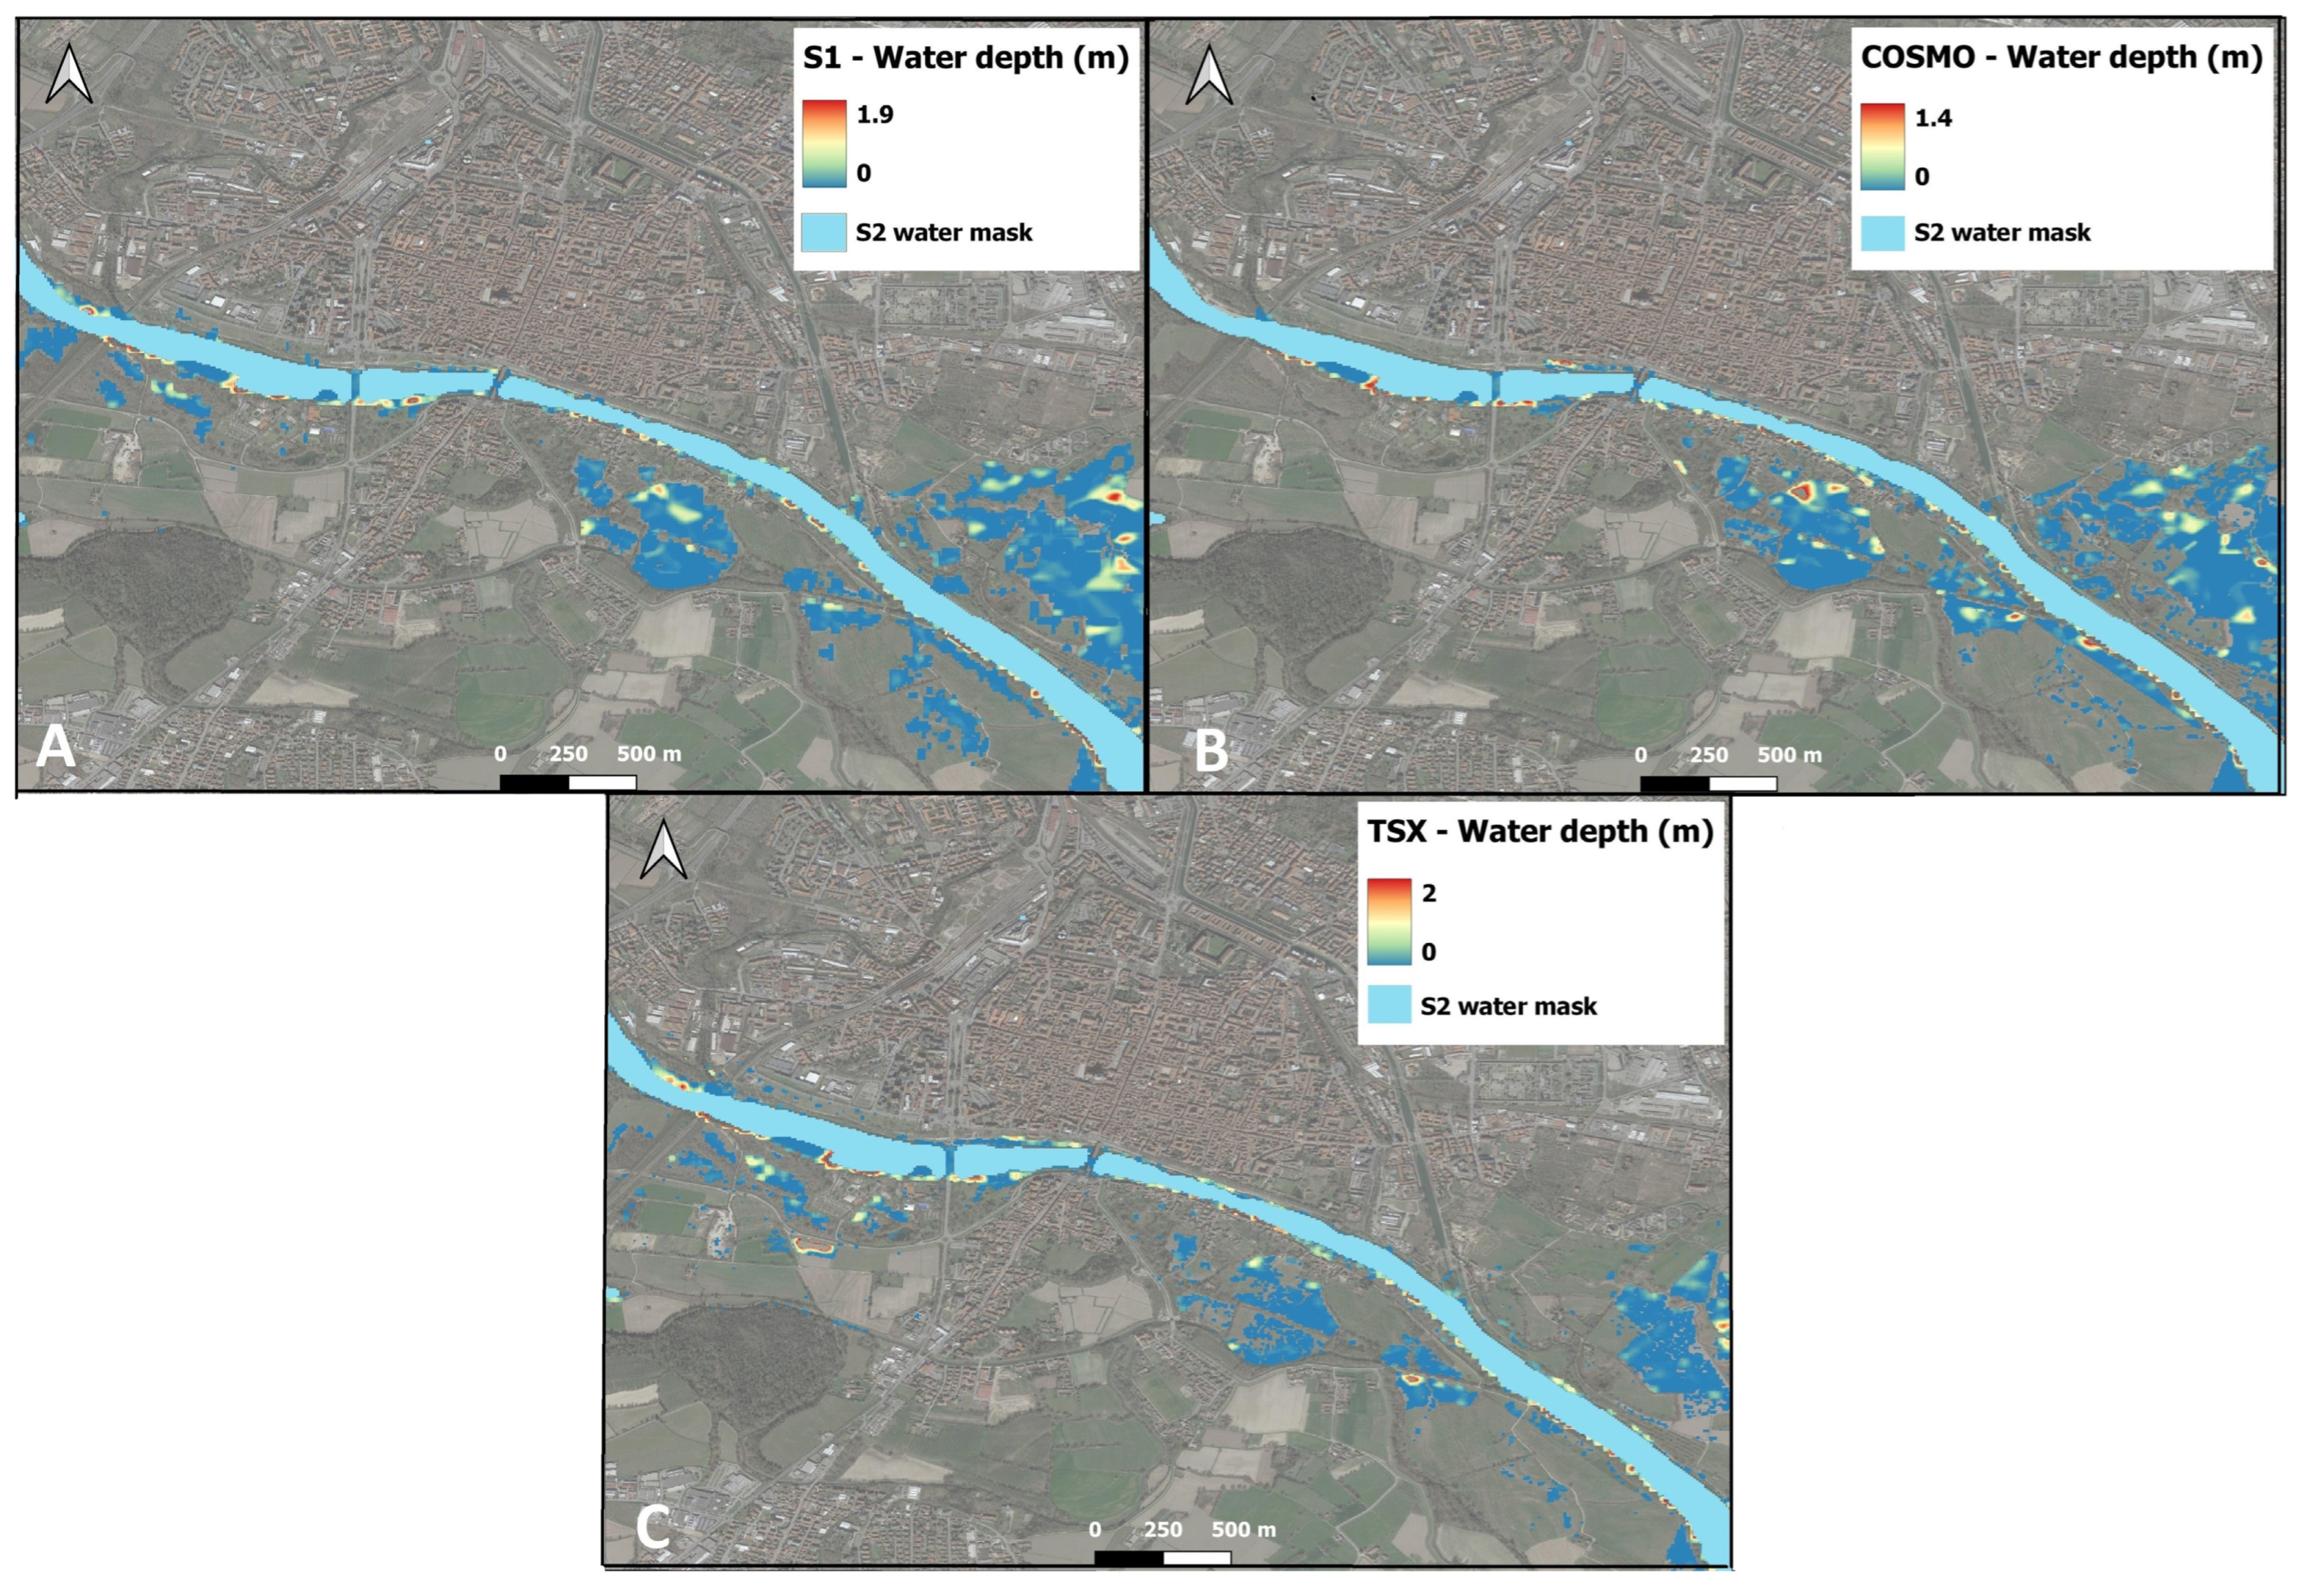
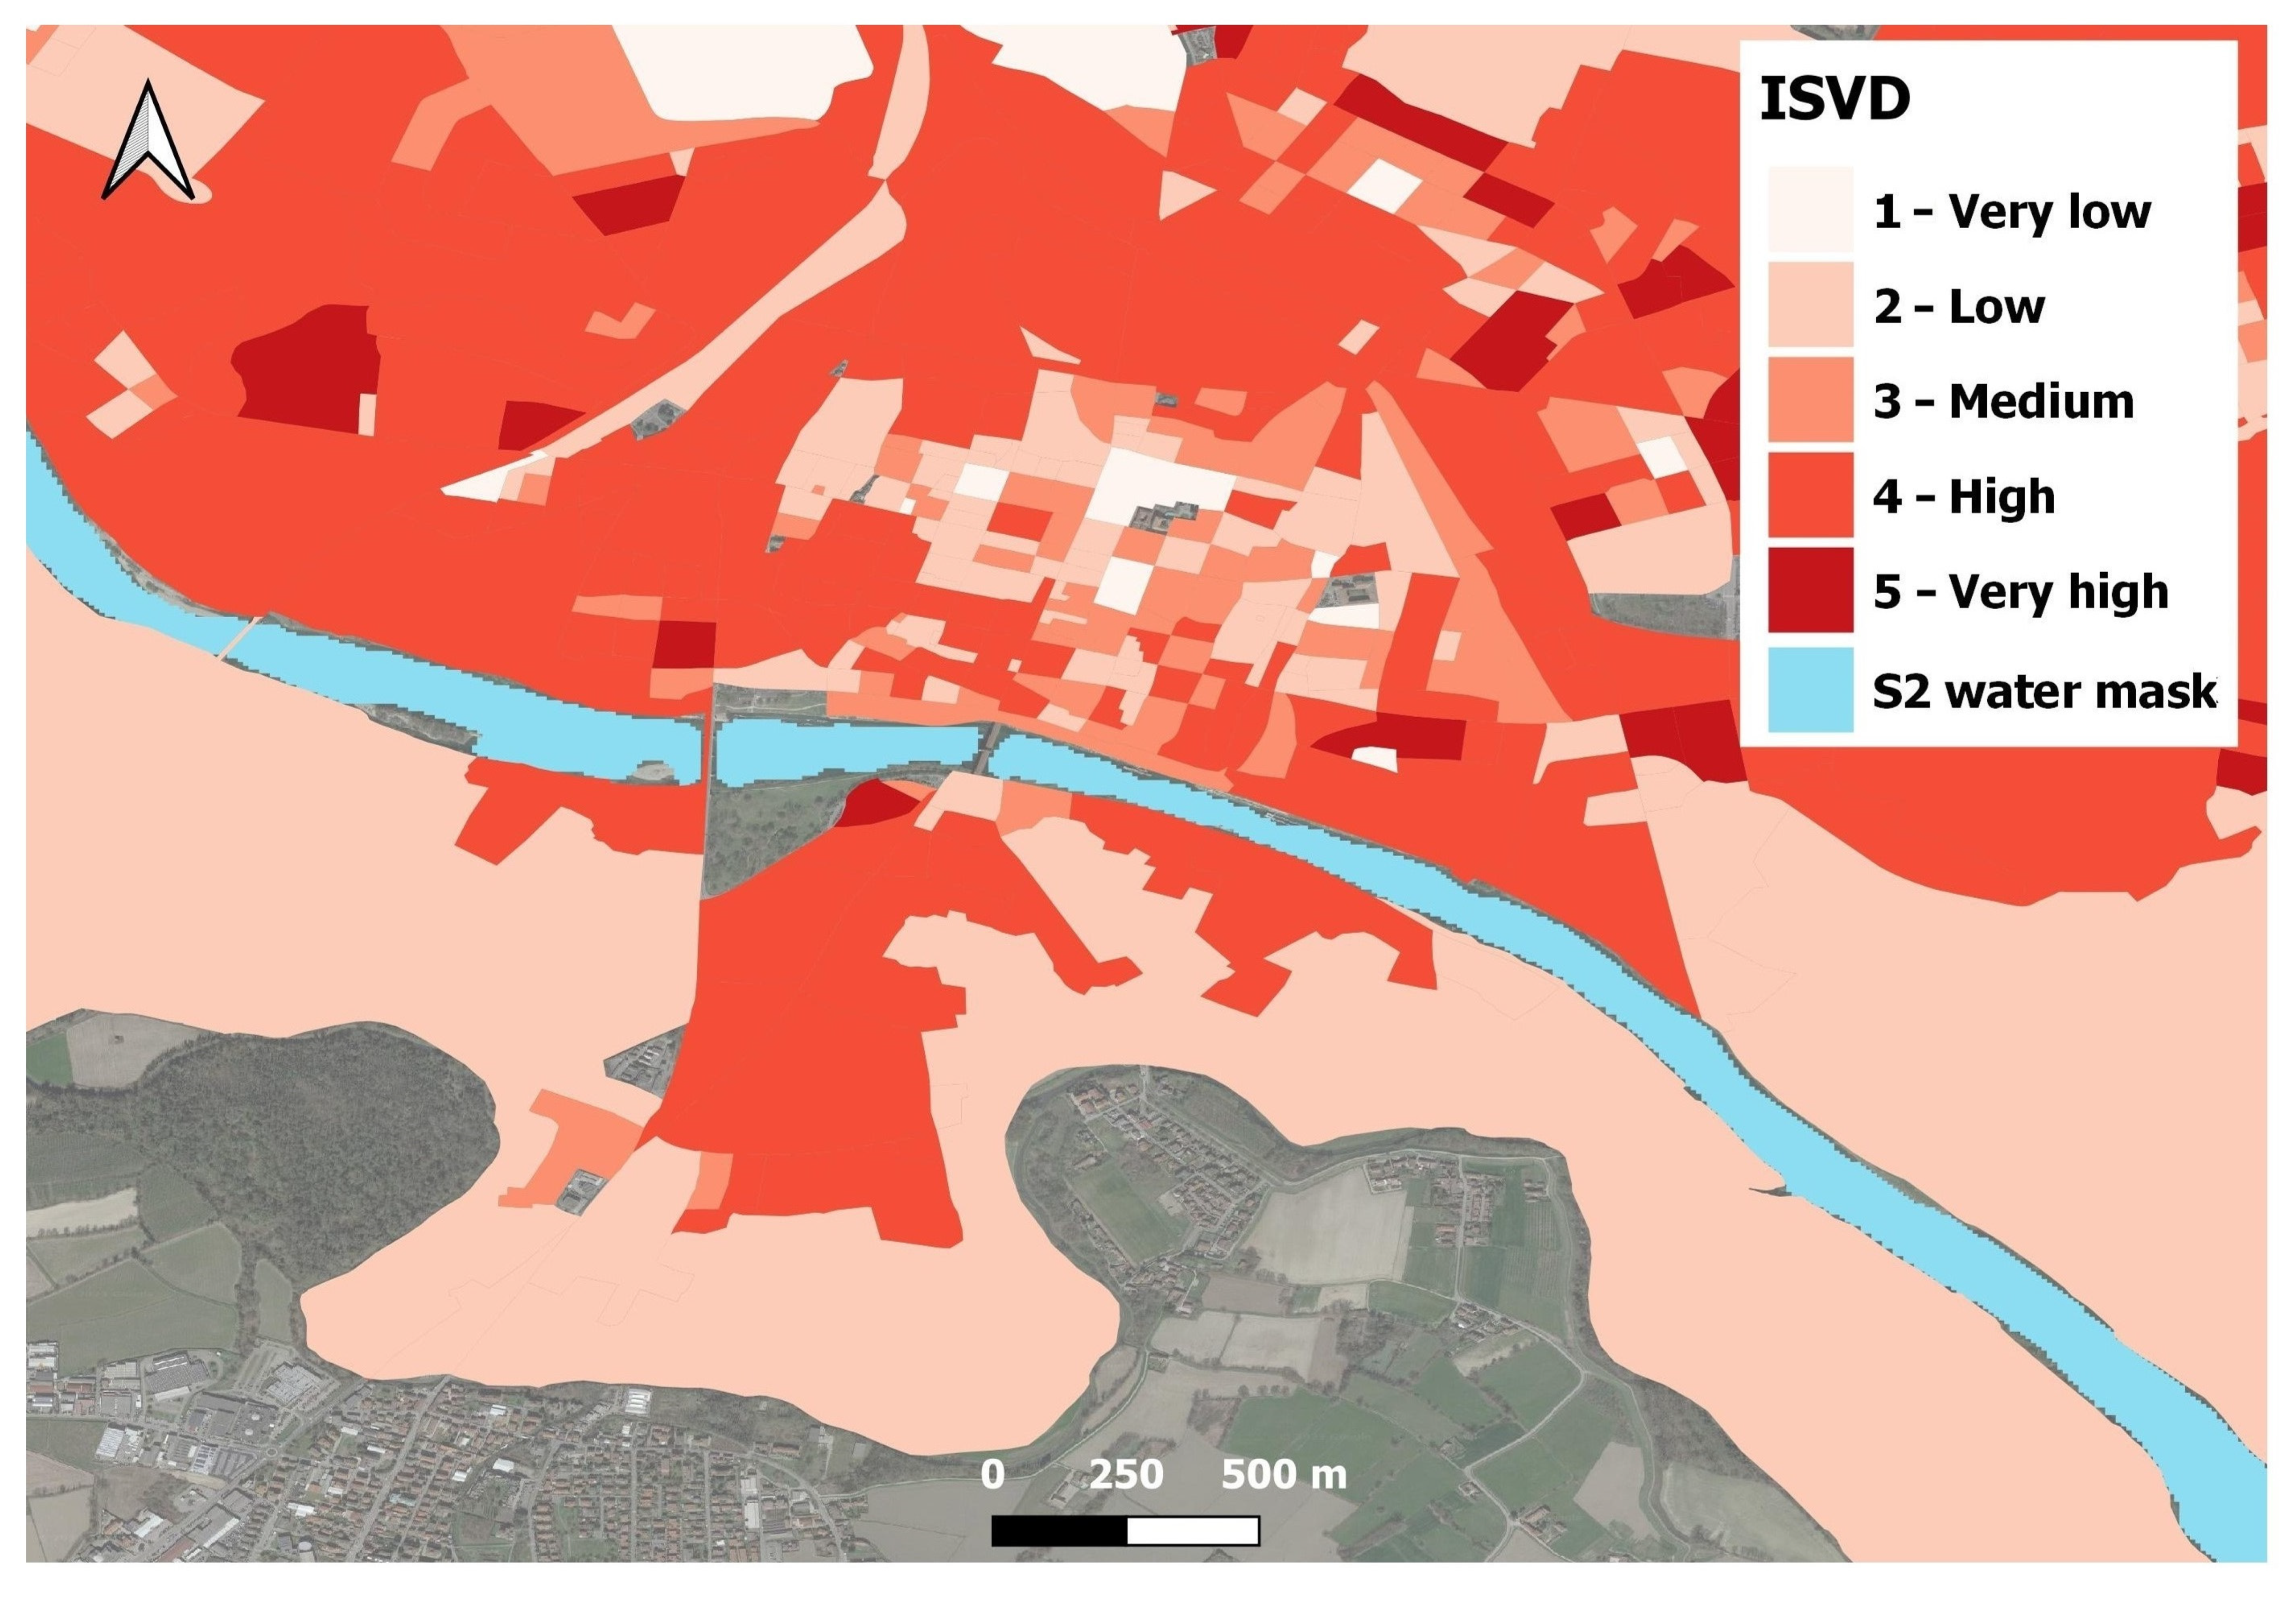
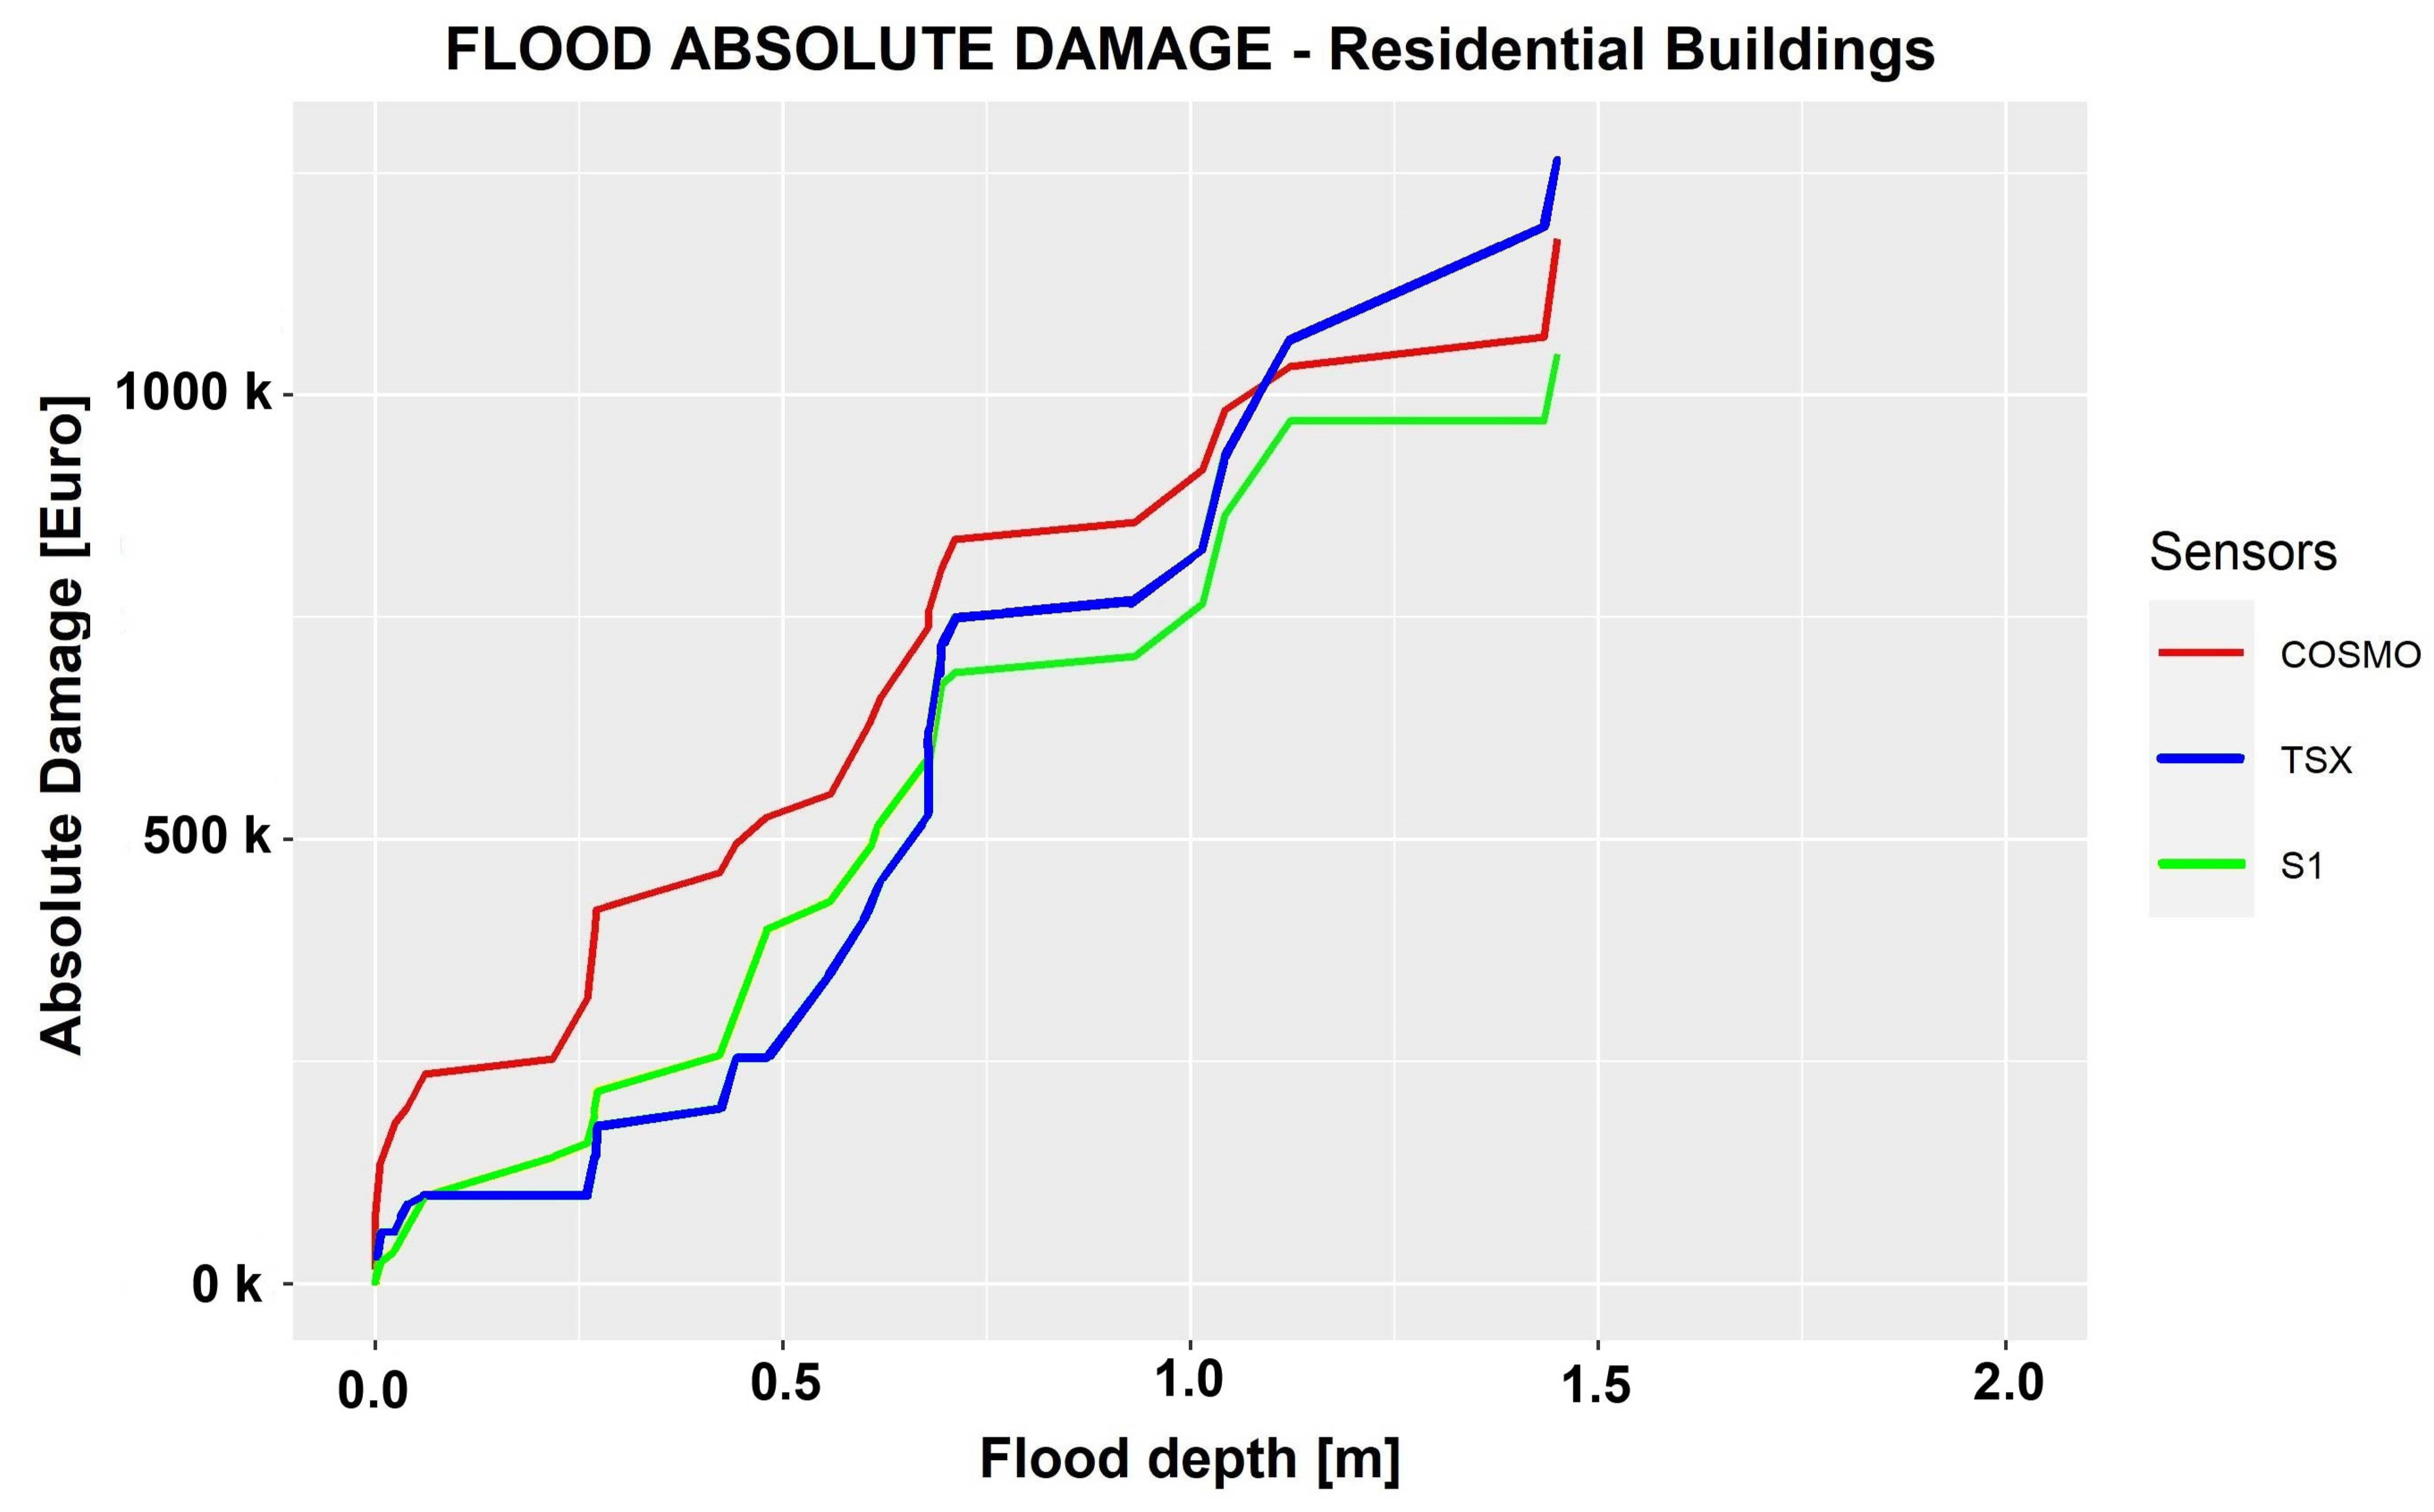

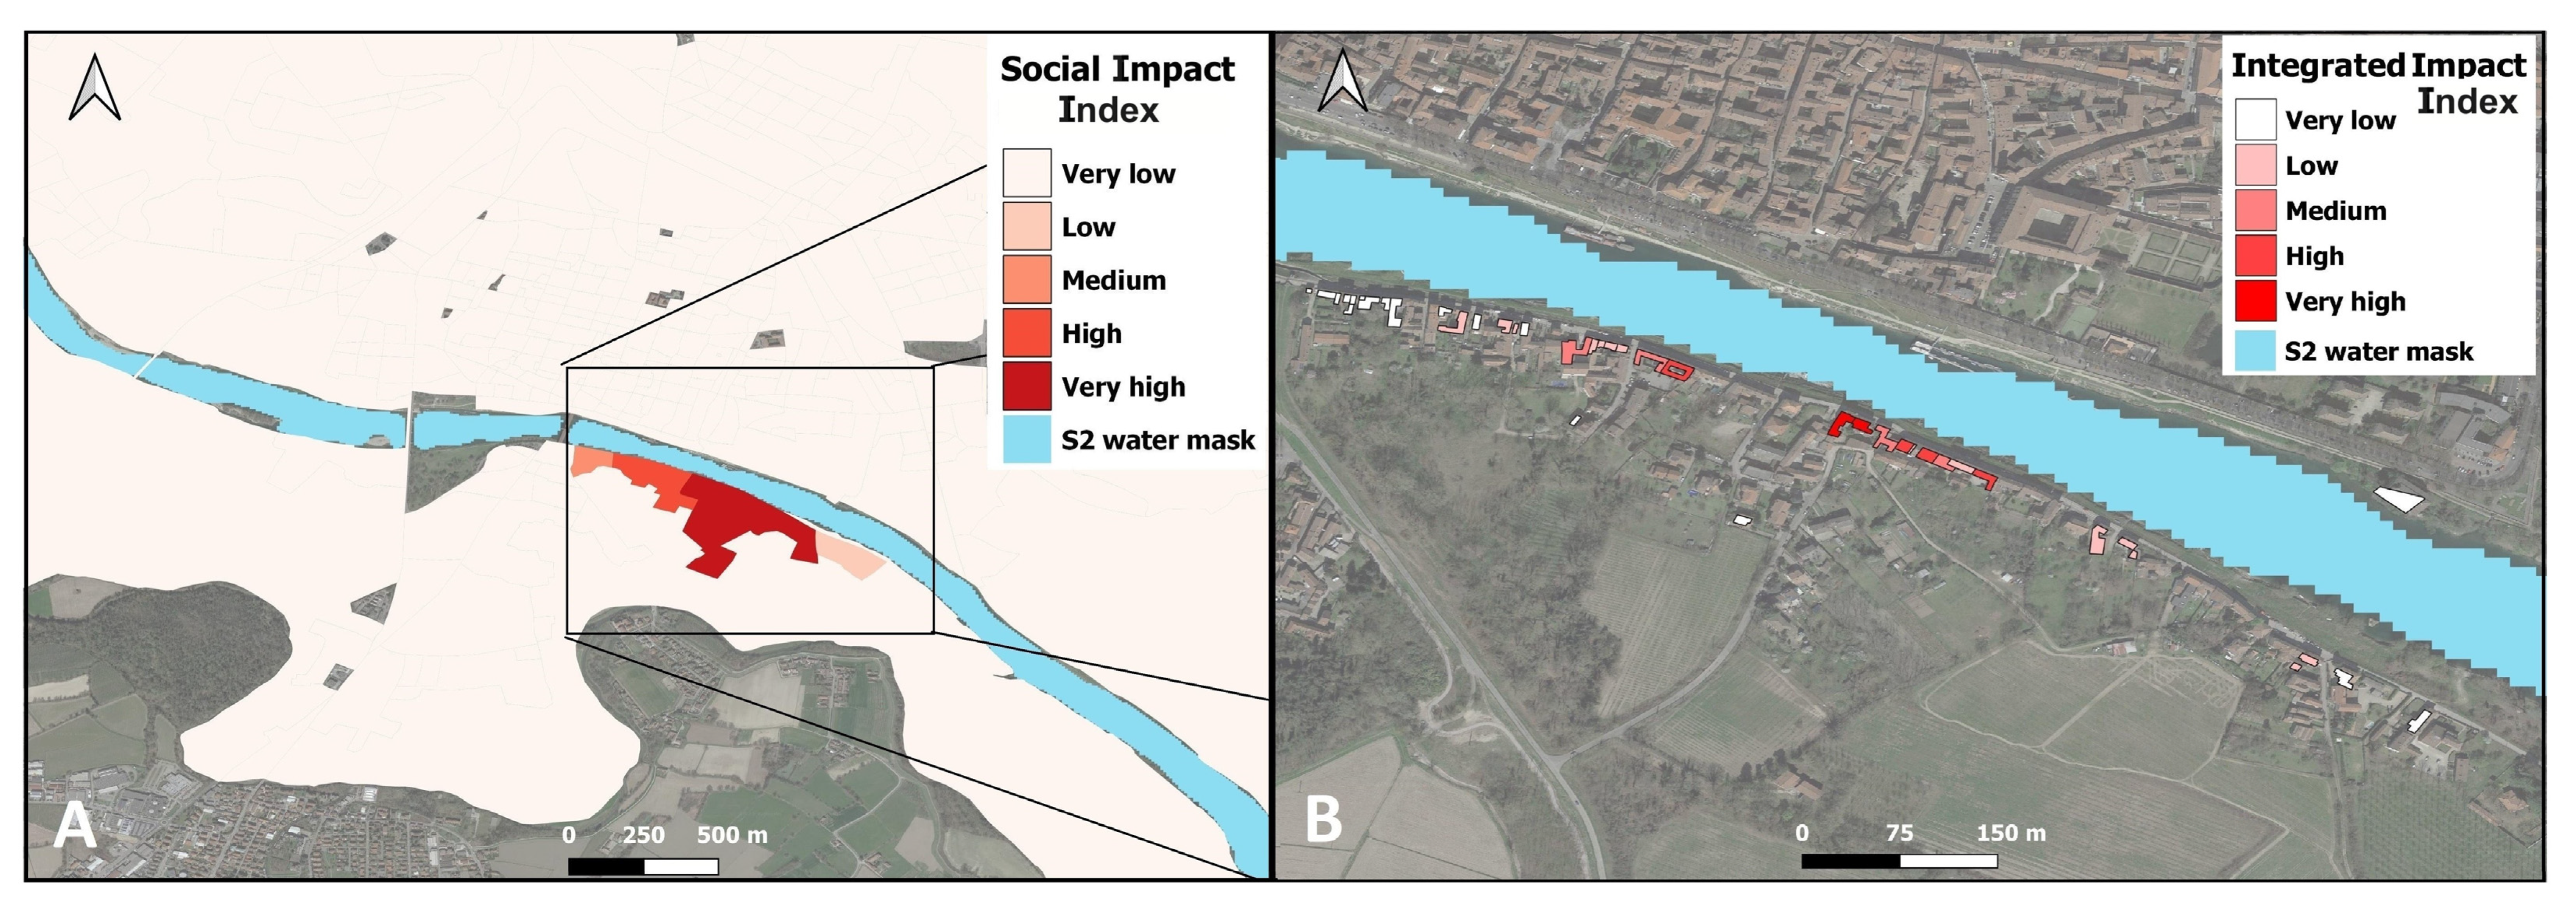
Disclaimer/Publisher’s Note: The statements, opinions and data contained in all publications are solely those of the individual author(s) and contributor(s) and not of MDPI and/or the editor(s). MDPI and/or the editor(s) disclaim responsibility for any injury to people or property resulting from any ideas, methods, instructions or products referred to in the content. |
© 2024 by the authors. Licensee MDPI, Basel, Switzerland. This article is an open access article distributed under the terms and conditions of the Creative Commons Attribution (CC BY) license (https://creativecommons.org/licenses/by/4.0/).