Abstract
The port of Tangier Med is essential due to its strategic location, as it is an important trading center linking Europe, North America, and Africa. However, the increased rates of downstream sediment transportation put pressure on the sustainable future of the port. Thus, assessing the existing erosion rates and future improvement scenarios is imperative for planning sustainable management at the catchment level. We utilize the Erosion Potential Model (EPM) combined with the Intensity of Erosion and Outflow (IntErO) algorithm to assess the erosion and outflow intensity and to distinguish the sediment-producing areas in the R’mel watershed. The port’s proximity at the bottom of the slope opposite the R’mel Dam is relevant in this context. Initial results show an average erosion rate of 13 t/ha/year. Quarry operations were identified as the primary sediment source, as indicated by the factors contributing to erosion. The qualitative PAP/RAC (Priority Actions Program/Regional Activity Center) model was used to assess the development trends in the watershed, confirming a clear tendency toward irreversible degradation in the quarry areas. Considering that the mined carbonate lithology represents 23.77% of the total area of the catchment, the situation in the region could deteriorate if quarry operations continue. The simulation of quarry rehabilitation scenarios through land use and land cover change (LULC) with IntErO shows that reforestation of quarries can significantly reduce erosion rates (4.78 t/ha/year) compared to their conversion to agricultural land. This study underlines the effectiveness of IntErO, based on the EPM model, in quickly and effectively mapping and quantifying water erosion.
1. Introduction
The northern region of Morocco, geographically known as the Rif, is highly vulnerable to water erosion risk. Numerous recent and long-term studies have highlighted the high erosion rates in the Rif watersheds [,]. This increased susceptibility to erosion is mainly due to the relatively young age of the lithological formations, which consist primarily of friable material dominated by marl and clay []. The rugged topography and steep slopes that characterize the Rif area further facilitate the detachment and mobilization of sediments []. The adverse effects of erosion are particularly noticeable regarding water and soil resources, as the storage capacity of the hydraulic infrastructure has decreased significantly in recent years. Soil resources are exposed to the leaching of organic and mineral matter due to erosion [,], which leads to progressive soil degradation and threatens the food security of all living beings, including humans [,].
The scientific community and public and private institutions have been intensively involved in studying water erosion and erosion control for many years. The aim is to improve the understanding of this phenomenon and to develop appropriate erosion control measures that would ensure the sustainability of water and soil resources for as long as possible. As a result, numerous quantitative and qualitative models have been developed over the years. For example, some models are based on radioactive tracers such as Caesium-137 (137Cs) [,], Pb Lead-210 (210Pbex) [], and Beryllium-7 (7B) [,]. These techniques have been widely criticized, mainly because of the high costs associated with laboratory analysis, the short half-life of these isotopes [,], and their inability to account for specific parameters that control the erosion process [].
In addition, methods based on hydrological modeling have been developed, with the Soil and Water Assessment Tool (SWAT) model being one of the most widely used worldwide [,]. This model facilitates the assessment of sediment and water supply with optimal sensitivity parameters, and its main strength lies in ensuring the connectivity of hydrological systems within catchments. However, its application in Morocco is limited by the need for data measured by hydrometric stations over relatively long periods [,]. Other methods are based on a geographic information system (GIS) and remote sensing, such as the Revised Universal Soil Loss Equation (RUSLE) [], Modified Universal Soil Loss Equation (MUSLE) [], RUSLE-3D [], and the Erosion Potential Method that is known as EPM [] and which is a frequently used empirical model across the Balkan area, North Africa, and Europe along with the Middle East []. These models differ in terms of the type of data used.
EPM is one of the most used models by researchers as it considers various factors of water erosion [,,]. It also assesses the effects of erosion forms and lithological substrates when evaluating the erosion process []. It has been integrated into an intensity of Error and outflow algorithm called IntErO (Intensity of Error and outflow) []. The integration of EPM into IntErO has facilitated the execution and application of EPM and has led to the international dissemination of the EPM method. However, in Morocco, the application of EPM still needs to be further improved [,]. This limitation can be overcome with IntErO, as it allows a fast and practical simulation of the physical catchment parameters. Previous studies have been conducted in the Arbaa Ayacha watershed using IntErO to assess erosion potential and show the influence of geomorphologic factors on soil erosion [,]. The successful implementation of previous studies has shown great potential for applying IntErO for advanced lithological applications in the Rif region.
IntErO is also a practical tool for qualitative erosion assessment. Previous studies have shown the importance of qualitative and holistic assessment methods for erosion prediction in risk mitigation measures in North African landscapes [,]. The qualitative method differs from the quantitative method in that it assigns weights to geographical units corresponding to soil erosion intensity []. The qualitative and quantitative models consider the same erosion factors, such as land use and land cover, soil type, slope gradient, and precipitation []. However, in the qualitative approach, each erosion control factor is given a specific weight depending on the researchers’ assessment or understanding of the local erosion processes and the importance of each parameter in controlling the phenomenon [,,]. The PAP/RAC method [] is one of the most used qualitative approaches in Morocco. The main objective of this method is the management of the Mediterranean coastal areas and the evaluation of the condition of the soil surfaces concerning their susceptibility to erosion. The PAP/RAC enables the visualization of erosion conditions, the analysis of water erosion relationships, and the assessment of risk trends in different catchment sizes [].
An essential objective of this study is to adapt the IntErO model to the environmental conditions of the Moroccan Rif region to study erosion and runoff. The choice of the study area is not arbitrary but essential for several reasons. First, a reservoir in the downstream watershed of the R’mel serves as the primary source of drinking water for the city of Kser Essghir. Directly opposite the reservoir is the most critical national coastal structure, the international port of Tangier Med []. This vital infrastructure must be protected from flooding and the damaging effects of water erosion. In addition, the basin’s soils must be safeguarded through land management, especially as agriculture is the most important source of economic activity for the local population. In addition, the assessment of the current state of the R’mel catchment shows that land use has changed significantly and rapidly over time. The anthropogenic influence in this catchment is particularly pronounced and can be seen above all in the extensive quarrying activities concentrated in the central region of the catchment. The economies of many Mediterranean countries have benefited from the extraction of raw materials. Unfortunately, many quarries in Mediterranean countries caused severe damage to the environment and landscape [,,]. Numerous studies have demonstrated the direct impact of operating or abandoned quarries on soil, water quality, and siltation of dams [,]. Therefore, soil conservation practices must be implemented to ensure soil protection and reduce the direct impact of the quarry on the ecosystem. Among these practices, the transformation of quarries to forests or vegetated areas, commonly known as afforestation, is of great scientific importance in the efforts to combat climate change, preserve biodiversity, stabilize soils, prevent erosion, and protect reservoirs as natural filters that retain sediments and pollutants before they enter the reservoirs []. In addition, reforestation helps to stabilize soils by strengthening their structure and water retention capacity, thus reducing the risk of erosion. Soil conservation is essential to maintain the fertility of adjacent agricultural land and prevent soil degradation.
The goal of this study is to determine the rate of erosion and the amount of sediment moving downstream of the basin using an efficient but not widely used model across the country. Sediment sources were identified and analyzed with respect to land use change scenarios in the region. Two scenarios regarding quarry surfaces were simulated utilizing the IntErO tool to assess the reliability of quarry rehabilitation and its impact on reducing erosion rates and sediment yield to the reservoir. Finally, the influence of erosion control factors on the erosion process was evaluated by incorporating qualitative aspects to determine the development trends of erosion in the region.
This study demonstrates the importance of quarry rehabilitation for environmental protection and ecosystem sustainability, highlighting the priority areas where erosion control measures are needed. Proactively managing these issues is essential to protect water and soil resources while maintaining the integrity of ecosystems in the region.
2. Materials and Methods
2.1. Study Area
The water catchment area of the R’mel lies in the northern Rif region of Morocco. It belongs to the province of Ksar Essghir, located in the Tangier-Tetouan Elhoceima region. The watershed covers an area of 34 km2. Its altitude ranges from 12 to 572 m (Figure 1a).
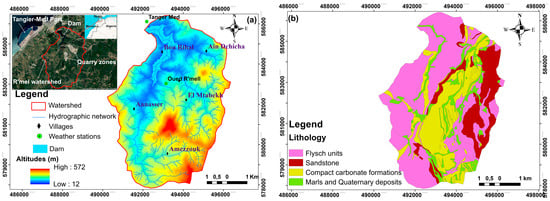
Figure 1.
Geographical location of the (a) R’mel watershed and the Tanger Med port in Northern Morocco, (b) lithological map of the study area.
The topographic data for this watershed were extracted from the ASTER digital terrain model (DTM) downloaded from the Earth Explorer website (https://earthexplorer.usgs.gov (accessed on 27 August 2023)). In the central and upstream parts of the watershed, the two highest points are located at the villages of Aanasser and Amezzouk. However, the lowest elevations are downstream of the watershed where the R’mel Dam was built. This dam collects water from the surrounding slopes and surface runoff through the hydrographic network.
The study area has a Mediterranean sub-humid climate with an average annual precipitation of about 820.3 mm, calculated based on a 12-year precipitation data series measured at the meteorological station of the catchment area. Land use and land cover (LULC) data were obtained using geospatial remote sensing by processing a Landsat OLI8 image downloaded from the United States Geological Survey (USGS) website (https://www.usgs.gov/ (accessed on 27 August 2023)) and processed with ENVI software version 5.5.2 []. This software facilitated the supervised classification of the different LULC classes within the watershed, with in-depth field checks performed for specific classes. The resulting map illustrates that most of the watershed is covered by dense scrubland, followed by open scrubland, which is detailed in the Results and Discussion section. On the other hand, dense natural forests are limited to the southern and northeastern parts of the watershed. Arable land is generally located in the central part of the watershed and near the villages and accounts for 22.7% of the total watershed area. The watershed’s unvegetated areas include rocks, bare land, and quarry areas (Table 1).

Table 1.
Percentage of land use land cover (LULC) classes in the study area.
The lithological data of the basin were taken from the geological map at a scale of 1:50,000, inspired by successful previous studies with aligning research objectives [,]. The basin has a variety of lithological formations (Figure 1b). The flysch formations, mainly located in the western part of the basin, cover about 49.77% of the basin’s total area. In the eastern part of the basin, sandstone formations dominate, covering approximately 15.25% of the site. Marl and quaternary deposits are mainly found on the banks of the gorge and make up 11.21% of the basin’s area. Finally, compact carbonate rock outcrops in the central part of the basin make up about 23.77% of the total area. This carbonate formation was mined on a large scale, mainly for the construction industry.
We engaged a specialist pedologist from our authors’ team, who conducted a comprehensive field visit in collaboration with our team. Drawing on the insights gained from this fieldwork and in conjunction with the data obtained from the prior geological survey, our team, comprising specialist pedologists and geologists, derived numerical values needed for the IntErO calculations in relation to the soils of the river basin. These values were then instrumental in the evaluation of the soils within the basin.
2.2. Intensity of Erosion and Outflow Assessment
2.2.1. IntErO Model Description and Implementation
EPM models [] use multiple components to obtain a global estimate of soil loss. Each factor quantifies one or more processes and their relationships [,]. EPM quantitatively estimates erosion intensity, sediment production, and sediment transport []. Most models are used to predict long-term annual rates of soil loss to crops due to sheet erosion, gully processes, sediment transport, rill erosion, and deposition on the soil surface. The EPM model predicts the extent of erosion due to sheet or gully erosion and accounts for additional soil losses due to gully erosion, wind erosion, or soil erosion [,]. The IntErO model of Spalevic [,,] integrates Erosion Potential Model (EPM) of Gavrilovic [] into its algorithm. It is an improvement over the previously used river basin and area/distance measurement programs [,]. The method is useful and can handle large amounts of data. It requires only 25 input parameters to generate 22 output parameters (Table 2).
Table 2.
Input data used for the IntErO model in the R’mel watershed.
The IntErO model program package of Spalevic [] takes six elements into account: soil type and lithology are represented by the coefficient Y, land use data represents Xa, temperature is linked to the parameter t, and erosion patterns are represented by the coefficient Q []. These coefficients must be thoroughly evaluated in various processes, including data collection, fitting, analysis, and integration into the model equations. The annual volume of sediments ‘Wyear’ eroded because of soil erosion was calculated using the following equations, Equations (1) and (2).
where F is the watershed area (km2), and T is the temperature coefficient derived as follows:
Hyear is the yearly average rainfall between 2007 and 2022 in mm. The Z coefficient, which can be categorized according to the degree of erosion (Table 3), represents the strength of the erosion process, and is calculated as follows in Equation (3):
Table 3.
Ranges of the Z coefficient in the Erosion Potential Method (EPM) [,].
The variable (Xa) represents the degree of soil protection. Xa considers land use and the extent of vegetation cover. With values close to 0, indicating low soil protection, and values around 1, indicating strong soil protection, this coefficient typically varies between 0.05 and 1 [,,]. The Xa values were obtained by assigning the classes suggested by the EPM technique and comparing the LULC map of the watershed with previous studies [,].
The soil erodibility coefficient Y is a dimensionless factor that reflects the erosion resistance of the soil and depends on the pedological lithological characteristics of the basin []. The Y factor was evaluated in this study using lithological data from the study area. Values for each soil type were then assigned based on EPM recommendations and previous studies [,,]. Values below 0.25 indicate moderate erodibility, while values above 2 indicate extremely erodible formations [,].
The coefficient φ is a one-dimensional component with values between 0.1 and 1. This parameter is related to active erosion and was calculated using the erosion pattern map of the R’mel basin. Values were then assigned to each erosion type using the recommendations of the previous studies [,,]. Finally, the average percentage of basin slope Isr in the study area was calculated using DEM (DTM-ASTER-GDEM). Calculating the specific sediment production (Gsp) was undertaken in m3 km−2 year−1 as some sediments are re-deposited in rivers or other catchments. This can be achieved using the following equation, Equation (4):
This can be accomplished by multiplying the average yearly sediment production (Wyear) by an R coefficient (delivery ratio), Equation (5):
The parameters O and D are given in kilometers, where O is the extent of the catchment area, D is the average height of the basin in the final section, and Lv is the length of the main river.
2.2.2. Land Cover Change Scenarios and Effect of Geomorphological Conditions
The investment directed toward implementing anti-erosion practices, along with their subsequent production, has the potential to yield satisfactory economic efficiency. This indicates that the allocation of resources to these measures can result in favorable returns, balancing both the financial aspect and the effectiveness of mitigating erosion-related challenges [,]. In this study, two scenarios were simulated in quarry areas using the IntErO algorithm to assess the reliability of quarry rehabilitation and its impact on erosion rates and sediment yield in the reservoir. This simulation involves utilizing the methodology outlined in Table 2 and Equations (1)–(5), incorporating alterations to the Xa coefficient within Equation (3). In the initial scenario, the land use and land cover (LULC) category associated with quarries has been substituted with a vegetation zone. In contrast, quarries have been reclassified as cultivated land in the second scenario.
To analyze the effect of geomorphological conditions on the erosive process, we created an intersection between the individual erosion factors and the erosion rate map to illustrate the influence of crucial erosion variables on sediment formation. This link was created through a GIS process between the files in vector format. This method requires two vector layers for the slope factor: one for erosion classes and one for slope classes []. To create the low, medium, high, and excessive classes in the resulting EPM model map, we first divided the slope map into four categories: 0–15%, 15–30%, 30–45%, and above 45%. The two files were then overlaid using the ArcGIS 10.8 intersect command to determine the erosion rate for each slope class. To determine the proportion of low, moderate, high, and excessive erosion classes, we used a map showing the erosion rates for each slope class generated by this process. The contribution of each factor to sediment production was indicated using the same methods for other factors and maps illustrating lithological, land use, and erosion features [,]. The slope map and sediment production map classes are sliced from each map using the same ArcGIS 10.8 commands and tools.
2.3. Evolutionary Trends of Erosion in the Basin and Its Qualitative Assessment
Several organizations (UNEP, FAO, and DGCONA) have mapped and measured the erosion processes caused by rainfall in the Mediterranean regions []. The PAP/RAC approach was developed to analyze the sensitivity of water erosion [,]. It is based on the interrelationships and interdependence of water erosion risk variables. Specific procedures are required to map each element of the approach, primarily the processing, intersection, and analysis of the data sets.
Generally, the technique can be divided into three main steps. The first step is the predictive approach to assign values to water-eroding variables such as lithology and soil type, LULC, slope, and vegetation density. In this phase, a map of the erosive state is created (Figure 2), and the catchment is prioritized according to the degree of erosion. The second step is the descriptive stage based on a map of the erosion forms and patterns of the site and its erosion risk.
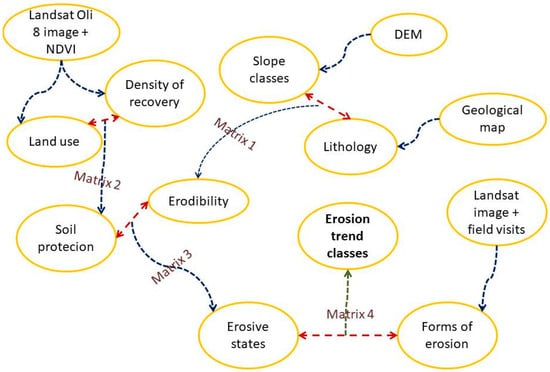
Figure 2.
Methodology for assessing erosional trends in the basin using the PAP/RAC method [].
The third step is the integration phase, which is the culmination of the previous two processes. It overlays the map of erosion forms with the map of erosion conditions (Matrix 4 in Figure 2). An interactive map of water erosion is displayed. It helps to identify development trends in the catchment areas concerning erosion risk. Using a systematic approach, the PAP/RAC method examines the potential risk of soil erosion by emphasizing conservation measures and implementing effective erosion control methods. The PAP/RAC method for measuring soil erosion risk in Mediterranean regions includes the following steps:
- -
- Data collection: The first step is to collect data on the many factors that influence the risk of soil erosion, including rainfall, soil type, lithology, LULC, and vegetation cover. This data can be collected through surveys, remote sensing, or existing databases.
- -
- Data preparation involves digitizing and arranging the data obtained in a geographic information system (GIS) to process and prepare them for analysis.
- -
- Erosion risk assessment: The next step is to assess the erosion risk by summarizing the information on the different aspects using a matrix technique. Under the matrix approach, each element is given a score based on how much it contributes to erosion risk. These scores are then added together to provide an overall erosion risk score for each area (Table 4 and Table 5).
Table 4.
Matrices for assessing soil erodibility and soil protection degree.
Table 5.
Matrices for assessing erosive states and erosion trends.
- -
- Erosion risk mapping uses erosion risk scores to show where there is a high risk of erosion. This allows you to prioritize protection measures and visualize the areas at risk of erosion.
- -
- Selection of conservation measures: Appropriate soil conservation measures can be selected for each erosion-prone area based on the erosion risk mapping. These measures may include terracing, contour plowing, improved plant cover, soil management techniques, and engineering structures.
- -
- Finally, the selected protective measures are implemented, monitored, and tested for their effectiveness in minimizing erosion risk.
3. Results and Discussion
3.1. Erosion Potential Assessment
The IntErO model calculates the sediment supply and the maximum discharge in the R’mel catchment area. Table 6 shows the results obtained after applying this model. According to the symmetry coefficient A (0.67), the catchment can experience large flood waves. The coefficient G of 3.20 indicates that the drainage network is very dense. The Isrvalue of 479.65% suggests the catchment has almost vertical slopes. The Z-value of the catchment area of 1.424 indicates that it is damage category I. The erosion process is excessive due to the type of erosion; in this case, it is mixed erosion. According to Gavrilovic, a watershed with a value of 1101.36 m3/km2 is classified as category III, which indicates moderate to severe surface erosion.
Table 6.
Analysis of the current situation using IntErO.
The degree of soil protection is assessed using the parameter Xa. The values for the soil protection coefficient Xa range from 0.05 to 0.9. A significant part of the catchment area had to be adequately protected, as 35.69% of the area had values for Xa on bare soils and plowed fields above 0.8. Lower Xa values correspond to some units of old dense afforestation, dense scrubland, and dense deciduous forest, which account for 34.5% of the basin. This value shows that one-third of this catchment is developed, slightly reducing erosion. Degraded forests and scrubland represent mean values of Xa in the remaining catchment (29.61%). Using the erodibility coefficient Y, the IntErO model evaluates the erodibility of the soil. The soil type and the lithology influence the soil erodibility (Y). The study region’s lithological and pedological maps were classified according to the terminology of the IntErO program. The soils of this catchment have an average erodibility in 50% of the catchment, a high erodibility in 43.26%, and a very high erodibility in 6.74% of the catchment. The parameter φ in this model expresses how far the erosion forms extend. It is a numerical representation of an evident and exposed erosion process. The values assigned to this component by Gavrilovic [] have been applied. At the same time, forests and permanent vegetation cover 56.84% of the surface, 32.6% of the basin is subject to surface erosion, 2.34% to erosion by creeks and gullies, and 8.22% to deep erosion.
The erosion rates determined with the EPM model integrated into the IntErO program are shown in Figure 3. The average sediment production is 1101.36 m3/km2/year (Figure 3a) or 13.22 t/ha/year (Figure 3b), with minimum and maximum values between 5 and 300 t/ha/year. This uniform conversion is intended to compare the results with erosion studies in the Moroccan Rif region. Most of these studies give the results in t/ha/year, while the EPM-IntErO models are not widely used in Morocco [,].
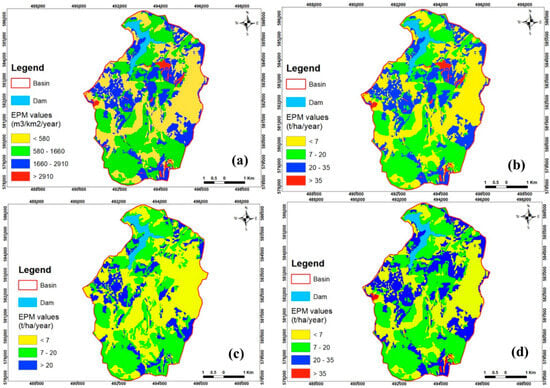
Figure 3.
Erosion rates were obtained for the current situation in (a) m3/km2/year, (b) t/ha/year, (c) for reforestation in Scenario 1, (d) cropping and plowing in Scenario 2 Compared to other sections of the Moroccan Rif, the average erosion rate in the R’mel basin is low. For example, the average rate in the Nakhla catchment is 38.7 t/ha/year [], while the RUSLE and SWAT models in the Arbaa Ayacha catchment showed 25.77 tha−1y−1 and 28.09 tha−1y−1, respectively []. Erosion in the Raouz catchment area is estimated at 26.6 tha−1y−1 using remote sensing [] and 16.53 tha−1y−1 using the RUSLE model []. These differences are mainly explained by the characteristics of the catchment area and the numerous interventions and developments carried out in the R’mel catchment area to maintain the dam and the downstream port.
The LULC parameter plays an important role. Over 60% of the R’mel catchment is covered by land uses that limit erosion, including dense and moderately dense forests, scrubland, and afforested areas. Moreover, the lithological substrate of the basin is mainly composed of fractured and compact erosion-resistant rocks such as tight carbonate rocks, sandstones, and flysch. In contrast, only a tiny part of the basin contains friable lithologies like marls and fluvial deposits. Consequently, anthropogenic activities, such as quarrying, are assumed to be the leading cause of erosion rates and the source of sediments moving downstream from the basin. These results highlight the need to analyze the basin’s physico-chemical characteristics and assess each parameter’s impact and contribution to erosion rates.
3.2. Effect of Basin Geomorphological Conditions
Bare areas and quarries, mainly located in the central zone of the basin, are the leading cause of excessive erosion (Figure 4a). The dense vegetation largely contributes to the low sediment input (34%). Open scrublands and agricultural land are essential in developing moderate erosion processes [,]. These observations also become apparent when analyzing the impact of erosion forms on sediment production (Figure 4c). Indeed, the areas exploited by quarries have the highest percentage in the excessive erosion class. Conversely, the regions stabilized by dense vegetation and afforestation mitigate the spread of erosion processes and ensure the stability of a considerable part of the basin (30%).
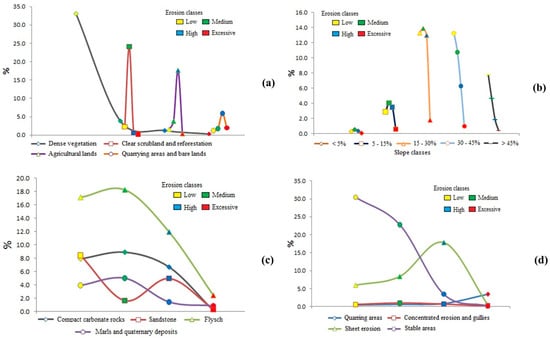
Figure 4.
Analysis of erosion-contributing factors to the erosion rate, (a) LULC, (b) slope classes, (c) lithology, (d) forms of erosion.
The other erosion classes generate more particles in the study area than the slope class (0 to 15%). Due to the combination of this component and other variables that determine the amount of sediment production, areas with a slope of 15 to 30% are most likely to be affected by erosion (Figure 4b). This slope class is associated with poorly developed, highly erodible soils in the basin’s center and downstream. The lithology in this part of the basin is essentially marble and clay, and all formerly vegetated areas have been replaced by agriculture.
All these features favor large amounts of sediment and accelerate the erosion process. However, slopes with more than 45% inclination, especially upstream in the basin, favor small amounts of sedimentation. In this area, erosion is limited by the extensive regeneration of matorral shrubs, deciduous vegetation, lithosols, and sandstones. The erosion-limiting effect is known for these lithologies and land use patterns [,]. The steep slope, dense vegetation, and hard rock limit sediment production in this case.
3.3. Soil Erosion Scenarios
Analyzing factors controlling erosion in the catchment has shown that quarries are the primary activity responsible for erosion and the main sediment source. Two simulation scenarios were investigated to mitigate the impact of the quarry on the erosion process in the study area. The first scenario (Table 7), which involved replacing the quarries with dense vegetation through afforestation, resulted in a significant reduction in erosion rates, which decreased from 13.22 to 8.44 t/ha/year, a decrease of 4.78 t/ha/year (Figure 3c).
Table 7.
Analysis of Scenario 1 (reforestation) using IntErO.
According to the asymmetry coefficient A, severe floods are possible in the watershed. The drainage network is highly dense according to the G value of 3.20. The watershed’s slopes are steep and nearly vertical, according to the Isr value of 479.65%. Based on a Z-value of 1.056 (Scenario 1) and 1.366 (Scenario 2), the watershed is classified as Destruction Category I. The erosion strength is considerable, and the type of erosion is surface erosion (Scenario 1) and mixed erosion (Scenario 2). Gavrilovic classifies the basin as category IV, i.e., an area of low erosion, with a value of 703.74 m3/km2god (Scenario 1), and as category III, a region of medium erosion, with a value of 1035.62 m3/km2god (Scenario 2).
It should be noted that reforestation requires a lot of time until the trees reach full maturity and can develop their protective effect. The second scenario (Table 8), which involves the conversion of quarries to cropland, also reduced erosion rates slightly by almost 1 t/ha/year, from 13.22 to 12.42 t/ha/year (Figure 3d). Although this approach is less practicable than reforestation, it has the advantage that it takes less time to convert quarries into agricultural land. The conversion of quarries into arable land is less effective than afforestation in erosion control. However, it has the advantage that the conversion and restoration of quarry areas take less time.
Table 8.
Analysis of Scenario 2 (cropping and plowing) using IntErO.
Both scenarios are critical to reducing erosion, protecting the downstream dam and harbor from the adverse effects of erosion, and promoting the restoration of regional ecosystem balance through reintroducing native fauna and flora. The combination of these approaches would enable more sustainable management of the quarry while maintaining water quality and biodiversity and helping to protect vital infrastructure.
3.4. Quantitative Analysis of Erosion Trends in the Basin
To assess these trends and anticipate potential impacts, the applied PAP/RAC method allowed us to simulate future regional developments regarding degradation or stabilization [,,]. The findings of this study show that the areas occupied by quarries (Figure 5a,b) exhibit a pronounced trend toward irreversible degradation, mainly concentrated in the central and upstream sections of the watershed where unprotected rocks predominate (Figure 6).
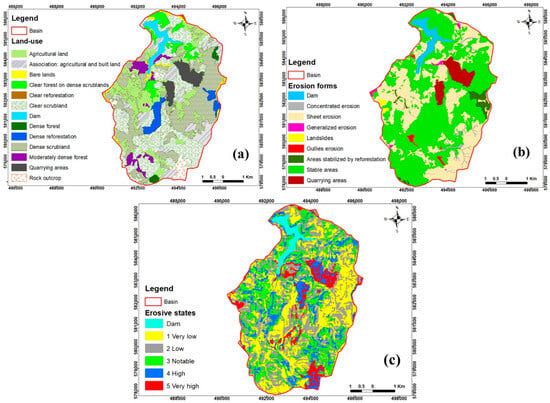
Figure 5.
Results of erosion trends: (a) LULC map, (b) forms of erosion, and (c) states of erosion.
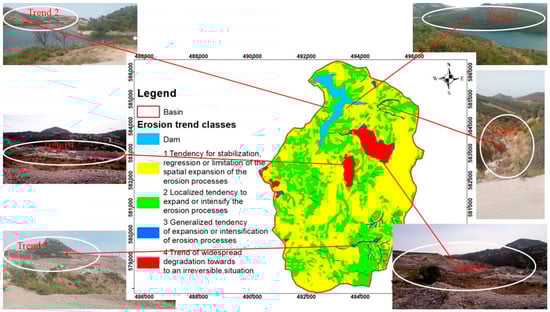
Figure 6.
Erosion trend classes map in R’mel watershed.
A widespread trend of widening or intensification of erosion was observed in areas with deep gullies, especially downstream of the basin. The zones around the dam are also moderately threatened (Figure 5c), indicating a localized trend of widening or intensifying erosion processes and highlighting the need for erosion control measures in this location. In contrast, the rest of the watershed appears to be relatively well preserved, with low erosion conditions and a trend toward stabilizing and regressing the spatial distribution of erosion processes (Figure 6).
4. Conclusions
Applying the IntErO algorithm based on the EPM model has proven to be a valuable tool for assessing sediment production under Moroccan environmental conditions. The study showed an average sediment production rate of 13.22 t/ha/an. Quarry areas were identified as the main contributors to sediment production, significantly influencing erosion and deposition downstream. These results are consistent with the qualitative model used by PAP/RAC, which shows a worrying trend of irreversible degradation in the quarry areas. In addition, the analysis has demonstrated that IntErO’s ability to simulate quarry rehabilitation scenarios supports reforestation as an effective strategy to mitigate erosion. This approach helps control erosion, promotes ecosystem restoration, and contributes to the recovery of local flora and fauna in the catchment. The study found that several factors influence sediment mobilization within the catchment, including land use, lithology, erosion forms, slopes, and rainfall. The results highlight the robustness and effectiveness of the IntErO algorithm in erosion studies and sediment assessment under Morocco’s unique environmental conditions. This research provides valuable insights for informed decision-making and promoting sustainable regional land management practices. By facilitating the conservation and restoration of critical ecosystems, the study contributes to the global scientific community and has broader implications for land management and erosion control research.
Author Contributions
Conceptualization, A.O., S.K., S.C., M.B. and V.S.; methodology, A.O., S.K., Y.B., M.A., S.C., M.B. and V.S.; software, A.O., S.K., Y.B., H.B., V.S., A.K. and A.H.; validation, A.O., S.K., Y.B., H.B., V.S., A.K., M.B. and A.H.; formal analysis, A.O., S.K., Y.B., S.C., H.B., V.S., A.K. and A.H.; investigation, A.O., S.K., Y.B., S.C., H.B., V.S., A.K. and A.H.; resources, A.O., S.K., Y.B., M.A., S.C. and V.S.; data curation, A.O., S.K., Y.B., M.A., S.C. and V.S.; writing—original draft preparation, A.O., S.K., Y.B., S.C., M.B., H.B., V.S., A.K. and A.H.; writing—review and editing, A.O., S.K., V.S., A.K. and A.H.; visualization, A.O., S.K., Y.B., S.C., H.B., V.S., A.K. and A.H.; supervision, V.S., A.K. and A.H.; project administration, V.S. All authors have read and agreed to the published version of the manuscript.
Funding
This research received no funding.
Institutional Review Board Statement
Not applicable.
Informed Consent Statement
Not applicable.
Data Availability Statement
Data is contained within the article. The IntErO model, developed by Professor Velibor Spalevic (2011), is available for free download and installation. It can be accessed at www.geasci.org/IntErO. Detailed instructions for downloading and installing the model can be found on the provided website.
Conflicts of Interest
The authors declare no conflicts of interest.
References
- Sadiki, A.; Faleh, A.; Navas, A.; Bouhlassa, S. Using magnetic susceptibility to assess soil degradation in the Eastern Rif, Morocco. Earth Surf. Process. Landf. 2009, 34, 2057–2069. [Google Scholar] [CrossRef]
- Okacha, A.; Salhi, A.; Arari, K.; El Badaoui, K.; Lahrichi, K. Soil erosion assessment using the RUSLE model for better planning: A case study from Morocco. Model. Earth Syst. Environ. 2023, 9, 3721–3729. [Google Scholar] [CrossRef]
- Sadiki, A.; Faleh, A.; Navas, A.; Bouhlassa, S. Assessing soil erosion and control factors by the radiometric technique in the Boussouab catchment, Eastern Rif, Morocco. CATENA 2007, 71, 13–20. [Google Scholar] [CrossRef]
- Ouallali, A.; Bouhsane, N.; Bouhlassa, S.; Moukhchane, M.; Ayoubi, S.; Aassoumi, H. Rapid magnetic susceptibility measurement as a tracer to assess the erosion–deposition process using tillage homogenization and simple proportional models: A case study in northern of Morocco. Int. J. Sediment Res. 2023, 38, 739–753. [Google Scholar] [CrossRef]
- Khodabin, G.; Lightburn, K.; Hashemi, S.M.; Moghada, M.S.K.; Jalilian, A. Evaluation of nitrate leaching, fatty acids, physiological traits and yield of rapeseed (Brassica napus) in response to tillage, irrigation and fertilizer management. Plant Soil 2022, 473, 423–440. [Google Scholar] [CrossRef]
- Qasim, W.; Wan, L.; Lv, H.; Zhao, Y.; Hu, J.; Meng, F.; Lin, S.; Butterbach-Bahl, K. Impact of anaerobic soil disinfestation on seasonal N2O emissions and N leaching in greenhouse vegetable production system depends on amount and quality of organic matter additions. Sci. Total. Environ. 2022, 830, 154673. [Google Scholar] [CrossRef]
- Liu, T.; Xu, X.; Yang, J. Experimental study on the effect of freezing-thawing cycles on wind erosion of black soil in Northeast China. Cold Reg. Sci. Technol. 2017, 136, 1–8. [Google Scholar] [CrossRef]
- Kader, S.; Raimi, M.O.; Spalevic, V.; Iyingiala, A.-A.; Bukola, R.W.; Jaufer, L.; Butt, T.E. A concise study on essential parameters for the sustainability of Lagoon waters in terms of scientific literature. Turk. J. Agric. For. 2023, 47, 288–307. [Google Scholar] [CrossRef]
- Xinbao, Z.; Higgitt, D.; Walling, D. A preliminary assessment of the potential for using caesium-137 to estimate rates of soil erosion in the Loess Plateau of China. Hydrol. Sci. J. 1990, 35, 243–252. [Google Scholar] [CrossRef]
- Ritchie, J.C.; Ritchie, C.A. Bibliography of Publications of 137 Cesium Studies Related to Erosion and Sediment Deposition; 1011-4289; International Atomic Energy Agency (IAEA): Vienna, Austria, 1995; pp. 125–201. [Google Scholar]
- Preiss, N.; Mélières, M.A.; Pourchet, M. A compilation of data on lead 210 concentration in surface air and fluxes at the air-surface and water-sediment interfaces. J. Geophys. Res. Atmos. 1996, 101, 28847–28862. [Google Scholar] [CrossRef]
- Walling, D.E.; He, Q.; Blake, W. Use of 7Be and 137Cs measurements to document short-and medium-term rates of water-induced soil erosion on agricultural land. Water Resour. Res. 1999, 35, 3865–3874. [Google Scholar] [CrossRef]
- Sepulveda, A.; Schuller, P.; Walling, D.E.; Castillo, A. Use of 7Be to document soil erosion associated with a short period of extreme rainfall. J. Environ. Radioact. 2008, 99, 35–49. [Google Scholar] [CrossRef]
- Fesenko, S.; Prudnikov, P.; Isamov, N.; Emlyutina, E.; Titov, I. Dynamics of 137Cs concentration in fodder in the long-term after the Chernobyl accident. Biol. Bull. 2022, 49, 2359–2368. [Google Scholar] [CrossRef]
- Cabrera, M.; Sanabria, R.; González, J.; Cabral, P.; Tejeda, S.; Zarazua, G.; Melgar-Paniagua, E.; Tassano, M. Using 137Cs and 210Pbex to assess soil redistribution at different temporal scales along with lithogenic radionuclides to evaluate contrasted watersheds in the Uruguayan Pampa grassland. Geoderma 2023, 435, 116502. [Google Scholar] [CrossRef]
- Lizaga Villuendas, I.; Latorre, B.; Gaspar, L.; Navas, A. Effect of historical land-use change on soil erosion in a Mediterranean catchment by integrating 137Cs measurements and WaTEM/SEDEM model. Hydrol. Process. 2022, 36, e14577. [Google Scholar] [CrossRef]
- Tan, M.L.; Gassman, P.W.; Yang, X.; Haywood, J. A review of SWAT applications, performance and future needs for simulation of hydro-climatic extremes. Adv. Water Resour. 2020, 143, 103662. [Google Scholar] [CrossRef]
- Hao, Z.; Wu, D. Data Preprocessing of Soil Attributes for Ecohydrological Applications Using SWAT Model at Xin’anjiang Upstream Watershed, China. Ecohydrol. Hydrobiol. 2023, 23, 198–210. [Google Scholar] [CrossRef]
- Briak, H.; Moussadek, R.; Aboumaria, K.; Mrabet, R. Assessing sediment yield in Kalaya gauged watershed (Northern Morocco) using GIS and SWAT model. Int. Soil Water Conserv. Res. 2016, 4, 177–185. [Google Scholar] [CrossRef]
- Ouallali, A.; Briak, H.; Aassoumi, H.; Beroho, M.; Bouhsane, N.; Moukhchane, M. Hydrological foretelling uncertainty evaluation of water balance components and sediments yield using a multi-variable optimization approach in an external Rif’s catchment. Morocco. Alex. Eng. J. 2020, 59, 775–789. [Google Scholar] [CrossRef]
- Renard, K.G. Predicting Soil Erosion by Water: A guide to Conservation Planning with the Revised Universal Soil Loss Equation (RUSLE); US Department of Agriculture, Agricultural Research Service: Beltsville, MD, USA, 1997.
- Williams, J.; Berndt, H. Sediment yield prediction based on watershed hydrology. Trans. ASAE 1977, 20, 1100–1104. [Google Scholar] [CrossRef]
- Mitasova, H.; Mitas, L. Modeling Soil Detachment with RUSLE 3D Using GIS; University of Illinois at Urbana-Champaign: Champaign, IL, USA, 1999. [Google Scholar]
- Gavrilović, S. Inženjering o Bujičnim Tokovima i Eroziji; Izgradnja: Belgrade, Serbia, 1972. [Google Scholar]
- Bezak, N.; Borrelli, P.; Mikoš, M.; Jemec Auflič, M.; Panagos, P. Towards multi-model soil erosion modelling: An evaluation of the erosion potential method (EPM) for global soil erosion assessments. CATENA 2024, 234, 107596. [Google Scholar] [CrossRef]
- Tangestani, M.H. Comparison of EPM and PSIAC models in GIS for erosion and sediment yield assessment in a semi-arid environment: Afzar Catchment, Fars Province, Iran. J. Asian Earth Sci. 2006, 27, 585–597. [Google Scholar] [CrossRef]
- Ahmadi, M.; Minaei, M.; Ebrahimi, O.; Nikseresht, M. Evaluation of WEPP and EPM for improved predictions of soil erosion in mountainous watersheds: A case study of Kangir River basin, Iran. Model. Earth Syst. Environ. 2020, 6, 2303–2315. [Google Scholar] [CrossRef]
- Sestras, P.; Mircea, S.; Roșca, S.; Bilașco, Ș.; Sălăgean, T.; Dragomir, L.O.; Herbei, M.V.; Bruma, S.; Sabou, C.; Marković, R.; et al. GIS based soil erosion assessment using the USLE model for efficient land management: A case study in an area with diverse pedo-geomorphological and bioclimatic characteristics. Not. Bot. Horti Agrobot. Cluj-Napoca 2023, 51, 13263. [Google Scholar] [CrossRef]
- Ouallali, A.; Aassoumi, H.; Moukhchane, M.; Moumou, A.; Houssni, M.; Spalevic, V.; Keesstra, S. Sediment mobilization study on Cretaceous, Tertiary and Quaternary lithological formations of an external Rif catchment, Morocco. Hydrol. Sci. J. 2020, 65, 1568–1582. [Google Scholar] [CrossRef]
- Spalevic, V.; Barovic, G.; Vujacic, D.; Curovic, M.; Behzadfar, M.; Djurovic, N.; Dudic, B.; Billi, P. The impact of land use changes on soil erosion in the river basin of Miocki Potok, Montenegro. Water 2020, 12, 2973. [Google Scholar] [CrossRef]
- Youssef, B.; Bouskri, I.; Brahim, B.; Kader, S.; Brahim, I.; Abdelkrim, B.; Spalević, V. The contribution of the frequency ratio model and the prediction rate for the analysis of landslide risk in the Tizi N’tichka area on the national road (RN9) linking Marrakech and Ouarzazate. CATENA 2023, 232, 107464. [Google Scholar] [CrossRef]
- Tahouri, J.; Sadiki, A.; Karrat, L.h.; Johnson, V.C.; Chan, N.w.; Fei, Z.; Kung, H.T. Using a modified PAP/RAC model and GIS-for mapping water erosion and causal risk factors: Case study of the Asfalou watershed, Morocco. Int. Soil Water Conserv. Res. 2022, 10, 254–272. [Google Scholar] [CrossRef]
- Elbadaoui, K.; Mansour, S.; Ikirri, M.; Abdelrahman, K.; Abu-Alam, T.; Abioui, M. Integrating Erosion Potential Model (EPM) and PAP/RAC Guidelines for Water Erosion Mapping and Detection of Vulnerable Areas in the Toudgha River Watershed of the Central High Atlas, Morocco. Land 2023, 12, 837. [Google Scholar] [CrossRef]
- Diani, K.; Ettazarini, S.; Hahou, Y.; El Belrhiti, H.; Allaoui, W.; Mounir, K.; Gourfi, A. Chapter 11—Identification of soil erosion sites in semiarid zones: Using GIS, remote sensing, and PAP/RAC model. In Handbook of Hydroinformatics; Eslamian, S., Eslamian, F., Eds.; Elsevier: Amsterdam, The Netherlands, 2023; pp. 169–183. [Google Scholar] [CrossRef]
- Huang, W.; Ho, H.C.; Peng, Y.; Li, L. Qualitative risk assessment of soil erosion for karst landforms in Chahe town, Southwest China: A hazard index approach. CATENA 2016, 144, 184–193. [Google Scholar] [CrossRef]
- Drzewiecki, W.; Wężyk, P.; Pierzchalski, M.; Szafrańska, B. Quantitative and qualitative assessment of soil erosion risk in Małopolska (Poland), supported by an object-based analysis of high-resolution satellite images. Pure Appl. Geophys. 2014, 171, 867–895. [Google Scholar] [CrossRef]
- Kader, S.; Jaufer, L.; Bashir, O.; Raimi, M.O. A Comparative Study on the Stormwater Retention of Organic Waste Substrates Biochar, Sawdust, and Wood Bark Recovered from Psidium Guajava L. Species. Comp. Study Stormwater Retent. Org. Waste Substrates 2023, 69, 105–112. [Google Scholar] [CrossRef]
- Chikh, H.A.; Habi, M.; Morsli, B. Influence of vegetation cover on the assessment of erosion and erosive potential in the Isser marly watershed in northwestern Algeria—Comparative study of RUSLE and PAP/RAC methods. Arab. J. Geosci. 2019, 12, 154. [Google Scholar] [CrossRef]
- Mohamed-Chérif, F.; Ducruet, C. Regional integration and maritime connectivity across the Maghreb seaport system. J. Transp. Geogr. 2016, 51, 280–293. [Google Scholar] [CrossRef]
- Sort, X.; Alcaniz, J. Contribution of sewage sludge to erosion control in the rehabilitation of limestone quarries. Land Degrad. Dev. 1996, 7, 69–76. [Google Scholar] [CrossRef]
- Ozcelik, M. Comparison of the environmental impact and production cost rates of aggregates produced from stream deposits and crushed rock quarries (Boğaçay Basin/Antalya/Turkey). Geoheritage 2022, 14, 18. [Google Scholar] [CrossRef]
- Taoufik, M.; Loukili, I.; Hadi, H.E.; Baghdad, B. Soil erosion risk assessment in an extraction area: Case of abandoned quarries in the Akreuch region (Morocco). In Proceedings of the 2020 IEEE International conference of Moroccan Geomatics (Morgeo), Casablanca, Morocco, 11–13 May 2020; pp. 1–5. [Google Scholar] [CrossRef]
- Costa, J.P.R.; Gomes, G.J.; Fernandes, G.; Magarinos, D.M.; Fonseca, A.; Pires, P.J. Ferronickel slag as free-draining rockfill dike material: A novel waste solution for mining regions. J. Mater. Cycles Waste Manag. 2023, 25, 128–143. [Google Scholar] [CrossRef]
- Elaloui, A.; Khalki, E.M.E.; Namous, M.; Ziadi, K.; Eloudi, H.; Faouzi, E.; Bou-Imajjane, L.; Karroum, M.; Tramblay, Y.; Boudhar, A. Soil erosion under future climate change scenarios in a semi-arid region. Water 2022, 15, 146. [Google Scholar] [CrossRef]
- López, S.; Wright, C.; Costanza, P. Environmental change in the equatorial Andes: Linking climate, land use, and land cover transformations. Remote Sens. Appl. Soc. Environ. 2017, 8, 291–303. [Google Scholar] [CrossRef]
- Henriques, C.; Zêzere, J.L.; Marques, F. The role of the lithological setting on the landslide pattern and distribution. Eng. Geol. 2015, 189, 17–31. [Google Scholar] [CrossRef]
- Abdolmaleki, M.; Mokhtari, A.R.; Akbar, S.; Alipour-Asll, M.; Carranza, E.J.M. Catchment basin analysis of stream sediment geochemical data: Incorporation of slope effect. J. Geochem. Explor. 2014, 140, 96–103. [Google Scholar] [CrossRef]
- Efthimiou, N.; Lykoudi, E.; Karavitis, C. Comparative analysis of sediment yield estimations using different empirical soil erosion models. Hydrol. Sci. J. 2017, 62, 2674–2694. [Google Scholar] [CrossRef]
- Raissis, F.; Theochari, A.-P.; Baltas, E. Soil transportation assessment of an eastern Mediterranean basin in Greece using GIS techniques. Euro-Mediterr. J. Environ. Integr. 2022, 7, 361–376. [Google Scholar] [CrossRef]
- Roy, P.; Pal, S.C.; Chakrabortty, R.; Saha, A.; Chowdhuri, I. A systematic review on climate change and geo-environmental factors induced land degradation: Processes, policy-practice gap and its management strategies. Geol. J. 2023, 58, 3487–3514. [Google Scholar] [CrossRef]
- Chalise, D.; Kumar, L.; Spalevic, V.; Skataric, G. Estimation of sediment yield and maximum outflow using the IntErO model in the Sarada river basin of Nepal. Water 2019, 11, 952. [Google Scholar] [CrossRef]
- Pavlova-Traykova, E.; Grigorova-Pesheva, B.; Petrova, K. Soil loss assessment by applying intero model. For. Sci. 2023, 59, 41–46. [Google Scholar]
- Sestras, P.; Mircea, S.; Cîmpeanu, S.M.; Teodorescu, R.; Roșca, S.; Bilașco, Ș.; Rusu, T.; Salagean, T.; Dragomir, L.O.; Marković, R. Soil erosion assessment using the intensity of erosion and outflow model by estimating sediment yield: Case study in river basins with different characteristics from Cluj County, Romania. Appl. Sci. 2023, 13, 9481. [Google Scholar] [CrossRef]
- Spalevic, V. Impact of Land Use on Runoff and Soil Erosion in Polimlje. Ph.D. Thesis, Faculty of Agriculture of the University of Belgrade, Belgrage, Serbia, 2011. [Google Scholar]
- Spalevic, V. Assessment of soil erosion processes by using the ‘IntErO’model: Case study of the Duboki Potok, Montenegro. J. Environ. Prot. Ecol. 2019, 20, 657–665. [Google Scholar]
- Mohammadi, M.; Khaledi Darvishan, A.; Spalevic, V.; Dudic, B.; Billi, P. Analysis of the impact of land use changes on soil erosion intensity and sediment yield using the intero model in the talar watershed of Iran. Water 2021, 13, 881. [Google Scholar] [CrossRef]
- Rajabi, A.M.; Yavari, A.; Cheshomi, A. Sediment yield and soil erosion assessment by using empirical models for Shazand watershed, a semi-arid area in center of Iran. Nat. Hazards 2022, 112, 1685–1704. [Google Scholar] [CrossRef]
- Berteni, F.; Barontini, S.; Grossi, G. Evaluating soil erosion by water in a small alpine catchment in Northern Italy: Comparison of empirical models. Acta Geochim. 2021, 40, 507–524. [Google Scholar] [CrossRef]
- Tričković, N.; Rončević, V.; Živanović, N.; Grujić, T.; Stefanović, L.; Jovanović, N.; Zlatić, M. Ecological and Economic Effects of Applying the Future Agricultural Production Structure Model (FAPSMS): The Case Study of the Barička River Basin. Sustainability 2023, 15, 8434. [Google Scholar] [CrossRef]
- Rončević, V.; Zlatić, M.; Todosijević, M. Environmental and economic effects of investments in sustainable land management in the basin of Šutilovac stream. Glas. Sumar. Fak. 2019, 19, 213–232. [Google Scholar] [CrossRef]
- Lamane, H.; Moussadek, R.; Baghdad, B.; Mouhir, L.; Briak, H.; Laghlimi, M.; Zouahri, A. Soil water erosion assessment in Morocco through modeling and fingerprinting applications: A review. Heliyon 2022, 8, e10209. [Google Scholar] [CrossRef]
- Griesbach, J.; Ruiz Sinoga, J.; Giordano, A.; Berney, O.; Gallart, F. Directives pour la Cartographie et la Mesure des Processus d’Erosion Hydrique dans les Zones Cotieres Mediterraneennes. 1998. Available online: https://www.academia.edu/76126325/Directives_pour_la_cartograophie_et_la_mesure_des_processus_d_erosion_hydrique_dans_les_zones_cotieres_mediterraneennes (accessed on 17 June 2023).
- Gavrilovic, Z. Use of an Empirical Method(Erosion Potential Method) for Calculating Sediment Production and Transportation in Unstudied or Torrential Streams. In Proceedings of the International Conference on River Regime, Wallingford, UK, 18–20 May 1988; Hydraulics Research Limited: Wallingford, UK, 1988; pp. 411–422. [Google Scholar]
- Sabri, E.; Spalevic, V.; Boukdir, A.; Karaoui, I.; Ouallali, A.; Mincato, R.L.; Sestras, P. Estimation of soil losses and reservoir sedimentation: A case study in Tillouguite sub-basin (High Atlas-Morocco). Agric. For./Poljopr. Sumar. 2022, 68, 207–220. [Google Scholar] [CrossRef]
- Aït Brahim, L.; Sossey Alaoui, F.; Siteri, H.; Tahri, M. Quantification of soil loss in the Nakhla watershed (northern Rif). Sécheresse-Sci. Chang. Planétaires 2003, 14, 101–106. [Google Scholar]
- Damnati, B.; Ibrahimi, S.; Benhardouze, O.; Benhardouze, H.; Reddad, H.; Radakovitch, O. Quantification de l’érosion par le 137Cs et le 210Pb: Cas de deux bassins versants au Nord-Ouest du Maroc (Région de Tanger-Tétouan). Notes Mémoires Serv. Géologique Maroc 2012, 575, 74–80. [Google Scholar]
- Ed-daoudy, L.; Lahmam, N.; Benmansour, M.; Afilal, H.; Ben harra, A.; Damnati, B. Hydric erosion rates in Raouz watershed, Morocco: RUSLE, GIS, and remote sensing. Remote Sens. Appl. Soc. Environ. 2023, 32, 101056. [Google Scholar] [CrossRef]
- Kader, S.; Novicevic, R.; Jaufer, L. Soil Management in Sustainable Agriculture: Analytical Approach for the Ammonia Removal from the Diary Manure. J. Agric. For. 2022, 68, 69–78. [Google Scholar] [CrossRef]
- Kostadinov, S.; Braunović, S.; Dragićević, S.; Zlatić, M.; Dragović, N.; Rakonjac, N. Effects of erosion control works: Case study—Grdelica Gorge, the South Morava River (Serbia). Water 2018, 10, 1094. [Google Scholar] [CrossRef]
- Manojlović, S.; Antić, M.; Šantić, D.; Sibinović, M.; Carević, I.; Srejić, T. Anthropogenic impact on erosion intensity: Case study of rural areas of pirot and dimitrovgrad municipalities, Serbia. Sustainability 2018, 10, 826. [Google Scholar] [CrossRef]
Disclaimer/Publisher’s Note: The statements, opinions and data contained in all publications are solely those of the individual author(s) and contributor(s) and not of MDPI and/or the editor(s). MDPI and/or the editor(s) disclaim responsibility for any injury to people or property resulting from any ideas, methods, instructions or products referred to in the content. |
© 2024 by the authors. Licensee MDPI, Basel, Switzerland. This article is an open access article distributed under the terms and conditions of the Creative Commons Attribution (CC BY) license (https://creativecommons.org/licenses/by/4.0/).