Abstract
The Landscape Character Assessment (LCA) method from the UK has proven effective in identifying landscape values and characteristics through a comprehensive mapping process. However, it is predominantly expert-led and lacks an evaluation of scenery, hindering the inclusion of the broader community’s preferences and visual attachment to their landscape. In Australia, the application of the Scenic Amenity Methodology (SAM) using Geographical Information System (GIS) mapping has engaged communities but has often overlooked the importance of landscape character. To overcome these limitations, this study presents an innovative scenic assessment methodology, referred to as modified Scenic Amenity Methodology (modified SAM). The methodology establishes landscape character types (LCTs) to map scenic preference ratings derived from community photo surveys. Simultaneously, it incorporates the visual exposure of the landscape from publicly accessible viewpoints, modelled using a Digital Elevation Model (DEM). The combination of scenic preferences and visual exposure enables mapping of the scenic amenity values held by the community. This methodology was first trialled in Bundaberg, then Cairns, the Whitsunday Islands, and, most recently, Toowoomba in Queensland, Australia. This paper presents the results of the Toowoomba study and reports on the challenges and limitations of informing landscape character type (LCT) values through a public photo survey, developing a scenic preference map from ratings of photos across a region, a map of the visual exposure of landscape elements from key public viewing locations, and, ultimately, a map of scenic amenity values across the Toowoomba Region. It indicates that integrating previous LCA approaches with public participation through community preferences is indeed feasible for regional landscape planning.
1. Introduction
Traditional approaches to landscape planning, based on preserving and protecting natural beauty and amenity, need to be continuously reinvented and developed in response to environmental, social, and economic shifts [1]. An expanded role for landscape planning is needed to conserve, reinforce, restore, and create enhanced landscape qualities [2]. Various government and planning systems have allowed different levels of application of approaches to landscape planning. Scenic evaluations and Landscape Character Assessment (LCA) are two dominant approaches that are widely—but disparately—adopted in the UK and the US, both of which have continued to evolve in Australia in broad-scale landscape planning applications.
The US Forest Service published the ground-breaking and highly influential Visual Management System (VMS) in 1973 [3], which included concepts and principles that were later adopted in the development of LCA in the UK [3,4]. Compared to earlier geographic, descriptive, and objective landscape classification systems, or highly subjective aesthetic approaches, the VMS was based on psycho-social research evidence on human (Western) preferences for ruggedness, naturalness, unity, integrity, intactness, etc. Later, the USA regional landscape inventories emphasised the importance of both natural and cultural features as a ‘sight to insight’ approach [5]. Thus, natural and man-made features were equally considered, more appropriately balancing the scenic emphasis of earlier approaches.
Approaches based on landscape character emerged in the UK in the mid-1980s in response to the imperative of safeguarding rural areas from the threats posed by urbanisation and industrial development [5]. As a methodology rooted in practical landscape assessment, LCA encompasses the intricate layers of landscape values. It aids in making strategic decisions in spatial planning, development control, archaeological management, and landscape stewardship [6,7]. LCA operates as a practical tool for informing local planning decisions and policy making. The European Landscape Convention [8], or ‘Florence Convention’, expanded the application of LCA to other European countries and beyond as an influential landscape assessment approach [5,6,9,10,11].
Similar to the USA, Australia has not achieved a consistent federal (national)-level approach to broad-scale landscape planning [12]. However, the UK’s LCA approach has been widely assimilated and adopted as the basis of landscape planning frameworks across Australia, including Visual Landscape Planning in Western Australia [13]. The transition of the Queensland Government to using maps as triggers for development controls and the need to map and manage scenic values across various local council areas resulted in the development of a consistent regional policy for South East Queensland (SEQ) in the identification and protection of scenic amenity values [14]. The protection of regional landscape values and scenic amenity for SEQ was established in the South East Queensland Regional Plan (2009) through Implementation Guideline No. 8. This guideline has endured through more recent iterations of the regional plan, consistently upholding its commitment to these objectives.
The Scenic Amenity Methodology (SAM) originated from a pilot study initiated by the Regional Landscape and Open Space Advisory Committee and Brisbane City Council in 1999. The SAM has valuable elements for evaluating regional landscapes, including considerations of scenic amenity based on scenic preference (i.e., the relative preference of the public for different landscape elements) and visual exposure (i.e., the relative visibility from public viewing locations). The definition of scenic amenity in Guideline No. 8 is ‘a measure of the relative contribution of each place in the landscape to the community appreciation of open space as viewed from places that are important to the public’ [15]. This methodology has been adopted by some (but not all) local government authorities in other parts of the state by measuring and mapping the areas of high scenic amenity for integration into planning schemes.
This paper aims to propose a new and more comprehensive approach to landscape planning by integrating previously established methods of assessing scenic amenity and addressing the limitations of previous approaches. This method aims to address the complex challenges facing our landscapes and communities by providing a more robust and practical framework for engagement through scenic values. A new framework is created to assess, map, and evaluate landscapes to inform management plans and land-use controls at a regional scale. This approach seeks to incorporate community inputs to increase the calibration and resolution of landscape overlays, providing a more informed and inclusive approach to landscape planning.
2. Methodology
Scenic amenity, as applied in Queensland, is calculated from two independent factors: scenic preference (SP) and visual exposure (VE). Scenic preference (SP) is a measure of the relative contribution of community preferences for different landscapes. It is rated between 1 and 10, based on a statistical analysis of detailed information from community photo surveys and assigning these ratings to mapping units (Figure 1a). Visual exposure (VE) is a measure of the relative visibility of different parts of the landscape as seen from publicly accessible viewpoints, as modelled in a Digital Elevation Model (DEM). It considers the average number of people travelling on routes or visiting public locations and the approximate time they spend looking at the view. Visual exposure is rated between values of 1 and 10, as deciles from ‘least’ visible areas (visible to 10% of viewers) to ‘moderate’ and ‘most’ visible areas. Furthermore, this analysis integrates the land-cover attenuation factor, which considers the influences of screening by vegetation and built form on visibility (Figure 1b).
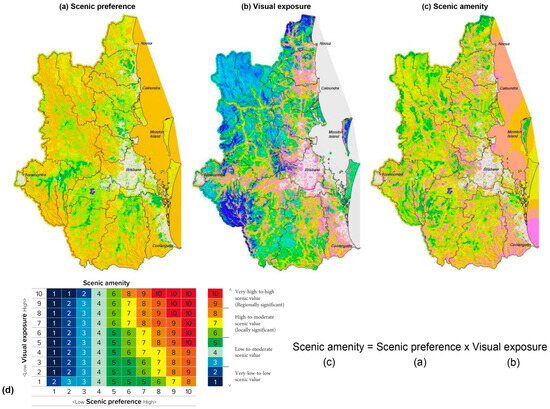
Figure 1.
SEQ Scenic Amenity Methodology (SAM) 2004: (a) scenic preference map; (b) visual exposure map; (c) scenic amenity map; (d) SAM look-up table (source: Queensland Government, 2004).
A scenic amenity rating (Figure 1c) is calculated by combining scenic preference and visual exposure maps equally, using a scenic amenity matrix or look-up table (Figure 1d). The matrix reflects the interaction of these two factors based on the logic that the community highly values visible landscapes with preferred elements. By combining these factors, different levels of scenic amenity values can be grouped according to significance, either regionally significant (9–10) or locally significant (6–8). The scenic amenity rating, however, is influenced more by the scenic preference rating. The highest scenic amenity rating for a mapped landscape unit occurs when both the scenic preference and visual exposure of that unit are high. Importantly, the matrix allows values to be attributed to highly preferred landscape elements, even when they are seen by relatively few observers [14]. If the scenic preference for the map unit is less than 4, the scenic amenity decreases with an increase in visual exposure. Scores on either side of the scenic preference rating of 4 indicate that individuals tend to respond more favourably to landscape elements with a score of 5 or higher while reacting negatively to elements with a score of 3 or less.
This duality of the SAM, considering both scenic preferences for certain landscape views and social considerations such as public sensitivities or concerns, is in accordance with US psycho-social approaches [16]. The SAM developed mapping of scenic values by integrating land-cover categories with evaluations of them using scenic preference surveys, then including visual exposure and experience across the landscape.
The SAM marked a significant departure from prior approaches employed in Australia and overseas when it introduced a participatory component that identified and rated community preferences for scenic qualities. While this represented a community-based and non-expert assessment, it also adopted a consistent approach to landscape evaluation with repeatable results [17]. It has evolved into a valuable process that heightens awareness of scenic amenity within communities, aiming to establish a regional approach through a transparent and reliable methodology.
However, scenic amenity (as assessed by the SAM) only represents limited layers of assessment and is only part of the full range of landscape values held by community members. In particular, it has intrinsic limitations in appreciating the nuances of landscape character. For example, scenic preferences (as rated by individuals or focus groups using photographs) are a simplification, often emphasising naturalness, which does not evaluate the broader viewshed context and landscape character, the historical or recreational values of the landscape, or its contribution to distinctive regional character. The lack of connection between scenic values and landscape character within the SAM framework caused the landscape architecture profession in Queensland to challenge the validity and application of the SAM [17]. Among their criticisms were the limited nature of the scenic preference survey photos, divided into four domains (bush, coast, urban, and rural) and visual elements (built and non-built). It was argued that these survey photos presented only broad land-use and land-cover-type categories; hence, the SAM insufficiently considered landscape integrity and character [17] and regional variations in the accessibility of landscape types.
Considering the stated limitations of the SAM in integrating landscape character values and the reliance of LCA on expert judgments with little or no community input, landscape architects in Queensland explored options for developing an alternative methodology by relating and integrating these two parallel approaches into one evaluation method. Our team trialled the integration of character and the SAM by adding a layer of ‘valued landscape character types’ to GIS scenic amenity mapping (creating a hybrid ‘Landscape Values Map’) in the Bundaberg Landscape Study [18] and then took this one step further by basing the scenic preference photo survey on landscape character types rather than visual domains in the Cairns Scenic Amenity Study [19] and again in the Whitsunday Scenic Amenity Study [20].
3. Alternative Methodology
3.1. Study Area
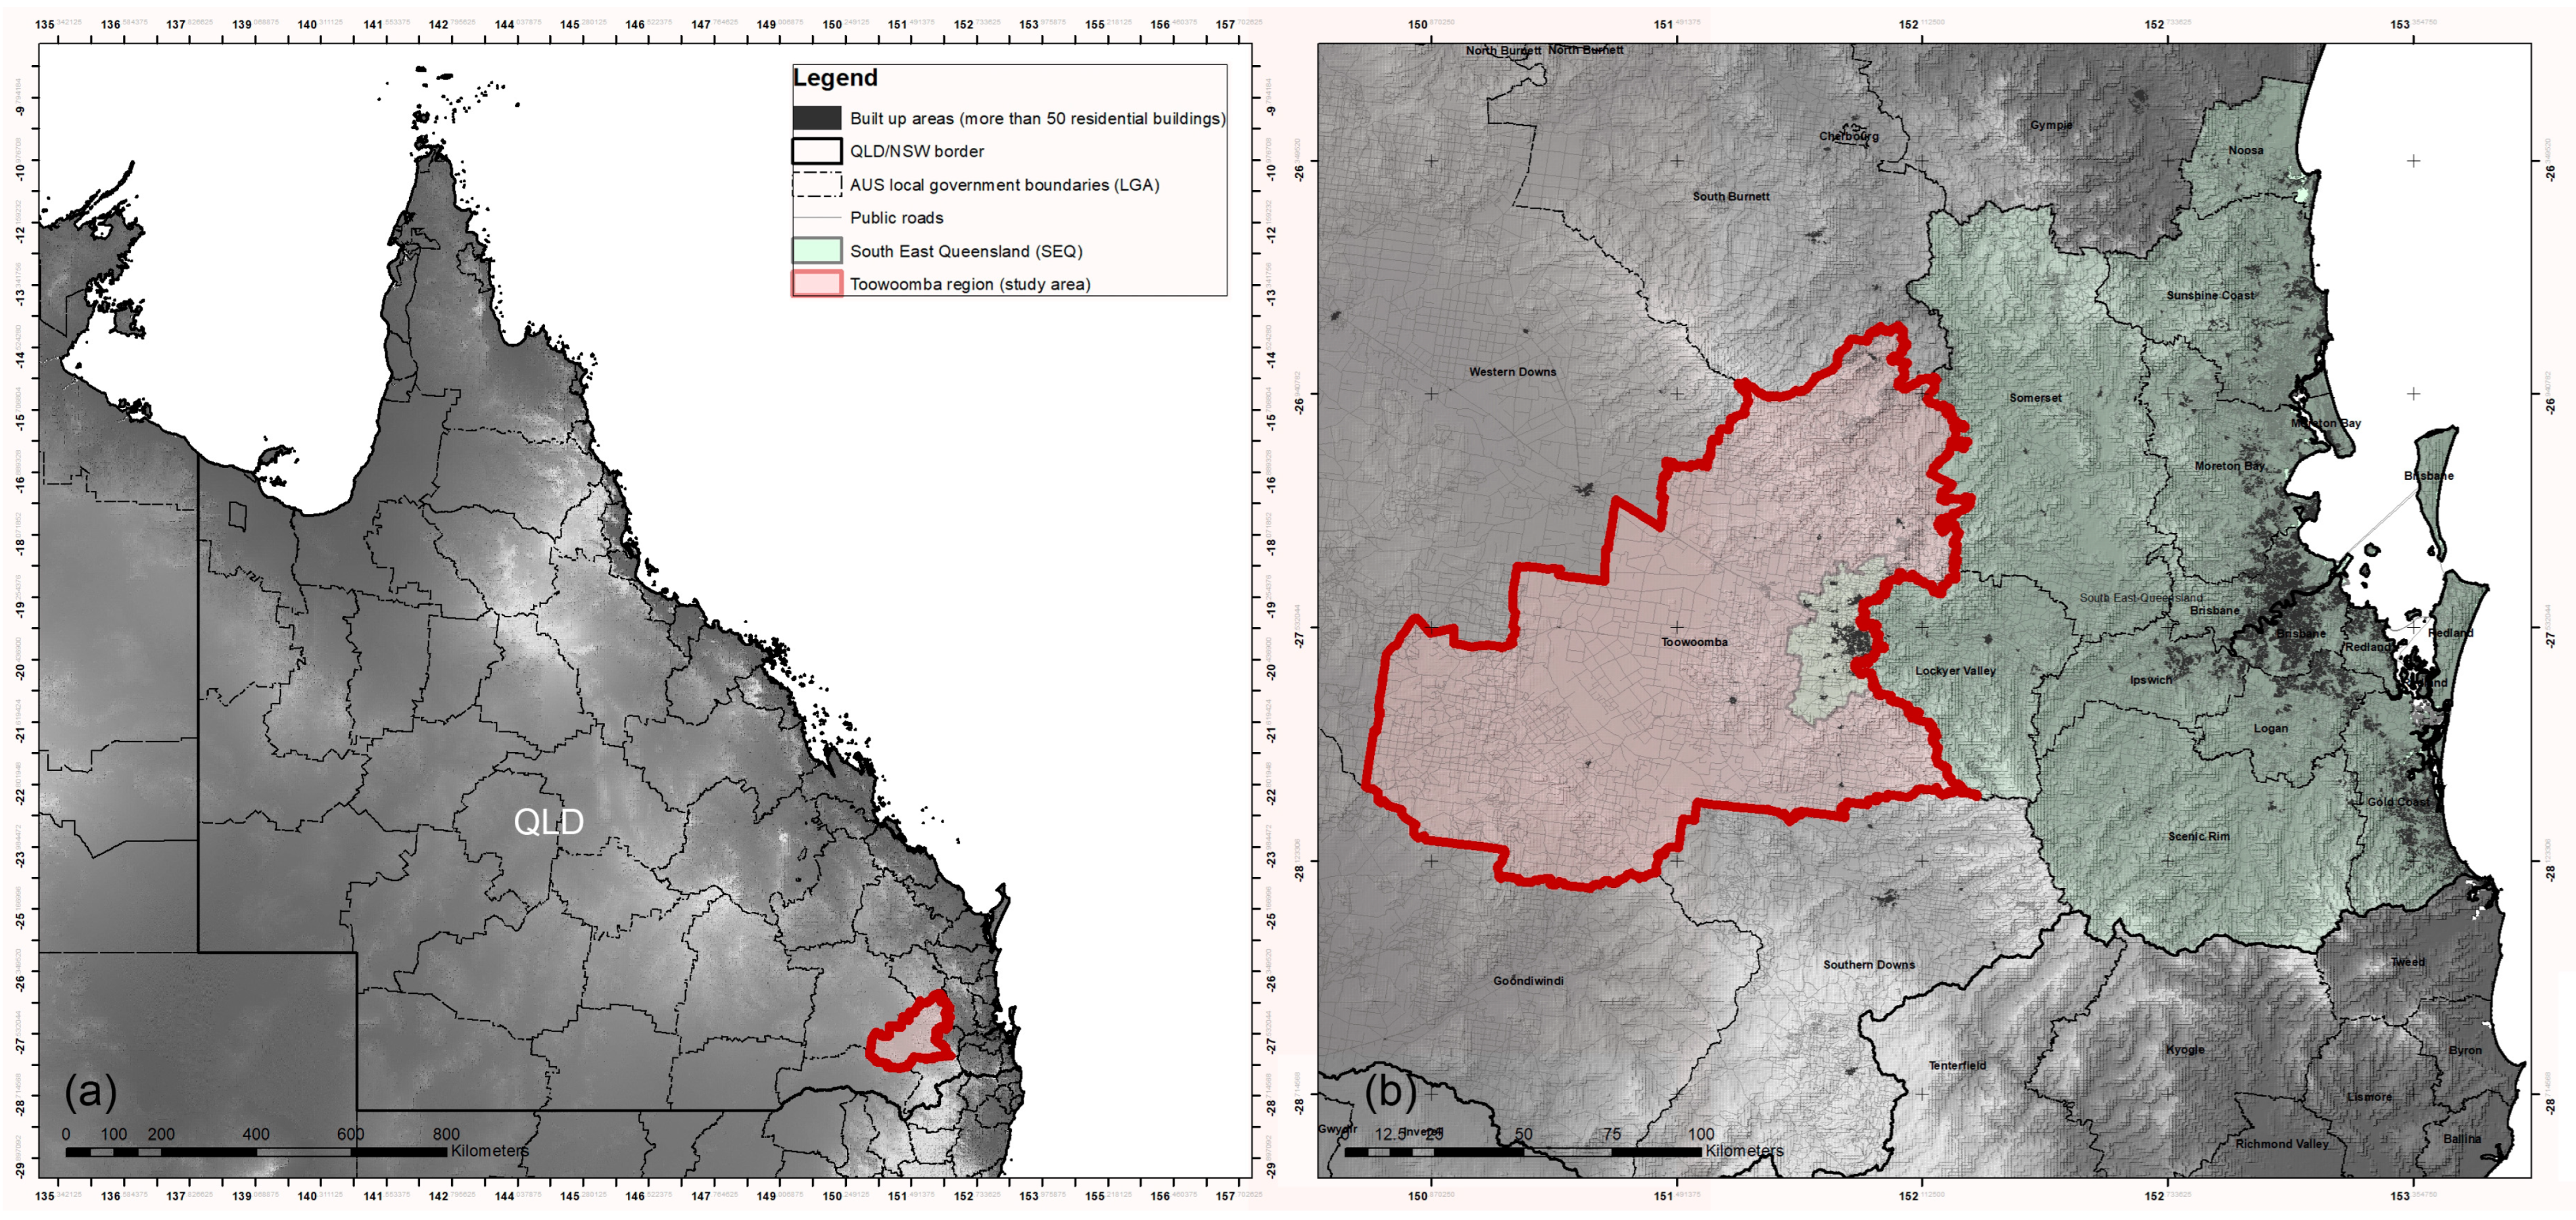
This study further developed an integrated approach with a specific focus on the Toowoomba Region, located in South East Queensland (SEQ), approximately 125 km west of Brisbane, the state capital. Encompassing an area of 12,975.3 km2 [21], the Toowoomba Region showcases diverse landscapes, ranging from flat agricultural plains to steep mountainous regions, with many areas highly esteemed for their scenic beauty and exceptional views. It comprises a diverse range of regional landscapes, encompassing urban and rural holdings, agricultural production, resource and mining sites, as well as protected areas.
At the time of our study, the population of the Toowoomba Region was 173,204 [22], and around 62% of this population resided within Toowoomba City. The region’s population is expected to increase by over 64,000 people by 2051 in a medium–high growth scenario [22]. Furthermore, numerous rural towns throughout the Toowoomba Region are facing challenges in accommodating growth, especially those located in close proximity to Toowoomba City. Therefore, it is imperative to effectively manage growth and development in the Toowoomba Region to safeguard its distinctive and diverse landscape, as well as its cultural and scenic amenity values (Figure 2).
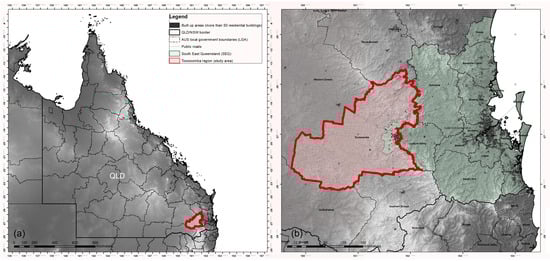
Figure 2.
Study area: (a) QLD local government areas; (b) Toowoomba Region in relation to SEQ.
The previous scenic amenity assessment undertaken for Toowoomba Regional Council (TRC) [23] emphasised identifying areas of high scenic amenity and sought to protect these values that were affected by proposed developments. However, the application of the regional SAM methodology and heavy reliance on quantitative GIS analysis and outputs resulted in extremely small and in cohesive areas of the Toowoomba Region being identified as having high scenic value. As such, a planning-scheme scenic amenity overlay in practice was rarely triggered by a development application.
In discussion with TRC, which commissioned a scenic amenity study to support the review of their current planning scheme, an alternative methodology was developed to address their concerns and ensure the outcomes of the study were relevant to and could appropriately guide planning in the region. It was decided to trial a new methodology that (a) embedded and integrated a Landscape Character Assessment (LCA) approach within a modified SAM methodology, (b) was supported by community participation to define scenic preference values based on landscape character types, and (c) used an alternative mapping analysis approach.
3.2. Integrating LCA into Scenic Preference Mapping
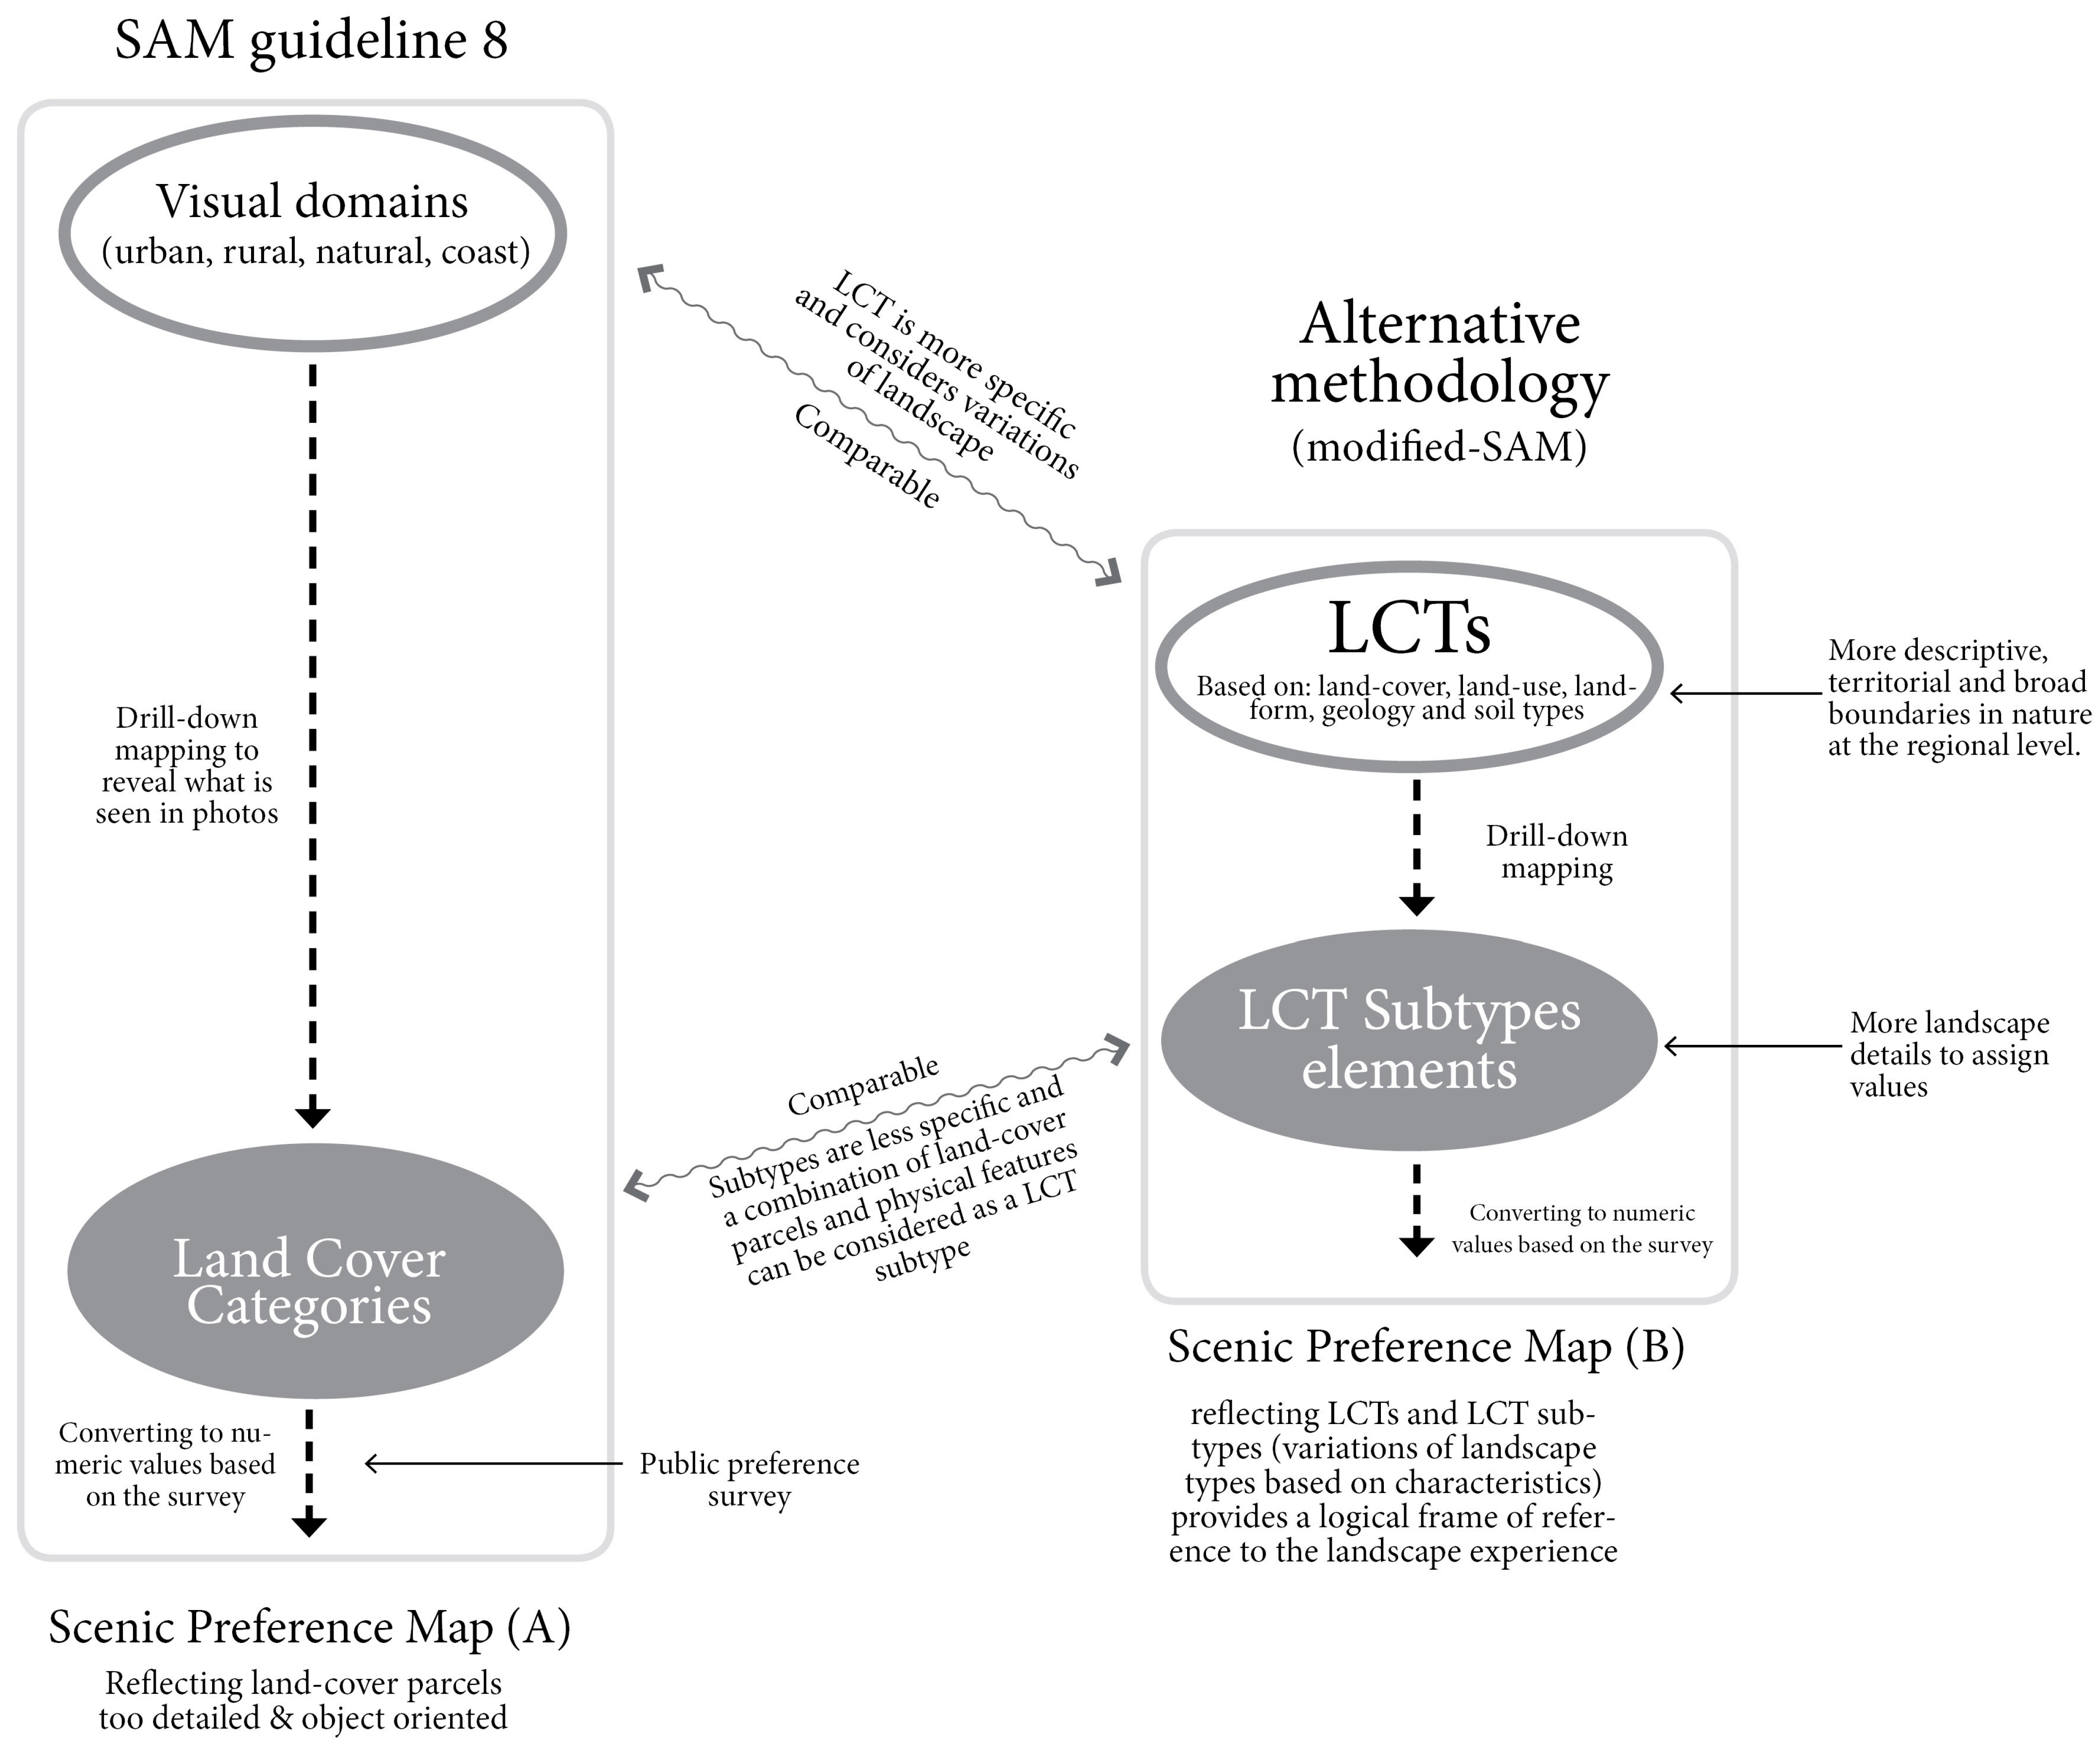
The original Guideline No. 8 of the SAM (2004) (Figure 1) used scenic preferences based on four ‘visual domains’ (urban, rural, bush, and coast), each of which was represented in survey photographs. Furthermore, visual elements in each photo (such as forests, waterbodies, buildings, etc.) were categorised into built and non-built elements and mapped according to aerial photos of land cover. Following face-to-face focus group ratings of photographed scenes undertaken to inform the South East Queensland Regional Plan review, the scenic preference survey mean ratings were correlated with various ratios of visual elements visible in each digital photograph to understand their effect on driving public preferences. Land-cover categories, representing the landscape visual elements, were then rated based on the identified rankings from 1–10 to create scenic preference map A (Figure 1).
One of the limitations of the SAM was that land-cover elements were rarely perceived and rated separately but combined to form impressions of scenery, and these combinations of elements largely influenced character and amenity. In our alternative methodology, the scenic preference component formed a critical part of the landscape evaluation, based on ratings of 65 selected photographs taken during spring and summer (October 2020 to January 2021) from different parts of the region to represent the diversity of the local landscape. These photographs were rated by interested individuals from the Toowoomba and wider SEQ communities in an online survey. Broad LCTs and subtypes were considered more useful than ‘visual domains’ and formed the basis of the Toowoomba scenic amenity assessments (Figure 3). Hence, the photo library comprised five representative photos for each of the 13 identified broad LCTs that covered the entire region.
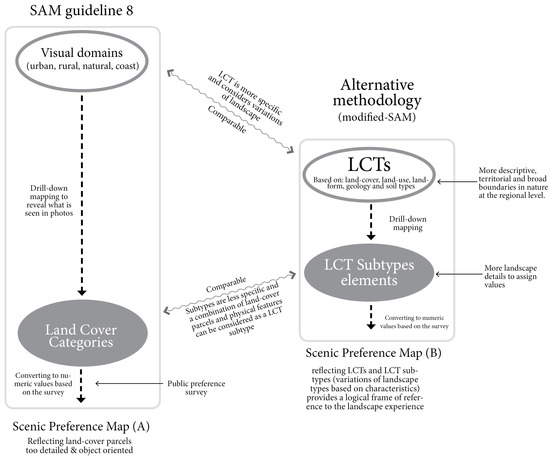
Figure 3.
Alternative methodology in relation to SAM (2004) to integrate LCA in scenic preference map.
Project landscape planners (from LatStudios) conducted photo survey acquisitions and structured the selection of landscape character types (LCTs). It was recognised early in the process that the original selection of photos from the photo library could introduce a certain level of bias, potentially favouring images perceived as the most favourable representation of each LCT. To mitigate subjectivity in this process, a more rigorous strategy was then employed. A substantial number of photos were captured from each LCT, and a comprehensive review and selection process unfolded through multiple rounds. This added approach aimed to ensure that the final set of photos chosen for the public photo survey was as well-rounded and representative as possible, reducing the impact of potential biases and subjectivity in the selection process. In addition, photos representing elements typically understood by landscape practitioners to reduce the scenic quality of a view were incorporated, and images were included to test the outcomes of the previous study prepared for the Toowoomba Region.
3.3. Identifying Landscape Character Types (LCTs) and Subtypes
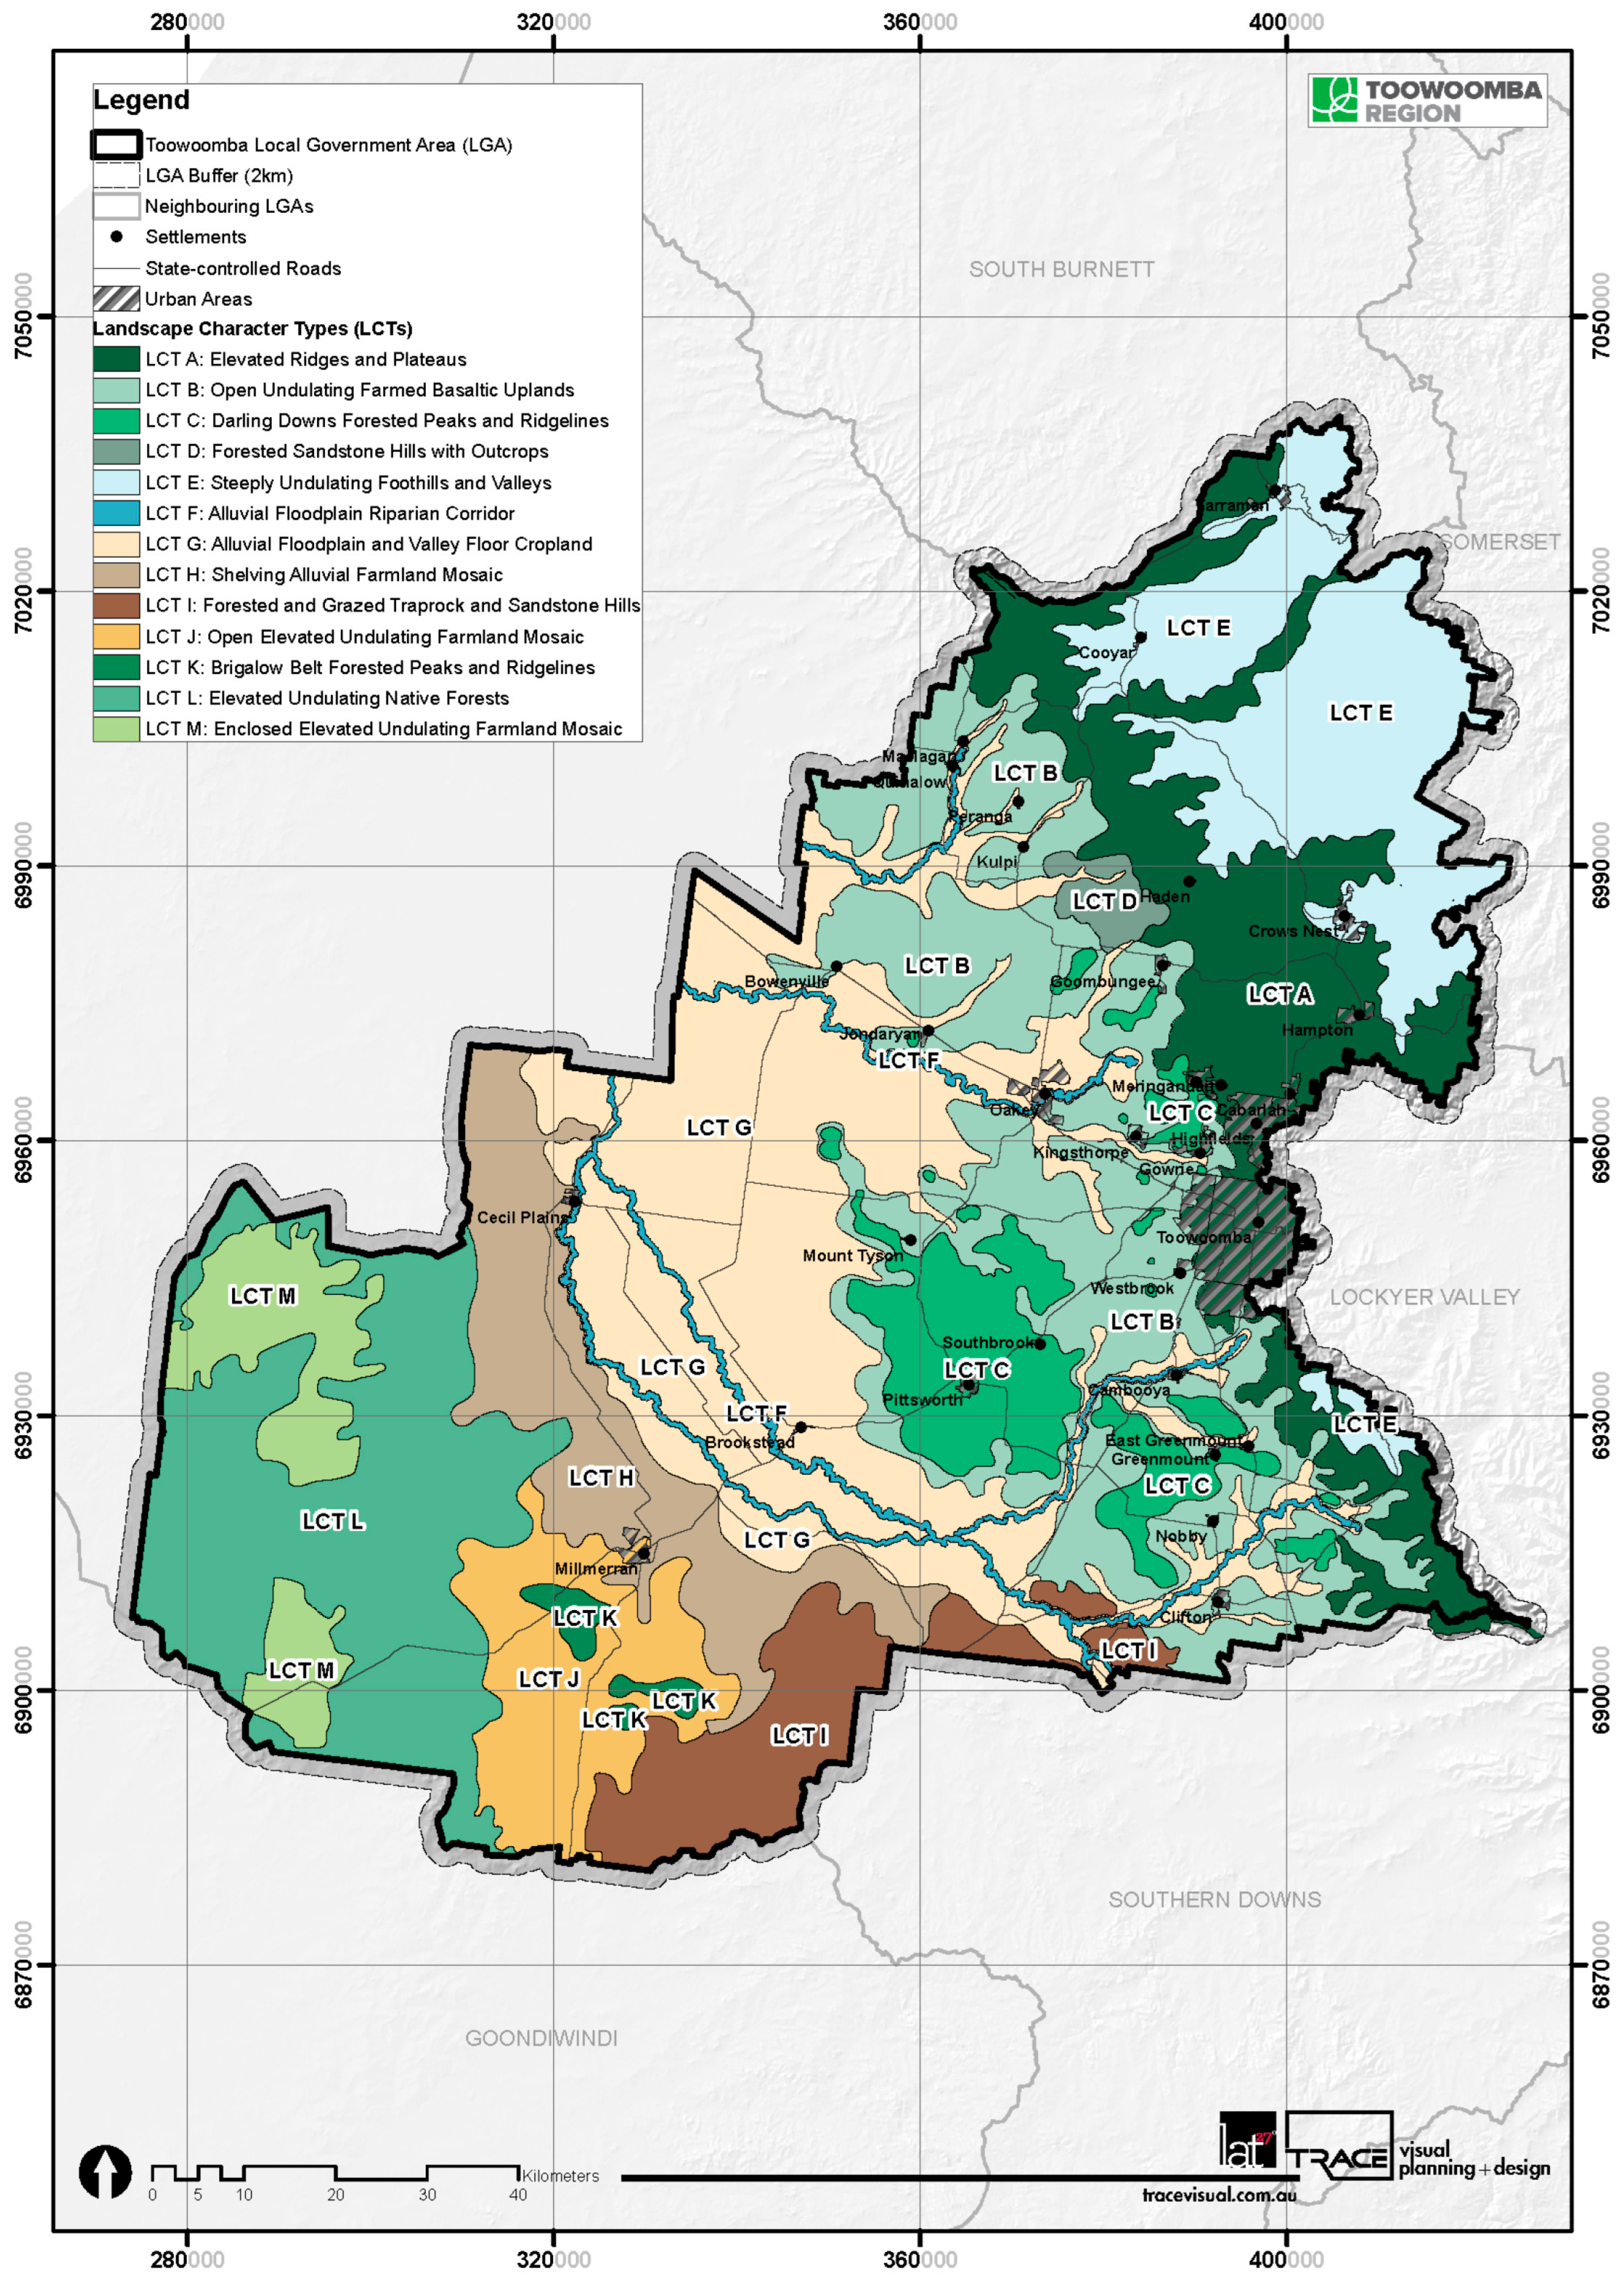
Within the LCA framework, identified LCTs are distinct types of landscapes that are relatively homogeneous; for example, in the Toowoomba Region, there are forested and grazed sandstone hills. They are generic in that they can occur in different places, but wherever they occur, they share broadly similar combinations of visible landscape elements and features, such as geology, topography, drainage patterns, vegetation, historical land use, and settlement pattern. A GIS database was developed to identify 13 broad LCTs across the Toowoomba Region that were further verified by multiple site visits from March to May 2021 by the project team (Figure 4). During this fieldwork (totalling 15 days), key characteristics of the landscape were identified and confirmed, photographic records were taken with a Global Positioning System (GPS) record, and digital mapping notes were made to verify key features, boundaries, and transitions within the landscape. Base GIS datasets were sourced from TRC and the Queensland Government’s open data portal (https://www.data.qld.gov.au/ (accessed on 14 September 2020)). Hydrology patterns were produced from the DEM. While certain layers, such as elevation and vegetation, played a significant role in shaping visible characteristics and perception, other layers, such as soil types and land-use categories, were also important in the characterisation process.
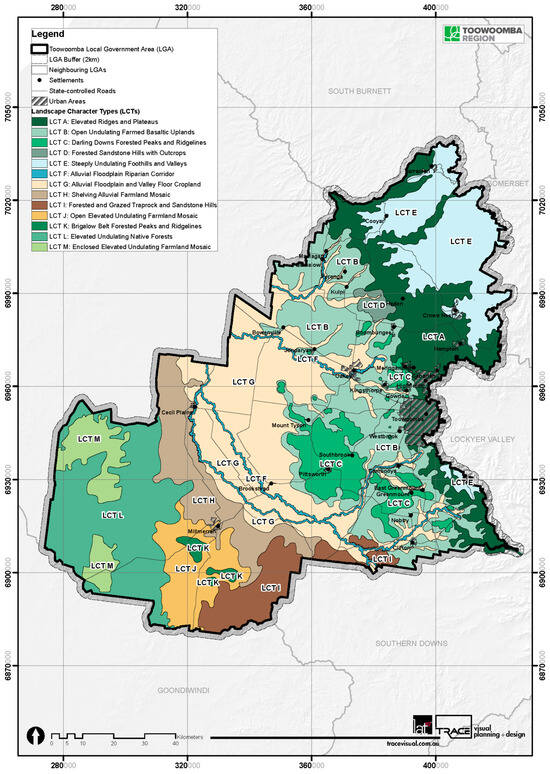
Figure 4.
Landscape character types (LCTs).
LCTs were more specific to variations in the landscape compared to visual domains (as used in the SAM) and considered local variations in the landscape. Selected photos for the photo survey were taken in the identified LCTs and demonstrated considerable landscape diversity within each broad LCT. Accordingly, landscape character subtypes were identified, providing a more logical frame of reference to classify physical features visible in photos [3]. The subtypes, related mainly to land use, were simpler and more generic (such as flat croplands, major dams and waterholes, highways, and major roads), but nevertheless generally included a combination of land parcels and detailed elements. In total, our study identified and mapped 10 categories of subtypes and built elements across the region.
Many LCT and subtype boundaries are, by their nature, imprecise. The extent to which a broad-scale landscape is divided and categorised, and the precision of LCT boundaries, depends on the purpose, scale, and level of assessment [24]. In human-dominated landscapes (especially urban, residential, and extractive), the boundaries are distinct. In natural and rural domains, transitions between landscape types are not generally abrupt, and the quality and boundaries can be drawn differently according to expert judgments. This reduces the certainty of designations and their accuracy when integrated into a quantitative scenic evaluation method. In this study, mapping inaccuracies were reduced by using the agreement between several expert landscape planners, who tested and trialled the identified boundaries as part of the study process, drawing extensively upon the spatial notes and photographs collected in the field.
The initial identification phase involved a comprehensive desktop study employing GIS mapping, which then informed subsequent on-site visits. Through a series of multiple site visits and an iterative process of cross-referencing between GIS mapping and direct field assessments, the accuracy of the boundaries was confirmed and fine-tuned. This dynamic interplay between GIS mappings and hands-on site inspections served to enhance the precision and reliability of the mapped boundaries.
3.4. Mapping Community Scenic Preferences
In the Toowoomba study, the scenic preference survey aimed to discern which landscape types were visually favoured by the local community. This information was crucial for determining the weightings assigned to various landscape types in the creation of a scenic preference map for the Toowoomba Region. The survey required participants to rate 65 images on a scale of 1 to 10 based on their individual scenic preferences, from the lowest to the highest, respectively. The utilisation of a scale ranging from 1 to 10 is a purposeful construct that facilitates the seamless distribution of preferences within the GIS mapping process. This scale has been specifically chosen for its user-friendly nature, providing a clear and easily comprehensible range for expressing preferences. Although alternative scales, such as 1–7 or 1–20, are technically feasible, their implementation introduces a higher level of detail to the scenic amenity look-up table. This added complexity could potentially affect participant understanding or willingness to participate in the process, highlighting the advantage of the 1-to-10 scale for its simplicity and ease of application.
The survey images were captured throughout the region by the team’s landscape planners during fieldwork aimed at identifying landscape character. They were carefully chosen to offer a portrayal of the diverse landscapes within the Toowoomba Region that was as comprehensive as possible. Additionally, the selection of images aimed to provide an equal representation of the 13 land-cover types (LCTs) outlined in the Toowoomba Regional Landscape Study. Some images were specifically included to assess how certain land uses (such as quarries, solar farms, roads, and industrial-built elements) and naturally occurring events (like bushfires) might influence the perception of scenic values. The ratio of the visible sky was also calculated in 2D photos to understand the effect of openness on preferences while acknowledging that this interpretation of openness diverges from the actual experience of landscape openness in the 3D environment. It is more akin to the level of enclosure or openness that can be perceived in each photo, determined by the limitations of the angle of the field of view.
The online scenic preference survey was hosted on the Council’s Your Say site (EHQ platform) to navigate the uncertainty and feasibility of face-to-face consultations during the COVID-19 pandemic. The survey was accessible from Friday, 19 February to Sunday, 14 March 2021. To familiarise participants with the range of images in the survey, it was structured to allow the viewing of all 65 images collectively in a grid gallery before proceeding to answer specific questions about individual images. The survey, crafted by community engagement professionals in collaboration with TRC, was promoted through various channels, including social media, emails to stakeholder lists, posters in Council service locations, and advertisements in Council’s Bold Magazine.
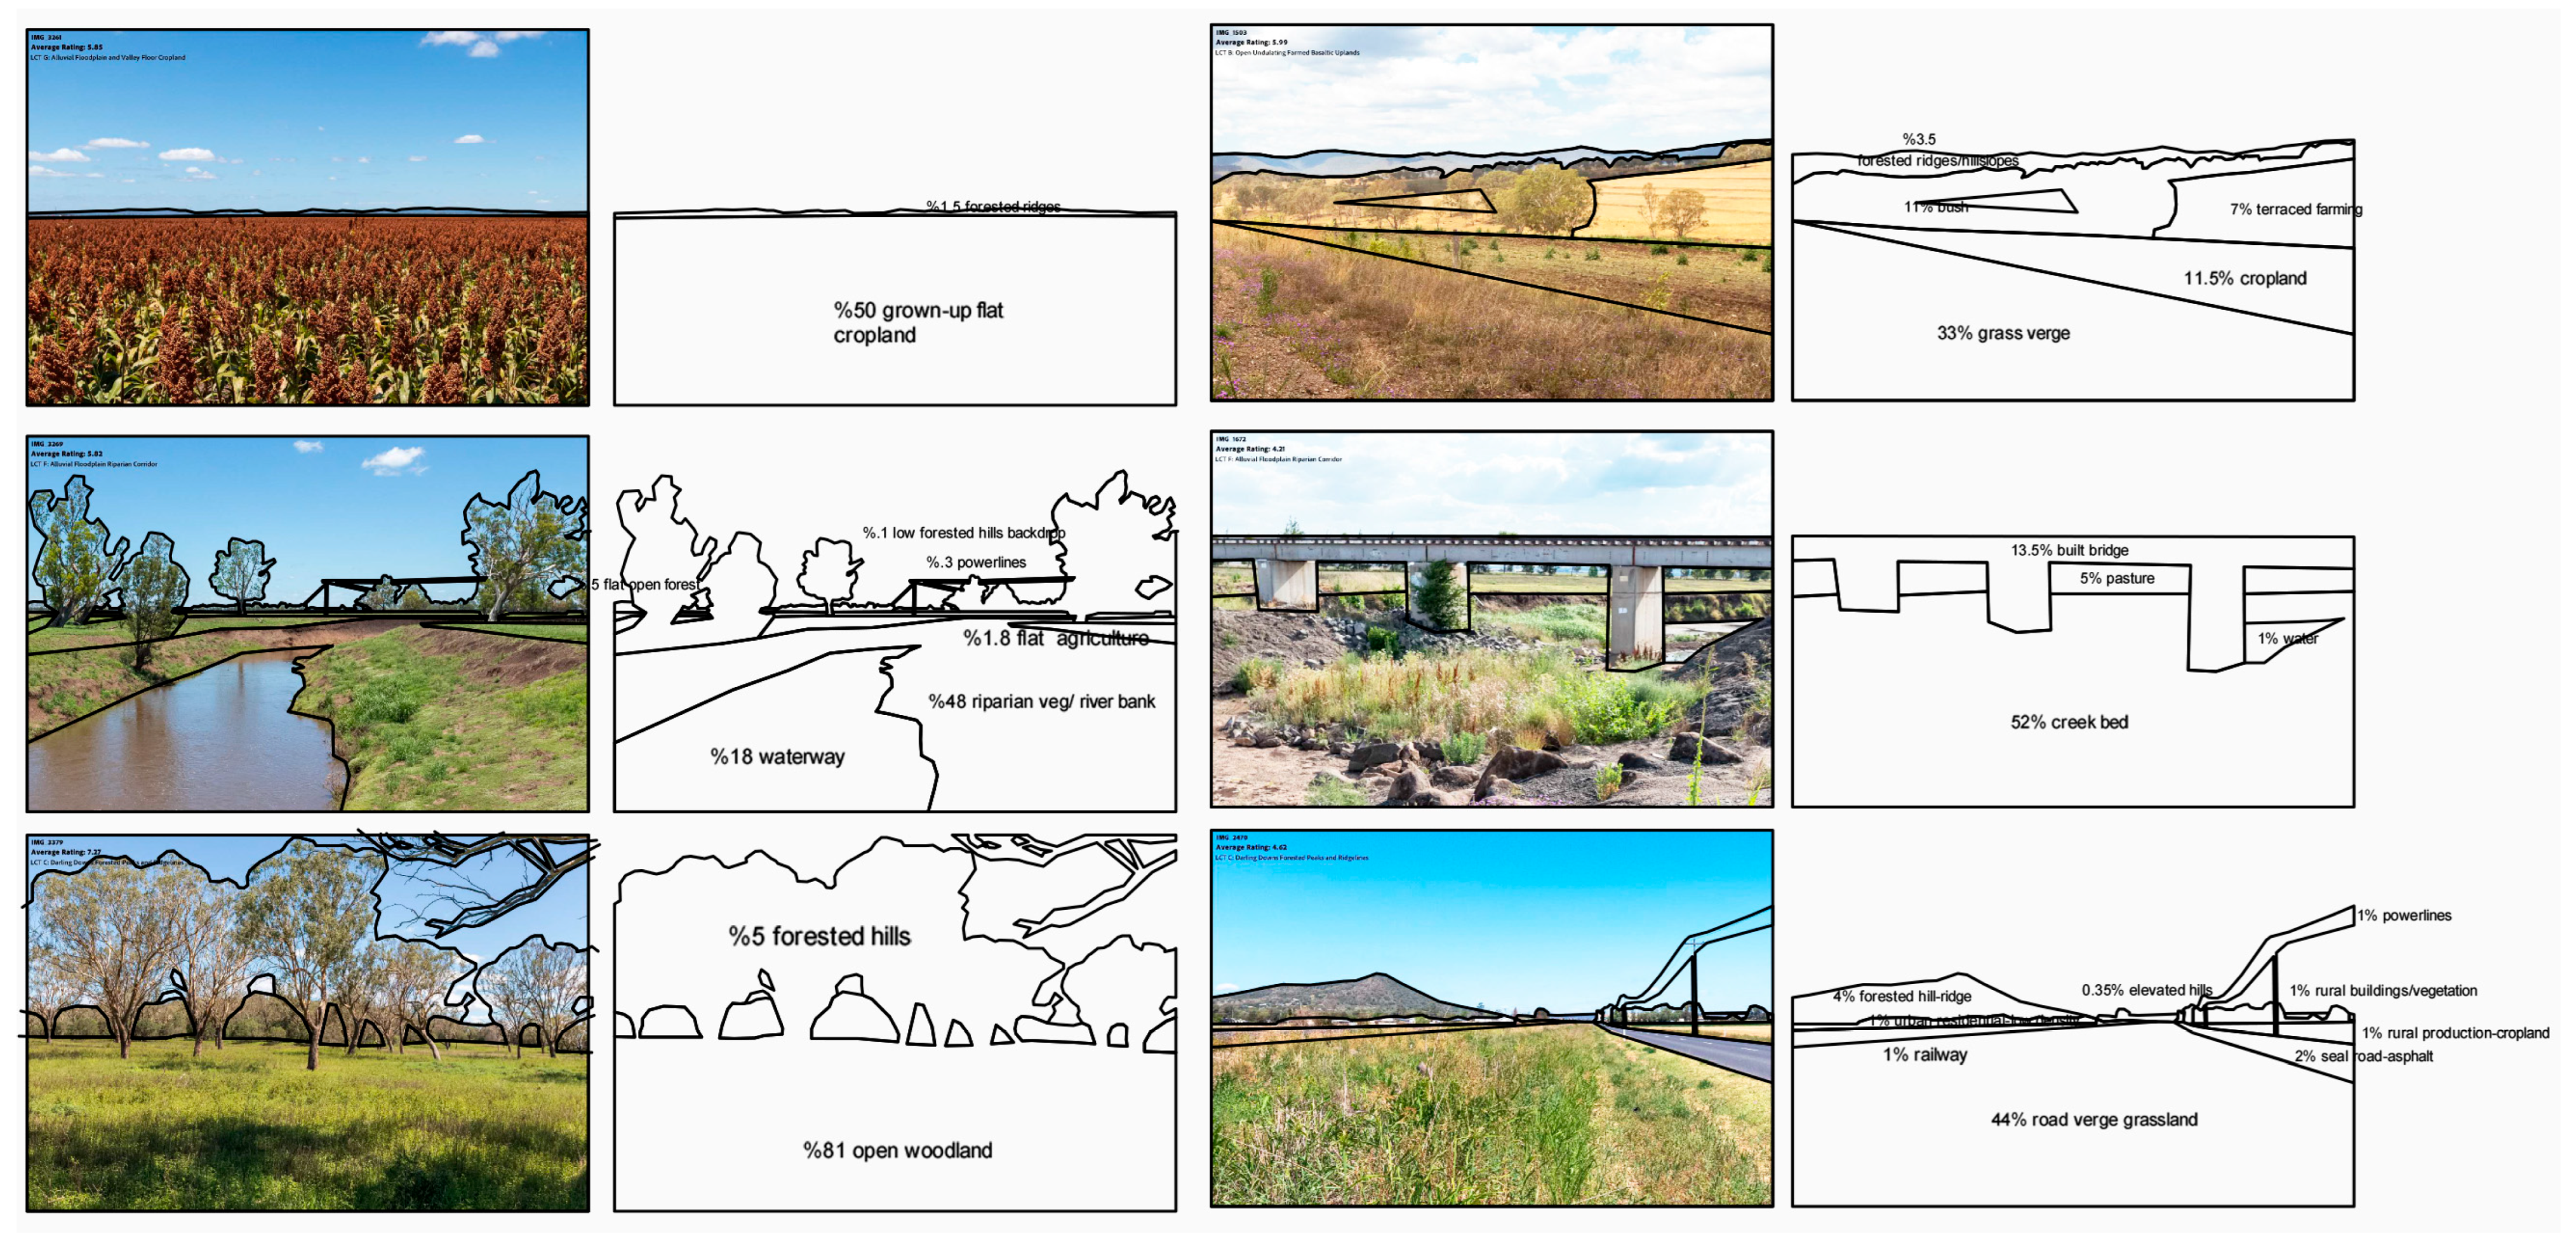
A mean rating of the value of each landscape to the participants was calculated for each survey photo. This became the mean scenic preference rating (SPR) for each photo. The proportion of subtypes with visible sky was calculated using AutoCAD by digitising the areas on the scenic preference survey photos (Figure 5). The images incorporated into the scenic preference survey underwent additional analysis to ascertain the percentage of visual elements present in each image. This analysis aimed to comprehend relationships and pinpoint correlations between the presence or absence of specific subtypes and their impact, whether positive or negative, on the perception of scenic value. The individual SPRs were then utilised to calculate the SPR for LCTs based on Pearson’s correlation coefficient between subtypes and preferences, determined by comparing calculated proportions and calculated mean preference ratings of the images. These values were then applied to the LCT map (Figure 6).

Figure 5.
Survey photo analysis in AutoCAD to classify and calculate ratio of visible LCT subtypes and built elements in each photograph used for correlation analysis with mean SPR.
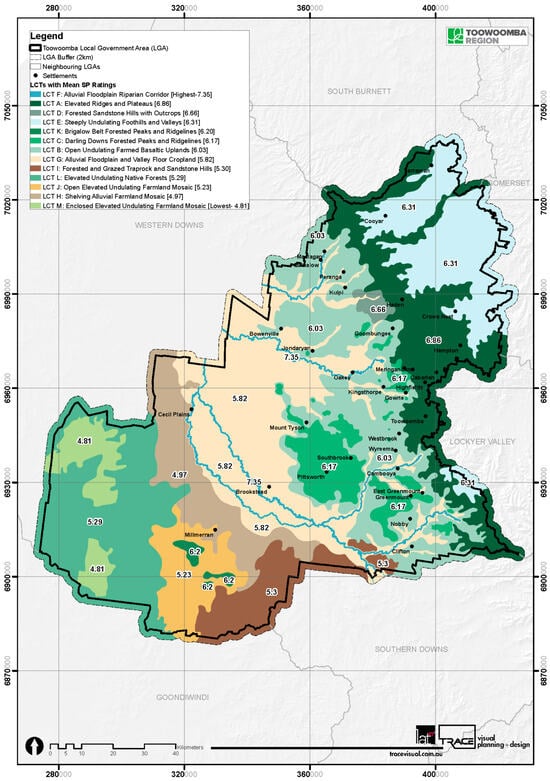
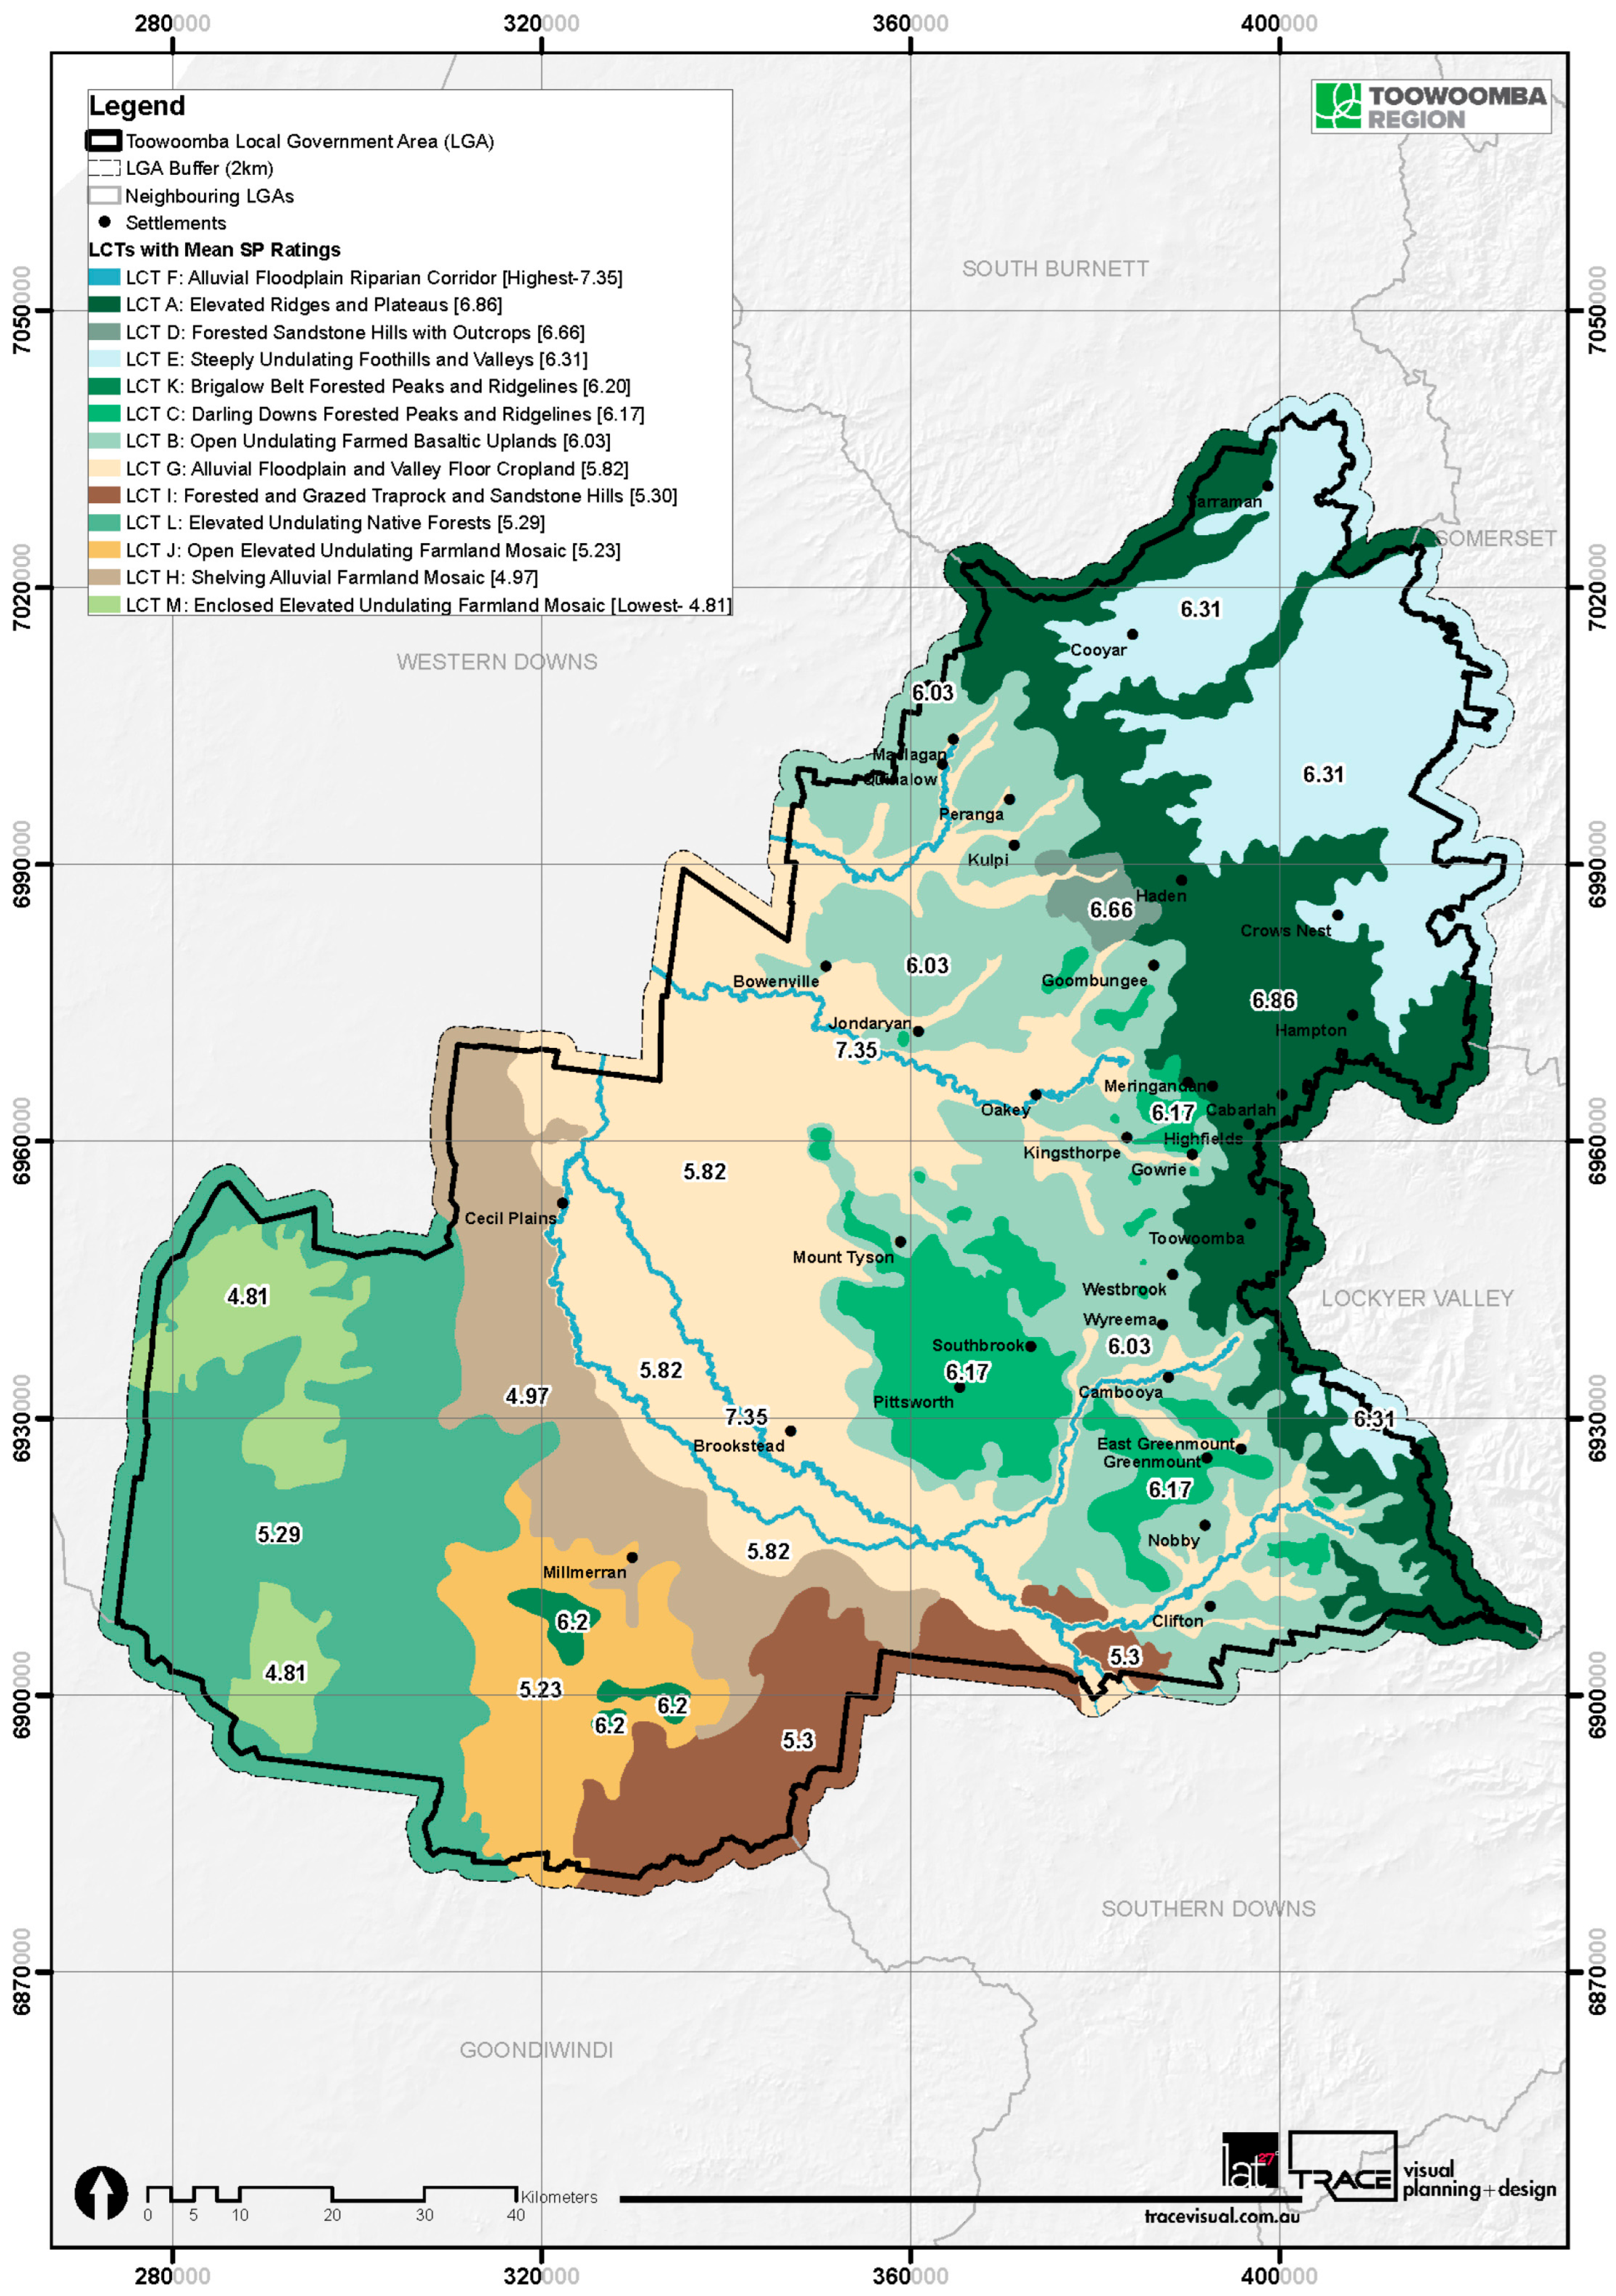
Figure 6.
Landscape character types (LCTs) with mean scenic preference ratings (SPRs).
Estimating the SPR for LCTs based on the average rating of photos in each LCT and using it to produce a scenic preference map was a new approach compared to the SAM (which only used land cover and did not consider visual domains or LCTs in the SPR mapping process). This introduced greater variations in scenic preference across the Toowoomba Region to the visual categories, which were then mapped. In any region, it is the combinations and distinctive mosaic of LCTs and land uses that influence SPR, so LCTs and subtypes formed a strong foundation for this analysis.
Based on the correlation analysis between the mean scenic preference rating (SPR) for each photo and the ratio of the LCT subtypes visible in each photo, the importance of the LCT subtypes in driving the scenic preference was identified and scored based on a value between 1 and 10 (Figure 7). The final scenic preference map was produced in accordance with the following operation:
Scenic preference = LCT map (mean SPR for each LCT) × LCT subtypes (1–10)

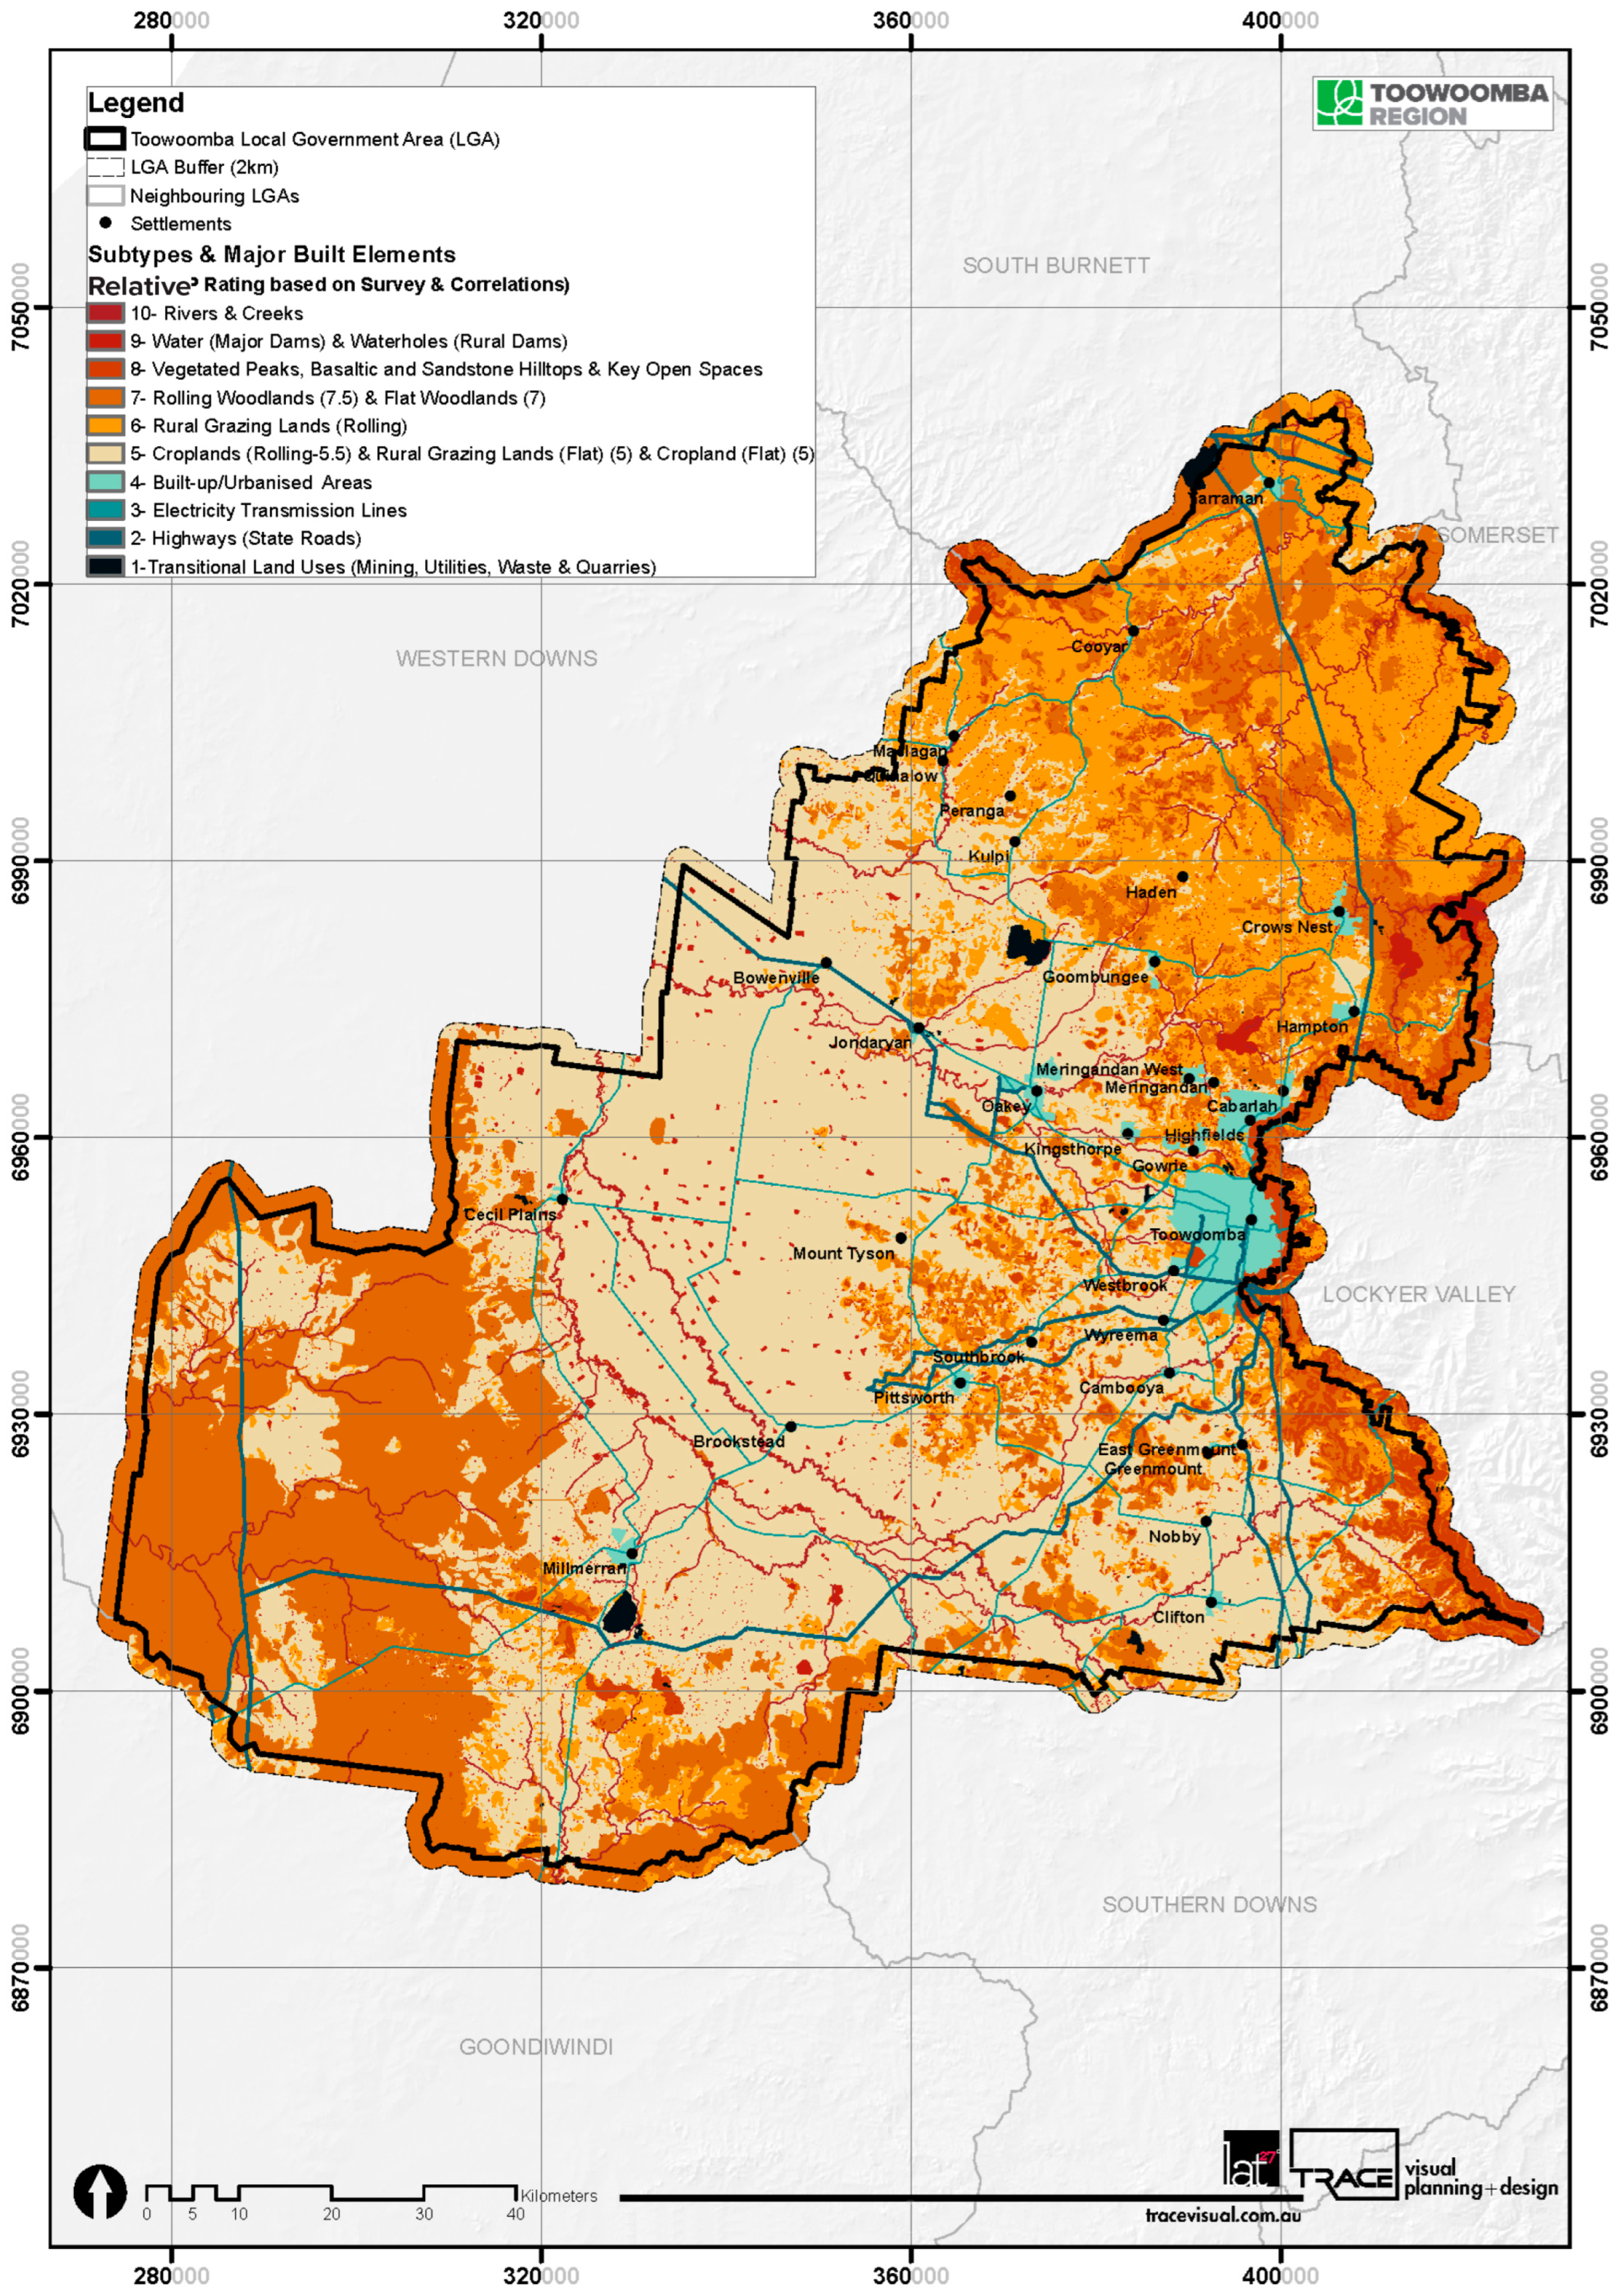
Figure 7.
Landscape subtypes with relative SPR.
Based on this formula, LCT mean ratings were used as a multiplier to bring variations in preferences into the LCT subtypes. This resulted in calculating the SPR range and reclassifying the scenic preferences into 1–10 mapping units in ArcGIS to use as a basis to combine with the visual exposure map as the next part of the process. Thus, broad LCTs with mean ratings were multiplied by their assigned SPR for the identified subtypes using GIS raster operations in ArcGIS 10.6. The SPR (1–10) assigned to the subtypes was based on the identified correlation strength for each category of LCT subtype and built elements.
3.5. Mapping Visual Exposure
GIS was employed to craft visual exposure (VE) maps, establishing the relative visibility of the landscape from all potential public viewing locations and along feasible view corridors. This encompassed scenic routes within the region. State-controlled and major transport routes, tourist drives, scenic lookouts (refer to Figure 8), and walking tracks in the Toowoomba Region were determined through a combination of desktop assessments and fieldwork surveys. Around 12,600 viewpoint locations were generated by placing points at 500 m intervals along major roads and walking trails within the region, representing potential viewing spots. These, in combination with scenic lookout locations identified through field surveys, formed the basis for creating a visual exposure (VE) map. The popularity of public viewing locations was assessed by considering factors such as the typical time spent at a location, the number of visitors, and their overall level of interest in or appreciation of the view (Table 1). Preliminary VE maps were developed following Implementation Guideline No. 8, utilising traffic census data for the Queensland state-declared road network in 2019 and assuming up to 500 daily visits to scenic lookouts.
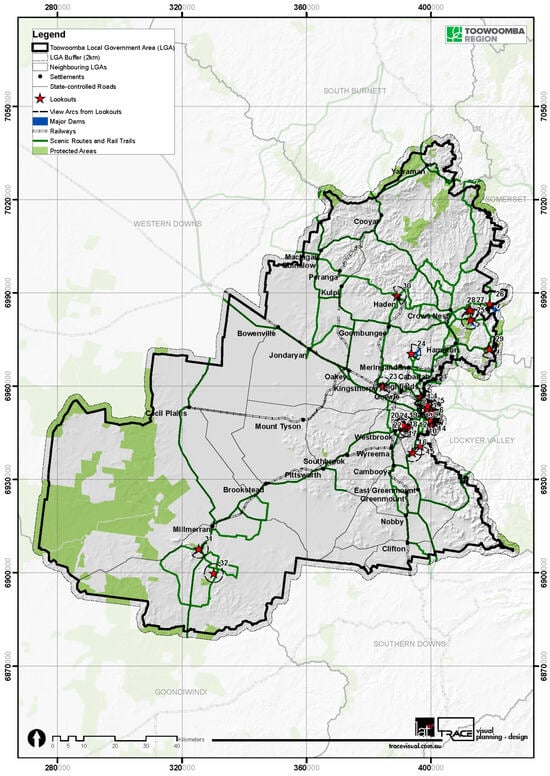
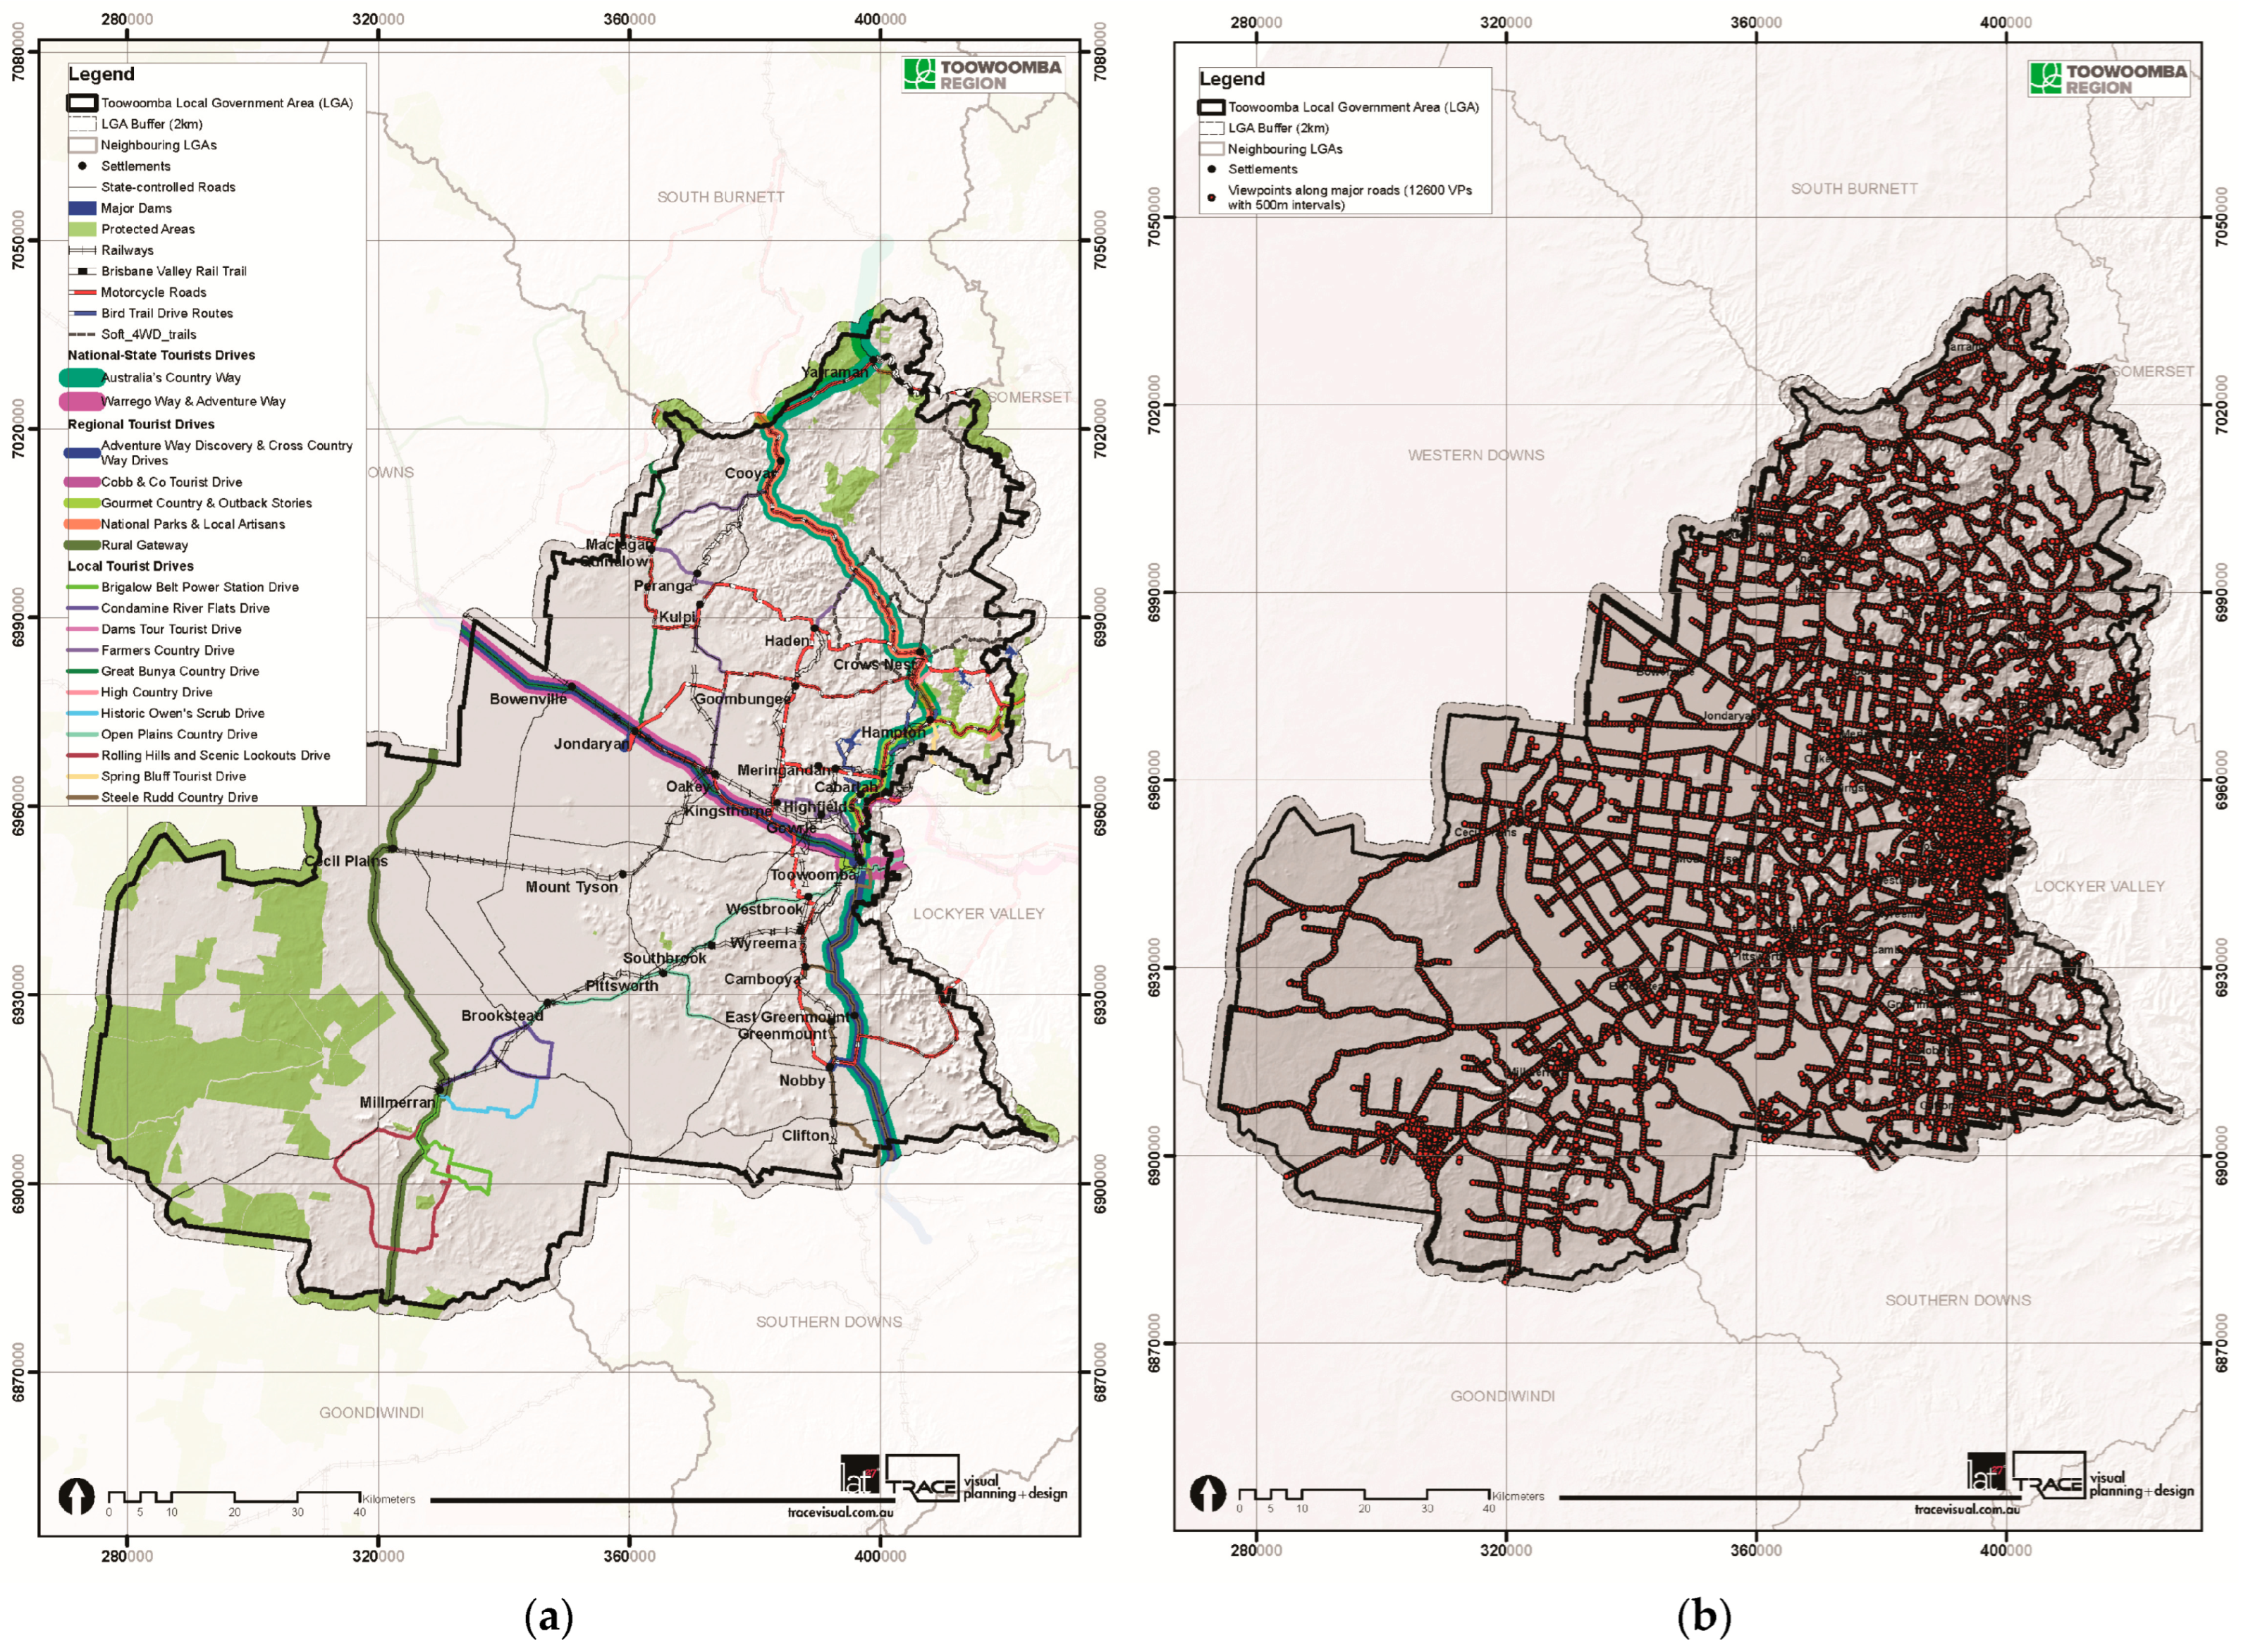
Figure 8.
Identified scenic lookouts and scenic routes within the Toowoomba Region.

Table 1.
Viewpoint viewing time calculation.
Multiple visual exposure maps were tested for sensitivity to traffic volumes (observer numbers) by including and excluding Annual Average Daily Traffic (AADT) data and for sensitivity to screening by including and excluding land-cover attenuation to understand the effect of these factors. AADT from 2017 and 2018 from Queensland’s open geospatial data was interpolated for the whole region to produce counts for all public roads based on different road hierarchies. Viewing location importance was calculated for different viewpoints along road classifications based on the driving speed and an average viewing time for each location. For static viewing locations, the viewing time was considerably higher. Viewing location importance was calculated as below [14]. The standard viewing duration (B × C) for each viewing location was estimated in Table 2.
Table 2.
Standard viewing duration for viewing locations [25].
Using Model Builder in ArcGIS 10.6, a cumulative visibility analysis was conducted to simulate individual viewsheds from all public locations, including roads, lookouts, and walking trails (refer to Figure 9a). Viewpoints were evenly positioned within a 500 m radius along roads to model the viewshed. Approximately 12,600 viewsheds were generated based on a 25 m cell-size Digital Elevation Model (DEM) and merged to create a visual exposure (VE) map (refer to Figure 9b). The combined VE map classified all viewsheds into 10 classes (1–10) in line with the regional Scenic Amenity Methodology (SAM). This classification reflected the relative visibility of the landscape observed from public locations.

Figure 9.
(a) scenic roads and designated lookouts; (b) 12,600 viewpoints with 500 m intervals along public roads and lookouts across the whole region.
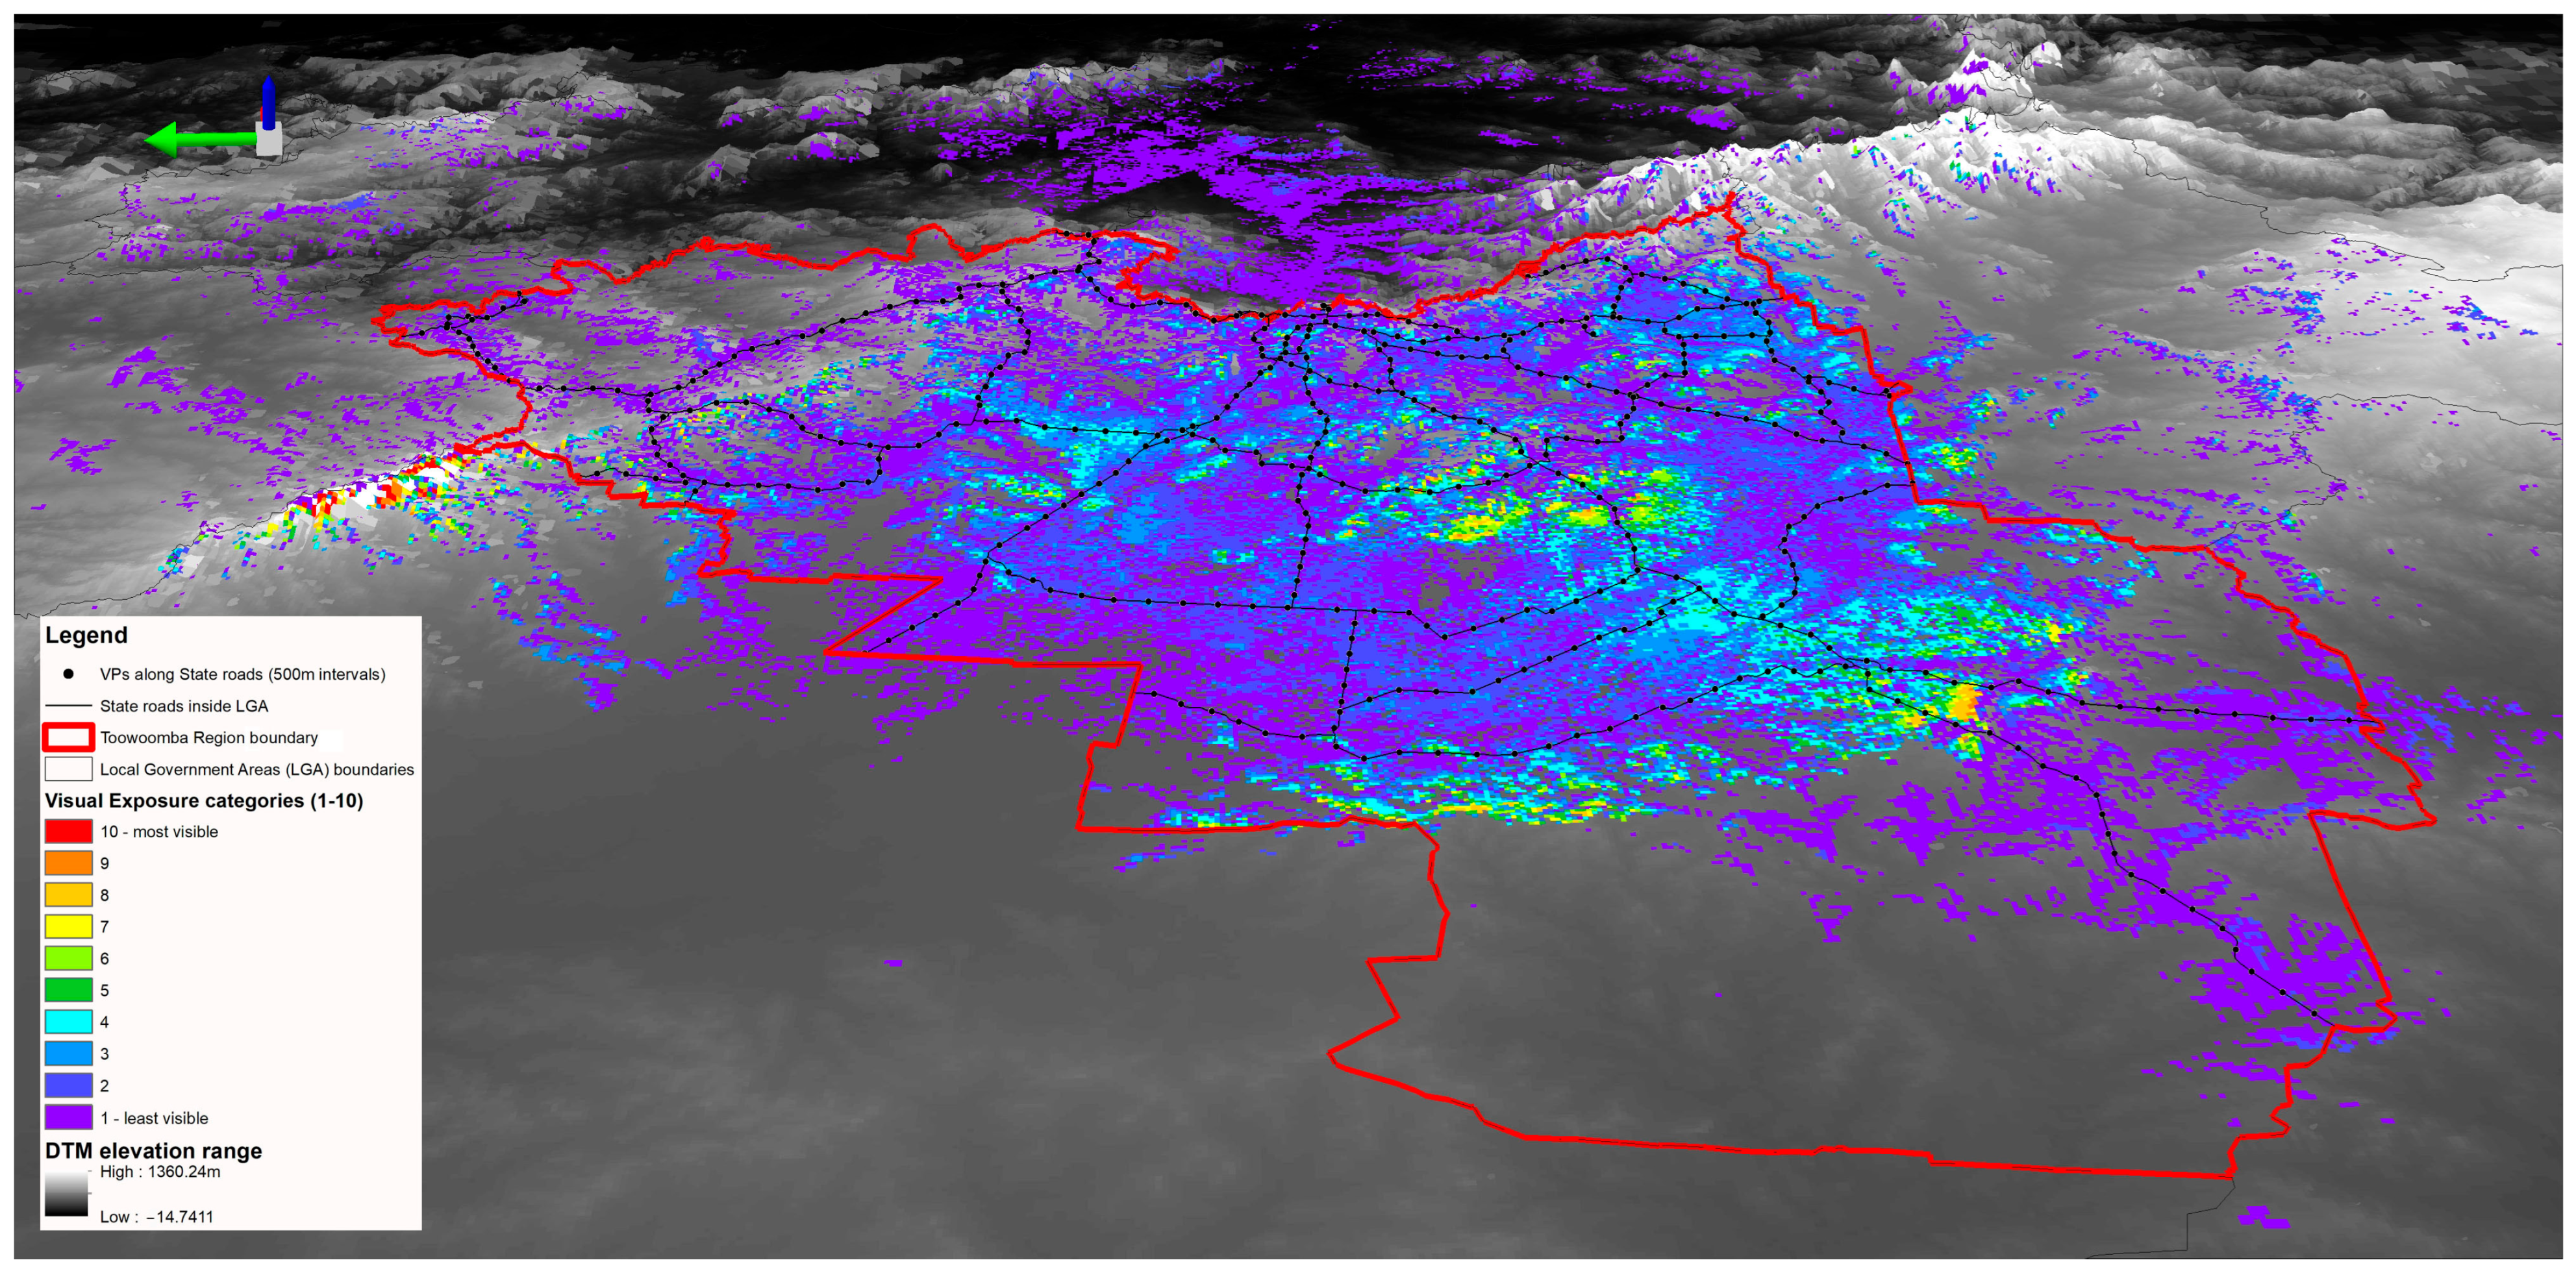
Consideration was required to evenly distribute viewpoints across the region along public roads to achieve an evenly distributed outcome. Viewing importance was calculated and applied to the cumulative viewshed. These categories were determined by dividing the landscape into ten segments, with each segment representing 10% of the total area, as outlined in Table 3. Hence, the VE map represented relative visibility groupings rather than the precise attributes of the region. An additional 2 km buffer around the local government area (LGA) boundary included landscapes near the border and showed views beyond administrative boundaries. A preliminary viewshed analysis on a large DEM cell size (200 m by 200 m) confirmed the engagement of views up to 20 km beyond the LGA boundary (Figure 10). However, for the production of the VE map in high resolution (25 m by 25 m), it was not possible to include a 20 km offset from the LGA boundary.
Table 3.
Determination of visual exposure ratings.

Figure 10.
Preliminary and coarse visual exposure modelling showing the engagement of views beyond the LGA boundary (up to 20 km distance) presented in 3D perspective.
3.6. Mapping Scenic Amenity
After creating distinct scenic preference (SP) and visual exposure (VE) maps, as previously outlined, a scenic amenity (SA) map was generated to assess and categorise the scenic amenity value of landscapes throughout the Toowoomba Region. This process involved an ArcGIS 10.6 analysis, which integrated visual exposure (from least visible to most visible) and scenic preference (from least preferred to most preferred). The resulting value, ranging from 1 to 10, was determined through a scenic amenity look-up matrix using spatial queries in ArcGIS 10.6.
4. Results
4.1. Community Scenic Preferences
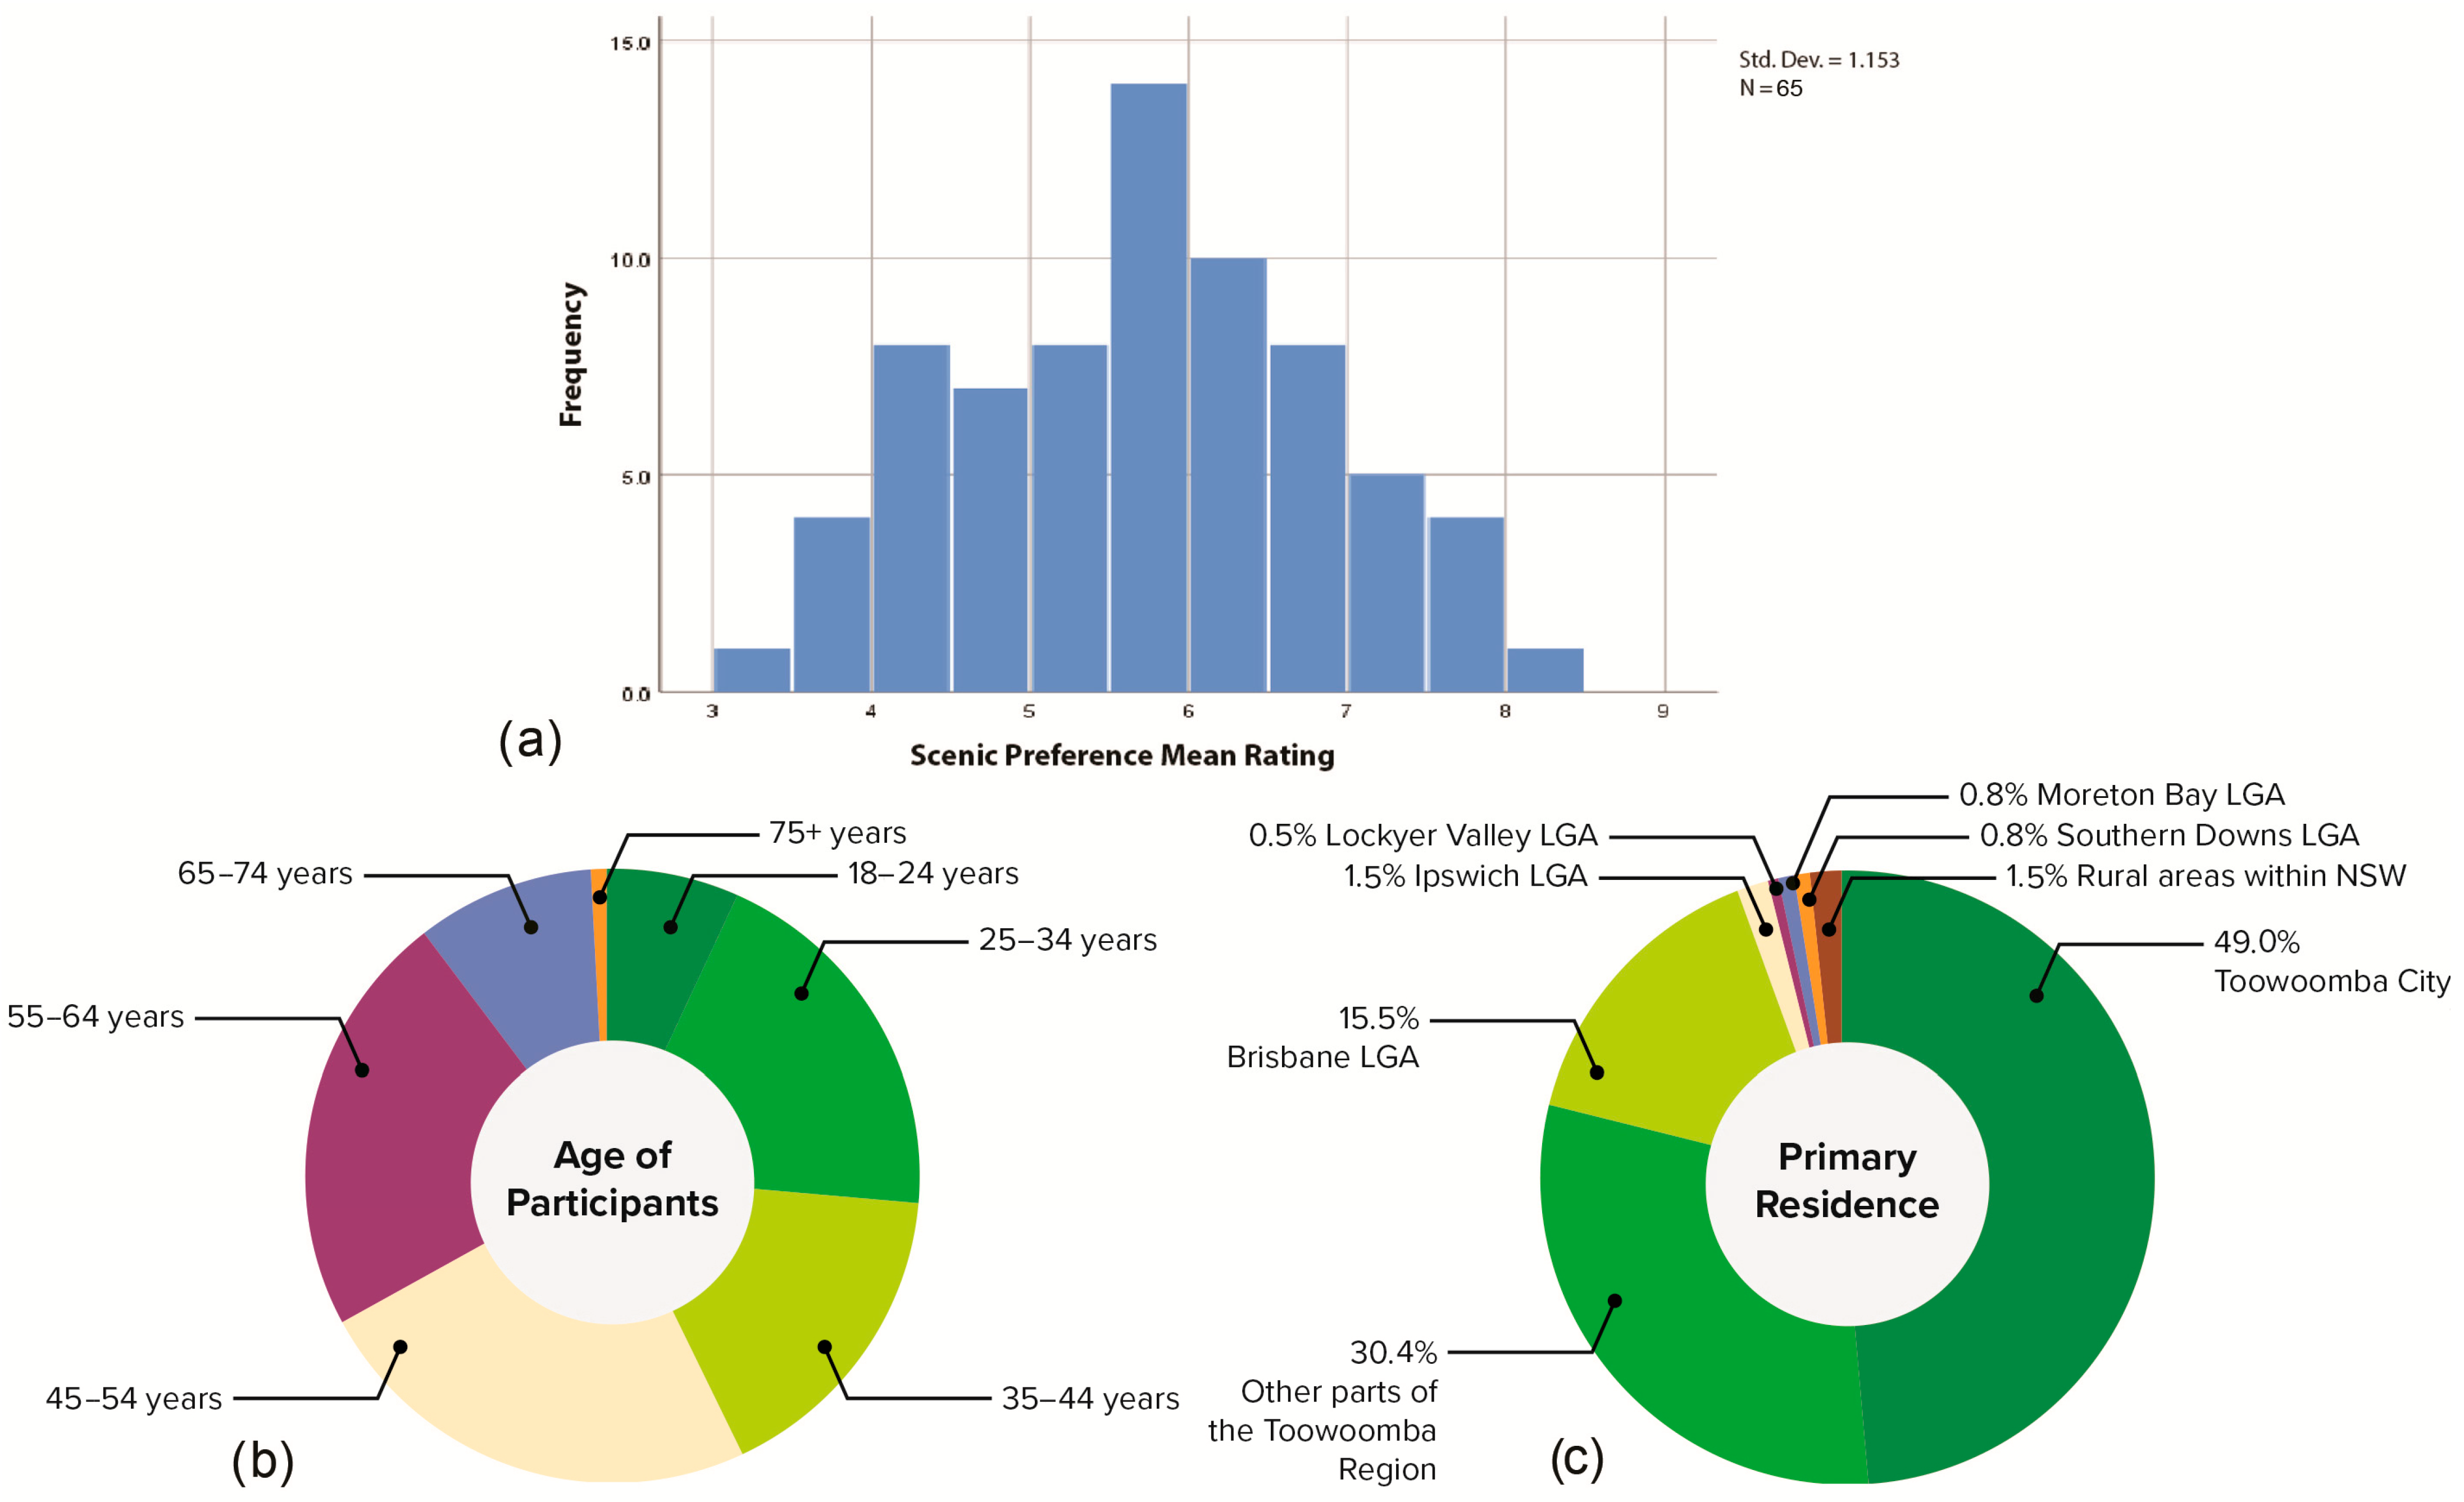
A diverse set of 128 survey responses were collected, spanning various age groups (refer to Figure 11b), and nearly 80% of respondents resided in the Toowoomba Region (refer to Figure 11c). Some participants opted not to rate all 70 included images, as the survey allowed for image skipping while still permitting submission. This aspect was considered during the analysis of the survey results. The presence of over 20% of respondents from outside the Toowoomba Region indicated the broader Queensland community’s appreciation for the landscapes of the Toowoomba Region (refer to Figure 11b,c).

Figure 11.
(a) Distribution of mean scenic preference ratings; (b) age group of survey respondents; (c) primary residence of survey respondents (%).
As depicted in Figure 11a, the mean scenic preference ratings (SPRs) exhibited a normal distribution of responses. The survey results did not identify any images with a mean rating resulting in a very high scenic preference of 9–10, although certain individual respondents did assign very high scenic amenity values to specific images. Virtually all respondents emphasised the importance of safeguarding areas with high landscape value and investing in Toowoomba’s image as a ‘garden city’. They considered these to be the most preferred approaches for managing the protection of landscape and scenic amenity values through the planning scheme.
4.2. Scenic Preferences Map
The SPR value range was between 4.81 and 7.35 (Table 4) across the Toowoomba Region (Figure 12a). These raster values were then reclassified to a base of 10 in order to produce 10 categories with values from 1 to 10 for the final SP map, as shown in Figure 12b. The strongest correlation (+0.73) between LCTs and scenic preference ratings was associated with the rivers and creeks category, and it was then scored at 10. The weakest correlation (−1 to −0.58) was associated with transitional land uses (mining, utilities and waste, and quarries). It was given a score of 1 (Table 5).
Table 4.
Mean SPR for LCTs.
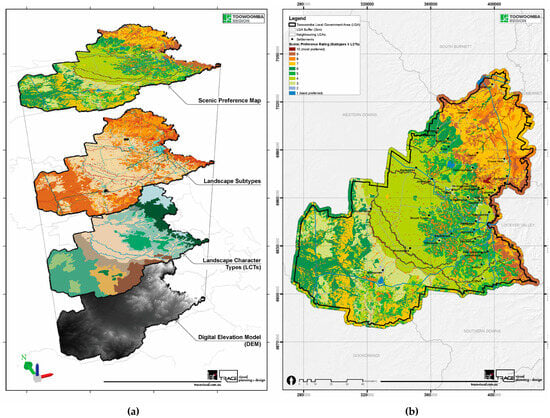
Figure 12.
Scenic preference mapping: (a) SP mapping process by multiplying LCTs and LCT subtypes; (b) final scenic preference map (1–10) reflecting the combined effect of LCTs and subtypes.
Table 5.
Mean SPR for LCT subtypes and major built elements.
4.3. Visual Exposure Map
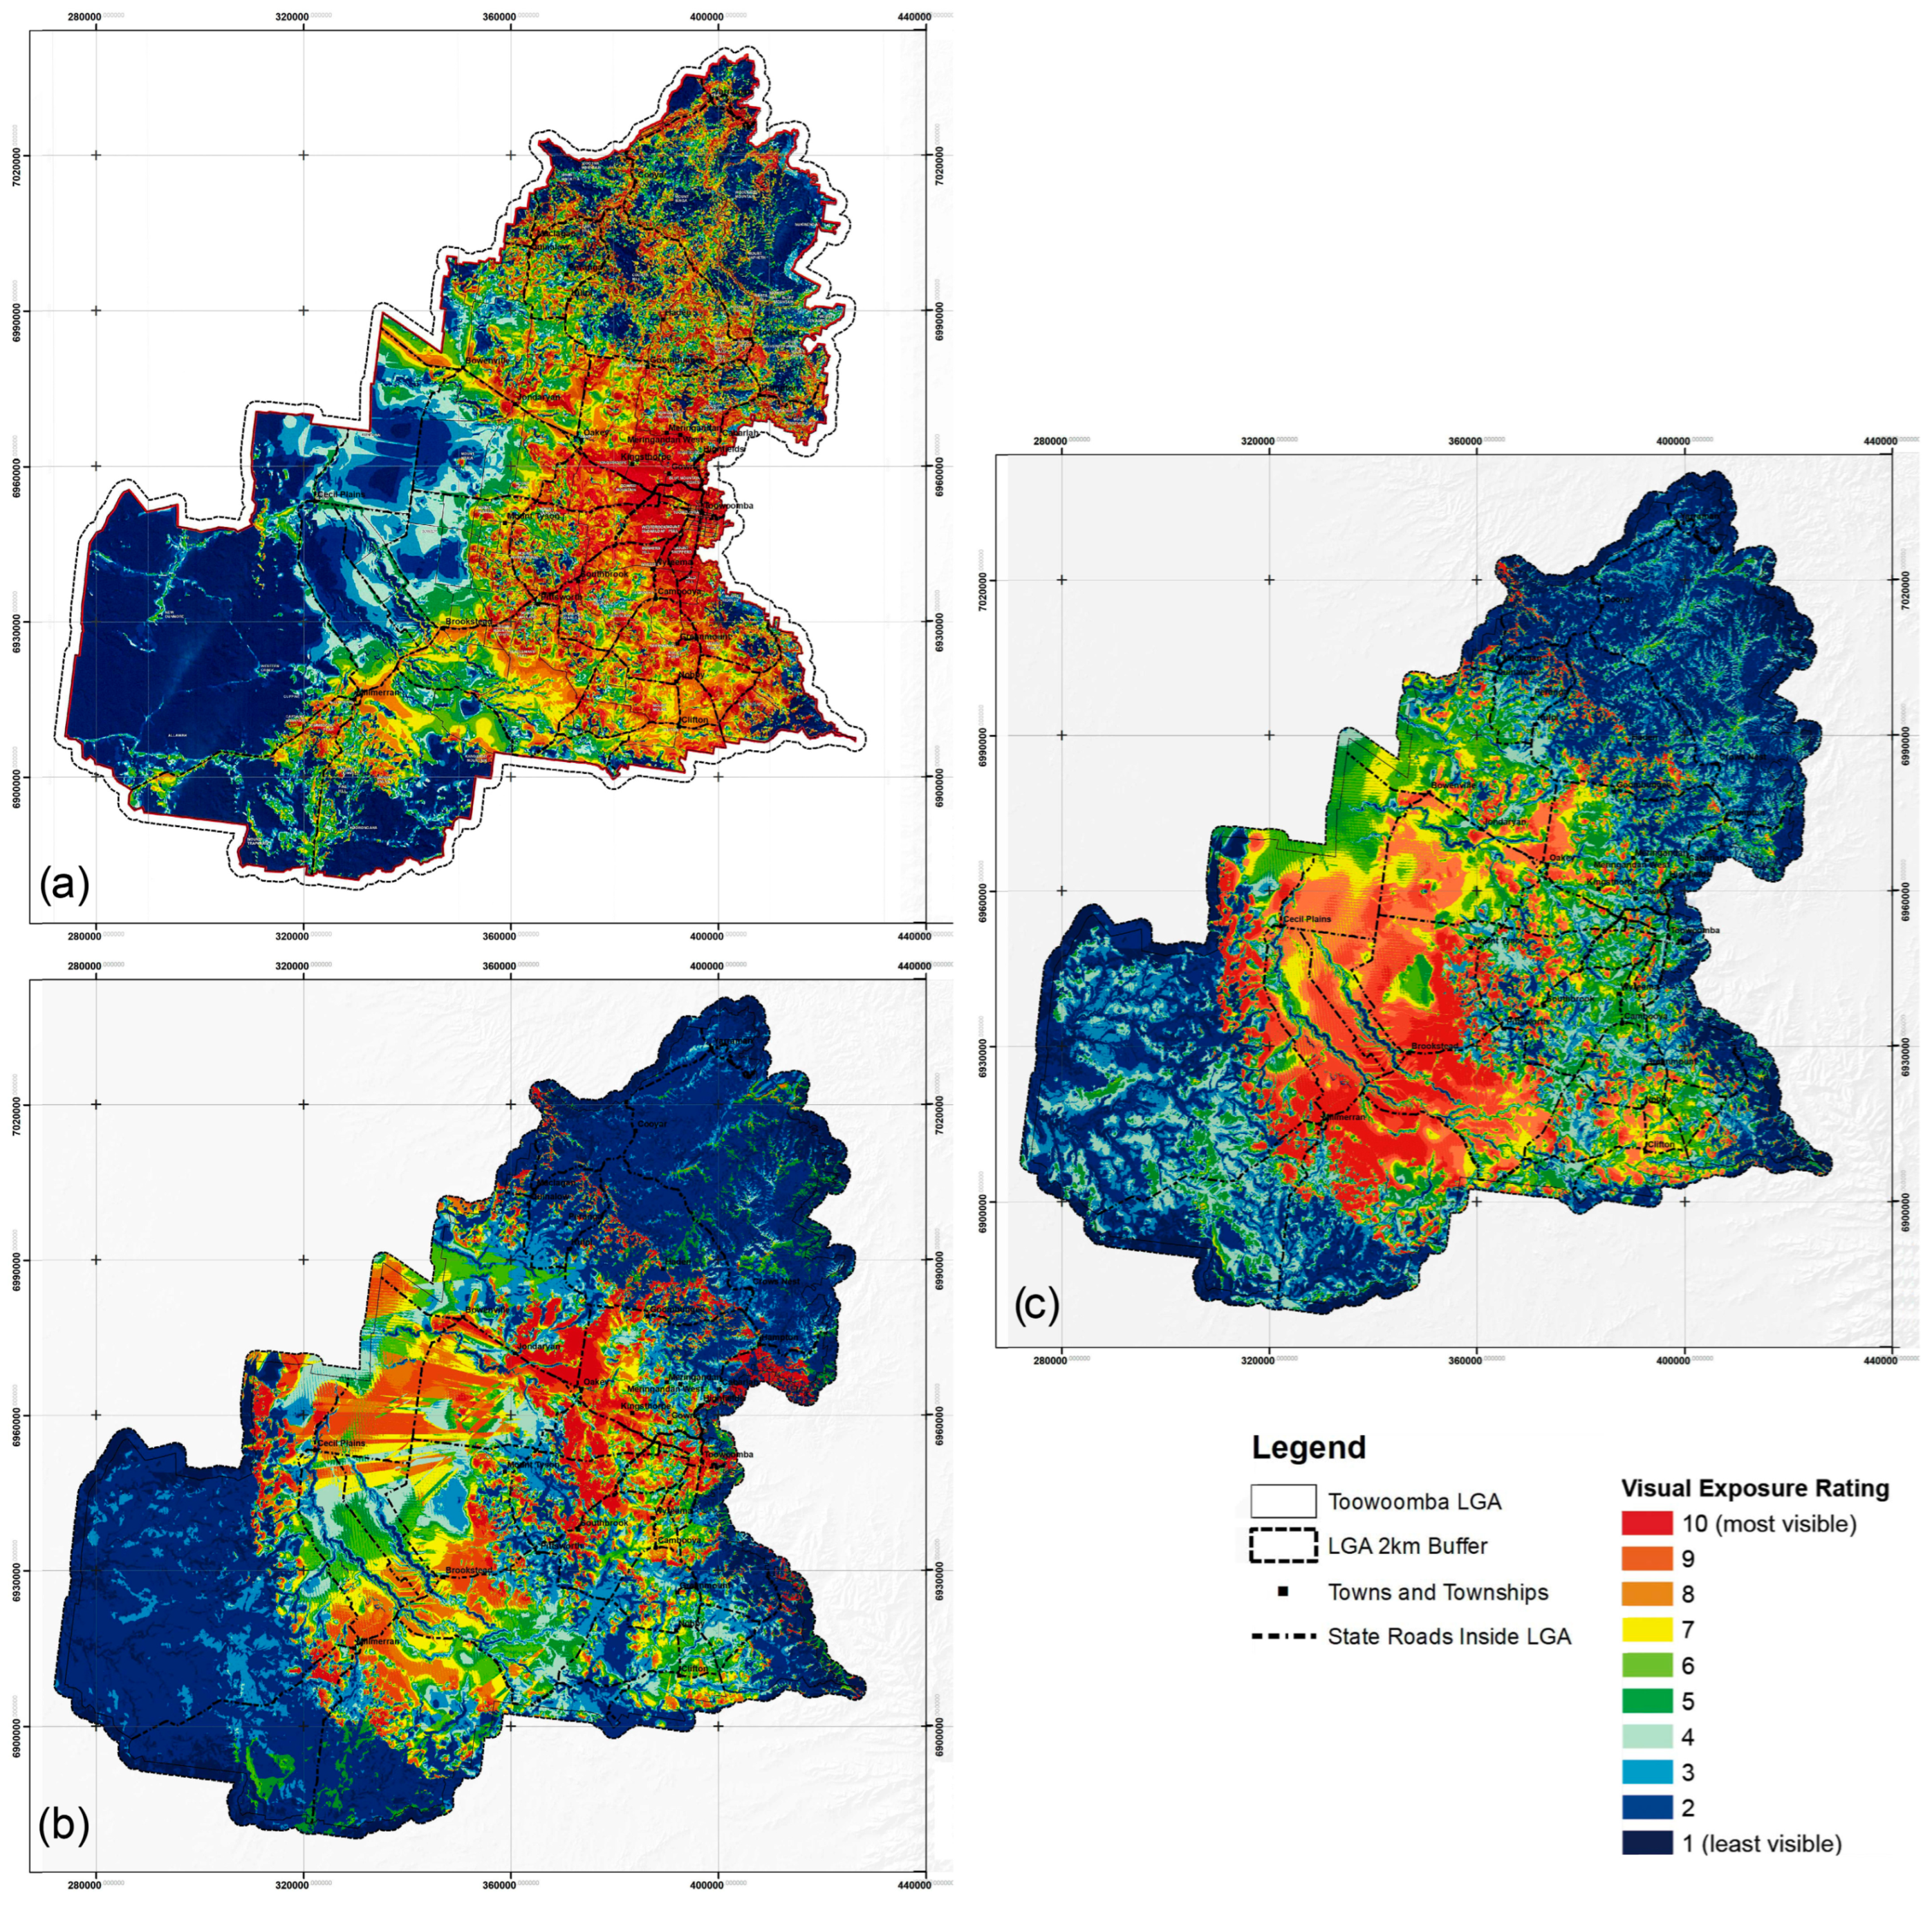
Three visual exposure options were produced and compared to choose the preferred visual exposure map. The generation of three distinct visual exposure maps was aimed at comprehensively exploring variations in the visual exposure modelling process. By conducting a comparison with the real-life landscape experience, this study aimed to discern the merits and drawbacks associated with each modelling approach. The primary objective was to identify the most suitable, meaningful, and less complex visual exposure modelling method for potential adoption in future landscape assessments. By undertaking this testing, this research sought to contribute valuable insights to enhance the precision and applicability of visual exposure mapping in the realm of landscape studies.
The first VE map option reflected viewing time and land-cover attenuation factors on visibility produced in TNTmips GIS [26] based on 2009 AADT (Figure 13a). The second option, visual exposure, was produced by integrating viewing time but excluding the land-cover attenuation effect (Figure 13b). Another option was modelled, comprising a more simplified option of visual exposure without AADT and a land-cover attenuation factor. This reflected a more realistic presentation of visibility as experienced during the field visit, regardless of the traffic flow. It was considered common sense that the visibility was extensive in flat areas and was reflected in the simplistic visual exposure model (Figure 13c). This departure from the Scenic Amenity Methodology (SAM) was implemented to prevent undervaluing landscapes that might be deemed of high scenic value but are less visually accessible. This adjustment aimed to account for the potential elevation of public preferences and perceptions of value due to the remoteness of certain landscapes, particularly in the context of tourism. However, it was acknowledged that each visual exposure map option had its own merits and information, depending on the purpose of use.

Figure 13.
Visual exposure mapping (1–10): (a) VE including AADT 2009 and land-cover attenuation factors produced by Conics Pty Ltd, Brisbane, Australia.; (b) VE map including AADT 2017 and 2018 only; (c) preferred VE map excluding AADT and land-cover attenuation (visibility only).
The selected simplified visual exposure map (Figure 13c) indicates the relative visibility of the landscape mainly based on landform and distribution of previewing locations within the Toowoomba Region, highlighting those areas that are most visible (red) as well as areas that are least visible (deep blue).
4.4. Scenic Amenity Map and Recommendations
The SA map (Figure 14a) identifies the areas of highest to lowest scenic amenity value within the Toowoomba Region based on the SP and VE maps produced in this study. In order to assist in the development of the Council’s new planning scheme and inform regional and local planning, an additional map classifying areas of regionally significant scenic amenity and locally significant scenic amenity value was produced (Figure 14b). It was recommended that this map replace the existing Scenic Amenity Overlay Map within the current planning scheme.
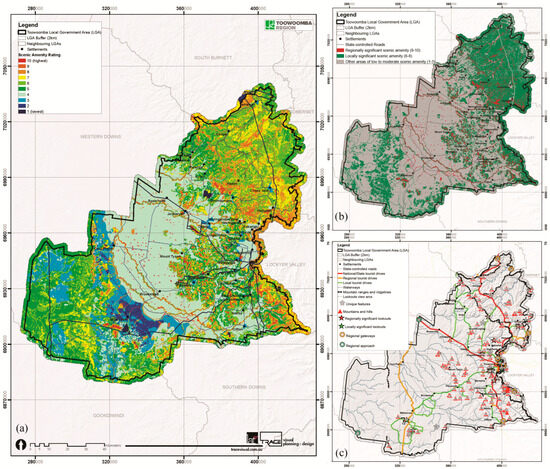
Figure 14.
Outcomes: (a) scenic amenity map (1–10); (b) scenic amenity overlay for integration in the planning scheme; (c) landscape features map including scenic routes, lookouts, mountain peaks, gateways, waterways, and unique features.
The areas identified as having very high regional scenic amenity value (9–10) within the Toowoomba Region included:
- Parts of rivers and creeks;
- Large water supply dams/reservoirs;
- Other dams and instances of water within the landscape (whilst GIS mapping has identified rural dams, including ring tanks, as having a high scenic preference, it should be noted that in reality, views of many of these features are not possible. Additionally, not all water bodies are considered to offer high levels of scenic amenity);
- Parts of vegetated and elevated peaks, ridges, plateaus, and hills.
These regionally significant scenic amenity areas (9–10) are considered to constitute highly appealing and distinctive landscapes that make the most significant contributions to the scenic amenity of the Toowoomba Region and broader South East Queensland (SEQ) region. They are highly valued by the community and should be managed and protected for their scenic amenity, beauty, and tourism value.
Scenic amenity areas of local significance encompass landscapes with moderate-to-high scenic value (rated 6–8). These areas are deemed attractive, contributing to the scenic amenity of the Toowoomba Region, and warrant management and protection for their scenic beauty.
Exploring potential enhancement measures for areas with low-to-moderate scenic amenity value (rated 1–5) could involve improvements in these locations. This might encompass initiatives such as enhancing landscape and visual amenity, especially along scenic routes traversing these areas. Additional strategies could involve tree planting and landscaping to create visual buffers, mitigating the impact of land uses that might diminish the perceived scenic amenity. It was also recommended that provisions for the protection and management of key values within LCTs be incorporated into the strategic framework as a guide to inform development within the region. Furthermore, consideration was also given to protecting key landscape features, including escarpments, mountain ranges and ridgelines, waterways, mountain peaks, and other unique features such as scenic routes, lookouts, gateways, and inter-urban breaks (Figure 14c). Our study recommended ensuring new developments were sympathetic to the existing character of the surrounding area, as identified in relevant parts of the LCA.
5. Discussion
This research presented an alternative methodology to integrate established landscape assessment approaches that originated in the 1970s in the USA [3,4,5] and in the 1980s in the UK [5,6,9,10,11]. This approach was required to assist TRC in implementing a requirement of Queensland state planning policy to map scenic amenity values within local government areas. A suite of approaches and maps, such as LCA, scenic preference, visual exposure, scenic amenity, landscape overlay, and features, collectively provided a comprehensive framework to map landscape values across a broad geographic location. These landscape values were based on landscape character and scenic amenity maps, alongside preferences provided by the local community, thus combining the knowledge of experts with that of lay people who know and love their local places and are most affected by landscape change in their region.
The mapping process is an evidence-based approach to helping local councils protect and enhance landscapes through the control of development pressures and the management of climate change impacts. Visual exposure provided a basis for understanding visual landscape experience and viewer sensitivity on a broad scale, and these were integrated into a scenic amenity (SA) map at a fine-grained resolution. The final scenic amenity map integrated all considerations as part of the assessment, including landscape character types, subtypes, community scenic preferences, and visual exposure, to inform a single map for inclusion as an ‘overlay’ in the local government planning scheme. The resolution and level of detail in the final scenic amenity map are sufficiently high to be used for future development assessments and various land-use planning and management purposes. However, the integration of community preferences is not limited to scenic preference surveys, as used in this study. There are other approaches, including Public Participatory GIS (PPGIS) and social media, that could potentially contribute to the identification and mapping of landscape values.
Participatory mapping has emerged as an important method for identifying landscape values. According to [27], mapped landscape values are (1) most appropriately interpreted as values pertaining to relationships, (2) indications of participant spatial/geographic discounting, reflecting familiarity and experiences within one’s local environment, (3) intimately linked to concepts of place attachment and “sense of place”, (4) correlated with participant attitudes and preferences regarding land use, (5) indicative of potential land-use conflicts, (6) associated with tangible landscape features, (7) generally consistent and enduring over time, (8) applicable across various geographic scales, (9) demonstrated with more similarities than differences across diverse geographic areas and populations, and (10) seldom evident in actually influencing land-use decisions [27]. To exemplify this phenomenon, residents in urban areas seem to maintain a ‘portfolio of natural places’. This portfolio includes local favourites with lower ratings but frequent visits, as well as more distant natural places that they find highly appealing but visit less frequently [28]. Broadly, the values expressed by citizens and indicators of landscape aesthetic quality identified by experts demonstrated only modest correlations, except for perceived environmental value and landscape naturalness. Consequently, the perceived landscape values of citizens often do not align with the locations identified in expert assessments [29].
Community engagement through scenic preference surveys provides an opportunity to raise awareness and learning for the community, jointly explore the meaning of valued landscapes and scenery, and understand ongoing and future pressures on visual resources. This allows the values of stakeholder communities, formed through their relationships with their landscapes, to better align with those of expert assessors, achieving the ELC goals to ‘democratise’ the landscape [30]. The scenic preference survey in this study highlighted the importance of naturalness and landscape integrity in shared aesthetic values of scenery by the community. Public surveys can evolve further to understand development and enhancement impacts on local preferences. For instance, notions of green energy or reducing land degradation by farming may be studied through public surveys and provide clearer planning directions.
The evaluation of landscapes, based on their scenic amenity and character, provides a tangible basis for managing these intangible values through spatial planning and sensitive land use. While the proposed methodology integrates Landscape Character Assessment (LCA) into an established scenic evaluation method (SAM), criticism can still be aimed at using a quantitative approach to measure essentially subjective and qualitative parameters. This continues as a long-standing debate between expert- and perception-based approaches [31]. However, the integration of community scenic preferences and local information, such as various complementary layers of landscape features, scenic routes, lookouts, and gateways, adds greater equity to the evaluation. In the case of the Toowoomba study (undertaken during COVID-19 restrictions on face-to-face focus group meetings), the photo survey for community scenic preferences was conducted via an online platform, which provided a wider opportunity for local participation. However, the online platform used for the Toowoomba study did not allow participants to first review all the survey photos at full scale to start comparing and scoring photos. Offering an initial, detailed overview of survey photos by participants is likely to increase the validity or confidence in some of the ratings. In the future, alternative forums such as online whiteboards (e.g., Miro.com (accessed on 14 September 2021)) may potentially allow participants to compare and sort the survey photos as the first step before scoring. However, the capacity of online platforms to integrate inputs from both stakeholder communities and those of ‘outsiders’ (e.g., tourists and other visitors) in the scenic preference survey can bring additional perspectives and benefits [32].
Despite the invaluable opportunities presented by digital engagement, the project team recognises its limitations, particularly due to the constraints imposed by COVID-19 restrictions, especially when juxtaposed with the richness of face-to-face public engagement. Acknowledging the unique challenges posed by the pandemic, we understand that deeper community engagement through physical activities holds the potential for a more effective research and public engagement strategy. This approach not only aligns with participatory planning methods but also serves as an educational opportunity for the community. Engaging in physical activities provides a tangible and immersive experience, offering participants a genuine connection with the landscape as it is authentically experienced and lived. The integration of such approaches into future initiatives could amplify the impact and authenticity of community involvement.
The proposed methodology primarily emphasises the visual dimension of landscape planning. By integrating Landscape Character Assessment (LCA) into the Scenic Amenity Methodology (SAM), our endeavour was to encompass the multi-faceted and multi-sensory aspects of the landscape experience and perception. However, it is important to acknowledge that the current research predominantly concentrates on the visual component, and the integration of non-visual aspects necessitates distinct studies and further research development in this area.
Describing and evaluating landscapes is at the core of several established or proposed systems for protecting, managing, and enhancing the environment, such as the geodesign framework [33]. The approach proposed in this paper has the potential to deepen the decision-making process by engaging with the community. Aesthetic values and character, embodied in the scenery, form a shared interest among many stakeholders and can be evaluated in a participatory planning approach that better responds to the challenges of growing urbanisation and climate change impacts. The integration of scenic values, community preferences, and character (LCA) can also provide a basis for considering a range of other non-visual values associated with the landscape, such as rural production, tourism, heritage, and cultural and Indigenous values, in a more comprehensive approach to guide the future planning and management of Australian landscapes. Integration of landscape evaluation, planning, and design approaches on a regional scale can be important steps towards less fragmented, more attractive, resilient, and biodiverse landscapes.
Overall, integrating not only character and scenic amenity values in landscape evaluation but also non-visual assessments and narratives (such as Historic Landscape Characterisation and Indigenous values) is considered a future pathway for landscape planning and management [32,34]. In a broader context, other non-visual issues, such as rural production, biodiversity and natural significance, tourism and recreation opportunities, bushfire and other hazards, rehabilitation potential, cultural significance, and intrinsic values, are additional layers that can potentially be integrated into holistic landscape evaluation and inform landscape planning and management.
The proposed streamlined and practical methodology for broadly mapping landscape values contributes substantially to the UN Decade on Ecosystem Restoration. This approach supports participatory planning by actively involving local community values through their connection to the landscapes, strengthening collaborative endeavours dedicated to ecosystem restoration. This methodology is aligned with the overarching goals of the UN Decade on Ecosystem Restoration, fostering social–ecological connections for both research and practical implementation. Acknowledging that the success of restoration efforts is contingent on accounting for diverse social preferences, connectedness, and systems thinking, this approach emphasises the importance of incorporating a comprehensive understanding of the social dimension in restoration initiatives [35].
6. Conclusions
Landscape planning is an evolving field, but it remains based on landscape evaluation. These assessments need to evolve beyond the scenic view and target underlying landscape values based on visual cues [1]. This study aimed to integrate landscape character, scenic amenity, and community preferences into a framework for achieving place-based landscape evaluation to overcome the limitations associated with LCA and scenic evaluations, such as the SAM, as separate methodologies. The integration of LCTs and subtypes as part of the mapping process of scenic preferences for the Toowoomba Region allowed the production of a more sensitive layer reflecting landscape experiences as perceived by the public. Similarly, the simplification of the visual exposure map allowed it to become a more sensitive layer of landscape experience for consideration in the mapping process. The entire process contributed to the production of the final scenic amenity map with a high level of detail and specificity for integration in the planning scheme and development controls. It posited that all areas have values worthy of protection and that no place is expendable [5].
The outcome has proven valuable in landscape evaluation for local government land-use planning schemes, allowing consistency throughout regions in Queensland. It is also likely to have applications in visual impact assessments for large-scale developments, such as renewable energy projects, which can have irreversible impacts on landscapes. The methodology proposed in this paper is also considered suitable for integrating more broadly with other quantitative and qualitative assessments at the landscape scale, particularly those that overlap with scenic and character values such as biodiversity, catchment protection, and rural production.
Author Contributions
Conceptualisation, A.T. and G.L.; methodology, A.T., W.D., G.P. and A.C.; software, A.T.; formal analysis and validation, A.T. and G.P.; investigation, W.D. and G.P.; resources, A.T.; data curation, A.T., W.D. and G.L.; writing—original draft preparation, all authors; writing—review and editing, all authors; visualisation, A.T.; supervision, A.T., W.D. and G.L.; project administration, W.D. and G.P.; funding acquisition, W.D. All authors have read and agreed to the published version of the manuscript.
Funding
This research received no external funding.
Institutional Review Board Statement
Not applicable.
Informed Consent Statement
Not applicable.
Data Availability Statement
Toowoomba Regional Council is the primary owner of the data used in this study. The Toowoomba Region study reports can be found on the Council’s engagement website at https://yoursay.tr.qld.gov.au/tr-futures. (access on 1 January 2023)
Acknowledgments
The proposed research was conducted as part of consultancy services provided by a consortium led by LatStudios (trading as Lat27) and Trace Visual in collaboration with PSA Consulting, Extent Heritage, and The Comms Team in 2020–2021 for the Toowoomba Regional Council (TRC). Special thanks to Markus Dittmann, the project manager in strategic planning and economic development at TRC, for his support and review of the project outcome.
Conflicts of Interest
The authors declare no conflicts of interest.
References
- Selman, P. Centenary paper: Landscape planning—Preservation, conservation and sustainable development. Town Plan. Rev. 2010, 81, 381–406. [Google Scholar] [CrossRef]
- Warnock, S.; Brown, N. A vision for the countryside. Landsc. Des. 1998, 22–26. [Google Scholar]
- USDA Forest Service. National Forest Landscape Management; Chapter 1; U. S. Department of Agriculture Handbook Number 462; U.S. Government Printing Office: Washington, DC, USA, 1974; Volume 2, 47p.
- Palmer, J.; Smardon, R. US approaches related to landscape character assessment. In Handbook of Landscape Character Assessment: Current Approaches to Characterization and Assessment; Fairchild, G., Herlin, I.S., Swanwick, C., Eds.; Routledge: London, UK, 2018. [Google Scholar]
- Staniscia, S.; Yuill, C.; Cribari, V. Four plus one dimensions of transferability: Defining a framework for the application of a landscape characterization in the USA. City Territ. Archit. 2020, 7, 8. [Google Scholar] [CrossRef]
- Fairclough, G.; Sarlov Herlin, I.; Swanwick, C. Landscape character approaches in global, disciplinary and policy context. In Handbook of Landscape Character Assessment: Current Approaches to Characterization and Assessment; Fairchild, G., Herlin, I.S., Swanwick, C., Eds.; Routledge: London, UK, 2018. [Google Scholar]
- Swanwick, C.; Fairclough, G. Landscape Character Experience from Britain. In Handbook of Landscape Character Assessment: Current Approaches to Characterization and Assessment; Fairchild, G., Herlin, I.S., Swanwick, C., Eds.; Routledge: London, UK, 2018. [Google Scholar]
- Council of Europe. The European Landscape Convention [Online]. 2000. Available online: https://www.coe.int/en/web/landscape/the-european-landscape-convention (accessed on 15 March 2022).
- Sarlöv Herlin, I. Exploring the national contexts and cultural ideas that preceded the Landscape Character Assessment method in England. Landsc. Res. 2016, 41, 175–185. [Google Scholar] [CrossRef]
- Li, G.; Zhang, B. Identification of landscape character types for trans-regional integration in the Wuling Mountain multi-ethnic area of southwest China. Landsc. Urban Plan. 2017, 162, 25–35. [Google Scholar] [CrossRef]
- Bartlett, D.; Gomez-Martin, E.; Milliken, S.; Parmer, D. Introducing landscape character assessment and the ecosystem service approach to India: A case study. Landsc. Urban Plan. 2017, 167, 257–266. [Google Scholar] [CrossRef]
- Lothian, A. The Science of Scenery: How We View Scenic Beauty, What It Is, Why We Love It, and How to Measure and Map It; CreateSpace Independent Publishing Platform: Scotts Valley, CA, USA, 2017. [Google Scholar]
- Western Australian Planning Commission. Visual Landscape Planning in Western Australia, A Manual for Evaluation, Assessment, Siting and Design; Western Australian Planning Commission: Perth, Australia, 2007. [Google Scholar]
- Queensland Government. Implementation Guideline No. 8-Identifying and Protecting Scenic Amenity Values; Queensland Government: Brisbane, Australia, 2007.
- Preston, R.A. Scenic Amenity: Measuring Community Appreciation of Landscape Aesthetics at Moggill and Glen Rock; Department of Natural Resources and Mines, Environmental Protection Agency: Brisbane, Australia, 2001.
- Kaplan, R.S.-W.; Kaplan, S. The Experience of Nature: A Psychological Perspective; Cambridge University Press: Cambridge, UK, 1989. [Google Scholar]
- Aila Qld Regional Landscape Committee. AILA Queensland Position Paper on SEQ Scenic Amenity & the Scenic Amenity Guideline 8 [Online]. Brisbane. 2009. Available online: https://www.aila.org.au/common/Uploaded%20files/_AILA/Submission%20Library/QLD/AILAPositionPaperSC27Apr09.pdf (accessed on 9 October 2021).
- Cardno Chenoweth 2011. Bundaberg Landscape and Scenic Amenity Study. Unpublished.
- CARDNO 2012. Cairns Scenic Amenity Study [Online]. Available online: https://eisdocs.dsdip.qld.gov.au/Active%20Projects/Aquis%20Resort%20at%20the%20Great%20Barrier%20Reef/EIS/Aquis%20EIS_DIGITAL_Appendix%20E%20-%20Landscape%20and%20Visual.pdf (accessed on 15 March 2022).
- CARDNO 2017. Whitsunday Scenic Amenity Study [Online]. Available online: https://www.whitsundayrc.qld.gov.au/downloads/file/382/whitsunday-scenic-amenity-study (accessed on 15 March 2022).
- Queensland Government. South East Queensland Regional Plan 2017 ShapingSEQ; Department of Infrastructure, Local Government and Planning: Brisbane, Australia, 2017.
- Australian Bureau of Statistics. 2016 Census QuickStats-Toowoomba [Online]. 2017. Available online: https://www.abs.gov.au/census/find-census-data/quickstats/2016/317 (accessed on 10 September 2021).
- CONICS. 2009. Scenic Amenity Study Final Report-Toowoomba Regional Planning Project [Online]. Available online: https://tr.qld.gov.au/testcat/planbuild/planningdevelop/311-planningscheme/scenic-amenity-study (accessed on 10 September 2021).
- Swanwick, C. Landscape Character Assessment—Guidance for England and Scotland: Topic Paper 1—Recent Practice and the Evolution of Landscape Character Assessment; Countryside Agency and Battleby: Cheltenham, UK, 2002. [Google Scholar]
- US EPA. Landscape and Predictive Tools, a Guide to Spatial Analysis for Environmental Assessment; US EPA: Washington, DC, USA, 2011. [Google Scholar]
- Datum Geospatial [Online]. 2023. Available online: https://www.microimages.com/products/ (accessed on 10 May 2023).
- Brown, G.; Reed, P.; Raymond, C.M. Mapping place values: 10 lessons from two decades of public participation GIS empirical research. Appl. Geogr. 2020, 116, 102156. [Google Scholar] [CrossRef]
- Bijker, R.A.; Sijtsma, F.J. A portfolio of natural places: Using a participatory GIS tool to compare the appreciation and use of green spaces inside and outside urban areas by urban residents. Landsc. Urban Plan. 2017, 158, 155–165. [Google Scholar] [CrossRef]
- Solecka, I.; Rinne, T.; Caracciolo Martins, R.; Kytta, M.; Albert, C. Important places in landscape—Investigating the determinants of perceived landscape value in the suburban area of Wrocław, Poland. Landsc. Urban Plan. 2022, 218, 104289. [Google Scholar] [CrossRef]
- Calderon, C.; Butler, A. Politicising the landscape: A theoretical contribution towards the development of participation in landscape planning. Landsc. Res. 2020, 45, 152–163. [Google Scholar] [CrossRef]
- Daniel, T.C. Whither scenic beauty? Visual landscape quality assessment in the 21st century. Landsc. Urban Plan. 2001, 54, 267–281. [Google Scholar] [CrossRef]
- Butler, A. Dynamics of integrating landscape values in landscape character assessment: The hidden dominance of the objective outside. Landsc. Res. 2016, 41, 239–252. [Google Scholar] [CrossRef]
- Steinitz, C. A Framework for Geodesign: Changing Geography by Design; Esri: Redlands, CA, USA, 2012. [Google Scholar]
- Low Choy, D.; Wadsworth, J.; Burns, D. Seeing the landscape through new eyes: Identifying and incorporating indigenous landscape values into regional planning processes. Aust. Plan. 2010, 47, 178–190. [Google Scholar] [CrossRef]
- Fischer, J.; Riechers, M.; Loos, J.; Martin-Lopez, B.; Temperton, V.M. Making the UN Decade on Ecosystem Restoration a Social-Ecological Endeavour. Trends Ecol. Evol. 2021, 36, 20–28. [Google Scholar] [CrossRef] [PubMed]


Disclaimer/Publisher’s Note: The statements, opinions and data contained in all publications are solely those of the individual author(s) and contributor(s) and not of MDPI and/or the editor(s). MDPI and/or the editor(s) disclaim responsibility for any injury to people or property resulting from any ideas, methods, instructions or products referred to in the content. |
© 2024 by the authors. Licensee MDPI, Basel, Switzerland. This article is an open access article distributed under the terms and conditions of the Creative Commons Attribution (CC BY) license (https://creativecommons.org/licenses/by/4.0/).