
Seasonal Drought Dynamics and the Time-Lag Effect in the MU Us Sandy Land (China) Under the Lens of Climate Change

Abstract

1. Introduction
2. Study Area and Methods
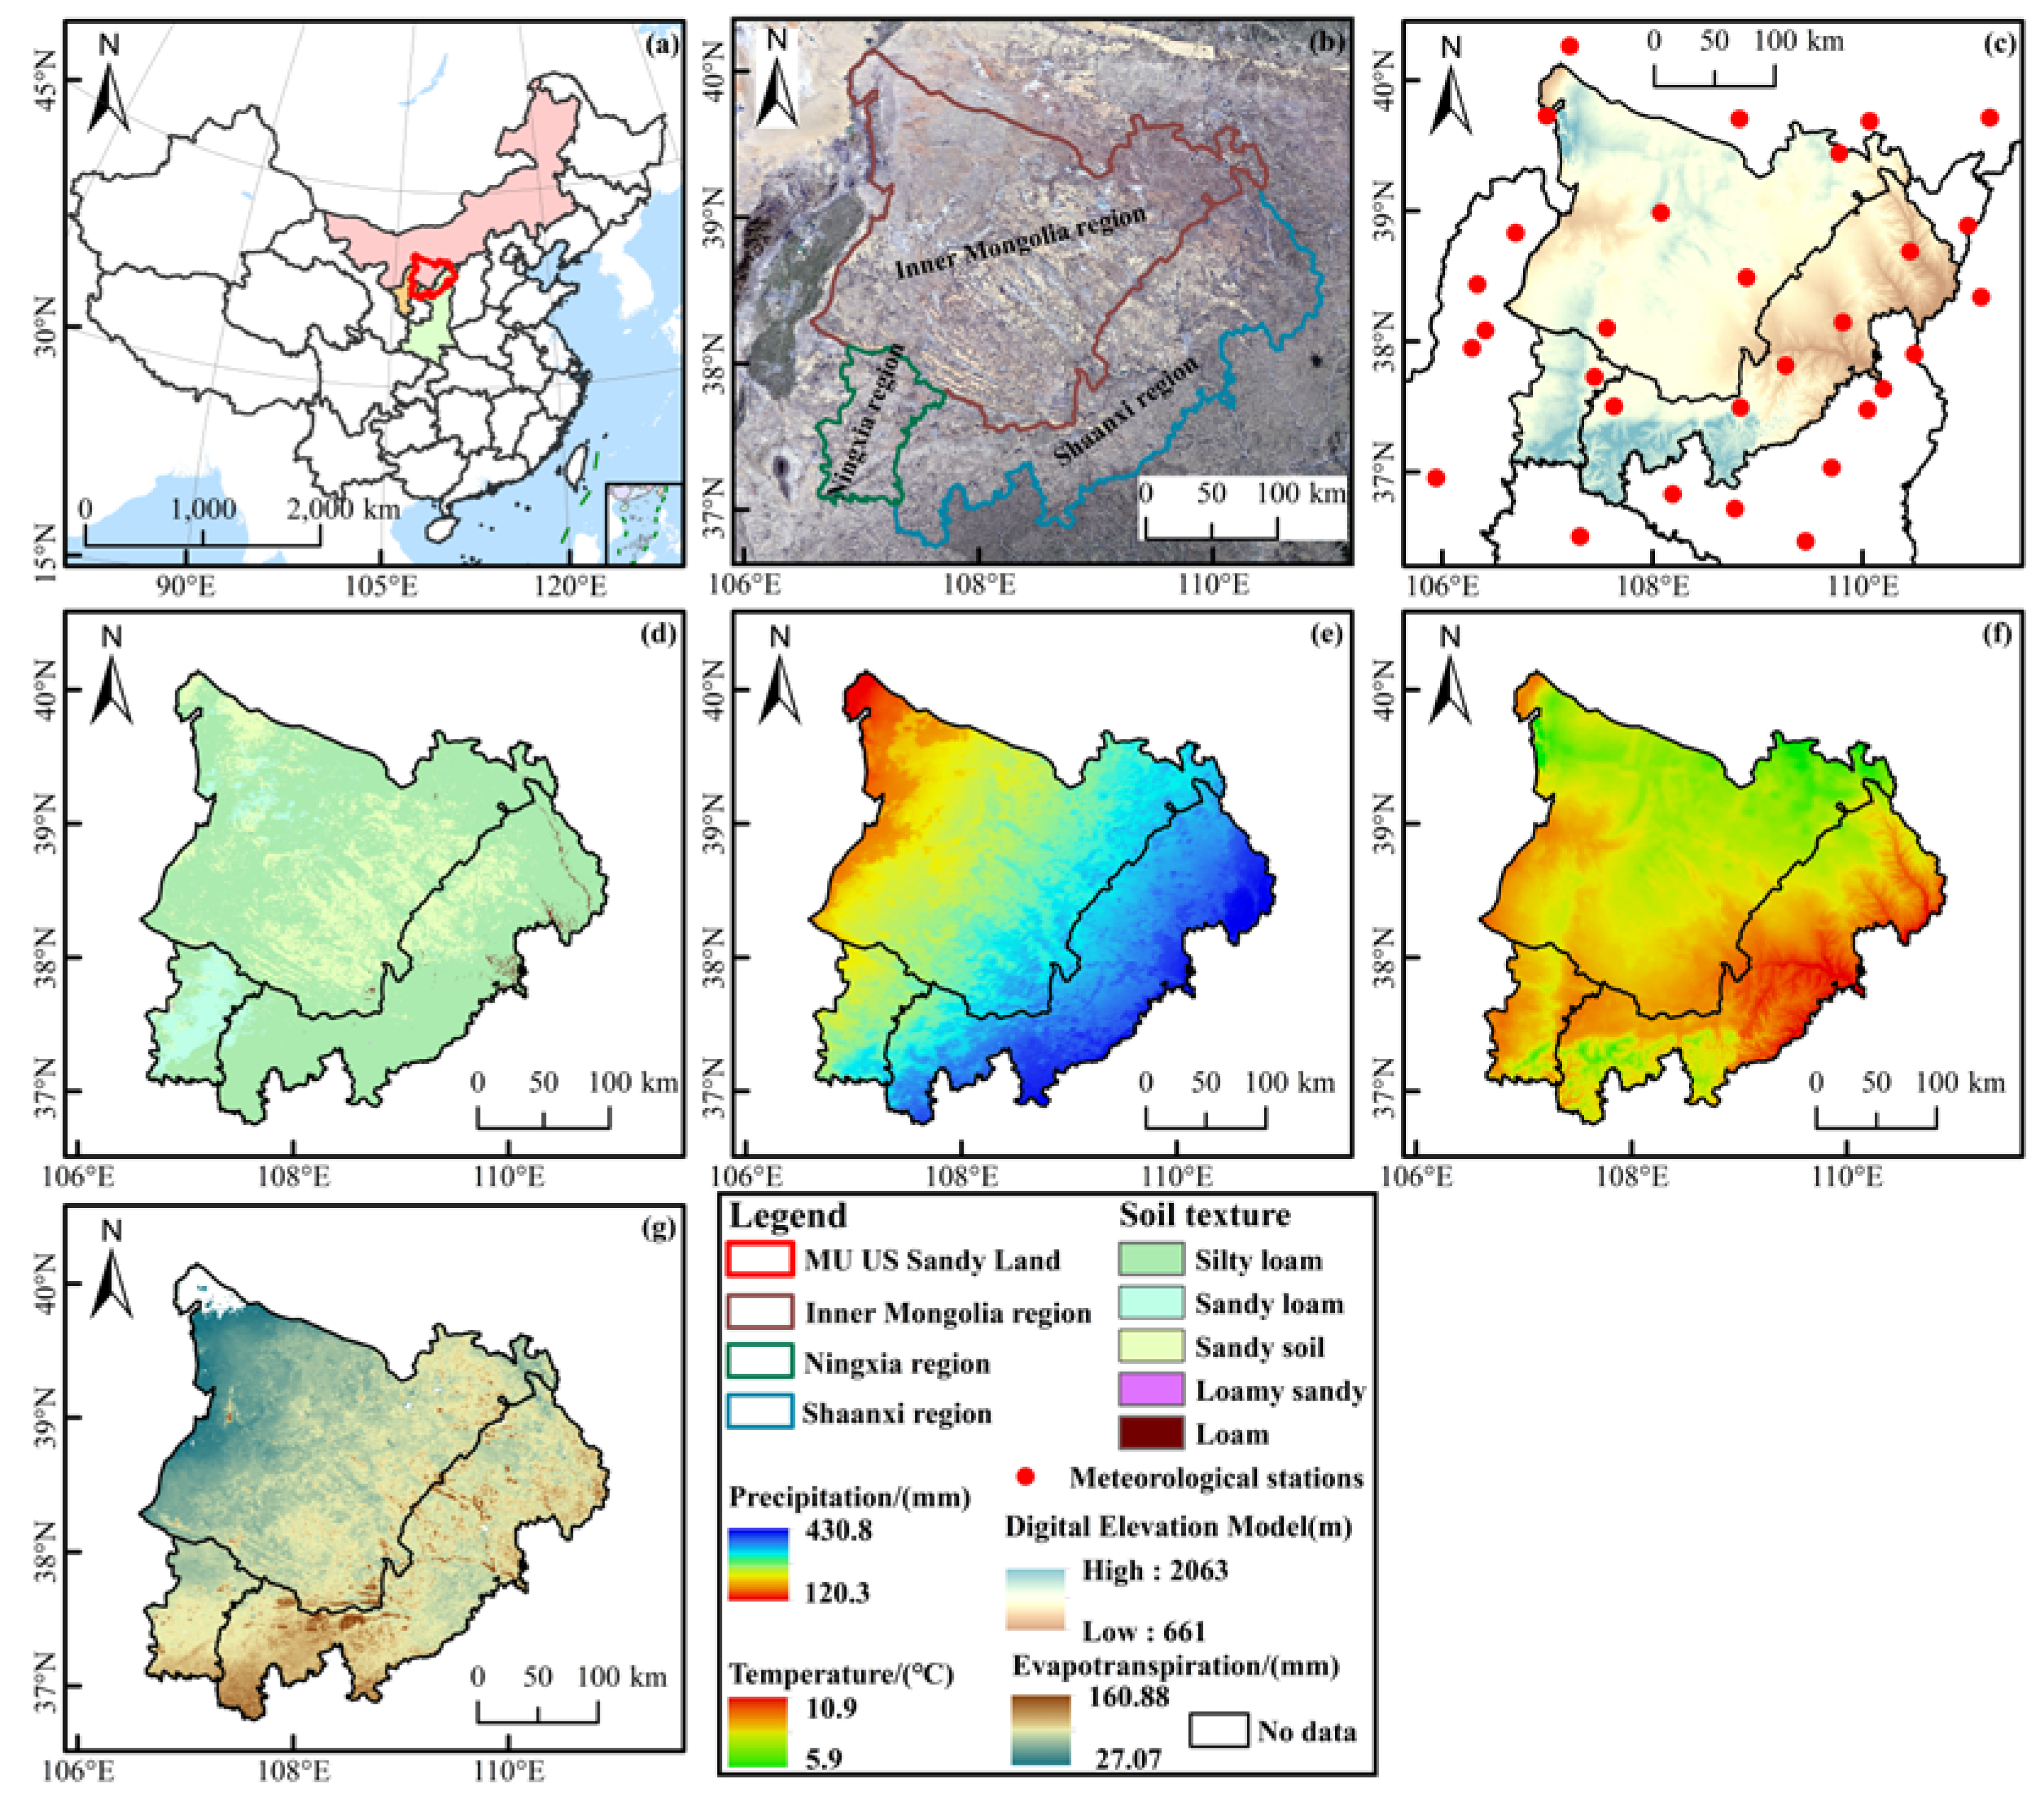
2.1. Study Area
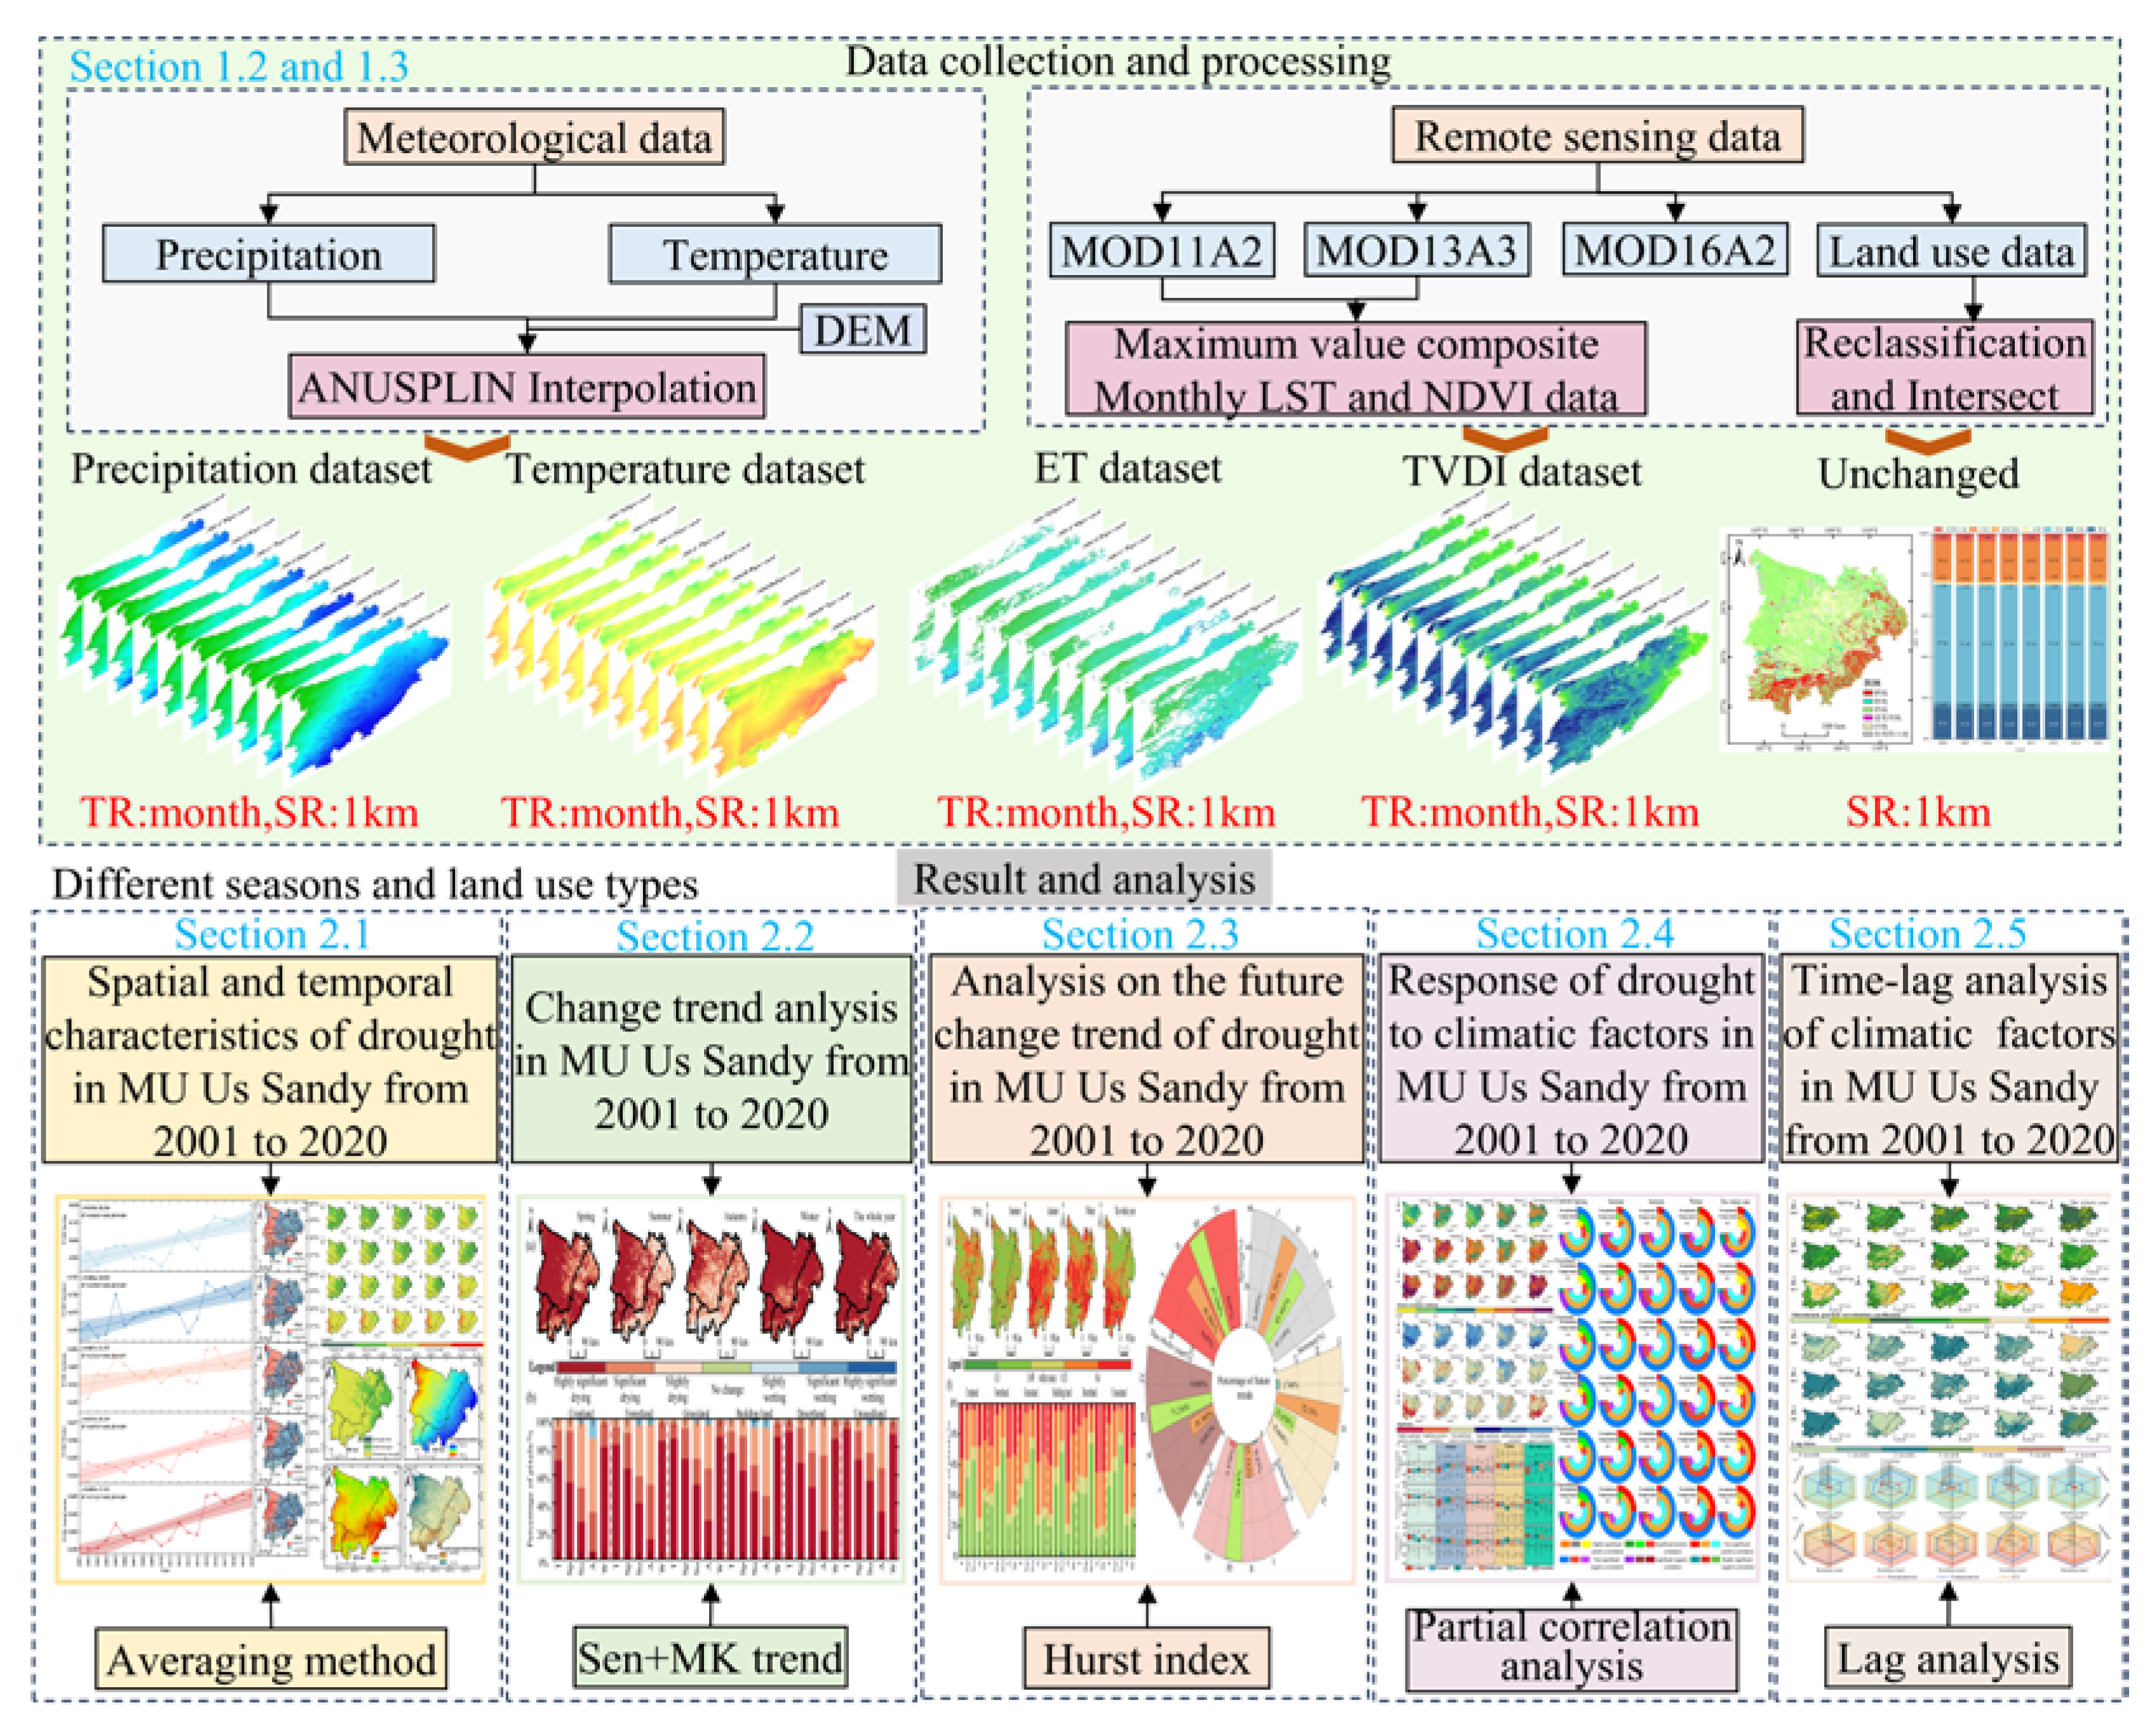
2.2. Data Sources
2.3. Methods
2.3.1. TVDI
2.3.2. TVDI Trend Evaluation of Change
2.3.3. Hurst Exponent
2.3.4. Partial Correlation Analysis and Lag Analysis
3. Results
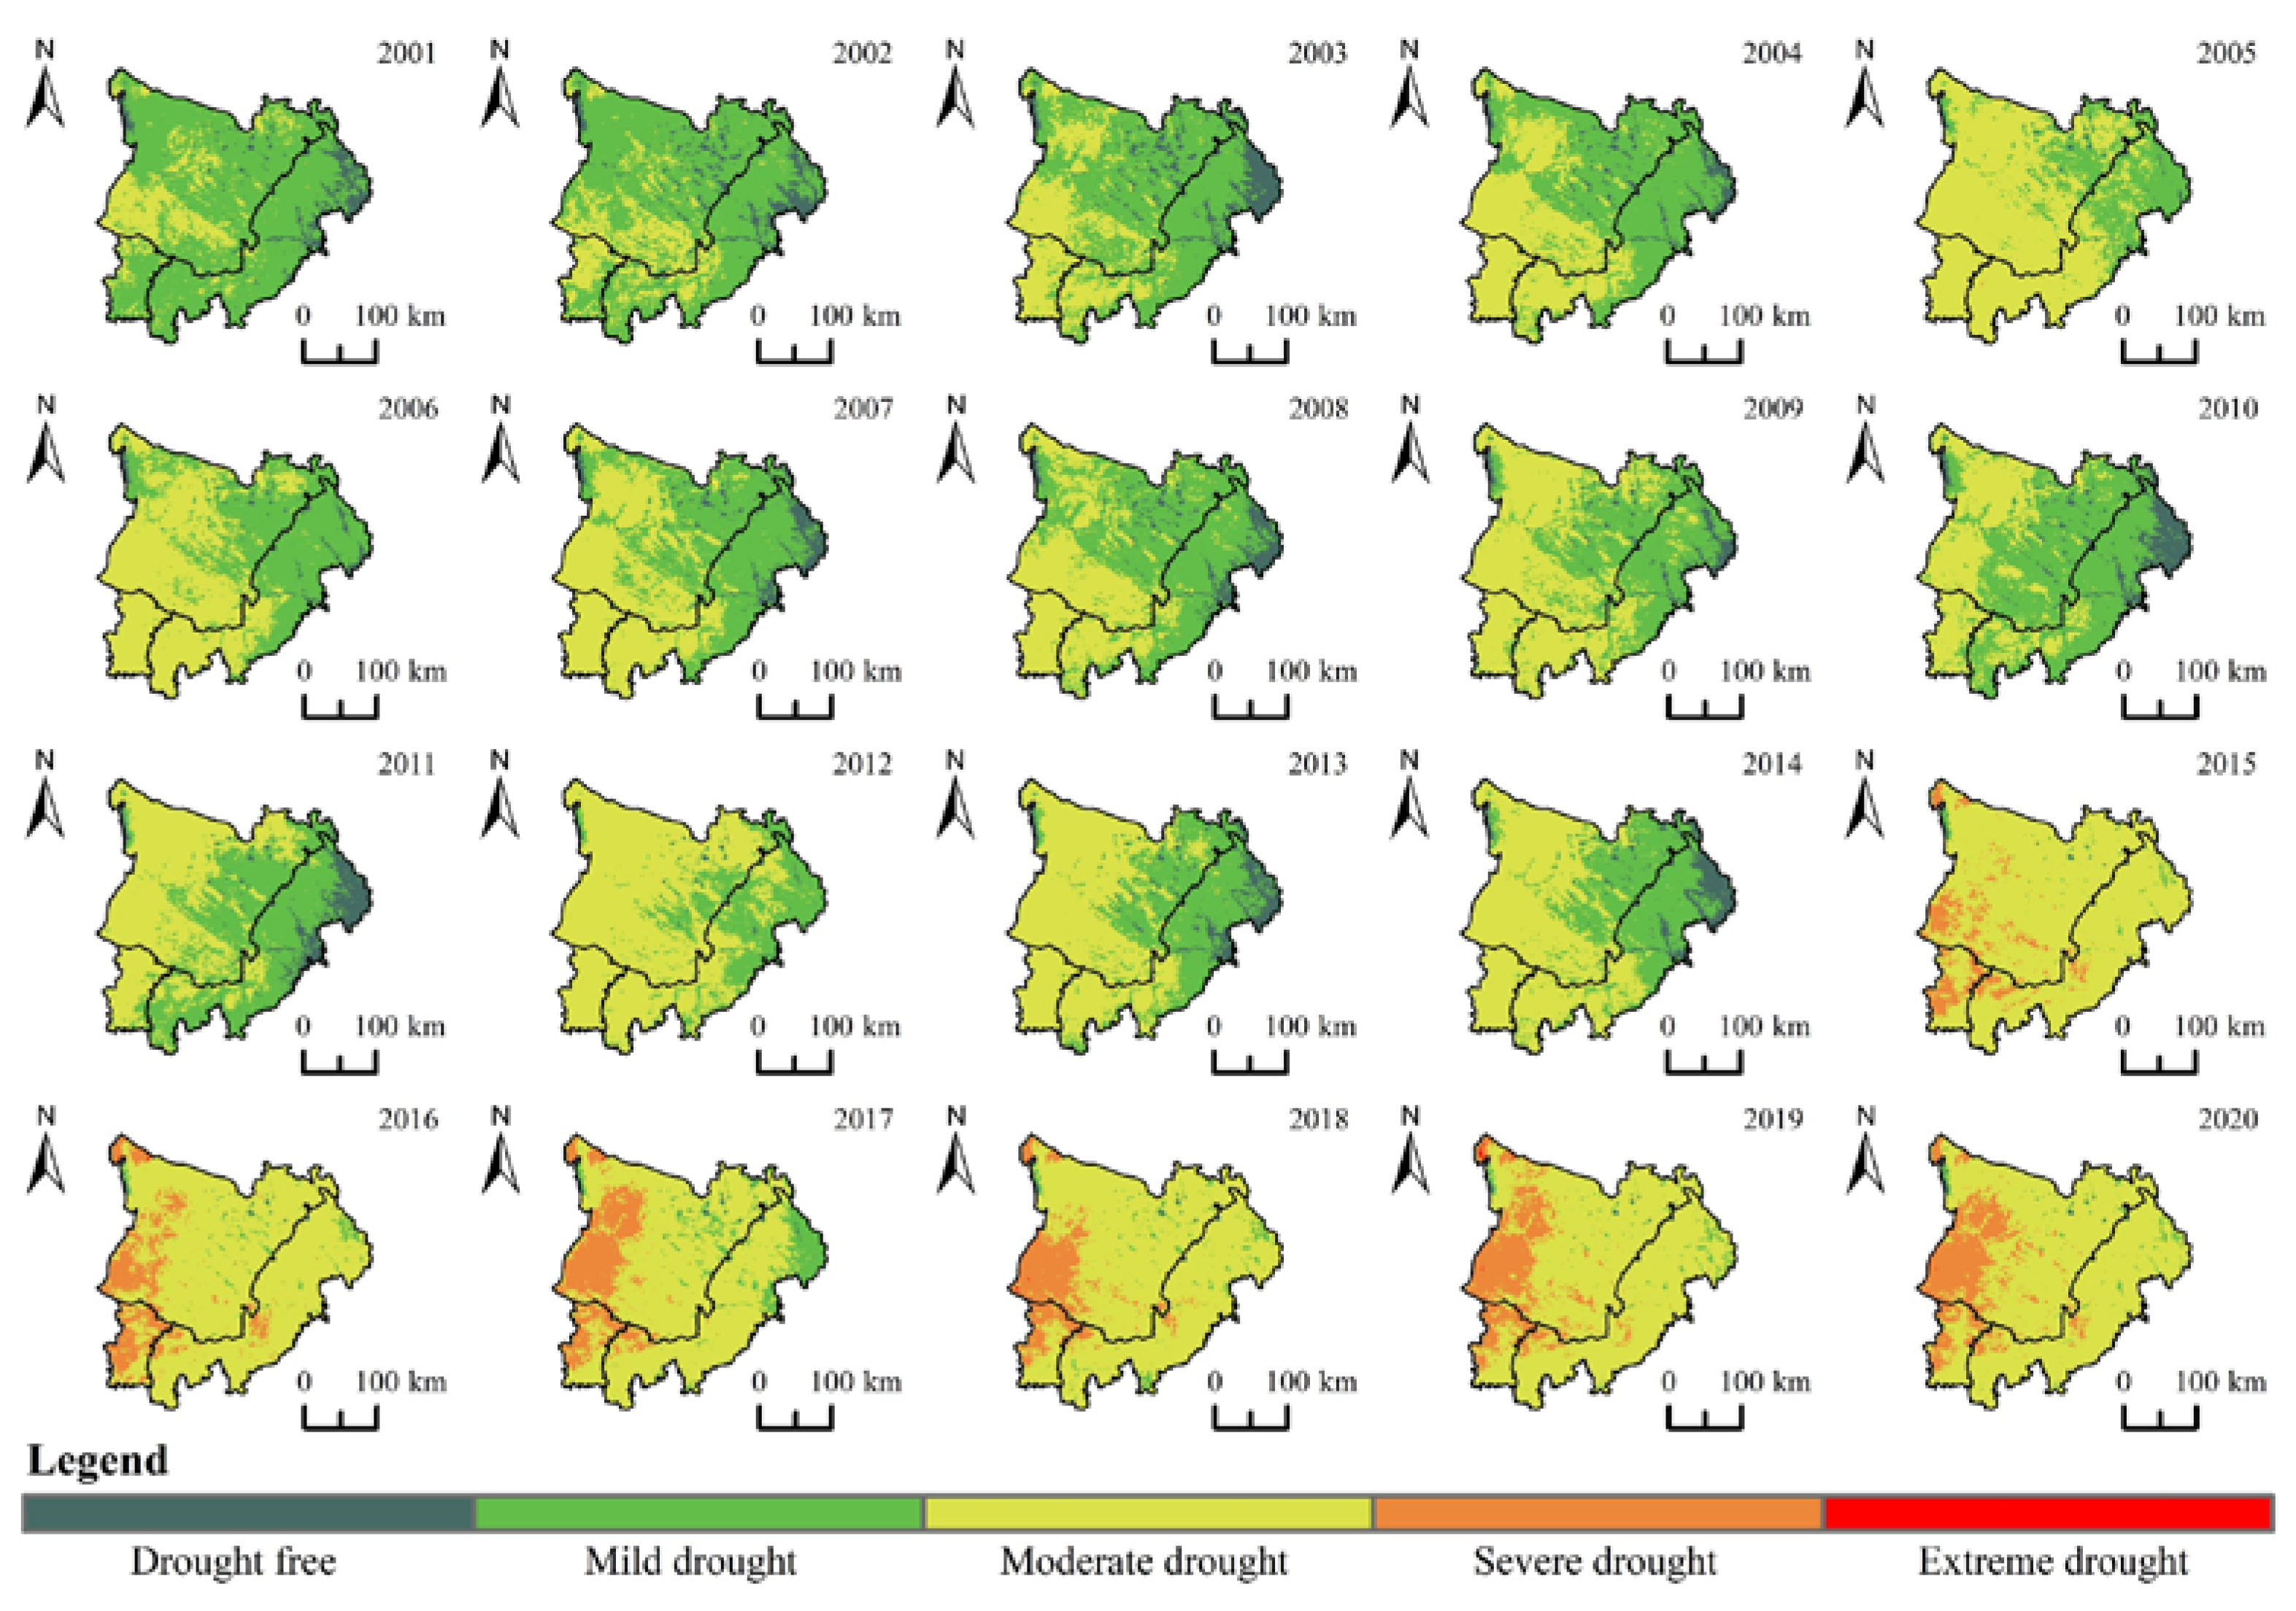
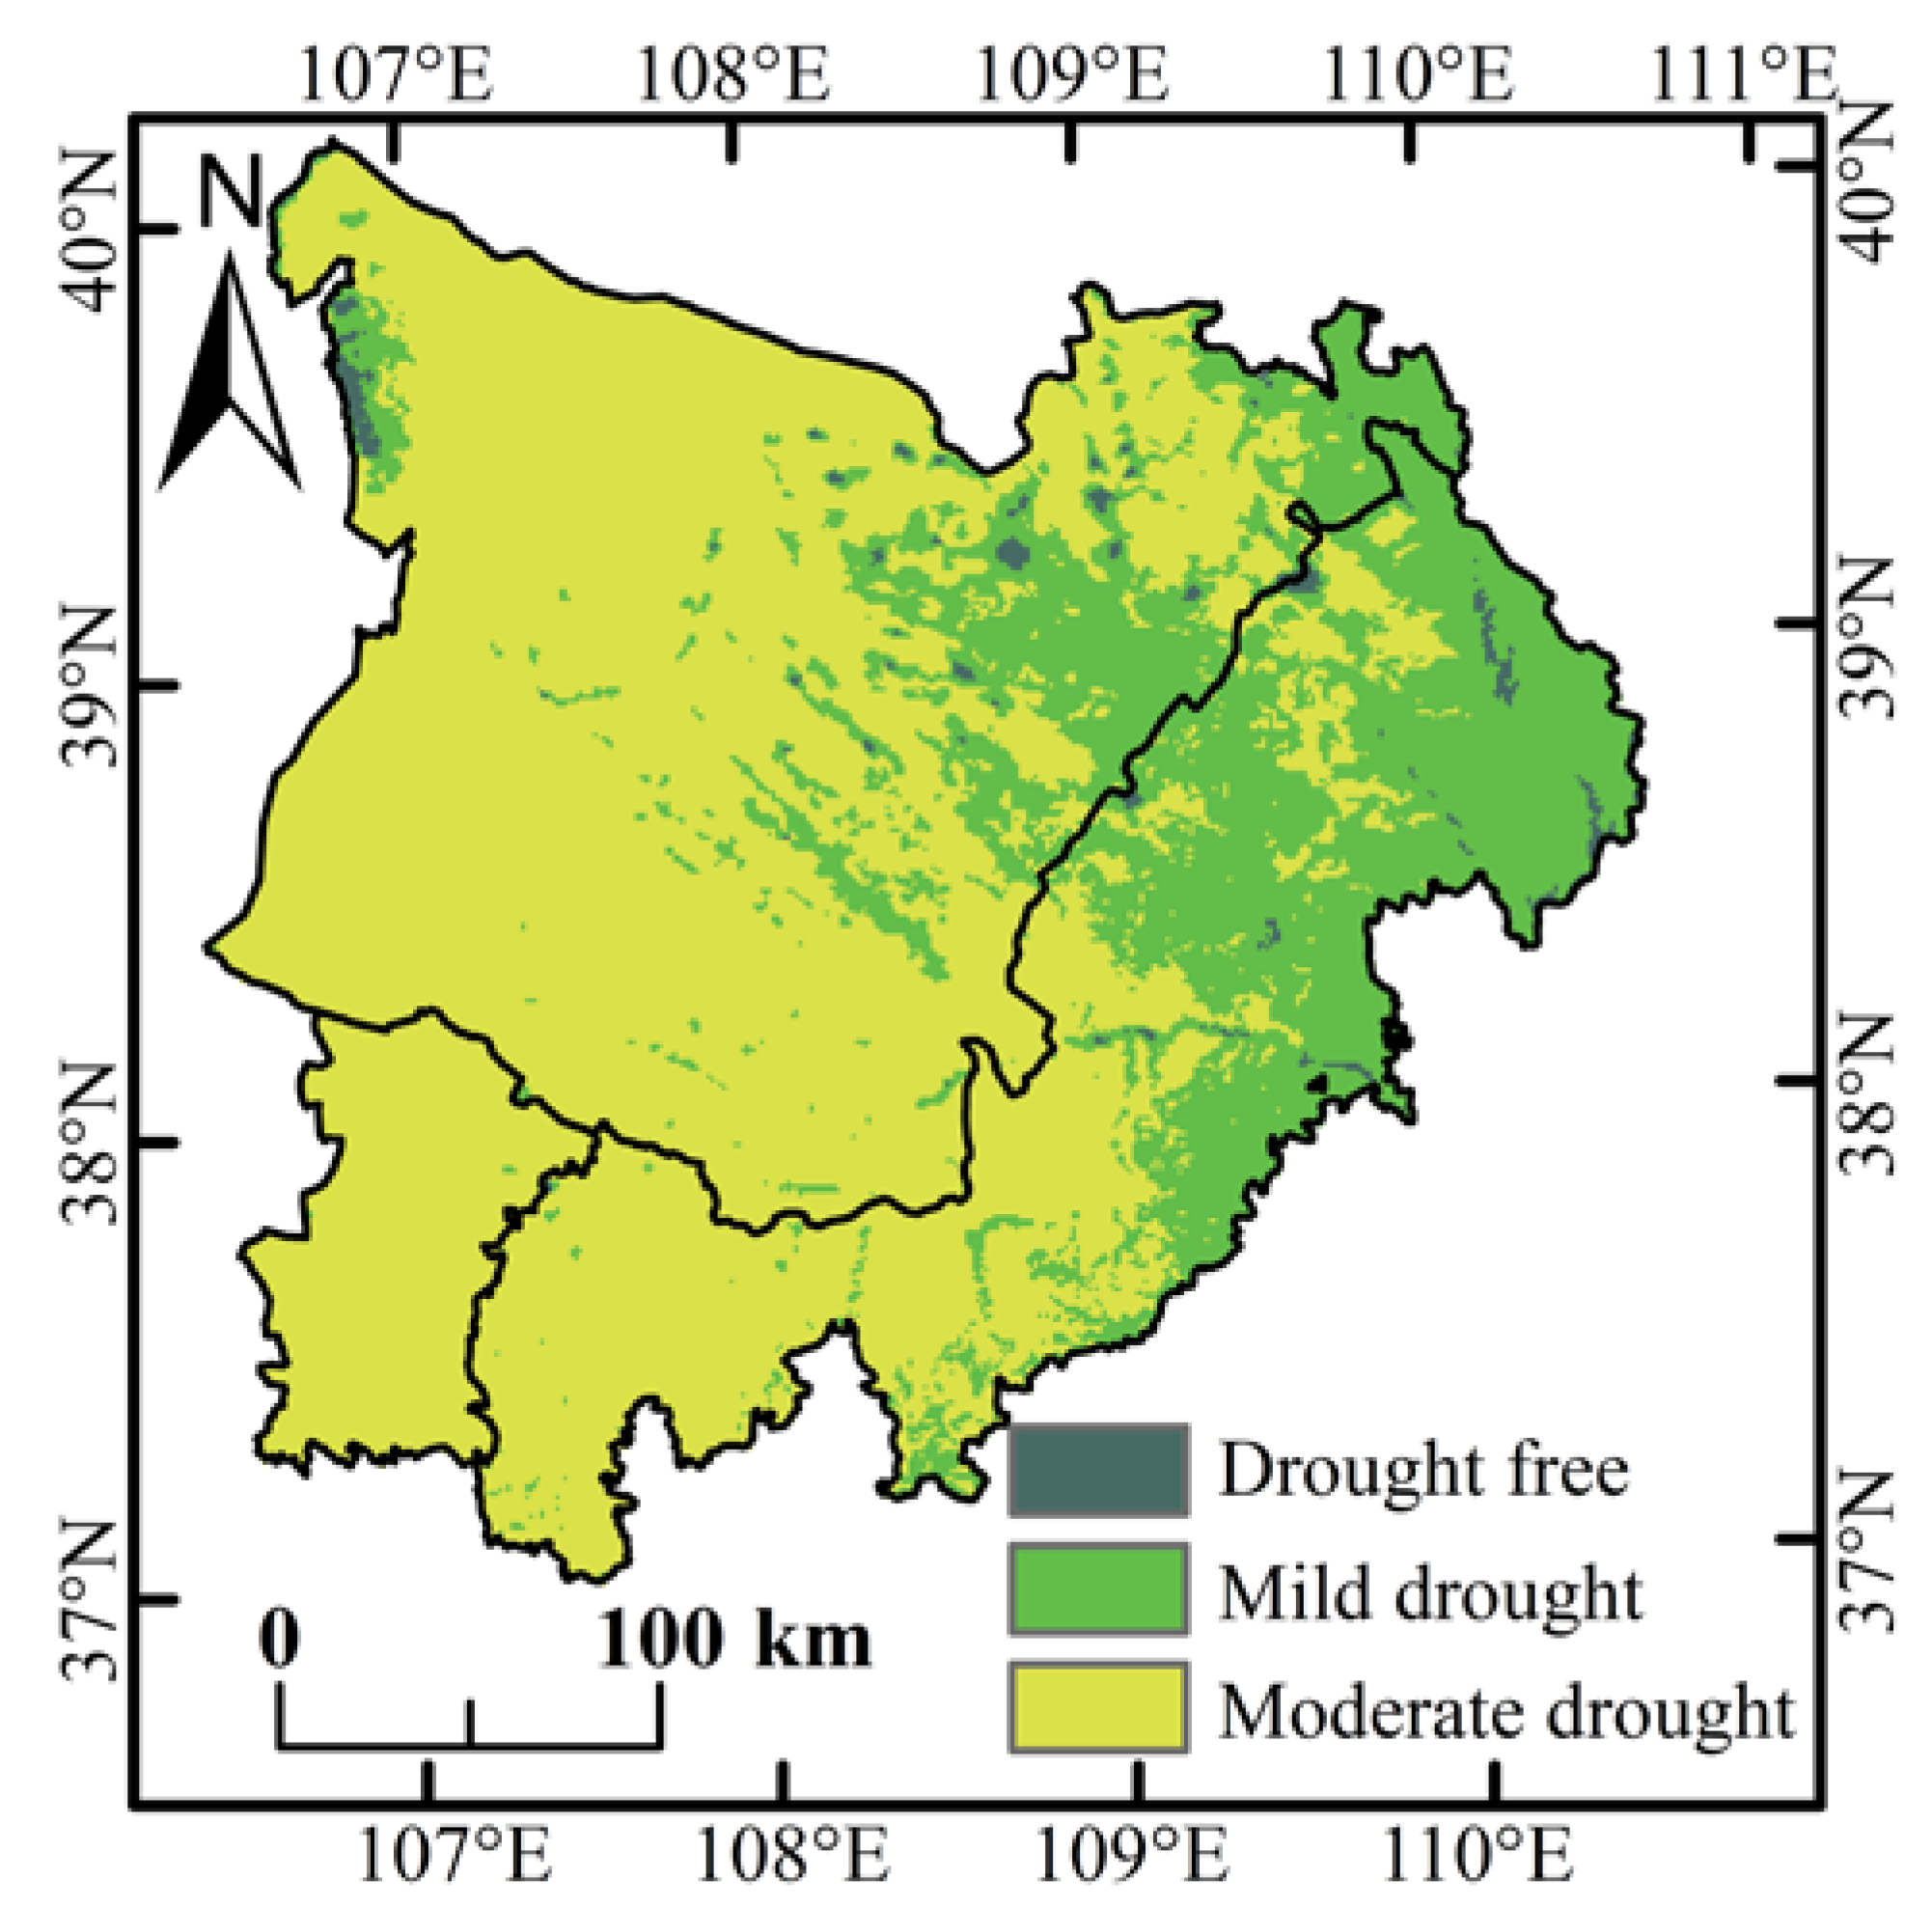
3.1. Drought Shifts through MUSL: Temporal and Spatial Features
3.2. Trend Analysis of TVDI Changes in MUSL
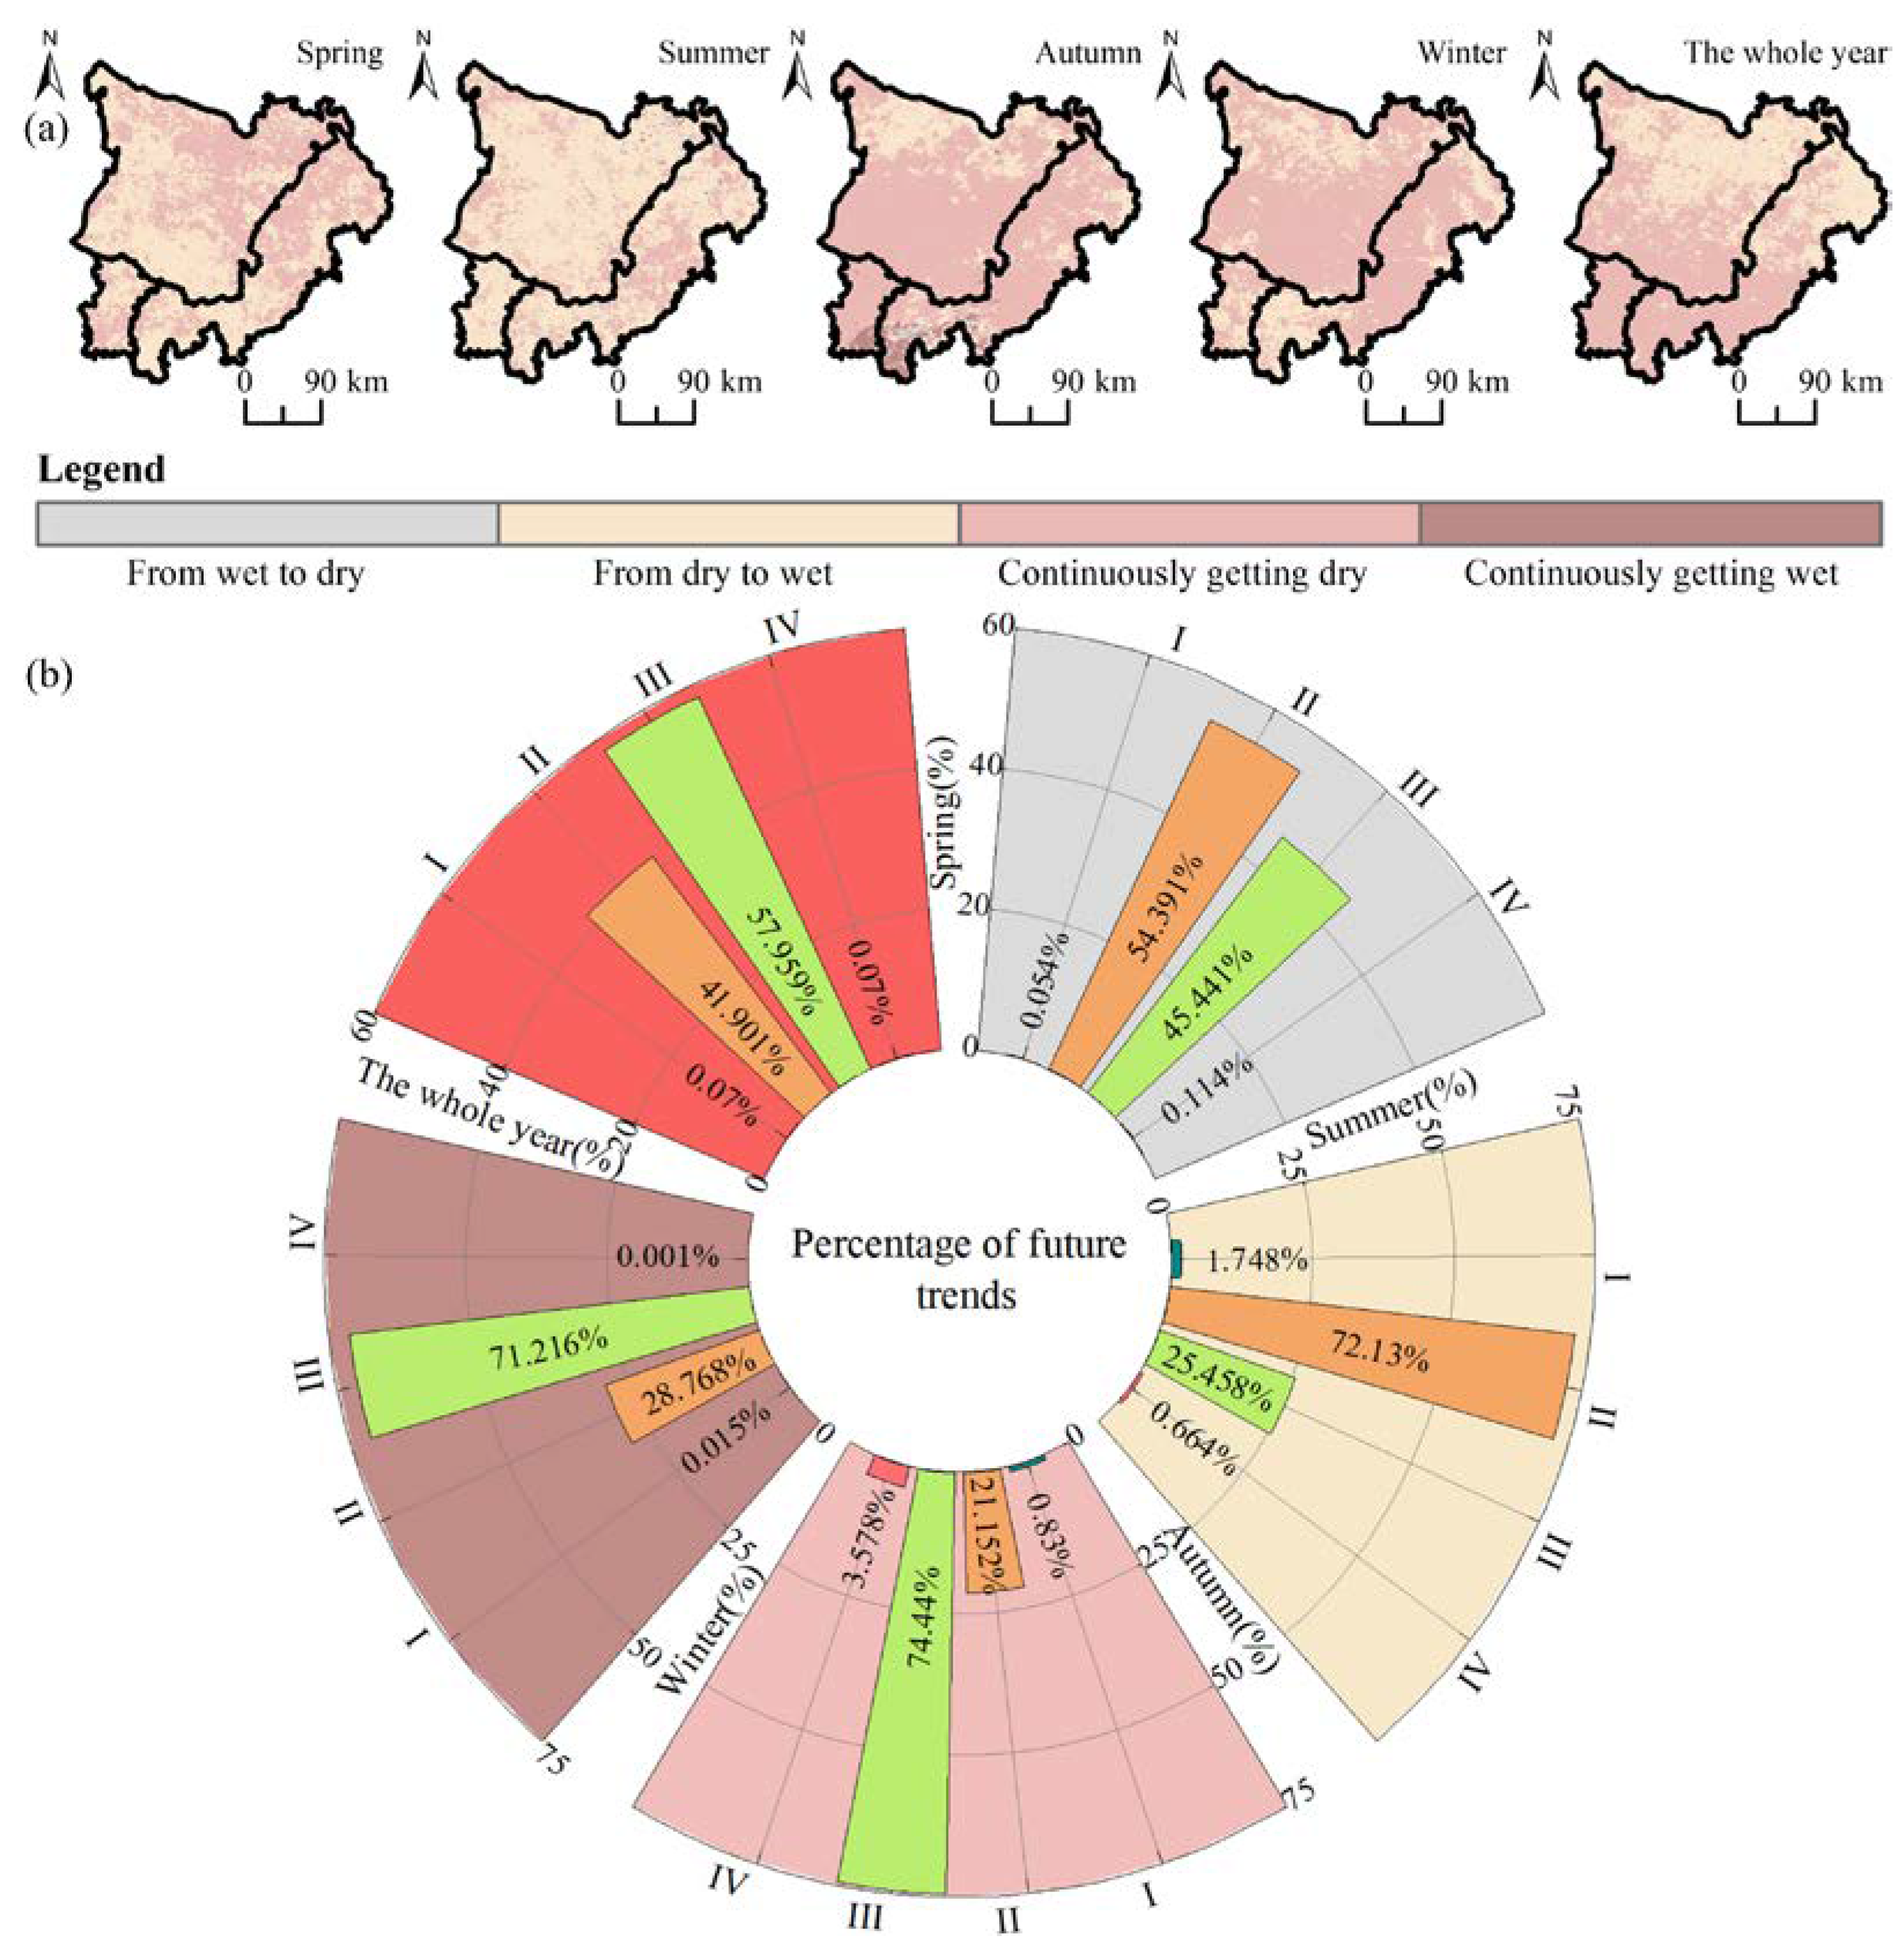
3.3. Analysis of Future Continuing Trends in TVDI in MUSL
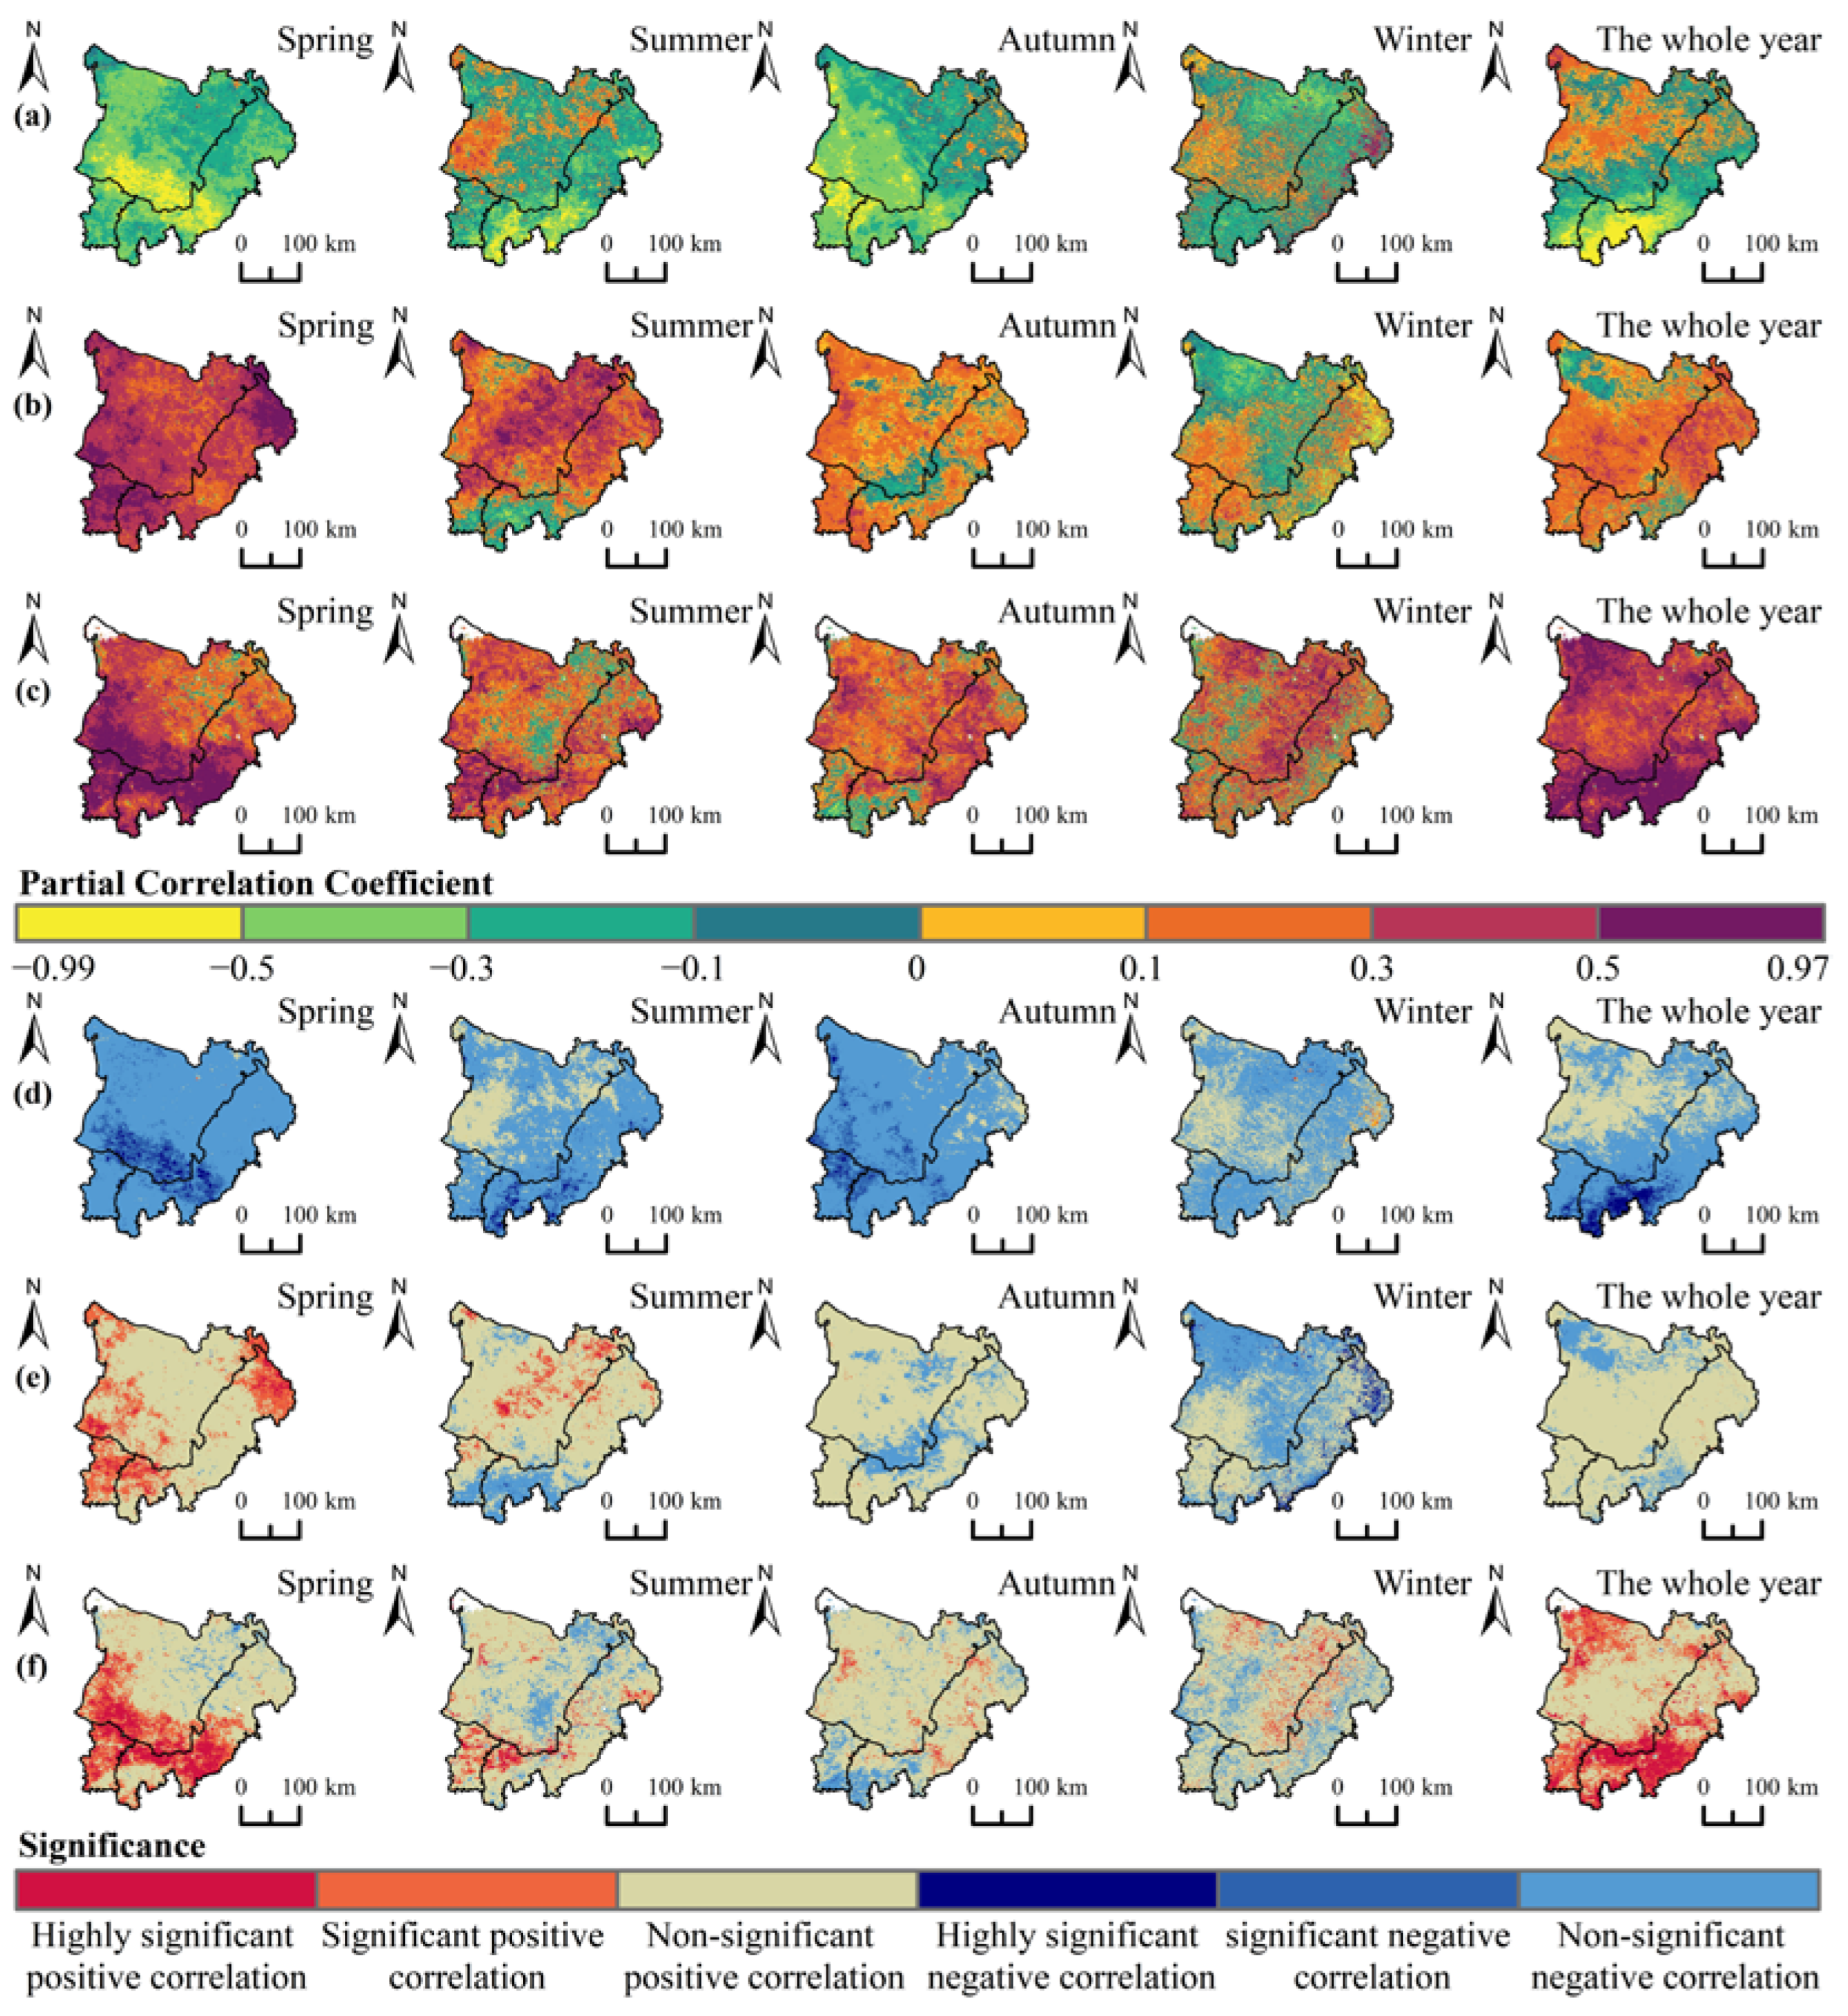
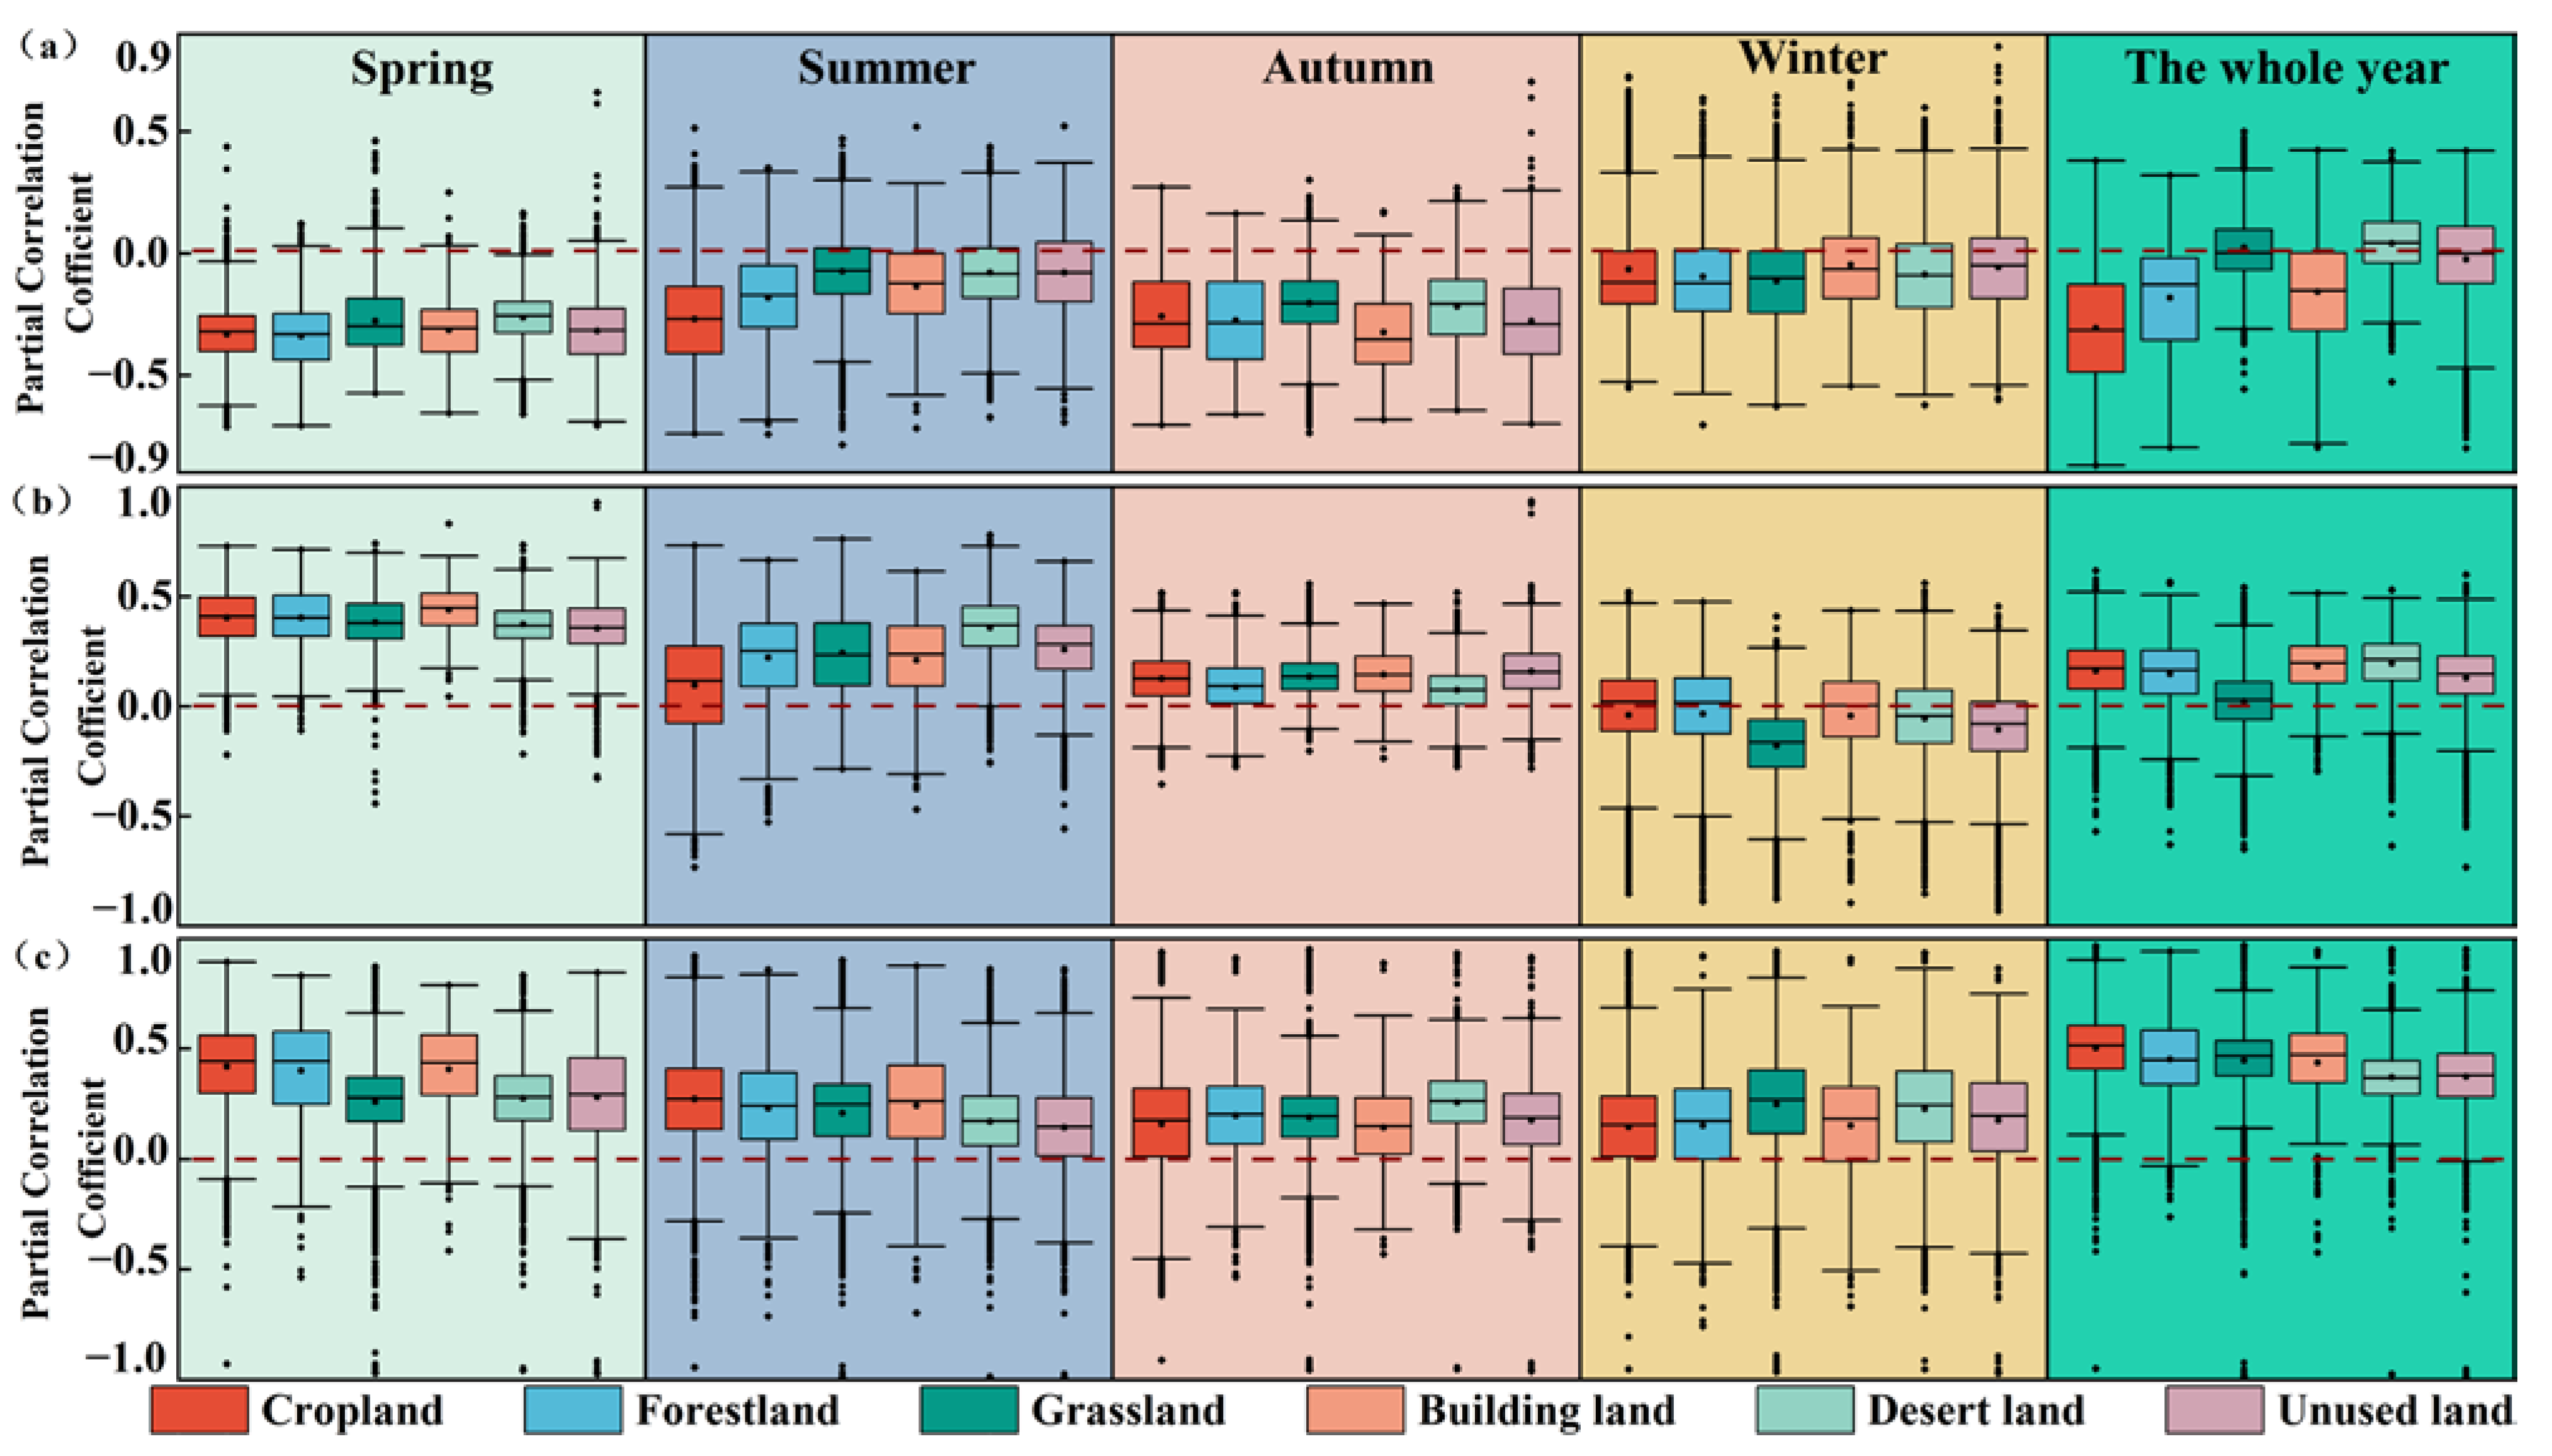
3.4. Response of Drought to Changes in Temperature, Precipitation, and ET
3.5. Lag Analysis of Temperature, Precipitation, and ET in Annual Drought and Different Seasons
4. Discussion
5. Conclusions
- (1)
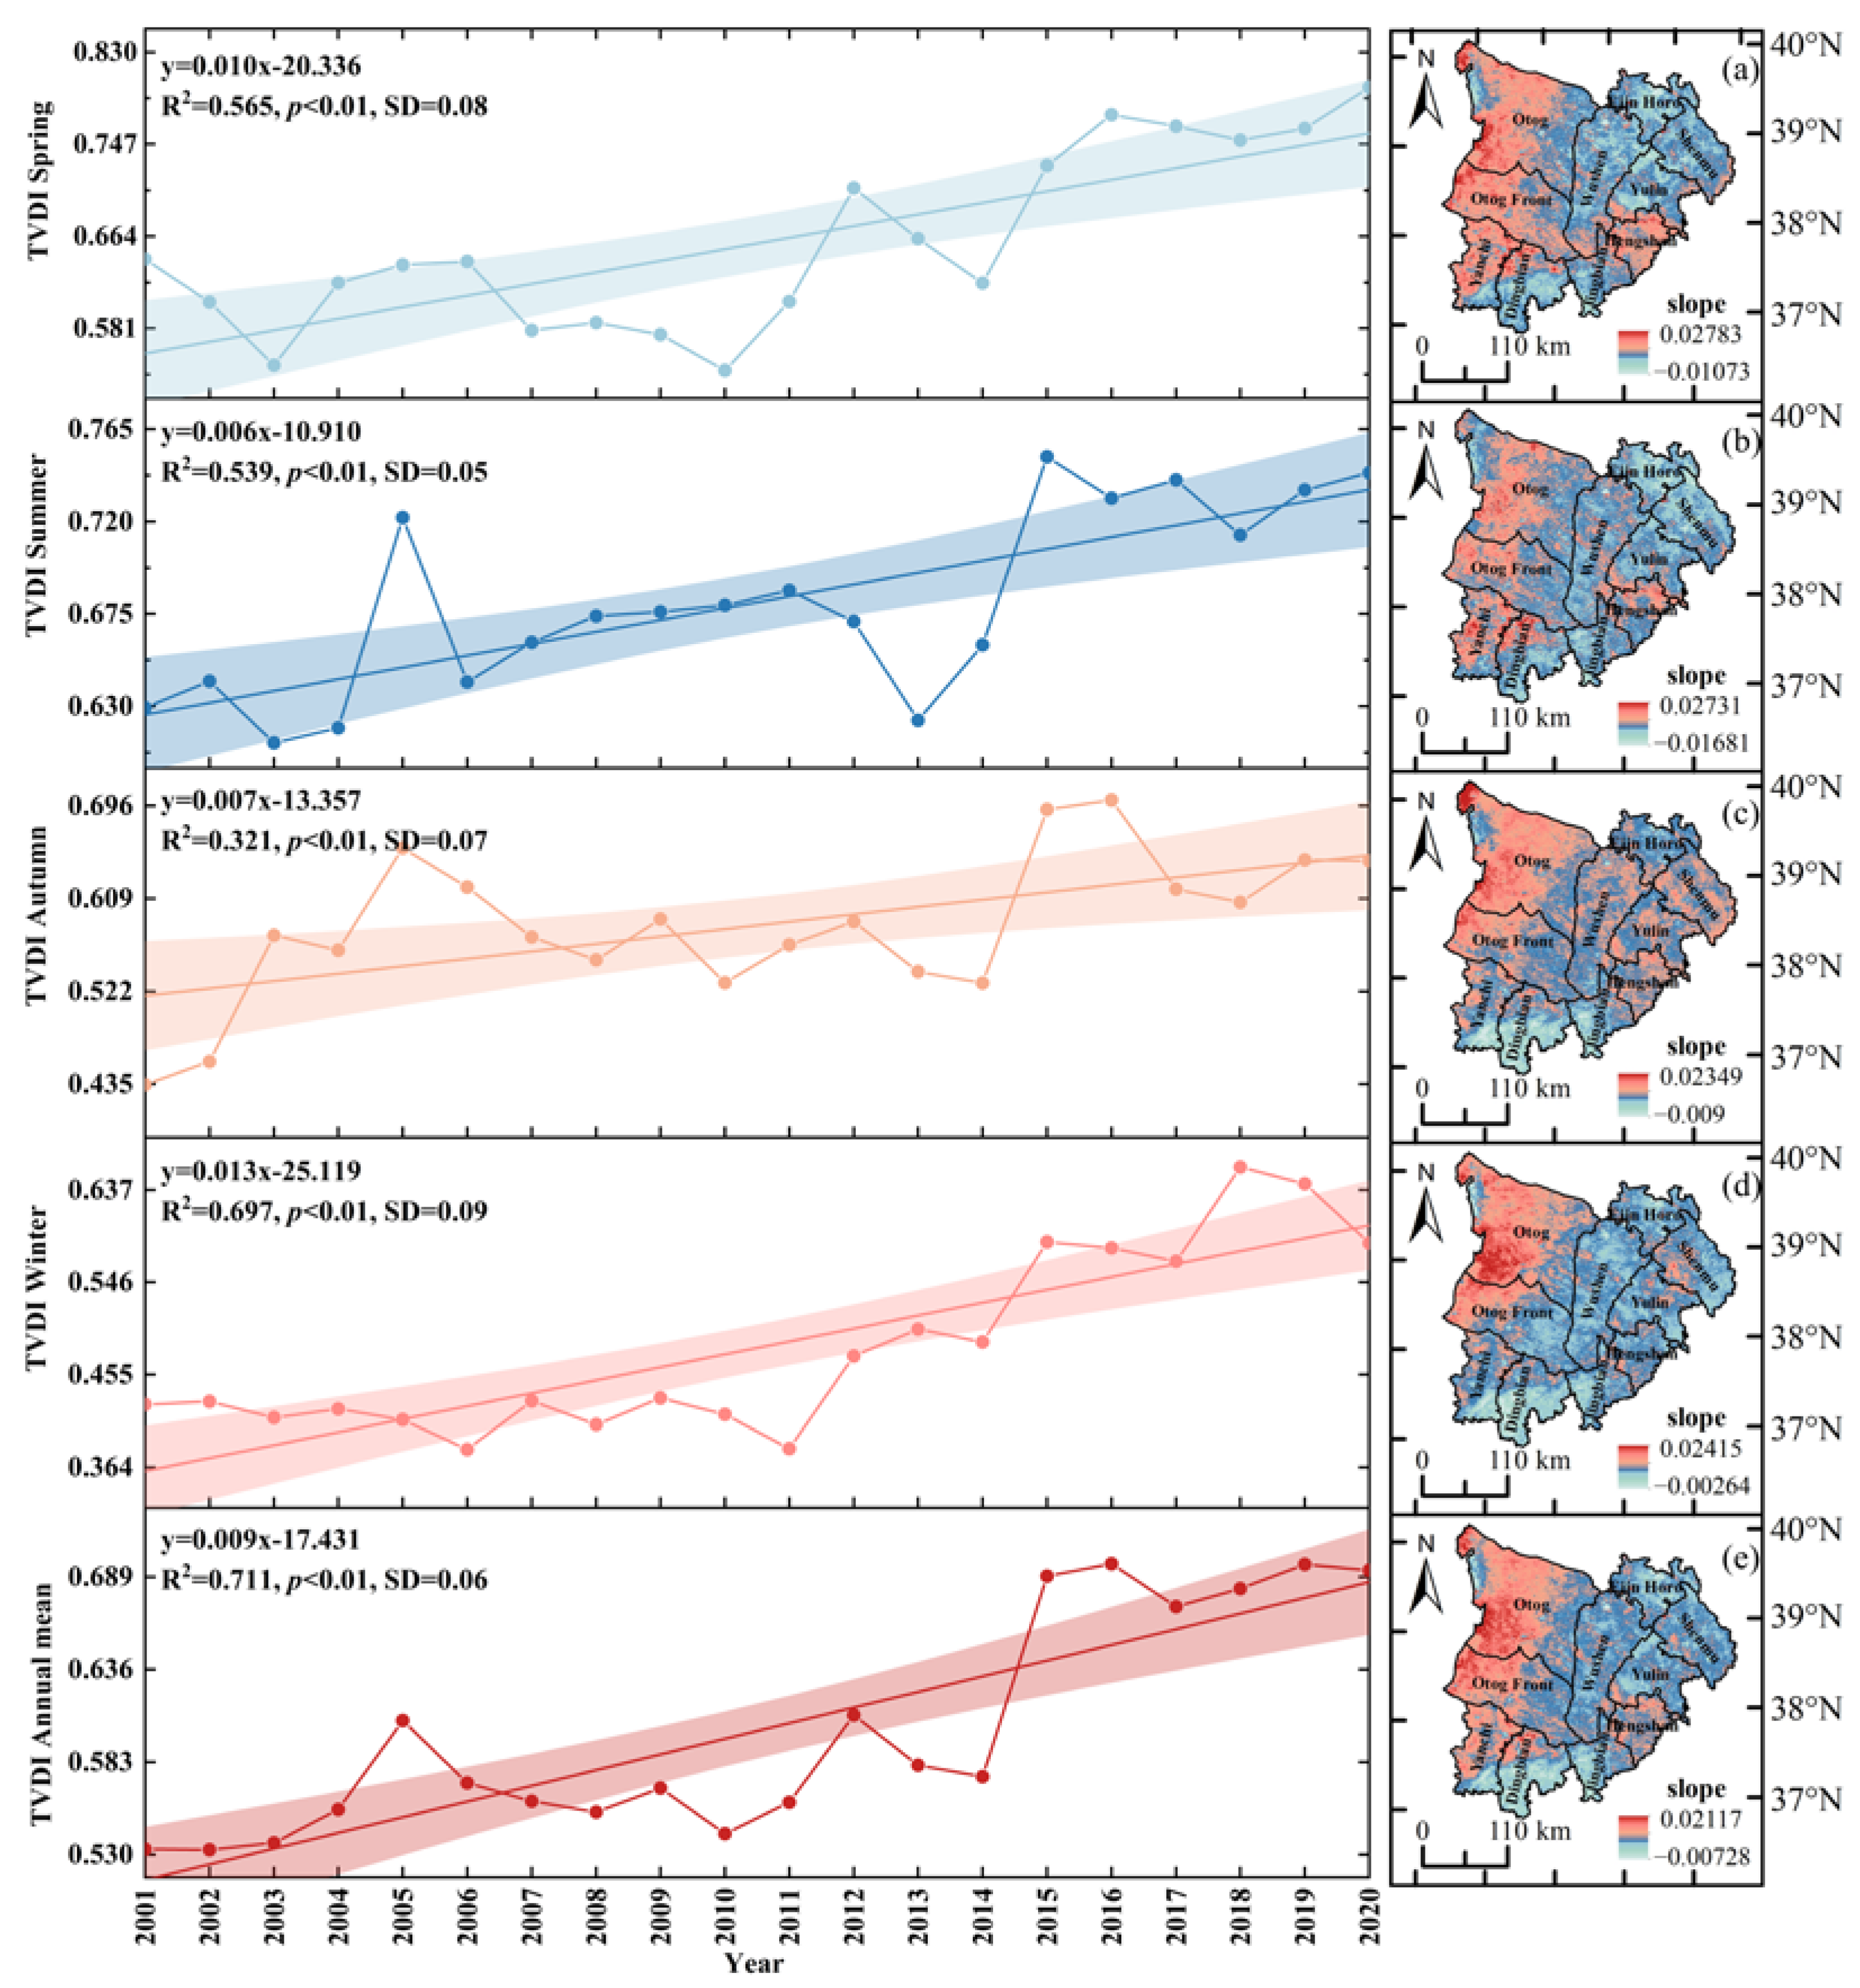
- From 2001 to 2020, TVDI (mean value 0.6) was greater for its west and smaller for its east. Drought severity varies by season, with the order being spring > summer > autumn > winter. Summer had the lowest growth rate (0.006/a, R2 = 0.539), while winter exhibited the highest (0.013/a, R2 = 0.697).
- (2)
- A significant drying trend dominated in autumn (Z = 1.99), and a highly significant drying trend prevailed in the remaining three seasons (Z average = 2.95) and the whole year (Z = 3.47). The minimum value (0.36 in summer) and maximum value (0.36 in autumn and the whole year) of the Hurst index are located in Yanchi County, and the future drought mitigation area is expected to be in central Ordos and Shenmu City. Spring and summer are mainly dry to wet, whereas autumn and winter are mainly continuous dry.
- (3)
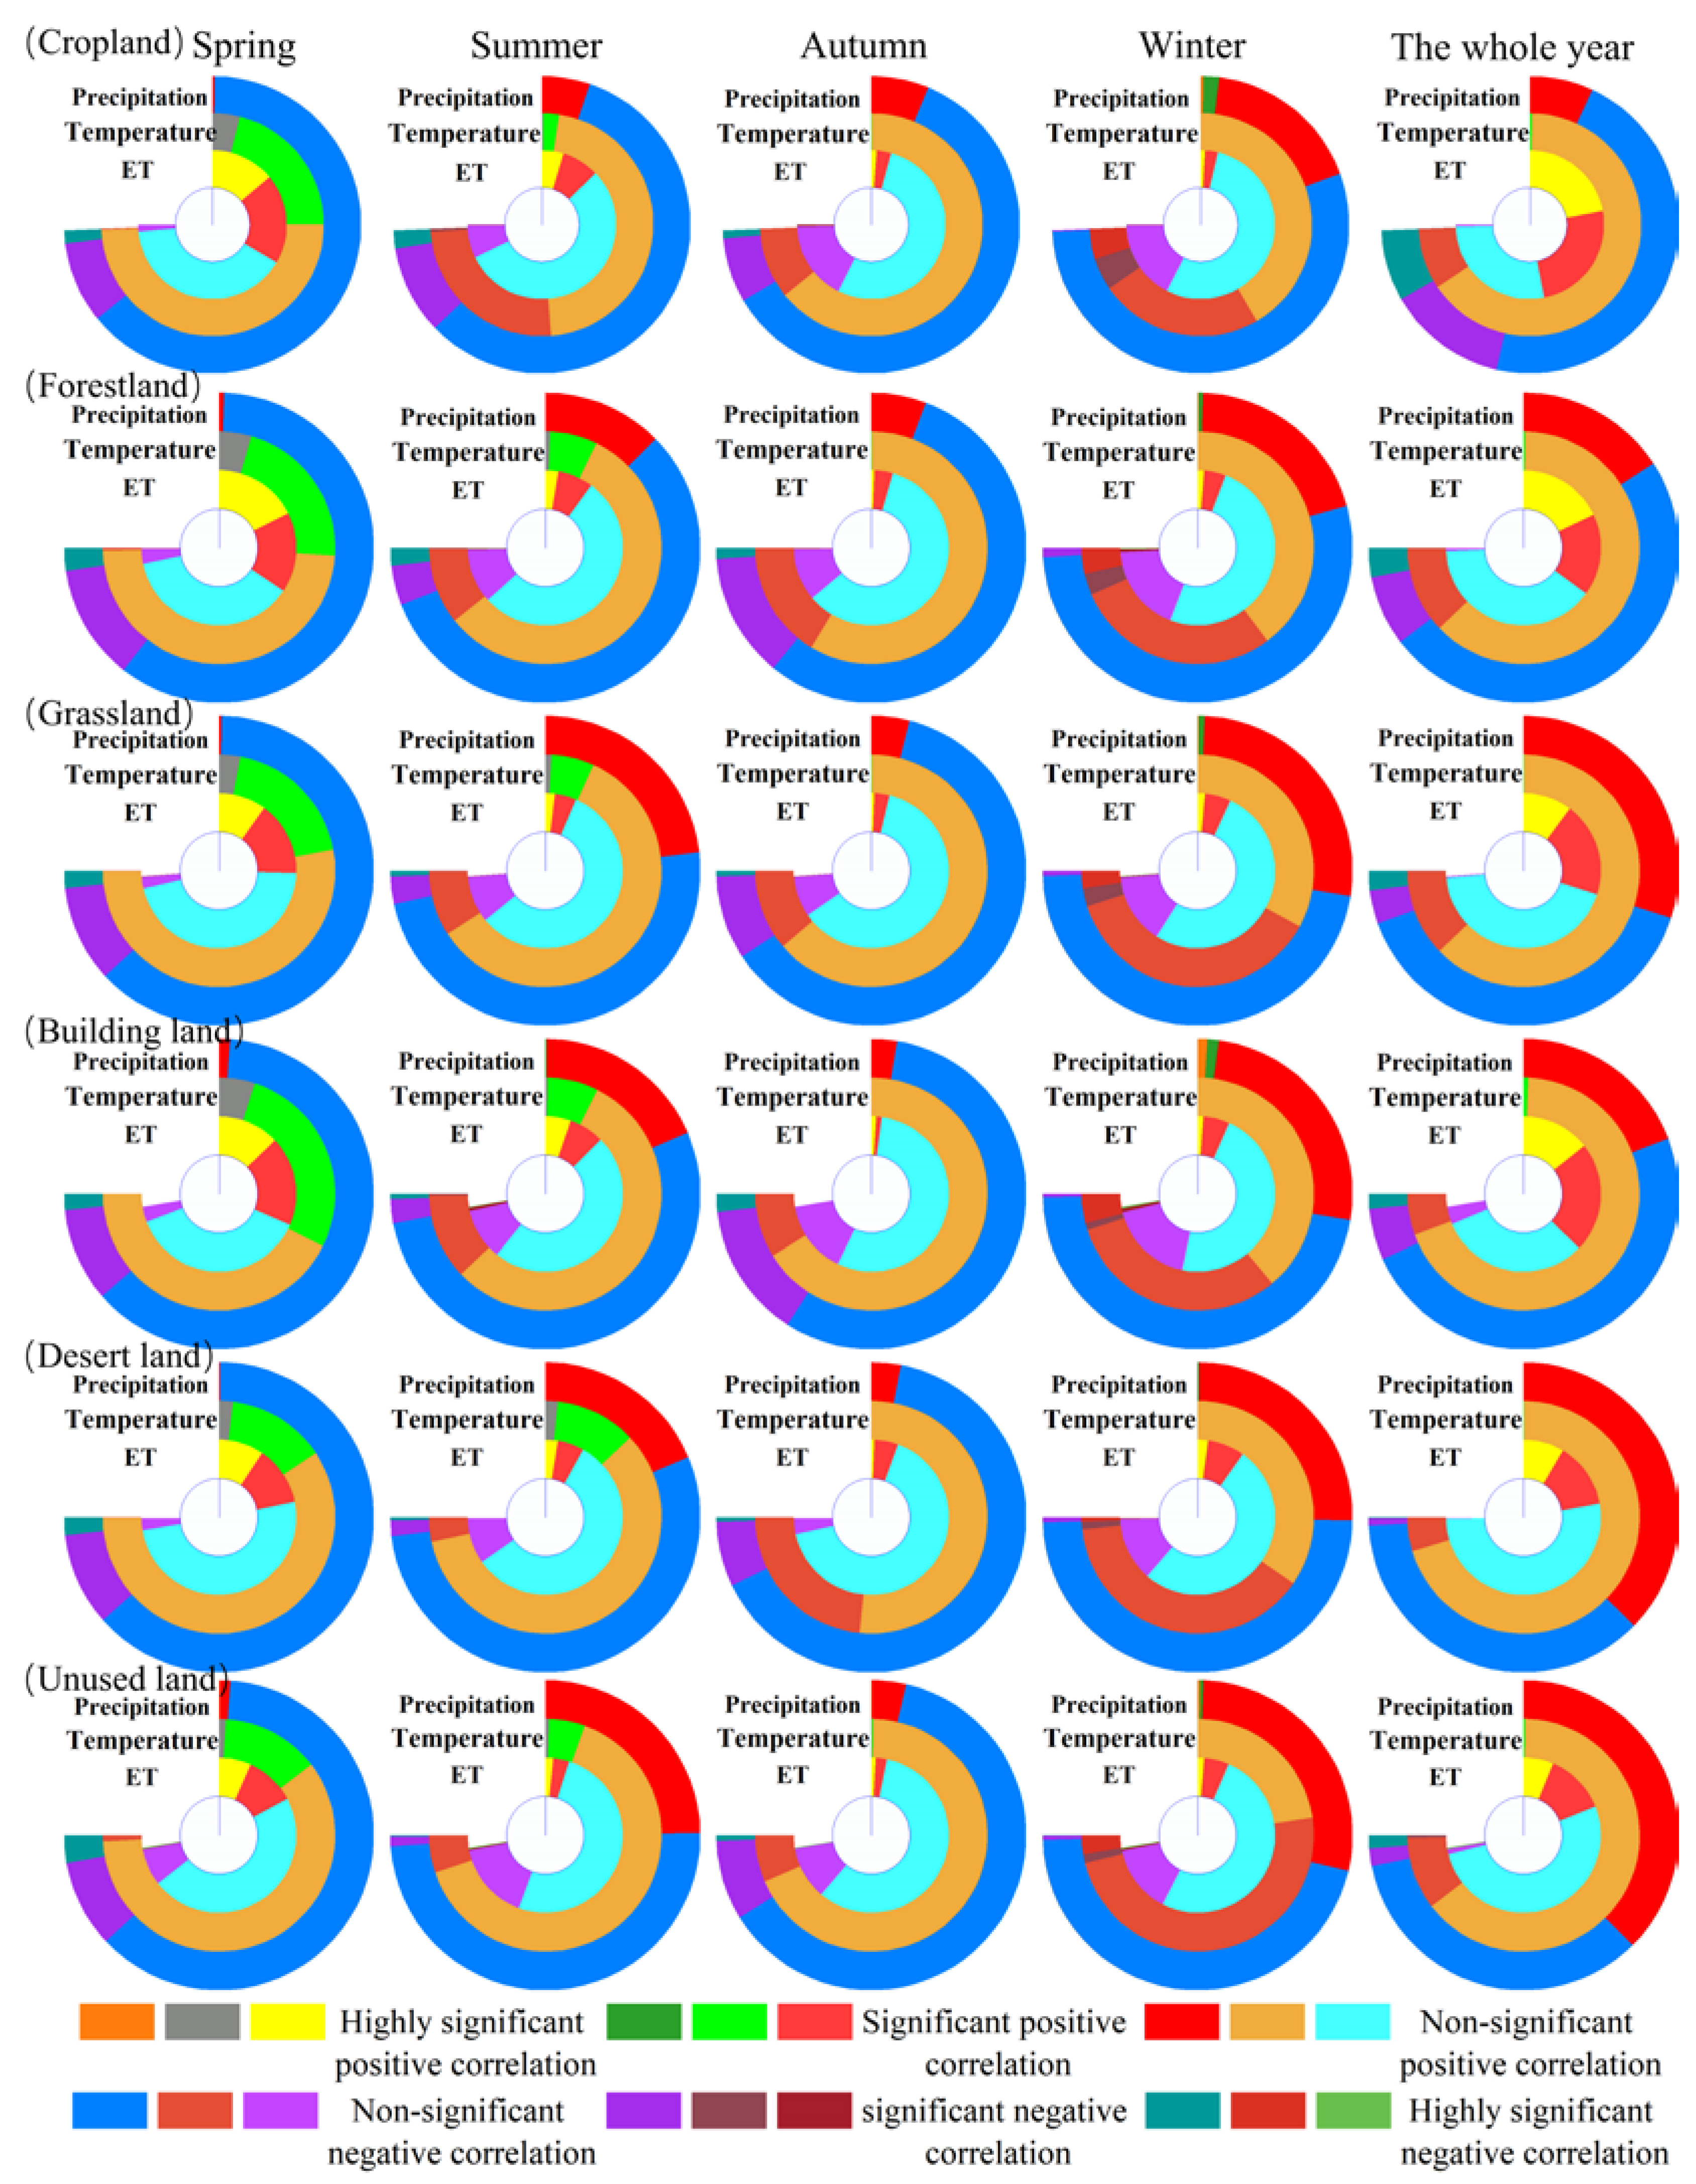
- The TVDI of the whole year and the four seasons (−0.07) was mainly negatively correlated with precipitation. During spring, summer, and fall, TVDI exhibited a favorable correlation with temperature and ET, while in winter, it had an inverse relationship with temperature (−0.06) and a positive correlation with ET (0.18). TVDI was predominantly non-significantly negatively correlated with precipitation for all land use types in all seasons. Land use type and temperature were predominantly non-significantly positively correlated in spring, summer, autumn, and throughout the whole year. Different land types and ET were predominantly non-significantly positively correlated in all four seasons and throughout the whole year.
- (4)
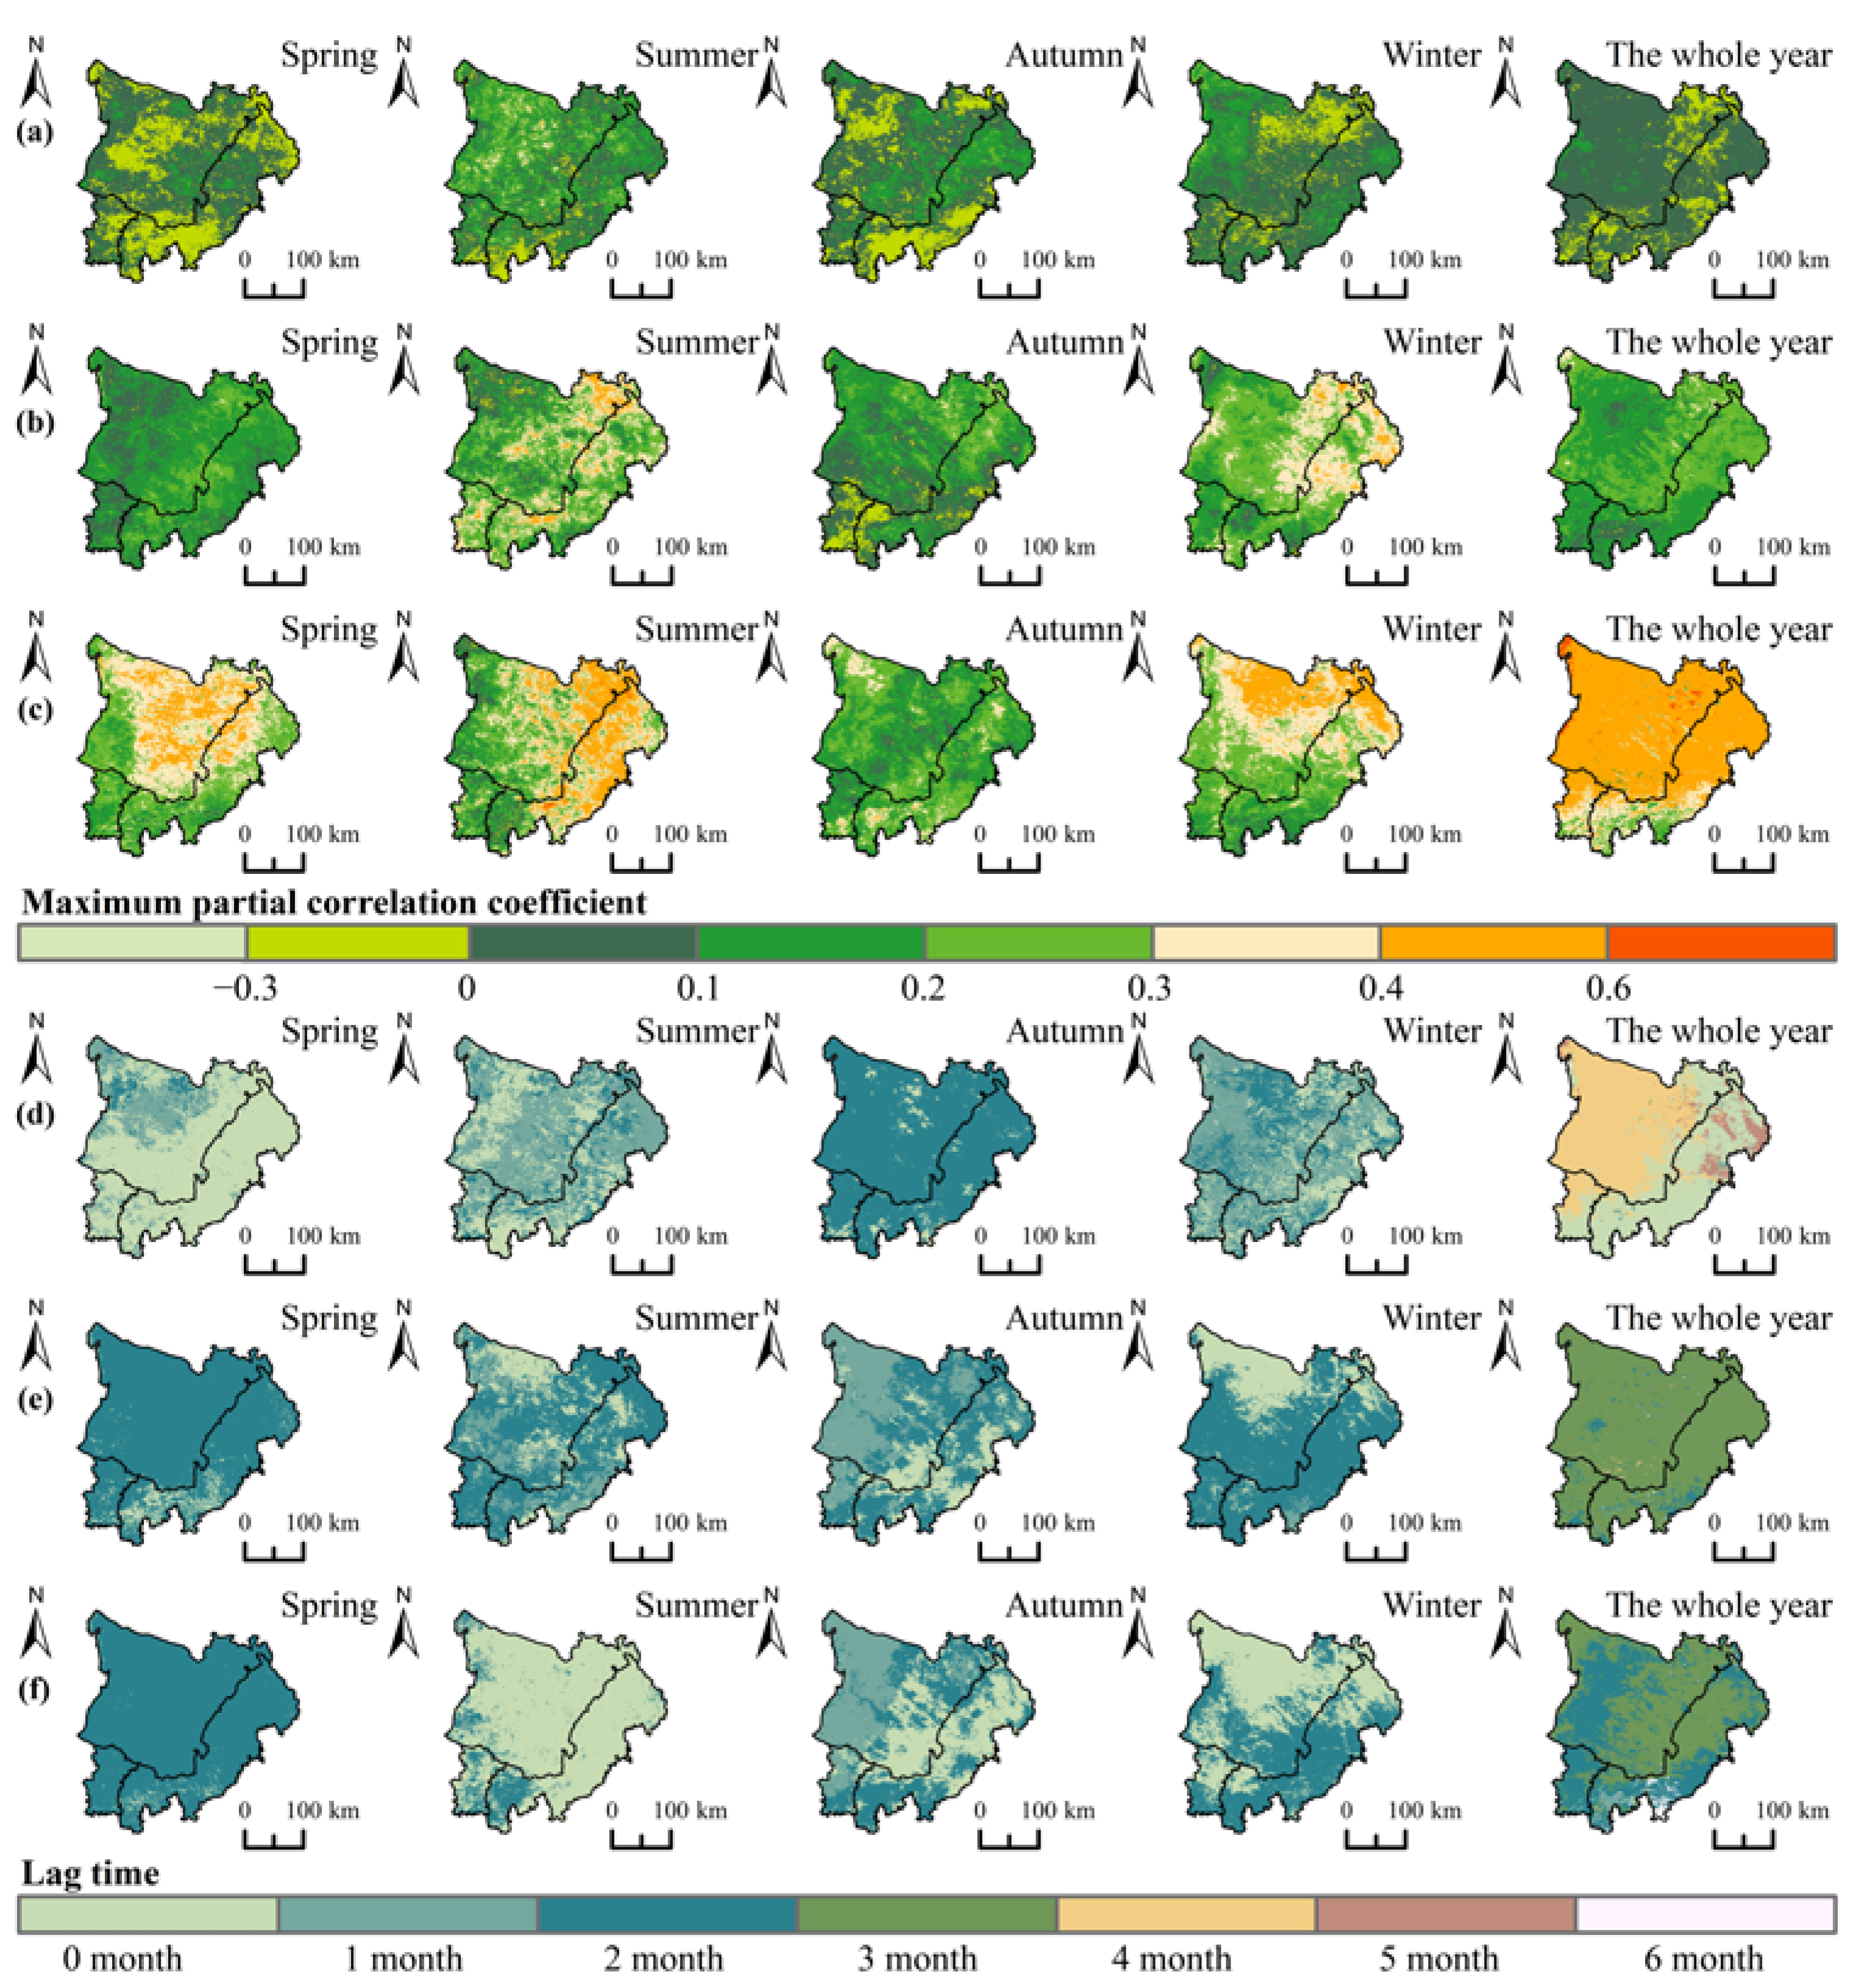
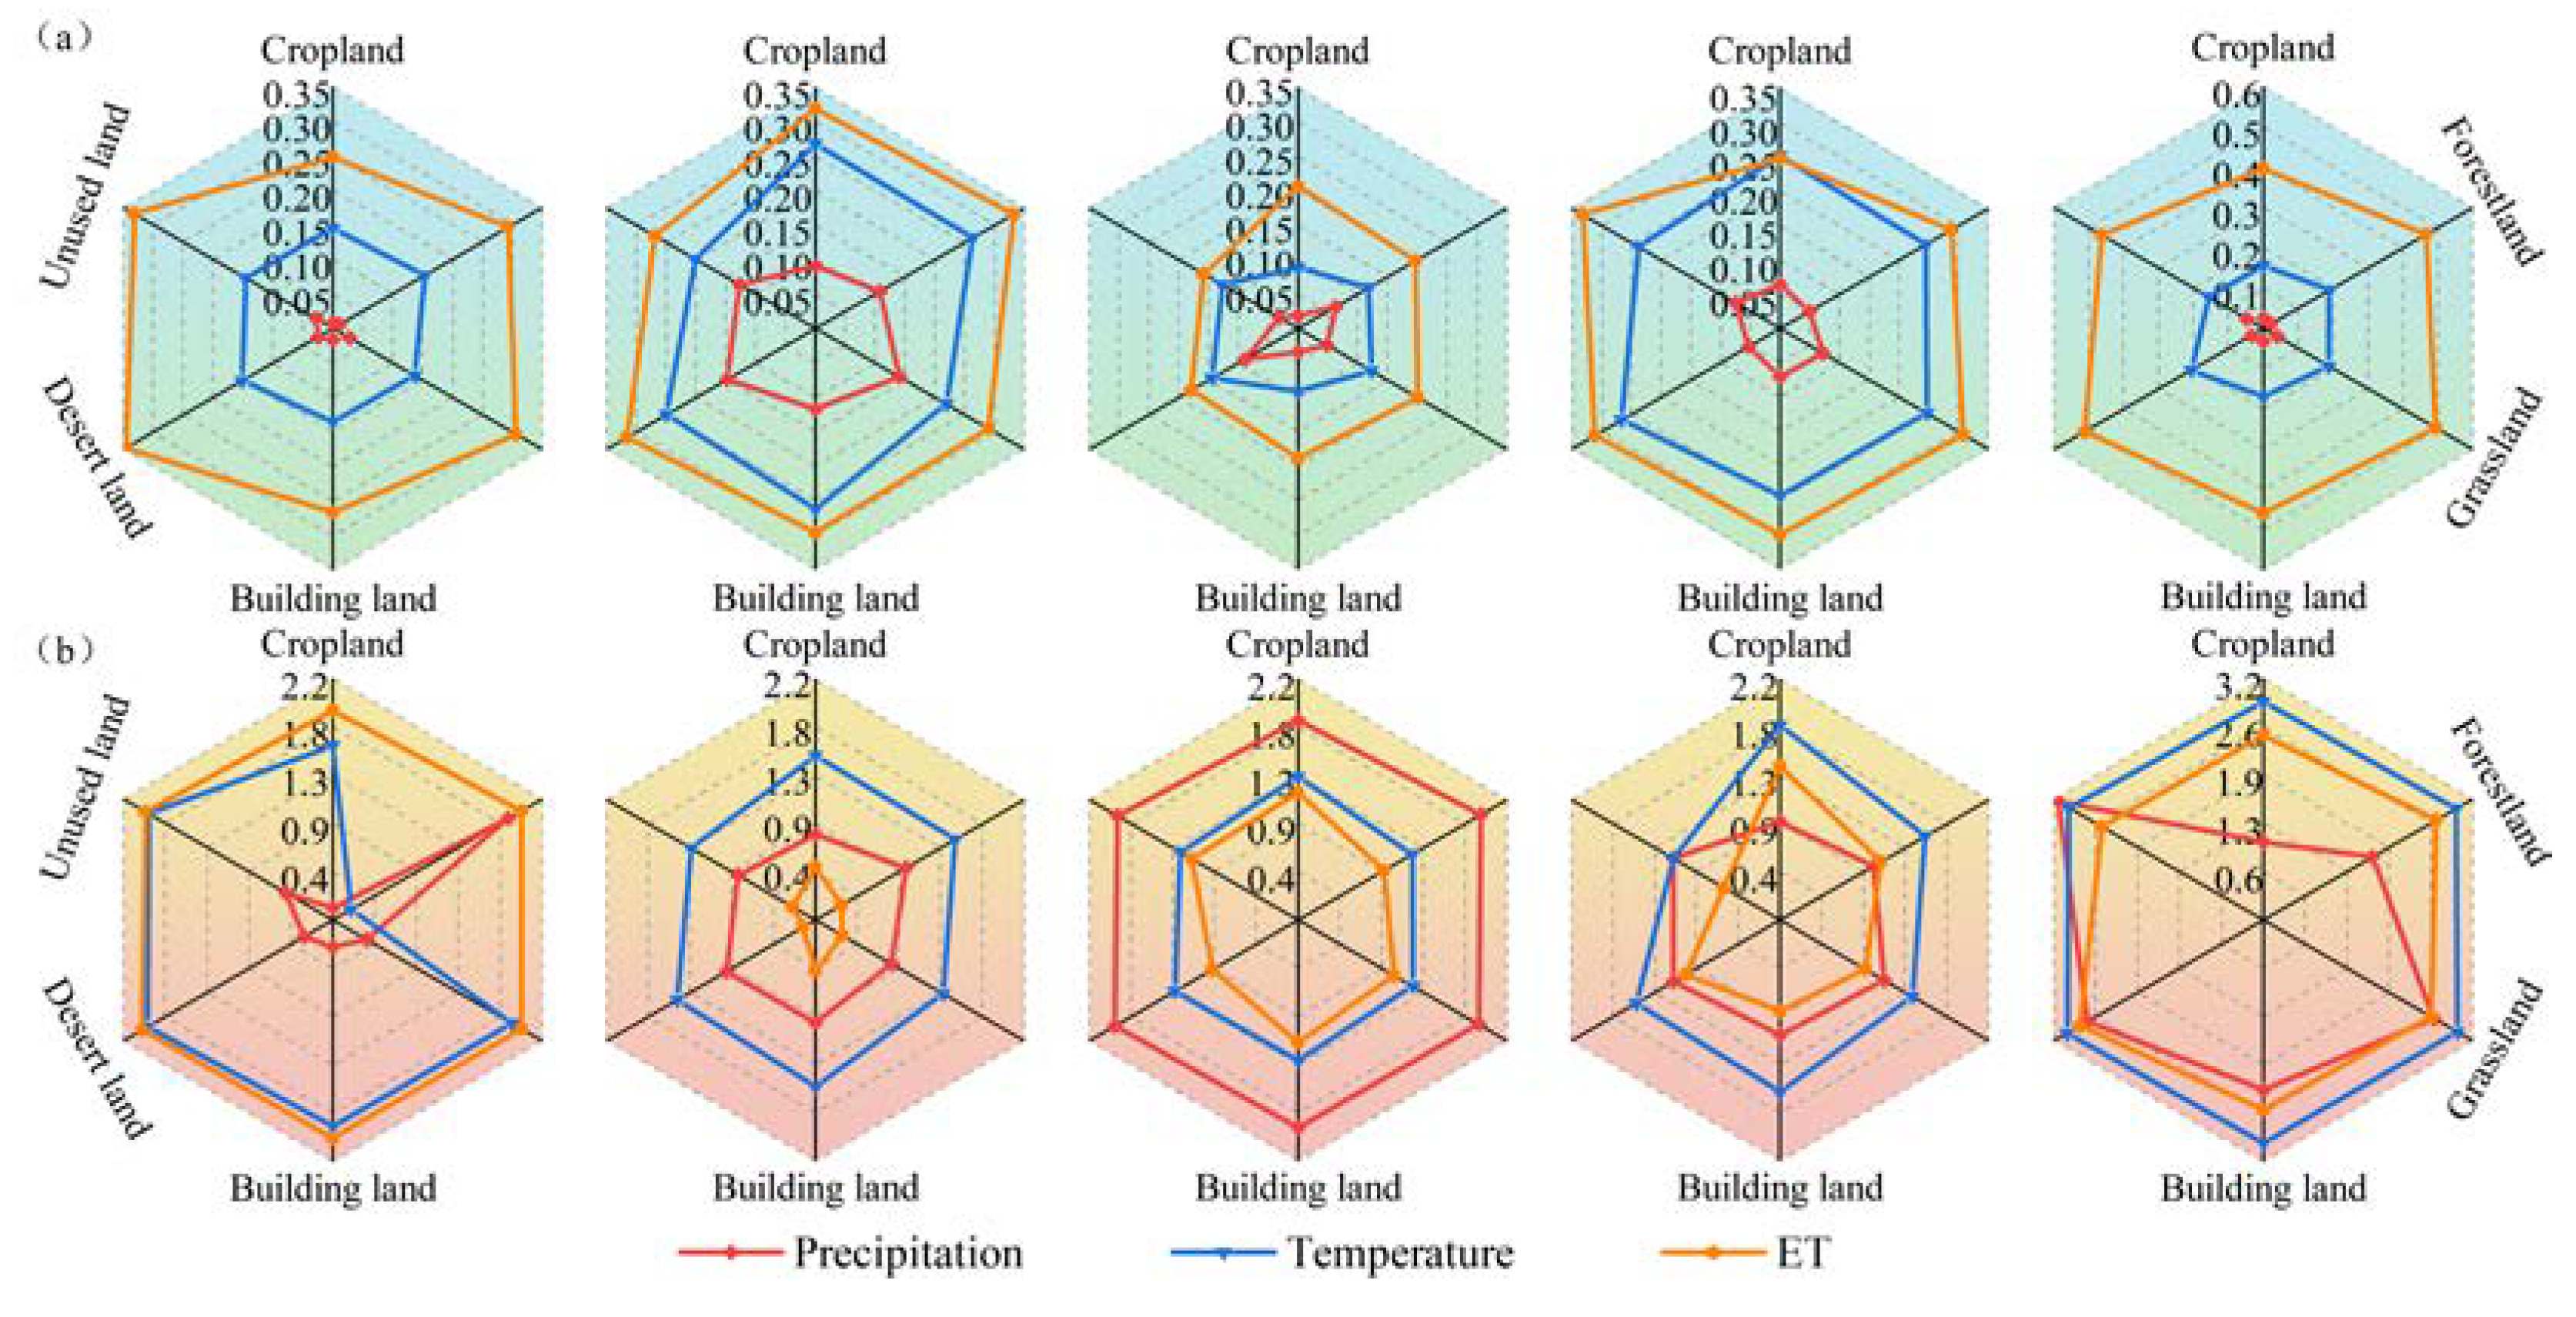
- On the seasonal scale, spring TVDI was most sensitive to precipitation (0.3 months) and slow to respond to temperature (1.8 months) and ET (2 months). The standard deviation of the lag time of TVDI for temperature (0.8) and ET (1.1) was greater in autumn than in spring (0.4). Annually, precipitation was the most contributing element of cropland, forestland, building land, and desert land (2.6 months); ET has the strongest impact on grassland and unused land; desert land has the weakest sensitivity to temperature (3 months).
Author Contributions
Funding
Informed Consent Statement
Data Availability Statement
Acknowledgments
Conflicts of Interest
References
- Liu, Y.; Huang, S.; Fang, W.; Ma, L.; Zheng, X.; Huang, Q. Propagation and dynamic change of meteorological drought to hydrological drought in different seasons. J. Hydraul. Eng. 2021, 52, 93–102. [Google Scholar] [CrossRef]
- Gao, Y.; Markkanen, T.; Thum, T.; Aurela, M.; Lohila, A.; Mammarella, I.; Kämäräinen, M.; Hagemann, S.; Aalto, T. Assessing various drought indicators in representing summer drought in boreal forests in Finland. Hydrol. Earth Syst. Sci. 2016, 20, 175–191. [Google Scholar] [CrossRef]
- Li, Y.; Cheng, W.; Zuo, W.; Zhang, L. Agricultural vulnerability to drought in China’s agro-pastoral ecotone: A case study of Yulin City, Shaanxi Province. Chin. Geogr. Sci. 2023, 33, 934–945. [Google Scholar] [CrossRef]
- Yuan, Y.; Ye, X.; Liu, T.; Li, X. Spatio-temporal Charateristics of Integrated Drought in Poyang Lake Basin Based on Multi-source Remote Sensing Data. Res. Environ. Yangtze Basin. 2024, 33, 214–227. [Google Scholar]
- Chen, Y.; Sun, L.; Du, Y.; Han, W.; Hu, H. Progress and Prospect of Remote Sensing Monitoring on Agricultural Drought. Remote Sens. Inf. 2022, 37, 1–7. [Google Scholar] [CrossRef]
- Liu, X.; Guan, M.; Li, X.; Gu, C. Progress in Bibliometric-based Remote Sensing Drought Monitoring Research. J. Catastrophol. 2023, 39, 1–14. [Google Scholar]
- Wang, C.; Han, X.; Wang, H.; You, J. Responses of Vegetation in Mu Us Sandy Land to Climate Change from 1982 to 2020. For. Grassl Resour Res. 2023, 137, 80–89. [Google Scholar] [CrossRef]
- Fang, X.; Liu, X.; Yue, D. Analysis of Climate Change Characteristics and Influencing Factors in Mu Us Sandy Land from 1960 to 2018. Res. Soil Water Conserv. 2022, 29, 163–169. [Google Scholar] [CrossRef]
- Xu, Z.; Lu, H. Aeolian environmental change studies in the Mu Us Sandy Land, north-central China: Theory and recent progress. Acta Geogr. Sin. 2021, 76, 2203–2223. [Google Scholar] [CrossRef]
- Lian, H.; Han, X.; Liu, Y.; Han, Y.; Yang, W.; Xiong, W. Study on spatiotemporal characteristics of atmospheric drought from 1981 to 2020 in the Mu Us Sandy Land of China based on SPEI index. J. Desert Res. 2022, 42, 71–80. [Google Scholar]
- Shi, L.; Li, H.; Zhao, Y.; Ren, Y.; He, J.; Yu, F.; Hasi, E. Benefit evaluation of wind prevention and sand fixation under the combined measures of sand barrier in mobile dunes in Mu Us sandy land. Arid Zone Res. 2023, 40, 268–279. [Google Scholar] [CrossRef]
- Zhou, X.; Wang, P.; Tansey, K.; Zhang, S.; Li, H.; Wang, L. Developing a fused vegetation temperature condition index for drought monitoring at field scales using Sentinel-2 and MODIS imagery. Comput. Electron. Agric. 2020, 168, 105144. [Google Scholar] [CrossRef]
- Jackson, R.D.; Idso, S.; Reginato, R.; Pinter, P., Jr. Canopy temperature as a crop water stress indicator. Water Resour. Res. 1981, 17, 1133–1138. [Google Scholar] [CrossRef]
- Liu, S.; Pan, X.; Yang, Y.; Yuan, J.; Yang, Z.; Wang, Z.; Xie, W.; Song, H. A Crop water stress index based on Remote Sensing methods for monitoring drought in an Arid area. Remote Sens. Lett. 2023, 14, 890–900. [Google Scholar] [CrossRef]
- Tang, S.; Zhang, X.; Chen, N. Adaptability analysis of drought index in soil moisture monitoring. Sci. Surv. Map. 2021, 46, 114–119. [Google Scholar] [CrossRef]
- Wei, W.; Yan, P.; Zhou, L.; Zhang, H.; Xie, B.; Zhou, J. A comprehensive drought index based on spatial principal component analysis and its application in northern China. Environ. Monit. Assess. 2024, 196, 193. [Google Scholar] [CrossRef]
- Qin, Y. Comprehensive Drought Monitoring Based on SPEI and TVDI in Inner Mongolia, China. Master’s Dissertation, Chengdu University of Technology, Chengdu, China, 2020. [Google Scholar] [CrossRef]
- Zhao, G.; Li, X.; Li, B. An Overview on Agricultural Drought Montoring Methods Based on Land Surface Temperature and Vegetation Index Feature Space. Res. Soil. Water Conserv. 2010, 17, 245–250. [Google Scholar]
- Sandholt, I.; Rasmussen, K.; Andersen, J. A simple interpretation of the surface temperature/vegetation index space for assessment of surface moisture status. Remote Sens. Environ. 2002, 79, 213–224. [Google Scholar] [CrossRef]
- Guo, Y.; Han, L.; Zhang, D.; Sun, G.; Fan, J.; Ren, X. The Factors Affecting the Quality of the Temperature Vegetation Dryness Index (TVDI) and the Spatial–Temporal Variations in Drought from 2011 to 2020 in Regions Affected by Climate Change. Sustainability 2023, 15, 11350. [Google Scholar] [CrossRef]
- Luo, B.; Liu, X.; Guo, P. Remote sensing drought monitoring of Hetao irrigation area based on MODIS data. J. China Agric. Univ. 2020, 25, 44–54. [Google Scholar] [CrossRef]
- Wang, Y.; Shi, H.; Jiang, Y.; Wu, Y.; Gao, Y.; Ding, C. Spatio-temporal Variation of Drought Characteristics and Its Influencing Factors in Loess Plateau Based on TVDI. Trans. Chin. Soc. Agric. Mach. 2023, 54, 184–195. [Google Scholar] [CrossRef]
- Fan, L.; Geng, B.; Wang, J.; Chen, J. Temporal and Spatial Dynamics of Drought and Its Response to Climate Change in the Loess Plateau from 2001 to 2020. Res. Soil Water Conserv. 2022, 29, 183–191. [Google Scholar] [CrossRef]
- Zhou, T.; Han, C.; Qiao, L.; Ren, C.; Wen, T.; Zhao, C. Seasonal dynamics of soil water content in the typical vegetation and its response to precipitation in a semi-arid area of Chinese Loess Plateau. J. Arid Land 2021, 13, 1015–1025. [Google Scholar] [CrossRef]
- Zhao, J.; Zhang, X.; Liao, C.; Bao, H. TVDI based Soil Moisture from Remotely Sensed Data over Large Arid Areas. Remote Sens. Technol. Appl. 2011, 26, 742–750. [Google Scholar]
- Carlson, T.; Gillies, R.; Perry, E. A method to make use of thermal infrared temperature and NDVI measurements to infer surface soil water content and fractional vegetation cover. Remote Sens. Rev. 1994, 9, 161–173. [Google Scholar] [CrossRef]
- Price, J. Using spatial context in satellite data to infer regional scale evapotranspiration. IEEE Trans. Geosci. Remote Sens. 1990, 28, 940–948. [Google Scholar] [CrossRef]
- Wu, L. Classification of drought grades based on temperature vegetation drought index using the MODIS data. Res. Soil Water Conserv. 2017, 24, 130–135+3. [Google Scholar] [CrossRef]
- Hoaglin, D.; Mosteller, F.; Tukey, J. Understanding Robust and Exploratory Data Analysis; John Wiley & Sons: Hoboken, NJ, USA, 2000; Volume 76. [Google Scholar]
- Zhao, N.; Zhao, Y.; Zou, H.; Bai, X.; Zhen, Z. Spatial and temporal trends and drivers of fractional vegetation cover in Heilongjiang Province, China during 1990–2020. Chin. J. Appl. Ecol. 2023, 34, 1320–1330. [Google Scholar] [CrossRef]
- Long, Y.; Jiang, F.; Deng, M.; Wang, T.; Sun, H. Spatial-temporal changes and driving factors of eco-environmental quality in the Three-North region of China. J. Arid Land 2023, 15, 231–252. [Google Scholar] [CrossRef]
- Wu, Y.; Yang, J.; Li, S.; Guo, C.; Yang, X.; Xu, Y.; Yue, F.; Peng, H.; Chen, Y.; Gu, L.; et al. NDVI-Based Vegetation Dynamics and Their Responses to Climate Change and Human Activities from 2000 to 2020 in Miaoling Karst Mountain Area, SW China. Land 2023, 12, 1267. [Google Scholar] [CrossRef]
- Hua, Y.; Gao, R.; Ao, D. Temporal Lag of Desert Steppe Vegetation Growth Response to Climate Factors in Inner Mongolia. J. Northwest For. Univ. 2021, 36, 1–10. [Google Scholar]
- Wang, X.; Song, J.; Xiao, Z.; Wang, J.; Hu, F. Desertification in the Mu Us Sandy Land in China: Response to climate change and human activity from 2000 to 2020. Geogr. Sustain. 2022, 3, 177–189. [Google Scholar] [CrossRef]
- Liu, Q.; Zhang, Q.; Yan, Y.; Zhang, X.; Niu, J.; Svenning, J. Ecological restoration is the dominant driver of the recent reversal of desertification in the Mu Us Desert (China). J. Clean. Prod. 2020, 268, 122241. [Google Scholar] [CrossRef]
- Yang, L.; Li, Y.; Fan, H.; Wang, Y. Temporal and spatial distribution and influencing factors of evapotranspiration in Mu Us Sandy Land. J. Agric. Sci. Technol. 2022, 24, 169–178. [Google Scholar] [CrossRef]
- Li, C.; Fu, B.; Wang, S.; Stringer, L.C.; Wang, Y.; Li, Z.; Liu, Y.; Zhou, W. Drivers and impacts of changes in China’s drylands. Nat. Rev. Earth Environ. 2021, 2, 858–873. [Google Scholar] [CrossRef]
- Li, J.; Guo, L.; Yang, M.; Zhao, G.; Wang, T. Climate warming hiatus and characteristics of air temperature and precipitation in Mu Us Sandy Land. J. Water Resour. Water Eng. 2022, 33, 72–80. [Google Scholar] [CrossRef]
- Li, M.; Li, C. Temporal and spatial evolution characteristics of meteorological drought in the Loess Plateau from 1961 to 2020. Pearl River. 2023, 44, 1–10. [Google Scholar]
- Deng, Z.; Zhang, Q.; Xu, J.; Chen, M.; Qin, S.; Zhang, S. Comparative Studies of the Ham Characteristic of Hot-dry Wind and High Temperature Heat Waves. Adv. Earth Sci. 2009, 24, 865–873. [Google Scholar]
- Lu, A.; Ge, J.; Pang, D.; He, Y.; Pang, H. Asynchronous Response of Droughts to ENSO in China. J. Glaciol. Geocryol. 2006, 28, 535–542. [Google Scholar] [CrossRef]
- Zheng, Y.; Dong, L.; Xia, Q.; Liang, C.; Wang, L.; Shao, Y. Effects of revegetation on climate in the Mu Us Sandy Land of China. Sci. Total Environ. 2020, 739, 139958. [Google Scholar] [CrossRef]
- Lu, J. Evaluation of Vegetation Restoration in Loess Plateau and Time-Lag Effect of Climate Change and Drought. Master’s Dissertation, Northwest A&F University, Xianyang, China, 2022. [Google Scholar] [CrossRef]
- Wei, X.; He, W.; Zhou, Y.; Ju, W.; Xiao, J.; Li, X.; Liu, Y.; Xu, S.; Bi, W.; Zhang, X. Global assessment of lagged and cumulative effects of drought on grassland gross primary production. Ecol. Indic 2022, 136, 108646. [Google Scholar] [CrossRef]
- Gao, W.; Zheng, C.; Liu, X.; Lu, Y.; Chen, Y.; Wei, Y.; Ma, Y. NDVI-based vegetation dynamics and their responses to climate change and human activities from 1982 to 2020: A case study in the Mu Us Sandy Land, China. Ecol. Indic 2022, 137, 108745. [Google Scholar] [CrossRef]
- Wang, J. Drought Monitoring Based on TVDI and Its Lag Research in Hebei Province. Master’s Dissertation, Hebei University of Engineering, Handan, China, 2022. [Google Scholar] [CrossRef]
- Wang, H.; Guo, Y.; Bai, Y.; Wang, N.; Wei, X.; Zhou, M. Dynamic pattern of vegetation in Xinjiang and its time-lag effect on climate. Trans. Chin. Soc. Agric. Eng. 2023, 39, 137–145. [Google Scholar]
- Zheng, Q.; Wu, J.; Jiang, P. Numerical study on the effect of the distribution of the southeast sealine of china on the amplifying of the torrential rain of the landing typhoon 9216. J. Trop. Meteorol. 1996, 12, 17–26. [Google Scholar]
- Wang, S.; Li, R.; Wu, Y.; Zhao, S. Effects of multi-temporal scale drought on vegetation dynamics in Inner Mongolia from 1982 to 2015, China. Ecol. Indic 2022, 136, 108666. [Google Scholar] [CrossRef]
- Zhang, L.; Cheng, L.; Sun, Y.; Pang, Y.; Li, J.; Jia, X.; Fei, B.; Xiu, X.; Yin, J.; Wu, B. Grain size characteristics of soil on typical underlying surfaces in Mu Us Sandy Land. Chin. J. Ecol. 2023, 1–9. Available online: https://link.cnki.net/urlid/21.1148.Q.20230906.1327.012 (accessed on 20 February 2024).


| F | Trending Traits | |
|---|---|---|
| > 0 | 2.58 < F | Highly significant drying |
| 1.96 < F ≤ 2.58 | Significant drying | |
| F ≤ 1.96 | Slightly drying | |
| = 0 | F | No change |
| < 0 | 2.58 < F | Highly significant wetting |
| 1.96 < F ≤ 2.58 | Significant wetting | |
| F ≤ 1.96 | Slightly wetting |
| TVDI | 0∼0.46 | 0.46∼0.57 | 0.57∼0.76 | 0.76∼0.86 | 0.86∼1 |
|---|---|---|---|---|---|
| Drought grade | Drought free | Mild drought | Moderate drought | Severe drought | Extreme drought |
Disclaimer/Publisher’s Note: The statements, opinions and data contained in all publications are solely those of the individual author(s) and contributor(s) and not of MDPI and/or the editor(s). MDPI and/or the editor(s) disclaim responsibility for any injury to people or property resulting from any ideas, methods, instructions or products referred to in the content. |
© 2024 by the authors. Licensee MDPI, Basel, Switzerland. This article is an open access article distributed under the terms and conditions of the Creative Commons Attribution (CC BY) license (https://creativecommons.org/licenses/by/4.0/).
Share and Cite
Wang, F.; Li, R.; Wang, S.; Wang, H.; Shi, Y.; Zhang, Y.; Zhao, J.; Yang, J. Seasonal Drought Dynamics and the Time-Lag Effect in the MU Us Sandy Land (China) Under the Lens of Climate Change. Land 2024, 13, 307. https://doi.org/10.3390/land13030307
Wang F, Li R, Wang S, Wang H, Shi Y, Zhang Y, Zhao J, Yang J. Seasonal Drought Dynamics and the Time-Lag Effect in the MU Us Sandy Land (China) Under the Lens of Climate Change. Land. 2024; 13(3):307. https://doi.org/10.3390/land13030307
Chicago/Turabian StyleWang, Fuqiang, Ruiping Li, Sinan Wang, Huan Wang, Yanru Shi, Yin Zhang, Jianwei Zhao, and Jinming Yang. 2024. "Seasonal Drought Dynamics and the Time-Lag Effect in the MU Us Sandy Land (China) Under the Lens of Climate Change" Land 13, no. 3: 307. https://doi.org/10.3390/land13030307
APA StyleWang, F., Li, R., Wang, S., Wang, H., Shi, Y., Zhang, Y., Zhao, J., & Yang, J. (2024). Seasonal Drought Dynamics and the Time-Lag Effect in the MU Us Sandy Land (China) Under the Lens of Climate Change. Land, 13(3), 307. https://doi.org/10.3390/land13030307