

Structure and Carbon Capture of a Temperate Mixed Forest across Altitudinal Gradients in Northern Mexico

 ,
, 
 ,
,  and
and Highlights
- This research examined floristic diversity and biomass in a vast mixed pine-oak forest in Chihuahua, Mexico, at various altitudes;
- In a mixed pine-oak forest in Chihuahua, Mexico, species richness and diversity were greatest at lower altitudes, and lower at higher altitudes;
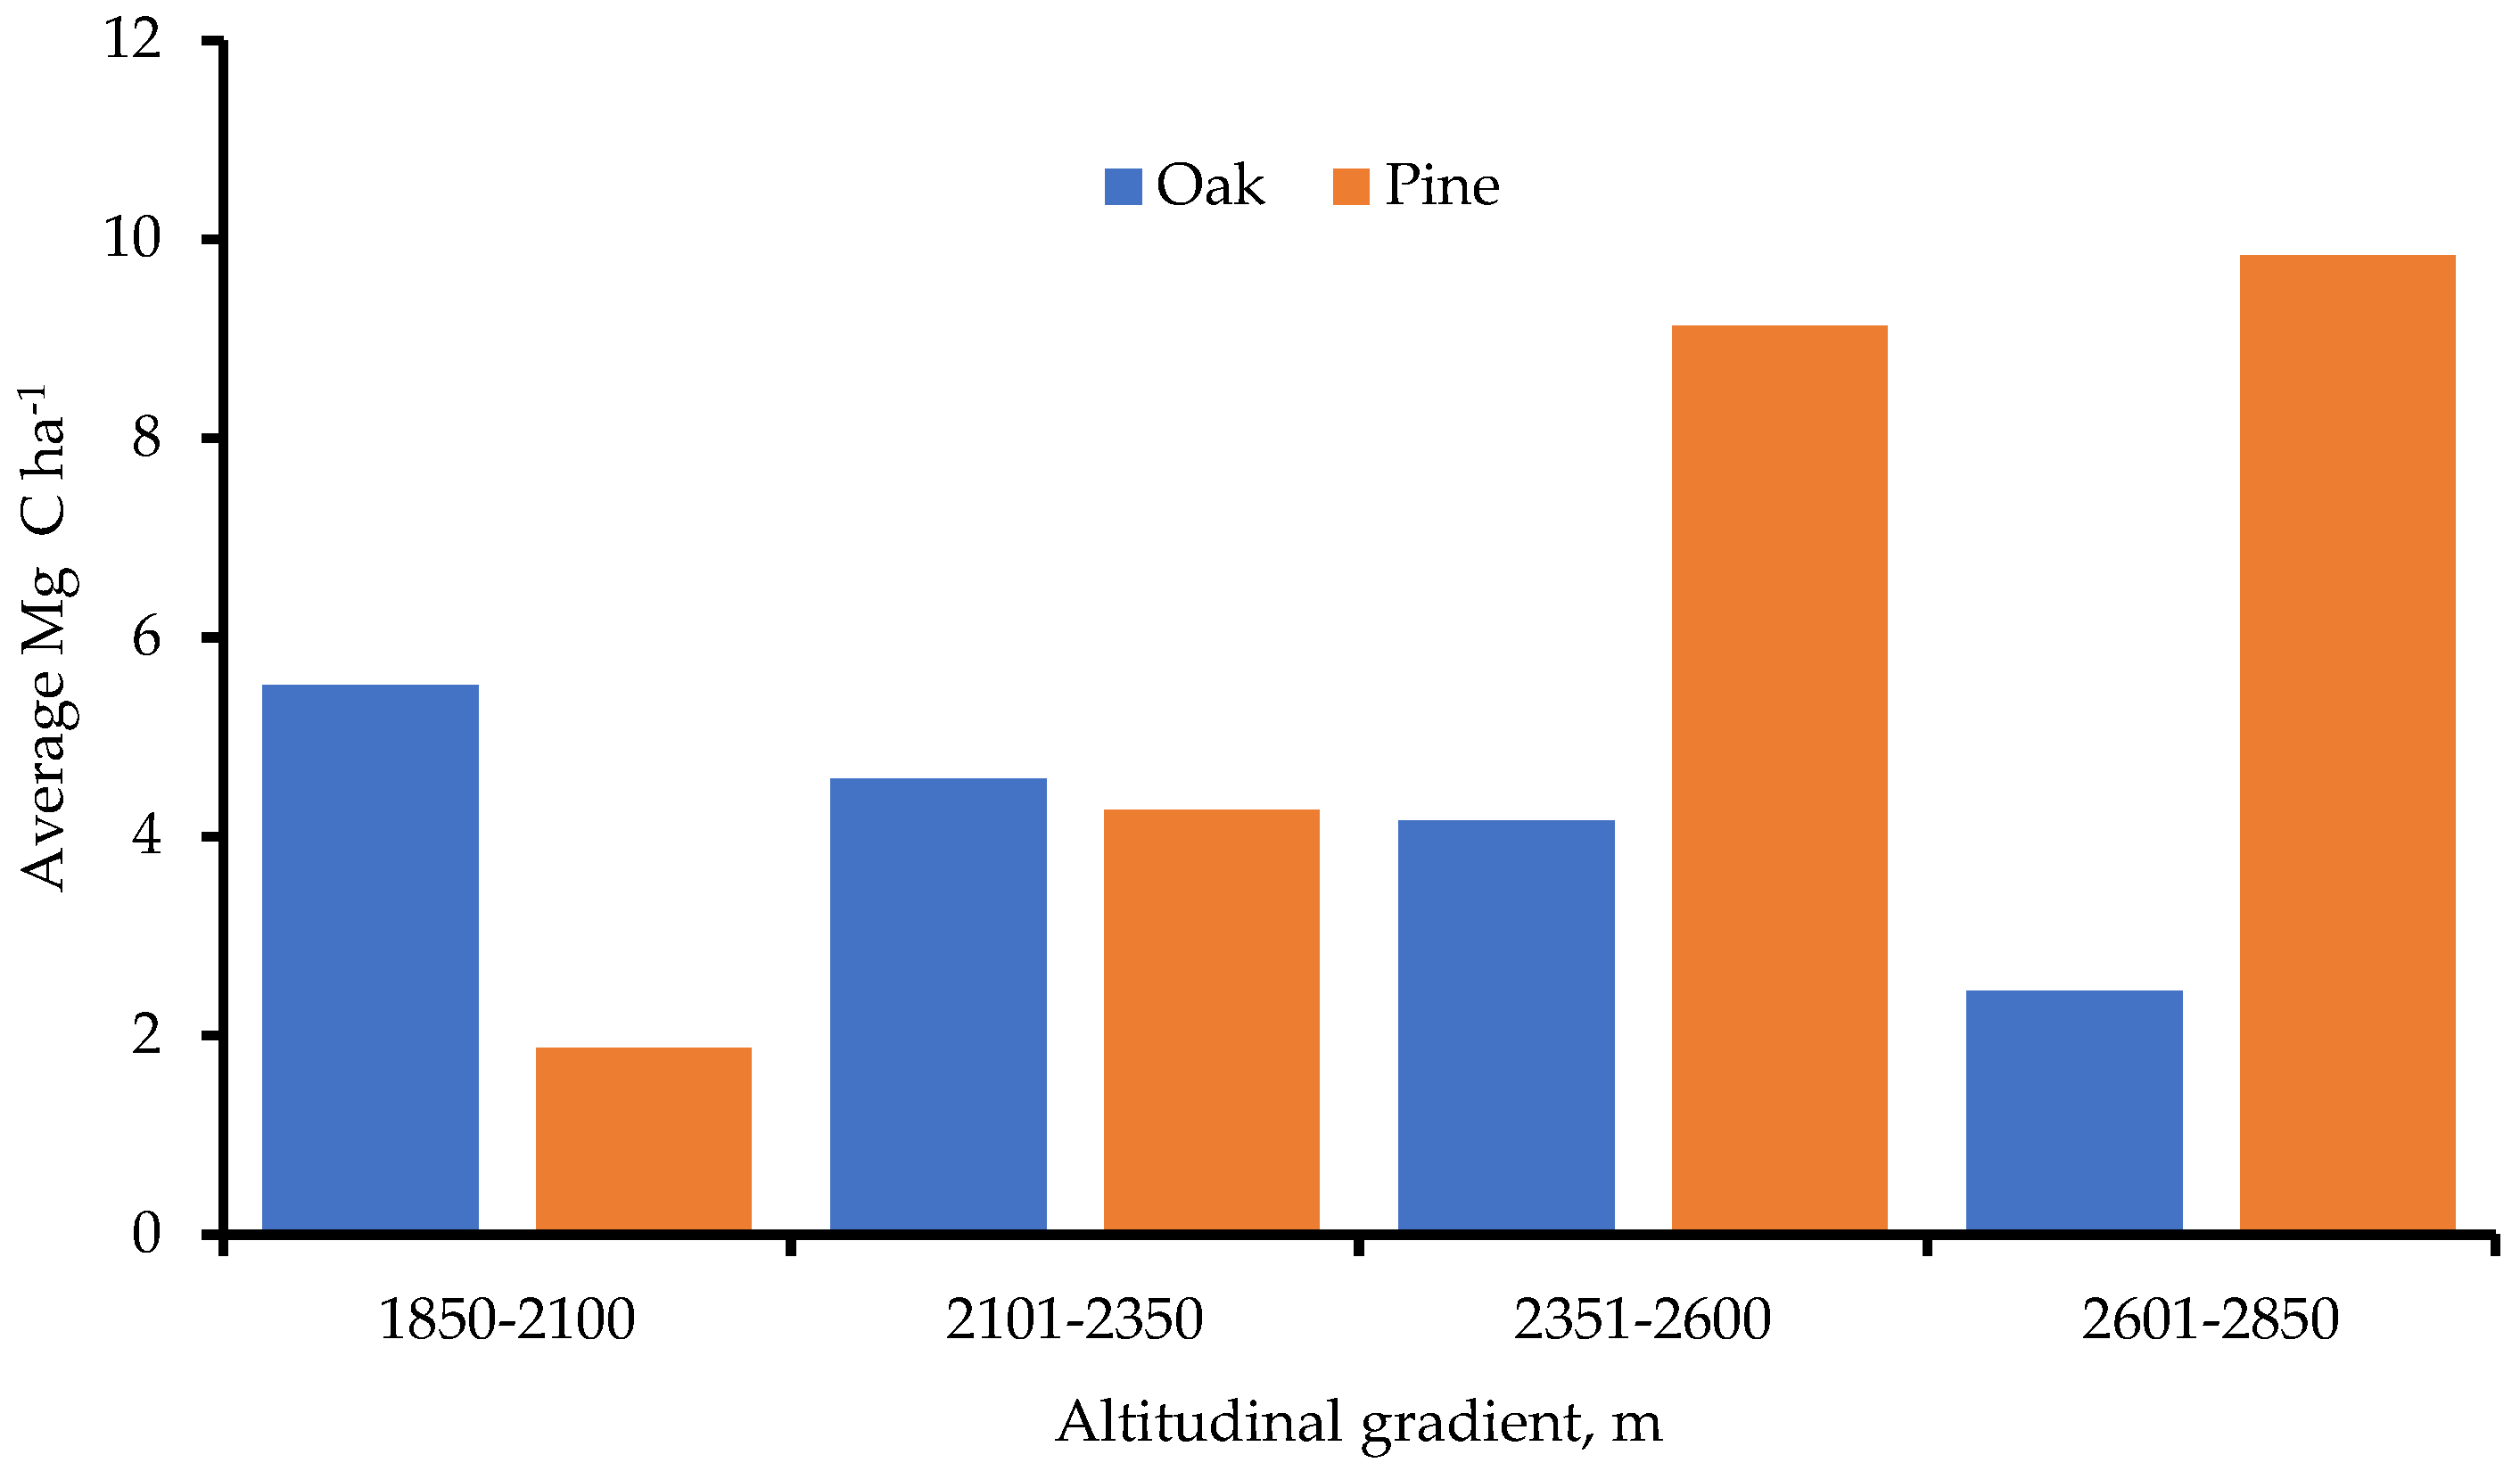
- At 2601-2850 m, forest carbon storage peaked. Pine trees held more carbon generally, yet at higher altitudes;
- Social protections and carbon credit sales aid carbon storage in shifting climates. Reforestation, genetic enhancements, and mixed stands may boost carbon storage.
Abstract
1. Introduction
2. Materials and Methods
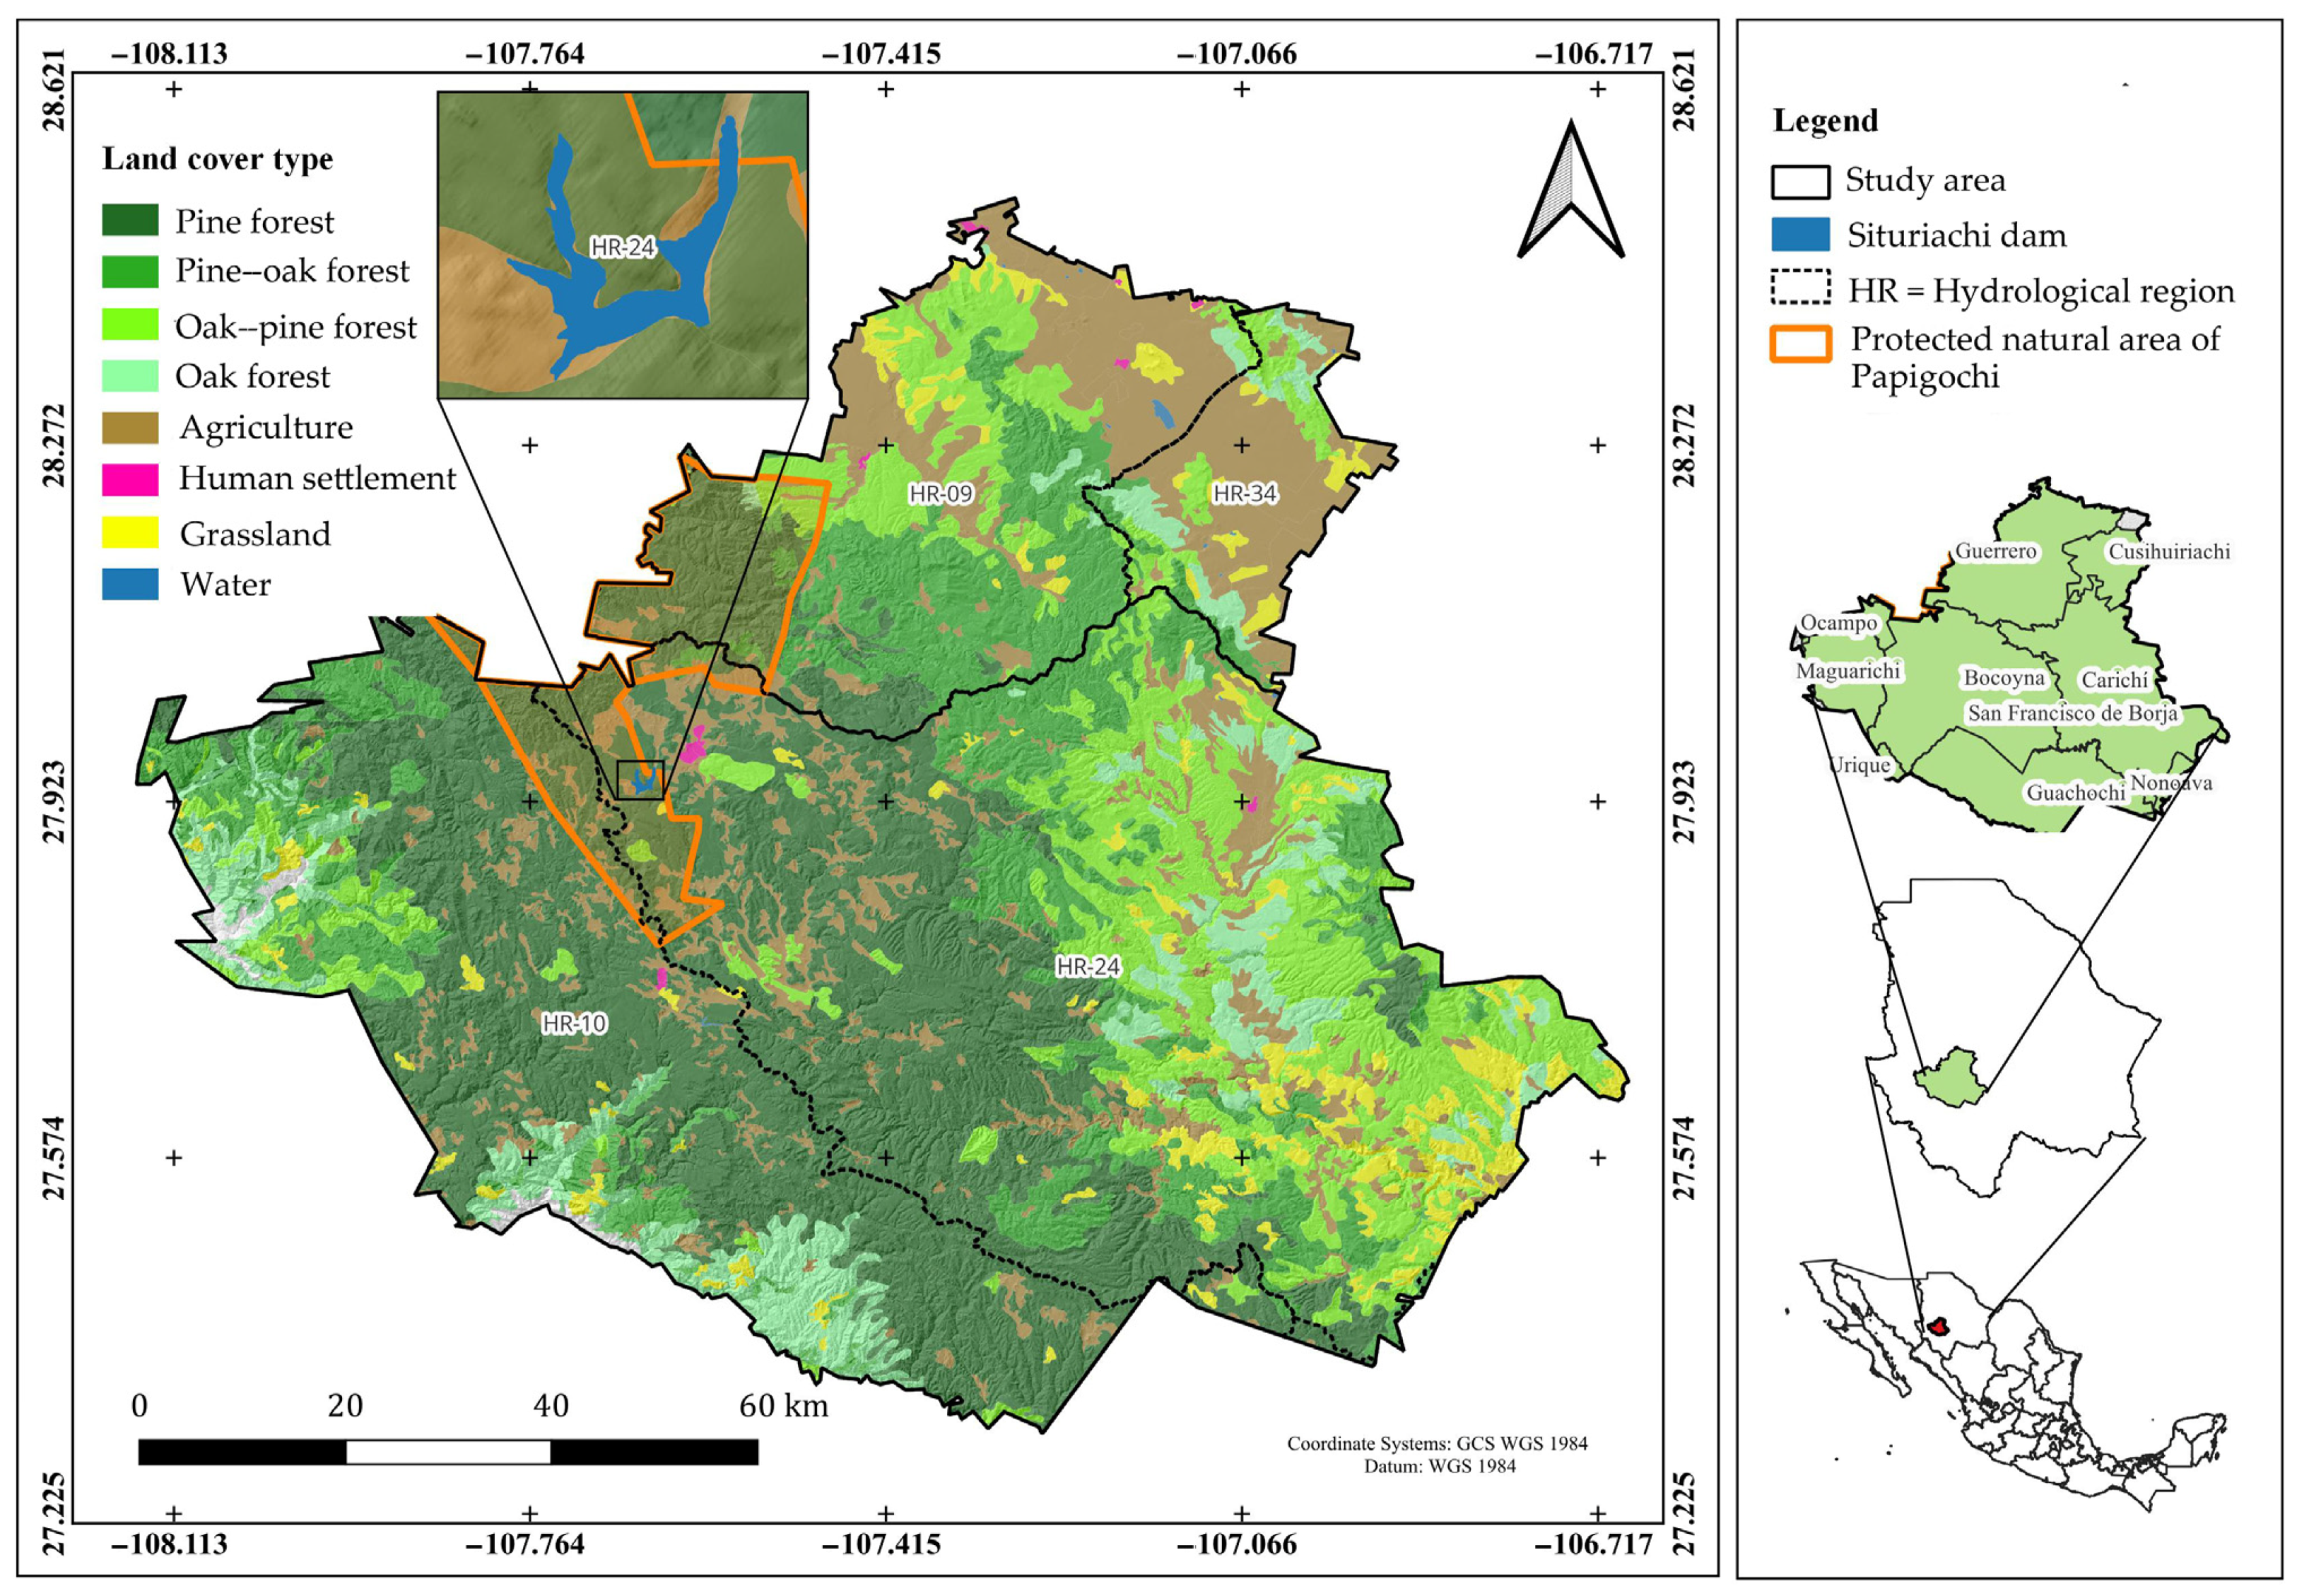
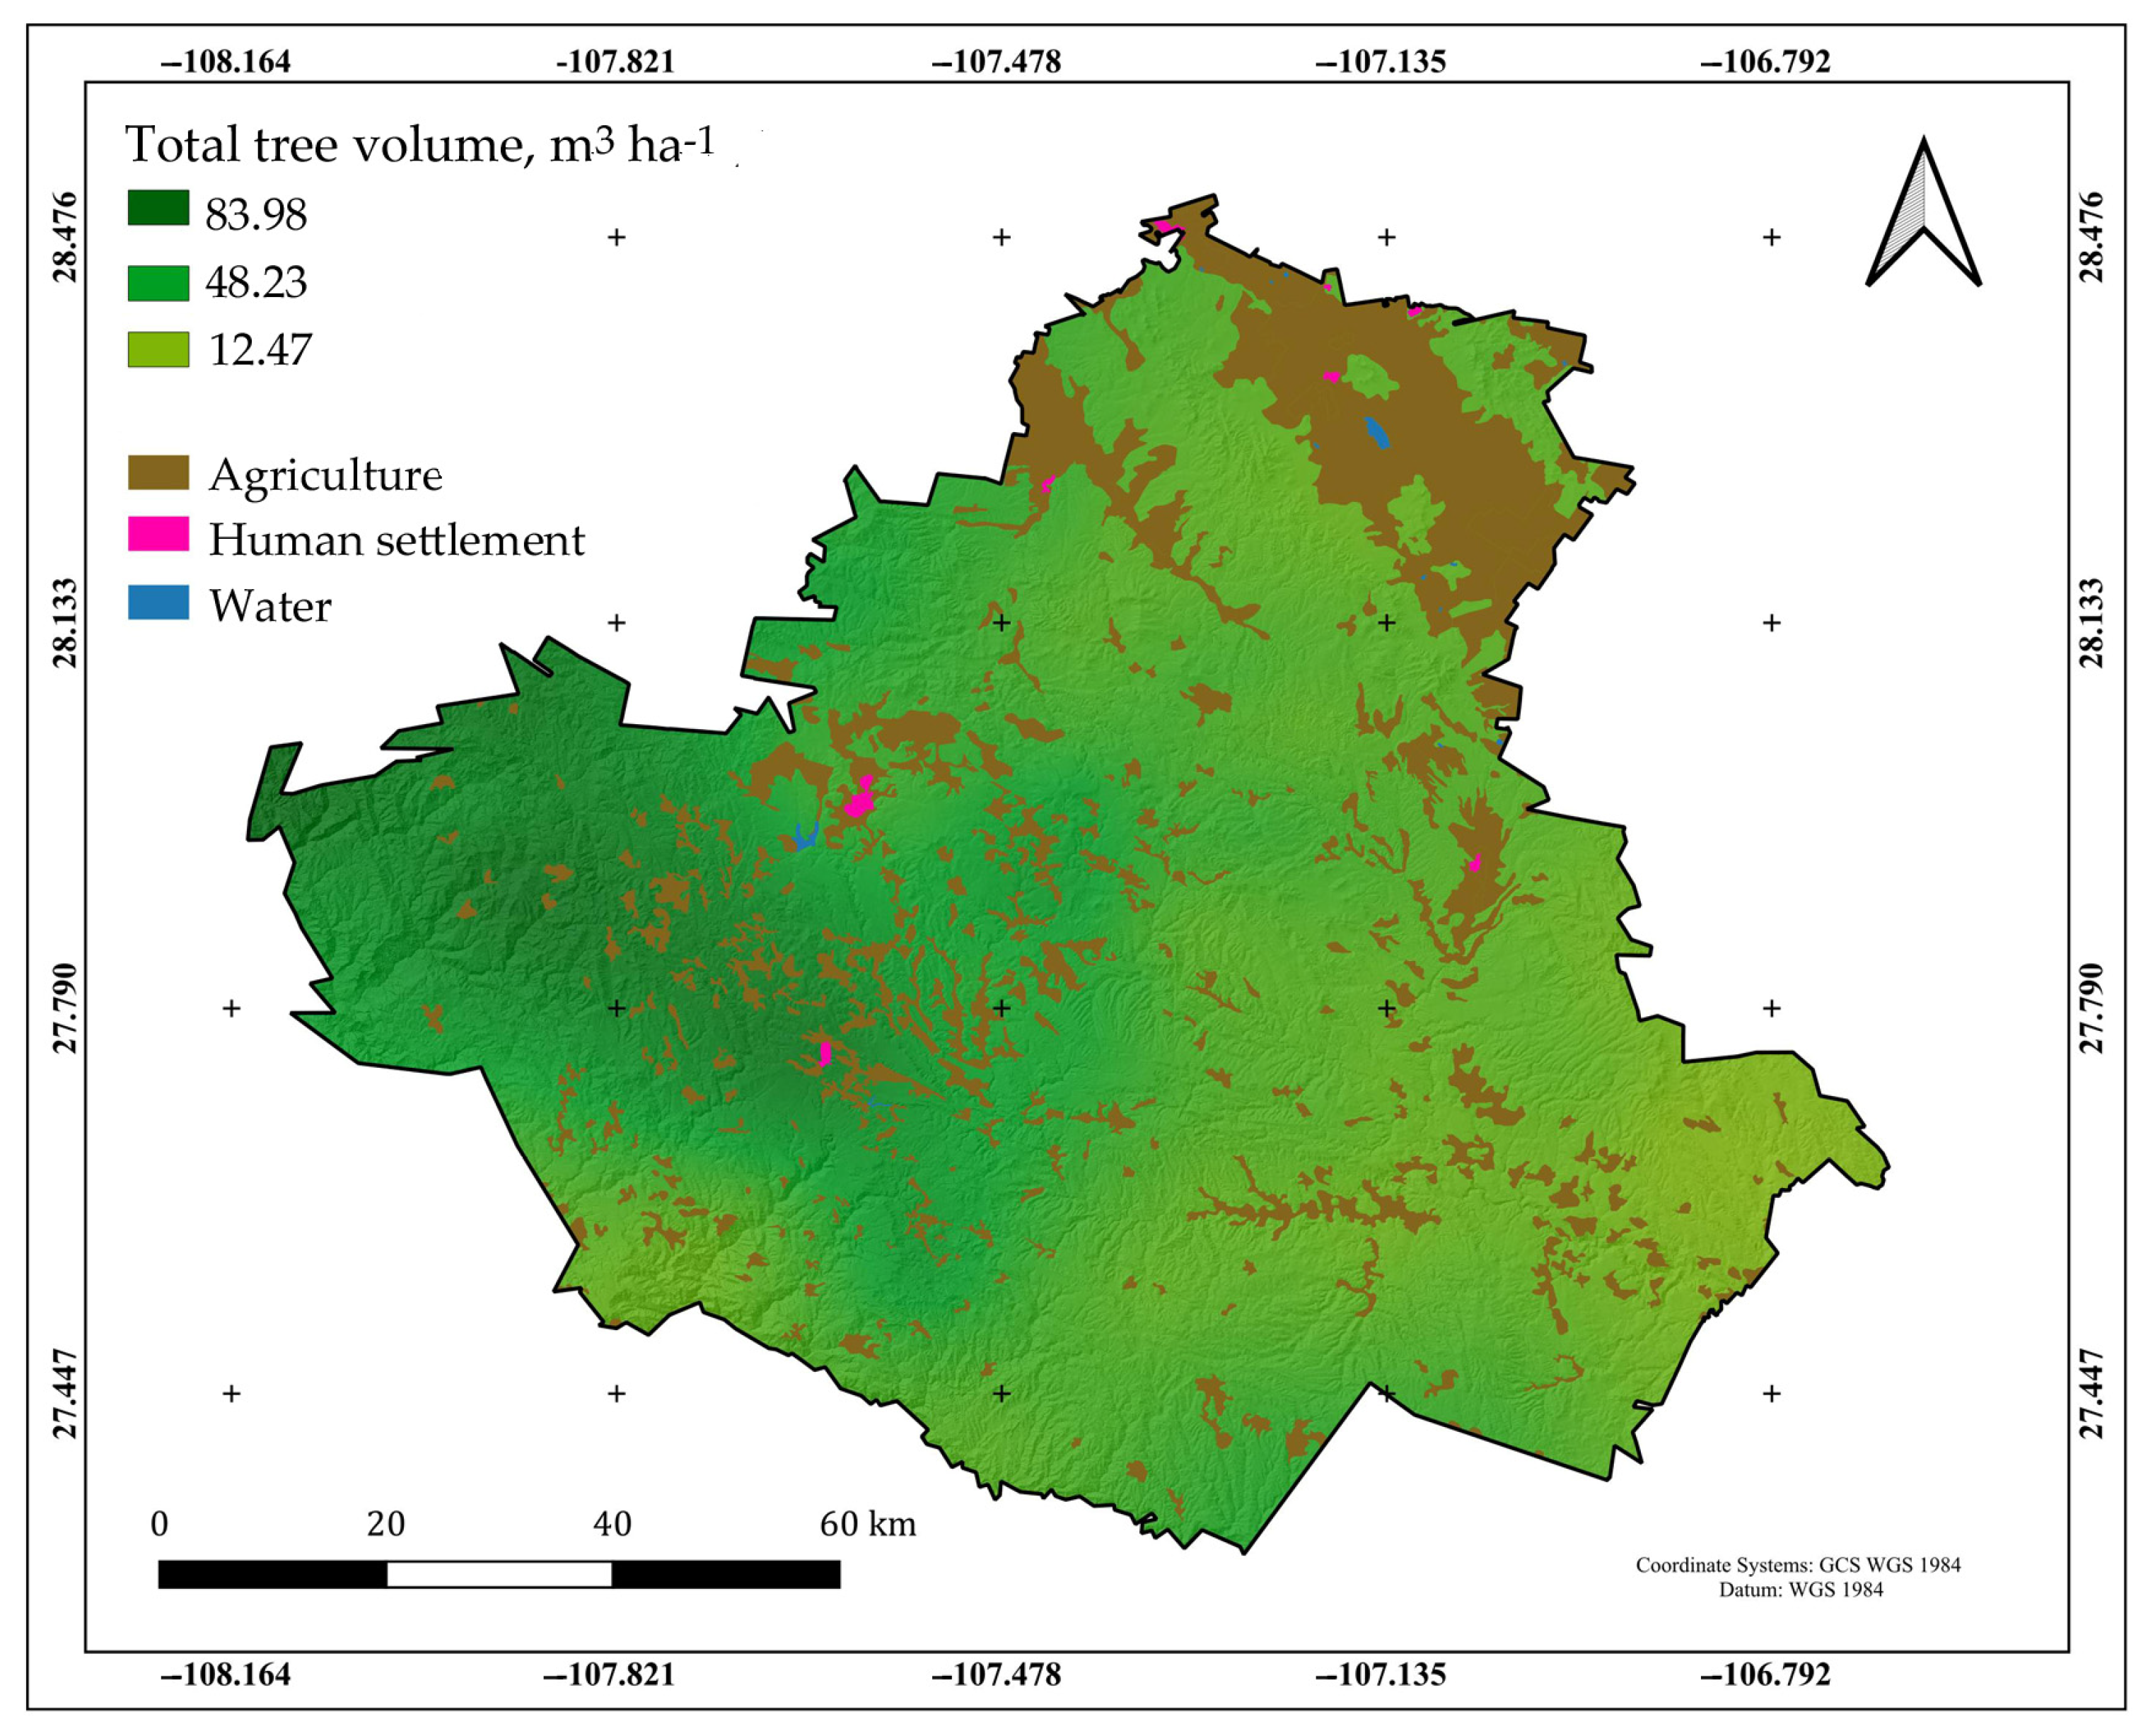
2.1. Description of the Study Area
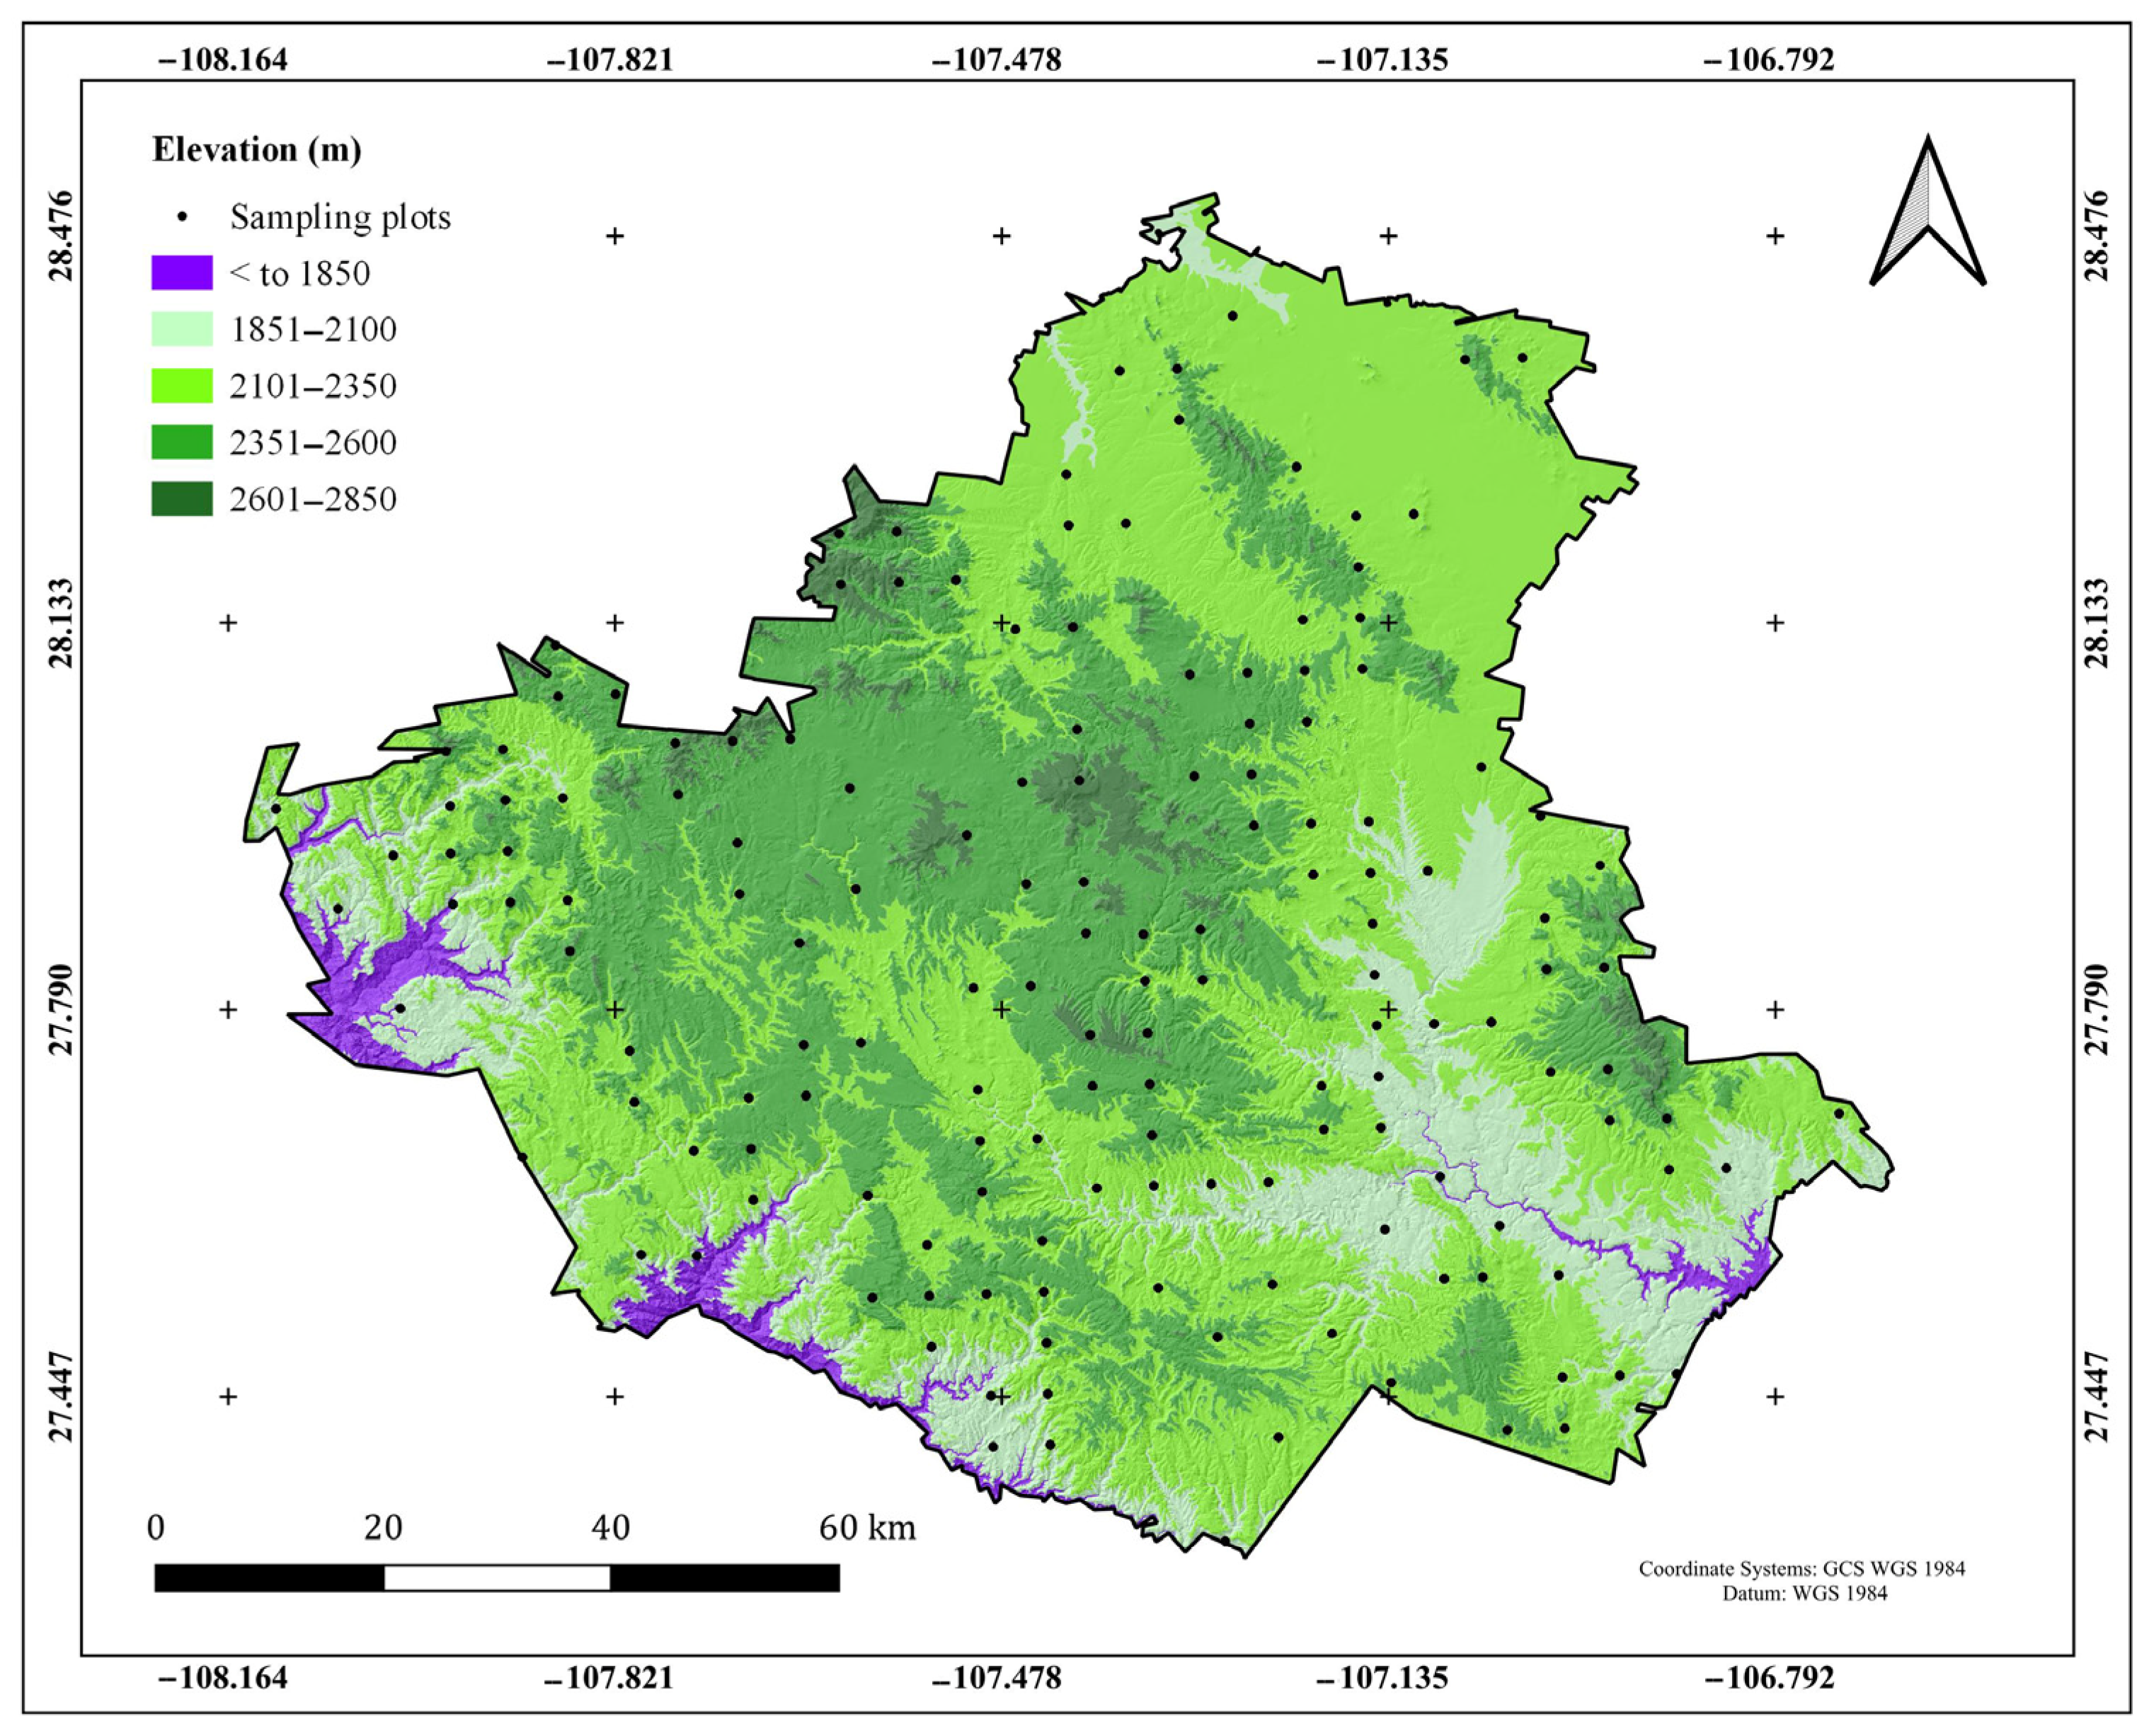
2.2. Sampling Plots
2.3. Estimation of Volume, Biomass, and C Content

| Tree Species | b0 | b1 | b2 | b3 | Density g cm−3 |
|---|---|---|---|---|---|
| Abies durangensis Martínez | 0.000066 | 1.788316 | 1.055175 | 0.000013 | 0.38 |
| Arbutus tessellata P.D.Sørensen | 0.000142 | 1.483474 | 1.121788 | 0.000116 | 0.75 |
| Arbutus xalapensis Kunth | 0.000142 | 1.483474 | 1.121788 | 0.000116 | 0.75 |
| Cupressus arizonica Greene | 0.000062 | 1.882421 | 0.946587 | 0.000010 | 0.45 |
| Cupressus lusitanica Miller | 0.000062 | 1.882421 | 0.946587 | 0.000010 | 0.45 |
| Fraxinus uhdei (Wenz.) Lingelsh | 0.000101 | 1.687575 | 1.033752 | 0.000050 | 0.46 |
| Juniperus deppeana Steud. | 0.000101 | 1.687575 | 1.033752 | 0.000050 | 0.46 |
| Juniperus flaccida Schldtl. | 0.000101 | 1.687575 | 1.033752 | 0.000050 | 0.46 |
| Juniperus monosperma Engelmann | 0.000101 | 1.687575 | 1.033752 | 0.000050 | 0.46 |
| Pinus arizonica Engelm | 0.000027 | 2.120149 | 0.969354 | 0.000136 | 0.43 |
| Pinus strobiformis Engelmann | 0.000177 | 1.398093 | 1.220451 | 0.000085 | 0.37 |
| Pinus cembroides Zucc. | 0.000122 | 1.620204 | 1.067986 | 0.000049 | 0.37 |
| Pinus durangensis Martínez | 0.00002 | 2.154422 | 1.024150 | 0.000100 | 0.47 |
| Pinus engelmannii Carr. | 0.000011 | 2.244813 | 1.116209 | 0.000149 | 0.43 |
| Pinus herrerae Martínez | 0.000122 | 1.620204 | 1.067986 | 0.000049 | 0.43 |
| Pinus leiophylla var. chihuahuana | 0.000056 | 1.847202 | 1.034216 | 0.000079 | 0.43 |
| Pinus lumholtzii B.L. Rob. & Fernald | 0.000122 | 1.620204 | 1.067986 | 0.000049 | 0.43 |
| Pinus oocarpa Shiede | 0.000056 | 1.847202 | 1.034216 | 0.000079 | 0.43 |
| Pinus teocote Schiede ex Schltdl. | 0.000056 | 1.847202 | 1.034216 | 0.000079 | 0.45 |
| Populus tremuloides Michx. | 0.000132 | 1.454625 | 1.259012 | 0.000100 | 0.45 |
| Pseudotsuga menziesii (Mirb.) Franco | 0.000062 | 1.882421 | 0.946587 | 0.000010 | 0.45 |
| Quercus arizonica C.S. Sargent | 0.000048 | 1.878022 | 0.996633 | 0.000149 | 0.61 |
| Quercus crassifolia Bonpl. | 0.000132 | 1.454625 | 1.259012 | 0.000100 | 0.45 |
| Quercus rugosa Née | 0.000038 | 1.818784 | 1.158475 | 0.000191 | 0.61 |
3. Results
3.1. Tree Composition and Diversity across Altitudinal Gradients
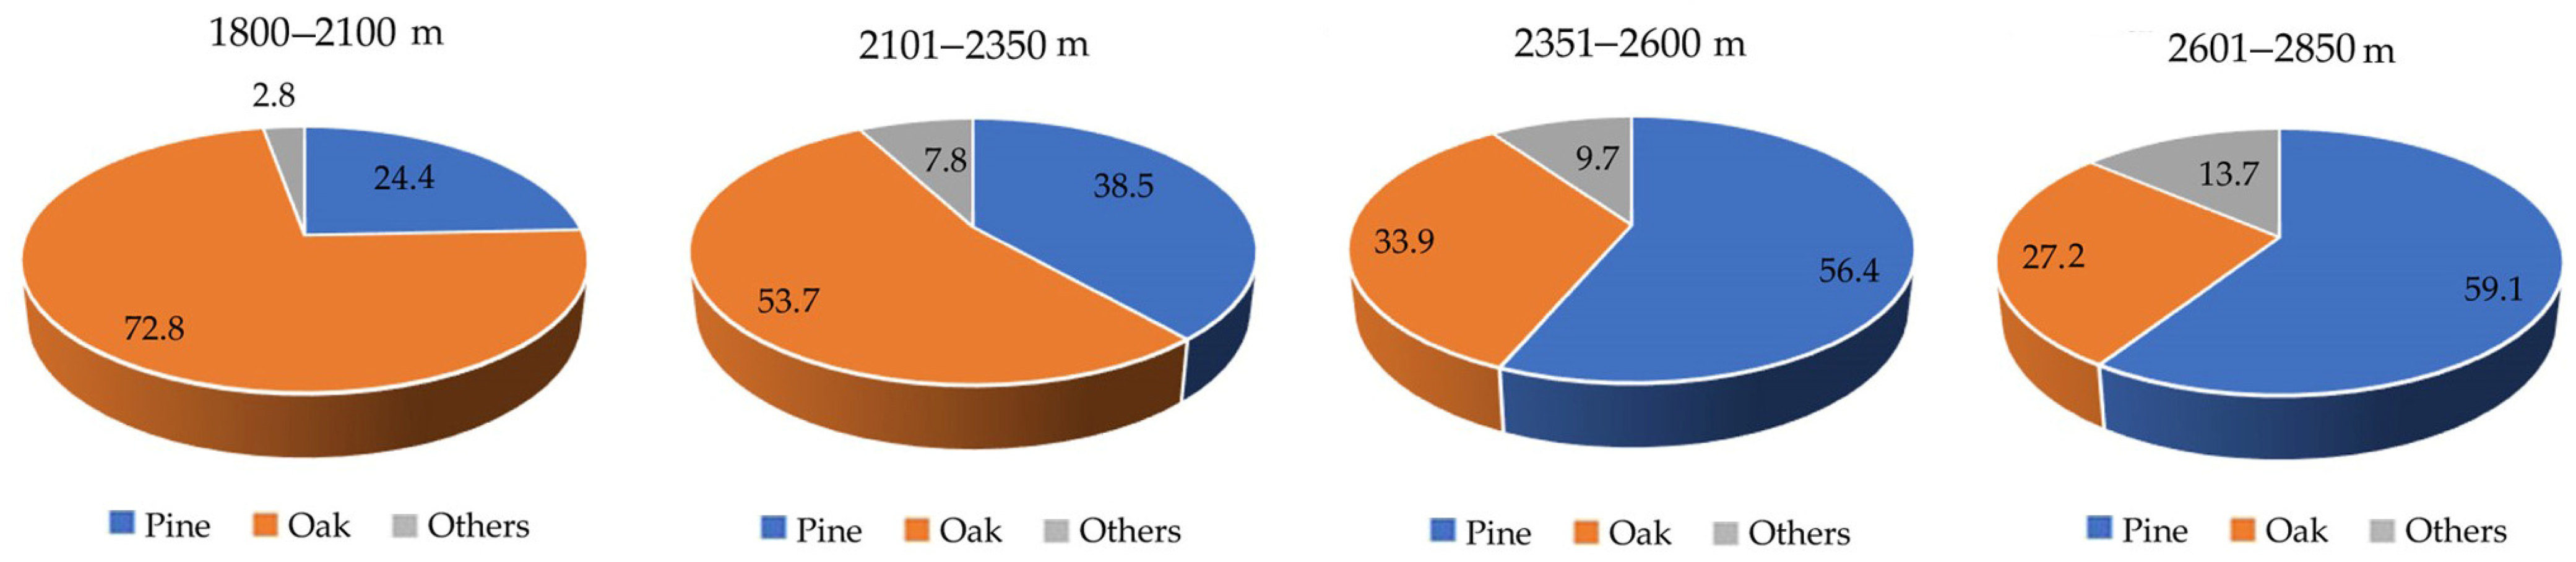
3.1.1. Tree Composition
3.1.2. Diversity
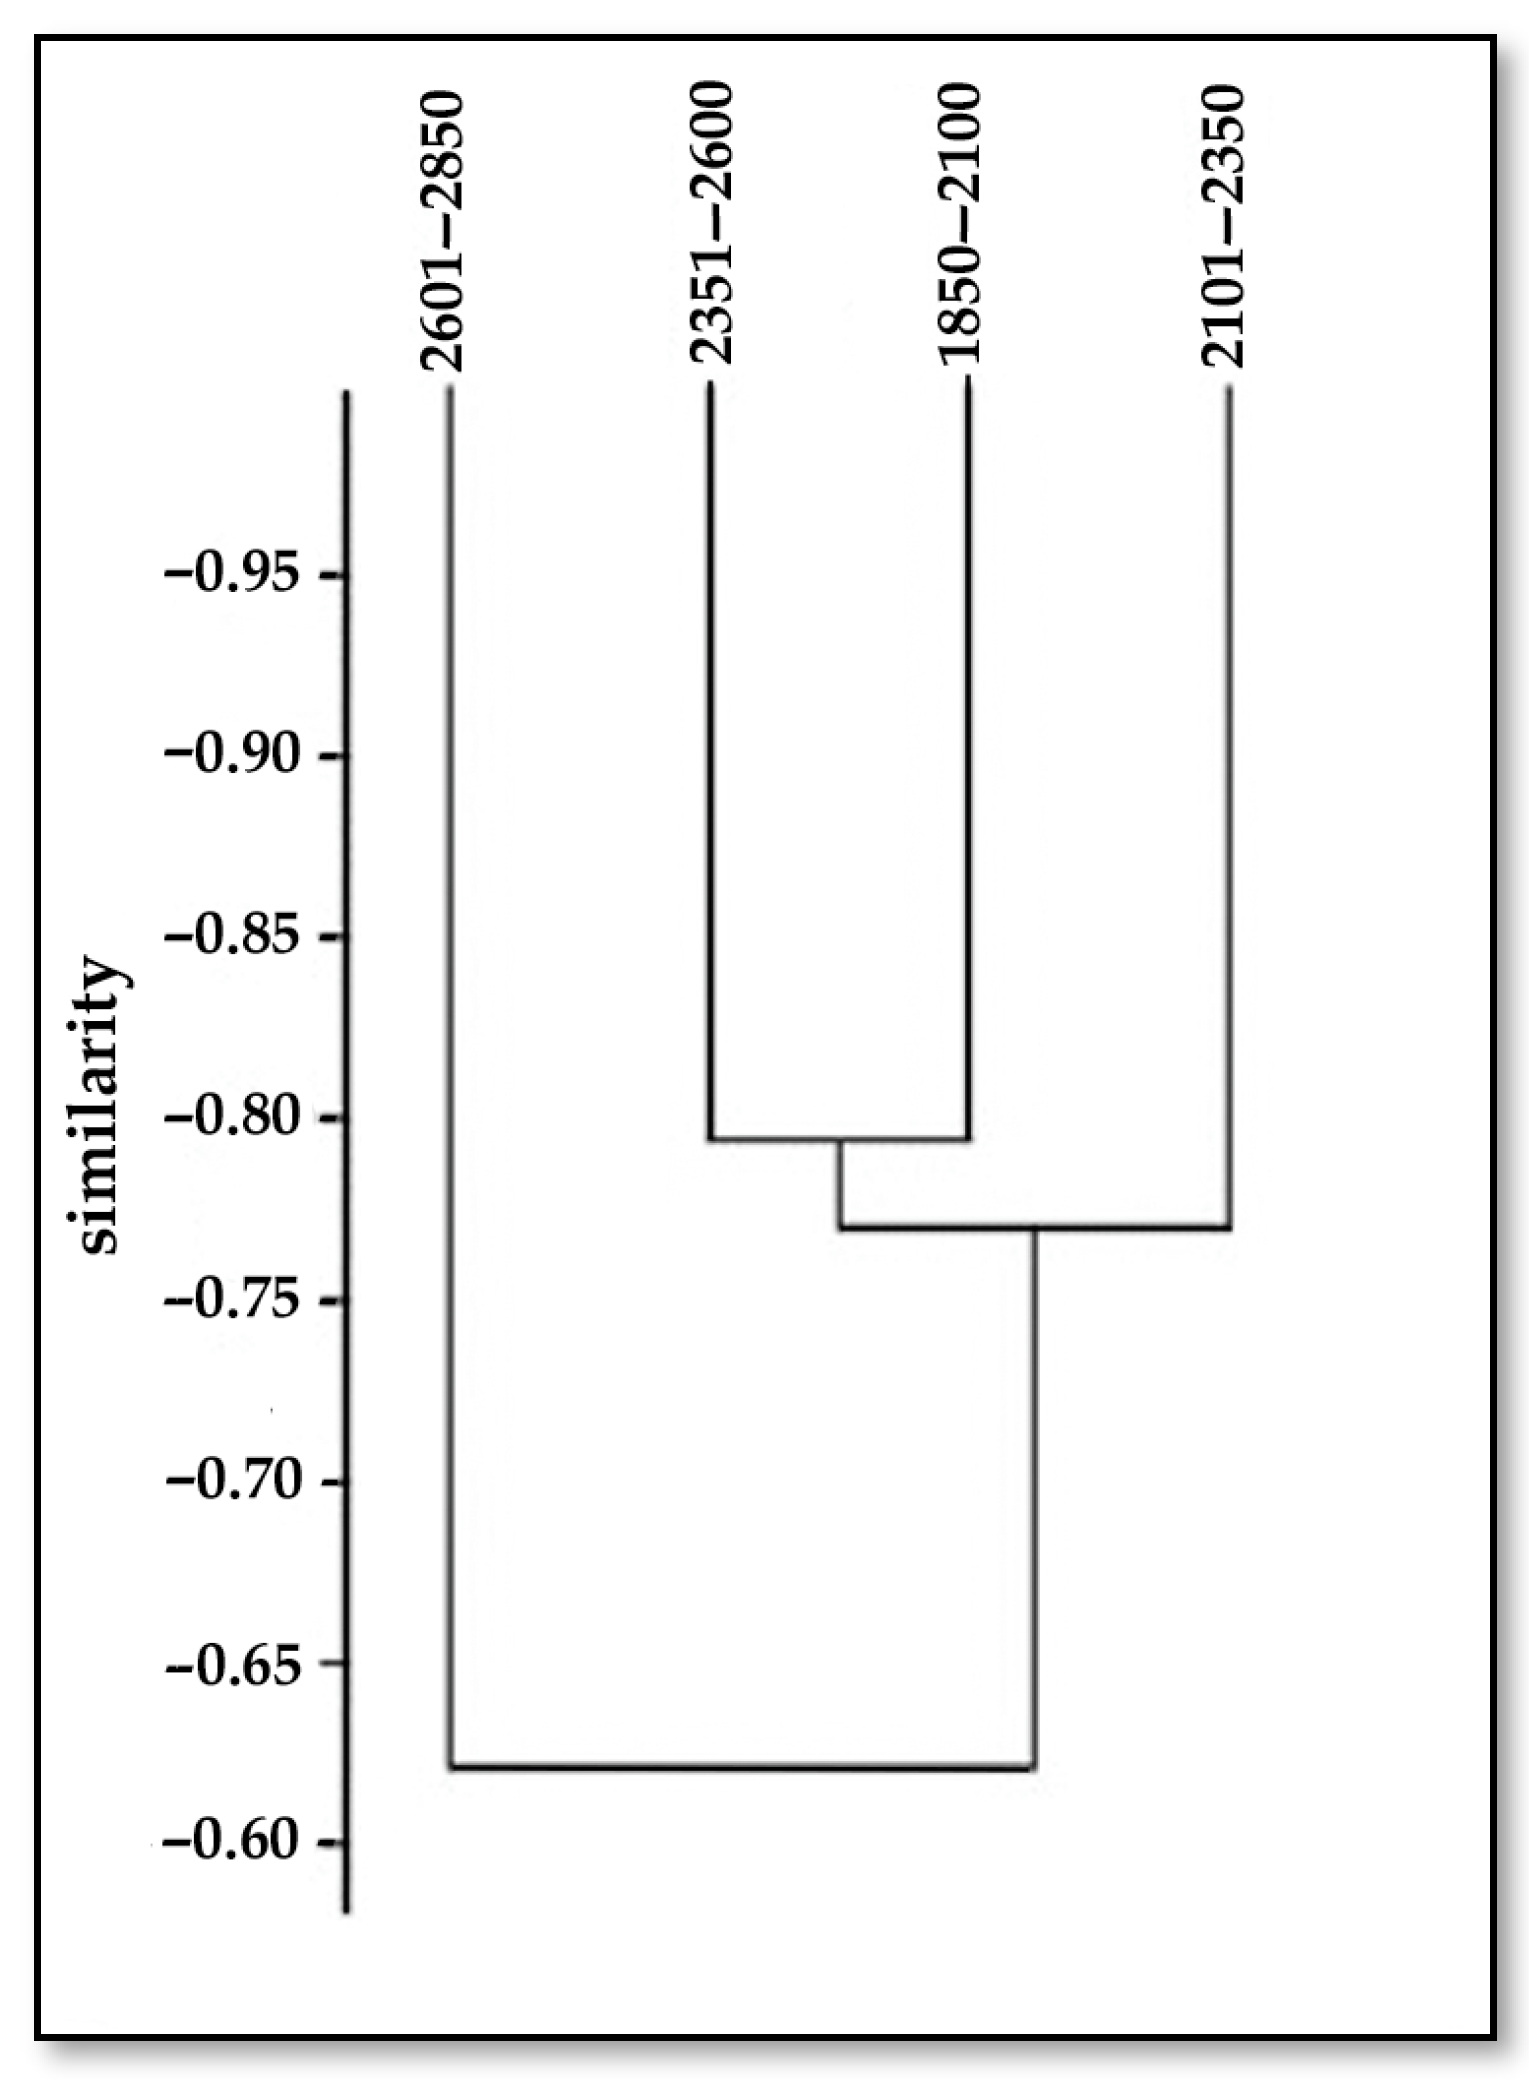
3.1.3. Sorensen Index
3.2. Volumetric Inventory
3.3. C Storage in Aboveground Biomass
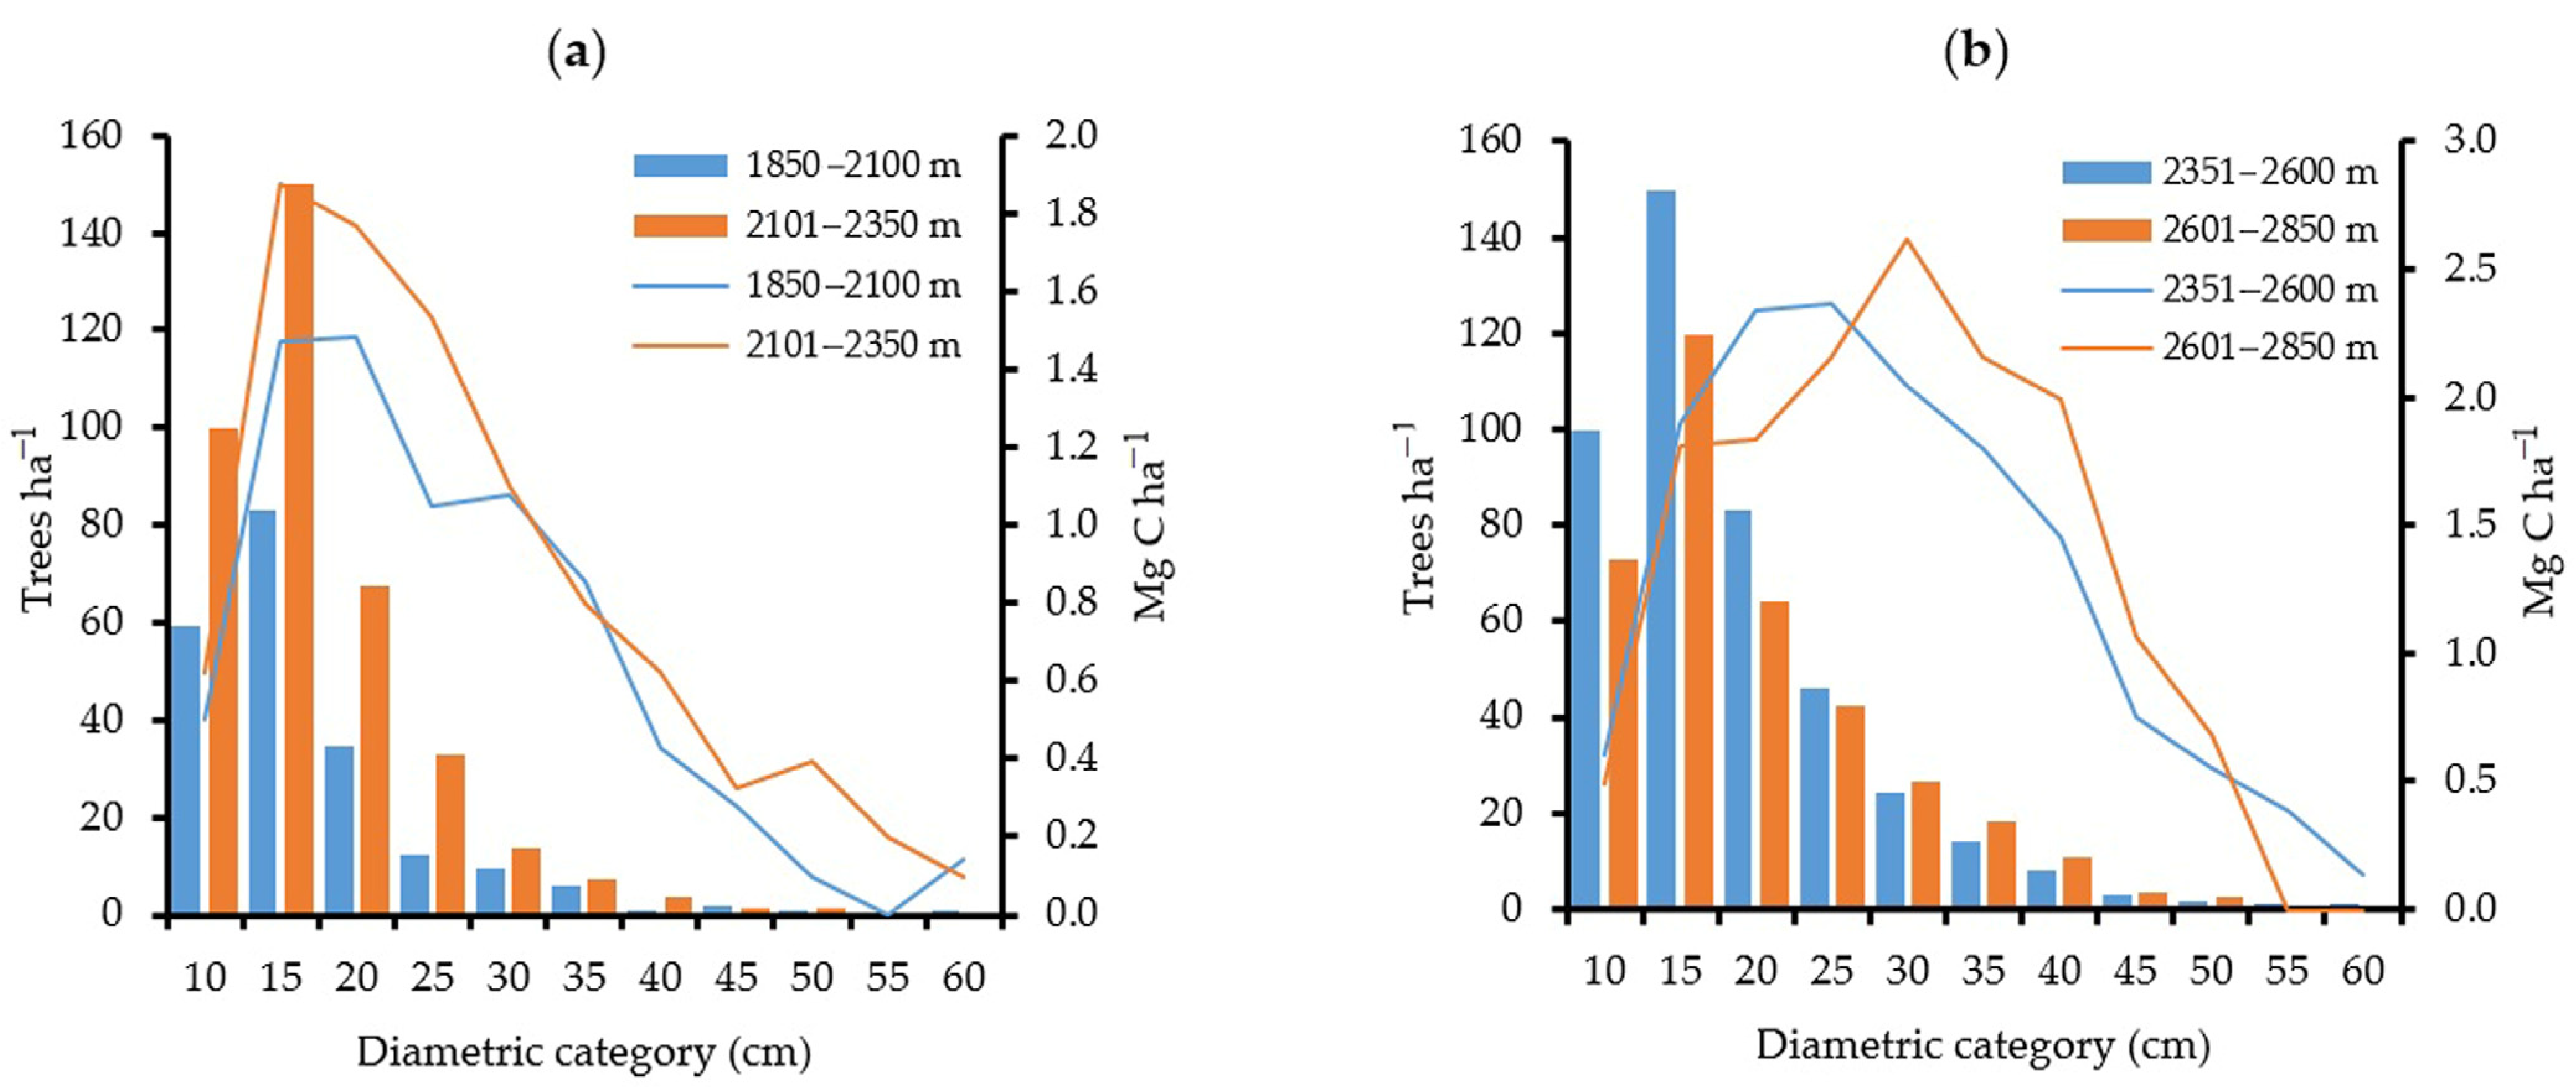
3.4. C Capture and Structure by Altitudinal Gradient
4. Discussion
4.1. Carbon Storage by Altitudinal Gradient and by Diametric Classification
4.2. Forest Management Strategies to Increase C Storage
4.3. C Trade and Social Aspects
5. Conclusions
Supplementary Materials
Author Contributions
Funding
Data Availability Statement
Acknowledgments
Conflicts of Interest
References
- Jandl, R.; Bauhus, J.; Bolte, A.; Schindlbacher, A.; Schüler, S. Effect of climate-adapted forest management on carbon pools and greenhouse gas emissions. Curr. For. Rep. 2015, 1, 1–7. [Google Scholar] [CrossRef]
- Malmshimer, R.W.; Bowyer, J.L.; Fried, J.S.; Gee, E.; Izlar, R.L.; Reid, R.A.; Munn, I.A.; Oneil, E.; Stewart, W.C. Managing Forests because Carbon Matters: Integrating Energy, Products, and Land Management Policy. J. For. 2011, 109, S7–S50. Available online: https://api.semanticscholar.org/CorpusID:131320809 (accessed on 3 January 2024).
- Seneviratne, S.I.; Rogelj, J.; Séférian, R.; Wartenburger, R.; Allen, M.R.; Cain, M.; Millar, R.J.; Ebi, K.L.; Ellis, N.; Hoegh-Guldberg, O.; et al. The many possible climates from the Paris Agreement’s aim of 1.5 °C warming. Nature 2018, 558, 41–49. [Google Scholar] [CrossRef] [PubMed]
- Bonan, G.B. Forests and climate change: Forcings, feedbacks, and the climate benefits of forests. Science 2008, 320, 1444–1449. [Google Scholar] [CrossRef] [PubMed]
- Noormets, A.; Epron, D.; Domec, J.C.; McNulty, S.G.; Fox, T.; Sun, G.; King, J.S. Effects of forest management on productivity and carbon sequestration: A review and hypothesis. Forest Ecol. Manag. 2015, 355, 124–140. [Google Scholar] [CrossRef]
- Castruita-Esparza, L.U.; Gutiérrez, M.; Olivas-García, J.M.; Rubio-Arias, H.O. The pine-oak forest of the Rio Conchos basin, Mexico: Key to rain production and soil erosion control. Environments 2023, 10, 37. [Google Scholar] [CrossRef]
- Zhang, T.; Niinemets, Ű.; Sheffield, J.; Lichstein, J.W. 2018. Shifts in tree functional composition amplify the response of forest biomass to climate. Nature 2018, 556, 99. [Google Scholar] [CrossRef] [PubMed]
- Ezquerro, M.; Diaz-Balteiro, L.; Pardos, M. Implications of forest management on the conservation of protected areas: A new proposal in Central Spain. Forest Ecol. Manag. 2023, 548, 121428. [Google Scholar] [CrossRef]
- Canadell, J.G.; Monteiro, P.M.S.; Costa, M.H.; Cotrim da Cunha, L.; Cox, P.M.; Eliseev, A.V.; Henson, S.; Ishii, M.; Jaccard, S.; Koven, C.; et al. Global Carbon and other Biogeochemical Cycles and Feedbacks. In Climate Change 2021: The Physical Science Basis; Contribution of Working Group I to the Sixth Assessment Report of the Intergovernmental Panel on Climate Change; Masson-Delmotte, V., Zhai, P., Pirani, A., Connors, S.L., Péan, C., Berger, S., Caud, N., Chen, Y., Goldfarb, L., Gomis, M.I., et al., Eds.; Cambridge University Press: Cambridge, UK; New York, NY, USA, 2023; pp. 673–816. [Google Scholar] [CrossRef]
- Pardos, M.; del Río, M.; Pretzsch, H.; Jactel, H.; Bielak, K.; Bravo, F.; Brazaitis, G.; Defossez, E.; Engel, M.; Godvod, K.; et al. The greater resilience of mixed forests to drought mainly depends on their composition: Analysis along a climate gradient across Europe. Forest Ecol. Manag. 2021, 481, 118687. [Google Scholar] [CrossRef]
- Tian, H.; Yao, Y.; Li, Y.; Shi, H.; Pan, S.; Najjar, R.G.; Pan, N.; Bian, Z.; Ciais, P.; Cai, W.; et al. Increased terrestrial carbon export and CO2 evasion from global inland waters since the Preindustrial Era. Glob. Biogeochem. Cycles 2023, 37, e2023GB007776. [Google Scholar] [CrossRef]
- Pacheco-Aquino, G.; Durán Medina, E.; Ordóñez-Díaz, J.A. Tree carbon estimation in the forest management area of Ixtlán de Juárez, Oaxaca, Mexico. Rev. Mex. Cienc. For. 2018, 6, 126–145. [Google Scholar]
- Suárez-Muñoz, M.; Bonet-García, F.J.; Navarro-Cerrillo, R.; Herrero, J.; Mina, M. Forest management scenarios drive future dynamics of Mediterranean planted pine forests under climate change. Landsc. Ecol. 2023, 38, 2069–2084. [Google Scholar] [CrossRef]
- Besnard, S.; Carvalhais, N.; Arain, M.A.; Black, A.; de Bruin, S.; Buchmann, N.; Cescatti, A.; Chen, J.; Clevers, J.G.P.W.; Desai, A.R.; et al. Quantifying the effect of forest age in annual net forest carbon balance. Environ. Res. Let. 2018, 13, 124018. [Google Scholar] [CrossRef]
- Nunes, L.; Lopes, D.; Rego, F.C.; Gower, S.T. Aboveground biomass and net primary production of pine, oak, and mixed pine-oak forests on the Vila Real district, Portugal. Forest Ecol. Manag. 2013, 305, 38–47. [Google Scholar] [CrossRef]
- Seedre, M.; Janda, P.; Trotsiuk, V.; Hedwall, P.; Morrisey, R.C.; Mikoláš, M.; Bače, R.; Čada, V.; Svoboda, M. Biomass carbon accumulation patterns throughout stand development in primary uneven-aged forest driven by mixed-severity natural disturbances. Forest Ecol. Manag. 2020, 455, 117676. [Google Scholar] [CrossRef]
- García-García, S.A.; Alanís-Rodríguez, E.; Aguirre-Calderón, O.A.; Treviño-Garza, J.; Cuellar-Rodríguez, L.G.; Chavez-Costa, A.C. Composition, structure and status of tree regeneration in an altitudinal gradient in a temperate forest of Guadalupe y Calvo, Chihuahua. Polibotanica 2023, 56, 81–100. [Google Scholar] [CrossRef]
- Xu, B.; Feng, Z.; Chen, Y.; Zhou, Y.; Shao, Y.; Wang, Z. Assessing the distribution and driving effects of net primary productivity along an elevation gradient in subtropical regions of China. Forests 2024, 15, 340. [Google Scholar] [CrossRef]
- Bisht, S.; Bargali, S.S.; Bargali, K.; Rawat, G.S.; Rawat, Y.S.; Fartyal, A. Influence of anthropogenic activities on forest carbon stocks—A case study from Gori Valley, Western Himalaya. Sustainability 2022, 14, 16918. [Google Scholar] [CrossRef]
- Joshi, V.C.; Sundriyal, R.C.; Chandra, N.; Arya, D. Unlocking nature’s hidden treasure: Unveiling forest status, biomass and carbon wealth in the Binsar Wildlife Sanctuary, Uttarakhand for climate change mitigation. Environ. Chall. 2024, 14, 100825. [Google Scholar] [CrossRef]
- Acosta-Hernández, A.C.; Padilla-Martínez, J.R.; Hernández-Díaz, J.C.; Prieto-Ruiz, J.A.; Goche-Telles, J.R.; Nájera-Luna, J.A.; Pompa-García, M. Influence of climate on carbon sequestration in conifers growing under contrasting hydro-climatic conditions. Forests 2020, 11, 1134. [Google Scholar] [CrossRef]
- Singh, C.; van der Ent, R.; Wang-Erlandsson, L.; Fetzer, I. Hydroclimatic adaptation critical to the resilience of tropical forests. Global Change Biol. 2022, 28, 2930–2939. [Google Scholar] [CrossRef]
- Abatzoglou, J.T.; Williams, A.P.; Boschetti, L.; Zubkova, M.; Kolden, C.A. Global patterns of interannual climate-fire relationships. Global Change Biol. 2018, 24, 5164–5175. [Google Scholar] [CrossRef] [PubMed]
- Challenger, A.; Soberón, J. Los ecosistemas terrestres. In Capital Natural de México. Vol. I. Conocimiento Actual de la Biodiversidad; Sarukhán, J., Ed.; Comisión Nacional para el Estudio de la Biodiversidad (CONABIO): Mexico City, Mexico, 2008; pp. 87–108. [Google Scholar]
- Barton, A.M.; Poulos, H.M.; Koch, G.W.; Kolb, T.E.; Thode, A.E. Detecting patterns of post-fire regeneration in a Madrean Sky Island with field surveys and remote sensing. Sci Total Environ. 2023, 867, 161517. [Google Scholar] [CrossRef] [PubMed]
- Cortés-Montaño, C.; Fulé, P.Z.; Falk, D.A.; Villanueva-Díaz, J.; Yocom, L.L. Linking old-growth forest composition, structure, fires history, climate and land-use in the mountains of northern Mexico. Ecosphere 2012, 3, 106. [Google Scholar] [CrossRef]
- Alfaro-Reyna, T.; Martinez-Vilalta, J.; Retana, J. Regeneration patterns in Mexican pine-oak forests. For. Ecosyst. 2019, 6, 50. [Google Scholar] [CrossRef]
- Mas, J.F.; Velázquez, A.; Díaz-Gallegos, J.R.; Mayorga-Saucedo, R.; Alcántara, C.; Bocco, G.; Castro, R.; Fernández, T.; Pérez-Vega, A. Assessing land use/cover changes: A nationwide multidate spatial database for Mexico. Int. J. Appl. Earth Obs. Geoinform. 2004, 5, 249–261. [Google Scholar] [CrossRef]
- Balderrama, S.; Luján, A.C.; Hernández, G.; Castruita, L.U. Captura de carbono en bosque de coníferas de la Sierra Tarahumara en Chihuahua Mexico. Rev. Latinoam. Rec. Natur. 2008, 4, 203–214. [Google Scholar]
- Castruita-Esparza, L.U.; Silva, L.C.; Gómez-Guerrero, A.; Villanueva-Díaz, J.; Correa-Díaz, A.; Horwath, W.R. Coping with extreme events: Growth and water-use efficiency of trees in western Mexico during the driest and wettest periods of the past one hundred sixty years. J. Geophys. Res. Biogeosci. 2019, 124, 3419–3431. [Google Scholar] [CrossRef]
- Pimienta de la Torre, D.J.; Domínguez-Cabrera, G.; Aguirre-Calderón, O.; Hernández, F.J.; Jiménez-Pérez, J. Estimación de biomasa y contenido de carbono de Pinus cooperi Blanco en Pueblo Nuevo, Durango. Madera Bosques 2007, 13, 35–46. [Google Scholar] [CrossRef]
- Aguirre-Calderón, O.A.; Jiménez-Pérez, J. Carbon content evaluation in southern forests of Nuevo Leon. Rev. Mex. Cienc. For. 2011, 2, 74–83. [Google Scholar]
- Barton, A.M.; Poulos, H.M. Pine vs. oaks revisited: Conversion of Madrean pine-oak forest to oak shrubland after high-severity wildfire in the Sky Islands of Arizona. Forest Ecol. Manag. 2018, 414, 28–40. [Google Scholar] [CrossRef]
- Silva-Rodríguez, S. Estudio Regional Forestal de la UMAFOR San Juanito, Clave 08-05; Unidad de Manejo Forestal San Juanito, A.C. y Consultoría Ecosistemas y Medio Ambiente Sierra Madre, S.C.: Chihuahua, Mexico, 2009; 266p. Available online: www.conafor.gob.mx:8080/documentos/docs/9/1143ERF_UMAFOR0805.pdf (accessed on 6 October 2023).
- Parmesan, C. Ecological and evolutionary response to recent climatic change. Ann. Rev. Ecol. Syst. 2006, 37, 637–669. [Google Scholar] [CrossRef]
- Thomas, C.; Cameron, A.; Green, R.E.; Bakkenes, M.; Beaumont, L.J. Extinction risk from climate change. Nature 2004, 427, 145–149. [Google Scholar] [CrossRef] [PubMed]
- Gray, P. Impacts of climate change on diversity in forested ecosystems: Some examples. For. Chron. 2005, 81, 655–661. [Google Scholar] [CrossRef][Green Version]
- Dawson, B.; Spannagle, M. The complete guide to climate change; Routledge: New York, NY, USA, 2009; 436 p, ISBN 0-41-547790-5. [Google Scholar]
- Shannon, C.E. The mathematical theory of communication. Bell Syst. Tech. J. 1948, 27, 379–423. [Google Scholar] [CrossRef]
- Hutcheson, K. A test for comparing diversities based on the Shannon formula. J. Theor. Biol. 1970, 29, 151–154. [Google Scholar] [CrossRef] [PubMed]
- Corral-Rivas, J.J.; Vargas-Larreta, B. Validación y Calibración del Sistema Biométrico Utilizado en la Elaboración de los Programas de Manejo Forestal Maderable en la UMAFOR 0808 "Guadalupe y Calvo", Chihuahua; Technical Report; CONAFOR: Chihuahua, México, 2013.
- Sotomayor-Castellanos, J.R.; Hernández-Maldonado, S.A. Características elásticas de maderas mexicanas. In Investigación e Ingeniería de la Madera; Universidad Michoacana de San Nicolás de Hidalgo: Morelia, Mexico, 2012; Volume 8, pp. 3–78. Available online: https://www.researchgate.net/publication/261064509_Caracteristicas_elasticas_de_maderas_mexicanas (accessed on 6 October 2023).
- Castellanos, J.S. Banco FITECMA de Características Físico-Mecánicas de Maderas Mexicanas; Universidad Michoacana de San Nicolás de Hidalgo: Morelia, México, 2015; 65p, Available online: https://www.researchgate.net/publication/276841418_Banco_FITECMA_de_caracteristicas_fisico-mecanicas_de_maderas_Mexicanas (accessed on 6 October 2023).
- Zanne, A.E.; Lopez-Gonzalez, G.; Coomes, D.A.; Ilic, J.; Jansen, S.; Lewis, S.L.; Miller, R.B.; Swenson, N.G.; Wiemann, M.C.; Chave, J. Global Wood Density Database. Dryad 2009. [Google Scholar] [CrossRef]
- Pérez-Olvera, C.d.l.P.; Dávalos-Sotelo, R. Algunas características anatómicas y tecnológicas de la madera de 24 especies de Quercus (encinos) de México. Madera Bosques 2008, 14, 43–80. [Google Scholar] [CrossRef]
- Nájera Luna, J.A.; García, R.P. Propiedades físicas de la madera de Juniperus deppeana y Arbustus xalapensis de la región del Salto Durango. Agrociencias 2009, 6, 37–41. [Google Scholar] [CrossRef]
- Díaz, J.A.B.O.; Naranjo, A.G.; Mancera, N.J.V.; Tejeda, T.H.; Díaz, M.d.J.O.; Dávalos-Sotelo, R. Densidad de las maderas mexicanas por tipo de vegetación con base en la clasificación de J. Rzedowski: Compilación. Madera Bosques 2015, 21, 77–216. [Google Scholar] [CrossRef]
- Vázquez-Cuecuecha, O.G.; Zamora-Campos, E.M.; García-Gallegos, E.; Ramírez-Flores, J.A. Densidad básica de la madera de dos pinos y su relación con propiedades edáficas. Madera Bosques 2015, 21, 129–138. [Google Scholar] [CrossRef]
- Hernández, I.G. Estimación del Carbono Capturado en el Ejido Forestal El Retiro y Gumeachi, Bocoyna, Chihuahua, Mediante el Modelo LUCS. Master’s Thesis, Universidad Autónoma de Chihuahua, Chihuahua, Mexico, 2003. [Google Scholar]
- Fried, J.S.; Zhou, X. Forest Inventory-Based Estimation of Carbon Stocks and Flux in California Forests in 1990; General Technical Report PNW-GTR 750; US Department of Agriculture, Forest Service, Pacific Northwest Research Station: Portland, OR, USA, 2008; Volume 750, 25p. [Google Scholar]
- García-García, S.A.; Narváez-Flores, R.; Olivas-García, J.M.; Hernández-Salas, J. Diversidad y estructura vertical del bosque de pino-encino en Guadalupe y Calvo, Chihuahua. Rev. Mex. Cienc. For. 2019, 10, 41–63. [Google Scholar] [CrossRef]
- Margalef, R. Homage to Evelyn Hutchinson, or Why There is an Upper Limit to Diversity; Connecticut Academy of Arts and Sciences: New Haven, CT, USA, 1972; 23p. [Google Scholar]
- Colwell, R.K.; Hurtt, G.C. Nonbiological gradients in species richness and a spurious Rapoport effect. Am. Nat. 1994, 144, 570–595. [Google Scholar] [CrossRef]
- McCain, C.M.; Grytnes, J.A. Elevational gradients in species richness. In Encyclopedia of Life Sciences (ELS); John Wiley & Sons, Ltd: Chichester, UK, 2010; pp. 1–10. [Google Scholar] [CrossRef]
- Álvarez-Arteaga, G.; García Calderón, N.E.; Krasilnikov, P.; García-Oliva, F. Almacenes de carbono en bosques montanos de niebla de la Sierra Norte de Oaxaca, México. Agrociencia 2013, 47, 171–180. Available online: http://www.scielo.org.mx/scielo.php?script=sci_arttext&pid=S1405-31952013000200006 (accessed on 6 October 2023).
- Meave, J.A.; Rincón, A.; Romero-Romero, M.A. Oak forests of the hyper-humid region of La Chinantla, Northern Oaxaca Range, Mexico. Ecol. Stud. 2006, 185, 113. Available online: https://link.springer.com/chapter/10.1007/3-540-28909-7_9 (accessed on 6 October 2023).
- Martínez-Barrón, R.A.; Aguirre-Calderón, O.A.; Vargas-Larreta, B.; Jiménez-Pérez, J.; Treviño-Garza, E.J.; Yerena, J.I. 2016. Modelación de biomasa y carbono arbóreo aéreo en bosques del estado de Durango. Rev. Mex. Cienc. Forest. 2016, 7, 91–105. [Google Scholar] [CrossRef][Green Version]
- Lira-Tuero, L.A.; Corral-Rivas, J.J.; Padilla-Martínez, J.R.; López-Serrano, P.M.; Pompa-García, M.; Cruz-Cobos, F. Efecto del manejo forestal en biomasa y carbono en bosques de Durango. Rev. Mex. Agroecosist. 2019, 6, 89–97. [Google Scholar]
- Morales-Inocente, M.Á.; Luna, J.A.N.; Bretado, M.Á.E.; Cobos, F.C.; Hernández, F.J.; Vargas-Larreta, B. Carbono retenido en biomasa y suelo en bosques de El Salto, Durango, México. Investig. Cienc. Univ. Aut. Aguascalientes 2020, 80, 5–13. [Google Scholar] [CrossRef]
- Návar-Chaídez, J.J. Los bosques templados del estado de Nuevo León: El manejo sustentable para bienes y servicios ambientales. Madera Bosques 2010, 16, 51–69. [Google Scholar] [CrossRef]
- García-García, S.A.; Rodríguez, E.A.; Calderón, O.A.; Garza, E.T.; Ávila, G.G. Carbon stock and horizontal structure of a temperate forest in Guadalupe y Calvo, Chihuahua. Rev. Mex. Cienc. Forest 2021, 12, 70. [Google Scholar] [CrossRef]
- Rascón-Solano, J.; Galván-Moreno, V.S.; Aguirre-Calderón, O.A.; García-García, S.A. Caracterización estructural y carbono almacenado en un bosque templado frío censado en el noroeste de México. Rev. Mex. Cie. For. 2022, 13, 136–165. [Google Scholar] [CrossRef]
- Comision Nacional Forestal (CONAFOR). Modelo de Predicción del Carbono Almacenado-INFyS 2015-2020. Mexico, 2020. Available online: https://snmf.cnf.gob.mx/principaleindicadoresforestalesciclo-2015-2020/ (accessed on 6 October 2023).
- Soto-Cervantes, J.A.; Corral-Rivas, J.J.; Domínguez-Calleros, P.A.; López-Serrano, P.M.; Montiel-Antuna, E.; García-Montiel, E.; Pérez-Luna, A. Comparison of carbon content between plantation and natural regeneration seedlings in Durango, Mexico. PeerJ 2023, 11, e14774. [Google Scholar] [CrossRef] [PubMed]
- Chávez-Rodríguez, N. Estudio Regional Forestal de la Unidad de Manejo Forestal Guadalupe y Calvo A. C. Clave 08-08; y Consultoría Ecosistemas y Asociación Regional de Silvicultores de Guadalupe y Calvo A.C.; Estado de Chihuahua, Mexico, 2009; 188p. Available online: www.conafor.gob.mx:8080/documentos/docs/9/1147ERF_UMAFOR0808.pdf (accessed on 6 October 2023).
- Návar-Cháidez, J.J.; González-Elizondo, S. Diversidad, estructura y productividad de bosques templados de Durango, México. Polibotánica 2009, 27, 71–87. [Google Scholar]
- Lehman, C.L.; Tilman, D. Biodiversity, stability, and productivity in competitive communities. Am. Nat. 2000, 156, 534–552. [Google Scholar] [CrossRef] [PubMed]
- Encina-Domínguez, J.A.; Zárate-Lupercio, A.; Estrada-Castillón, E.; Valdés-Reyna, J.; Villarreal-Quintanilla, J.Á. Composición y aspectos estructurales de los bosques de encino de la sierra de Zapalinamé, Coahuila, México. Acta Bot. Mex. 2009, 86, 71–108. [Google Scholar] [CrossRef]
- Arruda, D.; Oliveira, D.B.; Vieira, F.C.; Soares, G.T.; Duque, R.; D’Ăngelo, S.; Ferreira, Y.R. Structural aspects and floristic similarity among tropical dry forest fragments with different management histories in Northern Minas Gerais, Brazil. Rev. Árvore 2011, 35, 131–142. [Google Scholar] [CrossRef]
- Hernández-Stefanoni, J.L.; Dupuy, J.M.; Tun-Dzuland, F.; May-Pat, F. Influence of landscape structure and stand age on species density and biomass of a tropical dry forest across spatial scales. Landsc. Ecol. 2011, 26, 355–370. [Google Scholar] [CrossRef]
- Boisvenue, C.; Bergeron, Y.; Bernier, P.; Peng, C. Simulations show potential for reduced emissions and carbon stocks increase in boreal forests under ecosystem management. Carbon Manag. 2012, 3, 553–568. [Google Scholar] [CrossRef]
- Ameray, A.; Bergeron, Y.; Valeria, O.; Montoro Girona, M.; Cavard, X. Forest carbon management: A review of silvicultural practices and management strategies across boreal, temperate and tropical forests. Curr. Forestry Rep. 2021, 7, 245–266. [Google Scholar] [CrossRef]
- Perry, D.A. The scientific basis of forestry. Ann. Rev. Ecol. Syst. 1998, 29, 435–466. [Google Scholar] [CrossRef]
- Jactel, H.; Brockerhoff, E.G. Tree diversity reduces herbivory by forest insects. Ecol. Lett. 2007, 10, 835–848. [Google Scholar] [CrossRef]
- Löf, M.; Dey, D.C.; Navarro, R.M.; Jacobs, D.F. Mechanical site preparation for forest restoration. New For. 2012, 43, 825–848. [Google Scholar] [CrossRef]
- Jiménez-Esquilín, A.E.; Stromberger, M.E.; Shepperd, W.D. Soil scarification and wildfire interactions and effects on microbial communities and carbon. Soil Sci. Soc. Am. J. 2008, 72, 111–118. [Google Scholar] [CrossRef]
- Nordborg, F.; Nilsson, U.; Gemmel, P.; Orlander, G. Carbon and nitrogen stocks in soil, trees and field vegetation in conifer plantations 10 years after deep soil cultivation and patch scarification. Scan. J. For. Res. 2006, 21, 356–363. [Google Scholar] [CrossRef]
- Mjöfors, K.; Strömgren, M.; Nohrstedt, H.-Ö.; Johansson, M.-B.; Gärdenäs, A.I. Indications that site preparation increases forest ecosystem carbon stocks in the long term. Scand. J. For. Res. 2017, 32, 717–725. [Google Scholar] [CrossRef]
- Carroll, M.; Milakovsky, B.; Finkral, A.; Evans, A.; Ashton, M.S. Managing carbon sequestration and storage in temperate and boreal forests. In Managing Forest Carbon in a Changing Climate; Ashton, M.S., Tyrrell, M.L., Spalding, D., Gentry, B., Eds.; Springer: Dordrecht, the Netherlands, 2012; pp. 205–226. [Google Scholar] [CrossRef]
- Ruano, I.; Rodriguez-Garcia, E.; Bravo, F. Effects of pre-commercial thinning on growth and reproduction in post-fire regeneration of Pinus halepensis Mill. Ann. For. Sci. 2013, 70, 357–366. [Google Scholar] [CrossRef]
- Parajuli, R.; Chang, S.J. Carbon sequestration and uneven-aged management of loblolly pine stands in the Southern USA: A joint optimization approach. For. Policy Econ. 2012, 22, 65–71. [Google Scholar] [CrossRef]
- Nilsen, P.; Strand, L.T. Carbon stores and fluxes in even-and uneven-aged Norway spruce stands. Silva Fenn. 2013, 47, 1–15. [Google Scholar] [CrossRef]
- Harrington, R.A.; Fownes, J.H.; Vitousek, P.M. Production and resource use efficiencies in N-and P-limited tropical forests: A comparison of responses to long-term fertilization. Ecosystems 2001, 4, 646–657. [Google Scholar] [CrossRef]
- Lal, R. Forest soils and carbon sequestration. For. Ecol. Manag. 2005, 220, 242–258. [Google Scholar] [CrossRef]
- Pretzsch, H.; del Rio, M.; Ammer, C.; Avdagic, A.; Barbeito, I.; Bielak, K.; Brazaitis, G.; Coll, L.; Dirnberger, G.; Drössler, L.; et al. Growth and yield of mixed versus pure stands of Scots pine (Pinus sylvestris L.) and European beech (Fagus sylvatica L.) analysed along a productivity gradient through Europe. Eur. J. For. Res. 2015, 134, 927–947. [Google Scholar] [CrossRef]
- Naeem, S.; Thompson, L.J.; Lawler, S.P.; Lawton, J.H.; Woodfin, R.M. Declining biodiversity can alter the performance of ecosystems. Nature 1994, 368, 734. [Google Scholar] [CrossRef]
- Tilman, D.; Knops, J.; Wedin, D.; Reich, P.; Ritchie, M.; Siemann, E. The influence of functional diversity and composition on ecosystem processes. Science 1997, 277, 1300–1302. [Google Scholar] [CrossRef]
- Potapov, P.; Hansen, M.C.; Laestadius, L.; Turubanova, S.; Yaroshenko, A.; Thies, C.; Smith, W.; Zhuravleva, I.; Komarova, A.; Minnemeyer, S.; et al. The last frontiers of wilderness: Tracking loss of intact forest landscapes from 2000 to 2013. Sci. Adv. 2017, 3, e1600821. [Google Scholar] [CrossRef] [PubMed]
- Loomis, J.J.; Knaus, M.; Dziedzic, M. Integrated quantification of forest total value. Land Use Pol. 2019, 84, 335–346. [Google Scholar] [CrossRef]
- Lin, Y.-R.; Liu, W.-Y. Assessment of timber value and carbon credits provided by pure and mixed forests in Taiwan. Front. For. Glob. Change 2023, 6, 1246992. [Google Scholar] [CrossRef]
- Ranero, A.; Covaleda, S. The financing of forest carbon projects: Existing experiences and opportunities in Mexico. Madera Bosques 2018, 24, 1–28. [Google Scholar] [CrossRef]
- Ciccarino, I.D.M.; Fernandez, M.E.S.T. A bibliometric review of stakeholders’ participation in sustainable forest management. Can. J. For. Res. 2023, 54(3), 1–16. [Google Scholar] [CrossRef]
- Comision Nacional Forestal (CONAFOR). 2017. Available online: https://www.gob.mx/conafor/documentos/iniciativa-de-reduccion-de-emisiones (accessed on 4 February 2024).
- Luján-Álvarez, C.; Olivas-Garcia, J.M.; Vazquez-Alvarez, S.; Hernandez-Salas, J.; Castruita-Esparza, L.U. Strategic participatory forest management system for sustainable forestry development. Madera Bosques 2021, 27, e2712260. [Google Scholar] [CrossRef]


| Altitudinal Gradient, m | Number of Plots |
|---|---|
| 1850–2100 | 19 |
| 2101–2350 | 64 |
| 2351–2600 | 61 |
| 2601–2850 | 7 |
| Name and Formula | Description of Terms | Range of Values |
|---|---|---|
| Shannon–Weiner Index S H’= − ∑ Pi × ln(Pi) i=1 | H’ = Shannon–Weiner Index S = Total number of species Pi = proportion of individuals of species i | 1–5 |
| Pielou’s Evenness Index | H’: Shannon-Wiener Index S: Species richness | 0–1 |
| Sorensen Index Is Hutchenson t-test t = | a: number of species community a b: number of species community b c: number of similar species in both communities : Diversity of sample 1 : Diversity of sample 2 var: variance | 0–1 Significant or not significant at p < 0.05 |
| Altitudinal Gradient, m | No. Sampled Trees | No. Species (S) | H’ | Evenness (J’) |
|---|---|---|---|---|
| 1850–2100 | 861 | 26 | 2.75 b 1 | 0.84 |
| 2101–2350 | 3829 | 36 | 2.95 a | 0.82 |
| 2351–2600 | 4164 | 28 | 2.73 b | 0.82 |
| 2601–2850 | 378 | 17 | 2.37 c | 0.83 |
| Altitudinal Gradient, m | 1850–2100 | 2101–2350 | 2351–2600 | 2601–2850 |
|---|---|---|---|---|
| 1850–2100 | 1 | 0.78 | 0.79 | 0.61 |
| 2101–2350 | 0.78 | 1 | 0.75 | 0.52 |
| 2351–2600 | 0.79 | 0.75 | 1 | 0.71 |
| 2601–2850 | 0.61 | 0.52 | 0.71 | 1 |
| No. of Plots | Altitudinal Gradient, m | Minimum (Mg C ha−1) | Maximum (Mg C ha−1) | C Average (Mg C ha−1) | Area (ha) | Total (Mg C) per Gradient | MgCO2e |
|---|---|---|---|---|---|---|---|
| 19 | 1850–2100 | 0.99 | 21.03 | 7.85 | 98,355.98 | 745,983 | 2,737,759 |
| 64 | 2101–2350 | 1.50 | 31.32 | 9.35 | 361,111.81 | 3,377,069 | 12,393,845 |
| 61 | 2351–2600 | 0.93 | 40.87 | 14.33 | 294,245.79 | 4,217,602 | 15,478,600 |
| 7 | 2601–2850 | 2.04 | 35.90 | 14.82 | 33,180.56 | 491,844 | 1,805,067 |
| Altitude | 1850–2100 m | 2101–2350 m | 2351–2600 | 2601–2850 | ||||
|---|---|---|---|---|---|---|---|---|
| Diameter, cm | Sampled Trees | C Storage Mg ha−1 | Sampled Trees | C Storage Mg ha−1 | Sampled Trees | C Storage Mg ha−1 | Sampled Trees | C Storage Mg ha−1 |
| 10 | 45 | 0.07 | 352 | 0.18 | 464 | 0.25 | 37 | 0.22 |
| 15 | 67 | 0.26 | 513 | 0.53 | 786 | 0.93 | 52 | 0.65 |
| 20 | 44 | 0.36 | 289 | 0.68 | 498 | 1.42 | 31 | 0.86 |
| 25 | 26 | 0.39 | 153 | 0.65 | 269 | 1.47 | 26 | 1.29 |
| 30 | 14 | 0.34 | 83 | 0.66 | 150 | 1.38 | 17 | 1.70 |
| 35 | 5 | 0.22 | 43 | 0.51 | 91 | 1.29 | 14 | 1.58 |
| 40 | 4 | 0.22 | 23 | 0.42 | 56 | 1.15 | 10 | 1.79 |
| 45 | - - | - - | 10 | 0.28 | 22 | 0.60 | 4 | 1.07 |
| 50 | - - | - - | 8 | 0.25 | 7 | 0.31 | 3 | 0.68 |
| 55 | - - | - - | 2 | 0.09 | 4 | 0.20 | - - | - - |
| 60 | - - | - - | - - | - - | 2 | 0.14 | - - | - - |
| Total | 205 | 1.87 | 1476 | 4.27 | 2349 | 9.13 | 194 | 9.83 |
| Altitude | 1850–2100 m | 2101–2350 m | 2351–2600 m | 2601–2850 m | ||||
|---|---|---|---|---|---|---|---|---|
| Diameter, cm | Sampled Trees | C Storage Mg ha−1 | Sampled trees | C Storage Mg ha−1 | Sampled Trees | C Storage Mg ha−1 | Sampled Trees | C Storage Mg ha−1 |
| 10 | 181 | 0.43 | 581 | 0.39 | 392 | 0.28 | 17 | 0.11 |
| 15 | 244 | 1.21 | 856 | 1.23 | 527 | 0.76 | 41 | 0.63 |
| 20 | 104 | 1.12 | 360 | 1.05 | 219 | 0.66 | 15 | 0.42 |
| 25 | 34 | 0.65 | 156 | 0.83 | 131 | 0.67 | 8 | 0.46 |
| 30 | 29 | 0.74 | 50 | 0.43 | 69 | 0.56 | 5 | 0.44 |
| 35 | 12 | 0.64 | 26 | 0.27 | 38 | 0.45 | 3 | 0.38 |
| 40 | 3 | 0.21 | 11 | 0.17 | 15 | 0.27 | - - | - - |
| 45 | 5 | 0.28 | 3 | 0.05 | 7 | 0.15 | - - | - - |
| 50 | 1 | 0.10 | 5 | 0.14 | 6 | 0.17 | - - | - - |
| 55 | 1 | 0.15 | 3 | 0.11 | 6 | 0.19 | - - | - - |
| 60 | - - | - - | 3 | 0.10 | - - | - - | - - | - - |
| Total | 614 | 5.52 | 2054 | 4.78 | 1410 | 4.16 | 89 | 2.45 |
Disclaimer/Publisher’s Note: The statements, opinions and data contained in all publications are solely those of the individual author(s) and contributor(s) and not of MDPI and/or the editor(s). MDPI and/or the editor(s) disclaim responsibility for any injury to people or property resulting from any ideas, methods, instructions or products referred to in the content. |
© 2024 by the authors. Licensee MDPI, Basel, Switzerland. This article is an open access article distributed under the terms and conditions of the Creative Commons Attribution (CC BY) license (https://creativecommons.org/licenses/by/4.0/).
Share and Cite
Castruita-Esparza, L.U.; Narváez-Flores, R.; Gutiérrez, M.; Mojica-Guerrero, A.S.; Quiñones-Barraza, G.; Hernández-Salas, J. Structure and Carbon Capture of a Temperate Mixed Forest across Altitudinal Gradients in Northern Mexico. Land 2024, 13, 461. https://doi.org/10.3390/land13040461
Castruita-Esparza LU, Narváez-Flores R, Gutiérrez M, Mojica-Guerrero AS, Quiñones-Barraza G, Hernández-Salas J. Structure and Carbon Capture of a Temperate Mixed Forest across Altitudinal Gradients in Northern Mexico. Land. 2024; 13(4):461. https://doi.org/10.3390/land13040461
Chicago/Turabian StyleCastruita-Esparza, Luis U., Raúl Narváez-Flores, Mélida Gutiérrez, Aldo S. Mojica-Guerrero, Gerónimo Quiñones-Barraza, and Javier Hernández-Salas. 2024. "Structure and Carbon Capture of a Temperate Mixed Forest across Altitudinal Gradients in Northern Mexico" Land 13, no. 4: 461. https://doi.org/10.3390/land13040461
APA StyleCastruita-Esparza, L. U., Narváez-Flores, R., Gutiérrez, M., Mojica-Guerrero, A. S., Quiñones-Barraza, G., & Hernández-Salas, J. (2024). Structure and Carbon Capture of a Temperate Mixed Forest across Altitudinal Gradients in Northern Mexico. Land, 13(4), 461. https://doi.org/10.3390/land13040461