Abstract
The COVID-19 pandemic has spurred the resurgence of the informal street vending economy. This revival has boosted the market economy but has also challenged urban governance. Recognizing street vending deregulation as both a stimulus for employment and a potential challenge to hygiene and safety, this study evaluates the suitability of street vending within Wuchang District of Wuhan, China. The methodology unfolds in four steps: constructing an indicator system based on a policy and literature review, a spatial quantitative analysis via GIS, weight allocation through expert consultation and entropy methods, and the identification of suitable areas as well as strategies. Findings reveal suitability clusters centered around key urban nodes, extending across central and mid-western zones through corridors like Zhongnan Road, demonstrating the potential for centralized management and economic permeation into surrounding areas. The analysis of land-use compatibility showed that commercial, park, and residential lands offer the highest suitability for vending activities, proposing management strategies tailored to enhance business in commercial areas, flexible configurations in residential zones, diverse development in parks, quality-oriented development in public squares, and strict control in scenic and tourist facilities. This study not only deepens our understanding of the geographical distribution of and factors influencing street vending, but also proposes integrated management strategies for vending in urban public spaces, fostering vibrant, inclusive, and sustainable urban environments.
1. Introduction
1.1. Street Vending Deregulation: Urban Public Space Challenges
Amid the COVID-19 pandemic, the global economy has faced stagnation or regression. Numerous formal businesses downsized or shut down, leading to widespread unemployment [1]. The global supply chain has been severely disrupted [2], resulting in shortages in formal retail channels. To address the escalating unemployment rate and provide a channel for the supply of scarce goods, the China Central Civilization Office declared that street vending [3], occupied businesses, and roadside markets would be excluded from that year’s civilized cities assessment. Regions across China have temporarily eased regulations on the informal economy, implementing a range of policies to support street vending. In this context, a surge of street vendors into cities has provided a means for some unemployed individuals to sustain themselves, while also stimulating urban consumer vitality [4]. According to the National Bureau of Statistics of China, after street vending deregulation, the national urban registered unemployment rate fell from 6.0% to 4.2%. Street vending is popular among vendors and consumers across various public spaces in cities, due to its spontaneity and non-permanence [5]; however, as a form of the informal economy, street vending often operates outside formal regulatory systems, sometimes evading official oversight and management [6]. This can pose safety and hygiene risks to urban public spaces [7]. Thus, while street vending deregulation can stimulate employment, it may also impact the hygiene and safety of urban public spaces. Thus, the practical issues addressed in this study include how to strike a balance between the economic dynamism of street vending and maintaining order within urban public spaces.
1.2. Literature Review
Urban public space supports the activities of street vending. Urban planning could coordinate street vending with various urban functions. By doing so, it is possible to mitigate the inherent conflict between street vending and urban planning, safeguarding vendors’ livelihoods and rights while elevating the health and safety standards of public spaces. Current research on street vending and urban planning focuses on spatial management [8,9,10], the spatial distribution characteristics of street vending [11,12,13], and the interplay between street vending and urban spaces [14,15]. Specifically, research on spatial management emphasizes creating regulatory frameworks [16,17], with zoning regulations identified as effective strategies for management and control [18]. Studies on the distribution characteristics have focused on the scale, density, and spatial patterns of street vending at the street scale [19,20,21,22]. As for the interrelationship, research still focuses on the street scale [23], investigating the relationship between the spatial organization patterns of street vending and the width as well as accessibility of streets [24]. From a methodological perspective, most current research employs qualitative methods like literature analyses and social surveys to analyze the spatial distribution of street vending within urban planning [19,20]. This indicates that current research primarily focuses on the theoretical regulation and spatial organization characteristics of street vending at the street scale. Research has often focused on street vending as the primary subject, examining its characteristics and impacts, while public space is relegated to the role of a passive object. Proactively identifying suitable public space for street vending, utilizing quantitative methods at the urban scale, remains unexplored. A shift from passively accommodating street vending in public space to actively planning suitable spaces for street vending is necessary [25]. Urban public space needs to provide economic vitality for street vendors, while also mitigating the safety and hygiene issues that street vending may bring. Planning suitability evaluation is crucial for policy decisions and the management of public space. Thus, this study focuses on two main research questions:
- (1)
- How to identify suitable areas for street vending at the urban scale with spatial information?
- (2)
- What are the management strategies for street vending in different public spaces?
1.2.1. Influencing Factors of Street Vending in Urban Planning
Identifying the factors influencing street vending within urban planning is crucial for analyzing suitable areas. Policy documents reflect national or local policy orientations and planning principles, which are some of the main bases for influencing factors. These documents not only reveal the attitudes and expectations of policymakers towards the street vendor economy, but also clarify the policy framework for supporting the development of the street vending economy. Therefore, this study analyzes the street vendor policy documents of 10 provinces in China and summarizes five main objectives: ‘location restriction’, ‘environmental quality’, ‘economic dynamism’, ‘social participation’, and ‘infrastructure’ (detailed policy document information is provided in Table A1). Specifically, the policies tend to stipulate specific areas where street vendors are allowed. Commercial streets, commercial complexes, open parks, squares, residential areas, etc., are designated as specific areas where street vendors are allowed [26], which helps promote business vitality and community participation within the region. ‘Environmental quality’ emphasizes the environmental sanitation and beauty of a street vending area, so spatial conditions that can reduce the impact of street vendors on the environment should be considered [27]. ‘Economic dynamism’ describes the surrounding environment that promotes the economic potential of street vendors. ‘Social participation’ focuses on the interaction and participation between street vendors and community members [28]. ‘Infrastructure’ means that a suitable street vending area needs sufficient infrastructure to support its operations; thus, ‘location restriction’ can provide a policy basis for the scope of urban public space in this study. The remaining four objectives can serve as criteria in the suitability evaluation to guide the selection of factors.
The literature describes the actual operation mechanisms and socioeconomic effects of street vendors, providing a rich theoretical basis and practical cases. It also serves as one of the main bases for influencing factors of street vending in urban planning. To accurately identify the factors, this study searches for high-quality literature using ‘street vending’, ‘mobile vending’, and ‘micro business facilities’ as keywords, and examines the content of the literature for relevant factors (Table A2). Based on the four evaluation criteria summarized from policy documents, this study searched for influencing factors related to urban space, society, the economy, and the environment, and 15 factors were screened (Table 1). Especially during the COVID-19 pandemic, safe social distances, greening rates, and air quality have become factors [29]. The street vending area needs enough open space and appropriate greening space. Since street vending activities may cause air and noise pollution in the surrounding environment, good spatial openness is helpful for air circulation and noise diffusion [30]. Visibility is directly related to the sales opportunities and incomes of street vendors [31]. Commercial agglomeration, diverse business types and consumer demand refers to the economic agglomeration effect, which can create a vibrant and attractive atmosphere for street vending [32]. Diverse business types can attract a wider customer base [33]. Crowd density, local popularity, and local publicity can represent customer traffic and sales potential [34]. A good reputation and popularity can attract more customers. Greater customer demand indicates a strong market for street vendors. Land price can affect the cost of operating a street vendor stall. High land prices may make it difficult for vendors to find affordable locations; therefore, areas with moderate or lower land prices may be more suitable for street vendors [35]. Pavement walkability is a basic requirement for street vendor facility areas, as sufficient walking width can provide more operating space for street vendors. Good pavement walkability ensures a smooth and safe walking experience for pedestrians [36]. Traffic accessibility refers to the traffic convenience of the street vendor area, which is crucial for customer traffic [31]. Street lighting can improve the safety and attractiveness of night stalls [37]. Since street vending often lacks fixed cleaning facilities [38], sanitation facilities help improve the environment of an area where vendors are located.

Table 1.
Influencing factors of street vending in urban planning.
1.2.2. Quantitative Method Based on GIS Spatial Analysis
To some extent, there is a lack of methods for quantifying spatial information related to street vending; however, as the aim of this study is to identify suitable locations for street vending at the urban scale, spatial information data are essential for interpreting various factors.
Quantitative spatial analysis methods are indispensable in identifying suitable areas for street vending. This study analyzes the spatial quantification methods of the factors mentioned in Section 1.2.1 through a literature review. Detailed spatial analysis methods and applications are provided in Table A3. Among these methods, GIS-based spatial analysis tools are frequently adopted by scholars in quantifying spatial information. This study categorizes these spatial analysis methods into two types:
- (1)
- Data analysis: Performing various analytical operations on spatial data to reveal spatial patterns and trends. In the current research, the application of GIS-based data analysis methods has matured considerably. GIS spatial analysis tools that are commonly used include Getis–Ord Gi, the Shannon diversity index, kernel density estimation (KDE), hot spot analysis, space syntax, Kriging interpolation, spatial clustering, and buffer analysis [39,40,41,42,43,44,45,46,47,48,49,50,51,52,53]. For example, Zhang employed a Getis–Ord Gi* analysis based on POI data to examine the spatial distribution characteristics of commercial outlets in Chongqing’s main urban areas [39]. Long et al. utilized space syntax to investigate the accessibility of urban parks in Changsha City [43]. Krisp et al. used a kernel density analysis to analyze crowd movement patterns [41]. Derdouri and Murayama applied Kriging interpolation to estimate and map land prices in Fukushima Prefecture, Japan [46].
- (2)
- Spatial modeling and simulation: Creating spatial models and performing simulations to assess spatial changes under different scenarios. For three-dimensional space factors, spatial modeling and simulation tools are commonly used in three-dimensional urban models [54,55]. For example, some scholars utilize GIS spatial modeling methods to analyze the three-dimensional visibility and visual quality of urban open spaces [54]. These examples demonstrate the diverse applications of GIS spatial analysis methods in various research domains, highlighting their effectiveness in extracting meaningful insights from spatial data.
Based on a literature review, these influencing factors, in conjunction with GIS spatial analysis, can provide a basis for the indicators and methods used in identifying suitable areas for street vending, thereby offering a scientific and empirical foundation for identifying such areas.
2. Research Framework
This study investigates the suitability evaluation of street vending planning in urban public spaces. It aims to identify suitable areas for street vending at the city scale, analyze the characteristics of suitability levels in different public spaces, and subsequently propose management strategies for street vending. The research process consists of four steps: (1) construction of an indicator; (2) spatial quantitative analysis; (3) weight allocation; and (4) identification of suitable areas and strategies (Figure 1).
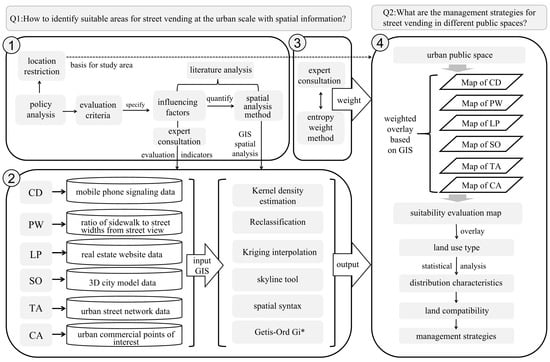
Figure 1.
Research framework.
First, based on policy documents and a literature review, the influencing factors of street vending in urban planning are elaborated. Five criteria are extracted from policies: ‘location restriction’, ‘environmental quality’, ‘economic dynamism’, ‘social participation’, and ‘infrastructure’. Among these, ‘location restriction’ serves as the basis for the study area, while the remaining four criteria are used as standards for suitability evaluation. Based on these criteria, 15 detailed influencing factors are identified from four aspects: urban space, social, economic, and environmental aspects. Due to similarities and correlations among these factors, six representative factors are selected through expert consultation: crowd density (CD), pavement walkability (PW), land price (LP), spatial openness (SO), traffic accessibility (TA), and commercial agglomeration (CA). These six factors serve as the indicators for suitability evaluation in this study. The procedure of indicator selection is discussed in Section 3.2.1. Second, based on a review of research on GIS spatial analysis methods, this study proposes spatial quantitative analysis methods for each indicator based on the GIS platform: kernel density estimation, reclassification, Kriging interpolation, skyline tool, spatial syntax, and the Getis-Ord Gi* index. The application of GIS spatial analysis techniques facilitated the processing of raw data into visual layers, enhancing the identification of suitable vending areas. The spatial analysis methods of all of the above indicators is detailed in Section 3.2. Third, by integrating both qualitative and quantitative methods, weights were assigned to indicators, balancing expert consultation with entropy weight method results to finalize the indicator weights. The calculation of weight is described in depth in Section 3.3. Finally, the six indicator layers are weighted and overlaid using the GIS Raster Calculator to generate the final street vending suitability map. The procedure of suitability map generating is discussed in Section 3.4. The results are then overlaid and analyzed with the land-use types in Wuchang District. The distribution characteristics of different suitability areas within various land-use types for considering land compatibility for street vending are analyzed, and management strategies for street vending are correspondingly proposed. Details are discussed in Section 5.
3. Data Collection and Research Method
3.1. Case Study Area and Data Source
Wuchang District, situated in Wuhan’s southeast and on the south bank of the Yangtze River, lies adjacent to Qingshan District and borders Hongshan District to the southeast. It is a central urban area of Wuhan and a key part of Wuchang Town (Figure 2). The total area of Wuchang District is 107.76 km2, of which the land area is 60.6 km2. As of the end of 2022, the permanent population of Wuchang District was 1.2705 million.
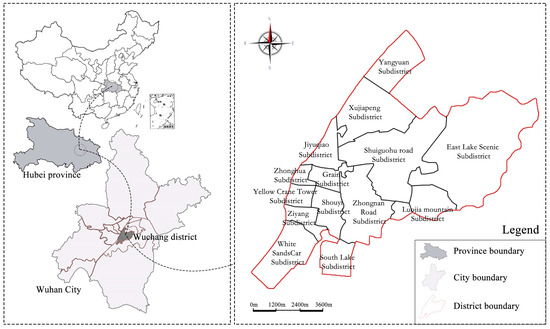
Figure 2.
Case study area.
The reasons for choosing Wuchang District as the study area are as follows:
- (1)
- Traffic advantages: Wuchang District is a traffic hub connecting other areas of Wuhan City. This geographical location and convenient transportation provide a large number of potential customers for street vending.
- (2)
- Consumption characteristics of the population: As a cultural and educational district, Wuchang District has many universities and research institutions, gathering a large number of students and young workers. This group generally has a high acceptance of new things and cost-effective commodities, providing a good consumer market for street vending.
- (3)
- Historical context: Wuchang District is an ancient city with a long history. As street vending is a traditional form of commerce, the rich historical context of Wuchang District lays a foundation for it.
- (4)
- Urban public space: As an old urban area, Wuchang District possesses many public spaces, such as squares, streets, and parks, which are ideal places for the development of street vending.
Based on the restrictions on street vending areas determined in the policy analysis, this study selected commercial complexes, open parks, squares, and residential areas as the research areas for urban public space. Therefore, areas covering administrative, medical, and educational use, lakes, mountains, residential and industrial areas, urban expressways, arterial roads, and high-speed rail tracks were excluded. The data used in this study are shown in Table 2.
Table 2.
Data item, usage and source.
3.2. GIS Spatial Analysis of Indicators
3.2.1. Indicator Selection
Based on a literature analysis, 15 influencing factors were obtained, but due to the similarities and correlations between these factors, it was necessary to find representative indicators through expert consultation [56,57]. In the process of selecting indicators for street vending, a discussion group composed of 20 experts from the fields of urban planning and management was convened. The group was tasked with evaluating 15 influencing factors across four criteria layers, focusing on the relevance of these factors to the suitability of areas for street vending and their representativeness compared to similar factors. The expert consultation questionnaire (Table A4, Table A5, Table A6 and Table A7) and results (Table A8) are provided in Appendix B. Six final indicators were finally determined: crowd density, pavement walkability, land price, spatial openness, traffic accessibility, and commercial agglomeration.
3.2.2. Crowd Density Determination Using Kernel Density Estimation
A higher crowd density means more potential consumers for street vendors [34]. The indicator data come from mobile phone signaling data obtained from the Amap. This type of data is collected through the mobile phone network and can display the distribution characteristics of the population by using mobile phones at different time periods in real time. The business hours of street vending can usually be divided into three main periods: morning, noon, and evening. Therefore, the crowd distribution points of Wuchang District were collected at 9:00 a.m., 2:00 p.m., and 7:00 p.m. on working days and non-working days. KDE in GIS was used to analyze the point data [41], generating crowd density distribution maps for each time period (Figure 3). Finally, all of the layers were superimposed to obtain the final crowd density distribution map. KDE is a non-parametric method often used to analyze and estimate the density function of data points [58], which is frequently used to analyze characteristics of population density distributions, particularly in fields such as Geographic Information Systems (GIS), social sciences, ecology, and market research [59,60,61,62]. Especially, in the context of GIS and urban planning, KDE can be used to identify areas of high population density within cities [63]. The formula for calculating the CD using KDE is as follows:
where represents the kernel density calculation at spatial position n, with k as the spatial weight function. The bandwidth (h), also the search radius, determines the scope; xi is the position of the ith data point within h, where the path distance at x is constrained by h; d denotes the data dimension.
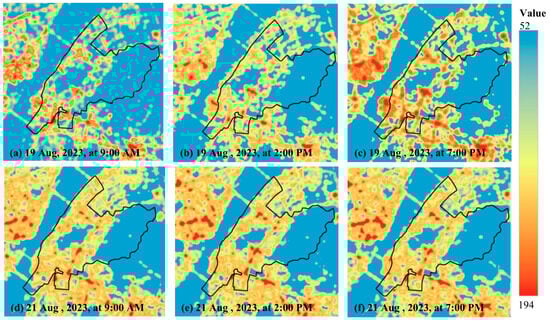
Figure 3.
Crowd density distribution for each time period: Subfigures (a–c) represent the population distribution during different time periods on non-workdays; Subfigures (d–f) represent the population distribution during different time periods on workdays.
3.2.3. Pavement Walkability Using Reclassification
Street vending impacts the comfort and safety of pedestrians; therefore, sufficient walking space can preserve public space quality and pedestrian experience [64]. Referencing the walkability quantification indicators proposed by Guzman et al. [49] for Colombian cities, pavement walkability is quantified through the ratio of sidewalk width to street width (the formula is below), a method frequently employed in urban planning to assess and enhance walkability and pedestrian-friendliness [65]. The indicator data were derived from street view images in Google Street View every 200 m, and the ratio was calculated for each street view image. A point layer was created in GIS based on the collected geographic locations. The ratio of pedestrian walkway width to street width was input into the attribute table of the point layer. The reclassification tools of the GIS were used to create a map that intuitively displays the distribution of pavement walkability (PW):
where Wn represents the pixels allocated to pedestrian space in street view image n, while Vn accounts for the pixels dedicated to vehicle space in the same image.
3.2.4. Land Price Using Kriging Interpolation
Land price directly affects the costs of street vendors. In areas with high land prices, street vendors may face higher rental costs, which may limit their profit margins. Urban residents living in areas with lower land prices generally have lower spending power and are therefore more likely to be the main customer base for street vending [22]. The land price data come from real estate websites. Land price information and geographic location of Wuchang District were systematically collected. The data were imported into GIS to create a land price point layer, with each point representing a collected land price data point. Since there are blank areas in the data provided by the real estate website, this study uses the Kriging interpolation method in GIS to predict the land value of unsampled points using existing point data and geostatistical principles, thereby forming a continuous land price distribution map.
3.2.5. Spatial Openness Using the Skyline Tool
The distribution of street vending and crowds will reduce environmental benefits and affect human comfort; therefore, open space can improve ventilation efficiency and air circulation. Based on the existing research on the quantitative evaluation method of spatial openness [66], this paper measures the spatial openness of Wuchang District by constructing a 3D urban model through GIS. The urban building outline and height data of the study area are obtained from OpenStreetMap (OSM). Using the ArcScene module of ArcGIS, a 3D urban model is constructed based on the building outline and height data. Observation points with an interval of 50 m × 50 m are set in the 3D model, and a search radius of 200 m is set for each observation point. Using the Skyline tool in the 3D Analysis of ArcGIS, multiple lines of sight are projected for each observation point, and a boundary between the sky and buildings and other elements is created to generate a skyline map. The ratio of the number of pixels in the visible area of the sky to the total number of pixels in the line of sight of the observation point is the spatial openness (SO) value (the formula is below); the higher the ratio, the greater the spatial openness of the point:
where Nk represents the total number of skyline charts obtained; ri is the pixel count in the ith sky area; and N denotes the total pixel count in each skyline chart.
3.2.6. Traffic Accessibility Using Spatial Syntax
Transportation accessibility affects people’s mobility, as well as local consumption patterns and economic vitality; traffic ability (TA) assesses the study areas within Wuchang District that have good accessibility. Space syntax is a common method for evaluating transportation accessibility [67,68]. This paper obtains the road network vector data of Wuchang District from OSM and uses the Space Syntax Toolkit plugin in QGIS to analyze the integration of road network data (the formula is below). Integration is commonly used to assess the overall accessibility of points within a spatial system and can be used to identify areas of high traffic or pedestrian activity in a city. Depth (Di) reflects the relative distance or interval from one point to another and can be used to explore the most efficient paths:
In the formula, represents the global integration of station i, and m is the total number of road axes in the study area. Di is the average depth value at station i, d represents the distance between two points, Nd is the number of nodes at that distance, s represents the levels of distance, and n is the total number of nodes in the network.
3.2.7. Commercial Agglomeration Using the Getis–Ord Gi* Index
In 1929, the American scholar Reilly proposed the law of retail gravitation, which provided a method to quantify and measure the theory of business districts. Studies have shown that larger retail stores attract more customers [69]. Aggregated locations can enhance the ability of commercial spaces to extend their influence outward. Commercial agglomeration (CA) can represent business vitality and consumption potential through the degree of the agglomeration of commercial areas [70]. The indicator data come from POI data obtained from Baidu Maps using a web crawler tool. These data include the geographic locations of catering, retail, and entertainment businesses. The data are imported into GIS to create a POI point layer. The Getis–Ord Gi* statistical analysis method is used to identify areas with high concentrations of business activity:
In the formulas, xj represents the attribute value of element j; wi,j is the spatial weight between elements i and j; and n denotes the total number of elements.
3.2.8. Classification of Indicator Levels
The Jenks Natural Breaks Optimization in GIS is used to classify the suitability levels of indicators. This method aims to minimize the within-class variance (variation within a dataset) while maximizing the between-class variance (variation between datasets); thus, suitability levels are categorized into five classes: V (excellent), IV (good), III (average), II (fair), and I (poor), each assigned a specific value range (Table 3). The numerical values of CD, PW, LP, SO, TA, and CA are positively correlated with the suitability level; that is, the larger the values of these indicators, the better the suitability level. On the other hand, LP is negatively correlated with the suitability level, which reflects the trade-offs between the indicators. They jointly affect the distribution of suitable areas.
Table 3.
Ranges for the five grades of the indicators.
3.3. Weight Assignment Methods of the Indicator
This paper assigns weights to indicators using a combination of qualitative and quantitative methods. The entropy weight method (EWM) is employed as a quantitative analysis method. The EWM is an objective method for assigning weights based on data variability, which can effectively utilize the inherent information of indicator data and reduce the influence of subjective judgment [71]. An expert consultation based on the analytic hierarchy process (AHP) serves as the qualitative analysis method. The combination of qualitative and quantitative methods not only utilizes the objective information of the data but also incorporates the professional judgment and experience of experts, which improves the accuracy and rationality of weight determination.
3.3.1. Entropy Weight Method (EWM)
Originally a thermodynamics concept, entropy was gradually adopted in information theory. According to the properties of entropy, an indicator’s higher degree of variation and greater difference amplify its impact on the system and its significance in evaluation, thereby increasing its entropy value. The entropy method relies on data and algorithmic steps to calculate weights and determine each indicator’s influence on the system, offering an objective value assignment approach. The steps were as follows:
The first step involves establishing a decision matrix. The matrix, based on original data, uses Xij to represent the value of the ith object for the jth indicator, where i = 1, 2, …, m and j = 1, 2, …, n. Thus, the decision matrix is as follows:
The second step involves data normalization. Evaluation indicators in this study are categorized into two types: positively and negatively correlated. The varying measurement methods for each indicator prevent direct comparison. To scientifically assess the evaluation factors’ suitability based on the principle that higher values indicate better outcomes for positive indicators, and lower values are preferable for negative ones, the decision matrix is normalized to highlight the strengths and weaknesses of each indicator:
where Yij represents the normalized value, Xij is the original data point, and n denotes the number of research objects.
Third, the weight was determined. It was calculated as follows:
Ej represents the entropy of the jth indicator, pij is the normalized value of the indicator, n is the sample size, and ln represents the natural logarithm. The higher the value of the entropy, the greater the dispersion of the data.
Yij is the normalized value of the ith sample on the jth indicator, calculated by dividing each original value by the sum of all values for that indicator. The formula for calculating the weight of each indicator based on its entropy, Ej, is:
where n is the total number of indicators. The weight, Wj, for each indicator is the complement of its entropy (1 minus the entropy), divided by the sum of the complements of the entropy for all indicators. This ensures that the sum of all weights equals 1. It is worth noting that the calculation of this set of formulae assumes that all instances of pij are non-negative. If pij is equal to 0, to avoid the undefined situation in the calculation of pijlnpij, we conventionally set this value to 0. This is the meaning of the formula , .
3.3.2. Expert Consultation Based on the Analytic Hierarchy Process (AHP)
The AHP, developed by Thomas L. Saaty in the 1970s, is a structured technique for organizing and analyzing complex decisions, based on mathematics and psychology [72]. It has been widely applied in various fields, such as decision making, resource allocation, and priority setting. This study utilizes the AHP for consulting experts on the importance of evaluation indicators. Five experts in the field of urban planning were asked to perform pairwise comparisons of these indicators. In pairwise comparison, two indicators are compared at a time in terms of their importance relative to the goal of finding suitable street vending areas. The comparison scale ranges from “absolutely important” to “equally important” to “absolutely less important”. The expert assessments of the evaluation process (Table A9, Table A10, Table A11, Table A12 and Table A13) and weight attribution results (Table A14) are presented in Appendix C.
3.3.3. Comprehensive Weight Calculation
The weight from the AHP set is , and satisfied . The final weight, , was obtained by synthesizing the weights of the AHP and the entropy weight method. The process of the comprehensive weight calculation method is shown in Figure 4. The calculation formula is as follows:

Figure 4.
Process of the comprehensive weight calculation method.
3.4. Suitability Map Production
ArcGIS Desktop 10.6 was used to generate the required map layers through cartographic modeling. The main parameters include geographic coordinates and projected coordinates WGS_1984_UTM_Zone_50N, which are the same as the coordinate system of the data source obtained in this study. Excluding areas such as administrative, medical, and educational land, lakes, mountains, residential areas, industrial areas, urban expressways, main roads, and high-speed rail tracks, commercial complexes, open parks, squares, and residential areas are reserved as potential spaces for street vending (Figure 5). The CD, PW, LP, SO, TA, CA, and LP maps are superimposed and weighted using the GIS Raster Calculator to generate the distribution area suitable for street vending in Wuchang District.
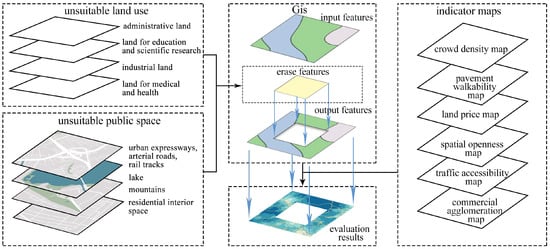
Figure 5.
Process of generating suitability maps.
4. Results
4.1. Result of Suitability Evaluation
The distribution characteristics of each indicator at five levels are generated through a GIS spatial analysis. The results reveal that crowd density is high in most areas, with exceptions like East Lake and Baishazhou Avenue in Wuchang District, where it is low (Figure 6). Hongshan Square, the Chuhehan Street shopping area, Zhongbei Road, the Tanhualin pedestrian commercial street, and along Jiefang Road feature favorable walkability. Similarly, several municipal roads nestled between residential zones and dispersed park squares also demonstrate advantageous walkability (Figure 7). This suggests that these areas provide ample pedestrian space. Land price distribution in residential areas revealed that parcels near Hongshan Square, Tanhualin, and Huanghelou Park commanded higher prices and were more densely located in the central area. In contrast, lower land prices were predominantly found on the northern and southern fringes, displaying a pattern of gradual decline from the central area outward (Figure 8). Areas exhibiting high spatial openness predominantly align with the Zhongnan Road–Zhongbei Road–Joy Avenue corridor (Figure 9). Similarly, vicinities near Rui’an Street and Ya’an Street display notable openness, as does the region between Zhongshan Road and Wuluo Road. This indicates that the space enclosed by the street-side buildings in these areas is relatively open, and the freedom of vision and movement is high. Traffic accessibility analysis identified Hongshan Square as the core traffic hub (Figure 10), with its surrounding areas exhibiting strong accessibility that gradually diminishes with distance. The area along Baishazhou Avenue exhibited the lowest traffic accessibility. Commercial agglomeration aligned with the hotspot analysis clustering model’s statistical characteristics, with key hotspots primarily located in Chuhehan Street, Zhongnan Road, Jiefang Road, Tanhualin, and Houbu Xiang. These areas align with urban business district patterns (Figure 11). These areas can provide a large number of potential customers for street vending.

Figure 6.
Crowd density.
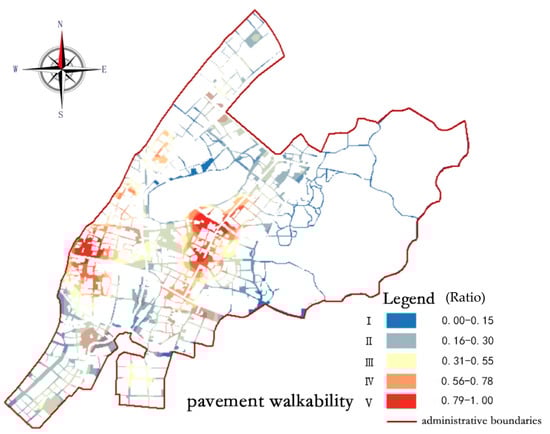
Figure 7.
Pavement walkability.

Figure 8.
Land price.
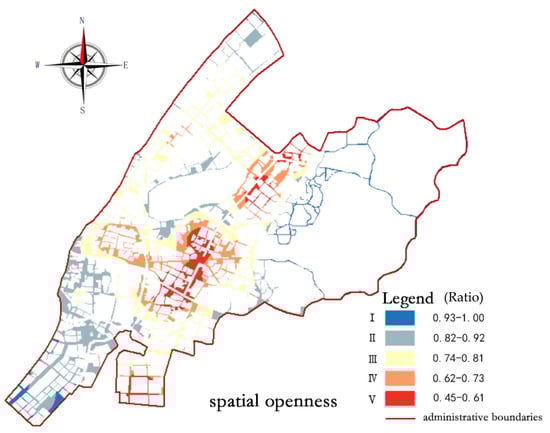
Figure 9.
Spatial openness.
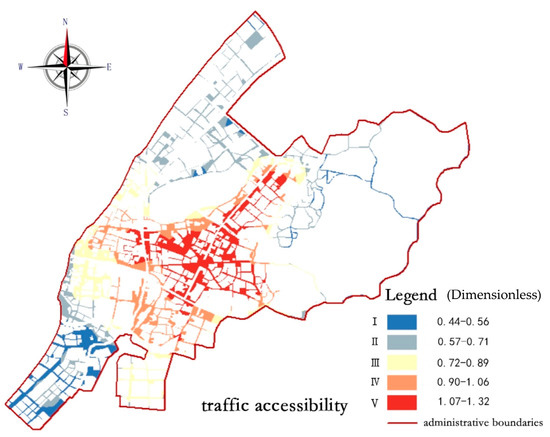
Figure 10.
Traffic accessibility.

Figure 11.
Commercial agglomeration.
The suitability evaluation map for street vending planning (Figure 12) reveals high suitability in areas such as Hongshan Square, the Chuhehan Street shopping area, the Tanhualin commercial area, and the vicinity of Zhongnan Road as well as Jiefang Road. Additionally, smaller park squares, like Shuyi Square, and residential areas, near Rui’an Street and Ya’an Street, demonstrate moderate suitability; however, the suitability in the area near Donghu and Baishazhou is relatively low. Overall, street vending suitability in Wuchang District forms clusters radiating from central points like Hongshan Square, Tanhualin, and the Chuhehan Street shopping districts. These clusters span the central and central–western sections of the study area, with Zhongnan Road, Zhongbei Road, and Jiefang Road acting as corridors that link these hubs and extend to other areas of general suitability. This multi-center and corridor-based street vending layout promotes centralized management and supports economic permeability in surrounding areas through its radial design. This layout helps disperse customer traffic and provides more location options for street vending, which are conducive to forming a more balanced and sustainable street economy ecosystem. Selecting suitable locations for street vending can achieve more efficient resource utilization and promote the prosperity of commercial activities, while ensuring the orderliness and beauty of urban public spaces.

Figure 12.
Suitability evaluation map.
4.2. Statistical Analysis of Suitability Results and Land Use
The suitability evaluation results identified urban public spaces appropriate for street vending. Specifically, urban public spaces comprise diverse elements and form a crucial subsystem within the broader urban physical environment. In order to further assess land compatibility for street vending, this study analyzes the distribution characteristics of the suitability of public spaces. Therefore, this study combines the suitability evaluation results with the land-use types in Wuchang District for analysis (Figure 13). The land-use data come from the Wuhan City Planning One Map Platform. Based on the land-use classification standard of the Wuhan Municipal Government, commercial land, residential land, park land, square land, scenic tour land, and tourist facility land are extracted from the land-use map. Among them, scenic tour land is a natural or artificial landscape area for sightseeing, and tourist facility land includes scenic road facilities. Considering the diversity and comprehensiveness of urban space utilization, these two types of land can be used as a supplement to open parks to provide a more comprehensive perspective for the planning of street vending. This study overlays the suitability evaluation map with the land-use map and calculates the proportion of each land-use type in the suitability map.
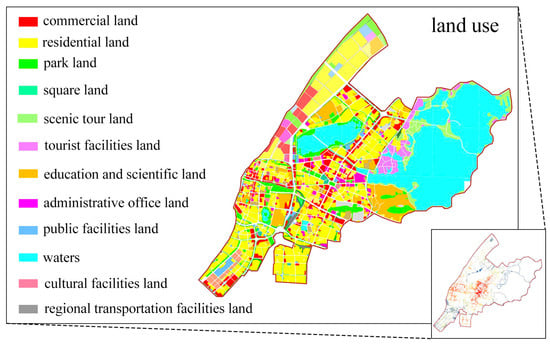
Figure 13.
Land-use types within Wuchang District.
The results (Figure 14) show that commercial land and park land contribute more areas of levels V and IV, followed by residential land. Square land, scenic tour land, and tourist facility land contribute less to the suitability for street vending due to their relatively small areas. The proportion of suitability levels in commercial land gradually increases from level I to V, with a concentration in level V. Residential land is concentrated in levels II to IV, with levels I and V being relatively less common. The distribution of suitability levels in park land is relatively even, with levels I to V having a balanced proportion. It can be observed that the proportions of levels III to V are relatively high in commercial land, residential land, and park land. Square land contributes a relatively smaller number of areas in levels IV and V. Scenic tour land and tourist facility land are mainly concentrated in levels I and II, which means that most public spaces in these two types of land are unsuitable for providing venues for street vending, likely due to low crowd activity, commercial vitality, and poor traffic access.
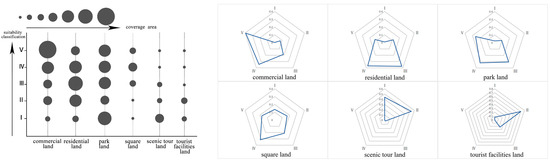
Figure 14.
Proportion of suitability levels. (The left figure represents the proportion of suitability levels within study area; the right figure represents the proportion of suitability levels within different land use types).
5. Discussion
To address the research questions—how to utilize spatial information to determine suitable areas for street vending at the urban scale, and what the control strategies for street vending in different public spaces are—the suitability evaluation of street vending planning in Wuchang District is proposed. The aim is to identify appropriate areas for street vending and analyze various land compatibility for street vending.
5.1. Verification and Discussion of Suitable Area
From an overall layout perspective, our evaluation reveals that suitable areas for street vending in Wuchang District have formed clusters radiating from central points, such as Hongshan Square, Tanhualin, and the Chu River Han Street shopping area. These clusters span the central and western parts of the research area, with Zhongnan Road, Zhongbei Road, and Jiefang Road serving as corridors connecting these hubs. The suitable areas exhibit a multi-center spatial structure interconnected by corridors. Many studies have discussed the relationship between urban spatial structure and commercial development. Some scholars believe that interconnected corridors can enhance regional connectivity, effectively linking different commercial centers within a city and providing convenient transportation for both consumers and merchants [73,74]. A multi-center structure helps balance economic development within a city, avoiding the excessive concentration or dispersion of resources [75]. This balance facilitates the optimal allocation of commercial resources. Through a multi-center structure connected by corridors, stronger commercial centers can exert an economic driving effect on surrounding weaker areas [76,77]. This economic spillover effect can help promote balanced regional economic development and enhance the overall commercial vitality as well as competitiveness of a city.
Additionally, we conducted the verification of specific local areas. Scholars have surveyed and analyzed the current distribution of street vendors in the old neighborhoods in the western part of Wuchang District [78]. By comparing the current distribution with the suitability results for this area, we found that the concentrated areas of street vendor distribution overlap with the suitable areas assessed in this study, especially in the western regions in Desheng Street, Hubu Lane, Dacheng Road, and Huadi Street, showing a high degree of overlap (seen in Figure 15). This consistency, to some extent, validates the effectiveness and reliability of our research findings.
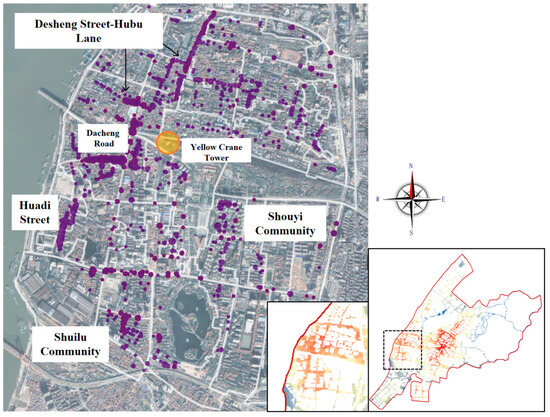
Figure 15.
Current distribution of street vendors in the western region of Wuchang District.
In the evaluation process, it was discovered that areas with high land prices often overlap with areas of high commercial concentration, high accessibility, and high walkability. This finding suggests that high land prices confer certain advantages for street vending, as these areas are likely to attract more foot traffic and potential customers; however, high land prices also increase the operating costs for street vendors, indicating that land price is a factor that requires careful consideration in street vending planning. It is neither purely positive nor entirely negative. This complex balance implies that more flexible and diversified strategies are needed to assist in the decision making for street vending layout. For example, policymakers and urban planners might need to consider providing subsidies or other forms of support to help street vendors cope with the economic pressures of high land prices. Additionally, exploring new commercial opportunities in areas with high pedestrian traffic but relatively lower land prices could help balance urban economic development and the rational use of spatial resources.
5.2. Management Strategies for Street Vending in Different Public Spaces
When integrating street vending into urban planning, it is crucial to consider the relationship between land-use types and the suitability of areas for street vending. By analyzing the distribution characteristics of suitability levels across different land-use types, we can assess land compatibility for street vending and formulate management strategies for street vending in different types of public spaces.
- (1)
- Commercial Land: Enhance Business
Public spaces within commercial land tend to be the most suitable venues for street vending activities. In this regard, we believe that a strategy of strengthening commerce can be adopted to further enhance the commercial vitality and diversity of areas that already possess strong commercial attraction and pedestrian flow. This can be achieved by strengthening the planning of night markets or holiday markets. This will enrich the consumption options in commercial districts and attract more consumers. Secondly, providing entrepreneurial support and preferential policies: this will encourage new and small-scale businesses to settle in. By implementing these measures, commercial land can be further optimized for street vending, creating a vibrant and diverse commercial environment.
- (2)
- Residential Land: Flexible Configuration
Within residential land, there are many areas suitable for street vending that can directly serve community residents. By flexibly setting and adjusting the types as well as operating hours of street vendors based on residents’ needs and habits, such as setting up breakfast stalls and late-night snack stalls during peak hours, establishing weekend markets for household goods or agricultural products, and organizing street vendor markets combined with cultural performances and handicraft displays, street vending can be integrated into the daily lives of residents, providing convenient services and enhancing community life.
- (3)
- Park Land: Diverse Development
Park lands contain areas of varying suitability levels, indicating significant differences in street vending appropriateness due to functional and spatial positioning reasons. Since parks typically serve multiple social, ecological, and cultural functions, different parks may have distinct characteristics and needs based on their location, size, design, and target audience. Therefore, it is necessary to propose diversified development strategies for park lands. For ecological conservation, commemorative, and cultural parks, a strict regulatory system should be implemented to limit street vending activities. For community parks and theme parks, temporary stalls can be set up for specific activities or themes without impacting the main functions of a park.
- (4)
- Square Land: Quality-oriented
In Wuchang District, where square lands are limited but can still provide suitable areas for street vending, it is indeed important to consider these squares as venues that play a special role. Such spaces, during specific periods, can transform into centers of urban culture, economy, and social activities. Squares also serve as places where the city’s appearance and ambiance are showcased. Thus, the opening up to street vending should be more cautious and purposeful. Street vending could be allowed during special festivals, holidays, or significant city events, and the opening duration should be limited to short terms to minimize the impact on the normal use of the squares.
- (5)
- Scenic Tour and Facility Lands: Strict Control
These types of land are mostly unsuitable for street vending activities. Setting restricted areas at important sights or regions and implementing strict control measures to ensure that street vending does not affect their ecological value and the visitor experience is necessary. In other scenic areas, a limited amount of street vending aligned with local culture and tourism themes can be introduced. The amount and layout of this vending should be carefully managed to avoid the excessive concentration or disruption of visitor flow. It should be situated in locations that do not hinder sightseeing or impact the landscape, such as near park entrances or exits, or in designated rest areas.
6. Conclusions
In the wake of the COVID-19 pandemic, urban spaces face unprecedented challenges and opportunities, particularly in the context of street vending. This research embarked on an exploration within the urban public spaces of Wuchang District, aiming to navigate the delicate balance between fostering economic vitality through street vending and preserving the orderliness as well as safety of these communal areas.
By constructing a comprehensive indicator system, employing GIS-based spatial quantitative analysis, allocating weights through a blend of qualitative and quantitative methods, and identifying and strategizing suitable areas for street vending, this study provides a nuanced understanding of how urban public spaces can accommodate street vending activities. Our findings reveal a pattern of suitability clusters centered around key urban nodes, extending through major corridors to mid-western areas of the district. This spatial distribution not only facilitates centralized management but also underscores the potential for economic permeation into peripheral areas, enhancing the vibrancy and inclusivity of urban public spaces. Moreover, this study underscores the significant contributions of commercial, park, and residential lands in creating highly suitable areas for street vending. At the same time, it points out the limited potential of square, scenic tour, and tourist facility lands for street vending activities.
The significance of this research lies in its contribution to a more dynamic, inclusive, and sustainable approach to urban planning. By shifting from the passive accommodation of street vending to actively planning for its integration, this study offers valuable insights into the optimization of urban public spaces. It underscores the need for urban planners and policymakers to consider the multifaceted impacts of street vending, not only as a means by which to stimulate employment but also as an essential component of urban social life. The integrated management strategies proposed herein aim to guide the sustainable development of street vending, ensuring that it contributes positively to the urban fabric and the well-being of city dwellers.
7. Limitations
While this study has made significant strides in applying GIS-based data analysis methods to assess the suitability of urban public spaces for street vending, several limitations warrant mentioning. Firstly, the reliance on existing datasets, such as POI data and urban land-use classifications, may not fully capture the dynamic nature of street vending activities. The fluidity and temporary setups characteristic of street vending can result in underrepresentation in static spatial datasets.
Secondly, the study’s methodologies, including Getis–Ord Gi, space syntax, kernel density analysis, and Kriging interpolation, while powerful, are inherently limited by the assumptions and parameters set by the researchers. The outcomes of these methods are sensitive to the choices of spatial scales, analysis units, and the weights assigned to different indicators, which could influence the results and their interpretation.
Moreover, the study’s focus on quantifiable spatial attributes might overlook the qualitative aspects of urban public spaces that influence street vending, such as social interactions, local regulations, and cultural significance, which are harder to measure but equally critical.
Lastly, while the study offers valuable insights into the spatial dynamics of street vending in Wuchang District, its applicability to other cities or regions with different urban layouts, regulatory environments, and cultural attitudes towards street vending might be limited. Future research could aim to address these limitations by incorporating more dynamic data collection methods, refining analysis techniques, and broadening the scope to include qualitative dimensions and a wider range of urban contexts.
Author Contributions
X.Z. and J.S.; Conceptualisation: J.S. and X.Z.; Methodology: X.Z.; Validation: J.S. and X.Z.; Formal analysis: X.Z.; Resources: J.S.; Data Curation: X.Z.; Writing—original draft preparation: X.Z.; Writing—review and editing: X.Z.; Visualization: X.Z.; Supervision: J.S.; Administration: J.S.; Funding acquisition: J.S. All authors have read and agreed to the published version of the manuscript.
Funding
This research was funded by National Key Research and Development Program of China: 2023YFC3807500; Housing and Urban-Rural Development Science and Technology Plan: 2022-H-001.
Data Availability Statement
Data are unavailable due to privacy or ethical restrictions.
Conflicts of Interest
The authors declare no conflicts of interest.
Appendix A. Influencing Factors and GIS Spatial Analysis Methods
Table A1.
Policy documents of street vending and summary content.
Table A1.
Policy documents of street vending and summary content.
| Policy Documents of Street Vending | Summary Content | City | ||||
|---|---|---|---|---|---|---|
| Location Restriction | Environmental Quality | Social Participation | Economic Dynamism | Infrastructure | ||
| Chengdu Municipal Urban Management Five Permissions One Stick Concurrent Epidemic Prevention and Economic Development Measures | √ | √ | / | / | / | Chengdu |
| Guiding Opinions on the Service Management of Temporary Food Stalls during the Epidemic Prevention Period | √ | / | / | / | / | Nanjing |
| Announcement on Opening Temporary Night Markets to Promote Citizen Consumption | √ | √ | / | √ | / | Daye |
| Guiding Opinions on Optimizing the Business Environment | / | / | / | √ | / | Shanghai |
| Several Measures of Shanxi Province to Promote Market Consumption and Actively Respond to the Impact of the Epidemic | √ | / | / | √ | / | Shanxi |
| Measures to Expand Employment and Promote Economic Development | / | / | √ | / | / | Hunan |
| Harbin City’s Implementation Plan for the Prosperity of the Nighttime Economy (2020–2022) | / | / | √ | / | √ | Harbin |
| Guiding Opinions on Promoting the Development of the Nighttime Economy | / | / | √ | √ | √ | Henan |
| Notice of the Implementation Plan of Ningbo City to Accelerate the Development of the Nighttime Economy | √ | √ | √ | / | / | Ningbo |
| Guiding Opinions on Accelerating the Development of the Stall Economy | √ | √ | / | / | / | Ganzhou |
Table A2.
Influencing factors mentioned in different literature.
Table A2.
Influencing factors mentioned in different literature.
| Influencing Factors | Sun Z, Bell S, Scott I, et al. [36] | Peimani N and Kamalipour H [23] | Dovey K, Recio R B, Pafka E. [24] | Liu, Q.Y., Wang, W.Q. [34] | Hu Y and Shen J T. [32] | Hu J [30] | Lv X Y and Li H F. [31] | Dai M Y, Xiang P C, Zhou T. [35] | He L, Zeng H X, Zeng H L, et al. [29] | Lan W L, Hao C J, Jiang Y, et al. [33] |
|---|---|---|---|---|---|---|---|---|---|---|
| Yuncheng City | Tehran | Manila | Shanghai City | Suzhou City | Changsha City | Harbin City | Chongqing City | Chao zhou City | Nanjing City | |
| Greening rate | / | √ | / | √ | / | √ | / | / | √ | / |
| Air quality | / | √ | / | / | / | √ | √ | / | √ | / |
| Spatial openness | / | / | √ | √ | / | √ | √ | / | √ | / |
| Visibility | / | / | / | / | / | / | √ | / | / | / |
| Commercial agglomeration | / | / | / | √ | / | / | / | / | / | √ |
| Diversity of business types | / | / | / | √ | / | / | / | √ | / | √ |
| Consumer demand | / | / | / | / | √ | / | / | / | / | / |
| Land price | / | / | / | / | √ | / | / | √ | / | / |
| Crowd density | √ | √ | √ | √ | √ | / | / | / | / | √ |
| Local popularity | √ | / | / | / | / | / | / | / | / | √ |
| Local publicity | √ | / | / | / | / | / | / | / | / | / |
| Pavement walkability | √ | √ | / | √ | √ | / | √ | / | √ | / |
| Traffic accessibility | / | √ | / | √ | √ | / | √ | / | / | / |
| Street lighting | / | / | / | / | / | √ | / | / | / | / |
| Sanitation facilities | / | / | √ | / | √ | √ | / | / | / | / |
Table A3.
GIS spatial analysis methods for influencing factors.
Table A3.
GIS spatial analysis methods for influencing factors.
| Types of GIS Spatial Analysis | Influencing Factors | GIS Spatial Analysis Process | Study Area | |
|---|---|---|---|---|
| Data Sources | GIS Tools | |||
| Data analysis | Commercial agglomeration | Point of Interest | Getis–Ord Gi | Chongqing [39] |
| Diversity of business types | Point of Interest | Shannon diversity index | Columbia [40] | |
| Crowd density | Mobile phone signaling data | Kernel density estimation | Allianz Arena in Munich [41] | |
| Consumer demand | Social media data | Hot spot analysis | Wuhan [42] | |
| Traffic accessibility | Urban street network | Space syntax analysis | Changsha [43] | |
| Sanitation facilities | Location data | Service area analysis | South Jakarta [44] | |
| Air quality | Monitoring station | Kriging interpolation | Wuhan [45] | |
| Land price | Land prices and location | Kriging interpolation | Fukushima prefecture [46] | |
| Local popularity | Social media data | Spatial clustering | Istanbul [47] | |
| Local publicity | Social media data | Buffer analysis | New York City’s parks [48] | |
| Pavement walkability | Street view | Reclassification | Colombia [49] | |
| Greening rate | Normalized Difference Vegetation Index (NDVI) | Reclassification | California [50] | |
| Street lighting | Nighttime light data | Reclassification | San Antonio neighborhoods [51] | |
| Spatial Modeling and Simulation | Spatial openness | 3D city model | Skyline tool | Piazza San Marco [54] |
| Visibility | 3D city model | Line of sight analysis | HawaiianIsland [55] | |
Appendix B. Expert Consultation Questionnaire and Results
Table A4, Table A5, Table A6 and Table A7 present the expert consultation questionnaire. The questionnaire aimed to evaluate the importance and representativeness of 15 influence factors across four criteria layers concerning the suitability of areas for street vending. Experts were asked to rate each factor based on five levels: “Very Good”, “Good”, “Average”, “Below Average”, and “Poor”. These are assigned scores of 5, 4, 3, 2, and 1, respectively, allowing for a quantitative assessment of each element. The final score for each factor was determined by calculating the average score across all expert evaluations. To identify the most crucial factors, the overall average score of all factors was calculated and used as a threshold. Factors with average scores above this threshold were considered more important and retained for further consideration. Table A8 present the expert consultation questionnaire result.
Table A4.
Questionnaire of environmental quality.
Table A4.
Questionnaire of environmental quality.
| Environmental Quality | Importance | Representativeness | ||||||||
|---|---|---|---|---|---|---|---|---|---|---|
| Very Good | Good | Average | Below Average | Poor | Very Good | Good | Average | Below Average | Poor | |
| Greening rate (GR) | ||||||||||
| Air quality (AQ) | ||||||||||
| Spatial openness (SO) | ||||||||||
Table A5.
Questionnaire of economic dynamism.
Table A5.
Questionnaire of economic dynamism.
| Economic Dynamism | Importance | Representativeness | ||||||||
|---|---|---|---|---|---|---|---|---|---|---|
| Very Good | Good | Average | Below Average | Poor | Very Good | Good | Average | Below Average | Poor | |
| Visibility (VI) | ||||||||||
| Commercial agglomeration (CA) | ||||||||||
| Diversity of business types (DBT) | ||||||||||
| Consumer demand (CDE) | ||||||||||
Table A6.
Questionnaire of social participation.
Table A6.
Questionnaire of social participation.
| Social Participation | Importance | Representativeness | ||||||||
|---|---|---|---|---|---|---|---|---|---|---|
| Very Good | Good | Average | Below Average | Poor | Very Good | Good | Average | Below Average | Poor | |
| Land price (LP) | ||||||||||
| Crowd density (CD) | ||||||||||
| Local popularity (LPO) | ||||||||||
| Local publicity (LPU) | ||||||||||
Table A7.
Questionnaire of infrastructure.
Table A7.
Questionnaire of infrastructure.
| Infrastructure | Importance | Representativeness | ||||||||
|---|---|---|---|---|---|---|---|---|---|---|
| Very Good | Good | Average | Below Average | Poor | Very Good | Good | Average | Below Average | Poor | |
| Pavement walkability (PW) | ||||||||||
| Traffic accessibility (TA) | ||||||||||
| Street lighting (SI) | ||||||||||
| Sanitation facilities (SF) | ||||||||||
Table A8.
Expert consultation questionnaire result.
Table A8.
Expert consultation questionnaire result.
| Influencing Factors | Environmental Quality | Economic Dynamism | Social Participation | Infrastructure | |||||||||||
|---|---|---|---|---|---|---|---|---|---|---|---|---|---|---|---|
| GR | AQ | SO | VI | CA | DBT | CDE | LP | CD | LPO | LPU | PW | TA | SI | SF | |
| Score | 3 | 2.5 | 4.5 | 2.5 | 5 | 3 | 3 | 4.5 | 5 | 3.5 | 2.5 | 5 | 5 | 2.5 | 4 |
| Threshold | 3.3 | 3.3 | 3.3 | 3.37 | 3.37 | 3.37 | 3.37 | 3.87 | 3.87 | 3.87 | 3.87 | 4.12 | 4.12 | 4.12 | 4.12 |
| Result | × | × | √ | × | √ | × | × | √ | √ | × | × | √ | √ | × | × |
√ present retain; × present remove.
Appendix C. Weight Attribution Results from the Expert Assessments
The comparisons made by the experts are input into a specialized AHP software. This software is designed to handle the mathematical computations necessary for AHP, including the synthesis of the pairwise comparisons into a coherent set of indicator weights. Table A9, Table A10, Table A11, Table A12 and Table A13 present the results of the AHP scores of the five experts. Table A14 present the final weights.
Table A9.
Expert 1.
Table A9.
Expert 1.
| SO | CA | LP | CD | PW | TA | Wi | |
|---|---|---|---|---|---|---|---|
| SO | 1 | 1 | 0.1667 | 0.3333 | 0.125 | 0.1667 | 0.0382 |
| CA | 1 | 1 | 0.2 | 1 | 0.2 | 0.3333 | 0.0566 |
| LP | 6 | 5 | 1 | 4 | 0.3333 | 3 | 0.2618 |
| CD | 3 | 1 | 0.25 | 1 | 0.25 | 0.5 | 0.0779 |
| PW | 8 | 5 | 3 | 4 | 1 | 4 | 0.4243 |
| TA | 6 | 3 | 0.3333 | 2 | 0.25 | 1 | 0.1411 |
Expert weight: 0.2000; Consistency ratio: 0.0484; λmax: 6.3047.
Table A10.
Expert 2.
Table A10.
Expert 2.
| SO | CA | LP | CD | PW | TA | Wi | |
|---|---|---|---|---|---|---|---|
| SO | 1 | 1 | 0.2 | 0.3333 | 0.1429 | 0.2 | 0.0439 |
| CA | 1 | 1 | 0.3333 | 1 | 0.1667 | 1 | 0.0797 |
| LP | 5 | 3 | 1 | 4 | 0.25 | 0.5 | 0.1891 |
| CD | 3 | 1 | 0.25 | 1 | 0.3333 | 1 | 0.1014 |
| PW | 7 | 6 | 4 | 3 | 1 | 3 | 0.4208 |
| TA | 5 | 1 | 2 | 1 | 0.3333 | 1 | 0.1652 |
Expert weight: 0.2000; Consistency ratio: 0.0897; λmax: 6.5650.
Table A11.
Expert 3.
Table A11.
Expert 3.
| SO | CA | LP | CD | PW | TA | Wi | |
|---|---|---|---|---|---|---|---|
| SO | 1 | 1 | 0.2 | 0.5 | 0.1429 | 0.25 | 0.0522 |
| CA | 1 | 1 | 0.3333 | 1 | 0.2 | 1 | 0.0879 |
| LP | 5 | 3 | 1 | 3 | 0.3333 | 1 | 0.2095 |
| CD | 2 | 1 | 0.3333 | 1 | 0.3333 | 0.5 | 0.0911 |
| PW | 7 | 5 | 3 | 3 | 1 | 2 | 0.3905 |
| TA | 4 | 1 | 1 | 2 | 0.5 | 1 | 0.1688 |
Expert weight: 0.2000; Consistency ratio: 0.0373; λmax: 6.2348.
Table A12.
Expert 4.
Table A12.
Expert 4.
| SO | CA | LP | CD | PW | TA | Wi | |
|---|---|---|---|---|---|---|---|
| SO | 1 | 1 | 0.25 | 0.25 | 0.2 | 0.3333 | 0.0567 |
| CA | 1 | 1 | 0.5 | 1 | 0.2 | 0.5 | 0.0835 |
| LP | 4 | 2 | 1 | 2 | 0.5 | 1 | 0.1914 |
| CD | 4 | 1 | 0.5 | 1 | 0.3333 | 0.5 | 0.1191 |
| PW | 5 | 5 | 2 | 3 | 1 | 3 | 0.3773 |
| TA | 3 | 2 | 1 | 2 | 0.3333 | 1 | 0.1721 |
Expert weight: 0.2000; Consistency ratio: 0.0296; λmax: 6.1863.
Table A13.
Expert 5.
Table A13.
Expert 5.
| SO | CA | LP | CD | PW | TA | Wi | |
|---|---|---|---|---|---|---|---|
| SO | 1 | 0.5 | 0.3333 | 0.5 | 0.1667 | 0.3333 | 0.0557 |
| CA | 2 | 1 | 0.5 | 1 | 0.25 | 0.5 | 0.096 |
| LP | 3 | 2 | 1 | 3 | 0.5 | 2 | 0.2237 |
| CD | 2 | 1 | 0.3333 | 1 | 0.3333 | 0.5 | 0.095 |
| PW | 6 | 4 | 2 | 3 | 1 | 3 | 0.3754 |
| TA | 3 | 2 | 0.5 | 2 | 0.3333 | 1 | 0.1542 |
Expert weight: 0.2000; Consistency ratio: 0.0154; λmax: 6.0972.
Table A14.
Sorting weights of elements in the scheme layer for decision-making objectives.
Table A14.
Sorting weights of elements in the scheme layer for decision-making objectives.
| SO | CA | LP | CD | PW | TA | |
|---|---|---|---|---|---|---|
| Weight | 0.0494 | 0.0807 | 0.2151 | 0.0969 | 0.3977 | 0.1603 |
References
- Blustein, D.L.; Duffy, R.; Ferreira, J.A.; Cohen-Scali, V.; Cinamon, R.G.; Allan, B.A. Unemployment in the time of COVID-19: A research agenda. J. Vocat. Behav. 2020, 119, 103436. [Google Scholar] [CrossRef] [PubMed]
- Guan, D.; Wang, D.; Hallegatte, S.; Davis, S.J.; Huo, J.; Li, S.; Bai, Y.; Lei, T.; Xue, Q.; Coffman, D.M.; et al. Global supply-chain effects of COVID-19 control measures. Nat. Hum. Behav. 2020, 4, 577–587. [Google Scholar] [CrossRef] [PubMed]
- Li, J. Present Situation and countermeasures of the development of the street-stall economy. J. Harbin Univ. 2022, 43, 55–57. [Google Scholar]
- Hermawatii, R.; Runiawati, N. Socio-economic dynamics of street vendors in Bandung. In Proceedings of the International Conference on Administrative Science (ICAS 2017), Barcelona, Spain, 21–25 May 2017; pp. 195–199. [Google Scholar]
- Wei, H.; Shi, N. Informal “Topophilia”: Place Attachment with Flowing Space and Its Formation, Power Production, and Turn of Planning. City Plan. Rev. 2020, 44, 20–29. [Google Scholar]
- Sinha, A.; Kanbur, R. Introduction: Informality—Concepts, Facts and Models. Margin. J. Appl. Econ. Res. 2012, 6, 91–102. [Google Scholar] [CrossRef]
- Gogoi, M.; Thakur, M.B. Work Security and Other Challenges for Street Vending in Guwahati City, Assam. Asia Pac. J. Anthropol. 2022, 23, 250–265. [Google Scholar] [CrossRef]
- Chen, Y.; Wang, Y. On the Path of Administrative Supervision of “Land-sharing Economy” Embedded in Modern Governance System—Take 15 Cities’ Regulatory Policies as Samples. Soc. Sci. Hunan. 2020, 6, 93–103. [Google Scholar]
- Ojeda, L.; Pino, A. Spatiality of street vendors and sociospatial disputes over public space: The case of Valparaíso, Chile. Cities 2019, 95, 102275. [Google Scholar] [CrossRef]
- Von Schönfeld, K.C.; Bertolini, L. Urban streets: Epitomes of planning challenges and opportunities at the interface of public space and mobility. Cities 2017, 68, 48–55. [Google Scholar] [CrossRef]
- Taheri Tafti, M. Assembling street vending. Urban Stud. 2020, 57, 1887–1902. [Google Scholar] [CrossRef]
- Peimani, N.; Kamalipour, H. Informal street vending: A systematic review. Land 2022, 11, 829. [Google Scholar] [CrossRef]
- Huang, G.; Xue, D.; Xu, C.; Yang, Y.; Chen, K. Governance of Informal Public Space in Urban China: A Post-modern Critique of Spatial Formalization of Urban Street Vending. Urban Plan. Int. 2019, 34, 47–55. [Google Scholar] [CrossRef]
- Karna, M.; Shrestha, S. Effects of Street Vending on the Lives of Vendors and on Urban Space. J. Adv. Res. Const. Urban Arch. 2019, 4, 8–16. [Google Scholar] [CrossRef]
- Widjajanti, R.; Wahyono, H. Space Livability of Street Vending in Simpang Lima Public Space, Semarang. IOP Conf. Ser. Earth Environ. Sci. 2018, 123, 012045. [Google Scholar] [CrossRef]
- Skinner, C.; Watson, V. The Informal Economy in Cities of the Global South: Challenges to the Planning Lexicon. Urban Plan. Int. 2019, 34, 23–30. [Google Scholar] [CrossRef]
- Zhou, Z.; Zhang, J.; Wang, Z. Stall Economy and Good Governance: Implication of Management Strategy in Asia-Pacific Region. Urban Plan. Int. 2022, 37, 74–81. [Google Scholar]
- Devlin, R.T. An area that governs itself’: Informality, uncertainty and the management of street vending in New York City. Plan. Theory 2022, 10, 53–65. [Google Scholar] [CrossRef]
- Liu, Y.; Liu, Y. Detecting the city-scale spatial pattern of the urban informal sector by using the street view images: A street vendor massive investigation case. Cities 2022, 131, 103959. [Google Scholar] [CrossRef]
- Xu, R.; Yu, W. Study on the Spatial Pattern and Rational Planning Strategy of Stall Economy in the Post Epidemic of COVID-19. Archit. Cult. 2020, 12, 72–73. [Google Scholar]
- Rahayu, M.J.; Putri, R.A.; Rini, E.F. Sustainable Street Vending Spatial Zoning Models in Surakarta. Proc. IOP Conf. Ser. Earth Environ. Sci. 2018, 123, 012044. [Google Scholar] [CrossRef]
- Dai, R.; Dang, X.; Feng, Z.; Li, H.; Liu, L. Random-forest-based street vending distribution model: A case study of Haizhu District. Acta Sci. Nat. Univ. Sunyatseni. 2018, 57, 76–82. [Google Scholar]
- Peimani, N.; Kamalipour, H. Mapping the spatiality of informal street vending. J. Urban. Int. Res. Placemaking Urban Sustain. 2022, 1–20. [Google Scholar] [CrossRef]
- Dovey, K.; Recio, R.B.; Pafka, E. The spatial logic of informal street vending in Manila: An assemblage approach. Space Polity 2022, 26, 192–215. [Google Scholar] [CrossRef]
- Gao, F.; Li, H. Resilient planning control of urban street vending space. Urban Problem. 2019, 6, 45–51. [Google Scholar]
- Xiao, R.Q. Why Does Policy Change Happen: A Study on the Governance Policy of “Mobile Vendors” Based on the Analysis of Multiple Streams Theory. Stat. Manag. 2023, 38, 88–95. [Google Scholar]
- Sang, S.J.; Tong, D.N.; Yin, Z.Y. Textual Analysis of Street Stall Economy Policy from the Perspective of Policy Tools in the Post-COVID-19 Era: A Case Study of Sichuan Province. China Circ. Econ. 2021, 27, 13–16. [Google Scholar]
- Wu, S.T.; Feng, Y.K.; Wu, Q. Urban, Market and History: Planning Thoughts on the Evolution of Stall Markets. Urban Dev. Stud. 2022, 29, 38–46. [Google Scholar]
- He, L.; Zeng, H.X.; Zeng, H.L.; Wu W, K. Integration of Health and Disaster Prevention Spaces in the Renovation of Existing Blocks: A Case Study of a Teaware Workshop in Chaozhou. South Archit. 2020, 5, 32–37. [Google Scholar]
- Hu, J. Research on the Dilemma and Countermeasures of Urban Street Vendor Environmental Pollution Governance: Based on the Theory of Collaborative Governance. J. Heilongjiang Vocat. Inst. Ecol. Eng. 2022, 35, 57–60. [Google Scholar]
- Lv, X.; Li, H. The Layout of Micro Commercial Facilities in Street Space. Planners 2019, 35, 57–62. [Google Scholar]
- Hu, Y.; Shen, J.T. Mechanisms of Spatial Distribution and Spatial Governance Strategies for Urban Mobile Vendors in Suzhou. Planners 2023, 39, 131–137. [Google Scholar]
- Lan, W.L.; Hao, C.J.; Jiang, Y.; Duan, J. Survey Study on the Spatial Characteristics of Morning Mobile Vendors in the Main Urban Area of Nanjing. Mod. Urban Res. 2021, 2, 14–19. [Google Scholar]
- Liu, Q.Y.; Wang, W.Q. Study on the Interaction Mechanisms Between Urban Space and Street Stall 3.0 Activities from the Perspective of Informal Economy. Urban Plan. Forum 2023, 3, 27–37. [Google Scholar]
- Dai, M.Y.; Xiang, P.C.; Zhou, T. Analysis of China’s Urban Informal Spaces from the Perspective of Systems Theory. Mod. Urban Res. 2023, 11, 78–83. [Google Scholar]
- Sun, Z.; Bell, S.; Scott, I.; Qian, J. Everyday use of urban street spaces: The spatio-temporal relations between pedestrians and street vendors: A case study in Yuncheng, China. Landsc. Res. 2020, 45, 292–309. [Google Scholar] [CrossRef]
- Li, K.H.; Liu, Q.H. How to soothe the common heart? Elements, values, and governance of the “living presence” in urban scenes. Fujian Trib. 2023, 12, 20–37. [Google Scholar]
- Yao, L.; Xie, J. The driving forces, dilemmas, and pathways of the rise of the domestic street vendor economy under the new development pattern. J. Commer. Econ. 2024, 1, 47–50. [Google Scholar]
- Zhang, X. Analysis on the Spatial Distribution Characteristics of Commercial Outlets in the Main Urban Area of Chongqing Based on POI Data. In Proceedings of the 25th International Symposium on Advancement of Construction Management and Real Estate, Singapore, 28 November 2020; pp. 1029–1042. [Google Scholar]
- Attaran, M. Industrial diversity and economic performance in U.S. areas. Ann. Reg. Sci. 1986, 20, 44–54. [Google Scholar] [CrossRef]
- Krisp, J.M.; Peters, S.; Burkert, F. Visualizing crowd movement patterns using a directed kernel density estimation. Earth Obs. Glob. Changes 2013, 255–268. [Google Scholar] [CrossRef]
- Hu, Q.; Zhang, Y. An effective selecting approach for social media big data analysis—Taking commercial hotspot exploration with Weibo check-in data as an example. In Proceedings of the 2018 IEEE 3rd International Conference on Big Data Analysis (ICBDA), Shanghai, China, 9–12 March 2018; pp. 28–32. [Google Scholar]
- Long, Y.; Qin, J.; Wu, Y.; Wang, K. Analysis of Urban Park Accessibility Based on Space Syntax: Take the Urban Area of Changsha City as an Example. Land 2023, 12, 1061. [Google Scholar] [CrossRef]
- Indriasari, V.; Mahmud, A.R.; Ahmad, N.; Shariff, A.R.M. Maximal service area problem for optimal siting of emergency facilities. Int. J. Geogr. Inf. Sci. 2010, 24, 213–230. [Google Scholar] [CrossRef]
- Tong, Y.; Yu, Y.; Hu, X.; He, L. Performance analysis of different kriging interpolation methods based on air quality index in Wuhan. In Proceedings of the 2015 Sixth International Conference on Intelligent Control and Information Processing (ICICIP), Wuhan, China, 26–28 November 2015; pp. 331–335. [Google Scholar]
- Derdouri, A.; Murayama, Y. A comparative study of land price estimation and mapping using regression kriging and machine learning algorithms across Fukushima prefecture, Japan. J. Geogr. Sci. 2020, 30, 794–822. [Google Scholar] [CrossRef]
- Üsküplü, T.; Terzi, F.; Kartal, H. Discovering activity patterns in the city by social media network data: A case study of Istanbul. Appl. Spat. Anal. Policy 2020, 13, 945–958. [Google Scholar] [CrossRef]
- Hamstead, Z.A.; Fisher, D.; Ilieva, R.T.; Wood, S.A.; McPhearson, T.; Kremer, P. Geolocated social media as a rapid indicator of park visitation and equitable park access. Comput. Environ. Urban Syst. 2018, 72, 38–50. [Google Scholar] [CrossRef]
- Guzman, L.A.; Arellana, J.; Castro, W.F. Desirable streets for pedestrians: Using a street-level index to assess walkability. Transp. Res. Part D Transp. Environ. 2022, 111, 103462. [Google Scholar] [CrossRef]
- Li, W.; Saphores, J.D.M.; Gillespie, T.W. A comparison of the economic benefits of urban green spaces estimated with NDVI and with high-resolution land cover data. Landsc. Urban Plan. 2015, 133, 105–117. [Google Scholar] [CrossRef]
- Kekula, F.; Hrubeš, P. An Empirical Study of Relationships between Urban Lighting Indicators and Night-Time Light Radiance. Neural Netw. World 2023, 33, 375–396. [Google Scholar] [CrossRef]
- Suk, J.Y.; Walter, R. Street Lighting and Public Safety: New Nighttime Lighting Documentation Method. In Proceedings of the ARCC-EAAE 2018 International Conference, Philadelphia, PA, USA, 16–19 May 2018. [Google Scholar]
- Chen, J.; Pellegrini, P.; Yang, Z.; Wang, H. Strategies for Sustainable Urban Renewal: Community-Scale GIS-Based Analysis for Densification Decision Making. Sustainability 2023, 15, 7901. [Google Scholar] [CrossRef]
- Lin, T.; Lin, H.; Hu, M. Three-dimensional visibility analysis and visual quality computation for urban open spaces aided by Google SketchUp and WebGIS. Environ. Plan. B Urban Anal. City Sci. 2017, 44, 618–646. [Google Scholar] [CrossRef]
- Liu, L.; Zhang, L.Q.; Ma, J.T.; Zhang, L.; Zhang, X.; Xiao, Z.; Yang, L. An improved line-of-sight method for visibility analysis in 3D complex landscapes. Sci. China Inf. Sci. 2010, 53, 2185–2194. [Google Scholar] [CrossRef]
- Brady, S.R. Utilizing and adapting the Delphi method for use in qualitative research. Int. J. Qual. Methods 2015, 14, 1609406915621381. [Google Scholar] [CrossRef]
- Chen, J.; Pellegrini, P.; Wang, H. Comparative residents’ satisfaction evaluation for socially sustainable regeneration—The case of two high-density communities in Suzhou. Land 2022, 11, 1483. [Google Scholar] [CrossRef]
- Chen, Y.C. A tutorial on kernel density estimation and recent advances. Biostat. Epidemiol. 2017, 1, 161–187. [Google Scholar] [CrossRef]
- Li, P.; Lv, Y.; Zhang, C.; Zhu, D. Analysis and planning of ecological networks based on kernel density estimations for the Beijing-Tianjin-Hebei region in Northern China. Sustainability 2016, 8, 1094. [Google Scholar] [CrossRef]
- Yu, W.; Ai, T.; Shao, S. The analysis and delimitation of Central Business District using network kernel density estimation. J. Transp. Geogr. 2015, 45, 32–47. [Google Scholar] [CrossRef]
- Zhao, L.; Wen, X.; Wang, Y.; Shao, Y. A novel hybrid model of ARIMA-MCC and CKDE-GARCH for urban short-term traffic flow prediction. IET Intell. Transp. Syst. 2022, 16, 206–217. [Google Scholar] [CrossRef]
- Zhang, G.; Zhu, A.X.; Windels, S.K.; Qin, C.-Z. Modelling species habitat suitability from presence-only data using kernel density estimation. Ecol. Indic. 2018, 93, 387–396. [Google Scholar] [CrossRef]
- Kucukpehlivan, T.; Cetin, M.; Aksoy, T.; Kurkcuoglu, M.A.S.; Cabuk, S.N.; Pekkan, O.I.; Dabanli, A.; Cabuk, A. Determination of the impacts of urban-planning of the urban land area using GIS hotspot analysis. Comput. Electron. Agric. 2023, 210, 107935. [Google Scholar] [CrossRef]
- Woldeamanuel, M.; Abebe, N.; Supangkat, F. Street vending on Addis Ababa’s sidewalks: A sign of vibrancy and identity or a nuisance for pedestrians? J. Urban Aff. 2023, 45, 317–334. [Google Scholar] [CrossRef]
- Majumdar, B.B.; Sahu, P.K.; Patil, M.; Vendotti, N. Pedestrian satisfaction-based methodology for prioritization of critical sidewalk and crosswalk attributes influencing walkability. J. Urban Plan. Dev. 2021, 147, 04021032. [Google Scholar] [CrossRef]
- Niu, X.Y.; Xu, F. A quantitative evaluation method for the openness of built environment spaces based on visual impact. Urban Plan. Forum 2011, 1, 91–97. [Google Scholar]
- Gil, J.; Varoudis, T.; Karimi, K.; Penn, A. The space syntax toolkit: Integrating depthmapX and exploratory spatial analysis workflows in QGIS. In Proceedings of the SSS 2015-10th International Space Syntax Symposium, Space Syntax Laboratory, The Bartlett School of Architecture, University College London (UCL), London, UK, 13–17 July 2015. [Google Scholar]
- Chen, J.; Wang, H.; Yang, Z.; Li, P.; Ma, G.; Zhao, X. Comparative Spatial Vitality Evaluation of Traditional Settlements Based on SUF: Taking Anren Ancient Town’s Urban Design as an Example. Sustainability 2023, 15, 8178. [Google Scholar] [CrossRef]
- Hou, L.; Guo, Y. Business Circle Theory and Retail Management. China Bus. Mark. 2000, 3, 25–28. [Google Scholar]
- Zhu, W.; Li, B.H. Service characteristics and demand patterns of suburban urban retail space in Shanghai. Urban Plan. Forum 2021, 1, 90–96. [Google Scholar]
- Zhu, Y.; Tian, D.; Yan, F. Effectiveness of entropy weight method in decision-making. Math. Probl. Eng. 2020, 2020, 1–5. [Google Scholar] [CrossRef]
- Chen, J.; Tian, W.; Xu, K.; Pellegrini, P. Testing Small-Scale Vitality Measurement Based on 5D Model Assessment with Multi-Source Data: A Resettlement Community Case in Suzhou. ISPRS Int. J. Geo-Inf. 2022, 11, 626. [Google Scholar] [CrossRef]
- Giuliano, G.; Kang, S.; Yuan, Q. Agglomeration economies and evolving urban form. Ann. Reg. Sci. 2019, 63, 377–398. [Google Scholar] [CrossRef]
- Chen, H.; Jia, B.; Lau, S.S.Y. Sustainable urban form for Chinese compact cities: Challenges of a rapid urbanized economy. Habitat Int. 2008, 32, 28–40. [Google Scholar] [CrossRef]
- Wu, F.; Zheng, Y.; Hu, Z.; Wen, C.; Duan, J.; Peng, Y.; Tu, Y.; Wang, M. A study on the urban multi-center spatial structure based on POI data—Taking Guangzhou as an example. In Proceedings of the 25th International Symposium on Advancement of Construction Management and Real Estate, Singapore, 28 November 2020; pp. 71–84. [Google Scholar]
- Meijers, E.J.; Burger, M.J. Spatial structure and productivity in US metropolitan areas. Environ. Plan. A 2010, 42, 1383–1402. [Google Scholar] [CrossRef]
- Ma, F.; Ren, F.; Yuen, K.F.; Guo, Y.; Zhao, C.; Guo, D. The spatial coupling effect between urban public transport and commercial complexes: A network centrality perspective. Sustain. Cities Soc. 2019, 50, 101645. [Google Scholar] [CrossRef]
- Yuan, M.Q. Study on the Spatial Characteristics and Influencing Factors of Informal Economic Activities in Old Communities of Wuchang District. Ph.D. Thesis, Huazhong University of Science and Technology, Wuhan, China, 2020. [Google Scholar]
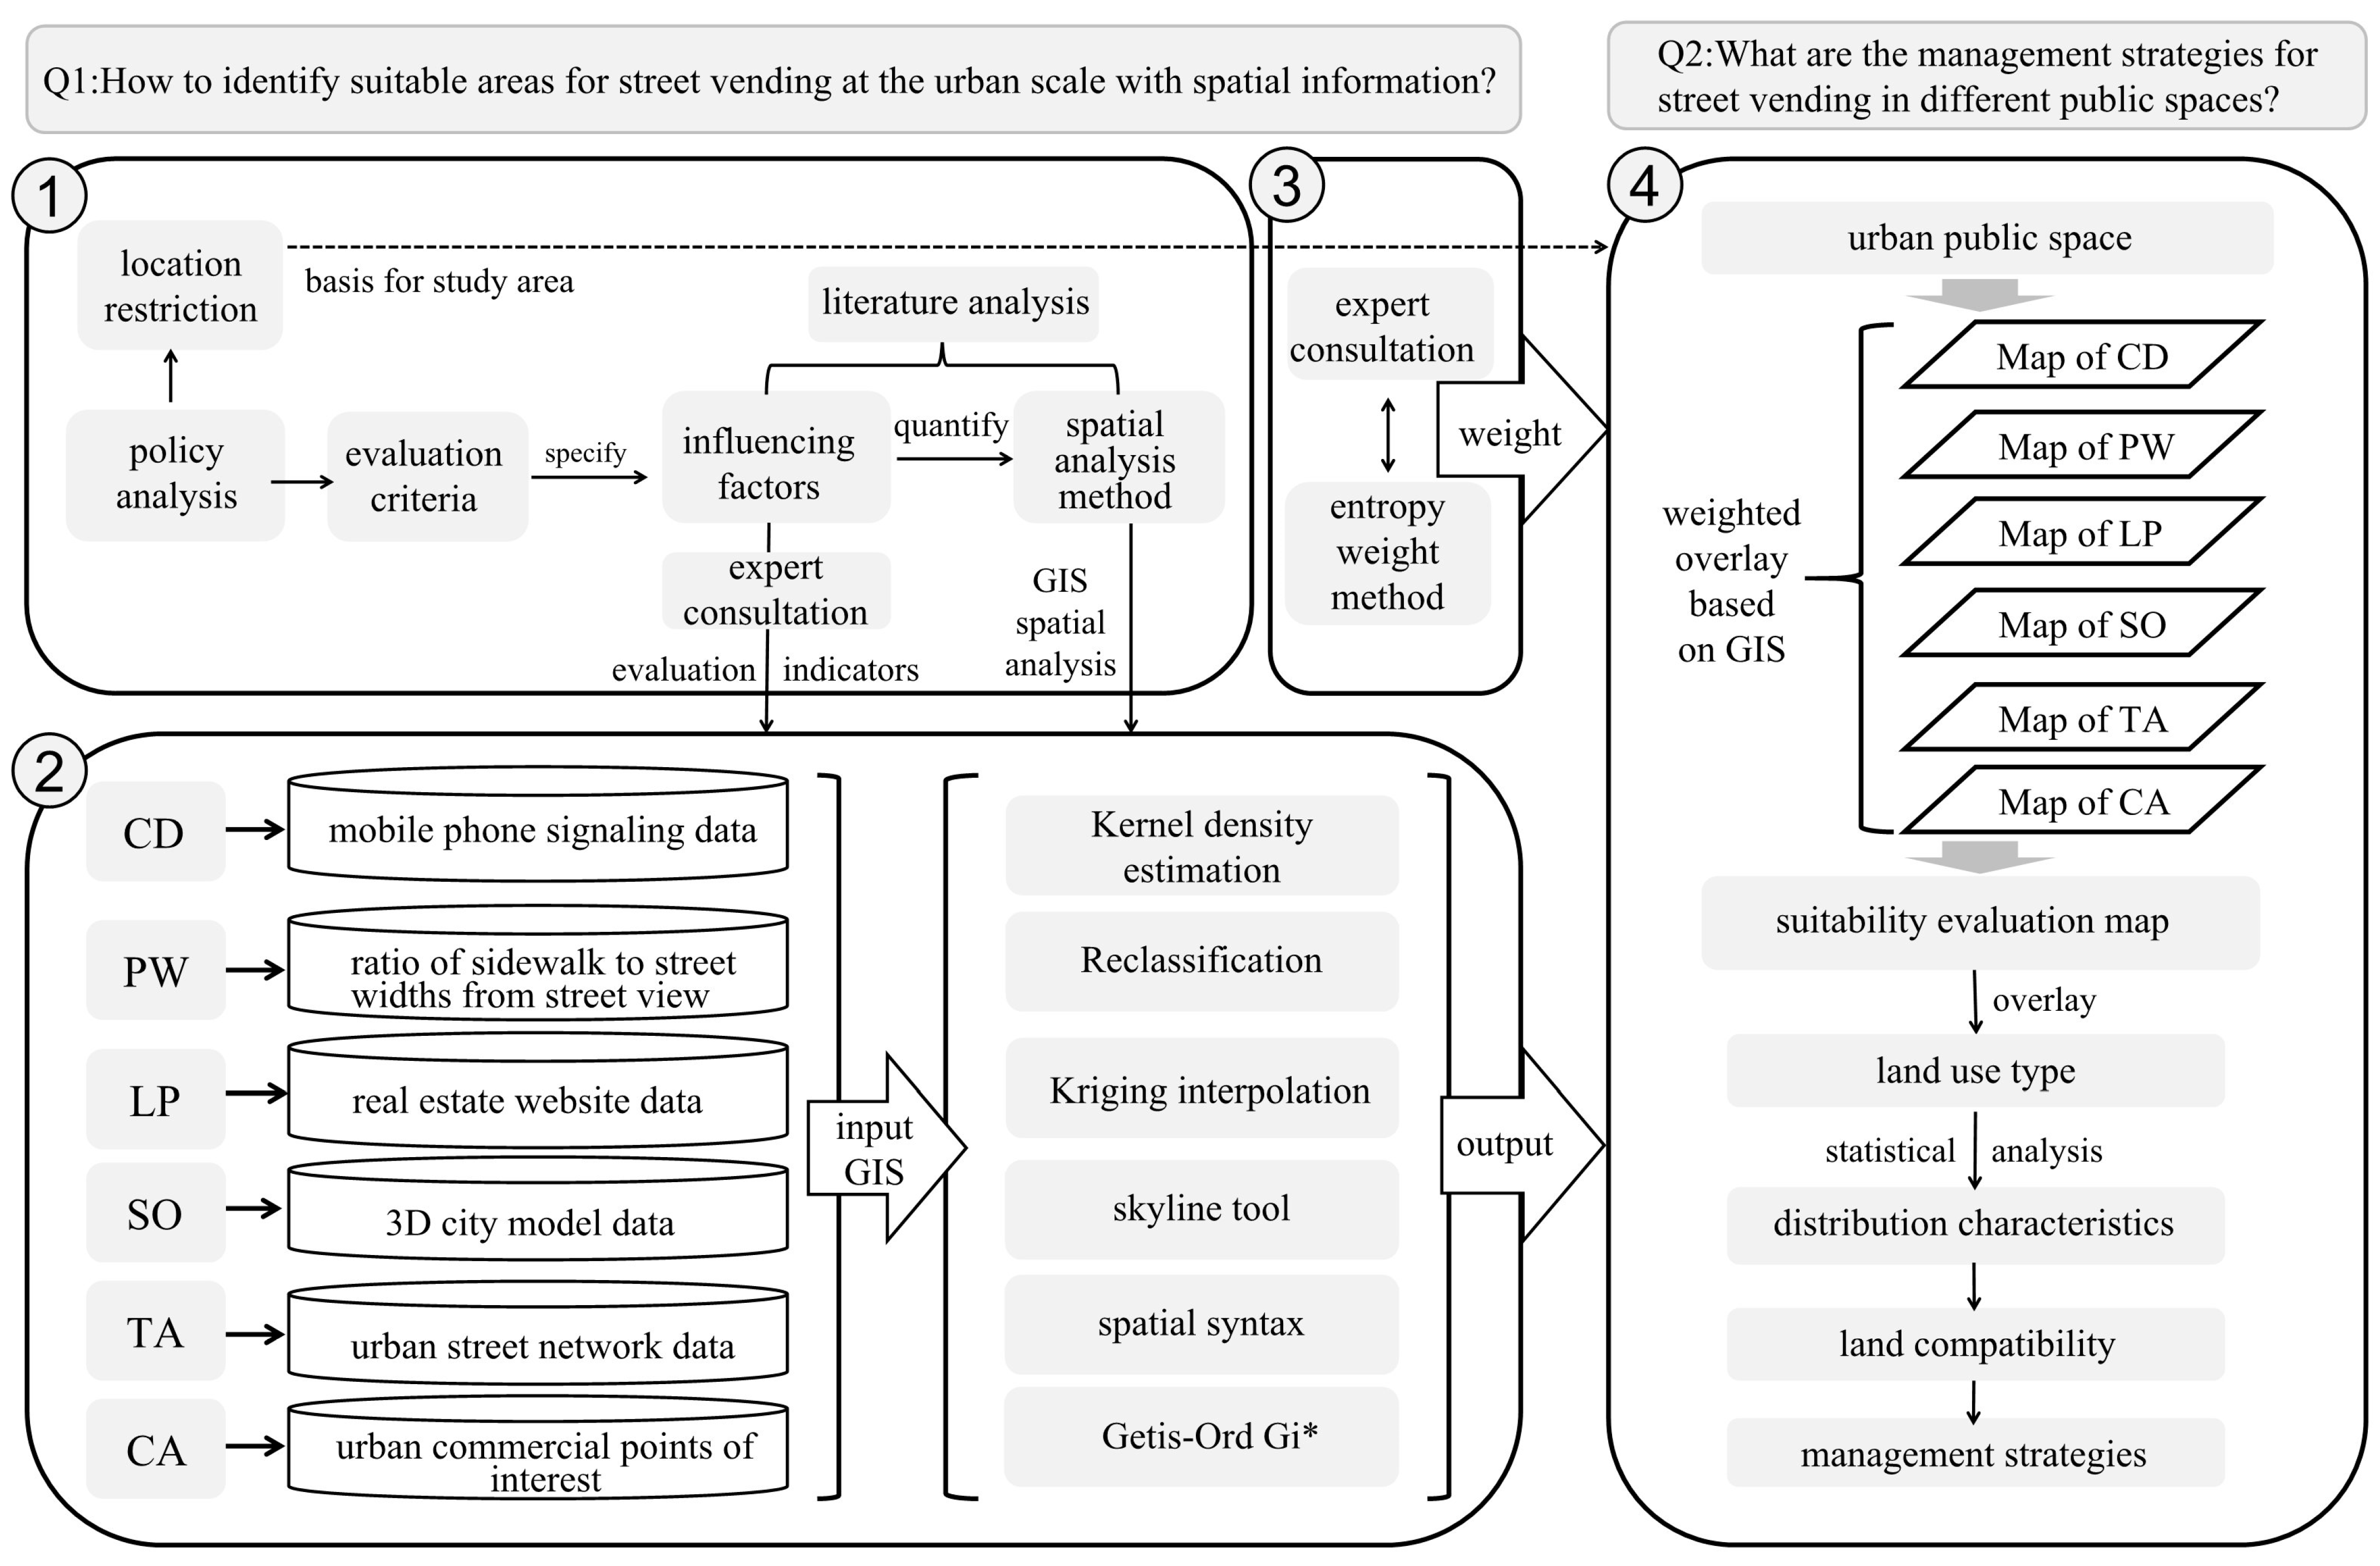
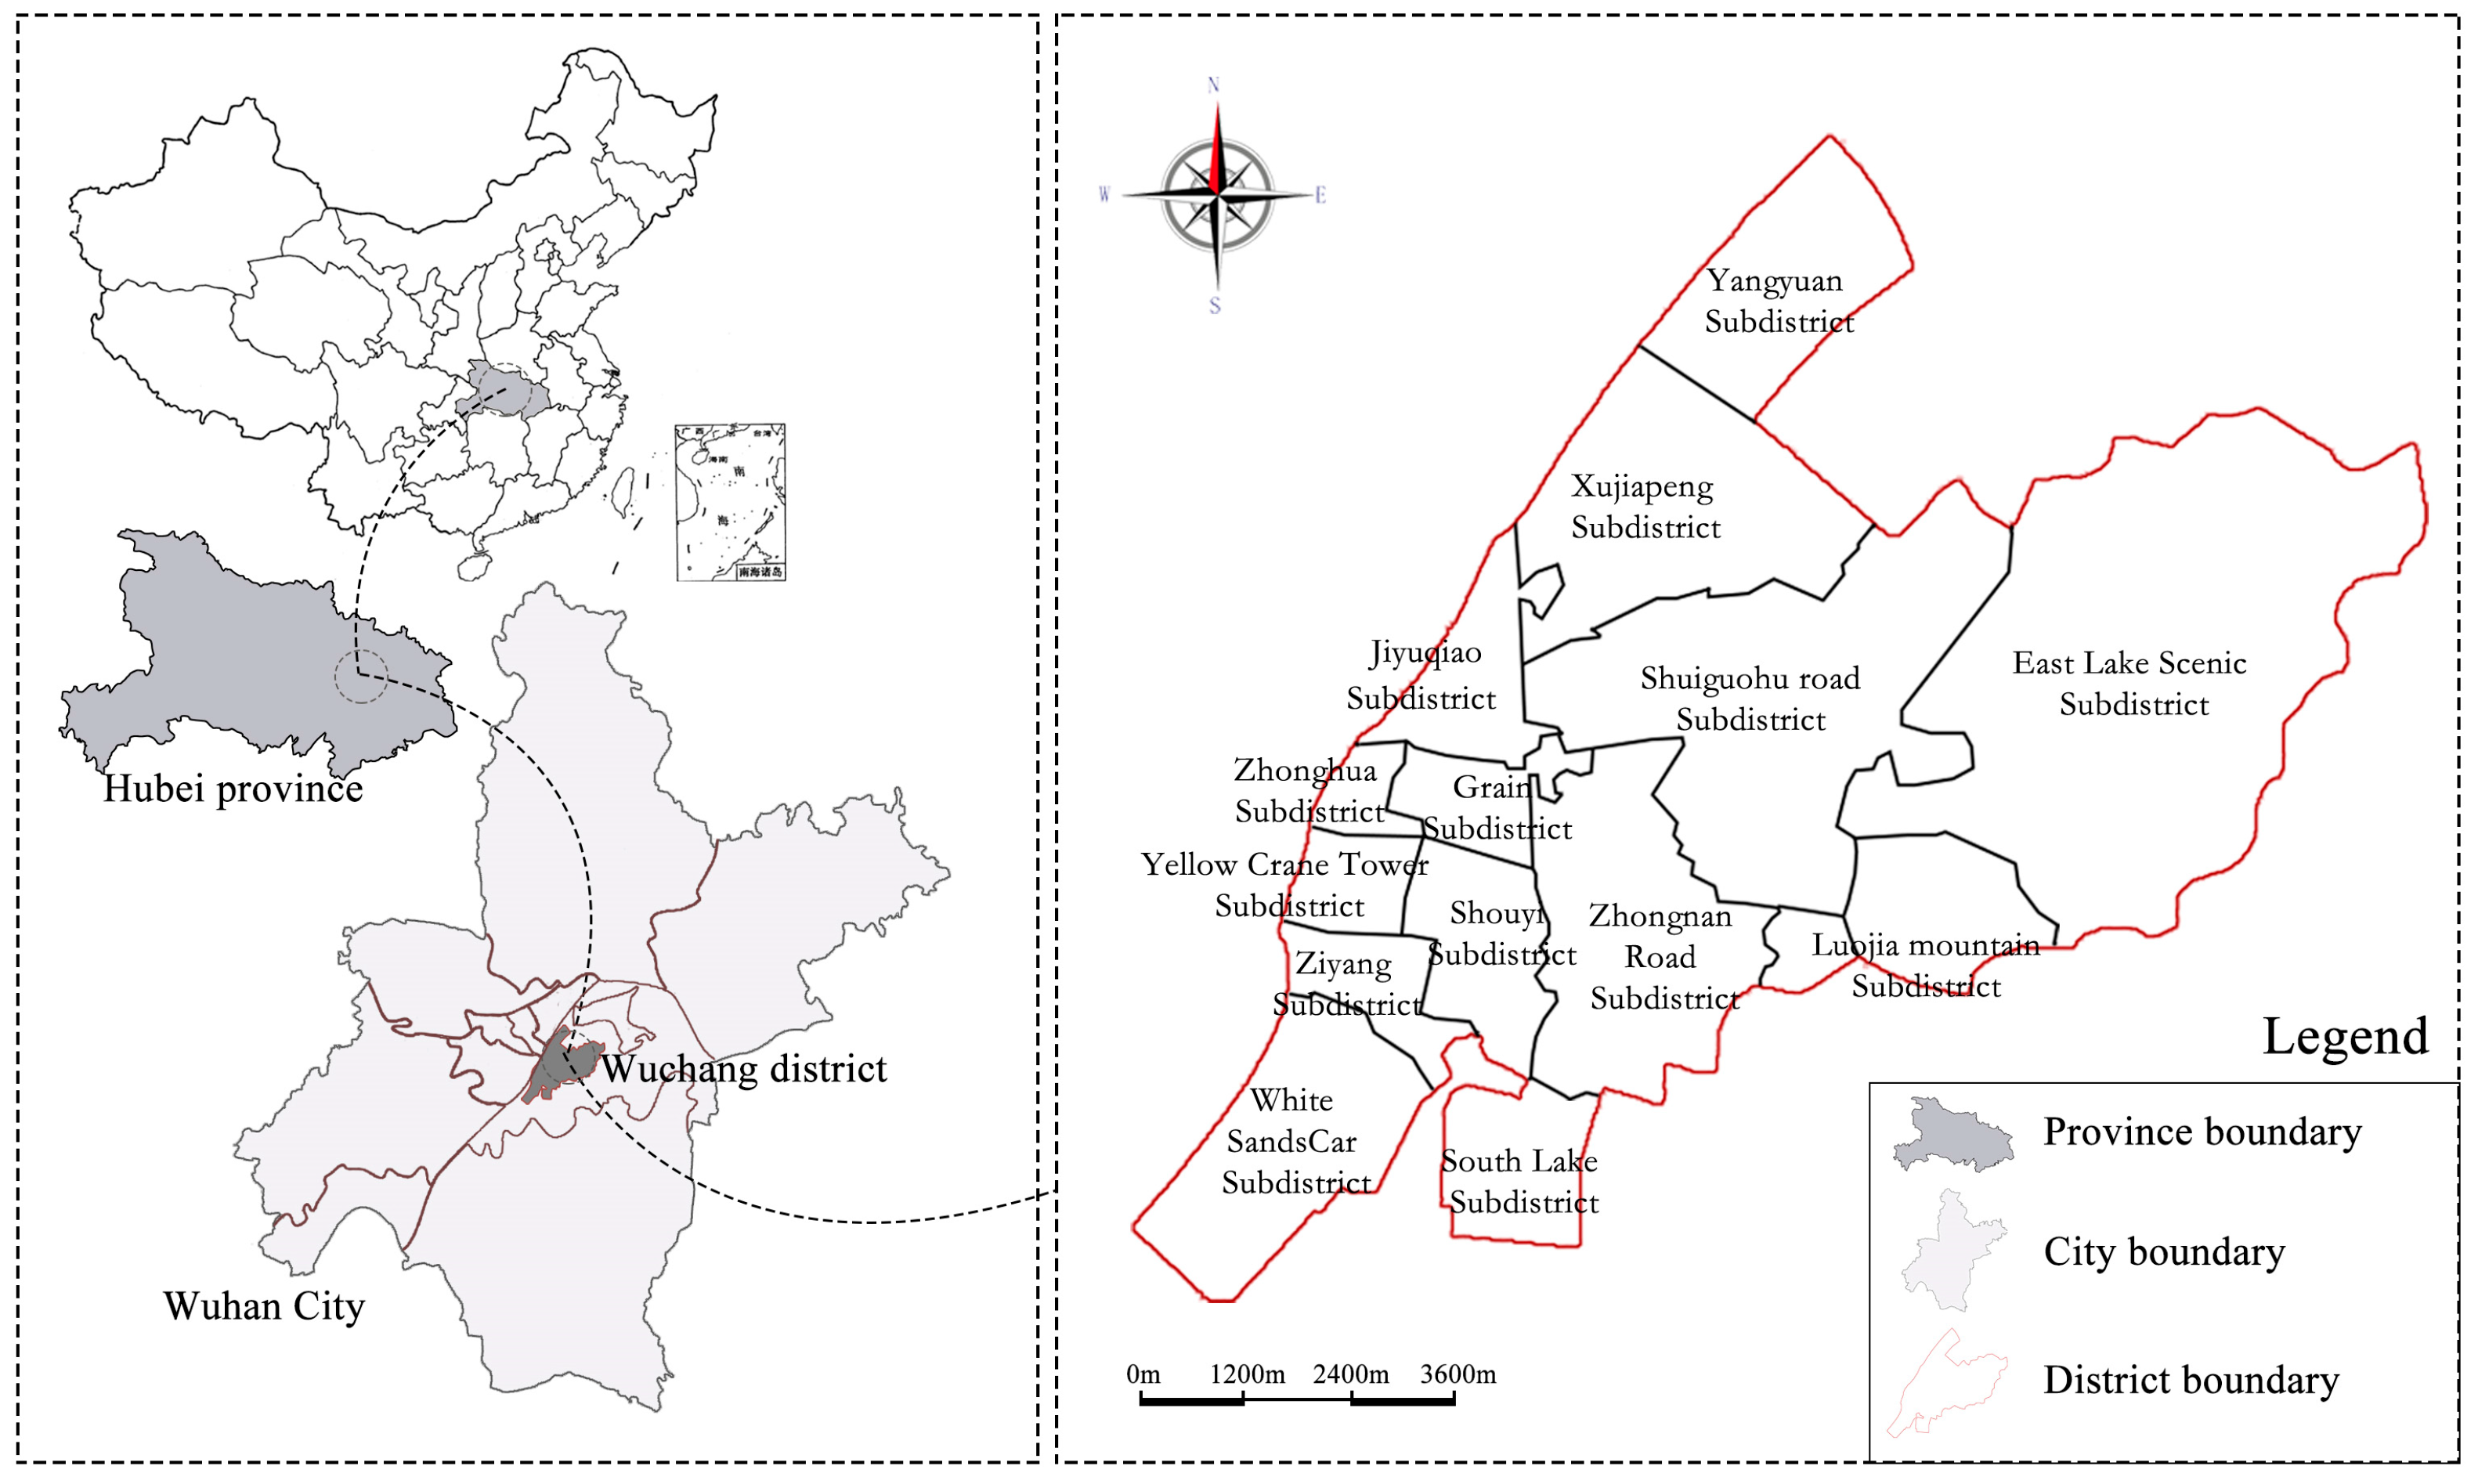

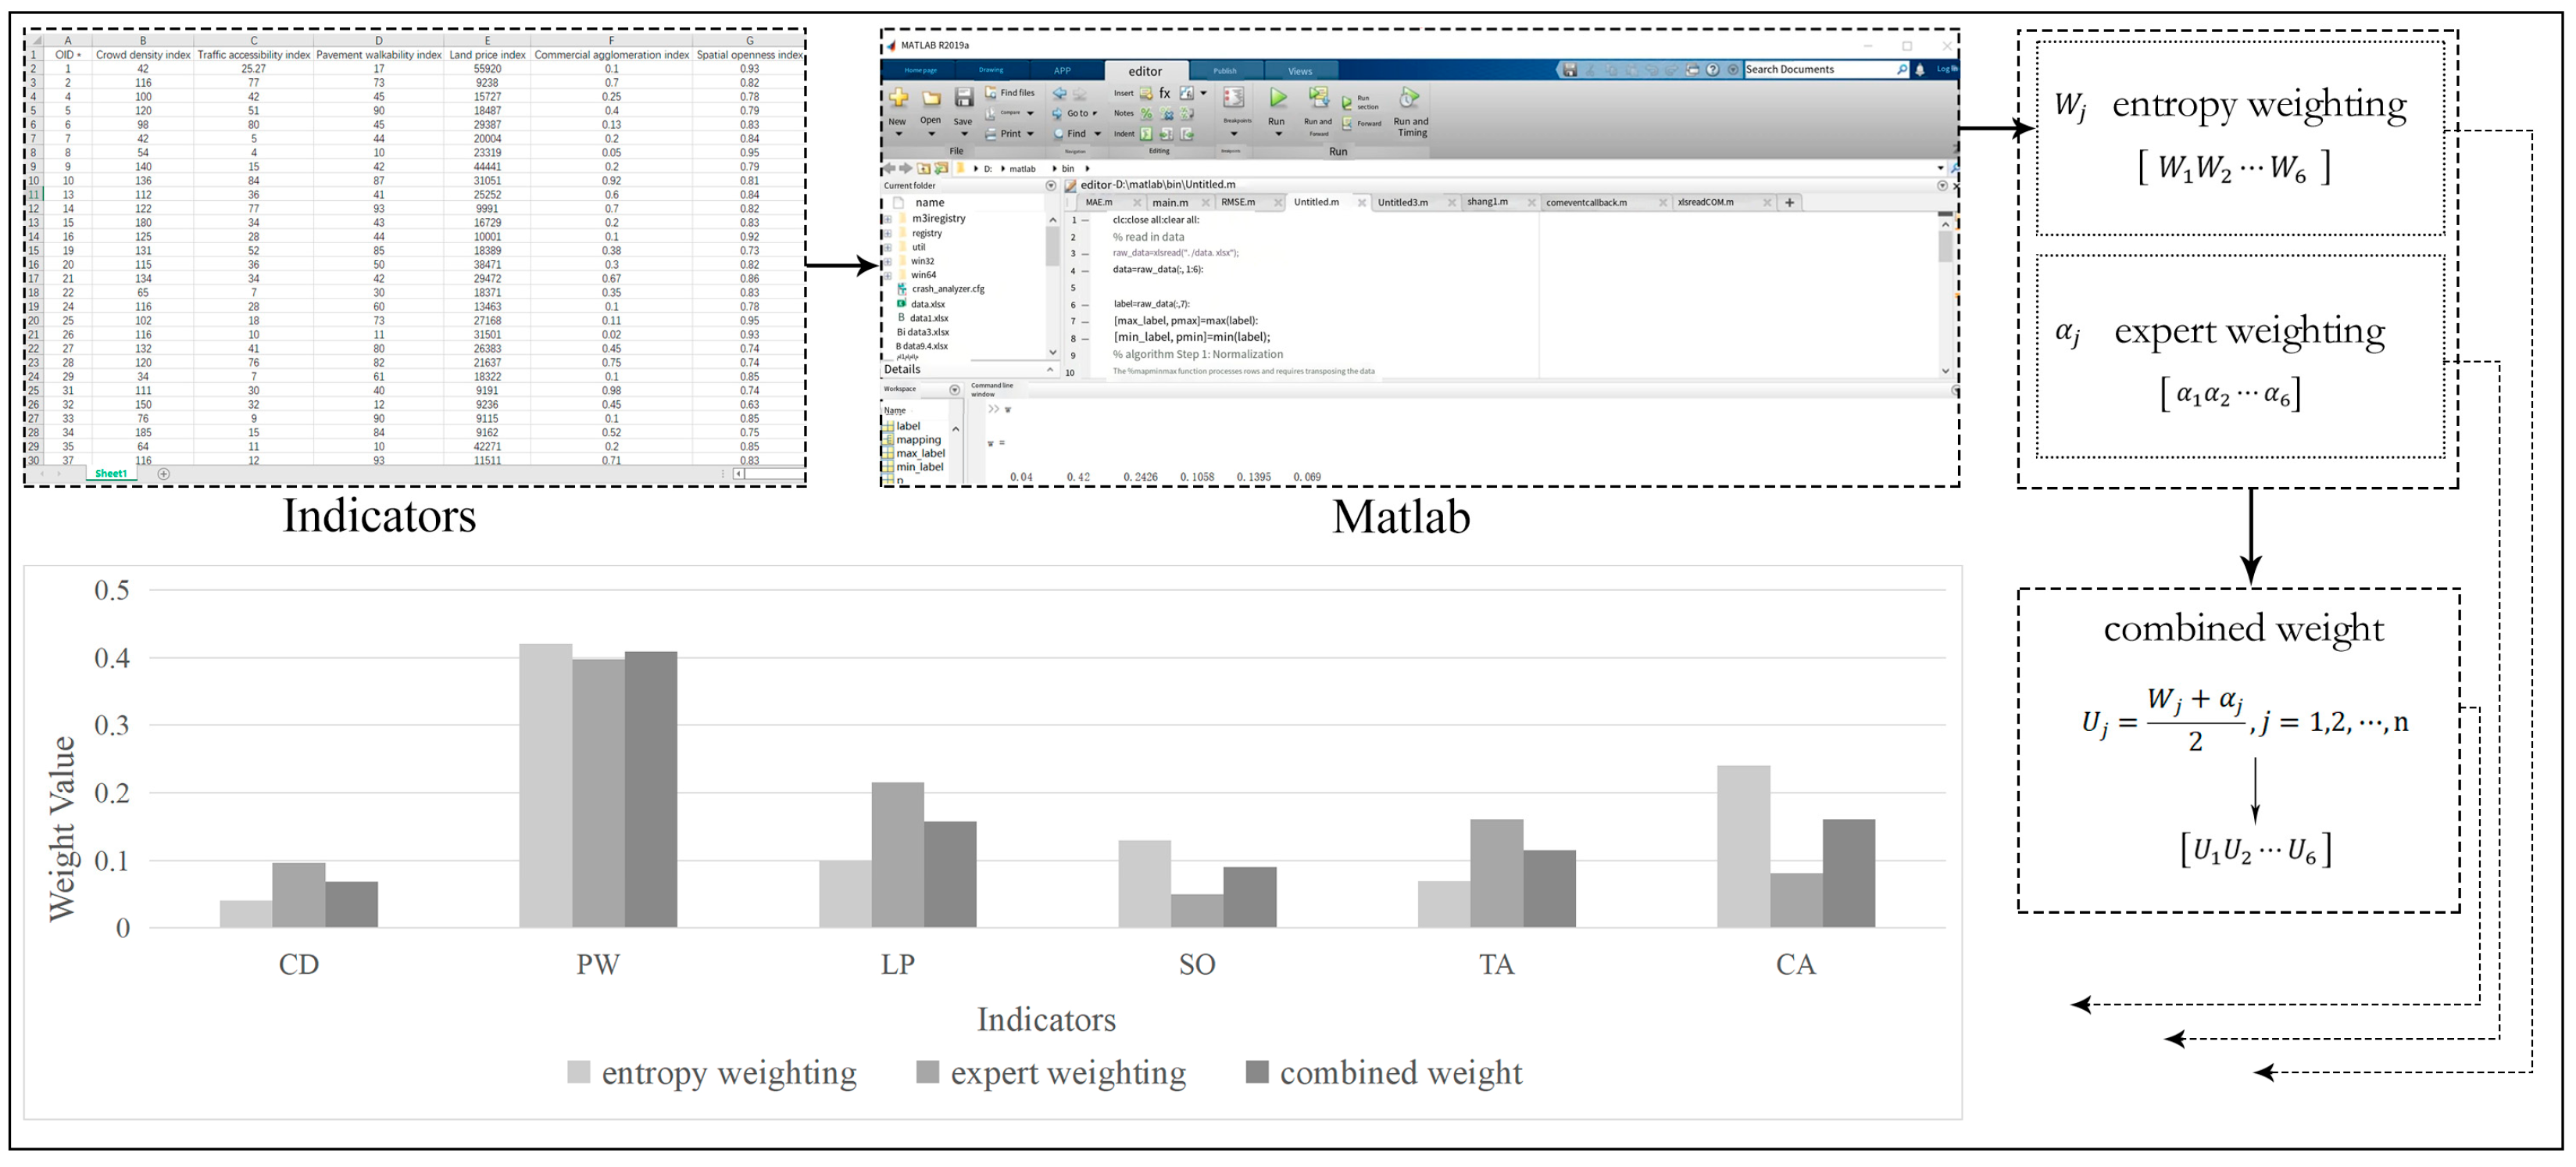
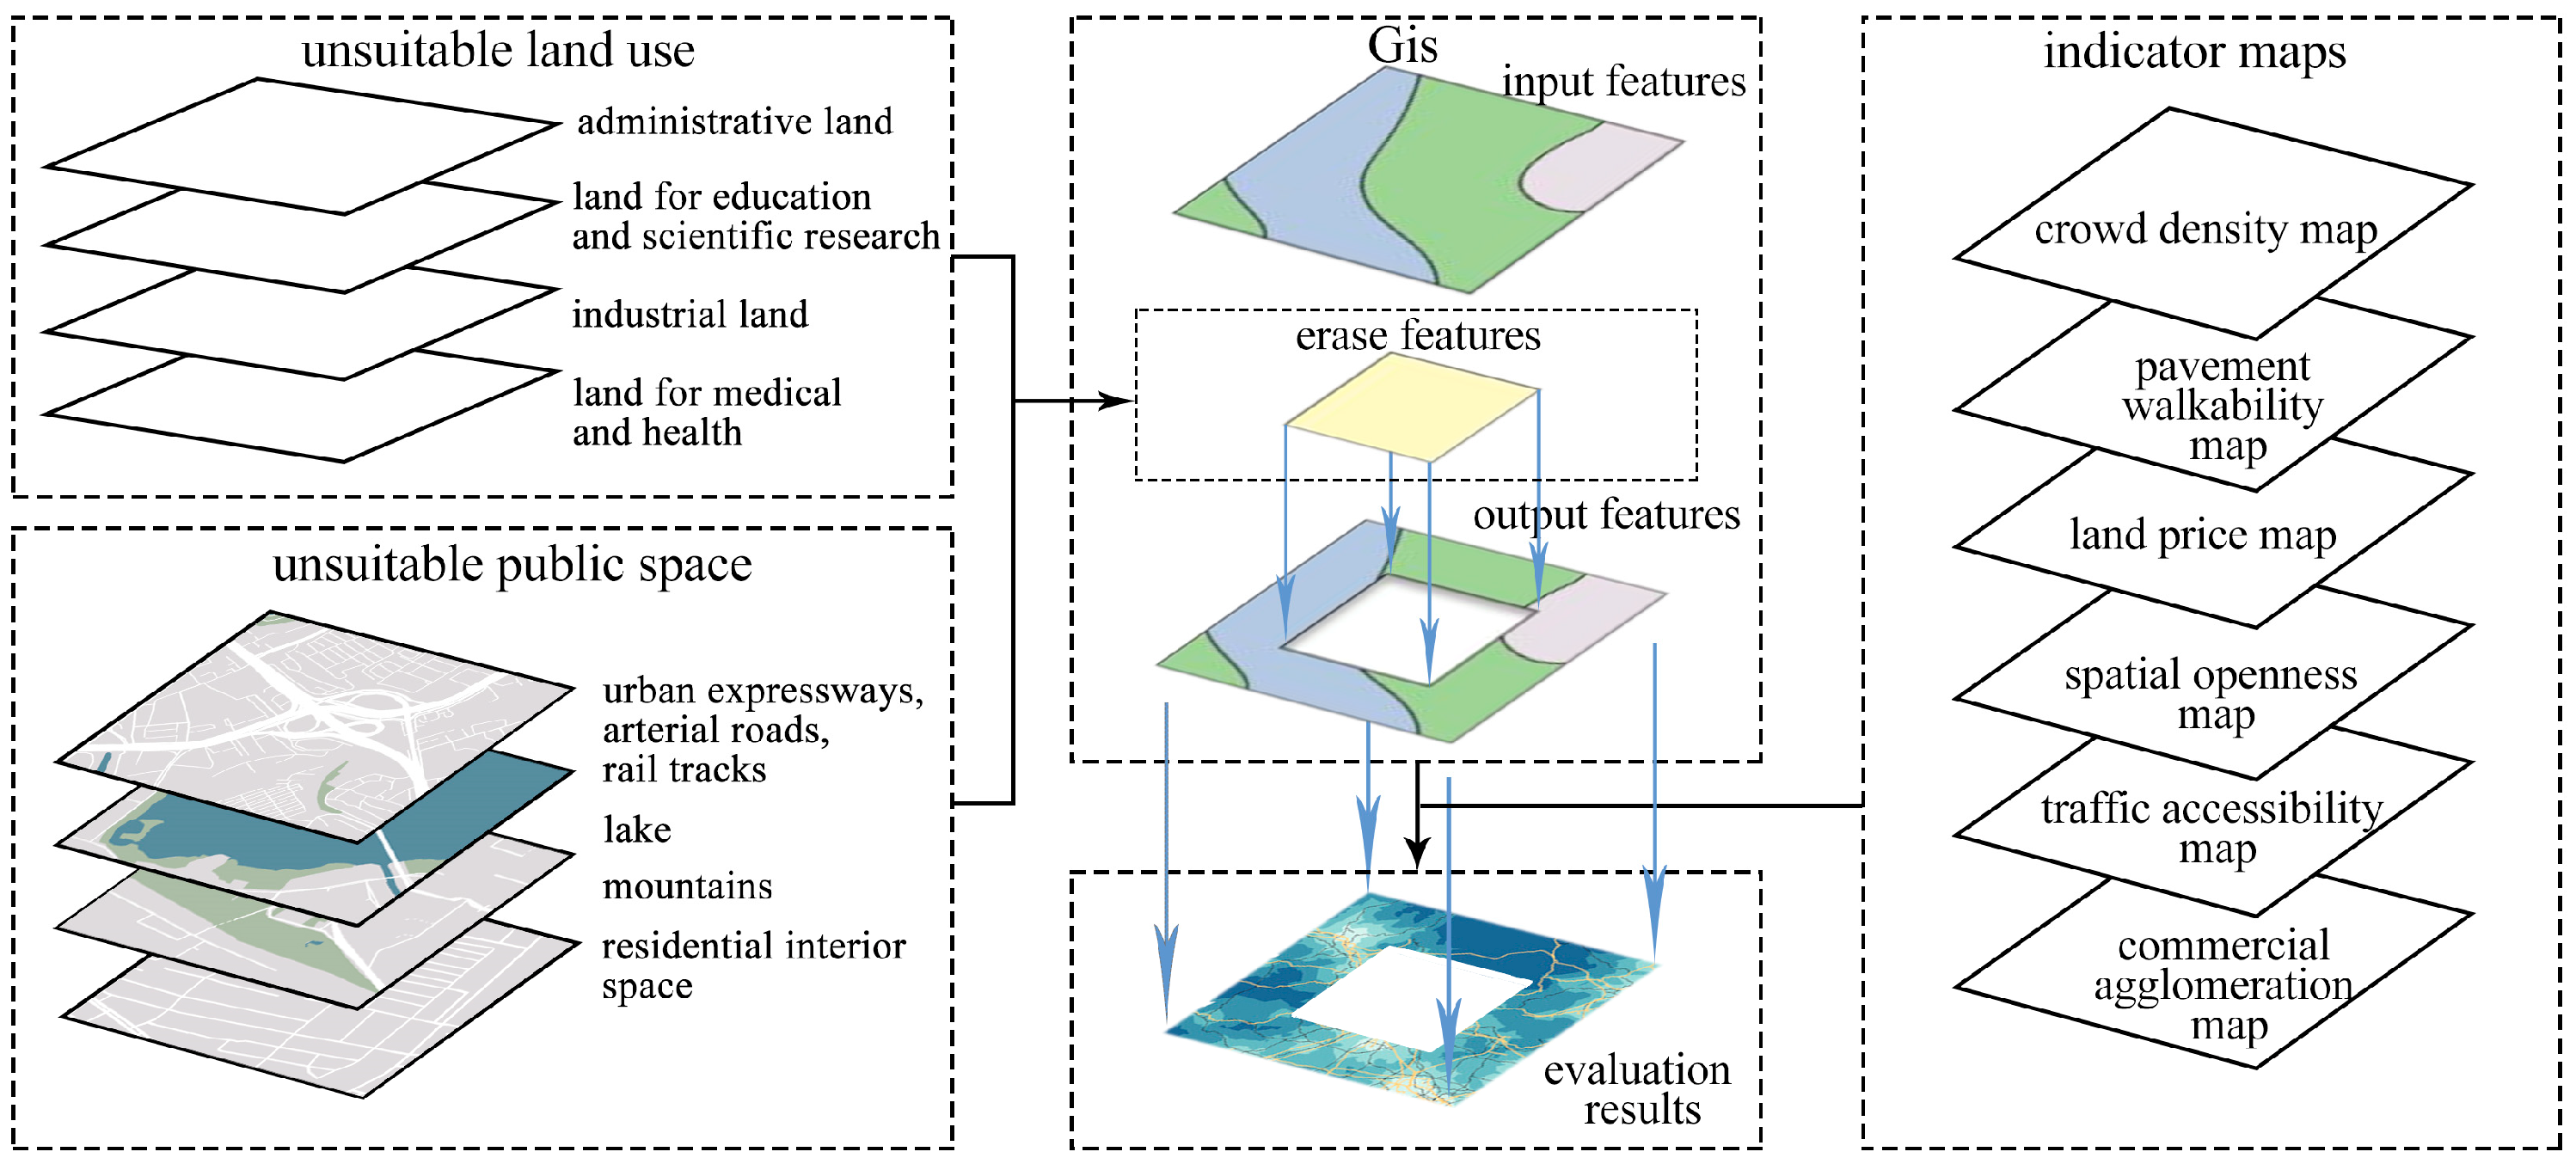
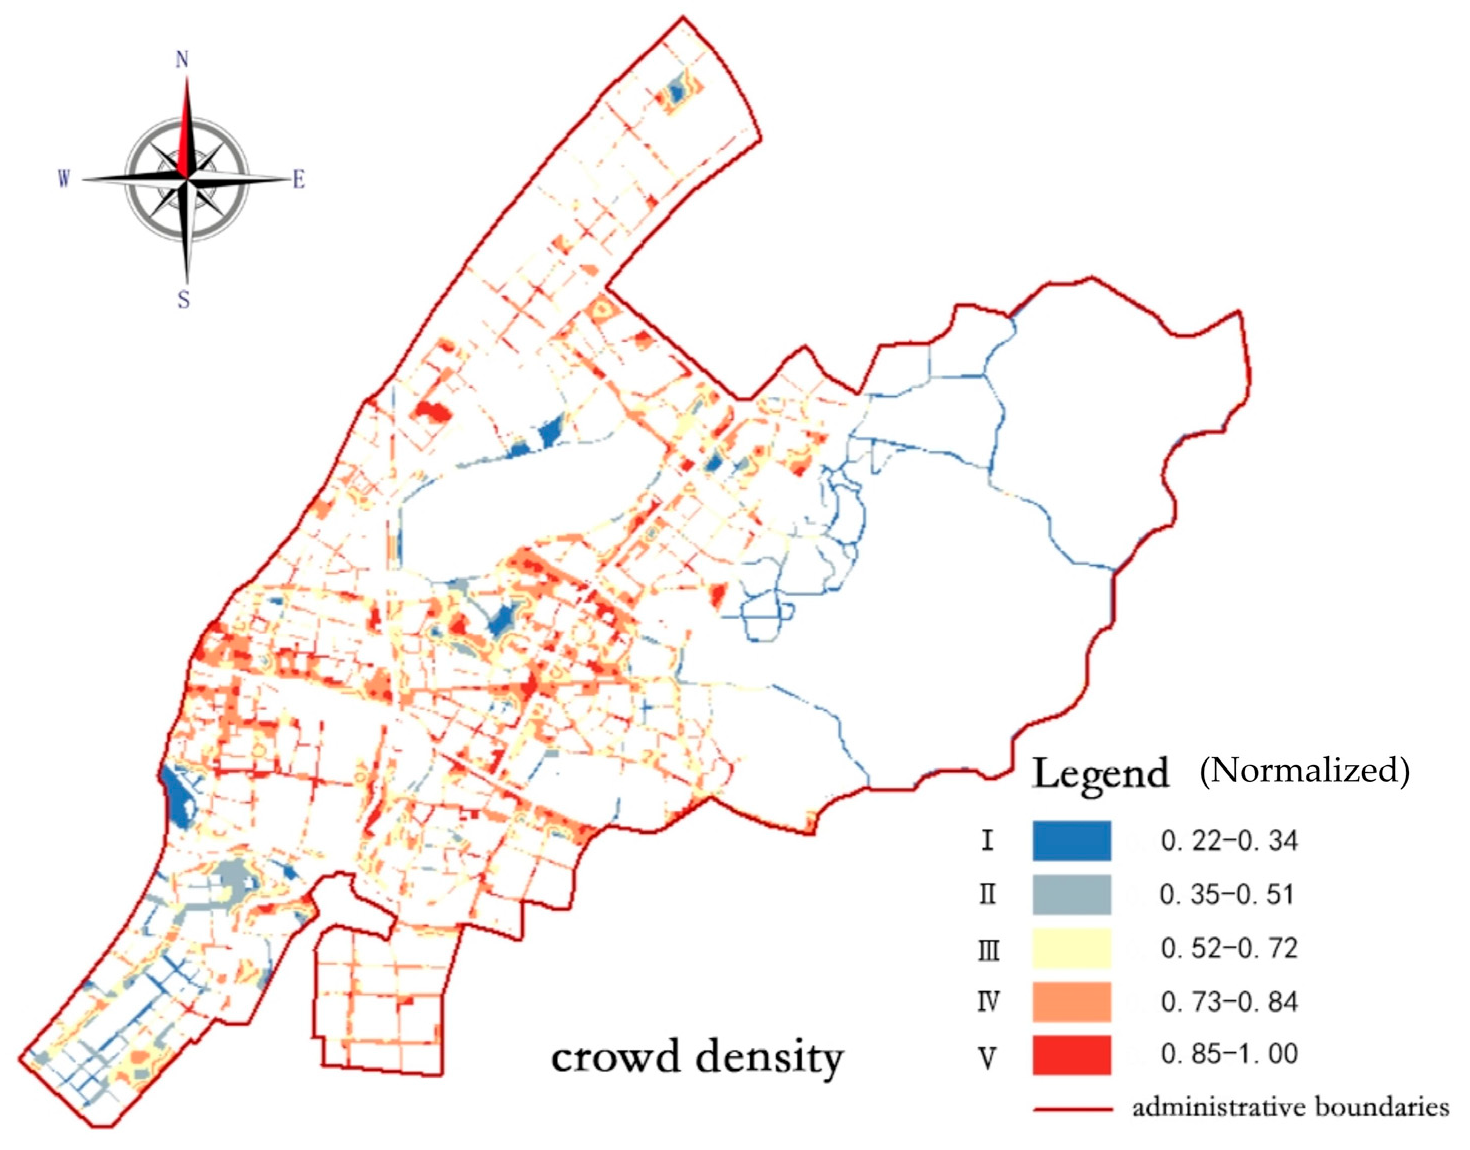
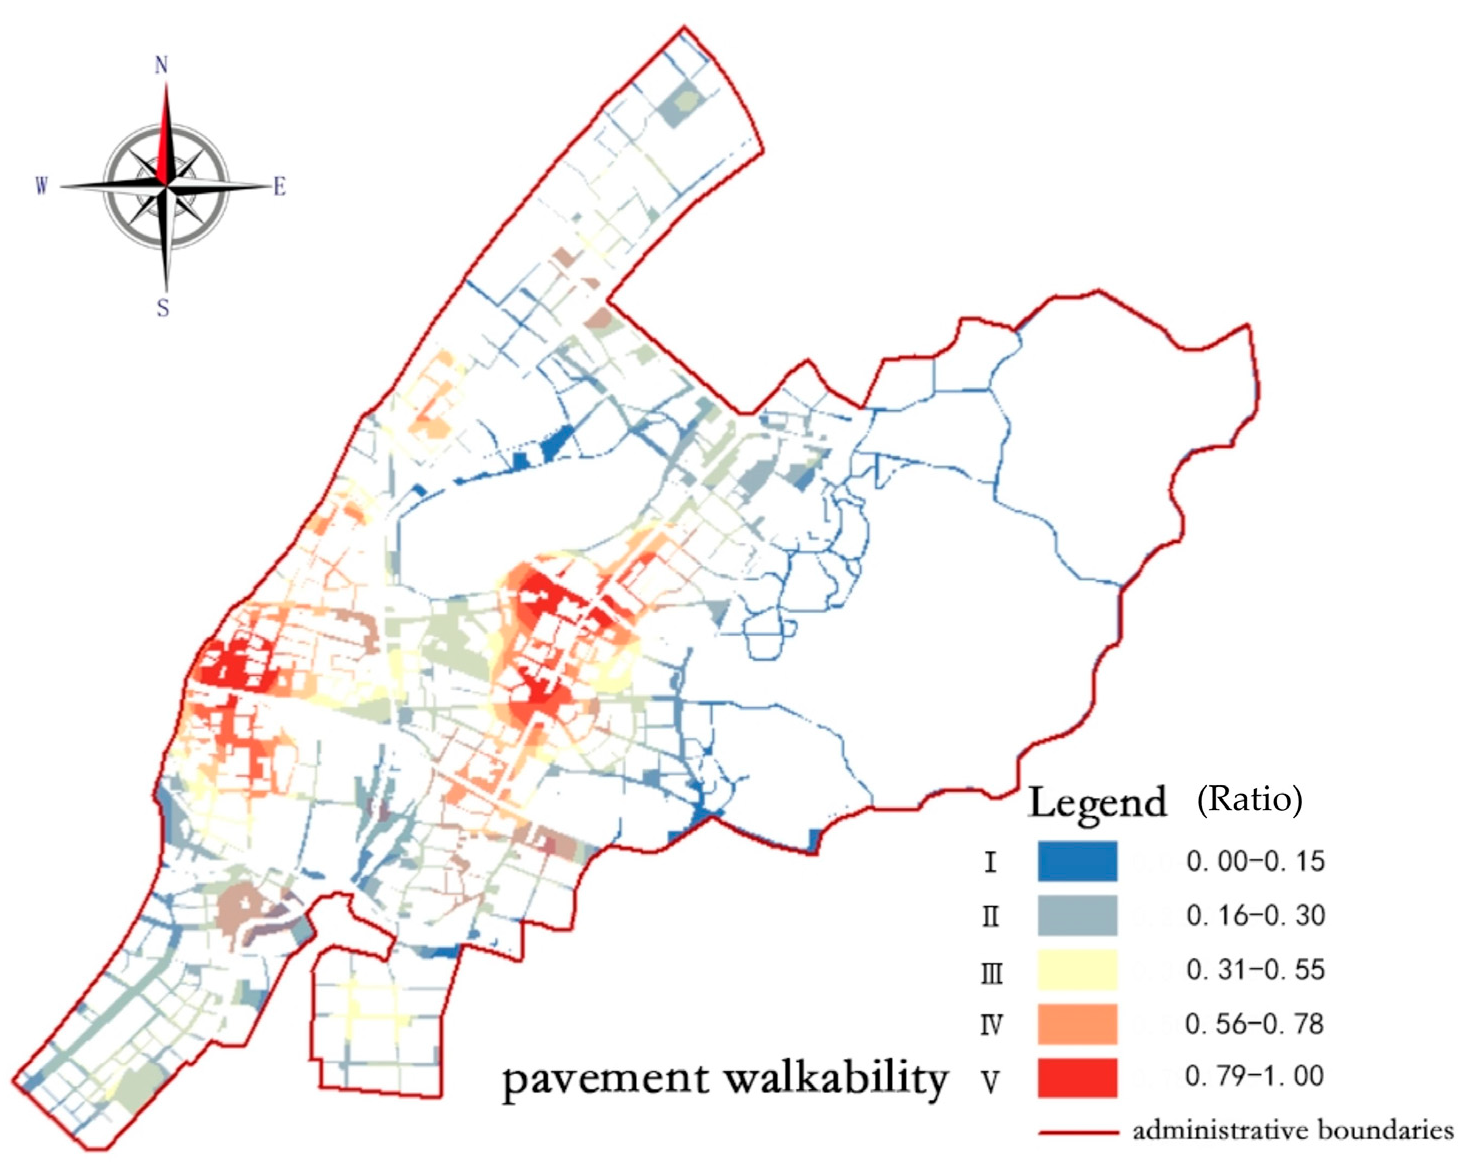
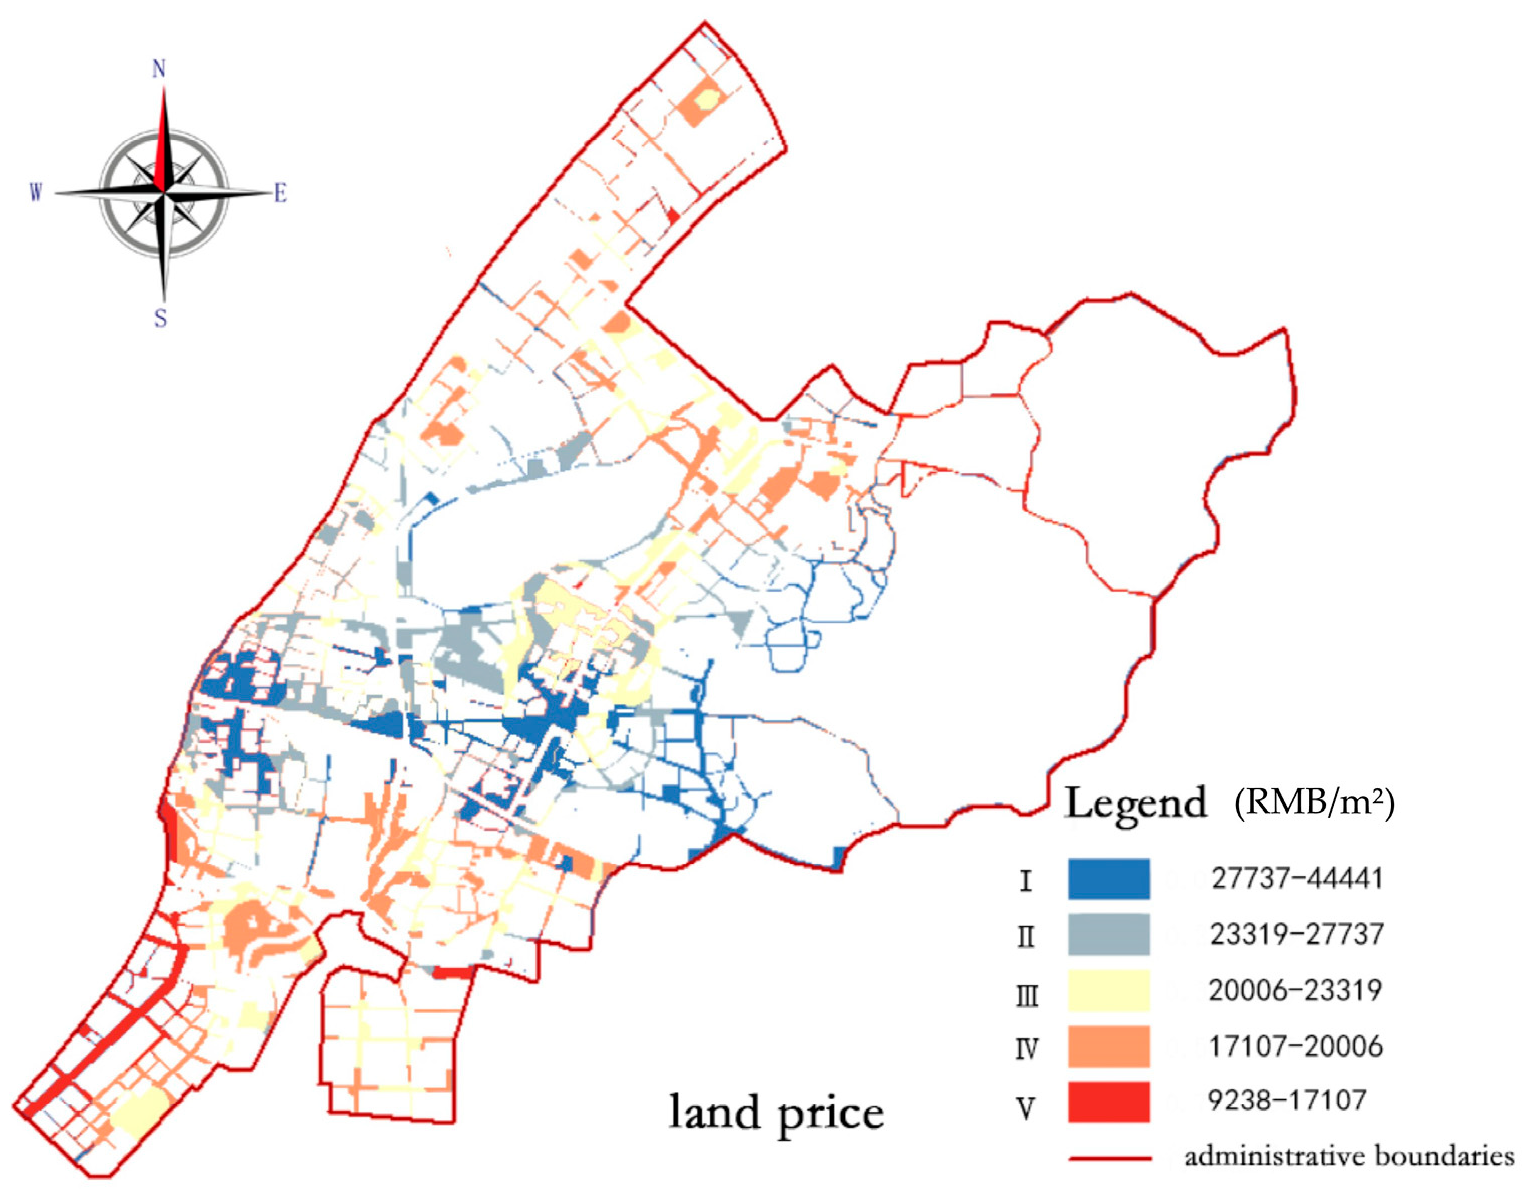
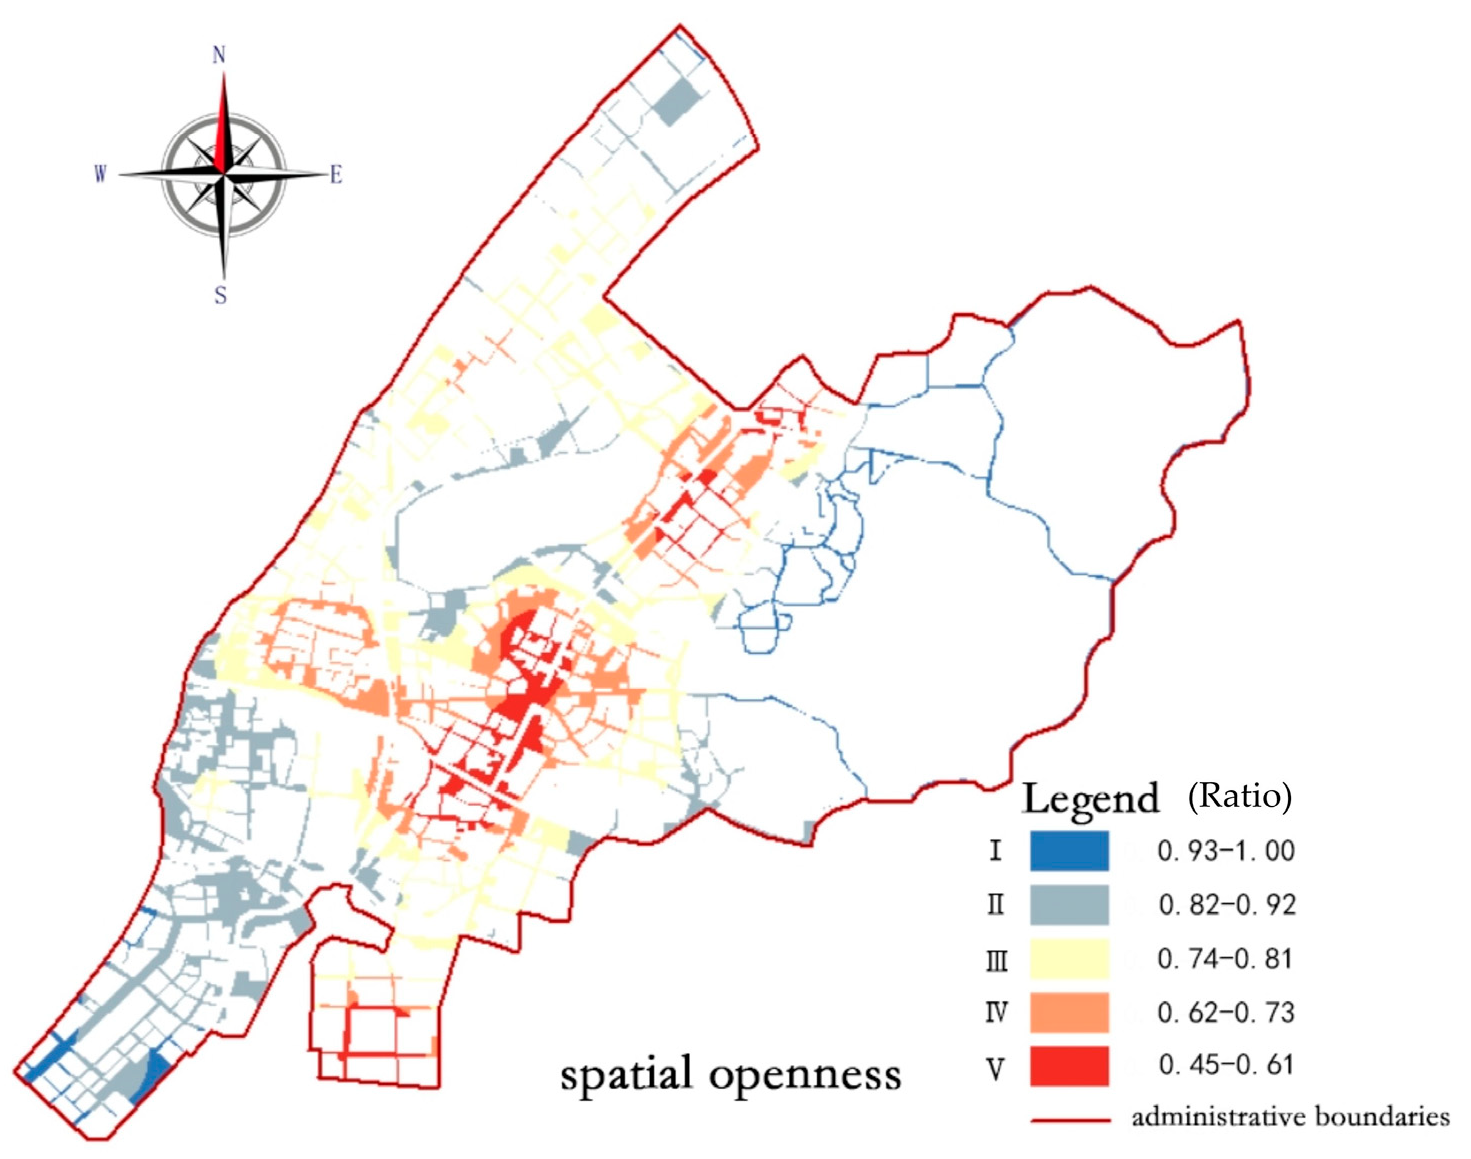

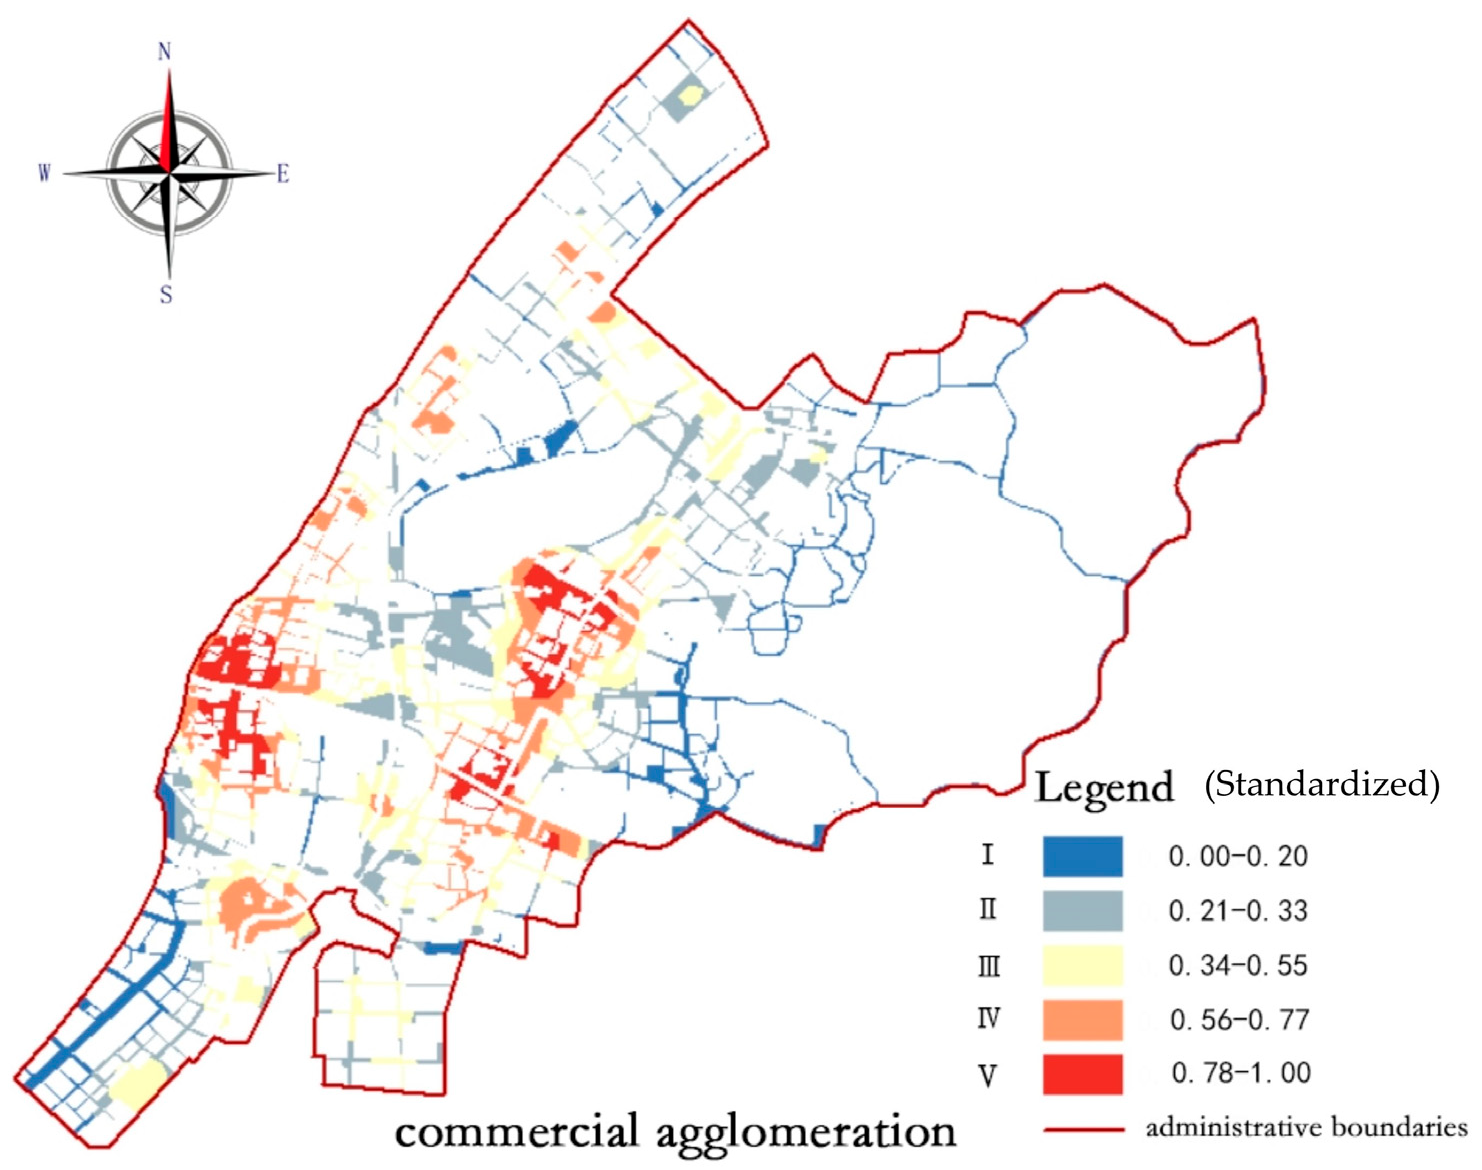
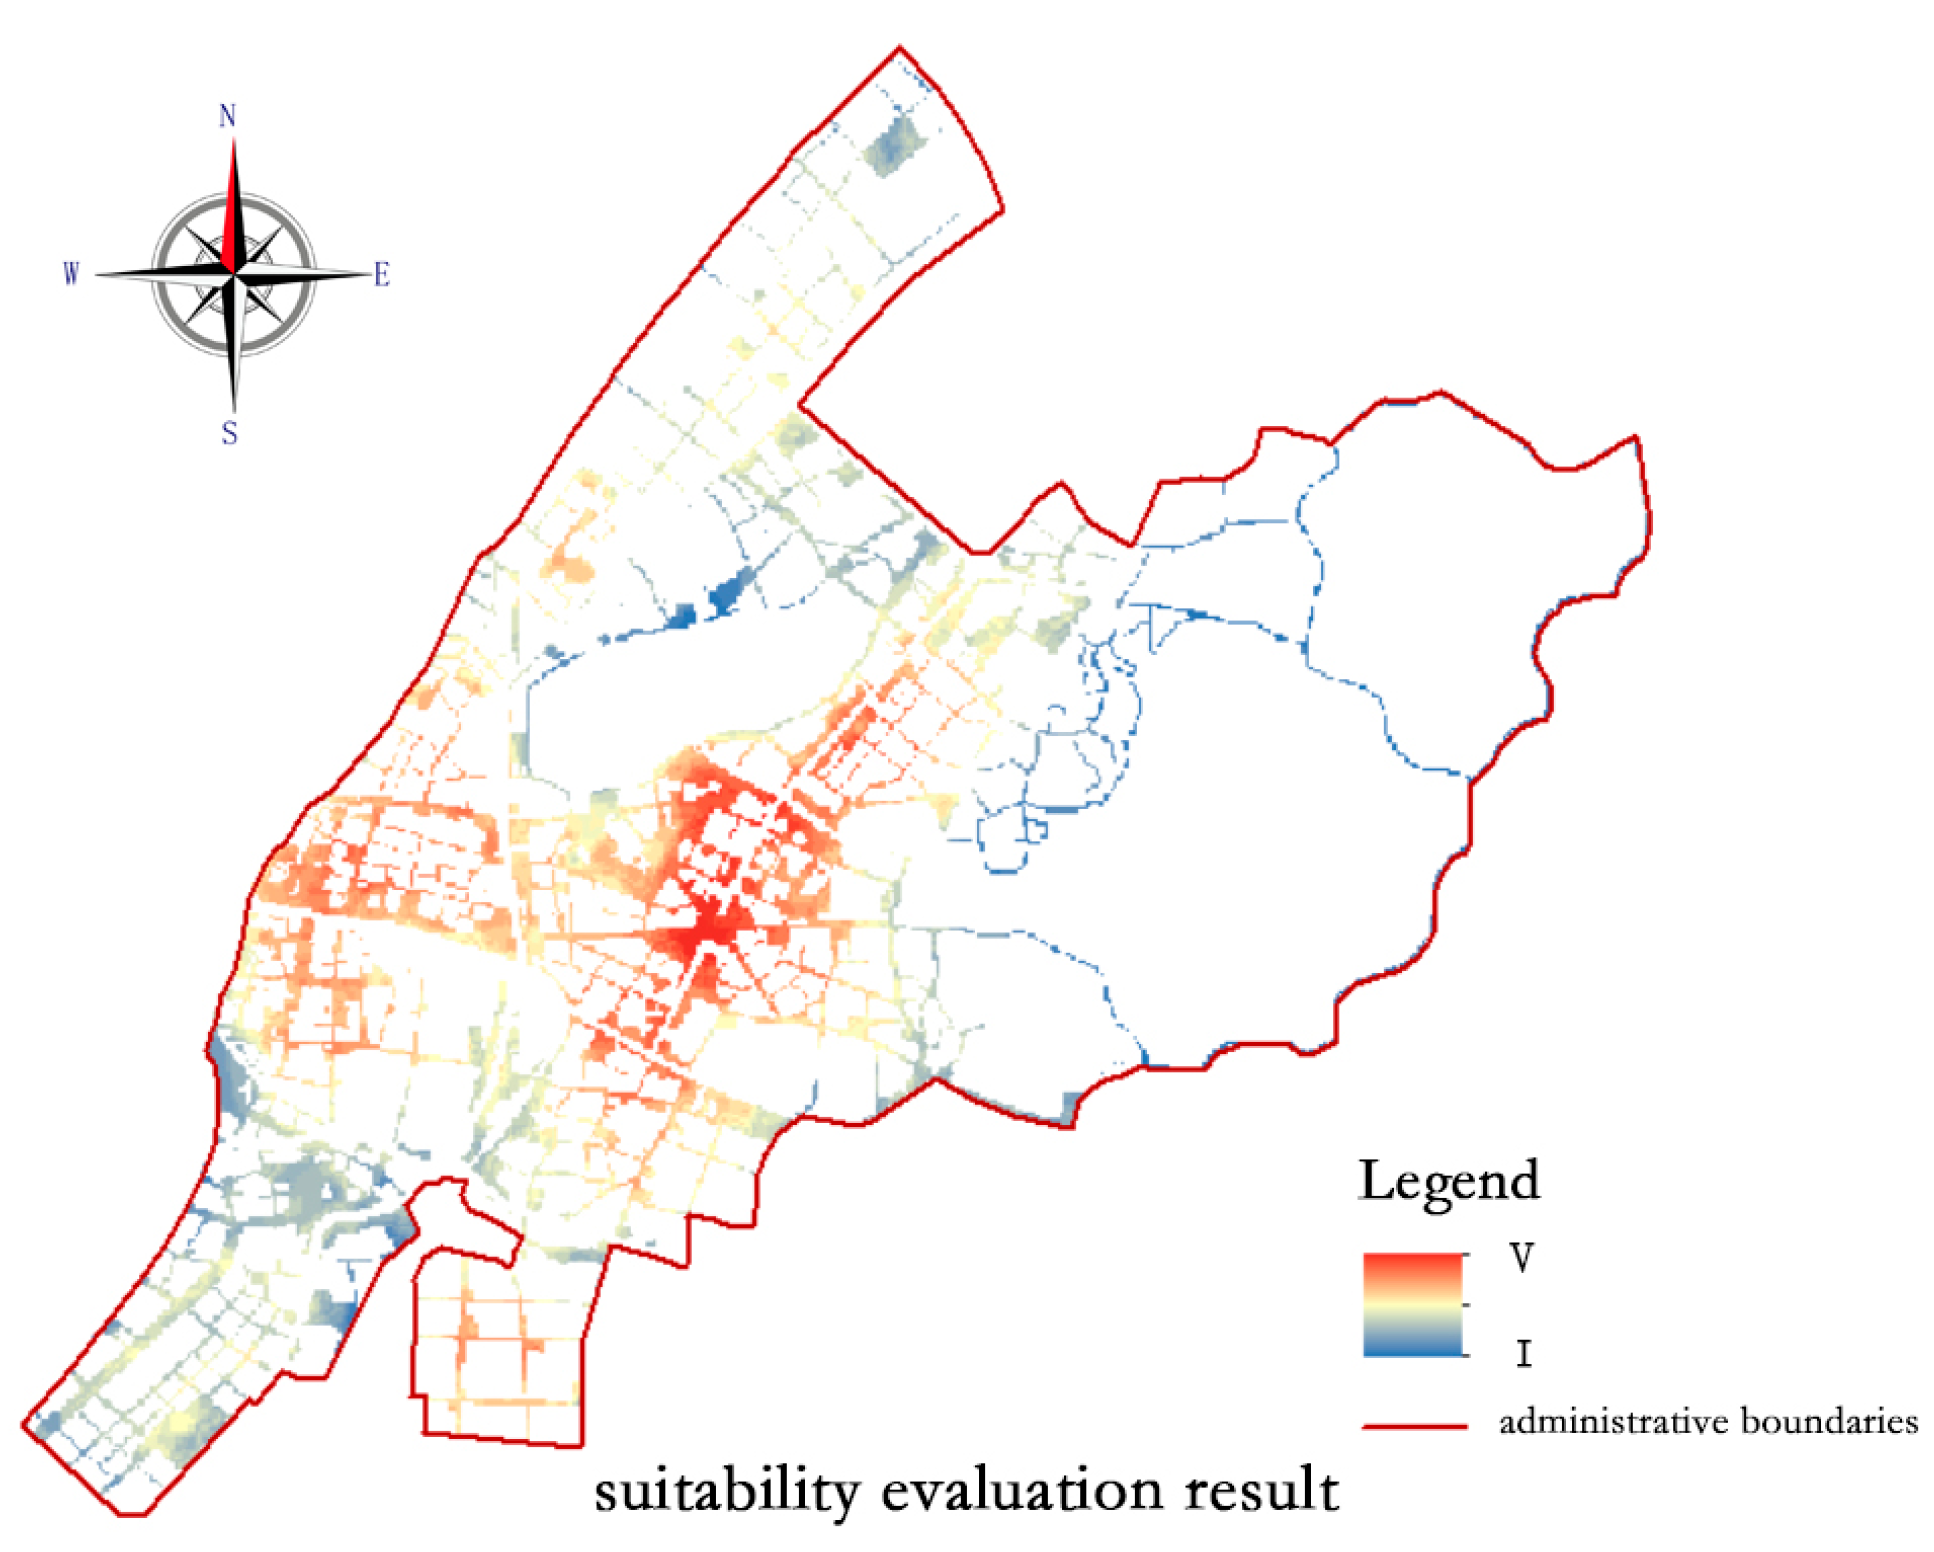
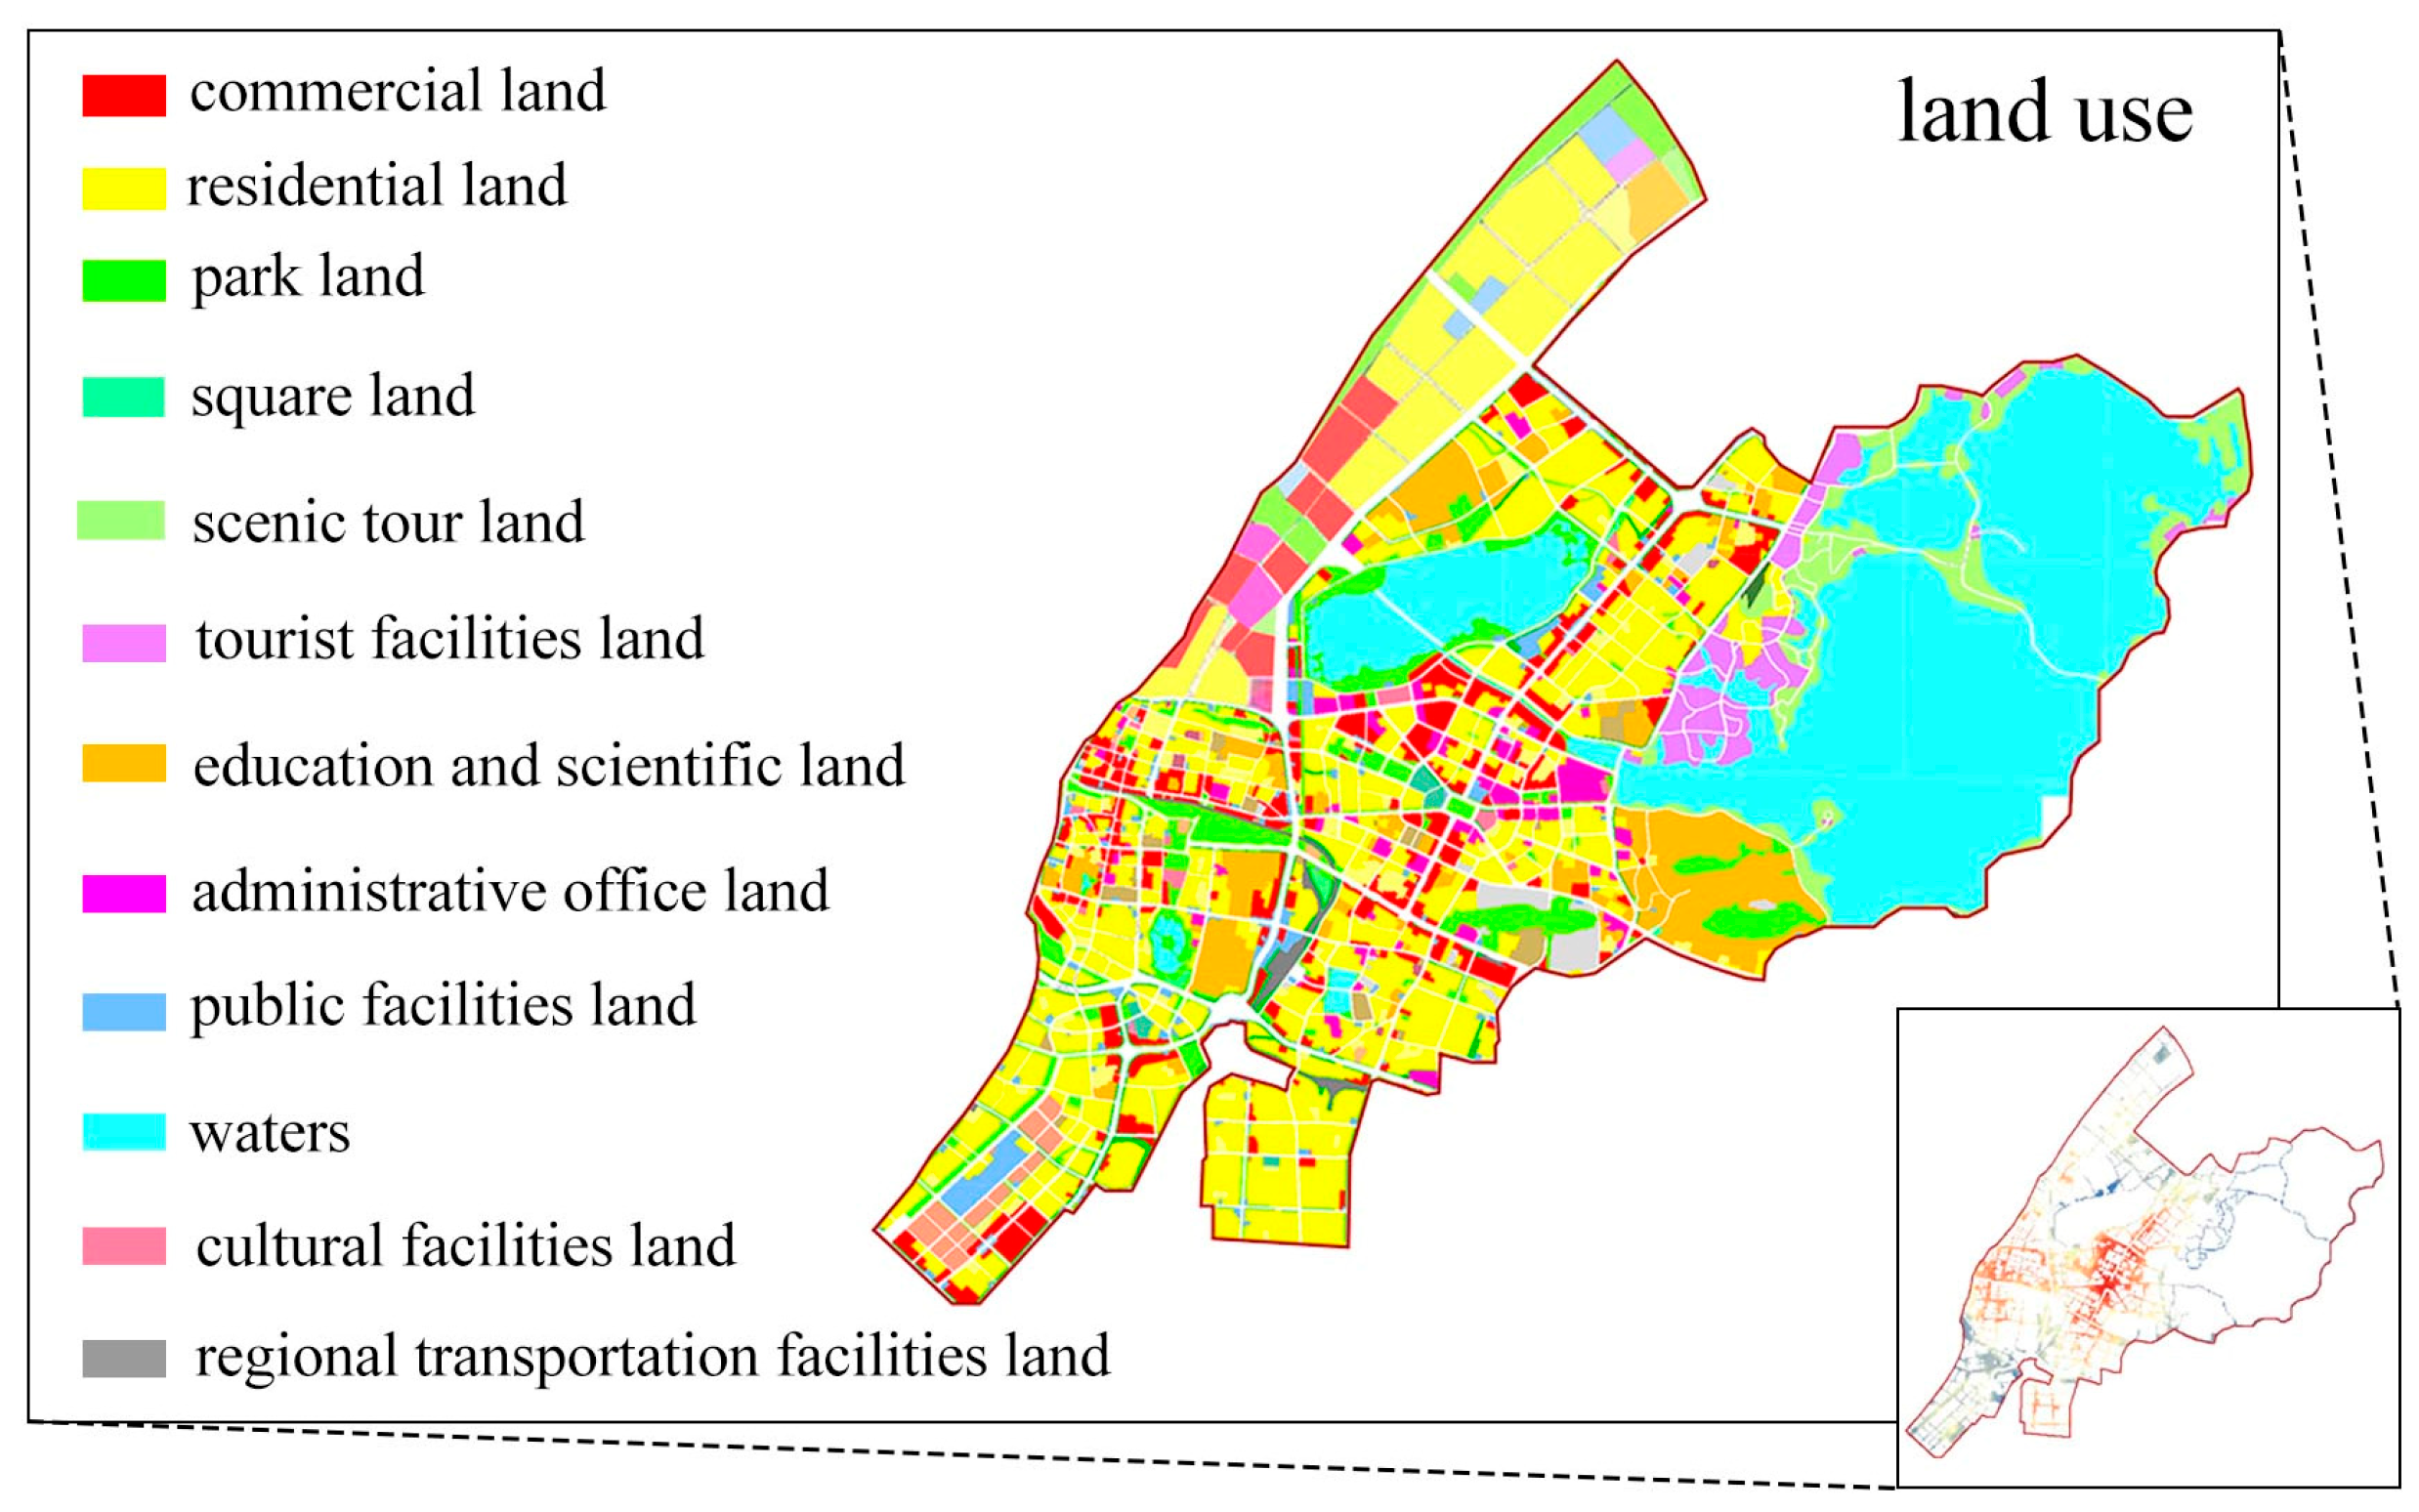
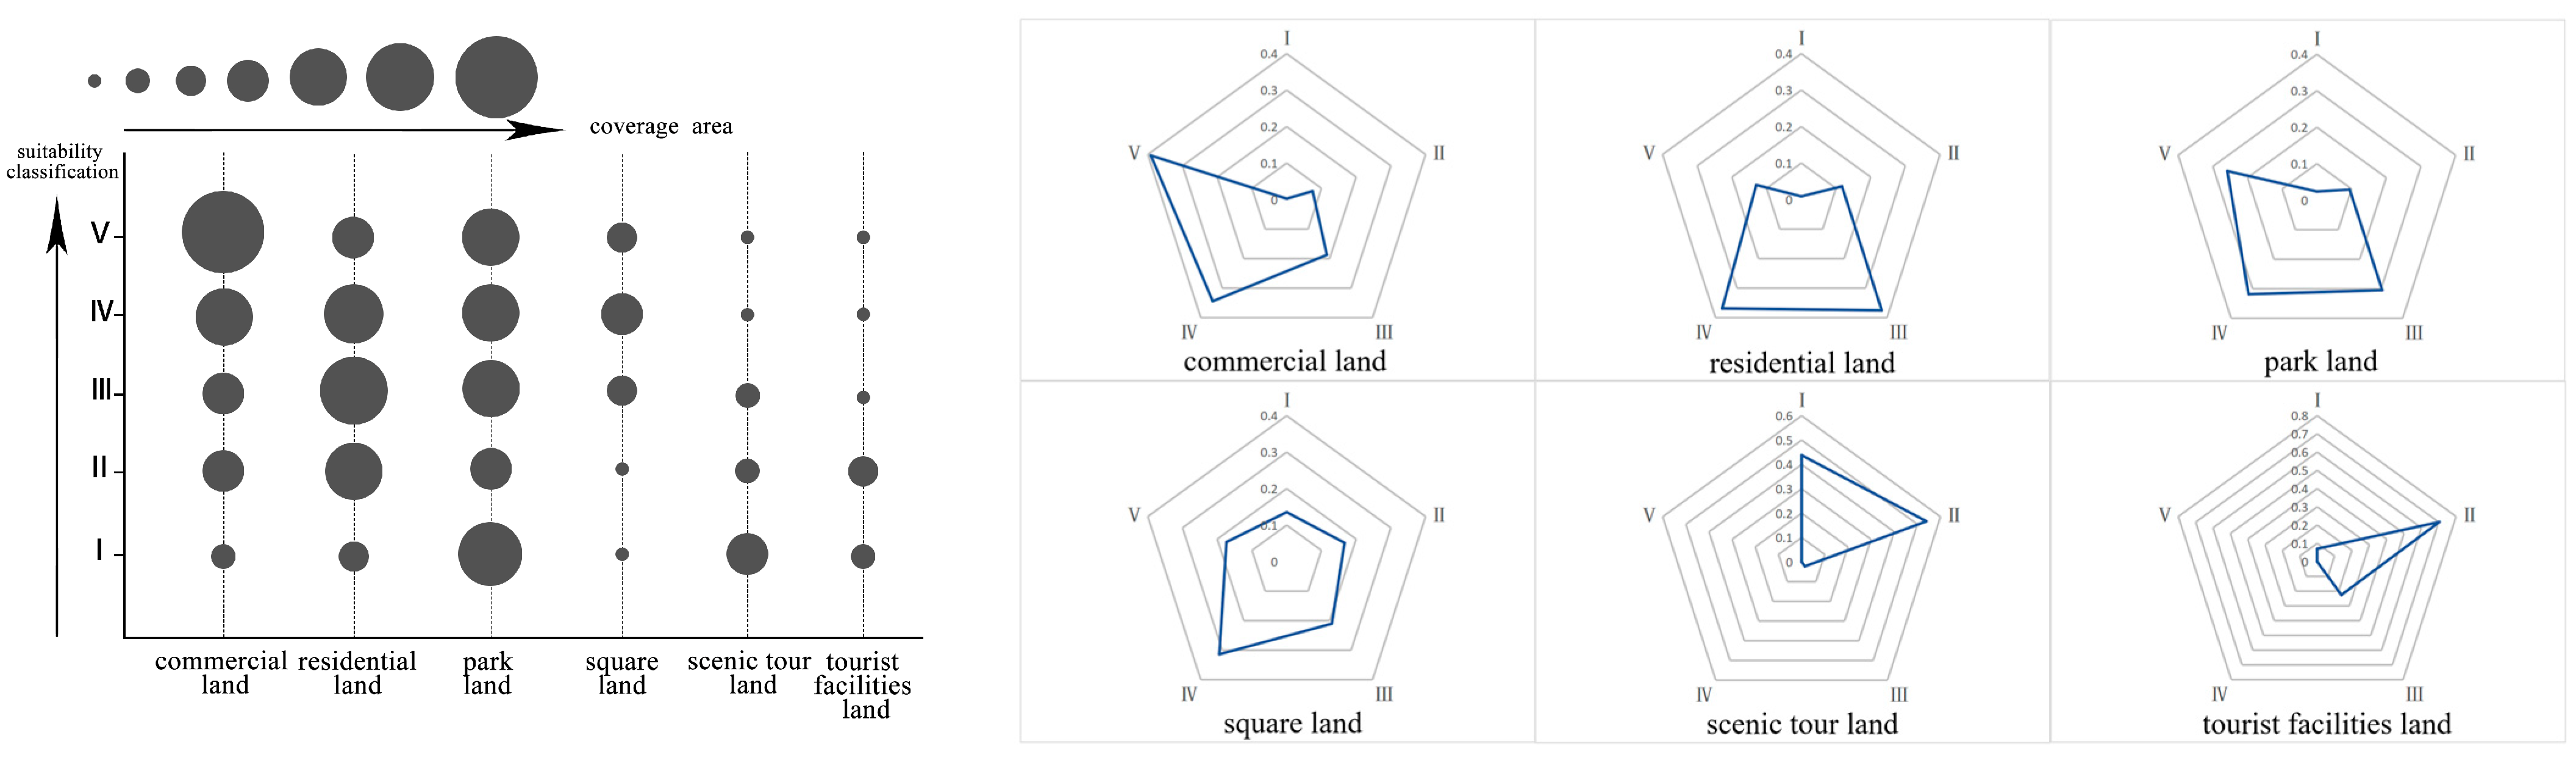

Disclaimer/Publisher’s Note: The statements, opinions and data contained in all publications are solely those of the individual author(s) and contributor(s) and not of MDPI and/or the editor(s). MDPI and/or the editor(s) disclaim responsibility for any injury to people or property resulting from any ideas, methods, instructions or products referred to in the content. |
© 2024 by the authors. Licensee MDPI, Basel, Switzerland. This article is an open access article distributed under the terms and conditions of the Creative Commons Attribution (CC BY) license (https://creativecommons.org/licenses/by/4.0/).