Abstract
In investigating the spatiotemporal patterns and spatial attributes of carbon storage across terrestrial ecosystems, there is a significant focus on improving regional carbon sequestration capabilities. Such endeavors are crucial for balancing land development with ecological preservation and promoting sustainable, low-carbon urban growth. This study employs the integrated InVEST-PLUS model to assess and predict changes in ecosystem carbon storage under various land use scenarios within the Chengdu urban cluster, a vital region in Central and Western China, by 2050. The results indicate the following. (1) A linkage between land use dynamics and ecosystem carbon storage changes: over two decades, a 7.5% decrease in arable land was observed alongside a 12.3% increase in urban areas, leading to an 8.2% net reduction in ecosystem carbon storage, equating to a loss of 1.6 million tons of carbon. (2) Carbon storage variations under four scenarios—natural development (NDS), urban development (UDS), farmland protection (FPS), and ecological protection (EPS)—highlight the impact of differing developmental and conservation policies on Chengdu’s carbon reserves. Projections until 2050 suggest a further 5% reduction in carbon storage under NDS without intervention, while EPS could potentially decrease carbon storage loss by 3%, emphasizing the importance of strategic land use planning and policy. This research provides a solid theoretical foundation for exploring the relationship between land use and carbon storage dynamics further. In summary, the findings highlight the necessity of incorporating ecological considerations into urban planning strategies. The InVEST-PLUS model not only sheds light on current challenges but also presents a method for forecasting and mitigating urbanization effects on ecosystem services, thus supporting sustainable development goals.
1. Introduction
Terrestrial ecosystem carbon storage (CS) encapsulates the significant amount of carbon held in plant leaves, woody components, and soil amid the ongoing carbon exchange process among plants, soil, and the atmosphere [1]. This carbon storage serves as a critical parameter for examining carbon fluxes between terrestrial ecosystems and the atmosphere and plays a pivotal role in evaluating the volume of carbon gases absorbed and released by these ecosystems [2]. Land use and cover change (LUCC) significantly influences the carbon cycling process within terrestrial ecosystems, thereby affecting regional carbon balances [3]. The specific land use and cover type is instrumental in determining the carbon storage capacity of terrestrial ecosystems, as shifts between land use categories often entail significant carbon exchanges [4,5]. With China’s pledge at the 75th United Nations General Assembly in 2020 to enhance its nationally determined contributions, implement more vigorous policies and measures, aim to peak carbon dioxide emissions by 2030, and achieve carbon neutrality by 2060, accurately estimating and modeling future land use carbon storage becomes increasingly critical [6]. In this context, an exhaustive investigation of the spatial distribution, characteristics, and mechanisms of land use carbon storage is imperative for comprehending the effects of human activities on regional carbon storage. This study not only aids in steering urban development toward low-carbon sustainability but also offers valuable insights for national spatial planning strategies.
In recent years, the study of carbon storage has received considerable attention from the academic community, especially regarding assessment methods, research subjects, and temporal scopes. The evaluation of carbon storage has seen the development of diverse methodologies by scholars [7]. Traditional techniques include biomass methods and accumulation methods [8]. However, the inability of these traditional methods to accurately reflect carbon storage changes across spatiotemporal gradients has led many researchers to adopt modeling approaches to assess these dynamic alterations [9]. Among existing models, the Integrated Valuation of Ecosystem Services and Trade-offs (InVEST) model stands out due to its low data requirements and efficient operation [10]. The Carbon module within the InVEST model, leveraging spatial land use changes, facilitates the visualization of changes in carbon storage ecosystem services. Utilizing the InVEST model allows for the quantitative assessment of carbon storage shifts, thereby offering an in-depth examination of how land use changes impact carbon storage [5,11].
Secondly, the research subjects of carbon storage cover a broad spectrum. From an administrative standpoint, studies span various spatial scales, including the macro (national), intermediate (provincial and municipal), and micro (county-level) scales, all recognized as critical research areas [12,13,14,15]. Research also extends across administrative boundaries, predominantly focusing on urban agglomerations, trans-basin areas, and similar extensive regions [16]. However, investigations into urban agglomerations are comparatively scarce, with a narrower focus that underscores their regional homogenization characteristics and trends. This specificity not only underscores the distinct role of urban agglomerations in carbon storage studies but also underlines their significance in regional carbon cycling dynamics. Predominantly, research has been concentrated in China’s eastern coastal areas [5]. The Chengdu Urban Agglomeration, distinguished as the first officially recognized urban agglomeration in Central and Western China, occupies a pivotal role [17]. Detailed exploration of carbon storage within the Chengdu Urban Agglomeration not only aims to bridge existing research gaps but also serves as a crucial reference for understanding carbon cycling in Central and Western China. As a model of advanced regional homogenization, the carbon storage scenario in the Chengdu Urban Agglomeration is shaped by local factors and mirrors the broader challenges and opportunities for carbon management and sustainable growth in these regions.
Thirdly, the temporal dimension of carbon storage research has historically been defined by cross-annual and cross-monthly analyses leveraging historical data, with a segment of the scholarly community dedicated to simulating and projecting future developments [18]. On the one hand, despite the widespread application of the InVEST model for evaluating ecosystem services, there is a noticeable lack of research combining these evaluations with forecasts of land use dynamics, particularly in the Central and Western regions of China, including the Chengdu Urban Agglomeration [19]. Our research aims to address this gap by applying the coupled model in this distinct area, offering fresh perspectives on the temporal and spatial progression of carbon storage. On the other hand, existing studies on ecosystem carbon storage frequently depend on static evaluation methods or dynamic models focused solely on land use changes, overlooking the integration of ecosystem service evaluations [20]. Our approach enhances existing methodologies by integrating the ecosystem service assessment features of the InVEST model with the dynamic land use modeling capabilities of the PLUS model, facilitating a more thorough examination of both present conditions and future possibilities.
Moreover, in contrast to previous research typically grounded in a limited set of scenarios to simulate differences in future land use [21], our study introduces a comprehensive suite of scenarios. In this paper, we concentrate on predicting changes in land use across various scenarios. This entails a holistic consideration of scenarios such as natural development, urban development, farmland protection, and ecological protection [18]. Under the natural development scenario (NDS), we examine the potential impacts of natural factors on carbon storage. In the context of the urban development scenario (UDS), the focus shifts to the implications of urban expansion on carbon storage. The farmland protection scenario (FPS) is dedicated to preserving the carbon storage capacity of farmland ecosystems, while the ecological protection scenario (EPS) underscores the conservation of natural ecosystems, thereby exerting distinct influences on carbon storage dynamics. This approach takes into full account the highly variable nature of future developments and enables a more nuanced analysis of the potential outcomes and impacts of various policy interventions on carbon storage.
Currently, research on land use change prediction models mainly focuses on models constructed based on cellular automata, such as the CA-Markov model [22], the FLUS model [23], and the CLUE-S model [24]. However, the Markov model has limitations in effectively describing spatial-scale changes [25], the FLUS model faces challenges in reflecting spatial differences in land use changes in different regions [26], and the CLUE-S model neglects the possibility of non-dominant land cover conversion [27]. In contrast, the PLUS model, with its unique advantages, effectively circumvents the pitfall of exponential growth in the number of transformation types as categories increase through the integration of transformation analysis strategies and pattern analysis strategies. Simultaneously, it retains the model’s capacity to unearth the mechanisms driving land use changes over a specified period, showcasing a broader applicability [18].
Consequently, by amalgamating the predictive capabilities of the PLUS model with the ecosystem service assessment proficiency of the InVEST model, our methodology empowers users to: (1) Visualize future land use changes under various policy scenarios, thereby facilitating a more informed decision-making process. (2) Quantify the impacts of land use changes on ecosystem carbon storage, offering valuable insights for carbon management and conservation strategies. (3) Evaluate policy interventions by comparing scenarios such as the NDS, UDS, FPS, and EPS, promoting the formulation of targeted and effective land use policies. (4) Our model has been applied through a case study in the Chengdu Urban Agglomeration, serving as a template for similar research in other regions, thus supporting global efforts toward sustainable development and climate change mitigation.
Building upon the aforementioned context, the pressing challenges posed by urbanization and climate change necessitate a deeper understanding of their impacts on ecosystem services, particularly on carbon storage in urban and peri-urban areas. Consequently, the primary aim of this study is to unravel the complex interplay between land use changes and ecosystem carbon storage within the Chengdu Urban Agglomeration. By specifically focusing on the rapidly urbanizing Chengdu urban cluster in Central and Western China, this research employs the InVEST-PLUS model to assess the impacts of land use changes on ecosystem carbon storage and to explore potential strategies for mitigating adverse effects. To this end, we will address the following research questions: (1) How have different land use types in the Chengdu urban cluster changed over the past 20 years? (2) How have these changes affected the distribution and total amount of regional carbon storage? (3) How will carbon storage change in the future under different land use and ecological protection policy scenarios?
2. Study Area
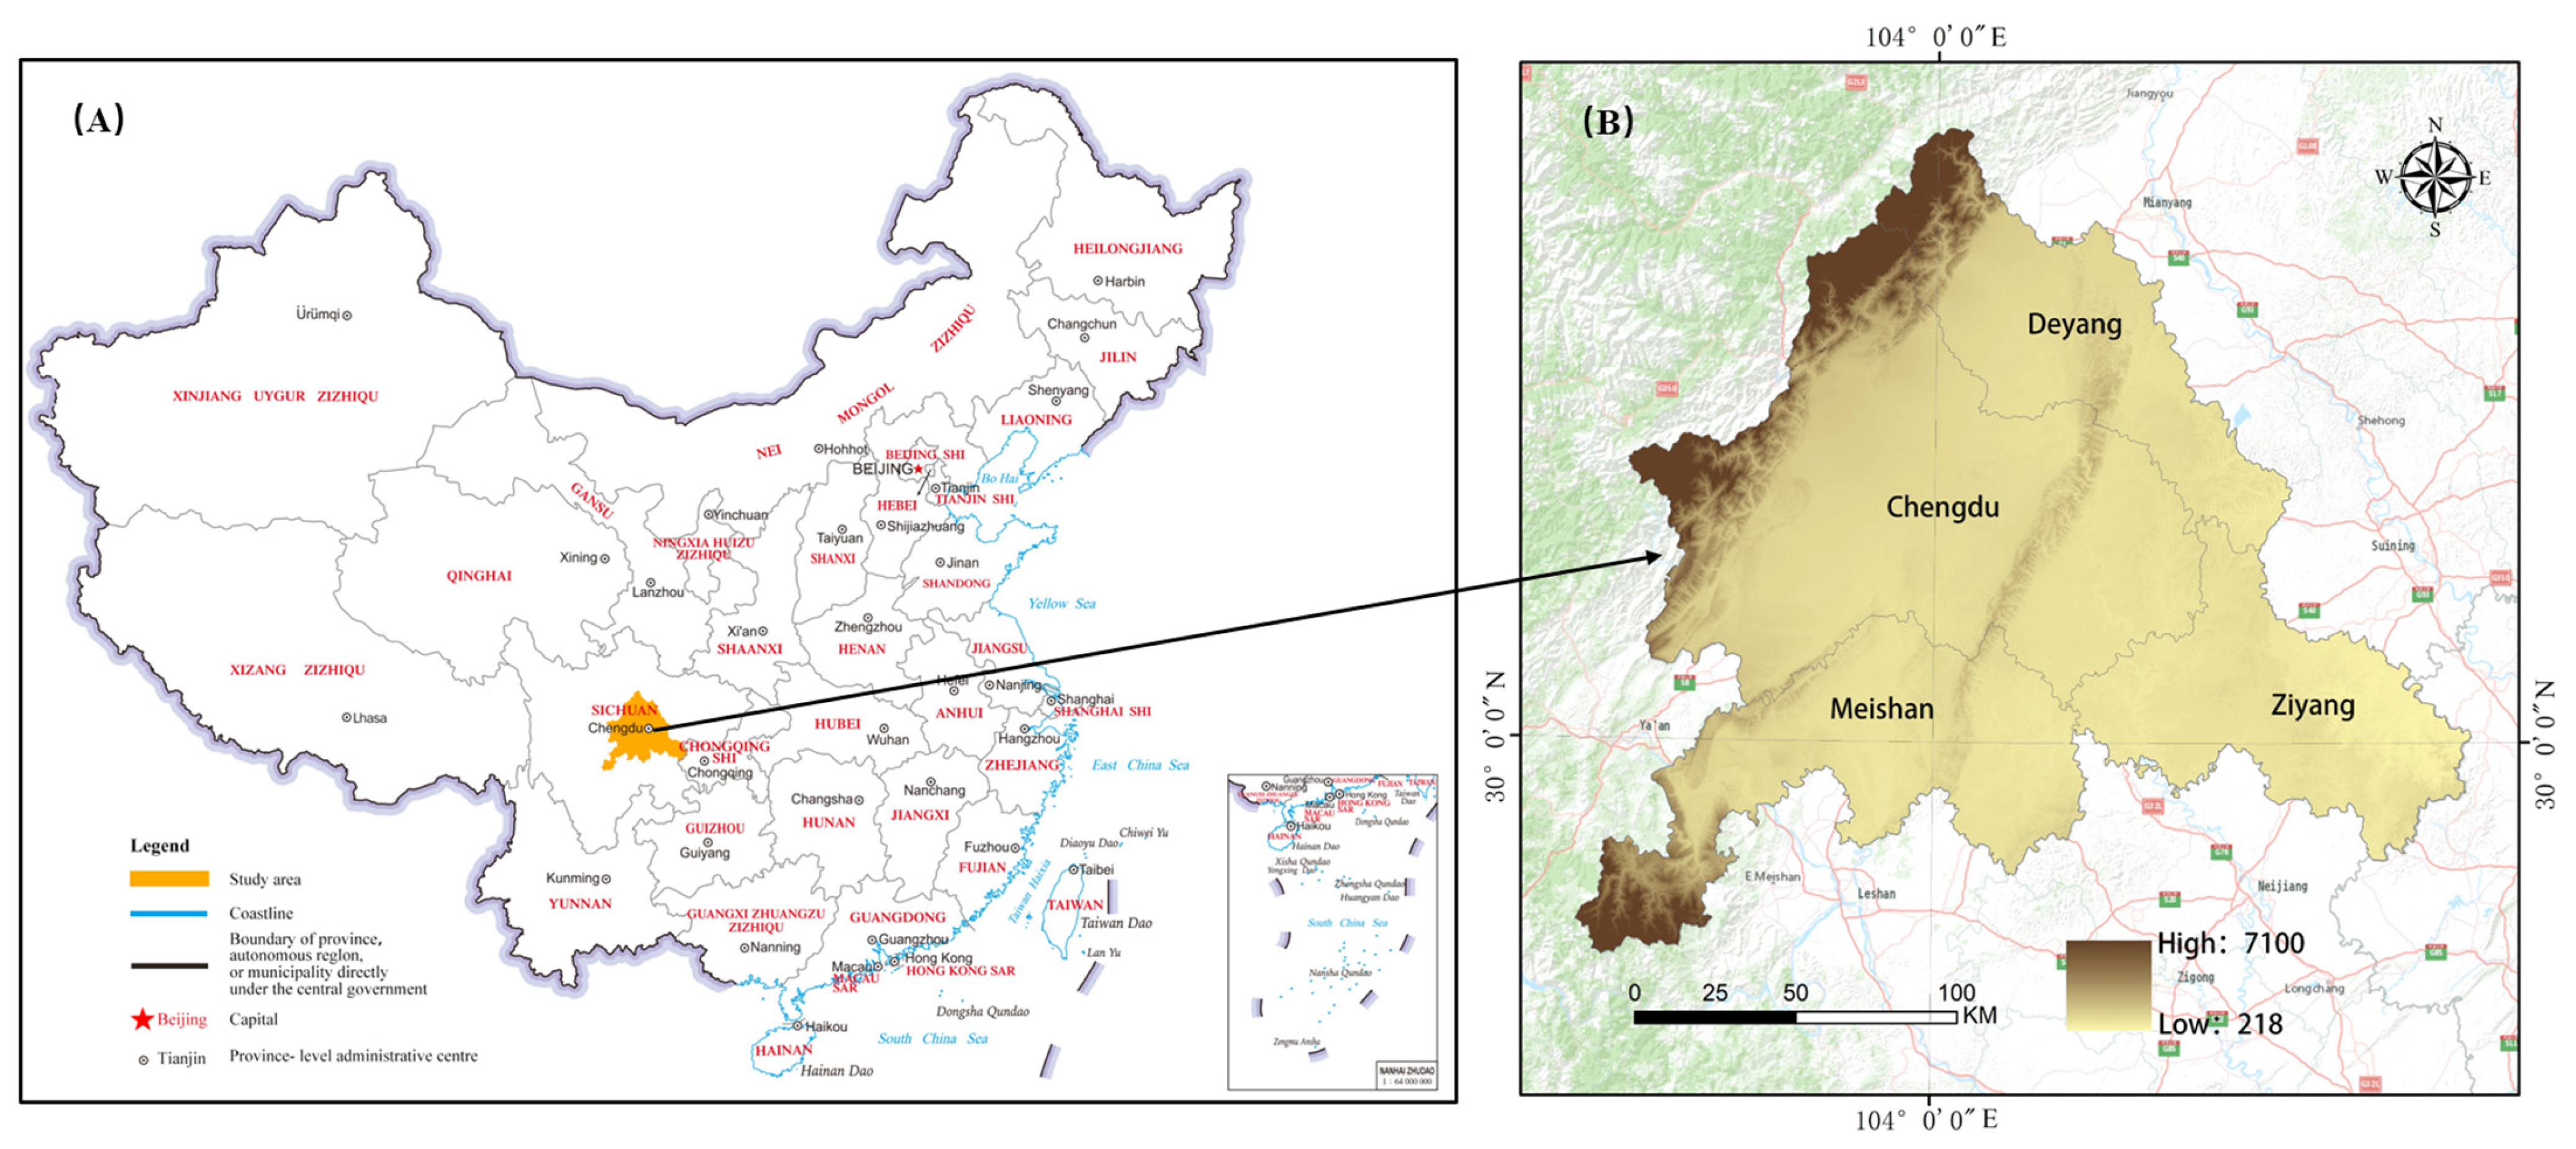
Chengdu Urban Agglomeration, as a crucial intersection point of China’s “Belt and Road Initiative” and the Yangtze River Economic Belt, is explicitly centered around Chengdu City and tightly linked with cities such as Deyang, Meishan, and Ziyang, forming a closely connected regional network. The total area of the agglomeration reaches 26,400 square kilometers, and as of the end of 2020, the resident population is approximately 27.61 million. As one of the most active, innovative, and open regions in the country’s economic development, the Chengdu Urban Agglomeration urgently needs to comprehensively implement requirements for dual control of energy consumption and control of carbon emissions. Simultaneously, it actively accelerates the construction of the Western Region Environmental Resource Trading Center and the National Carbon Market Capacity Building (Chengdu) Center. As depicted in Figure 1, the base map is sourced from the National Administration of Surveying, Mapping and Geoinformation of China (2019), with the addition of topographic land maps and specific annotations using ArcGIS 10.8 software. The remaining maps were also completed utilizing the same software.
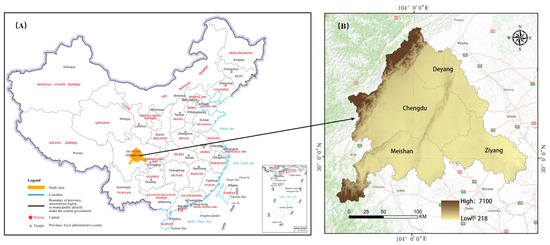
Figure 1.
Location (A) and topographical map (B) of Chengdu Urban Agglomeration.
3. Decision Framework and Data Sources
3.1. Design of Decision Framework
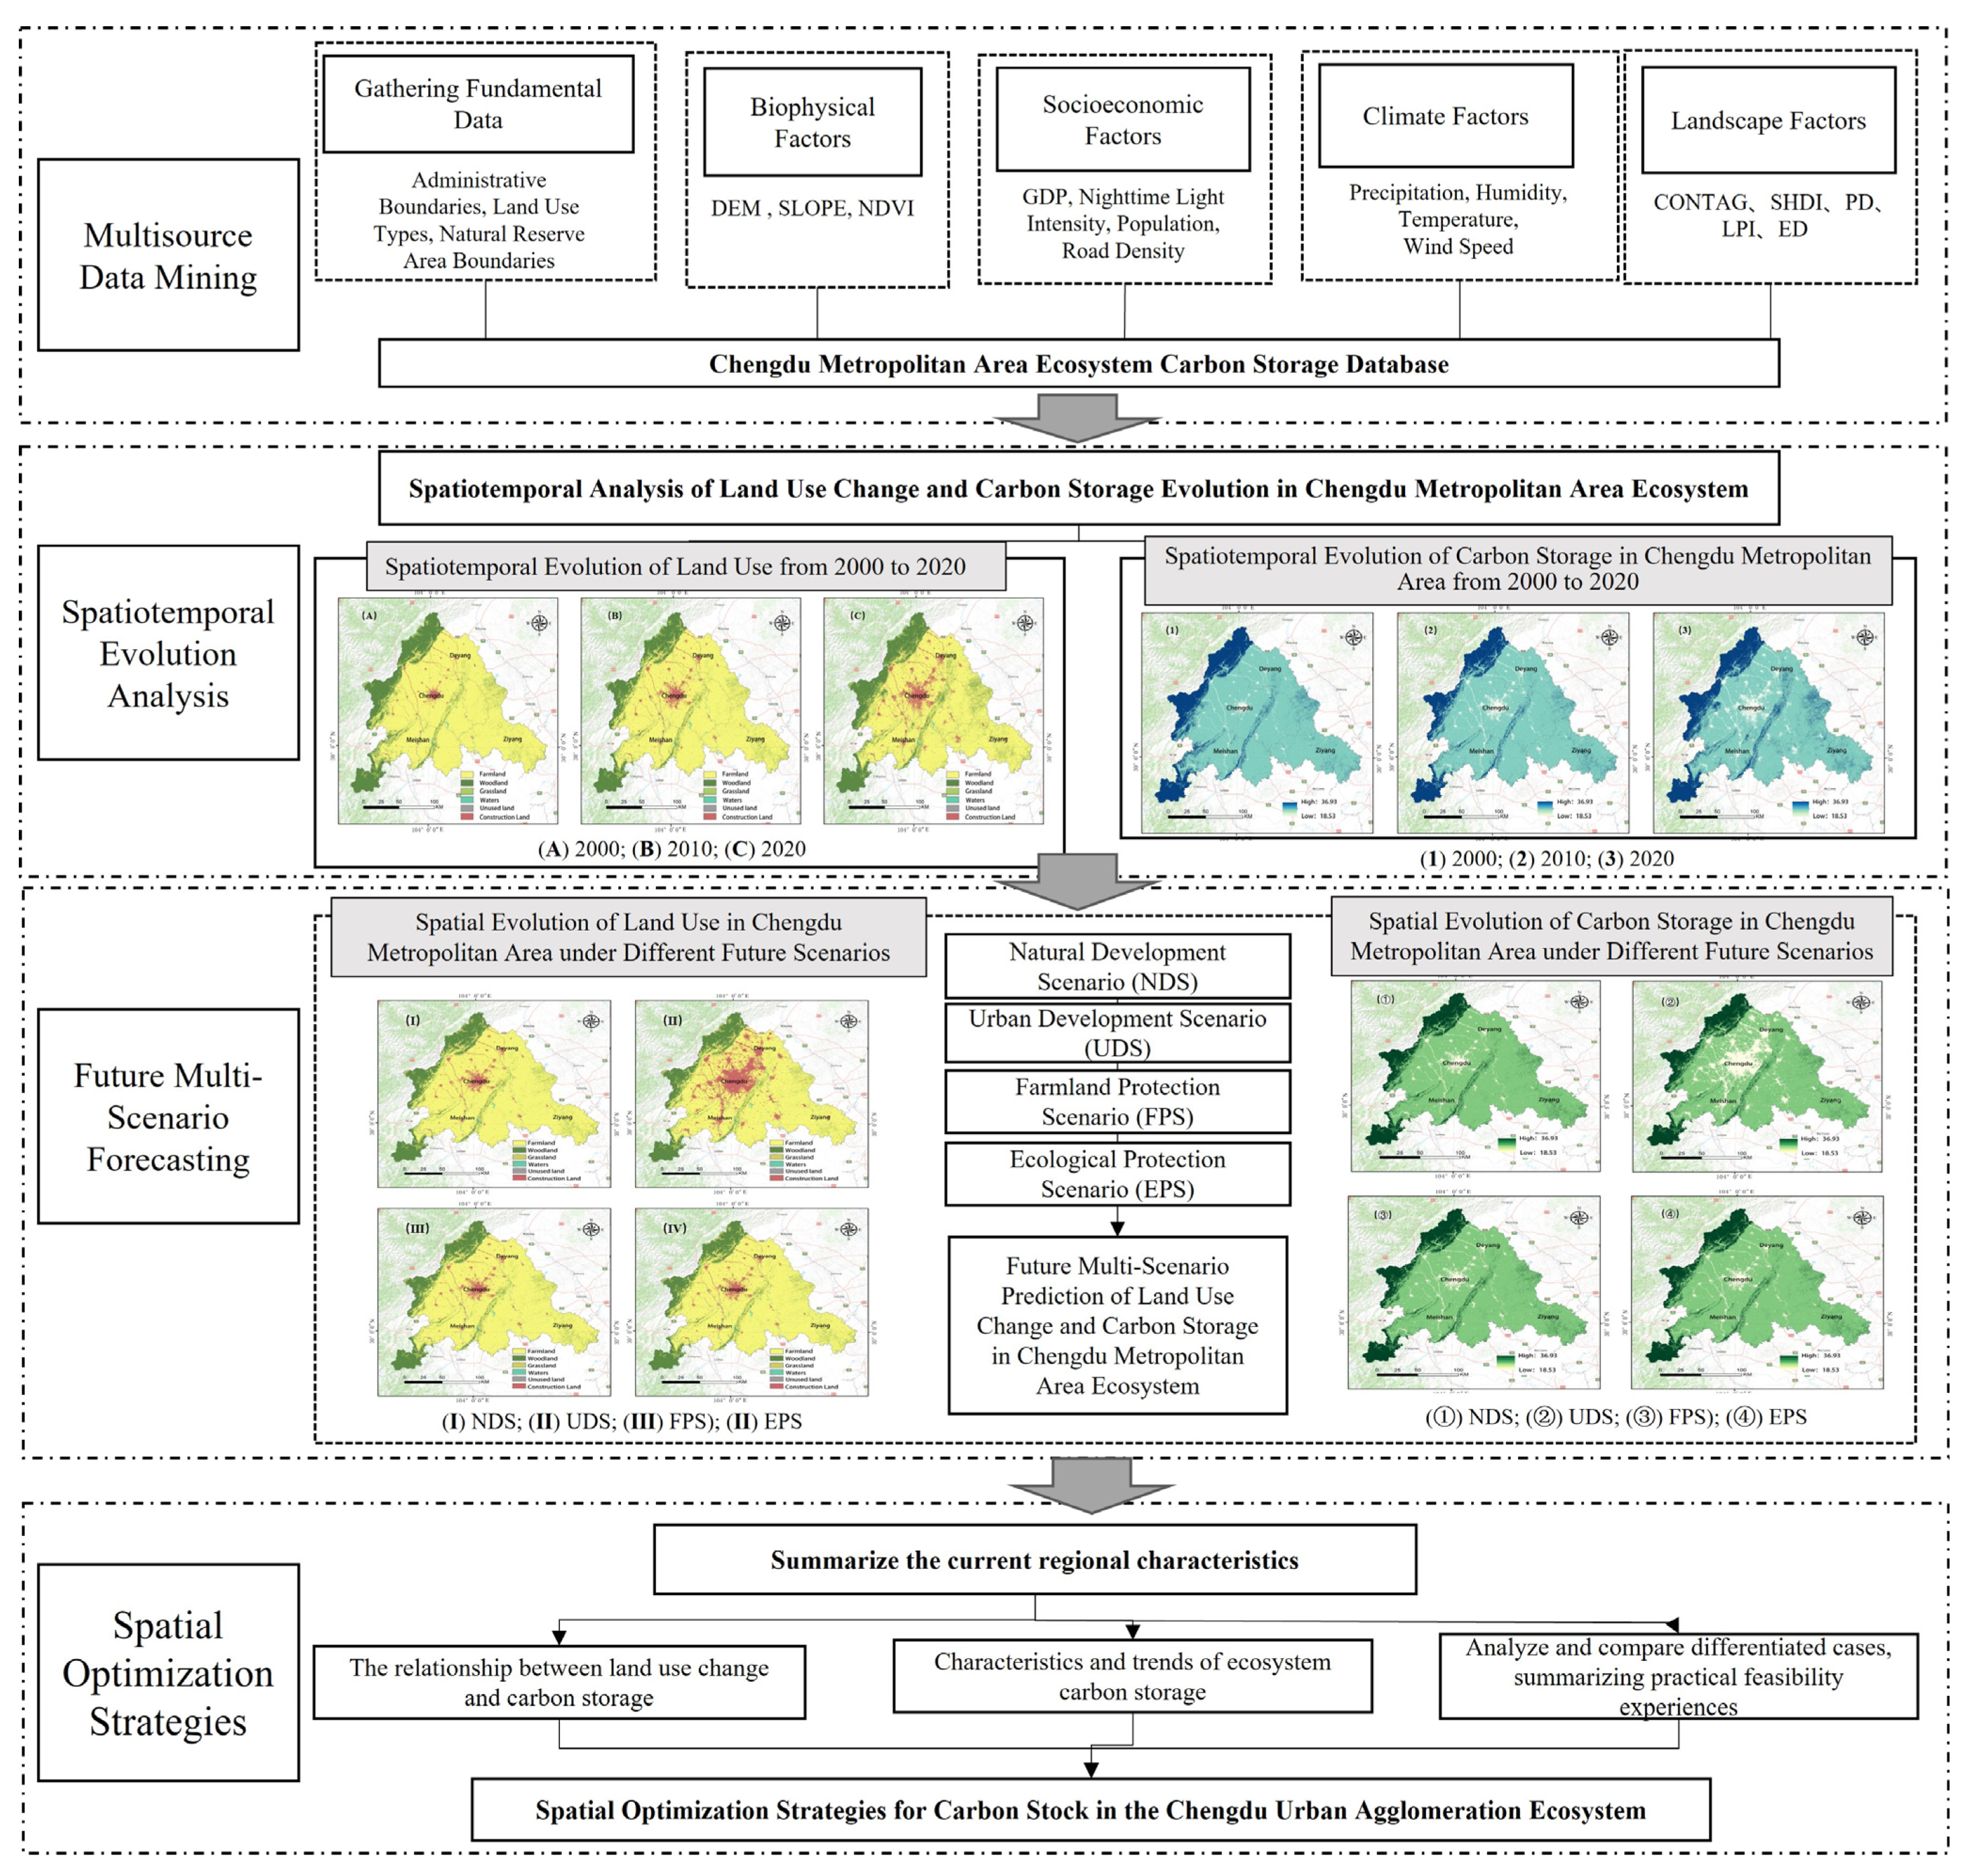
This research project employs a problem-oriented and goal-directed method, outlined by a technical sequence: “Multi-source Data Mining—Spatiotemporal Evolution Analysis—Future Multi-scenario Prediction—Spatial Optimization Strategies.” As shown in Figure 2, this study pivots around critical scientific inquiries, undertaking thorough explorations.
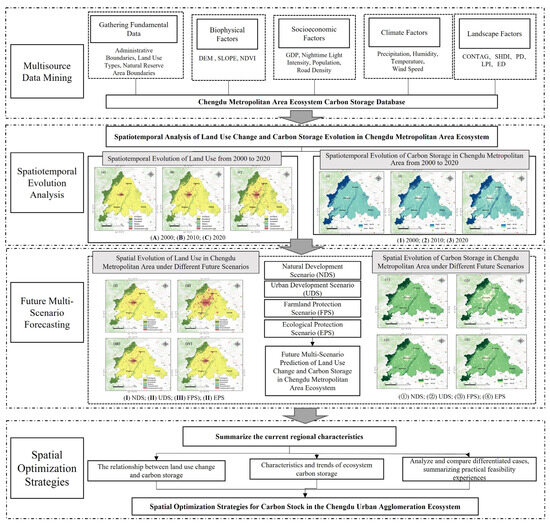
Figure 2.
Decision framework diagram of this study.
Initially, the project engages in multi-source data mining, gathering essential data and extensively collecting variables from various domains such as biophysics, economics, climate, and landscape. Through meticulous preprocessing and amalgamation of these datasets to ensure coherence and applicability, a robust groundwork is established for further investigation. Consequently, the Chengdu Urban Agglomeration Ecosystem Carbon Storage Database is developed, offering dependable data support for comprehensive analysis.
Subsequently, utilizing the InVEST model, the project devises the Chengdu Urban Agglomeration Ecosystem Carbon Storage Model. By examining historical spatiotemporal patterns, this model generates time-series data regarding ecosystem carbon storage, uncovering the dynamics and spatial distribution of carbon storage shifts across different ecosystem types within the Chengdu Urban Agglomeration. This provides invaluable insights for subsequent studies.
For projecting future carbon storage scenarios, the research applies the PLUS model to scrutinize trends and prospective effects of ecosystem carbon storage alterations under diverse scenarios within the Chengdu Urban Agglomeration. It thoroughly assesses the variance and uncertainties among these scenarios, laying a scientific foundation for forthcoming carbon storage management and strategic planning.
In the final phase, by integrating scenario projections with current land use policies, the project evaluates the existing and prospective capacities for ecosystem carbon storage in the Chengdu Urban Agglomeration. Leveraging these assessments, a suite of optimization strategies for enhancing ecosystem carbon storage is suggested, encompassing land use modifications, ecological rejuvenation, and scientific governance practices. These strategies are designed to augment the carbon sequestration potential and carbon reserves of ecosystems, providing targeted and pragmatic recommendations for the sustainable progress and carbon-neutral transition of the Chengdu Urban Agglomeration.
3.2. Data Sources
This article references significant works on land use simulation [18,23]. It emphasizes the precision and applicability of the PLUS model while considering the study area’s characteristics, data availability, importance, and currency. The article identifies 10 critical drivers of land use changes from both natural and anthropogenic perspectives. Comprehensive land use simulation studies were undertaken, with detailed information presented in Table 1. All utilized data conform to the PLUS model’s input specifications, with land use information establishing the basis for normalizing coordinate systems and resolutions to guarantee uniformity in row and column configurations.

Table 1.
Data information.
4. Methods
4.1. Land Use Change Dynamics
Land use dynamics encapsulate the magnitude of alterations within the same land use category over a designated timeframe [28]. This concept delineates the quantitative and qualitative shifts in land use, including variations in size, types, and scope of land employed during a defined interval [29]. By analyzing transitions in land use categories across a certain period, we can characterize the variations in the spatial extent of distinct land categories within a specified locale. The formula is as follows:
where L represents the dynamic degree of change for a certain land use type in the region, Ma and Mb represent the area of a specific land use type at the beginning and end of the study, and F represents the study period.
4.2. Carbon Storage Calculation Based on the InVEST Model
Employing the Carbon module of the InVEST model, in conjunction with land use and land cover maps and the carbon reserves of four carbon pools, we performed carbon stock assessments for the present scenario or a designated timeframe [5,10]. To enhance the precision of our calculations, we omitted land categories that are both relatively rare and quickly regenerative, like grassland and short-cycle crops, from the aboveground carbon pool, tailoring this exclusion to particular land use and land cover classifications [30]. The calculation formula is as follows:
where i represents the i-th type of land use; Ci_tot refers to the total carbon pool under different land use practices in a specific region; Ci_above represents the aboveground biomass, including the carbon pool of all vegetation material (such as bark, trunk, branches, leaves) surviving in the soil; and Ci_below refers to the biomass carbon pool in the soil, specifically the carbon pool of the active roots present in the soil. Ci_soil represents the carbon pool in the soil, generally referring to the carbon pool obtained from non-mineral soils rather than from organic-rich soils. Ci_dead refers to the carbon pool of withered, fallen, and dead organic matter.
The InVEST model operates under core assumptions regarding carbon reservoirs, treating the carbon density of each land cover type as a fixed value. This approach entails calculating the carbon stock of vegetation in a specific area by multiplying the carbon density values of various vegetation types by their respective surface areas [10,31]. Nevertheless, research has highlighted considerable fluctuations in carbon density across different locales. Therefore, our study concentrates on the central and western regions of China, particularly Sichuan Province and the Chengdu metropolitan area. We have synthesized findings from prior studies to more accurately represent carbon density fluctuations within this area [5,32]. Building on this, through conducting surveys in neighboring regions and a thorough examination of regional traits, we have modified the model to ascertain differentiated carbon concentration values for varied land uses within the Chengdu metropolitan area, as detailed in Table 2.
Table 2.
Reference values of carbon density by land use in Chengdu metropolitan area/t-m−2.
4.3. Land Use Change Prediction Based on the PLUS Model
4.3.1. Land Expansion Analysis Strategy
The Land Expansion Analysis Strategy (LEAS) employed in this study is a specialized Geographic Information System (GIS) analysis module specifically designed to accurately capture and analyze land use dynamics in time-series data [33]. The primary utility of the LEAS module stems from its adeptness in identifying significant areas of land expansion through land use data at two distinct time intervals, allowing for detailed sample-based evaluations of these areas [34]. Moreover, this approach integrates the Random Forest algorithm—a robust machine learning method—to examine and pinpoint patterns of probability in diverse land development scenarios [18]. This integration facilitates not only the forecasting of land use types but also the measurement of the influence rates of various potential driving factors, including economic growth, demographic trends, and policy shifts, in the land expansion process. The specific formula for the Random Forest classification algorithm is as follows:
where d takes values of 0 or 1, where 1 indicates a conversion from other land classes to land class k, and 0 indicates any land use conversion that does not involve land class k. is the indicator function of the decision tree; is the predicted type of the nth decision tree; is the probability of land use type k growing in spatial unit i.
4.3.2. Cellular Automaton Model Based on Multi-Class Stochastic Patch Seeds
Employing the Cellular Automaton Model with Multi-type Random Patch Seeds (CARS), this model simulates the generation of land use patches by considering the constraints of the probabilities of different land use developments [35]. CARS leverages a blend of random seed generation and a threshold decay mechanism to incorporate adaptive coefficients. These coefficients play a crucial role in modulating local land use competition, facilitating adjustments in land use quantity to align with anticipated future land use requirements [36]. This module consists of two main parts:
- (1)
- Macro Demand and Local Competition Feedback Mechanism. This feedback mechanism primarily achieves the generation of multi-type random patch seeds, thereby simulating the calculation of the overall probability for land use type k [37]. The formula is as follows:where is the comprehensive probability of spatial unit i transitioning to land type k at time t; is the suitability probability for land unit i to develop into k; represents the impact of future demand on land type k; and represents the neighborhood effect of unit i, which is the coverage ratio of land use components of type k in the next neighborhood. The neighborhood weight parameter is determined based on the proportion of the expansion area of land use types and is dimensionless.
- (2)
- Multi-type Random Patch Seed Threshold Decrease. The PLUS model evolves patches of multiple land use types by calculating the overall probability process through a threshold-decreasing trend of multi-type random patch seeds [18,38]. When the neighborhood effect of land use type k is equal to 0, the overall probability is given bywhere r is a random value ranging from 0 to 1, and is the threshold for the newly generated land use type k patch. Seeds generated in the PLUS model can grow into new land use type grid cells and gradually form new patch groups. In the process of land use type competition, the PLUS model uses threshold-decreasing rules to evaluate the land use types determined by the roulette, limiting the spontaneous growth of land types and promoting better results. Based on the LEAS and CARS modules, the PLUS module can determine the optimal land use layout, better simulate the changes in various land use patches, and thus support planning policies for sustainable development more effectively.
4.4. Setting of Multiple Scenarios for Land Use
This study focuses on coordinated urban development and draws from an extensive analysis of historical land use changes within the Chengdu Urban Agglomeration, as well as the most recent national spatial planning initiatives. It constructed four scenarios: the NDS, UDS, FPS, and EPS. These scenarios are designed to forecast land use changes in the Chengdu Urban Agglomeration by 2050. The specific scenario settings are as follows:
- (1)
- NDS: Employing a land use transfer matrix alongside the Markov model for the period 2000–2020, with a projection interval of 30 years, this scenario forecasts the area of each land use category within the research region for the year 2050 under the NDS. Reflecting the ongoing urbanization trend and without imposing limitations on the interchange among various land categories, this scenario establishes a foundation for modeling land use transformations in urban clusters.
- (2)
- UDS: Considering the requirements of urban development, this scenario increases the probability of conversion from farmland and grassland to construction land while taking into account natural laws and the requirements of the “Chengdu Urban Agglomeration Development Plan.” An urban development boundary is designated as a restrictive conversion area.
- (3)
- FPS: Ensuring the source of food security, this scenario protects farmland. Under the premise of maintaining the total planned area of farmland in the Chengdu Urban Agglomeration, the scenario implements policies for farmland occupation and replenishment, achieving the target of supplementary farmland area. The expansion of construction land is regulated in accordance with the overarching plan while also ensuring the increase in water bodies essential for agricultural use.
- (4)
- EPS: Considering the development of the ecological environment, this scenario is based on the growth rate of vegetation in ecological land as specified in the overall plan for land use in the Chengdu Urban Agglomeration. Building upon the EPS, it is possible to reduce the probability of farmland conversion to construction land, lower the probability of forest and grassland conversion to construction land, and moderately slow down the expansion of construction land. Natural reserves within the Chengdu Urban Agglomeration are designated as restricted areas.
The challenge of changing from the current land use to a preferred category is quantified through conversion costs [18]. A matrix value of 0 indicates an impossibility of conversion, while a value of 1 signifies permissible change. Given the examination of four distinct scenarios in this study, four separate conversion cost matrices are required (Table 3).
Table 3.
Transition cost matrix for multiple scenarios.
Simultaneously, to ascertain the model’s precision, land type data from 2010 were employed as the training set to forecast the land type distribution in 2020. During this validation phase, the model exhibited outstanding performance, securing an overall accuracy of 93.3% and a substantial Kappa coefficient of 89.3%. These results signify a high degree of agreement between the model’s land type predictions and the actual land cover, affirming the model’s reliability. The outcomes of the validation process satisfactorily fulfill the research criteria.
5. Results
5.1. Spatial–Temporal Evolution Characteristics of Land Use in Chengdu Urban Agglomeration from 2000 to 2020
From 2000 to 2020, there have been significant changes in land use types in the Chengdu Urban Agglomeration, as shown in Figure 3, reflecting the spatial pattern evolution of land use types in the Chengdu Urban Agglomeration over the past 20 years. Observing the changes in the figure, it can be noted that the transitions between different land use types among various administrative regions have become more pronounced, especially concentrated in the built-up areas, primarily attributed to the spatial expansion of construction land driven by Chengdu’s own urban development.
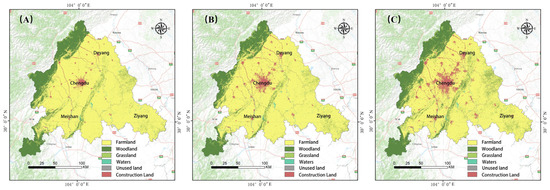
Figure 3.
Spatial–temporal evolution of land use in Chengdu Urban Agglomeration from 2000 to 2020 ((A) 2000; (B) 2010; (C) 2020).
Specifically, as early as 2017, Chengdu City, in formulating the overall plan for the national central city, made the decision to eliminate the “ring” restrictions. It expanded the core area to include 11 administrative districts of the original first and second rings, along with the High-tech Zone and Tianfu New Area, forming a spatial structure of “central urban area + suburban new towns”. This decision propelled the continual outward expansion of the boundary of the central region, especially with the expansion of the High-tech Industrial Development Zone in the south and the continuous expansion of rail transit.
In contrast, in the northwest part of the study area, focusing on Longmen Mountain and Qionglai Mountain, emphasis was placed on the restoration of giant panda habitats and the construction of ecological corridors. Therefore, over the past 20 years, this region has relatively maintained stable land use types of forests and grasslands. This indicates that in the overall development and construction of the Chengdu Urban Agglomeration, different regions have been influenced by diverse planning and policies, resulting in varied characteristics of land use changes.
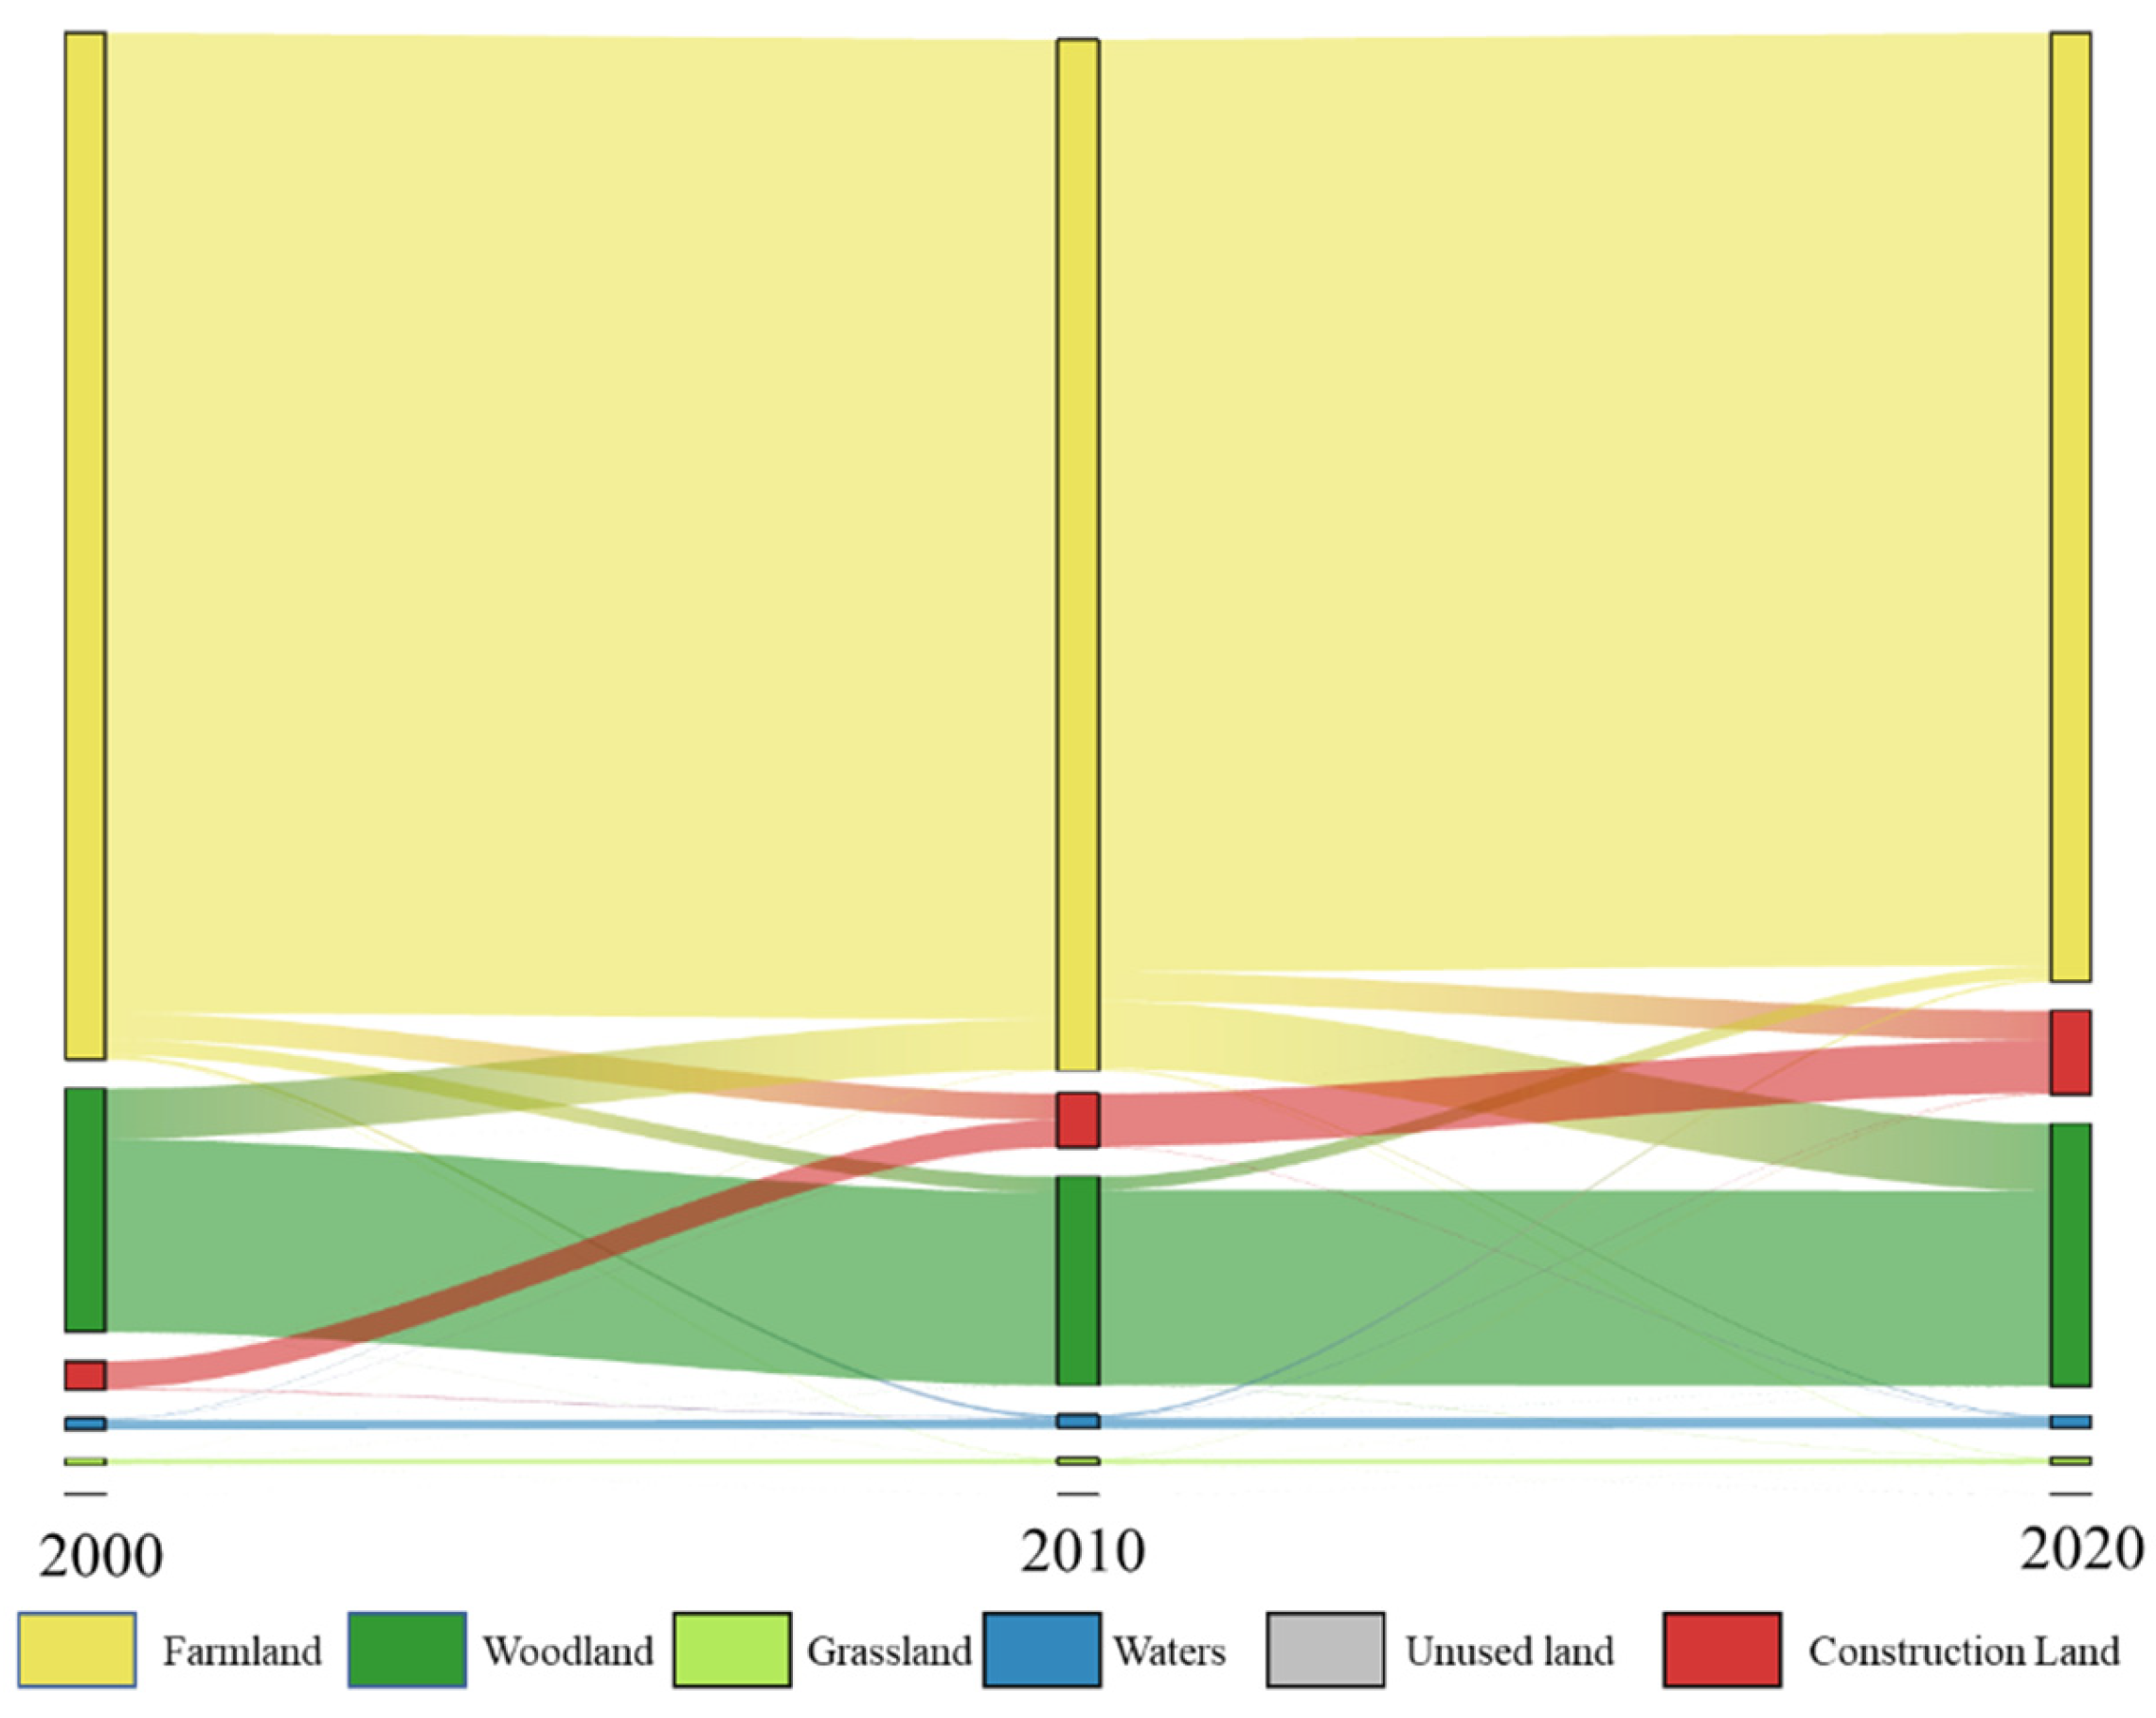
As shown in Table 4 and Figure 4, it reflects the quantity changes of various land use types in the Chengdu Urban Agglomeration over the past 20 years. Generally, in the last two decades, the total area of arable land has decreased, while forests, grasslands, water bodies, and unused land have remained relatively stable, and the built-up area has shown a continuously increasing trend.
Table 4.
Changes in land use types in Chengdu Urban Agglomeration from 2000 to 2020.

Figure 4.
Sankey diagram of land use evolution in Chengdu Urban Agglomeration from 2000 to 2020.
Specifically, in the years 2000, 2010, and 2020, the land use in the study area was primarily dominated by forests and arable land, with proportions of 78.01%, 78.39%, and 72.11%, respectively. This exhibited a trend of increase followed by a decrease, with an overall land change rate of −0.38%. Forests played a secondary dominant role during this period, accounting for 18.52%, 15.89%, and 19.98%, respectively, showing a trend of decrease followed by an increase, with an overall land change rate of 0.39%. The proportion of grassland area was 0.51%, 0.54%, and 0.58%, respectively, indicating a continuous growth trend. The proportion of water bodies was 0.80%, 1.07%, and 0.97%, respectively, showing an increase followed by a decrease. Meanwhile, the built-up area continued to increase, accounting for 2.14%, 4.08%, and 6.33%, respectively, with an overall land change rate of 9.79%. The area of unused land is relatively small, and its proportion has maintained a relatively stable level.
5.2. Spatial–Temporal Evolution Characteristics of Carbon Storage in Chengdu Urban Agglomeration from 2000 to 2020
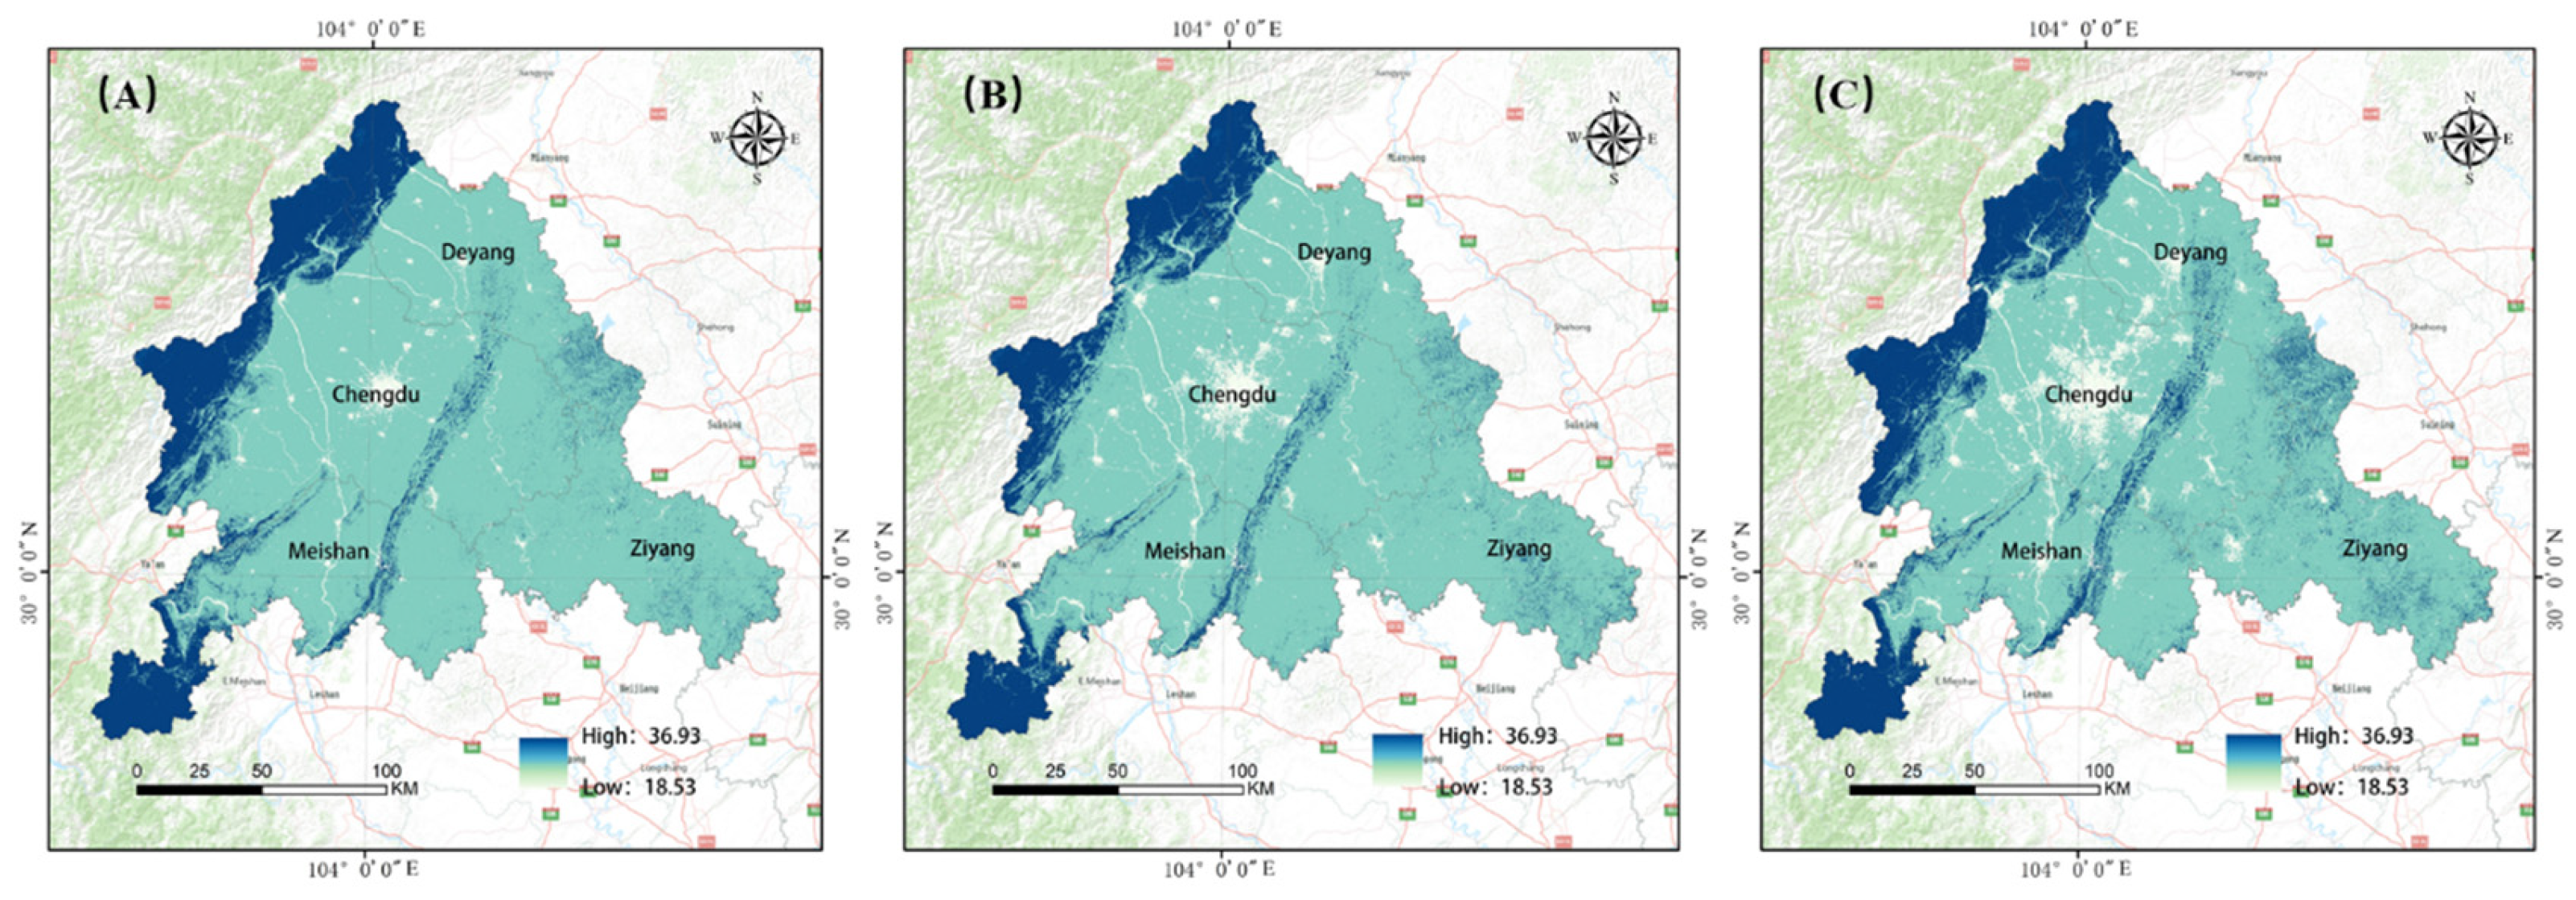
The impact of land use changes on the carbon storage of terrestrial ecosystems primarily depends on the carbon pools in soil and vegetation. Therefore, the transformation of different land use types and carbon density parameters directly influences regional carbon storage. As shown in Figure 5, the carbon sink areas in the Chengdu Urban Agglomeration are mainly distributed in the northwest, covering the Minshan region and the Qionglai Mountain region. These areas are crucial for protecting endangered wildlife, such as giant pandas, Sichuan golden monkeys, takins, and the endangered Lady Amherst’s pheasant, along with their habitats. In contrast, the carbon source areas are mainly located around the central urban area of Chengdu, encompassing the surrounding small and medium-sized cities and towns.
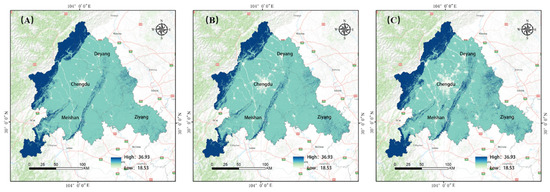
Figure 5.
Spatial–temporal evolution of carbon storage in Chengdu Urban Agglomeration from 2000 to 2020 ((A) 2000; (B) 2010; (C) 2020).
Combining the analysis of the continuous transition of land use types from “forest (grassland) → built-up area” in the Chengdu Urban Agglomeration, it can be concluded that urbanization has significantly contributed to the substantial reduction in carbon storage in this region. This emphasizes once again the disruptive role of human activities in regional carbon cycling. Urbanization not only leads to a decrease in ecosystem carbon storage but also may have profound effects on the ecological balance and habitats of wildlife in the region. Therefore, the rational management of carbon storage and the scientific formulation of land use planning are crucial to achieving sustainable coexistence between human activities and ecosystems.
Table 5 presents the quantity changes of carbon storage in the Chengdu Urban Agglomeration over the past 20 years, including the average, standard deviation, total value, and unit area values of carbon storage for each city and the entire region. The results from the InVEST model show that the area required for each ton of carbon storage evolved from 40.0670 t/m2 in 2000 to 40.9430 t/m2 in 2010 and then decreased to 39.6578 t/m2 in 2020, indicating a trend of initial increase followed by a decrease.
Table 5.
Carbon storage changes in Chengdu Urban Agglomeration from 2000 to 2020 based on administrative division standards.
However, there are variations in carbon storage among different cities. Specifically, the total carbon storage value in Chengdu City initially decreased and then increased. Although the total value is relatively high, the carbon storage per unit area consistently remains below the average. In contrast, Ziyang City has a smaller total carbon storage value, but its carbon storage per unit area is the highest, with the smallest standard deviation, indicating relatively small internal differences in carbon storage within Ziyang City. This highlights significant spatial variations in carbon storage among different cities in the Chengdu Urban Agglomeration, providing important guidance for regional carbon management and ecological conservation.
5.3. Spatial Evolution Characteristics of Future Land Use under Different Scenarios
According to Figure 6 and considering the actual situation of the Chengdu Urban Agglomeration, this study incorporated the driving factors of urban development and introduced constraints such as basic farmland and ecological protection areas in the simulation of land use changes. Four different scenarios for land use changes in the Chengdu Urban Agglomeration were established.
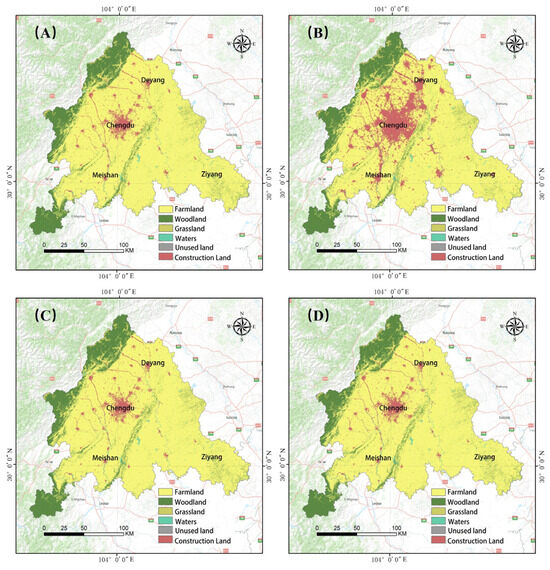
Figure 6.
Future spatial evolution of land use in Chengdu Urban Agglomeration under different scenarios ((A) NDS; (B) UDS; (C) FPS; (D) EPS).
From a spatial perspective, under the scenarios of natural development, farmland protection, and ecological protection, the distribution patterns of land classes in the Chengdu Urban Agglomeration are similar. Agricultural land occupies a large area, and construction land is mainly concentrated in the central–western region of the Chengdu Urban Agglomeration, with some scattered construction land. Forest land is mainly distributed in the western part of the research area, with variations in the specific expansion rates and the conversion of land use types.
Table 6 and Figure 7 present data on land use changes in the Chengdu Urban Agglomeration under various potential development scenarios, providing crucial data for this study. Firstly, the NDS indicates a relatively moderate trend of change. This scenario assumes no active policy intervention, and land use changes primarily follow natural trends and existing patterns. In this case, changes in farmland, forest land, grassland, and water areas are relatively small, indicating the stability of land use conditions. The expansion of urban construction land is also limited, revealing a slow pace of urbanization. For example, in Chengdu City, changes in farmland, forest land, grassland, water areas, and unused land are 10,676.93 square kilometers, 2452.39 square kilometers, 98.01 square kilometers, 115.64 square kilometers, and 6.58 square kilometers, respectively, while the growth of construction land is 986.66 square kilometers. These data suggest that under the NDS, without significant policy intervention, land use changes are relatively mild, and urban expansion is slow.
Table 6.
Changes in land use types in Chengdu Urban Agglomeration under different scenarios.
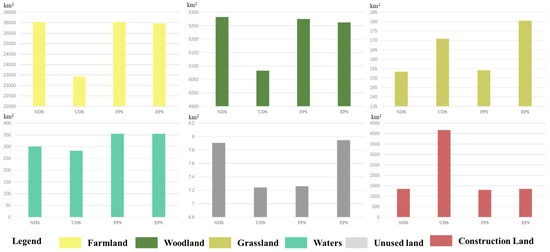
Figure 7.
Overall changes in land use types in Chengdu Urban Agglomeration under different scenarios.
Secondly, under the UDS, land use changes are particularly prominent. In this scenario, land use changes are mainly driven by the processes of urbanization and industrial and commercial development. Significant increases in construction land use, often at the expense of farmland and some forest land, characterize this scenario. This highlights the urgent demand for land resources by urban expansion and industrial development under the prioritized strategy of urban development, potentially posing threats to agricultural land and natural ecosystems. For example, in Chengdu City, construction land increases to 2855.23 square kilometers, while farmland decreases to 8865.42 square kilometers. This reflects a more significant impact of urban expansion on farmland and other natural resources driven by urbanization and industrial development.
In the FPS, the policy’s emphasis is on preserving farmland. In this scenario, the change in farmland is relatively small, reflecting a special emphasis on and protection of agricultural land. At the same time, the growth of construction land is constrained, implying that under this scenario, the pace of urban development and industrial expansion will be restrained to reduce the impact on farmland. For example, in Chengdu City, the quantity of farmland remains almost unchanged (10,676.83 square kilometers), while the growth of construction land is restricted (only 959.31 square kilometers). This reveals that in this scenario, the protection of agricultural land becomes a primary policy goal, and urban expansion is moderately controlled.
Lastly, the EPS particularly emphasizes the conservation of natural ecosystems. In this scenario, ecological lands such as farmland, forest land, grassland, and water areas receive more thoughtful protection. The increase in construction land is effectively controlled, demonstrating a high regard for environmental protection and sustainable development. Taking Chengdu City as an example, the areas of farmland, forest land, grassland, and water areas are 10,646.53 square kilometers, 2449.98 square kilometers, 109.49 square kilometers, and 144.61 square kilometers, respectively, indicating a focused protection on ecological lands. At the same time, the growth of construction land is also controlled within 978.64 square kilometers, highlighting a commitment to environmental protection and sustainable development.
In addition, cities like Deyang, Meishan, and Ziyang show similar patterns of change. For instance, under the UDS, Deyang’s construction land increases to 758.79 square kilometers, while farmland decreases to 4015.45 square kilometers; Meishan’s construction land increases to 414.73 square kilometers under the same scenario. These data further confirm the complex balance between urban development and land use under different development scenarios.
Overall, these four scenarios reflect the interactions and balance between urban development and land use from different perspectives. The UDS tends to support rapid urbanization and industrial expansion, while the farmland protection and EPSs emphasize the protection of agricultural land and natural ecosystems. The NDS depicts a more moderate and balanced development path.
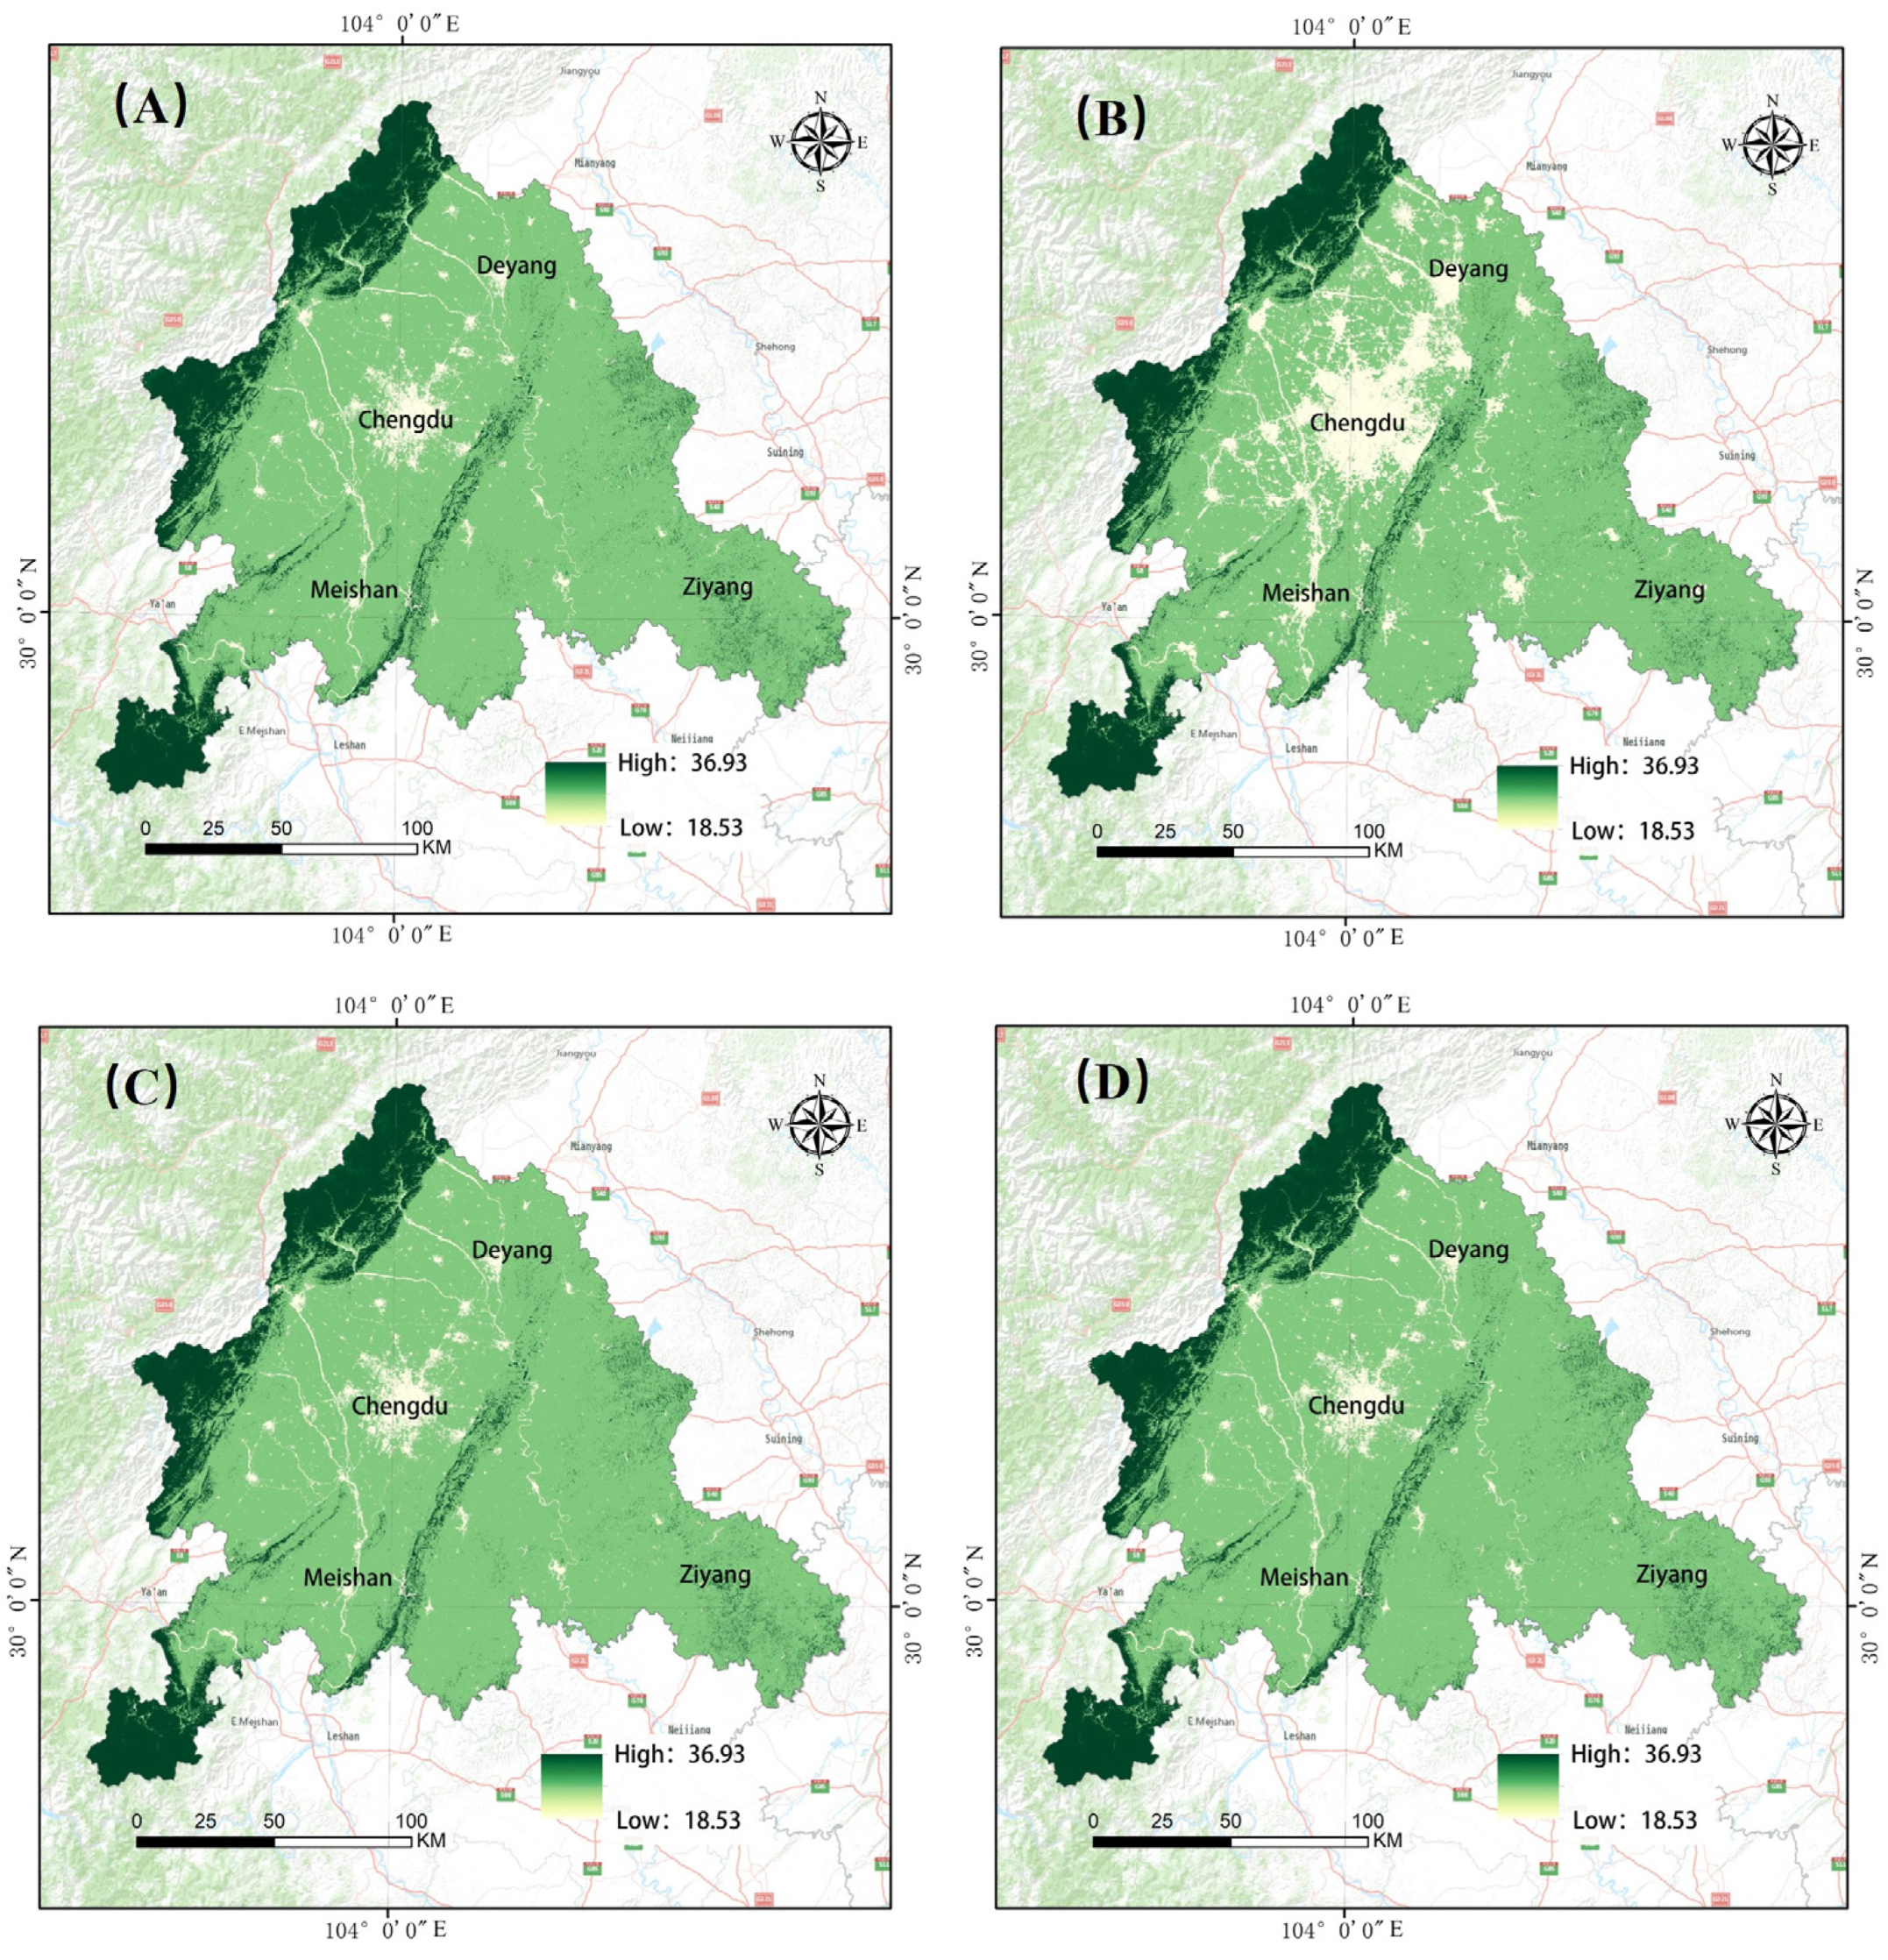
5.4. Future Evolution Characteristics of Carbon Storage under Different Scenarios
Figure 8 presents the characteristics of carbon storage spatial evolution in the future Chengdu Urban Agglomeration under different scenarios. Under the NDS, high-value carbon storage areas are mainly distributed in the western part of the study area, where the forest cover is high, forming regions with relatively high carbon storage. Correspondingly, low-value carbon storage areas are mainly located in the central and western urbanized areas with higher levels of urbanization, dominated by construction land use. This difference reflects the impact of land cover types on the distribution of carbon storage, with forests contributing significantly to carbon storage.
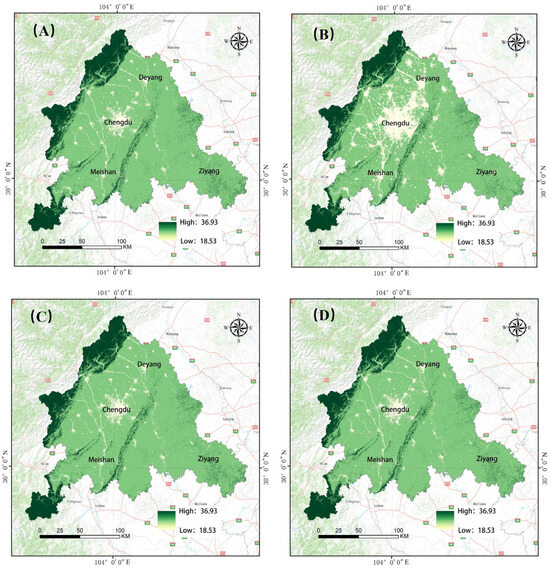
Figure 8.
Spatial evolution of carbon storage in Chengdu Urban Agglomeration under different scenarios ((A) NDS; (B) UDS; (C) FPS; (D) EPS).
In the scenarios of farmland protection and ecological protection, strict control over farmland and ecological land in the study area leads to insignificant changes in the area of construction land. Spatially, the evolution of carbon storage under these two scenarios is similar to that under the NDS. This indicates that in scenarios emphasizing land protection, the spatial distribution of carbon storage remains relatively stable and is not significantly affected by urban expansion.
However, under the UDS, compared to the other three scenarios, carbon storage in the western part of the study area is relatively stable, while carbon storage in the central and western regions shows a significant decrease, especially in urban areas. From an administrative division perspective, the decline in carbon storage is more pronounced in Ziyang City and its surrounding areas. This is mainly due to the demand for construction land in urban areas, leading to the expansion of cities from the center outward and the conversion of other land uses in the surrounding areas into construction land, thereby reducing the carbon storage of the original ecosystems.
Table 7 provides detailed information on carbon storage changes in the Chengdu Urban Agglomeration under different development scenarios, including natural development, urban development, farmland protection, and ecological protection. For each scenario, the data include the average carbon storage, standard deviation, total carbon storage, and carbon storage per unit area for the four administrative regions: Chengdu, Deyang, Meishan, and Ziyang.
Table 7.
Carbon storage changes in Chengdu Urban Agglomeration under different scenarios based on administrative division standards.
Firstly, under the NDS, Meishan shows the highest carbon storage, while Ziyang has the lowest. This difference may reflect the varying natural conditions and geographic features of each city. Chengdu’s average carbon storage is 22.1899 tons, with a total carbon storage of 353,360,498.7690 tons. The combined average carbon storage for the four cities is 21.8669 tons, with a total carbon storage of approximately 810 million tons. The carbon storage per unit area is relatively high in these four cities, with Meishan having the highest at 25,486.7488 tons/km2.
Secondly, under the UDS, carbon storage in all cities slightly decreases, possibly due to the reduction in tree cover and changes in land use during the urbanization process. Chengdu’s average carbon storage slightly decreases to 22.0498 tons, and total carbon storage also slightly decreases. Similar trends are observed in Deyang, Meishan, and Ziyang. Overall, under the UDS, the total carbon storage in the four cities slightly decreases, and the carbon storage per unit area also shows a slight decrease.
Under the FPS, the data are similar to the NDS, indicating that farmland protection measures positively contribute to maintaining carbon storage levels. Chengdu’s average carbon storage is nearly the same as that of the NDS, at 22.1884 tons. Deyang, Meishan, and Ziyang show similar trends, suggesting that farmland protection measures may have a positive effect on maintaining carbon storage levels.
Lastly, under the EPS, the average carbon storage and total carbon storage in all cities slightly decrease but remain at relatively high levels. This indicates that ecological protection measures have some impact on carbon storage, although the effect is relatively small. In the EPS, Chengdu, Deyang, Meishan, and Ziyang all experience a reduction in carbon storage, but the magnitude of the decrease is relatively small. This may suggest that despite the implementation of ecological protection measures, urban development, and human activities still have some degree of impact on carbon storage.
In summary, these four scenarios illustrate the changes in carbon storage in the Chengdu Urban Agglomeration under different development and protection policies. Under the NDS, carbon storage is relatively high, reflecting the positive role of natural conditions in carbon storage. The decrease in the UDS reflects the negative impact of urbanization on carbon storage. Farmland protection and EPSs show that protective measures can effectively maintain or slightly reduce carbon storage, with the extent of maintenance depending on specific protection policies and their implementation. Through the comparison of these data, we can gain a deeper understanding of the potential impact of different policies on regional carbon storage capacity.
6. Discussion
6.1. Response Relationship between Land Use Change and Carbon Storage
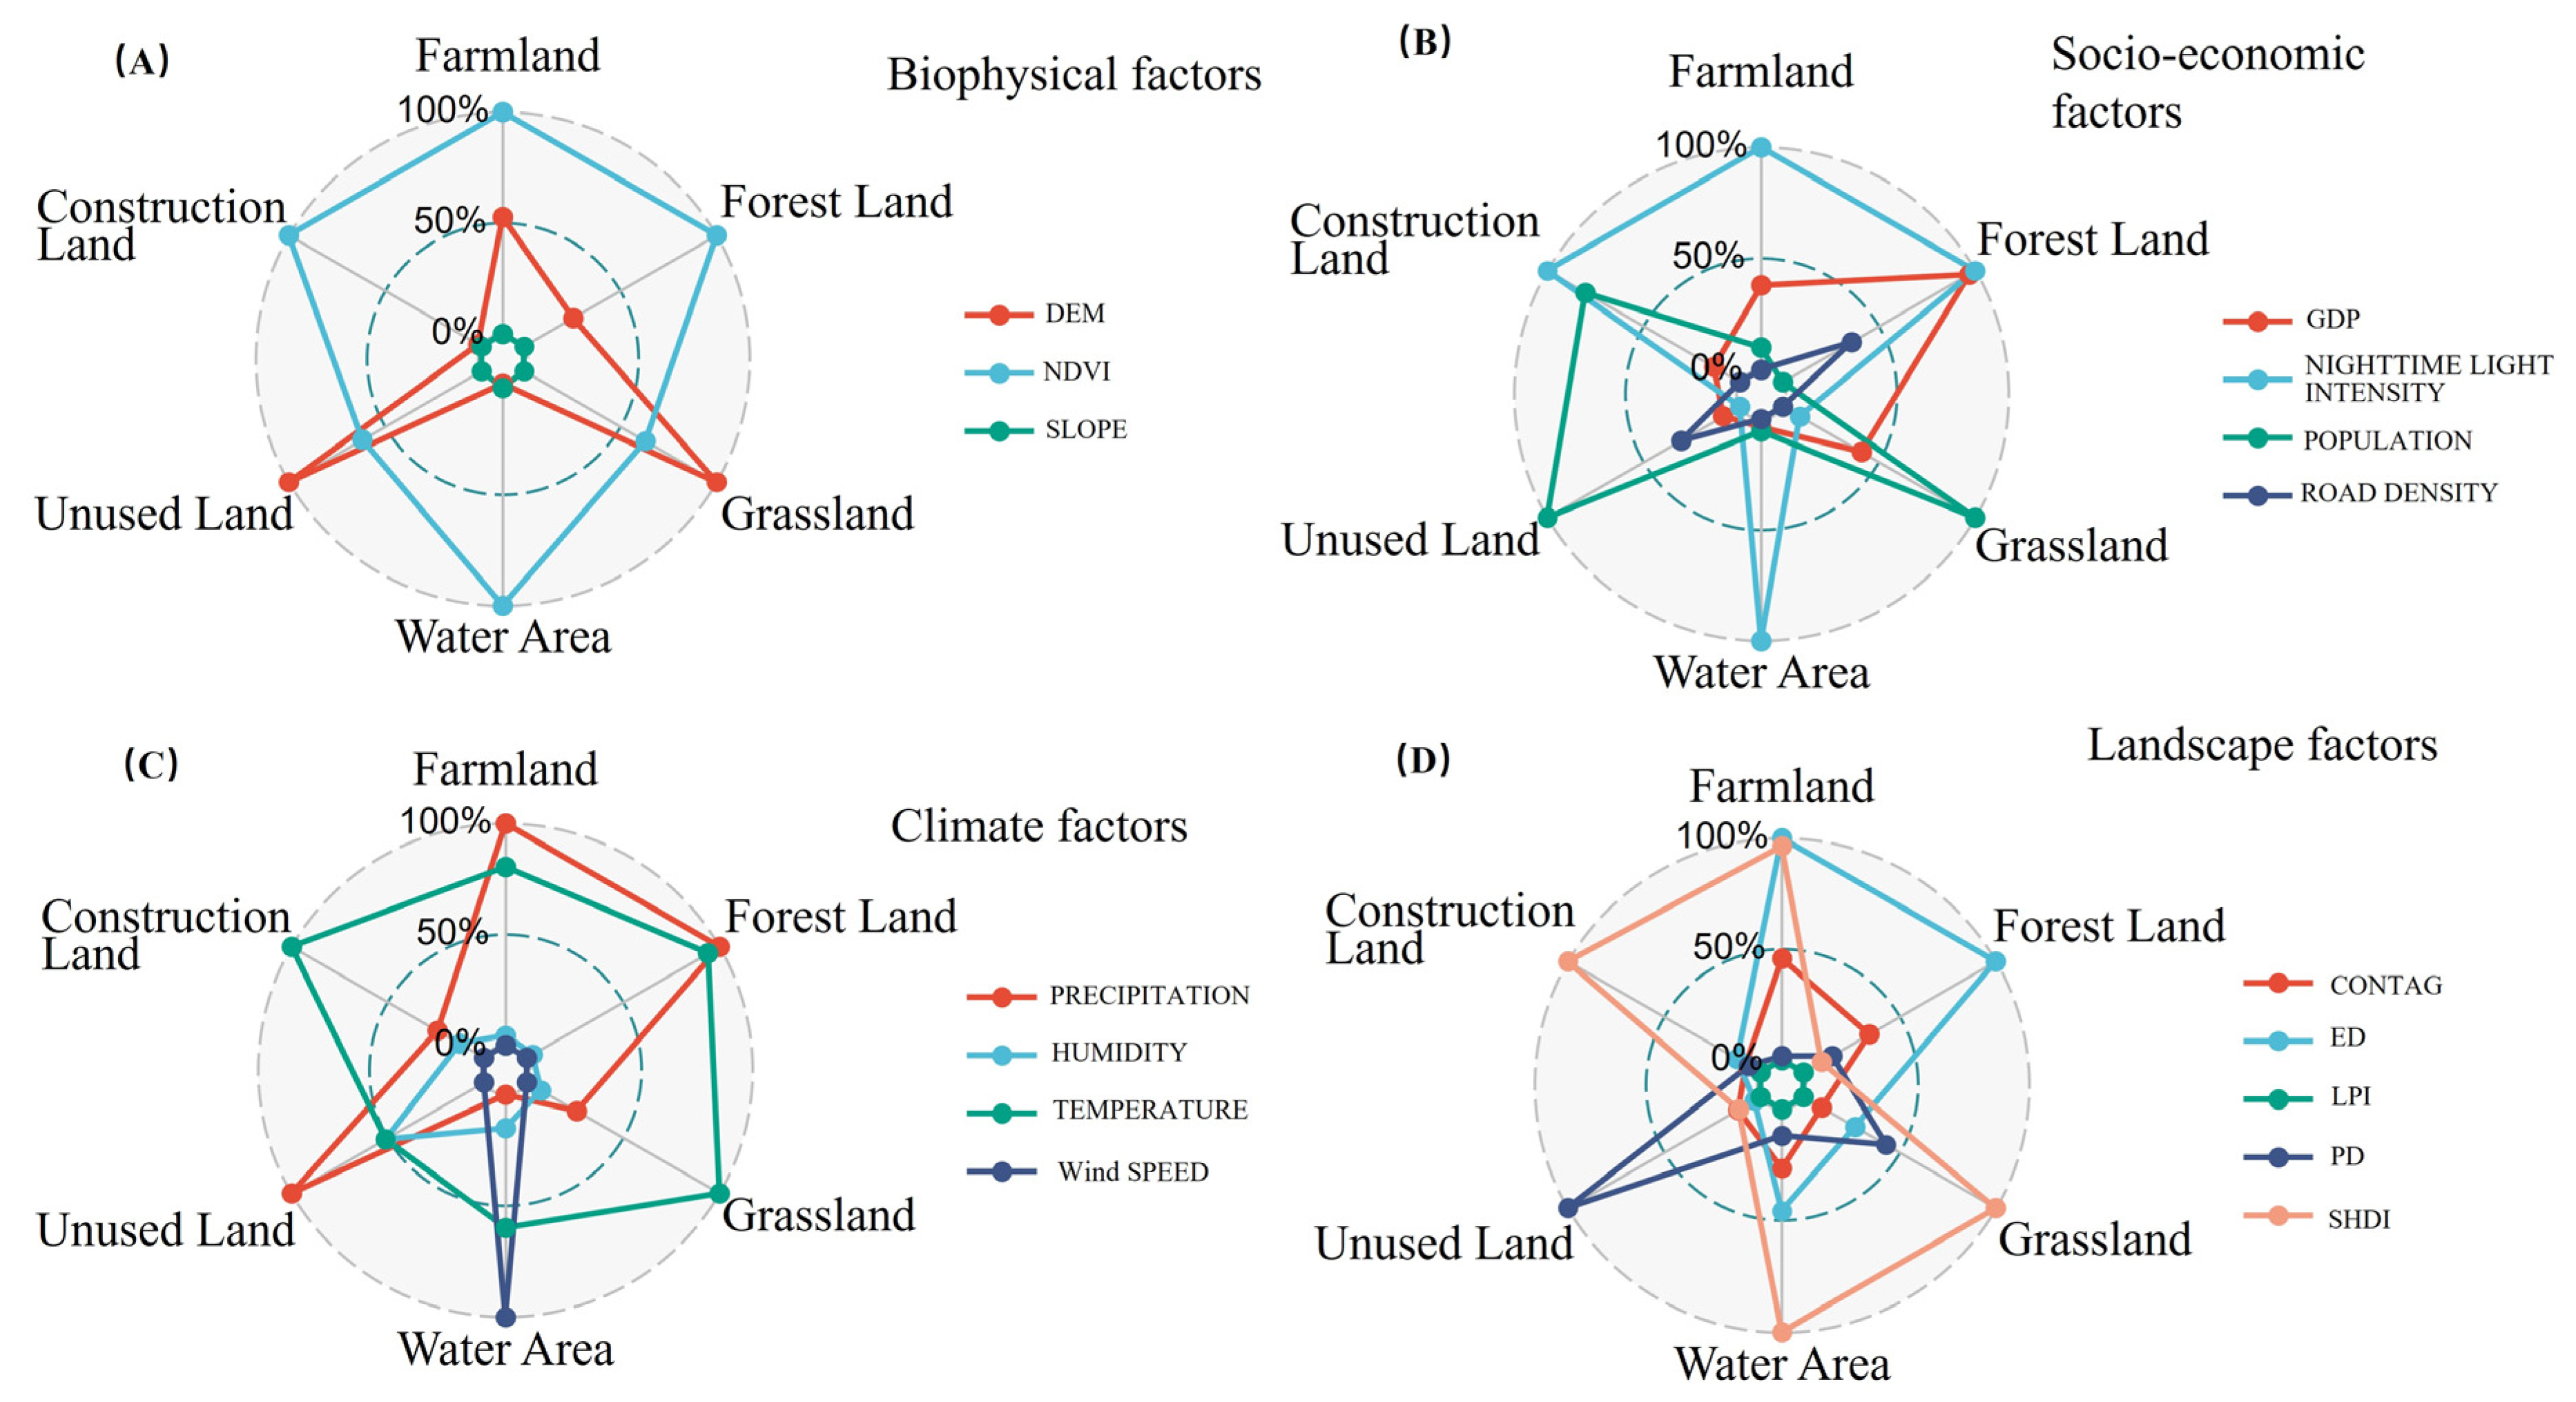
This study elucidates the reaction patterns of different land use types to a variety of factors, including biophysical, socio-economic, climate, and landscape factors, as shown in Figure 9. The diverse nature of these factors results in varied response effects across land use types. Specifically, biophysical factors such as DEM, NDVI, and slope have distinct impacts: NDVI is crucial for cultivated, built-up, forest land, and water bodies, while DEM significantly influences grassland and unused land. The effect of slope is comparatively minor, indicating that plant and animal communities have varying contributions to carbon cycling [39]. Biodiversity loss could diminish the ecosystem’s carbon storage capacity [40] as different species collectively engage in organic matter decomposition and carbon sequestration.
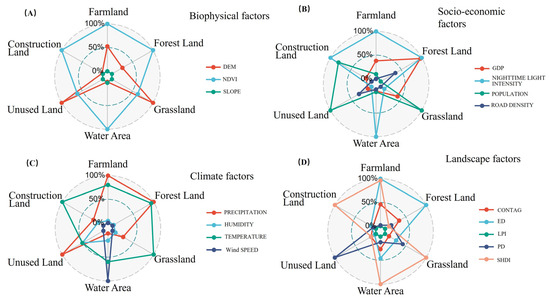
Figure 9.
Contributions of driving factors affecting land use types in Chengdu Urban Agglomeration ((A) biophysical factors; (B) socio-economic factors; (C) climate factors; (D) landscape factors).
Socio-economic factors consist of GDP, nighttime light intensity, population, and road density. Specifically, nighttime light intensity significantly influences cultivated land, built-up land, forest land, and water bodies. Population has a notable impact on built-up land, grassland, and unused land, while GDP significantly affects forest land, and road density has a certain influence on forest land and unused land, with a relatively minor impact on other land types. Due to human activities, including urban expansion, agricultural practices, and industrial development [41], there are direct and indirect effects on the carbon storage of the Chengdu Urban Agglomeration. Urban expansion leads to land use changes, agricultural practices affect the soil carbon content of cultivated land, and industrial activities may release carbon into the atmosphere [2,29].
Climate factors, including precipitation, humidity, temperature, and wind speed, also play significant roles. Precipitation affects cultivated, forest, and unused land; temperature impacts built-up land, cultivated land, forest land, and grassland; humidity influences unused land; and wind speed affects water bodies, with humidity and wind speed having minor overall effects [42]. Climate change could alter vegetation growth and ecosystem carbon storage, with drought and rising temperatures potentially reducing carbon fixation [43].
Landscape factors encompass CONTAG, ED, LPI, PD, and SHDI index. Among these, the SHDI index significantly influences cultivated land, built-up land, grassland, and water bodies. ED has a notable impact on cultivated land and forest land, while PD significantly affects unused land. CONTAG has a certain influence on cultivated land, forest land, and water bodies. Generally, the impact of LPI is relatively small. Therefore, SHDI comprehensively considers different habitat types within the ecosystem and their distribution patterns [44]. Higher diversity may correspond to increased biodiversity and a more complex ecosystem, contributing to the enhancement of carbon storage [45].
In summary, the land use changes within the Chengdu metropolitan area have a significant correlation with carbon storage responses. With the accelerated pace of urbanization, there has been a continuous increase in the area of land used for construction, while the areas of farmland, forestland, and other natural ecological lands have decreased. This transformation in land use types directly impacts the carbon storage capacity of ecosystems. Constructed lands typically replace original vegetation cover, leading to a reduction in carbon storage, a fact that is widely accepted [46]. However, our study delves deeper into the subtle effects of urban expansion on carbon storage within the specific context of the Chengdu urban cluster. Our findings resonate with those of Wang et al., who reported that urban expansion in China significantly reduces carbon storage capacity [47]. Similarly, our research indicates that due to changes in land use, there was a net decrease of 8.2% in ecosystem carbon storage over 20 years, closely aligning with trends observed by Cai et al. in their study on urban clusters in the Yangtze River Delta region [48]. Yet, our study advances this discussion by employing the coupled InVEST-PLUS model analysis, providing a more nuanced perspective on the spatiotemporal dynamics of carbon storage in response to different land use scenarios. For example, while L. Sallustio et al. explored the impact of urban development on carbon storage [49], our study uniquely quantifies potential mitigation measures under ecological protection scenarios, indicating a 3% reduction in carbon storage loss by 2050. This specific insight underscores the importance of strategic land use planning and policy interventions in protecting ecosystem services under urban growth pressures. Integrating these comparative analyses, our study draws upon and contributes to the broader discourse on the environmental impacts of urbanization. Works by Li et al. and Yang et al. similarly highlight the critical role of sustainable land use strategies in reducing carbon storage loss [50,51]. Our research supports these findings and offers new empirical data for the Chengdu urban cluster, thus enriching the global dialogue on urban ecology and land management practices.
6.2. Characteristics and Trends of Carbon Storage in the Chengdu Urban Agglomeration Ecosystem
As a critical metric for assessing the level of ecosystem services, carbon storage reflects, to some extent, the health of ecosystems in specific regions [52]. The past two decades have seen a reduction in carbon storage by 8.2% due to urban expansion and changes in land use, highlighting the ecological costs of rapid urbanization. Particularly in the early stages of urbanization, where economic development was overly emphasized without the necessary land use restrictions, the Chengdu metropolitan area experienced a significant increase in the area designated for construction purposes. This expansion encroached upon forestlands, grasslands, and farmlands, leading to a notable decrease in regional carbon storage.
The carbon storage within the Chengdu metropolitan area demonstrates not only significant temporal and spatial changes but also notable internal variations across different regions. Chengdu City, while being the largest contributor to regional carbon storage, has a comparatively low contribution per unit area, in contrast to the lower overall carbon storage observed in Ziyang City. The discrepancies in economic development among cities reveal a conflict between the value of ecosystem services provided and their aggregate contribution to socio-economic factors. Particularly, with Chengdu positioned as the central city, it is expected to exert a radiating and guiding influence. Nevertheless, during the early stages of rapid urban expansion and economic advancement, a narrow focus on the expansion of built-up areas resulted in a progressive reduction in carbon storage efficiency within the region. Thus, it is crucial to achieve a dynamic equilibrium between economic development and the ecosystem’s carrying capacity.
Therefore, future development scenarios for the Chengdu metropolitan area indicate varied impacts on carbon storage. The NDS is expected to further reduce carbon storage by 5%, while the EPS holds the potential to decrease losses by 3%. In the NDS, high-value carbon storage areas are mainly distributed in the western part of the study area, where the forest cover is high, indicating a positive impact of natural conditions on carbon storage. Conversely, in the UDS, especially in areas with high levels of urbanization in the central and western regions, carbon storage significantly decreases. Urban expansion leads to a reduction in vegetation cover, and the increase in built-up land negatively impacts carbon storage. In the scenario of cultivated land protection, carbon storage is relatively evenly distributed, with a focus on protecting agricultural land, resulting in minimal changes in carbon storage. In the scenario of ecological protection, carbon storage is relatively high, especially in ecological land areas. Ecological protection policies have a positive impact on carbon storage, slowing down the declining trend [4]. Therefore, this study underscores the effectiveness of informed policy interventions and strategic land use planning in safeguarding ecosystem services, particularly in terms of carbon storage.
6.3. Suggestions for Future Land Spatial Planning
An in-depth analysis of the characteristic trends of carbon storage in the Chengdu metropolitan area’s ecosystem reveals consistency with the evolution trends of land use types. In the early stages of rapid urbanization, uncontrolled expansion of urban built-up land leads to a decrease in the contribution capacity and storage efficiency of carbon storage. This trend may give rise to a series of issues, such as the urban heat island effect, urban hollowing, and regional ecological environmental problems [2,52]. To address this trend, the following strategies and recommendations for territorial spatial planning are proposed:
- (1)
- Optimize the spatial layout of land use to enhance carbon sequestration ecosystem services. At the macro level, it is crucial to refine the overall land use framework by strictly managing the “three zones and three lines” and curbing the expansion rate of built-up areas. For existing land, adjustments to inefficient industrial lands and the enhancement of historical and cultural blocks with new functions are advised to elevate efficiency. Regarding new land, the focus should be on augmenting the ecological value of lands like forests and grasslands, thereby increasing the total carbon storage in the Chengdu–Chongqing region. At the micro level, strategies include converting farmland back to forests or grasslands, conserving biodiversity, and fostering active spatial development and carbon cycling within the Chengdu metropolitan area.
- (2)
- Implement an ecological carbon sequestration compensation mechanism to promote regional coordinated coupling relationships. It is vital to acknowledge the developmental disparities among different regions, utilizing Chengdu’s central urban area’s developmental edge to harmonize and address diverse needs, shifting toward a new development paradigm. Promoting the growth of surrounding small and medium-sized towns, solidifying the ecological green base, and pioneering a green development route are also essential. Recommendations include fostering green and low-carbon industries, enhancing land spatial management and protection, and concentrating on ecological restoration efforts in areas like Longmenshan and Qionglai Mountain, alongside ecological corridor construction. Achieving these objectives necessitates overcoming entrenched interests and administrative hurdles, establishing a cost and benefit-sharing mechanism based on ecological carbon sequestration, and forming a metropolitan network spatial development model with multiple support points and complementary functions.
- (3)
- Leverage the role of multiple stakeholders in negotiation to construct an ecological security assurance system. On the softer aspects, a market-driven, government-guided multi-stakeholder negotiation system is recommended. This entails creating a significant ecological planning decision-making mechanism that unites diverse entities toward constructing the Chengdu metropolitan area. Concurrently, it is important to bolster source management in Chengdu’s metropolitan area and enhance risk assessments and mechanisms pertinent to the carbon pool of the ecological system. This involves tightening control over the ecological system’s carbon pool, improving its management effectiveness, and fostering a systematic and modern ecological system’s carbon pool security assurance system.
7. Conclusions and Limitations
This study leverages the InVEST-PLUS model to perform an in-depth analysis of the impact of spatiotemporal land use changes on ecosystem carbon storage, effectively mapping the relationship between urban expansion and ecosystem carbon storage and underscoring the critical need for sustainable land use planning. The key findings are the following. (1) Impact of Past Land Use Changes on Carbon Storage: An examination of the last two decades reveals an 8.2% decrease in ecosystem carbon storage in the Chengdu metropolitan area, largely attributed to a 12.3% increase in built-up areas. These data vividly illustrate the direct link between urbanization and the reduction of carbon sinks. (2) Predicted Impact of Future Land Use Scenarios: Scenario analysis indicates that, without intervention, carbon storage could decline by an additional 5% by 2050 under the NDS. In contrast, the EPS may mitigate this loss by 3%, emphasizing the effectiveness of specific conservation policies. (3) Optimization of Land Use Planning Strategies: The findings from our scenario analysis offer actionable insights for crafting policies that could mitigate the negative effects of urbanization on carbon storage. For example, adopting ecological protection measures by 2050 might curtail the carbon storage loss by approximately 1.6 million tons in the Chengdu metropolitan area, suggesting that a strategic pivot toward ecological conservation and sustainable land use practices could markedly influence the metropolitan area’s carbon storage outlook. Additionally, the scenario-based forecasts provide a solid basis for policymakers striving to harmonize urban development with environmental conservation.
However, this study has the following limitations. (1) Limited data resources: This study is restricted by the availability of data, and future research could enhance understanding by including information on ecological protection redlines, permanent basic farmland, and other relevant spatial data. (2) Feasibility of policy implementation: The feasibility of the proposed territorial spatial planning strategies requires policy-level support and implementation, which needs verification through actual implementation. (3) Sensitivity to special events: This study does not deeply explore the sensitivity to certain special events (e.g., natural disasters, economic crises), which could significantly influence carbon storage evolution.
Author Contributions
Y.Z.: Writing—Original Draft and Data Curation. X.L. and D.S.: Data Curation, Software, and Supervision. All authors have read and agreed to the published version of the manuscript.
Funding
This research was supported by the Key Projects of the National Natural Science Foundation of China (Grant No. 42130713).
Data Availability Statement
The original contributions presented in the study are included in the article, and further inquiries can be directed to the corresponding author.
Conflicts of Interest
The authors declare that the research was conducted without commercial or financial relationships that could be construed as a potential conflict of interest.
References
- Wang, Z. Estimating of Terrestrial Carbon Storage and Its Internal Carbon Exchange under Equilibrium State. Ecol. Model. 2019, 401, 94–110. [Google Scholar] [CrossRef]
- Hu, C.; Wang, Z.; Wang, Y.; Sun, D.; Zhang, J. Combining MSPA-MCR Model to Evaluate the Ecological Network in Wuhan, China. Land 2022, 11, 213. [Google Scholar] [CrossRef]
- Chang, X.; Xing, Y.; Wang, J.; Yang, H.; Gong, W. Effects of Land Use and Cover Change (LUCC) on Terrestrial Carbon Stocks in China between 2000 and 2018. Resour. Conserv. Recycl. 2022, 182, 106333. [Google Scholar] [CrossRef]
- Zhang, M.; Huang, X.; Chuai, X.; Yang, H.; Lai, L.; Tan, J. Impact of Land Use Type Conversion on Carbon Storage in Terrestrial Ecosystems of China: A Spatial-Temporal Perspective. Sci. Rep. 2015, 5, 10233. [Google Scholar] [CrossRef] [PubMed]
- Hu, C.; Wang, Z.; Li, J.; Liu, H.; Sun, D. Quantifying the Temporal and Spatial Patterns of Ecosystem Services and Exploring the Spatial Differentiation of Driving Factors: A Case Study of Sichuan Basin, China. Front. Environ. Sci. 2022, 10, 927818. [Google Scholar] [CrossRef]
- Zeng, N.; Jiang, K.; Han, P.; Hausfather, Z.; Cao, J.; Kirk-Davidoff, D.; Ali, S.; Zhou, S. The Chinese Carbon-Neutral Goal: Challenges and Prospects. Adv. Atmos. Sci. 2022, 39, 1229–1238. [Google Scholar] [CrossRef] [PubMed]
- Bachu, S.; Bonijoly, D.; Bradshaw, J.; Burruss, R.; Holloway, S.; Christensen, N.P.; Mathiassen, O.M. CO2 Storage Capacity Estimation: Methodology and Gaps. Int. J. Greenh. Gas Control 2007, 1, 430–443. [Google Scholar] [CrossRef]
- Lu, D.; Chen, Q.; Wang, G.; Liu, L.; Li, G.; Moran, E. A Survey of Remote Sensing-Based Aboveground Biomass Estimation Methods in Forest Ecosystems. Int. J. Digit. Earth 2016, 9, 63–105. [Google Scholar] [CrossRef]
- Wang, J.; Li, Y.; Bork, E.W.; Richter, G.M.; Eum, H.-I.; Chen, C.; Shah, S.H.H.; Mezbahuddin, S. Modelling Spatio-Temporal Patterns of Soil Carbon and Greenhouse Gas Emissions in Grazing Lands: Current Status and Prospects. Sci. Total Environ. 2020, 739, 139092. [Google Scholar] [CrossRef]
- Cong, W.; Sun, X.; Guo, H.; Shan, R. Comparison of the SWAT and InVEST Models to Determine Hydrological Ecosystem Service Spatial Patterns, Priorities and Trade-Offs in a Complex Basin. Ecol. Indic. 2020, 112, 106089. [Google Scholar] [CrossRef]
- Shi, M.; Wu, H.; Fan, X.; Jia, H.; Dong, T.; He, P.; Baqa, M.F.; Jiang, P. Trade-Offs and Synergies of Multiple Ecosystem Services for Different Land Use Scenarios in the Yili River Valley, China. Sustainability 2021, 13, 1577. [Google Scholar] [CrossRef]
- Roces-Diaz, J.V.; Vayreda, J.; Banque-Casanovas, M.; Díaz-Varela, E.; Bonet, J.A.; Brotons, L.; de-Miguel, S.; Herrando, S.; Martinez-Vilalta, J. The Spatial Level of Analysis Affects the Patterns of Forest Ecosystem Services Supply and Their Relationships. Sci. Total Environ. 2018, 626, 1270–1283. [Google Scholar] [CrossRef] [PubMed]
- Li, Z.; Xia, J.; Deng, X.; Yan, H. Multilevel Modelling of Impacts of Human and Natural Factors on Ecosystem Services Change in an Oasis, Northwest China. Resour. Conserv. Recycl. 2021, 169, 105474. [Google Scholar] [CrossRef]
- Lam, S.T.; Conway, T.M. Ecosystem Services in Urban Land Use Planning Policies: A Case Study of Ontario Municipalities. Land Use Policy 2018, 77, 641–651. [Google Scholar] [CrossRef]
- Chen, W.; Chi, G.; Li, J. The Spatial Association of Ecosystem Services with Land Use and Land Cover Change at the County Level in China, 1995–2015. Sci. Total Environ. 2019, 669, 459–470. [Google Scholar] [CrossRef] [PubMed]
- He, Y.; Xia, C.; Shao, Z.; Zhao, J. The Spatiotemporal Evolution and Prediction of Carbon Storage: A Case Study of Urban Agglomeration in China’s Beijing-Tianjin-Hebei Region. Land 2022, 11, 858. [Google Scholar] [CrossRef]
- Hu, C.; Huang, G.; Wang, Z. Exploring the Seasonal Relationship between Spatial and Temporal Features of Land Surface Temperature and Its Potential Drivers: The Case of Chengdu Metropolitan Area, China. Front. Earth Sci. 2023, 11, 1226795. [Google Scholar] [CrossRef]
- Wang, B.; Hu, C.; Zhang, Y. Multi-Scenario Simulation of the Impact of Land Use Change on the Ecosystem Service Value in the Suzhou-Wuxi-Changzhou Metropolitan Area, China. Chin. Geogr. Sci. 2023, 34, 79–92. [Google Scholar] [CrossRef]
- Liang, Y.; Hashimoto, S.; Liu, L. Integrated Assessment of Land-Use/Land-Cover Dynamics on Carbon Storage Services in the Loess Plateau of China from 1995 to 2050. Ecol. Indic. 2021, 120, 106939. [Google Scholar] [CrossRef]
- Tasser, E.; Schirpke, U.; Zoderer, B.M.; Tappeiner, U. Towards an Integrative Assessment of Land-Use Type Values from the Perspective of Ecosystem Services. Ecosyst. Serv. 2020, 42, 101082. [Google Scholar] [CrossRef]
- Acheampong, R.A.; Silva, E.A. Land Use–Transport Interaction Modeling: A Review of the Literature and Future Research Directions. J. Transp. Land Use 2015, 8, 11–38. [Google Scholar] [CrossRef]
- Sang, L.; Zhang, C.; Yang, J.; Zhu, D.; Yun, W. Simulation of Land Use Spatial Pattern of Towns and Villages Based on CA–Markov Model. Math. Comput. Model. 2011, 54, 938–943. [Google Scholar] [CrossRef]
- Liu, X.; Liang, X.; Li, X.; Xu, X.; Ou, J.; Chen, Y.; Li, S.; Wang, S.; Pei, F. A Future Land Use Simulation Model (FLUS) for Simulating Multiple Land Use Scenarios by Coupling Human and Natural Effects. Landsc. Urban Plan. 2017, 168, 94–116. [Google Scholar] [CrossRef]
- Huang, D.; Huang, J.; Liu, T. Delimiting Urban Growth Boundaries Using the CLUE-S Model with Village Administrative Boundaries. Land Use Policy 2019, 82, 422–435. [Google Scholar] [CrossRef]
- Moser, G.; Serpico, S.B.; Benediktsson, J.A. Land-Cover Mapping by Markov Modeling of Spatial–Contextual Information in Very-High-Resolution Remote Sensing Images. Proc. IEEE 2012, 101, 631–651. [Google Scholar] [CrossRef]
- Wang, Q.; Guan, Q.; Lin, J.; Luo, H.; Tan, Z.; Ma, Y. Simulating Land Use/Land Cover Change in an Arid Region with the Coupling Models. Ecol. Indic. 2021, 122, 107231. [Google Scholar] [CrossRef]
- Fu, C.; Liu, Y.; Chen, Y.; Li, F.; Huang, J.; Huang, H. Simulation of Land Use Change and Habitat Quality in the Yellow River Basin under Multiple Scenarios. Water 2022, 14, 3767. [Google Scholar] [CrossRef]
- Liu, X.; Andersson, C. Assessing the Impact of Temporal Dynamics on Land-Use Change Modeling. Comput. Environ. Urban Syst. 2004, 28, 107–124. [Google Scholar] [CrossRef]
- Hu, C.; Wang, Z.; Huang, G.; Ding, Y. Construction, Evaluation, and Optimization of a Regional Ecological Security Pattern Based on MSPA—Circuit Theory Approach. Int. J. Environ. Res. Public Health 2022, 19, 16184. [Google Scholar] [CrossRef]
- Harrison, M.T.; Cullen, B.R.; Mayberry, D.E.; Cowie, A.L.; Bilotto, F.; Badgery, W.B.; Liu, K.; Davison, T.; Christie, K.M.; Muleke, A. Carbon Myopia: The Urgent Need for Integrated Social, Economic and Environmental Action in the Livestock Sector. Glob. Change Biol. 2021, 27, 5726–5761. [Google Scholar] [CrossRef]
- Babbar, D.; Areendran, G.; Sahana, M.; Sarma, K.; Raj, K.; Sivadas, A. Assessment and Prediction of Carbon Sequestration Using Markov Chain and InVEST Model in Sariska Tiger Reserve, India. J. Clean. Prod. 2021, 278, 123333. [Google Scholar] [CrossRef]
- Wang, B.; Hu, C.; Li, J. Coupling and Coordination Relationship between the Tourism Economy and Ecosystem Service Value in Southern Jiangsu, China. Int. J. Environ. Res. Public Health 2022, 19, 16136. [Google Scholar] [CrossRef] [PubMed]
- Liang, X.; Guan, Q.; Clarke, K.C.; Liu, S.; Wang, B.; Yao, Y. Understanding the Drivers of Sustainable Land Expansion Using a Patch-Generating Land Use Simulation (PLUS) Model: A Case Study in Wuhan, China. Comput. Environ. Urban Syst. 2021, 85, 101569. [Google Scholar] [CrossRef]
- Guo, R.; Wu, T.; Wu, X.; Luigi, S.; Wang, Y. Simulation of Urban Land Expansion under Ecological Constraints in Harbin-Changchun Urban Agglomeration, China. Chin. Geogr. Sci. 2022, 32, 438–455. [Google Scholar] [CrossRef]
- Xu, L.; Liu, X.; Tong, D.; Liu, Z.; Yin, L.; Zheng, W. Forecasting Urban Land Use Change Based on Cellular Automata and the PLUS Model. Land 2022, 11, 652. [Google Scholar] [CrossRef]
- Guo, H.; Cai, Y.; Li, B.; Tang, Y.; Qi, Z.; Huang, Y.; Yang, Z. An Integrated Modeling Approach for Ecological Risks Assessment under Multiple Scenarios in Guangzhou, China. Ecol. Indic. 2022, 142, 109270. [Google Scholar] [CrossRef]
- Han, N.; Yu, M.; Jia, P. Multi-Scenario Landscape Ecological Risk Simulation for Sustainable Development Goals: A Case Study on the Central Mountainous Area of Hainan Island. Int. J. Environ. Res. Public Health 2022, 19, 4030. [Google Scholar] [CrossRef] [PubMed]
- Lai, Z.; Chen, C.; Chen, J.; Wu, Z.; Wang, F.; Li, S. Multi-Scenario Simulation of Land-Use Change and Delineation of Urban Growth Boundaries in County Area: A Case Study of Xinxing County, Guangdong Province. Land 2022, 11, 1598. [Google Scholar] [CrossRef]
- De Graaff, M.-A.; Adkins, J.; Kardol, P.; Throop, H.L. A Meta-Analysis of Soil Biodiversity Impacts on the Carbon Cycle. Soil 2015, 1, 257–271. [Google Scholar] [CrossRef]
- Oliver, T.H.; Isaac, N.J.; August, T.A.; Woodcock, B.A.; Roy, D.B.; Bullock, J.M. Declining Resilience of Ecosystem Functions under Biodiversity Loss. Nat. Commun. 2015, 6, 10122. [Google Scholar] [CrossRef]
- Yin, J.; Yin, Z.; Zhong, H.; Xu, S.; Hu, X.; Wang, J.; Wu, J. Monitoring Urban Expansion and Land Use/Land Cover Changes of Shanghai Metropolitan Area during the Transitional Economy (1979–2009) in China. Environ. Monit. Assess. 2011, 177, 609–621. [Google Scholar] [CrossRef] [PubMed]
- Prentice, K.C.; Fung, I.Y. The Sensitivity of Terrestrial Carbon Storage to Climate Change. Nature 1990, 346, 48–51. [Google Scholar] [CrossRef]
- Feller, U. Drought Stress and Carbon Assimilation in a Warming Climate: Reversible and Irreversible Impacts. J. Plant Physiol. 2016, 203, 84–94. [Google Scholar] [CrossRef] [PubMed]
- Zhu, C.; Zhang, X.; Zhou, M.; He, S.; Gan, M.; Yang, L.; Wang, K. Impacts of Urbanization and Landscape Pattern on Habitat Quality Using OLS and GWR Models in Hangzhou, China. Ecol. Indic. 2020, 117, 106654. [Google Scholar] [CrossRef]
- Chen, S.; Wang, W.; Xu, W.; Wang, Y.; Wan, H.; Chen, D.; Tang, Z.; Tang, X.; Zhou, G.; Xie, Z. Plant Diversity Enhances Productivity and Soil Carbon Storage. Proc. Natl. Acad. Sci. USA 2018, 115, 4027–4032. [Google Scholar] [CrossRef] [PubMed]
- Wang, Z.; Xu, L.; Shi, Y.; Ma, Q.; Wu, Y.; Lu, Z.; Mao, L.; Pang, E.; Zhang, Q. Impact of Land Use Change on Vegetation Carbon Storage during Rapid Urbanization: A Case Study of Hangzhou, China. Chin. Geogr. Sci. 2021, 31, 209–222. [Google Scholar] [CrossRef]
- Wang, Z.; Zeng, J.; Chen, W. Impact of Urban Expansion on Carbon Storage under Multi-Scenario Simulations in Wuhan, China. Environ. Sci. Pollut. Res. 2022, 29, 45507–45526. [Google Scholar] [CrossRef] [PubMed]
- Cai, W.; Peng, W. Exploring Spatiotemporal Variation of Carbon Storage Driven by Land Use Policy in the Yangtze River Delta Region. Land 2021, 10, 1120. [Google Scholar] [CrossRef]
- Sallustio, L.; Quatrini, V.; Geneletti, D.; Corona, P.; Marchetti, M. Assessing Land Take by Urban Development and Its Impact on Carbon Storage: Findings from Two Case Studies in Italy. Environ. Impact Assess. Rev. 2015, 54, 80–90. [Google Scholar] [CrossRef]
- Li, L.; Song, Y.; Wei, X.; Dong, J. Exploring the Impacts of Urban Growth on Carbon Storage under Integrated Spatial Regulation: A Case Study of Wuhan, China. Ecol. Indic. 2020, 111, 106064. [Google Scholar] [CrossRef]
- Yang, H.; Huang, J.; Liu, D. Linking Climate Change and Socioeconomic Development to Urban Land Use Simulation: Analysis of Their Concurrent Effects on Carbon Storage. Appl. Geogr. 2020, 115, 102135. [Google Scholar] [CrossRef]
- Hu, C.; Li, H. Reverse Thinking: The Logical System Research Method of Urban Thermal Safety Pattern Construction, Evaluation, and Optimization. Remote Sens. 2022, 14, 6036. [Google Scholar] [CrossRef]


Disclaimer/Publisher’s Note: The statements, opinions and data contained in all publications are solely those of the individual author(s) and contributor(s) and not of MDPI and/or the editor(s). MDPI and/or the editor(s) disclaim responsibility for any injury to people or property resulting from any ideas, methods, instructions or products referred to in the content. |
© 2024 by the authors. Licensee MDPI, Basel, Switzerland. This article is an open access article distributed under the terms and conditions of the Creative Commons Attribution (CC BY) license (https://creativecommons.org/licenses/by/4.0/).