Article

Assessment of Uncertainties in Ecological Risk Based on the Prediction of Land Use Change and Ecosystem Service Evolution

1
School of Ethnology and Sociology, Minzu University of China, Beijing 100081, China
2
College of Life and Environmental Sciences, Minzu University of China, Beijing 100081, China
*
Author to whom correspondence should be addressed.
Land 2024, 13(4), 535; https://doi.org/10.3390/land13040535
Submission received: 14 February 2024 / Revised: 12 April 2024 / Accepted: 16 April 2024 / Published: 17 April 2024
(This article belongs to the Special Issue Ecological and Disaster Risk Assessment of Land Use Changes)

Abstract

:
With the rapid progress in urbanization and economic development, the impact of land use change (LUC) on ecosystem services is becoming increasingly significant. However, the accuracy of ecological risk assessment faces challenges due to the presence of uncertainty factors. Using the PLUS model, this study aims to simulate and predict land use changes (LUCs), focusing on the southern hilly regions in southeastern China as a case study, conducting an in-depth assessment of ecological risk uncertainty. Firstly, a spatiotemporal simulation of LUCs in the southern hilly region from 1990 to 2030 was conducted under multiple scenarios. Subsequently, differences in the spatial and temporal distribution of ecosystem service value (ESV) across different years and forecast scenarios in the southern hilly region were revealed, followed by a detailed analysis of the impact of LUCs on ESV. Finally, by calculating the Ecological Risk Index (ERI), the study systematically analyzed the evolution trend of ecological risk in the southern hilly region of China from 1990 to 2030. The main research findings are as follows: (1) the conversion proportions of different land use types vary significantly under different scenarios. Compared to 2020, under the 2030 National Development Scenarios (NDSs), there has been a slight decrease of around 3% in the total conversion area of farmland, forest, and grassland. However, under the Ecological Protection Scenario (EPS) and Urban Development Scenario (UDS) scenarios, there has been an increase in the area of forest and grassland, with a rise of approximately 1.5% in converted built-up land. (2) Western cities (e.g., Yueyang and Yiyang), central cities (e.g., Jiujiang), and northeastern cities (e.g., Suzhou) of China exhibit a relatively high ESV distribution, while ESV significantly decreased overall from 2010 to 2020. However, under the EPS and UDS, ESV shows a significant increasing trend, suggesting that these two scenarios may play a crucial role in ecosystem restoration. (3) The conversion of forest and water bodies to farmland has the most significant inhibitory effect on ESV, especially during the period from 1990 to 2000, providing substantial data support for relevant policy formulation. (4) From 1990 to 2030, ecological risk gradually increased in western, central, and southwestern cities of the southern hilly region, with the highest ecological risk values under the EPS scenario in northern cities (e.g., Chizhou and Tongling). Under the UDS scenario, there has been a significant decrease in ecological risk, providing valuable insights for future ecological conservation and sustainable development. However, a limitation lies in the need for further enhancement of the scenario’s simulation authenticity. This study offers a new perspective for understanding the impact of LUCs on ecosystem services and the uncertainty of ecological risks, providing crucial reference points for land resource management and the formulation of ecological conservation policies.

1. Introduction

Currently, research on ecosystem services is widely recognized as a core issue related to human well-being and ecological balance [1]. This research focuses on various material and non-material products that ecosystems provide to humans, serving as a crucial link in our relationship with nature [2]. These services include not only tangible items like food, water, and raw materials but also intangible services such as climate regulation, aesthetic enjoyment, and spiritual solace [3]. Understanding the operational mechanisms of ecosystem services is crucial for achieving social sustainability. When discussing ecosystem services, many scholars concentrate on specific aspects [4]. Scholars from the field of ecology emphasize the importance of ecosystem services in the protection and maintenance of biodiversity [5]. They highlight that biodiversity is the cornerstone of ecosystem functioning, critically influencing the reproduction of plants, stability of food chains, and adaptability of ecosystems to environmental changes [6]. Economists and policymakers also engage in the study of ecosystem services, focusing on their economic value and contribution [7]. Through estimation and economic assessments of ecosystem services, they underscore the direct role of these services in supporting agriculture, tourism, and natural resource management. Their research enhances policy understanding of ecosystem services, aiming to incorporate their value into decision-making frameworks to promote sustainable development [8]. Scholars in the social sciences focus on the relationship between ecosystem services and human well-being [9]. Their research aims to understand the impact of ecosystem services on social health, cultural identity, and community cohesion [10]. These scholars explore how the natural environment influences human physical and mental health, emphasizing the positive roles of natural landscapes, parks, and nature reserves in people’s quality of life and well-being [11]. The value of ecosystem services is not only a crucial indicator for assessing ecosystem health but also forms the foundation for promoting sustainable economic and social development [12]. However, in the face of severe global challenges such as pollution, excessive resource consumption, climate change, and ecological degradation, these factors have already had a significant impact on the provision of ecosystem services [13]. In socio-economic development, we face challenges such as excessive cultivation of agricultural land and ecosystem degradation, posing significant hurdles to the provision of ecosystem services. To better address global environmental crises and tackle a series of ecological and environmental issues domestically, the assessment of uncertainty regarding future ecological risks is crucial. This helps in the rational allocation of resources to address various ecological challenges and enables more effective ecological restoration and management by identifying potential uncertain risks. This approach minimizes ecological losses and maintains the health and stability of ecosystems to the greatest extent possible.
Land use change (LUC), as a primary driver of ecosystem service variations, directly shapes the structure and functions of ecosystems [14]. Previous research has extensively explored the widespread impact of LUC on ecosystem services [15]. During periods of rapid urban economic development, human activities have driven changes in land use, directly influencing the supply and stability of ecosystem services [16]. The specificity of land use forms complex social phenomena, playing a crucial role in maintaining the functionality of ecosystem services. Such changes inevitably trigger adjustments in ecosystem structure, ultimately leading to changes in the value of ecosystem services [17]. Past studies have extensively investigated the influence of LUC on ecosystem services. For instance, Guo et al. (2021) conducted a quantitative study on global ecosystem services, exploring the responses of ecosystem services to changes in LUC [18]. Pan et al. (2021) proposed new models to quantify the impact of LUC on the scarcity of ecosystem services [19]. Schirpke et al. (2020) analyzed the spatial relationship between ecosystem service intensity and LUC within counties [20]. Peters et al. (2019), using Mount Kilimanjaro in Tanzania as an example, analyzed the interaction between climate and LUC on biodiversity and ecosystem service functions in the region [21]. They found that different land use practices had varying effects on biodiversity and service functions, emphasizing the significant impact of LUC on the diversity and stability of ecosystem services [22]. Kertész et al. (2019), based on research in the Balaton Lake Basin in Hungary, utilized spatial and statistical databases to demonstrate the impact of LUC on ecosystem services [23]. Their research revealed the dynamic effects of different LUCs on service provision, indicating the profound implications of this impact on local communities and the environment [24]. Yohannes et al. (2021) assessed changes in ecosystem services in the Kathmandu Valley due to historical and predicted LUCs [25]. Rahman et al. (2021) assessed the impact of LUC on ESV, using a globally applicable benefit transfer method to estimate the environmental value associated with land use costs [26]. Solomon et al. (2019) evaluated the impact of LUC on ESV of dry Afromontane forests in northern Ethiopia, estimating ESVs and their variations based on the benefit transfer method and effective value coefficients [27]. Song et al. (2017) employed a value transfer method to study the effects of LUC on ESV and developed an elasticity index to assess the response of ESV changes relative to LUC [28]. These studies not only uncover the direct and indirect effects of LUC on ecosystem services but also reveal the diversity of these impacts under different environmental and regional conditions [29]. These impacts encompass aspects such as the quantity, scarcity, spatial distribution, and long-term adjustments of ESV. Despite extensive past research into the wide-ranging effects of LUCs on ESV, there has been limited comprehensive analysis of ESV variations and the uncertainty of ecological risks in unique geographical environments such as the southern hilly regions. Our study aims to fill this gap. The unique characteristics of this study area provide an opportunity for us to understand ESV variations and their uncertain factors. This study also pays particular attention to the influence of geographical backgrounds and annual climatic phenomena on ESV. Furthermore, we delve into how these unique geographical factors affect the simulated evolution of ESV and the uncertain ecological risks they entail, aiming to fill gaps in existing research and promote advancements in this field.
The future prediction of land use is crucial for assessing ESV [30], as is evaluating ecological risks and uncertainties [31]. The stability and sustainability of ecosystem services are influenced by various factors, with uncertainty being a significant challenge [32]. Previous assessments of ecological risk in China by scholars have focused on different ecosystems, soils, and urban and regional scales. Solovjova et al. (2019) proposed a method for mathematical modeling and ecological risk assessment of marine ecosystems, considering the combined effects of natural, anthropogenic, climatic, and invasive factors [33]. Zhao et al. (2013) utilized a relative risk model to evaluate the characteristics of ecological risks in Chinese freshwater ecosystems from both regional and overall perspectives [34]. Li et al. (2020) analyzed the surface sediments of six representative mangroves in China, discussing microplastic pollution and its related ecological risks [35]. Yan et al. (2021) evaluated the dynamic variation patterns and influencing factors of ecological risks in the agricultural–pastoral ecotone landscapes of China across different terrain gradients [36]. Zhang et al. (2023) estimated the landscape ecological risk index of different levels, climate zones, and ecosystem types in Chinese nature reserves [37]. Zou et al. (2022) explored the spatiotemporal patterns of ecological risks in Chinese agricultural ecosystems [38]. Chen et al. (2023) investigated the spatiotemporal variation patterns of ecological risks in Nanning City at the optimal scale, predicting ecological risks under two scenarios for Nanning City in 2036 [39]. These studies have explored ecological risks in different regions and ecosystems of China, emphasizing the relationship between ecological environmental changes and human activities. In comparison with existing research, this study focuses on the potential impact of uncertainty assessment on ESV evolution in the southern hilly region, thereby comprehensively assessing ecological risks and providing more flexible solutions for future decision-making.
Building on previous research, forecasting future land use patterns provides insights that help us understand the variations in ecosystem services under different land use scenarios [40]. The prediction of future land use is a complex process involving multiple factors, including climate change, uncertainties in human activity patterns, land management policies, population dynamics, urbanization, and the growth of impermeable surfaces, all impacting ESV [41]. Several scholars have explored the key drivers influencing land use simulation predictions. Lin et al. (2023) identified population, GDP, distance to railways, DEM, and annual average precipitation as driving factors [42]. Zhang et al. (2023) identified elevation, precipitation, temperature, slope, GDP, and soil properties as factors driving LUC in Sichuan Province, using the PLUS model to simulate and reveal the main drivers [43]. Xu et al. (2023) focused on the Weihe River Basin, considering precipitation, temperature, elevation, population, groundwater depth, GDP, and surface soil organic carbon as driving factors to explore the ecological characteristics of future urban cost control [44]. The selection of these driving factors in these studies provides valuable references, allowing for a deeper understanding of the mechanisms driving changes in land use patterns and providing a basis for future land use and ecological planning. By adopting different scenarios, we can capture the diversity of land use changes, thereby better reflecting the presence of uncertainty [45]. This aids in understanding the risks that ecosystem services may face under different development pathways and contributes to providing more resilient solutions for future decision-making [46]. Existing studies indicate that different land use practices have significant impacts on the supply and quality of ecosystem services [47]. For example, the conversion of forests into farmland may lead to reduced water sources and increased soil erosion, thereby diminishing the capacity for water regulation and soil conservation [48]. By simulating and predicting future LUCs, we can better anticipate trends in ecosystem service changes, providing essential foundations for developing sustainable development strategies [49]. Furthermore, the assessment of ecological risks and uncertainties must also consider the impacts of future LUCs. Previous research suggests that factors such as climate change, human activities, and biodiversity loss significantly affect the provision and stability of ecosystem services [50]. Climate change is a complex factor fraught with uncertainty, and its impact on ecosystem services may vary across regions and time [51]. The diversity of human behavior, uncertainty in the parameters of predictive models, and assumptions pose challenges to the assessment of uncertainties in ecological risks [52]. Population change can have profound effects on ESV, involving the structure, function, and interactions between ecosystems and the human–nature interface. For instance, population growth leads to increased demand for land and water resources, exerting pressure on the ecological environment. Population growth also disrupts biological resources, reducing levels of biodiversity [53]. Furthermore, urbanization alters the land use structure, converting large swathes of natural land into urban development, directly and indirectly impacting surrounding ecosystems. For example, urbanization may lead to reduced water sources, declining soil quality, and loss of biodiversity, thereby diminishing ecosystem stability and service quality [54]. Lastly, the growth of impermeable surfaces is another significant factor, causing increased runoff, leading to water wastage and exacerbating water pollution [55]. These factors collectively contribute to negative impacts on ecosystem services, threatening human livelihoods and socio-economic development. Urbanization and the growth of impermeable surfaces are often interconnected, with a complex interplay occurring between them. For example, urbanization may contribute to the growth of impermeable surfaces, exacerbating issues of water usage and pollution, subsequently affecting the supply and quality of ecosystem services. Such an interplay renders ecosystem responses to urbanization and the growth of impermeable surfaces more intricate and uncertain. In the future, the uncertainty of land use may exacerbate these impacts, increasing the uncertainty and risks associated with ecosystem services [56]. Therefore, based on the assessment of future land use patterns, we can comprehensively understand the future changes in ecosystem services, proactively identify potential ecological risks, and take corresponding measures to reduce the likelihood of these risks [57].
The southern hilly region of China is currently facing rapid LUCs and pressures from human activities, which may have profound effects on ecosystem services. Existing research indicates that the region’s LUCs exhibit uncertainty, such as the conversion of forests into farmland or urban expansion, introducing diversity and uncertainty that pose risks to the supply and quality of ecosystem services [58]. Predictions based on multi-scenario simulations of land use can more accurately depict potential future land use patterns, providing a finer and more comprehensive basis for assessing changes in ecosystem services. Such studies contribute to identifying potential ecological risks, such as reduced water sources, intensified soil erosion, and biodiversity loss, guiding decision-makers in formulating appropriate land management policies and protective measures to mitigate the loss of ecosystem services [59]. In regions such as the southern hilly region, ecosystem services are crucial for the livelihoods of local residents, community development, and ecological balance. Therefore, research on ecological risk and uncertainty assessments in this region would provide vital support for maintaining the stability of ecosystem services, contributing to the achievement of sustainable development and ecological conservation goals.

2. Materials and Methods
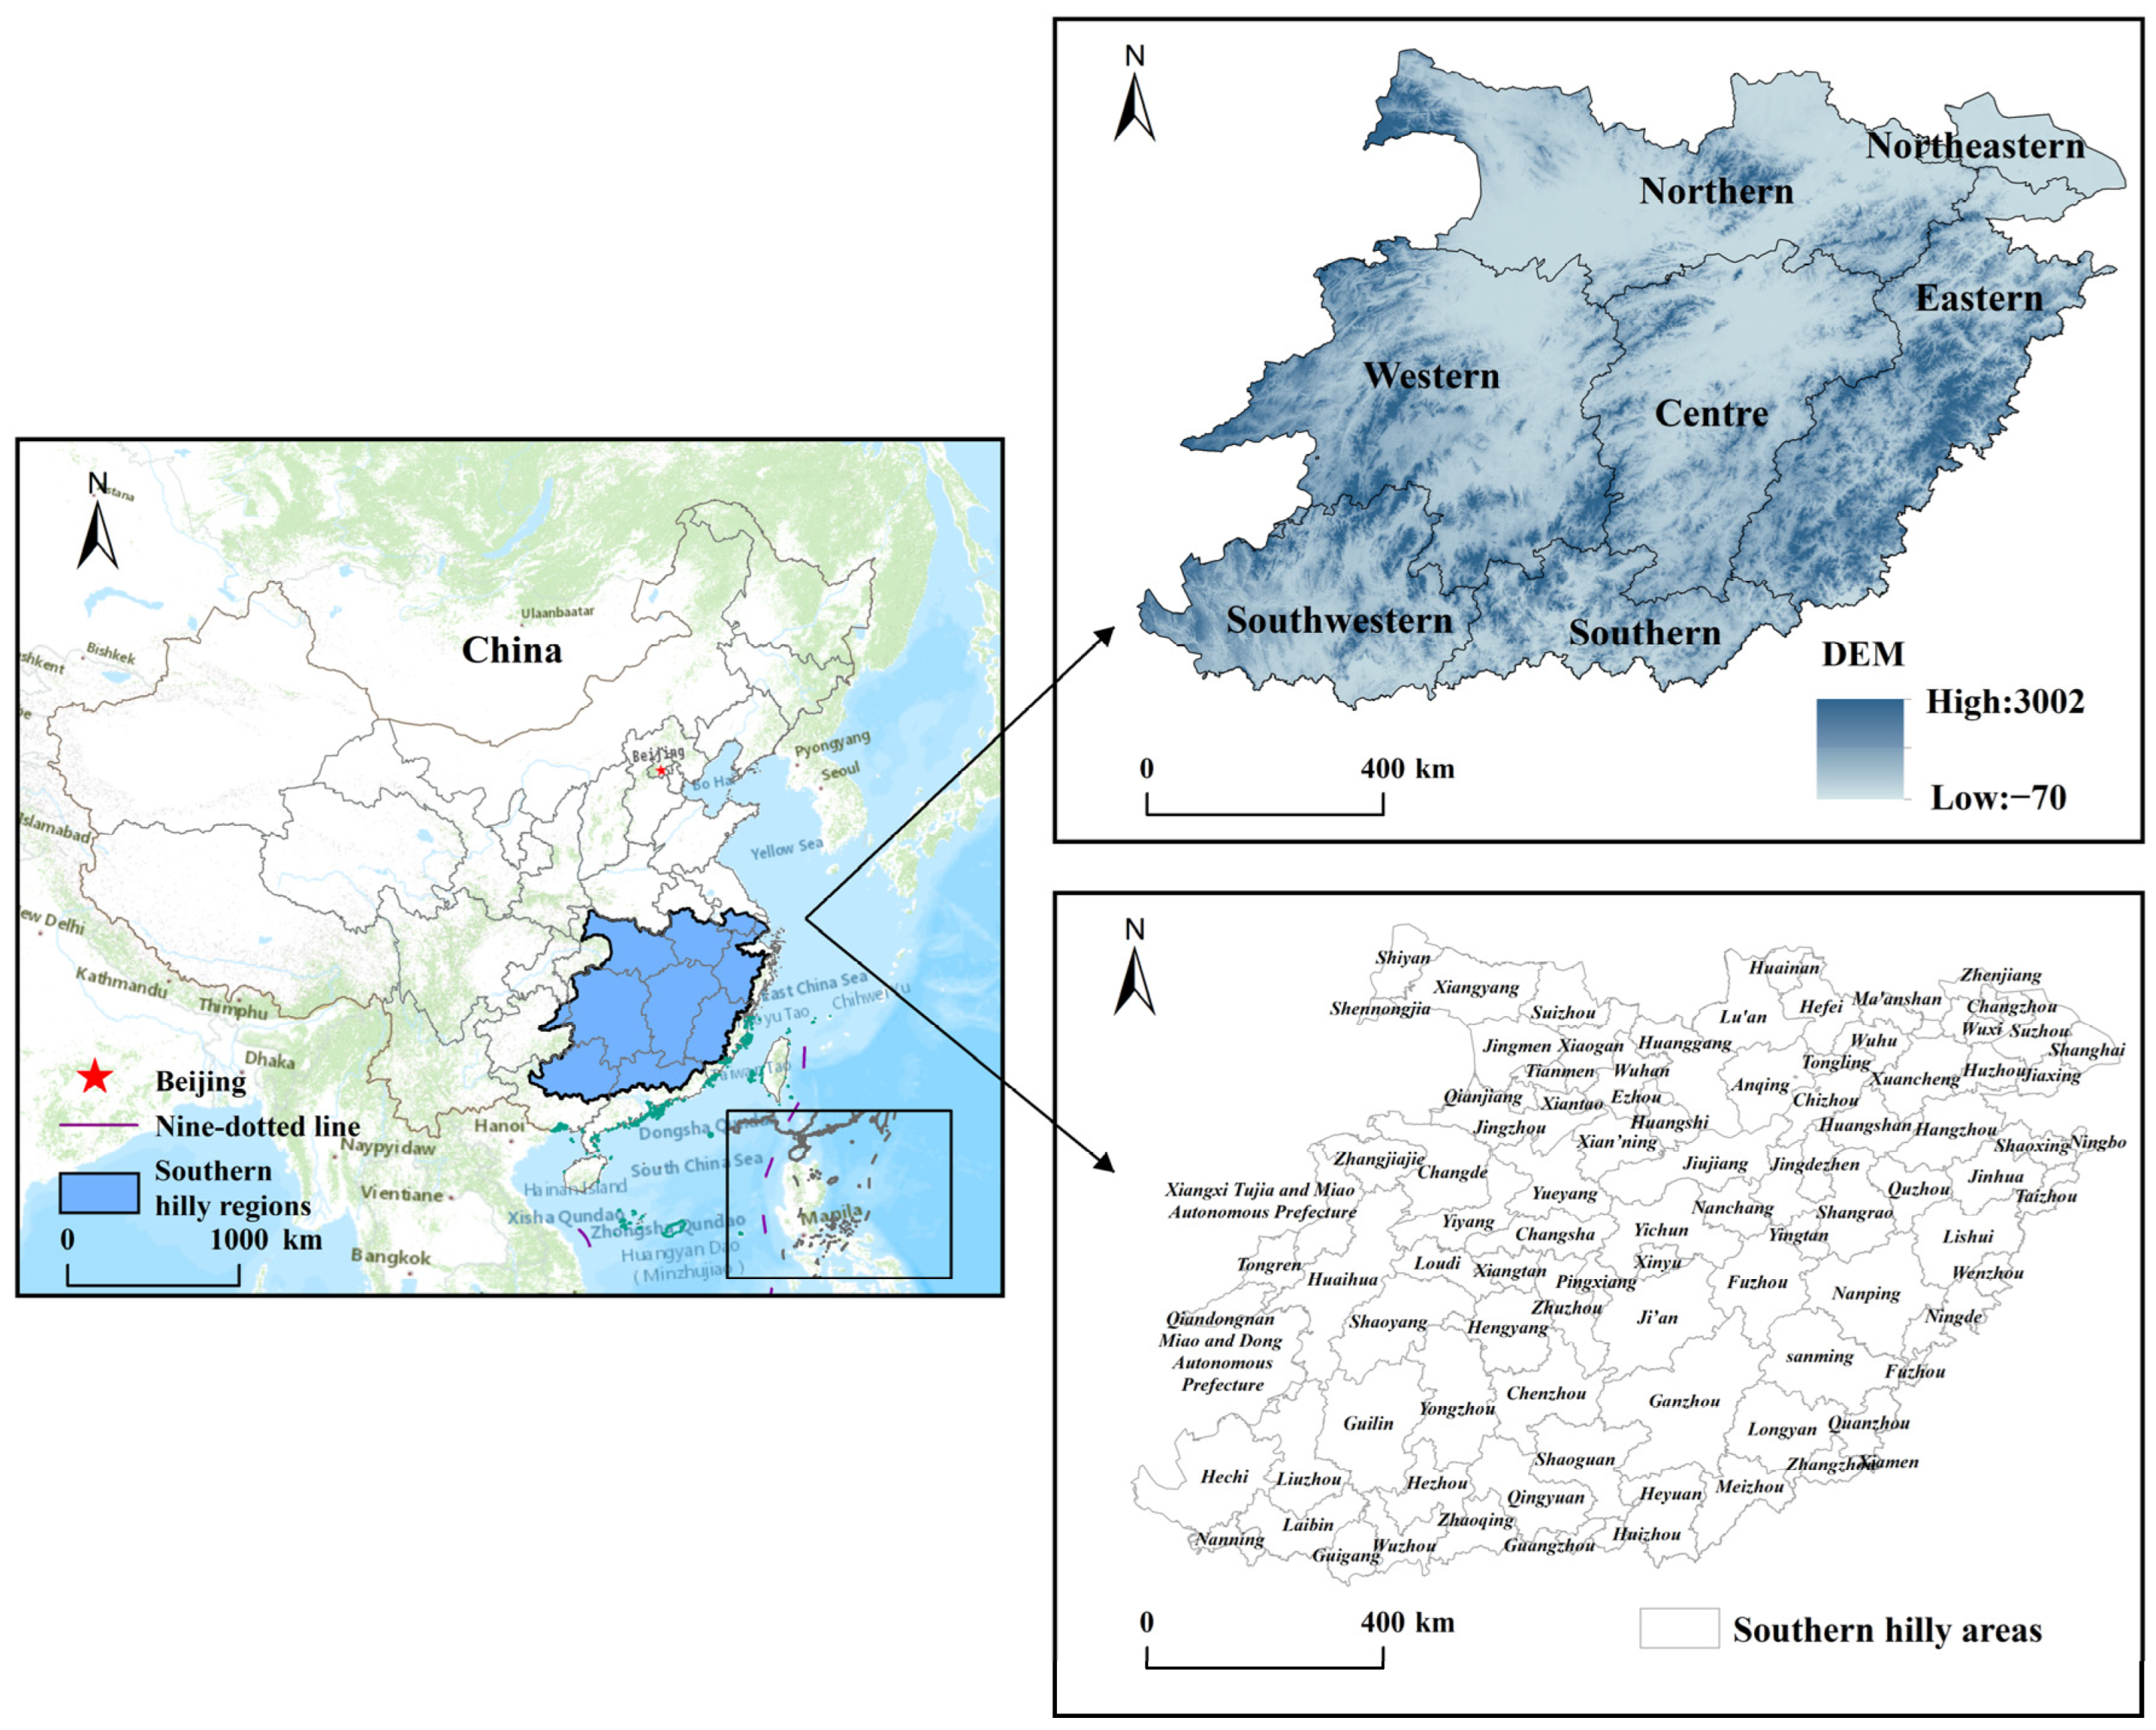
2.1. Study Area

The southern hilly region boasts abundant natural resources and diverse ecosystems, encompassing various ecosystem types such as forests, grasslands, and water bodies (Figure 1). These ecosystems interweave, forming a complex ecological pattern. The region’s climate, influenced by topography, exhibits diversity and can be broadly categorized into subtropical and temperate climates. The impact of monsoons results in uneven precipitation distribution, and the mountainous terrain leads to significant spatial variations in temperature and rainfall. These climatic features provide unique survival conditions for the region’s ecosystems and amplify the impact of LUCs on them. The southern hilly region is also a significant agricultural production area in China, with widespread distribution of farmland. With the development of the economy and society, human activities have had profound effects on land use, including urban expansion, changes in farmland, and forest development. These changes have the potential to impact ecosystem services and bring about a series of ecological risks. Therefore, evaluating land use change predictions and the ecological risk uncertainty of ecosystem services in this region holds crucial scientific significance and practical value.

2.2. Data Sources and Processing

In this study, the land use data from 1990 to 2020 and China’s administrative boundaries were sourced from the Resource and Environmental Science Data Center of the Chinese Academy of Sciences (http://www.resdc.cn/, accessed on 1 May 2023). The classification standards for land use data reference the classification system of land use status remote sensing monitoring data from the Resource and Environmental Science Data Center of the Chinese Academy of Sciences (http://www.resdc.cn/). Nine driving factors were selected for land use scenario prediction, including elevation (DEM) (http://www.gscloud.cn/, accessed on 1 May 2023), slope (derived from DEM), annual average rainfall (http://www.geodata.cn/, accessed on 1 May 2023), annual average temperature (http://www.geodata.cn/), population density (http://www.resdc.cn/), per capita GDP (http://www.resdc.cn/), distance to rivers, distance to major roads, and distance to railways, obtained through Euclidean distance analysis in ArcGIS 10.2 using data from rivers, roads, and railways (http://www.resdc.cn/). The correlations among these nine driving factors are all less than 0.7 (Table 1), indicating suitability for simulation prediction using the PLUS model. Grain production, prices, and planting areas are, respectively sourced from the “China Rural Statistical Yearbook” for the years 1990, 2000, 2010, and 2020.

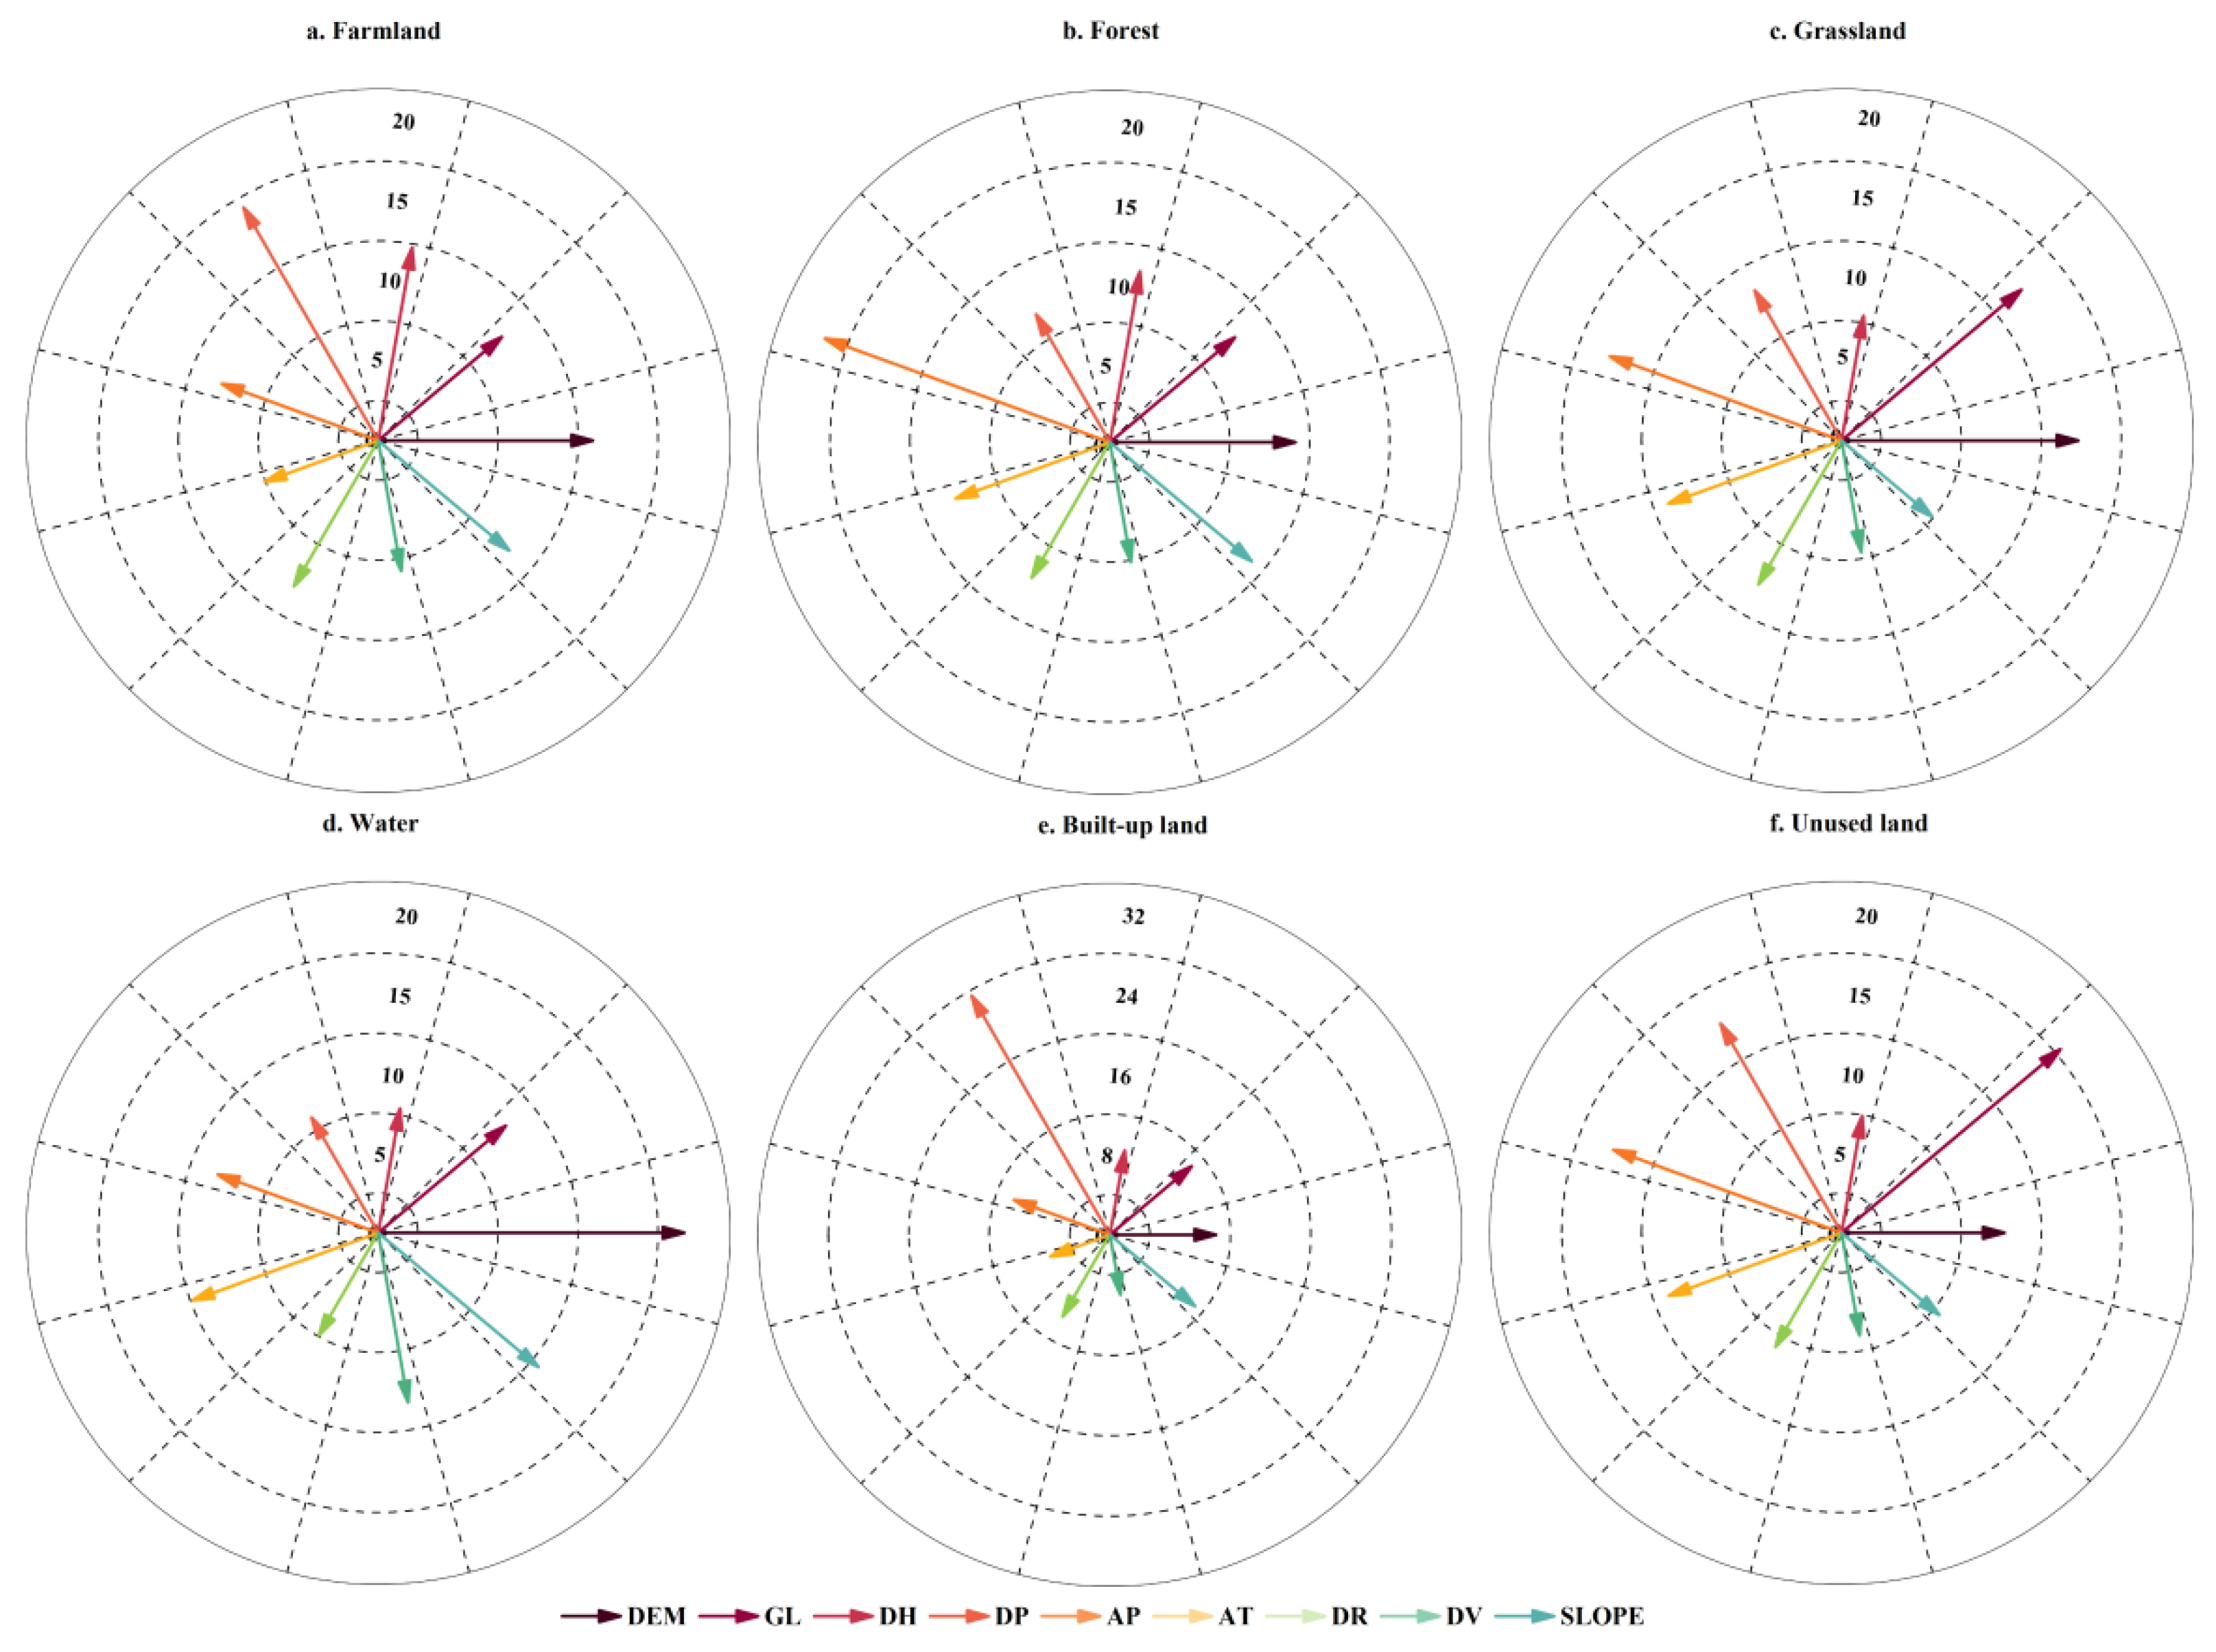
2.3. Screening of Drivers for Multi-Scenario Forecasting

This study utilizes the Land expansion analysis strategy (LEAS) module of the PLUS model to analyze the relationship between the development of various land uses and multiple driving factors [60]. The calculation principle of this module is based on random forest classification (RFC). The calculation formula is as follows [61]:
P i , k d ( x ) = n = 1 M I ( h n ( x ) = d ) M
The value of d is 0 or 1; 1 indicates a conversion from other land use types to land use type k, while 0 signifies no conversion from other land use types. X is a vector composed of multiple driving factors. I(∙) is the indicator function for the decision tree ensemble. Hn (x) is the predicted type of the nth decision tree for vector x. M is the total number of decision trees.

2.4. Calculation of ESV

The ESV types involved in this study mainly include Food production, Raw material production, Water supply, Gas regulation, Climate regulation, Environment depuration, Hydrological adjusting, Soil conservation, Nutrients cycle maintenance, Biodiversity, and Aesthetic landscape. Using the standard equivalent factor valuation method proposed by Xie et al. [62], the net profit of food production per unit area of agricultural ecosystem is taken as the ESV value of one equivalent factor [63]. Rice, wheat, corn, and soybeans are the four main staple crops in China. Considering the fluctuations in the values and planting areas of these four major crops in different years, the average net profit of the four major crops from 1990 to 2020 is taken as the standard equivalent factor value in this study. The calculation formula is as follows [64]:
V a = 1 7 i = 1 n a i p i q i A ( i = 1,2 , , n )
V E i j = C i j V a ( i , j = 1,2 , , n )
E S V = A k E k
Here, Va represents the economic value of agricultural crops per unit area in China; i denotes the type of crops, with pi representing the price of the ith crop in the current year; qi represents the yield of the jth crop per unit area; ai represents the total planting area of the ith crop; and A represents the total planting area for the four types of crops. VEij represents the ESV coefficient of the jth ecosystem service function contained in the ith ecosystem; Cij represents the economic value of the jth service included in the ith ecosystem per unit area of farmland compared to 1 unit area of agricultural land; and Va represents the economic value generated by 1 unit area of crops. ESV represents the total ecosystem service value; Ak represents the area of the kth land class; and Ek represents the ESV corresponding to 1 unit area of the kth land class.

2.5. Cross-Sensitivity (CICS)

Used to analyze the rate of change in ESV values caused by the unit area change rate of LUC, CICS serves as a measure of the degree of disturbance to the environment by natural or human activities. Generally, LUC is bidirectional, and only the net conversion between different land use types leads to actual changes in ESV [65]. A positive CICS value indicates that the net transition between two land uses promotes the change in ESV, while a negative value inhibits ESV development. The larger the absolute value of CICS, the more sensitive ESV is to the net transition between the two land uses, and vice versa. The calculation formula is as follows [66]:
P k i = ( V k V i ) P E S V
In the equation, Pki represents the improved land class transition CICS; Vk and Vi, respectively, represent the revised land class and the ESV equivalent factor for the land class. P E S V represents the change in ESV between the n + 1 year and the n year.

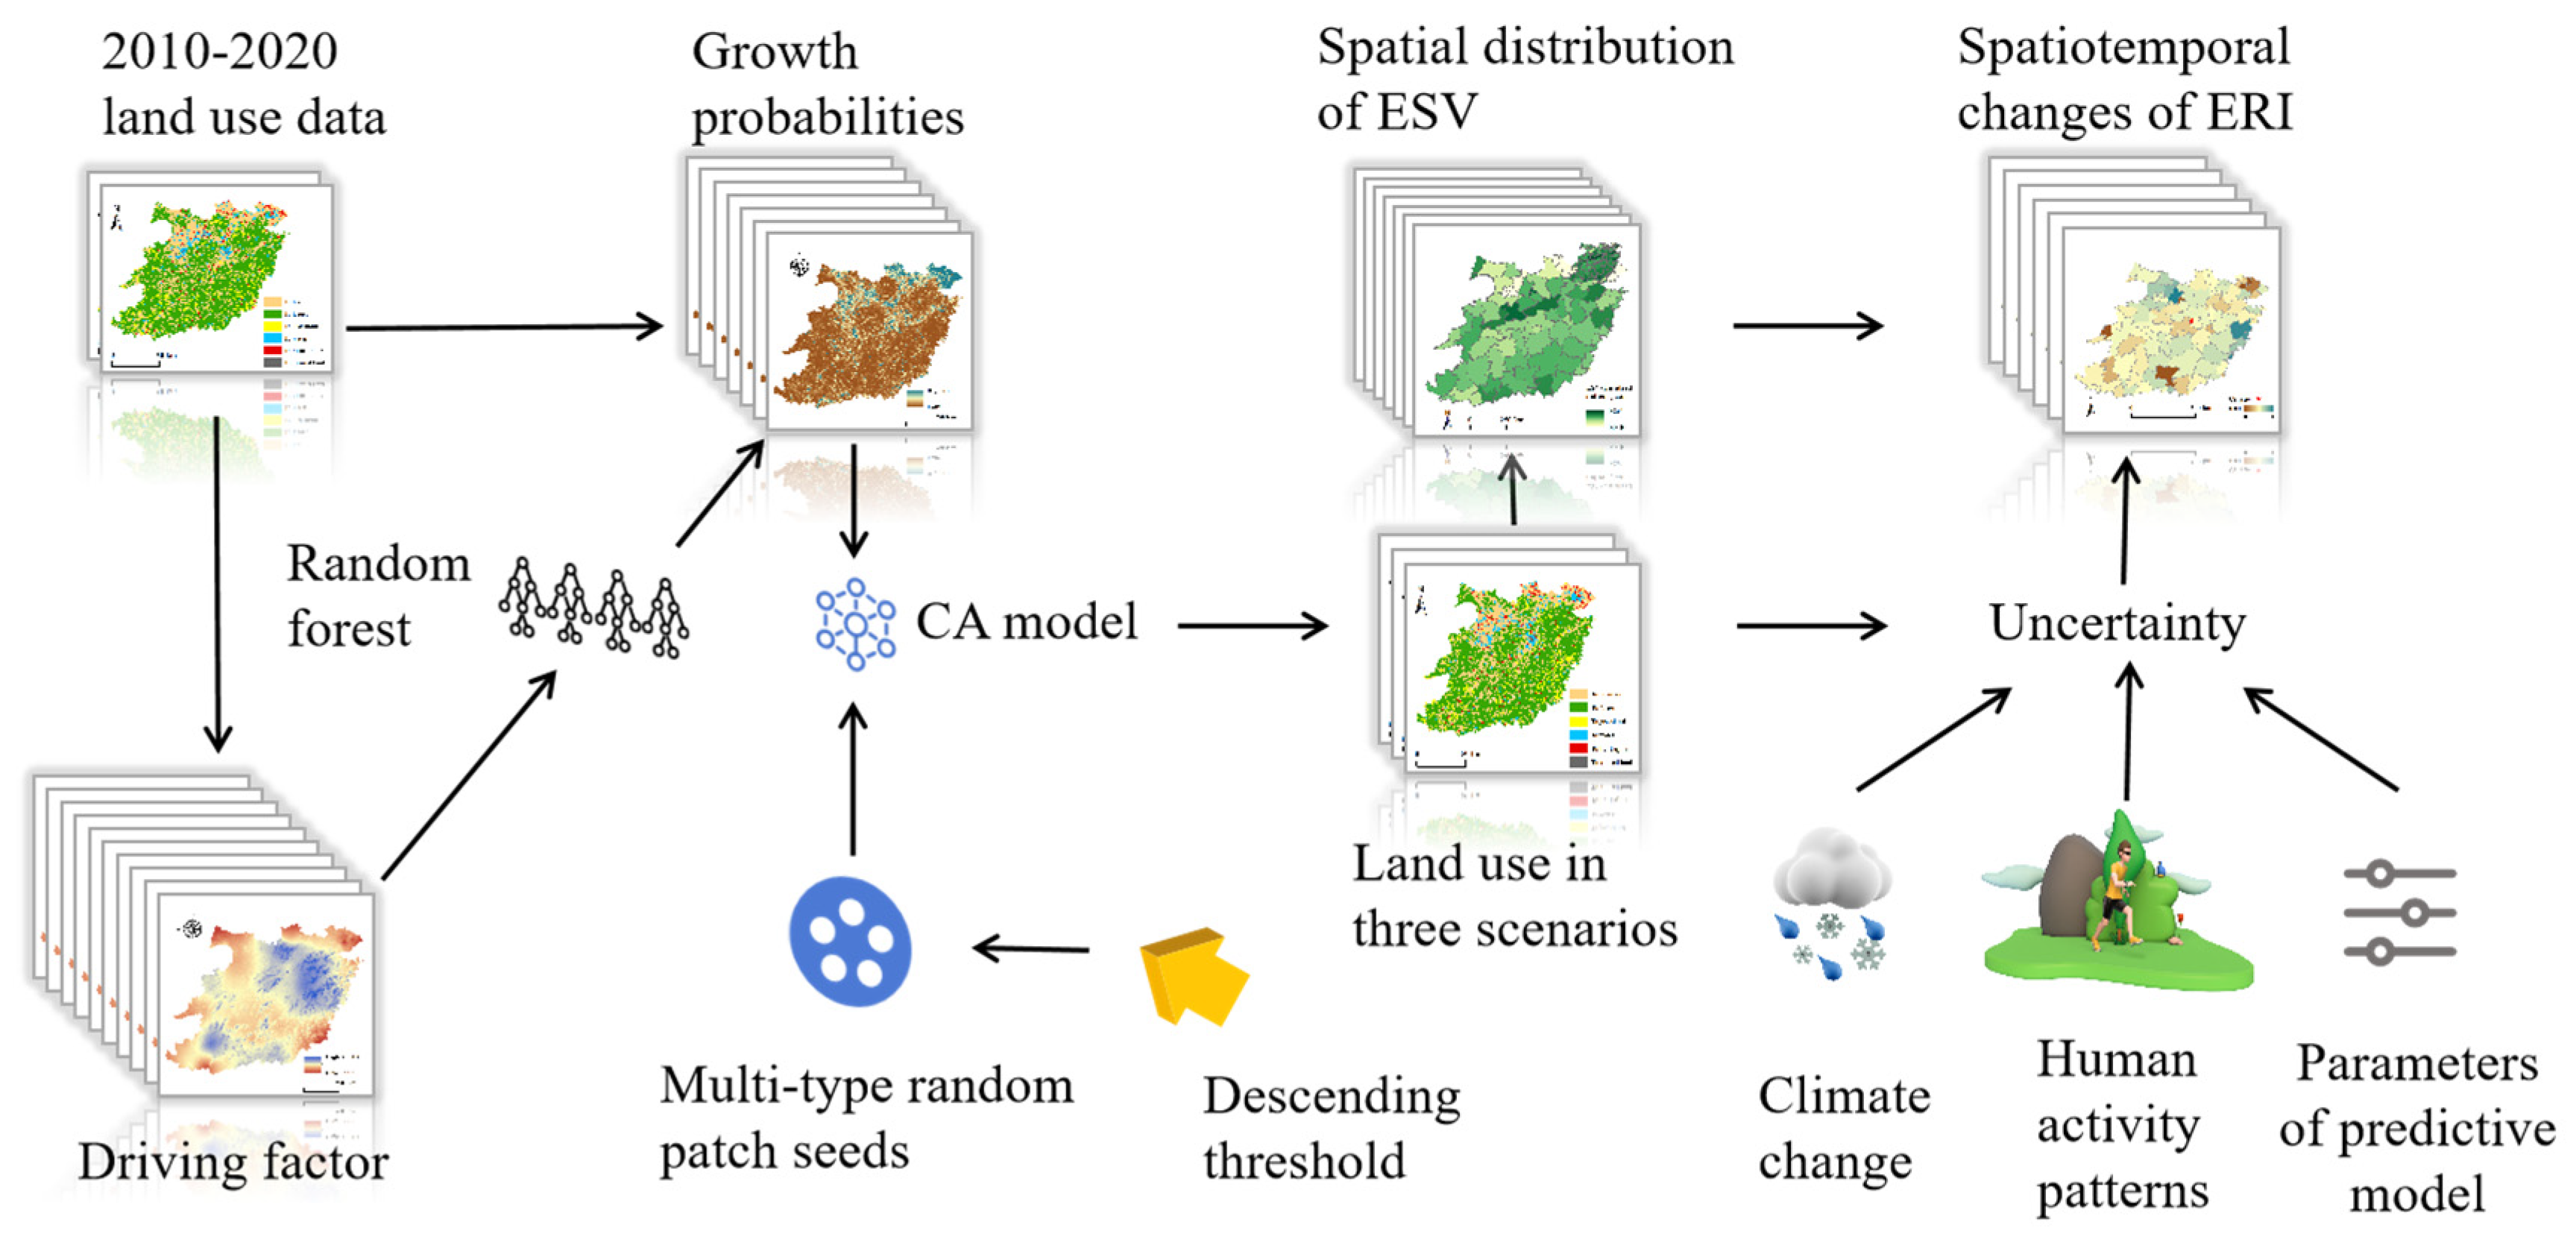
2.6. Land-Use Simulation Based on PLUS Model

Based on the land-use data from the year 2020, this study employs the PLUS model to simulate the land-use conditions in the year 2030 (Figure 2). To validate the simulation accuracy, we first simulate the land-use situation in the year 2020 using the land-use data from 2010. The simulation results are then compared with the actual values of the 2020 land-use data, yielding a Kappa value of 0.9734 and an FOM value of 0.9218. Kappa value is a measure of consistency for assessing the performance of classification models, while FOM value is an indicator used to evaluate the performance of binary classification models. The higher the Kappa coefficient and FOM value, the higher the accuracy of the model predictions [60]. This indicates that the simulation accuracy of the model in this study is extremely high and can be used for predicting future land-use data.
Three scenarios were set in this study: NDS (Natural Development Scenario), where the development probabilities of various land uses from 2010 to 2020 are maintained to simulate the land-use situation in 2030, with water bodies as restriction areas; EPS (Ecological Protection Scenario), which follows the requirements of the “General Land Use Plan of China” (2006–2020), appropriately protecting cultivated land, forests, and water bodies and reducing their conversion rates, with no conversion restrictions; UDS (Urban Development Scenario), which moderately increases the expansion rate of construction land while allowing other types of land to be converted into construction land, with water bodies as restriction areas. The conversion cost matrix was modified, where 1 indicates allowable conversion, and 0 indicates restricted conversion. Additionally, all three scenarios use the same set of driving factors, including distances to main rivers, railways, major highways, elevation, slope, average GDP per unit area, population density, potential evaporation, and annual average precipitation—nine factors in total.

2.7. Calculation of the Ecological Risk Index

To obtain the supply risk of ESV represented by different regional combinations of land-use types, the Sharpe Ratio was employed. The Sharpe Index, as an economic concept, measures the extent to which the unit risk of a fund portfolio exceeds the risk-free return. This ratio, as an indicator of risk-adjusted returns, provides the level of returns at a given risk level [67]. Based on this concept, the ESV of future spatial units can be seen as expected ecological returns, while the ESV before 2020 can be considered as the risk-free rate of return. The uncertainty of future land use can be viewed as a risk. When this ratio is positive, it indicates higher ESV risk returns for unit risk input. A negative ratio indicates future ESV losses. The standard deviation of future LUC uncertainty is regarded as the portfolio’s standard deviation, thereby determining the ecological risk level at the county scale under different scenario simulations. The formula is as follows [68]:
E R I j = ( E S V t + 1 E S V t ) S T D = E E R S T D E E R 0
E R I j = ( E S V t + 1 E S V t ) S T D 1 = E E R S T D 1 E E R < 0
In the equation, E R I j represents the ecological risk index, EER denotes the average return on investment for ESV, ESVt stands for the risk-free rate of return on investment, E S V t + 1 represents the ESV for period t + 1, and STD is the standard deviation of ESV.

2.8. Analysis of the Gravity of Ecological Risks in the Region

In the process of practical problem analysis, assuming a fixed region that includes n small area units, where the center coordinates of the ith unit are represented by (x, y), and the weight of the significance of the corresponding attributes for this unit is denoted as Mi, the centroid coordinates for the region corresponding to the attributes can be calculated using Formulas (8) and (9) [69,70]:
x ¯ = M i x i / M i
y ¯ = M i y i / M i
In Equations (8) and (9), xi and yi represent the coordinates of the center of the ith study area, and Mi represents the ERI for the ith study area.

3. Results

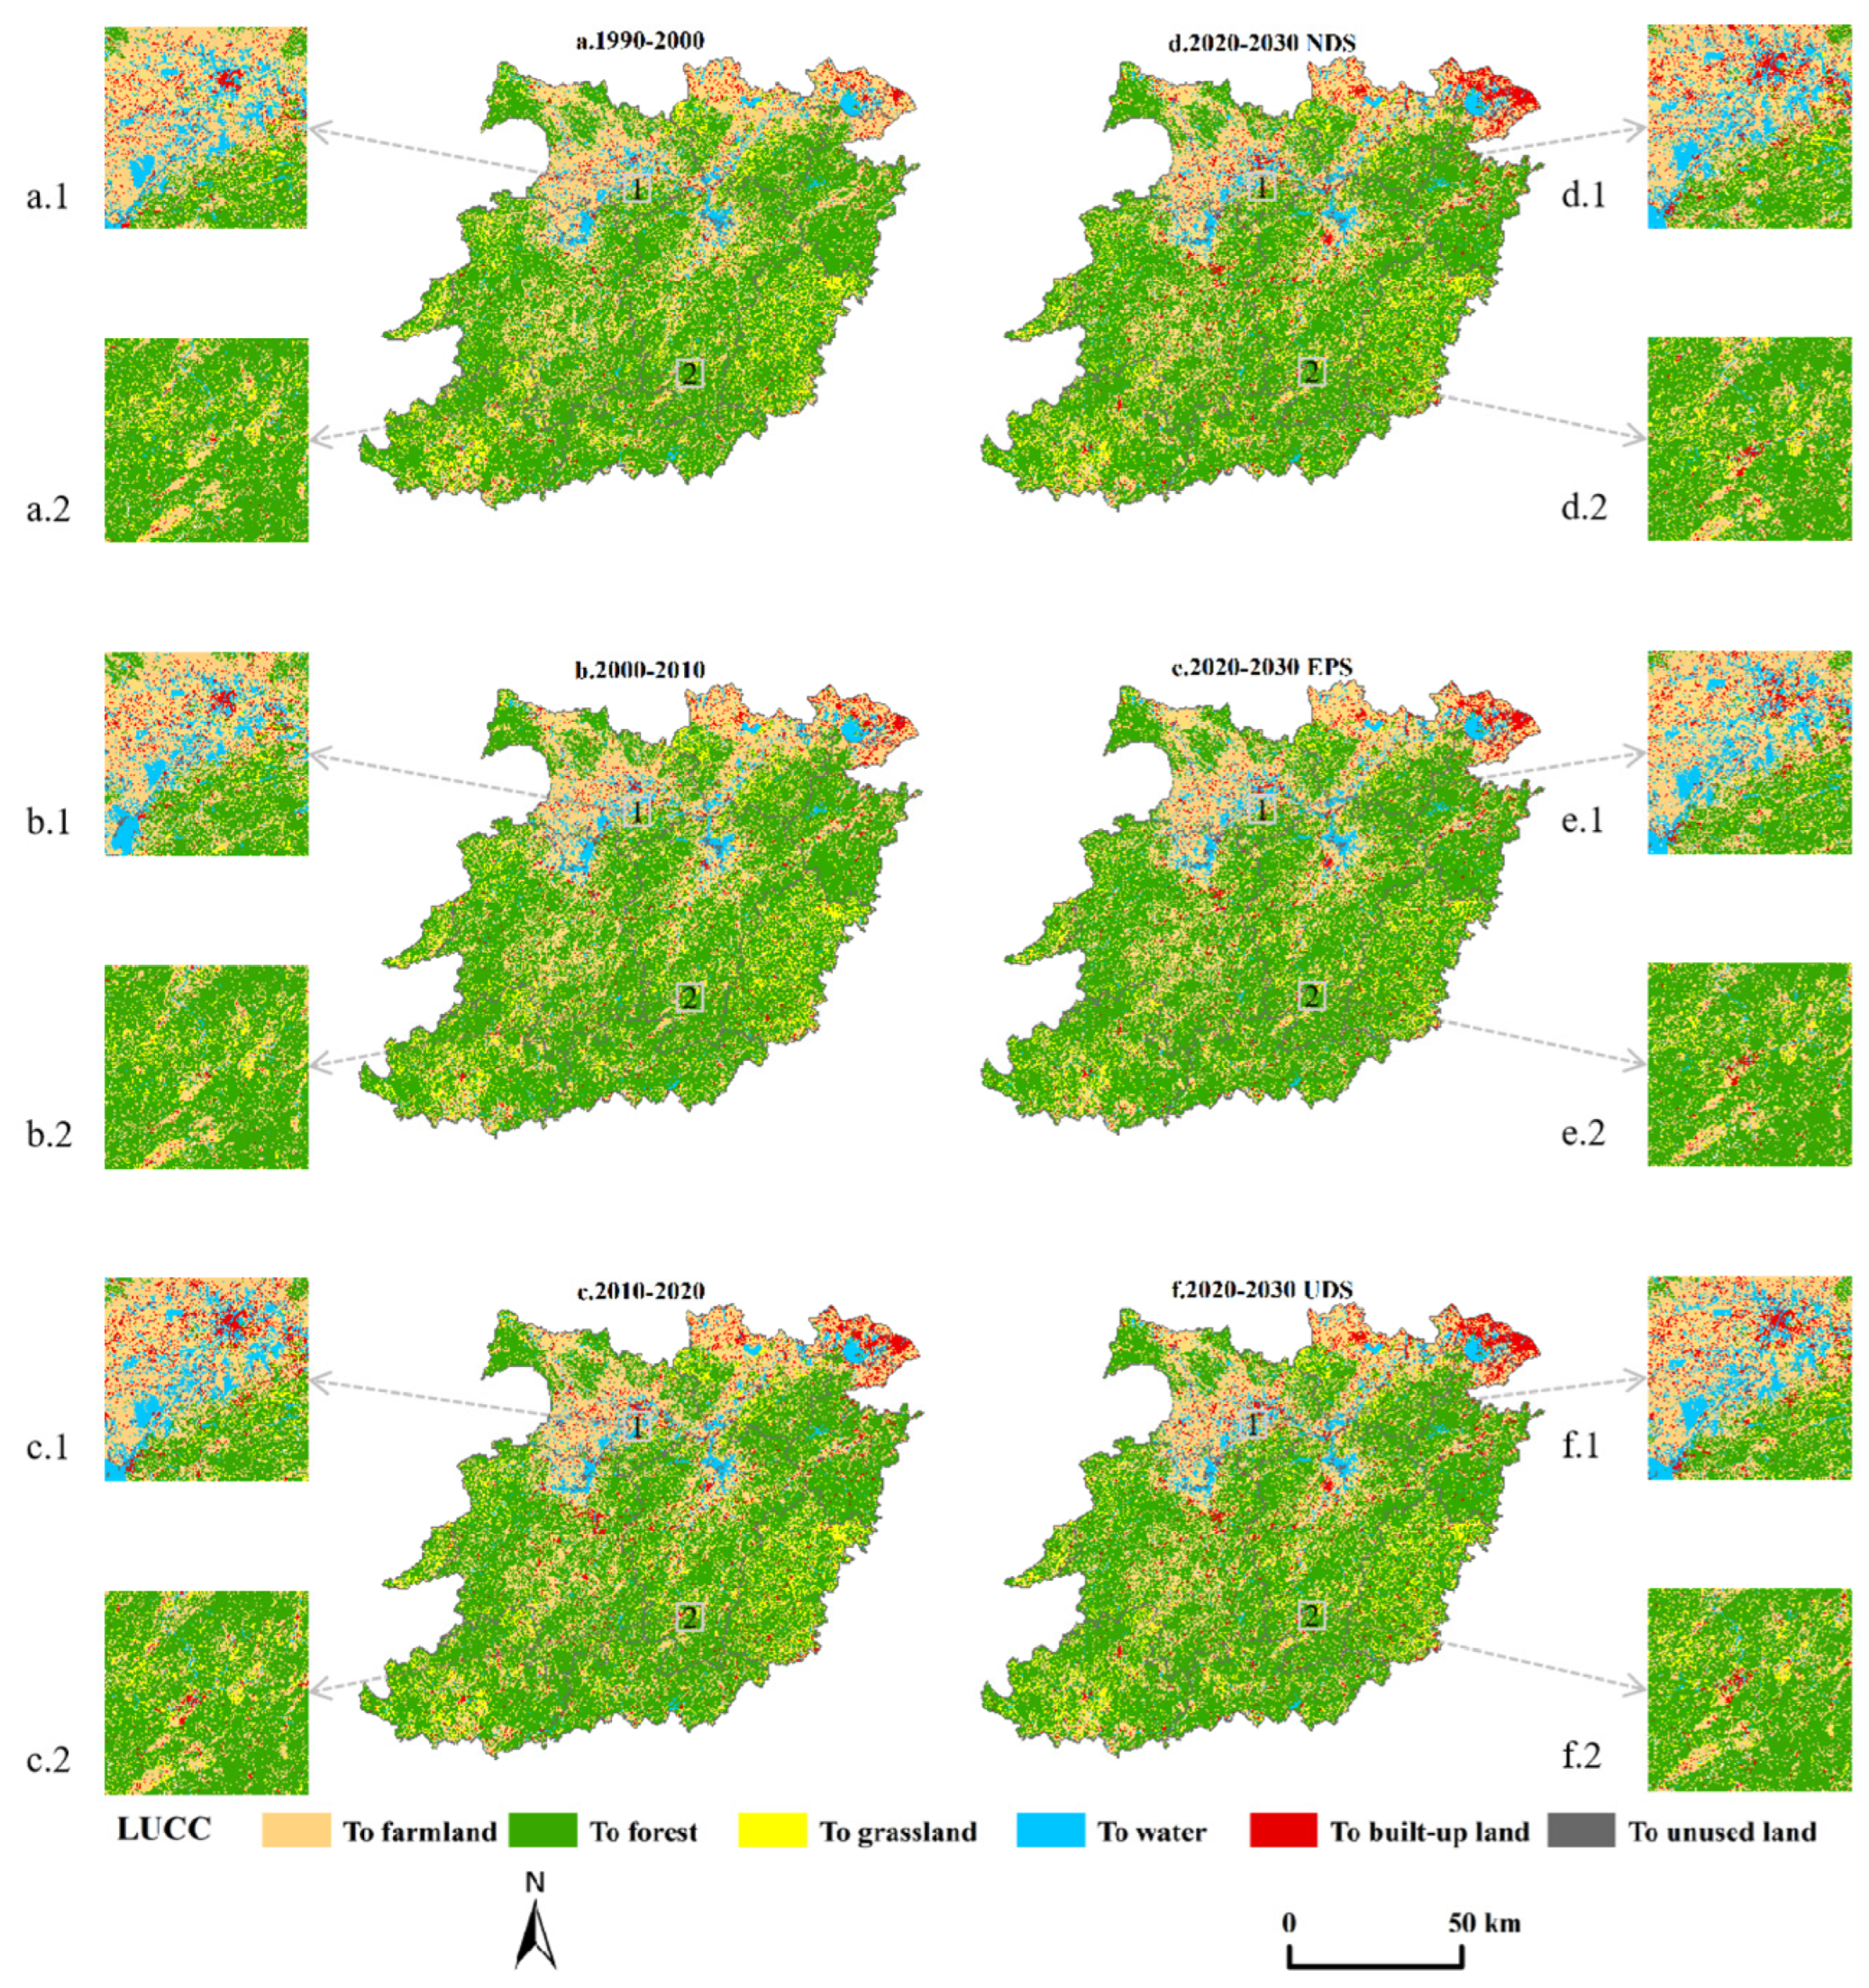
3.1. Spatial and Temporal Changes in Land Use in Different Scenarios

In the southern hilly region, forests constitute the largest land use type, accounting for 57% of the total land area, followed by farmlands at 30%. Across different scenarios from 1990 to 2030, the highest proportion of land conversion is observed from built-up areas to other land types (ranging from 4.8% to 9.1%). This is followed by water bodies (0.1% to 3.8%), grasslands (−2.3% to −5.5%), and farmlands (−1.9% to −3.1%) experiencing relatively high rates of conversion to other types. Changes in other land types are minimal. Figure 3 illustrates the spatiotemporal distribution of different land use types converted to other land types. Spatially, land use types converted to forest cover the largest areas, with a significant portion in the northern and northeastern provinces transitioning to farmland. Concentrated conversions to water bodies occur in the western Changde, central Jingdezhen, and Jiujiang cities, as well as in the northern and northeastern regions of the study area. In the northeastern part, there are concentrated conversions to built-up land. Throughout the study area, scattered conversions to built-up land are also observed. In 2030, under different scenarios, the spatiotemporal variation in land use conversion is not predicted to be pronounced, but there are expected to be differences in terms of quantity. Compared to 2020, under the NDS scenario in 2030, the total area of land converted to cultivated, forest, and grassland will decrease by approximately 3%. Under the EPS scenario, the areas converted to forest and grassland will increase by around 2%. In the UDS scenario, the area converted to built-up land will increase by approximately 1.5%.

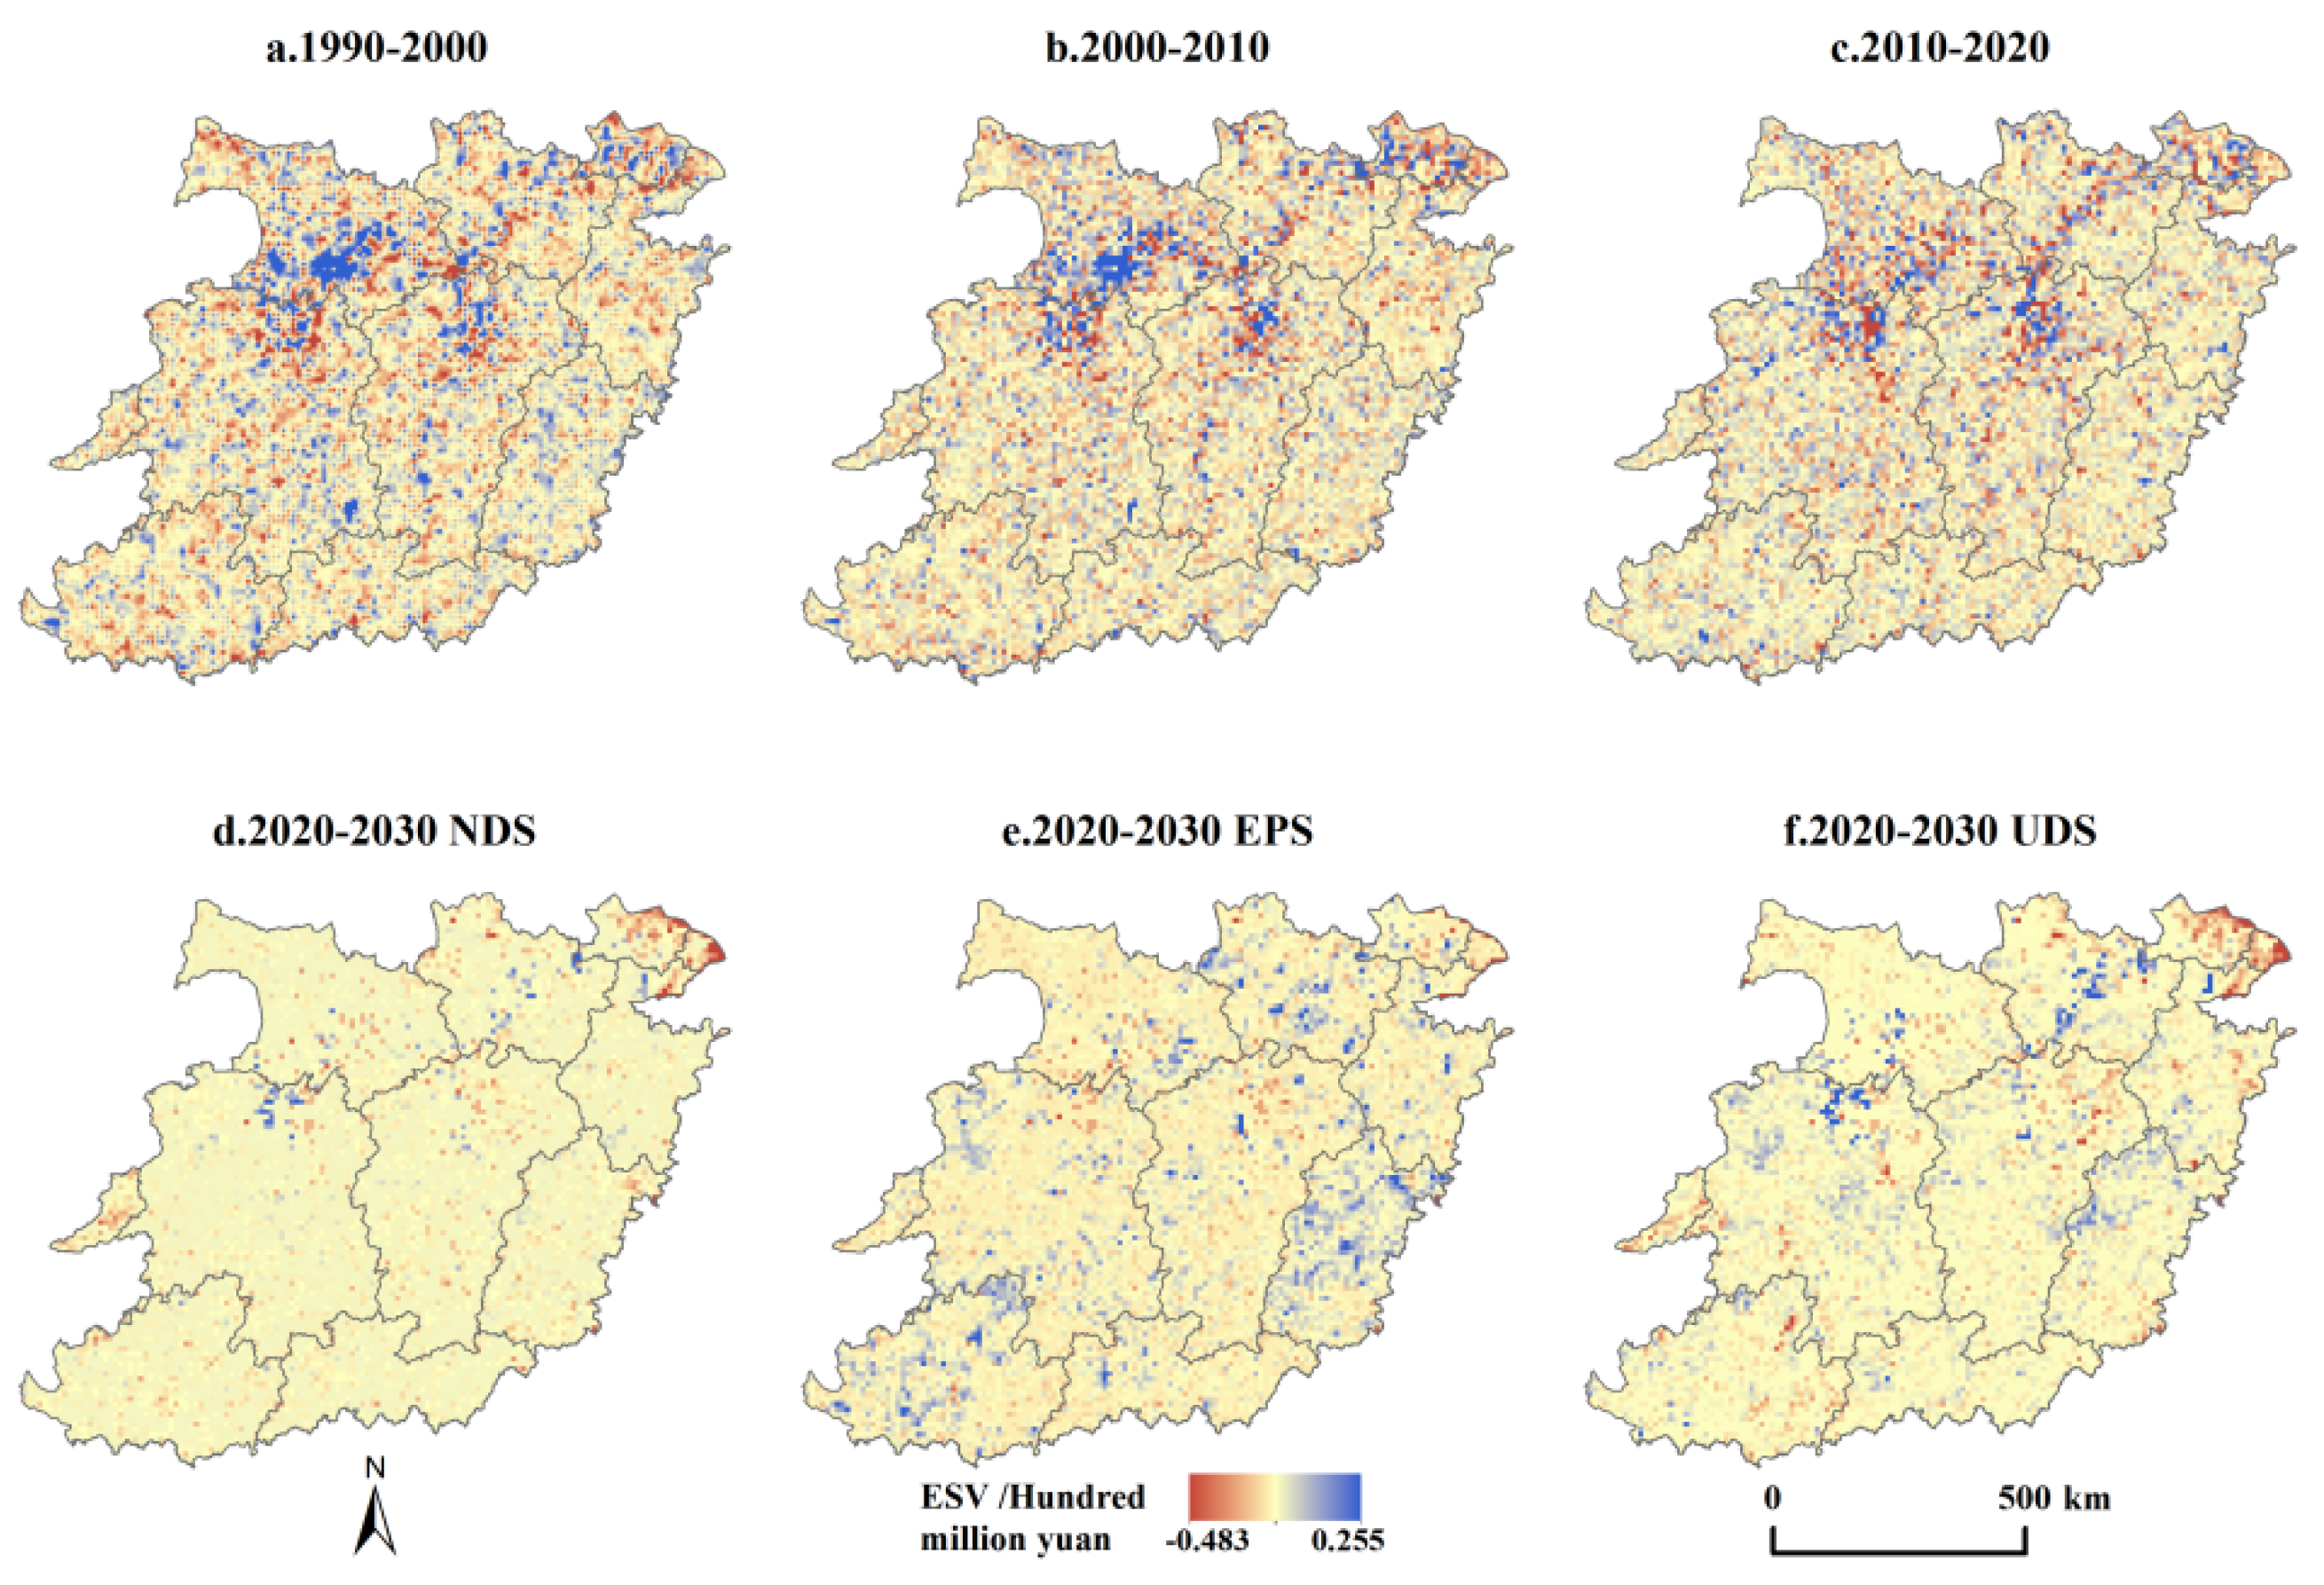
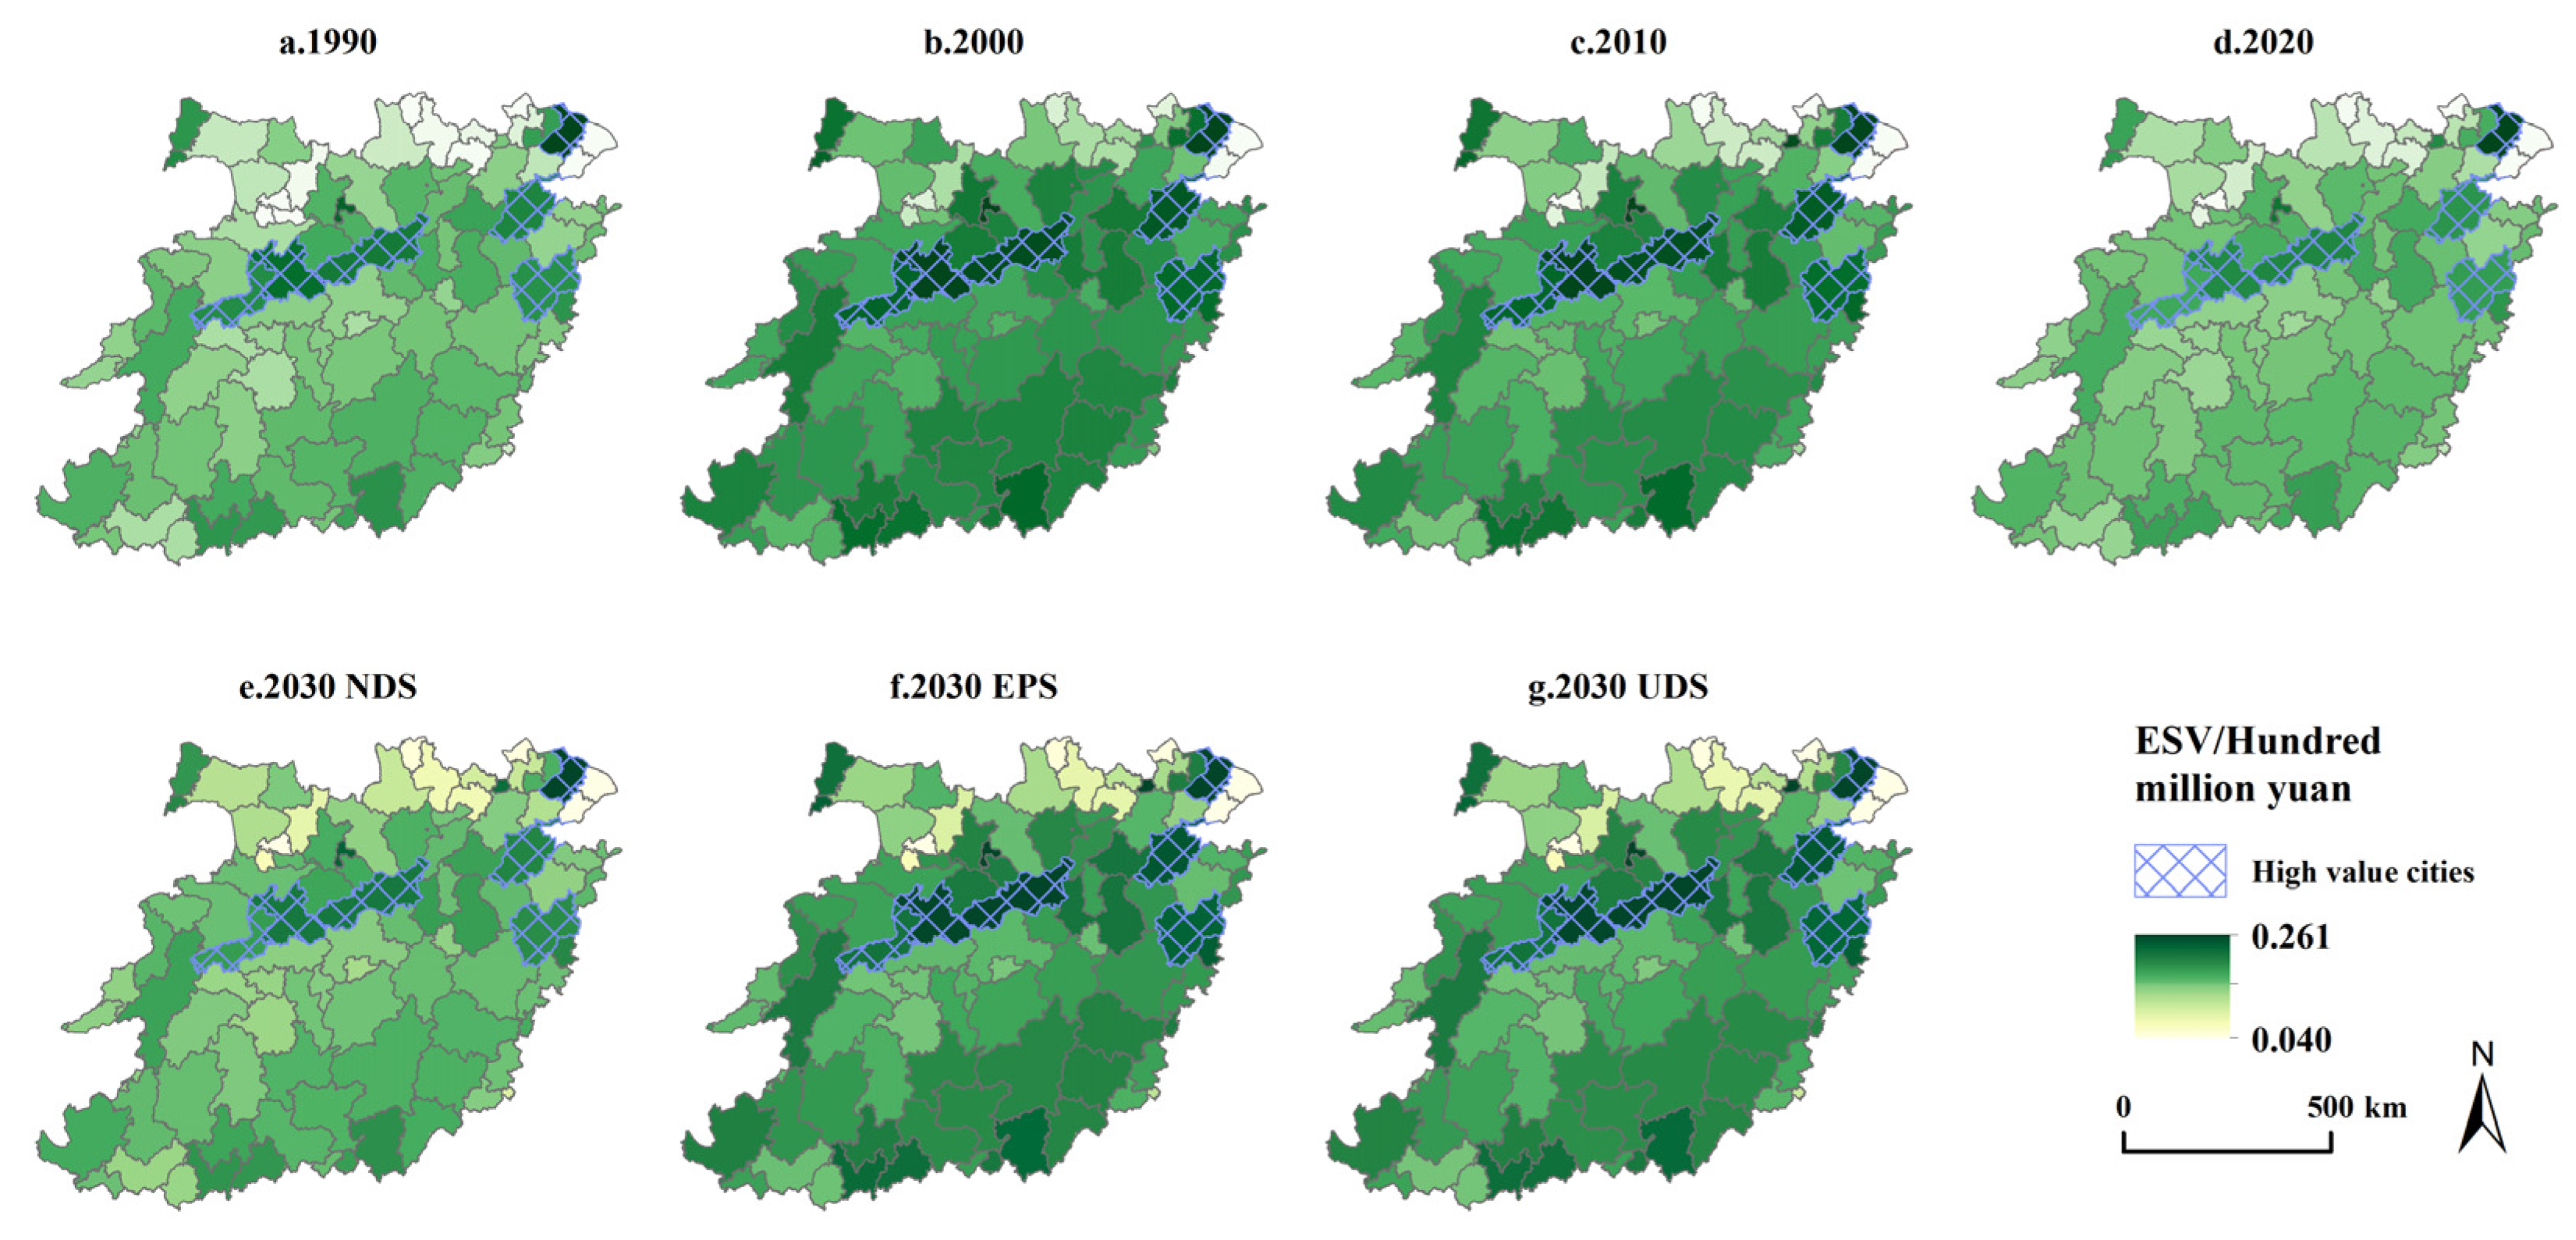
3.2. Multi-Scenario Modeling of Spatial and Temporal Changes in ESV

The spatial and temporal distribution differences in ESV in the southern hilly mountainous region are evident across different years and forecast scenarios at the municipal level (Figure 4). Overall, cities in the western part of the study area, such as Yueyang and Yiyang; central cities such as Jiujiang, northeastern city Suzhou; and eastern cities such as Hangzhou and Lishui tend to exhibit higher ESV distributions compared to other urban areas. From 1990 to 2010, ESV showed a general increasing trend year by year, with some cities in the northern part of the study area (e.g., Huainan, Hefei, and Wuhu) transitioning from lower ESV values to the median. In the period from 2010 to 2020, the overall ESV in the study area significantly decreased, except for Suzhou in the northeast, which retained the highest ESV, and the ESV of other cities dropped to the median range. From 2020 to 2030, under the NDS scenario, the overall trend in ESV changes is not significant, but under the EPS and UDS scenarios, there is a noticeable increase in overall ESV, indicating that both EPS and UDS scenarios contribute, to some extent, to the ecological restoration of the ecosystem.
The grid scale allows for a more detailed representation of the spatiotemporal variations in ESV (Figure 5). From 1990 to 2020, the ESV around Wuhan in the northern and around Nanchang in the central of the study area showed significant polarization, with noticeable net increases and decreases. The net increase in area was significantly higher than the net decrease in area from 1990 to 2010, with a net increase in area of around 30% in both 1990–2000 and 2000–2010 (Figure 4). From 2010 to 2020, the proportion of net increase in area decreased to 15%, significantly lower compared to 1990–2010, which was roughly equivalent to the net decrease in the area. From 2020 to 2030, under the NDS scenario, the ESV in the overall study area achieved basic equilibrium, showing no significant net change trend. In the EPS scenario, there are more areas of net increase in ESV across the study area (an increase of approximately 8916 km2). In the UDS scenario, the net increase in the area decreased in the central, southwestern, southern, and eastern parts of the study area, with a noticeable net decrease in the northeastern part.

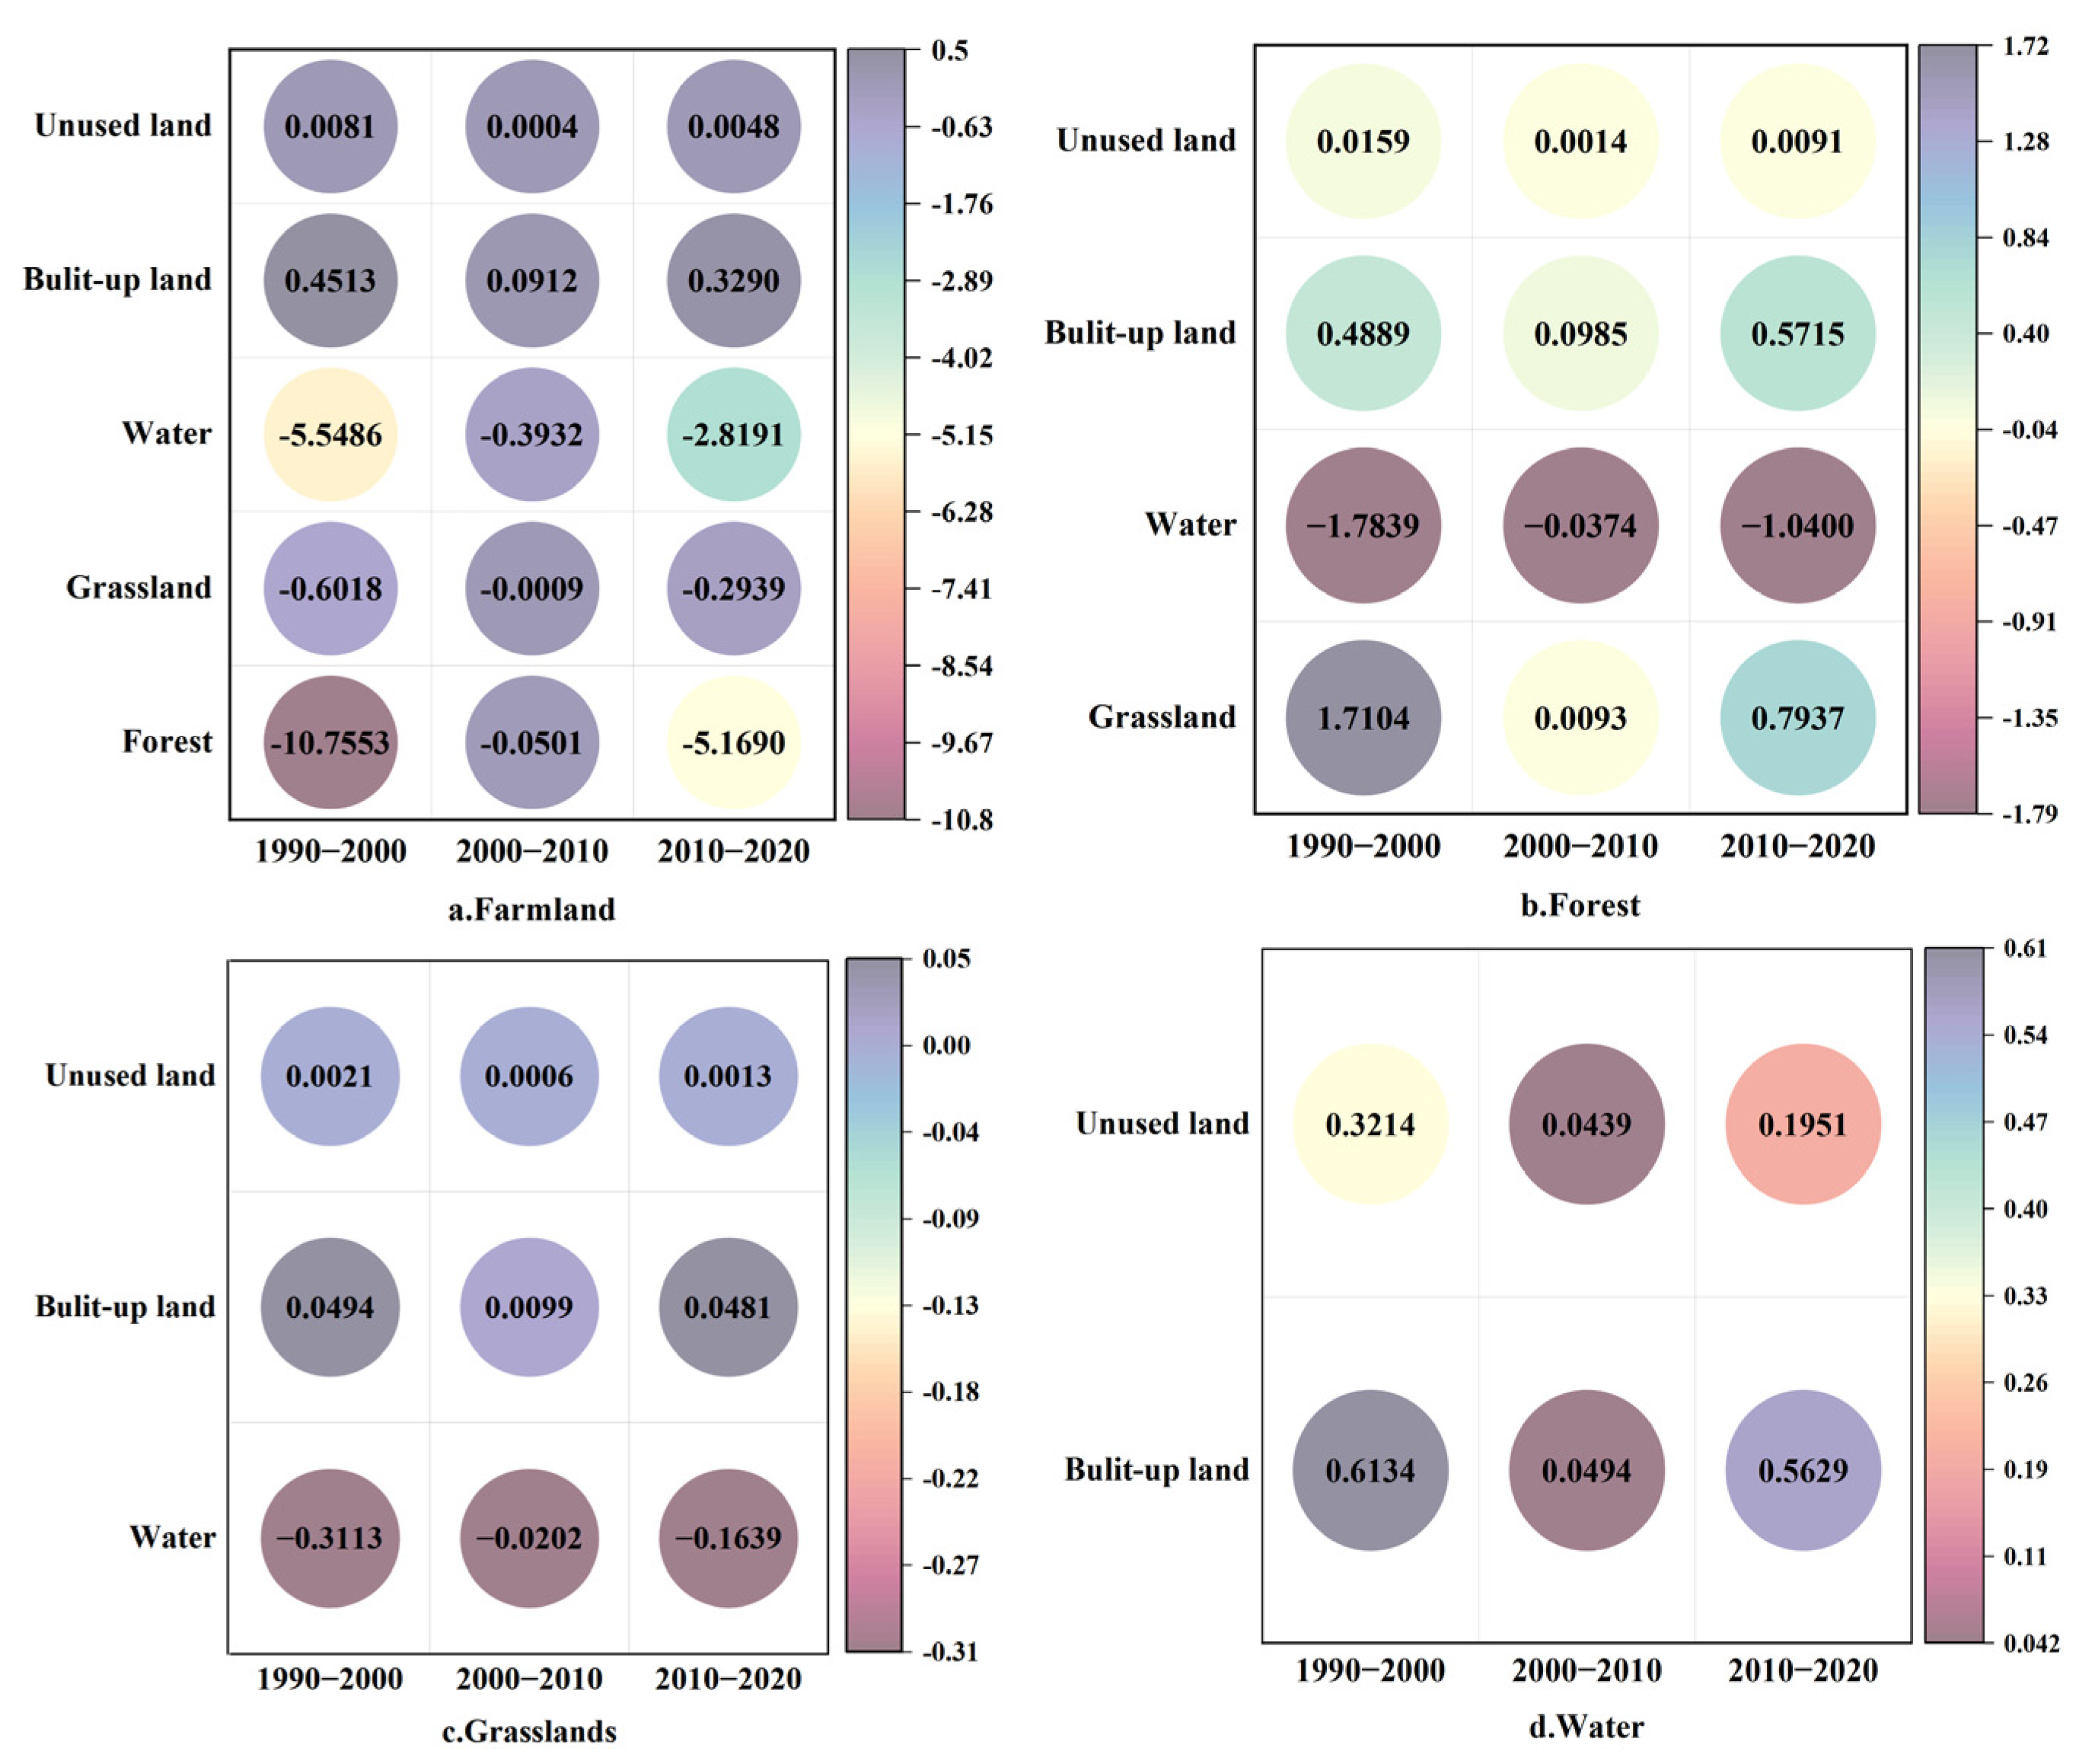
3.3. Impact of Land Use Change on ESV

Due to the bidirectional symmetry of land type conversion and the scenario settings in 2030, which resulted in zero conversion areas for some land use types, the calculated CICS results are zero. Therefore, only the unidirectional CICS from 1990 to 2020 is presented (Figure 6). From 1990 to 2000, the CICS for the conversion of forest and water bodies to cultivated land was the highest, indicating high sensitivity of ESV to this type of transition, and such transitions exert a strong inhibitory effect on the development of ESV in the study area. From 2000 to 2010, except for conversions between farmland and water, the absolute values of CICS for other types of land use transitions in the study area were all less than 0.1. This indicates that during this period, there were no significant changes in land use types overall within the study area, and they did not significantly affect the ESV. In the period 2010–2020, the absolute values of CICS for the conversion of forest and water bodies to farmland, as well as water bodies to forest, were relatively high. This indicates that ESV is highly sensitive to these types of conversions, and such transitions exert a strong inhibitory effect on the development of ESV.

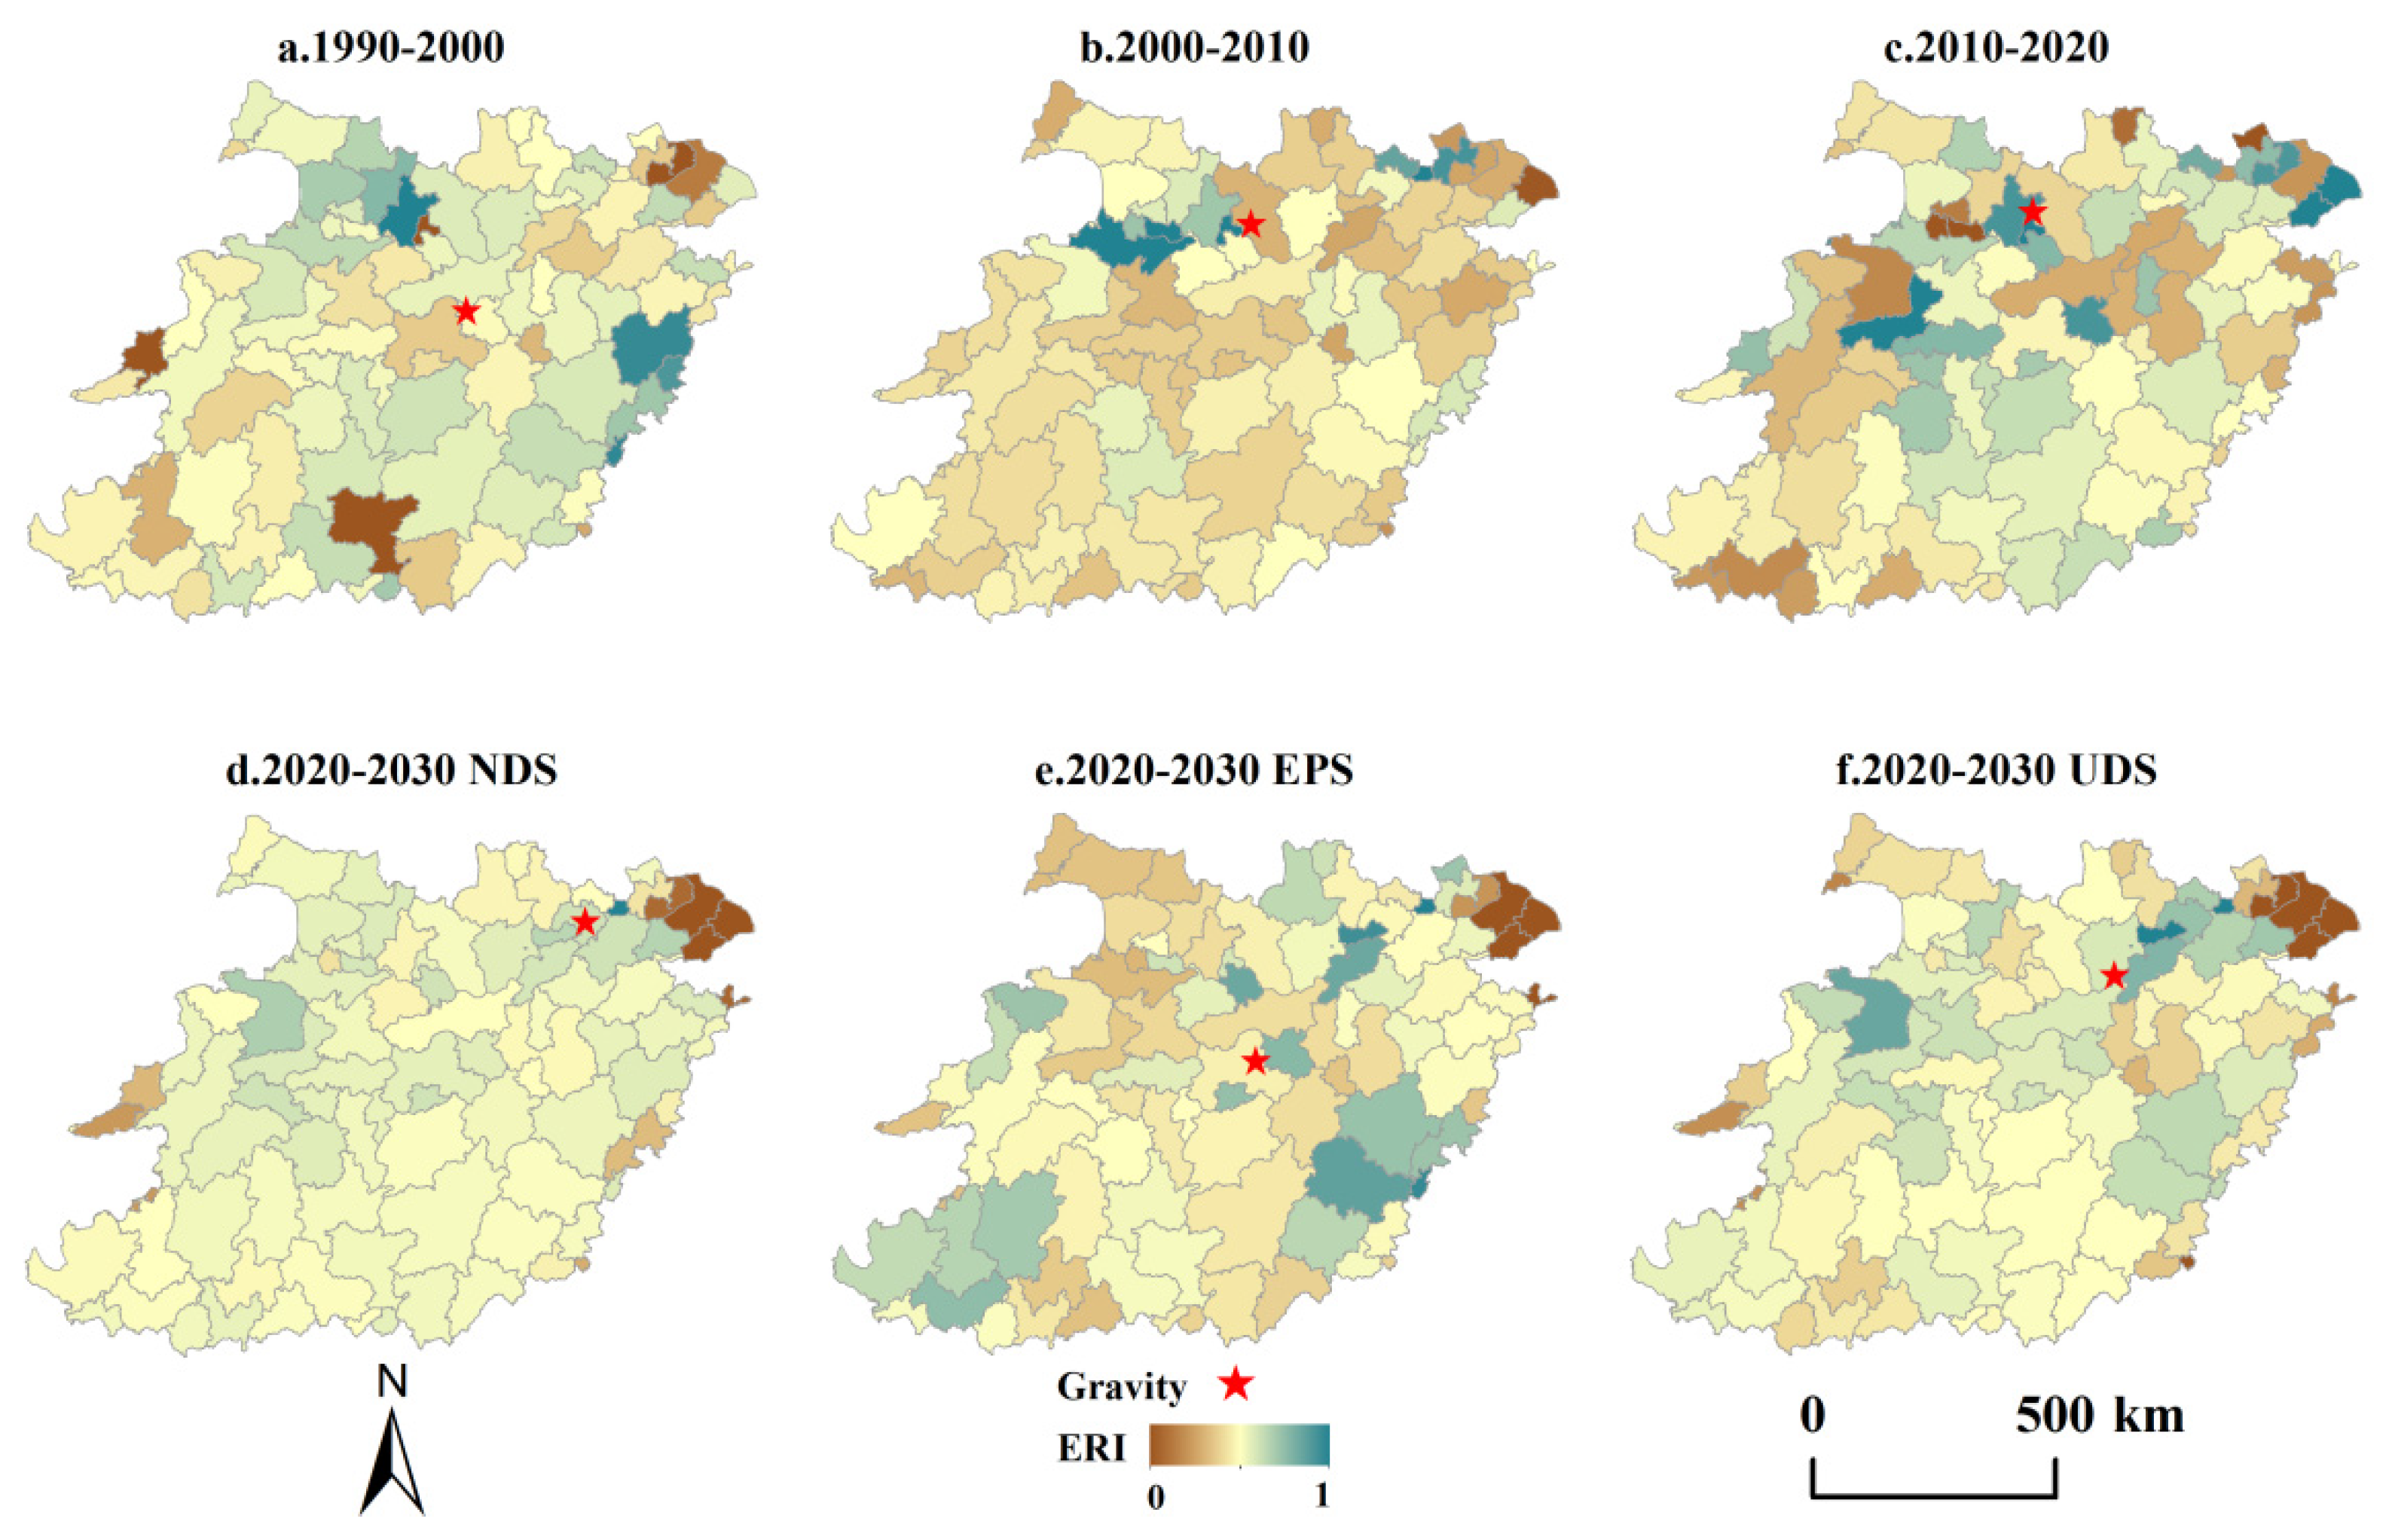
3.4. Ecological Risk Assessment in Different Scenarios

From 1990 to 2000, the ecosystem risk index (ERI) was relatively high in the northern part of the study area, including cities such as Wuhan, Tianmen, and Xiaogan. Additionally, the eastern part of the study area, particularly Lishui in Zhejiang Province, showed elevated ERI values (Figure 7). Suzhou and Shanghai in the northeast, Tongren in Guizhou province in the west, and Shaoguan in Guangdong province in the south exhibited the lowest ERI values, while other regions had moderate ERI levels. Between 2000 and 2010, there were no clear low ERI zones, except for Shanghai in the northeast, where ERI values were comparatively lower. Wuxi and Taizhou in the northeast and Yichang and Qianjiang in the north had higher ERI values during this period. From 2010 to 2020, the study area witnessed the emergence of large areas with high ERI values, primarily concentrated in the west, central, and southwest regions. Low ERI zones were mainly found in Yiyang in the west and Jiaxing in the southeast. In the NDS scenario from 2020 to 2030, the overall ERI in the study area remained moderate, with only Suzhou and Shanghai in the northeast exhibiting noticeable low ERI values. Under the EPS scenario from 2020 to 2023, there were numerous areas with high ERI values, concentrated in the northern cities of Chizhou and Tongling, the southwestern Guangxi Zhuang Autonomous Region, and the eastern cities of Nanping, Sanming, and Longyan. Comparatively, under the UDS scenario, the ERI values in the study area significantly decreased, with only Changde in the west and Chizhou, Tongling, and Wuhu in the north maintaining higher ERI values than the rest of the region.
The center of high ERI was located in Nanchang, Jiangxi province, from 1990 to 2000. By 2000–2010, the high-risk center of ERI shifted northwestward to Huanggang, Hubei Province. From 2010 to 2020, this center further moved westward to Wuhan, Hubei Province. Over different periods, factors such as agricultural expansion, changes in land use, variations in climate factors such as temperature and rainfall, and different policy and management measures can impact the health of ecosystems, leading to the migration of the high-risk center of ERI. In the scenarios from 2020 to 2030, distinct differences are observed in the distribution of the high-risk center of ERI. Under the NDS scenario, the ERI high-risk center is located in Wuhu, Anhui Province. In the EPS scenario, the high-risk center is situated in Yichun, Jiangxi Province. Meanwhile, under the UDS scenario, the center is found in Anqing, Anhui Province. Population growth, economic development, and policy changes collectively contribute to the variations in the high-risk center of ERI under different scenarios.

4. Discussion

4.1. Factors Influencing LUC in the Southern Hilly Region

The PLUS model employed the random forest algorithm to investigate the dynamic changes in land use in the southern hilly areas. The goal was to determine the relative impact of various factors on LUCs. Each driver exhibited significant differences in its contribution to LUCs (Figure 8). Population density emerged as the primary factor influencing changes in the farmland area, contributing 16.8%. Additionally, the digital elevation model (DEM) emerged as a crucial factor limiting changes in farmland area, accounting for 13.4% of the total. Annual average precipitation exhibited the greatest contribution (19.0%) to changes in forest area, followed by elevation (11.6%) and slope (11.6%). Annual average precipitation plays a crucial role in vegetation growth and the functioning of forest ecosystems. The varied topography of the southern hilly areas, with significant elevation changes, favors forest growth, while different slopes may lead to soil erosion issues, impacting the formation and stability of forests. For changes in grassland area, annual average precipitation also made the highest contribution (15.4%), followed by DEM (14.8%) and per capita GDP (14.7%), which played important roles in grassland area changes. Topography has a significant impact on factors such as moisture distribution, soil types, and hydrological processes, and different topographies may have a significant impact on the growth and distribution of grasslands. For example, flatter regions may favor the formation and growth of grasslands, while steep terrain may limit the expansion of grasslands. Economic activities may also influence land use and management, with factors such as agricultural development and urbanization potentially changing land cover types and, consequently, affecting the area and distribution of grasslands. DEM (19.1%), slope (13.1%), and annual average temperature (12.3%) had a significant influence on changes in water body area. Topography affects the formation and distribution of water bodies, slope influences water flow and the formation of rivers, and temperature plays a role in the evaporation and melting processes of water bodies. Changes in built-up land area are primarily influenced by population density (27.5%), slope (11.0%), and per capita GDP (10.6%). Areas with high population density often require more residential, commercial, and infrastructure development, making regions with a high population density more prone to an increase and change in built-up land. Steeper slopes may restrict the construction of buildings and infrastructure, reducing the likelihood of land being used for construction. Relatively gentle terrain is more conducive to development, resulting in a relatively smaller impact on built-up land. Regions with higher levels of economic development may attract more investment and demand, leading to land being used for construction and development. Changes in unused land area are primarily influenced by per capita GDP (17.9%), annual average precipitation (15.2%), and population density (15.1%). An increase in the economic development level of a region may imply that more land is developed and utilized, transforming it into construction or agricultural land. Regions with abundant precipitation may find it easier to engage in agricultural development or ecological conservation, while areas with less precipitation may have more unused land. Areas with a high population density may face greater urbanization demands and land use pressure, making them more inclined to utilize unused land to meet the demands of population growth and urban expansion.

4.2. Uncertainty Assessment of Ecological Risks

When assessing ecological risks associated with predicting LUCs and ecosystem services, uncertainty becomes a crucial and challenging aspect. LUCs themselves exhibit diversity and complexity. Different types of land use transitions may have varying impacts on ecosystems, and these impacts may vary over time and space. When evaluating their influence on ecological risks, this diversity must be taken into account, and efforts must be made to understand the patterns of their impact on ecosystem services. An increase in farmland may trigger issues such as soil erosion, loss of wildlife habitats, and water pollution. The concentrated conversion of other land types into water bodies may negatively impact aquatic ecosystems, resulting in wetland loss and reduced water resources. The expansion of built-up land may trigger ecosystem fragmentation, loss of biodiversity, and land cover issues. The temporal and spatial heterogeneity of land use changes in different scenarios may lead to the instability of ecosystem services. Different changes in different regions may have various effects on local ecosystems, including but not limited to the loss of biodiversity, soil erosion, and disruption of ecological balance. For instance, under the NDS scenario, a decrease in the area of forest and grassland may lead to weakening of ecosystem services, including a reduction in biodiversity, a decrease in natural land cover, and potential issues related to soil erosion. Under the EPS scenario, an increase in the area of forest and grassland may positively impact ecosystem services, enhancing biodiversity, improving natural land cover, and reducing the risk of soil erosion. Under the UDS scenario, an increase in the area of built-up land may result in increased pressure on ecosystem services, including the compression of natural habitats, disruption of ecological balance, and overexploitation of land resources. These changes may lead to the instability of ecosystem services in different regions, potentially causing issues such as loss of biodiversity, soil erosion, and disruption of ecological balance. A comprehensive assessment of the impacts under different scenarios contributes to a better understanding and management of the influence of land use changes on ecosystem services.
The correlation between ESV and LUCs contributes to increased uncertainty in ecological risks. The response of ESV may exhibit diversity due to the complexity of the internal structure and functions of ecosystems. ESV demonstrates complex temporal and spatial variations under different years and forecast scenarios. This indicates that the impact of LUCs on ESV is not fixed but rather a complex process influenced by multiple factors. The increasing trend in ESV from 1990 to 2010 may be attributed to the implementation of environmental protection policies or ecological restoration projects during that period. These measures may include activities such as reforestation, wetland conservation, and water resource management, contributing to the enhancement of ecosystem service values. The overall decline in ESV from 2010 to 2020 could be linked to accelerated urbanization, industrial expansion, or excessive land development, leading to the loss of ecological functions and a decline in ecosystem services. The ESV increase under different scenarios from 2020 to 2030 may be associated with policy adjustments. The EPS scenario may involve more ecological conservation measures, promoting ESV enhancement, while the UDS scenario may relax land use policies, resulting in a decline in ESV in certain regions. The differences in ESV net increase or decrease between regions under EPS and UDS scenarios may stem from different policy orientations. EPS may prioritize ecological protection and restoration, while UDS may emphasize economic development, leading to divergent trends in ESV changes across different regions. The variations in the impact of different land use types on ESV at different time periods may arise from differences in environmental vulnerability. For instance, the conversion of forest and water bodies into cultivated land in the early stages may significantly disrupt ecosystems, while the impacts of such conversions may become more sensitive in later stages as environmental vulnerability decreases. The influence of LUCs on ESV does not follow a single fixed pattern but rather involves a complex process intertwined with various factors. Factors such as urbanization, agricultural development, and policy adjustments may lead to complex and diverse impacts on ESV, thereby increasing the temporal and spatial uncertainty in ESV changes.

4.3. Policy Recommendations and Outlook

Research indicates that the spatiotemporal variations in the ERI in the southern hilly areas exhibit significant uncertainty. From 1990 to 2010, the distribution of ERI values was relatively balanced, with only a few regions showing distinct high or low values. This reflected the relative stability of ecosystems in the study area, with fewer severe ecological risk threats at that time. From 2010 to 2020, the emergence of large areas with increased high values and some low-value areas was attributed to factors such as urban expansion, LUCs, or intensified environmental pressures. This shift may suggest that ecosystem stability faced new challenges and threats during this period. In 2030, under different scenarios, variations in the distribution of ERI values are predicted to be observed, especially under the EPS and UDS scenarios. Under the EPS scenario, there are more areas with high values, indicating more severe ecological risks. This suggests that when the conversion of forests, farmlands, and water is excessively protected and restricted, it may increase some new ecological risks, such as unmanaged forests increasing the risk of wildfires, poorly managed farmlands facing the risk of soil degradation, and an increase in forest cover leading to intensified internal competition among species, disrupting ecological balance, among others. Therefore, only adopting moderate ecological protection measures can reduce ecological risks. The overall decrease in ERI values under the UDS scenario may be due to the influence of environmental policies or management measures. The differences in ERI values between different regions indicate inconsistent levels of ecological risk. Regions in the western, central, and southwestern areas may face more severe ecological pressure, while the eastern and northeastern regions remain relatively stable. In the EPS scenario, some regions experience high risk, possibly due to increased environmental pressure resulting from development policies in this scenario. In contrast, under the UDS scenario, the decrease in ERI values may reflect improvements in environmental management policies. These uncertainties arise from the interweaving of various factors such as environmental policies, economic development, and human activities during different time periods. Different policy orientations may have drastically different impacts on ecosystems, leading to increased uncertainty in ERI. For areas with high ERI, implementing stricter environmental protection policies and regulatory measures, strengthening pollution control, and ecological restoration are recommended. For relatively stable areas, emphasis can be placed on ecological protection and sustainable utilization. Measures should be taken to address ERI changes caused by urban expansion and land use changes, focusing on the protection and restoration of affected ecosystems. Strengthening land planning and management to ensure the sustainability and ecological balance of land use is essential. Establishing a comprehensive environmental monitoring system and early warning mechanism allows real-time tracking of ecosystem changes, enabling timely actions to prevent the deterioration of ecosystems in high-risk areas. Ensuring the coordination of environmental policies with economic development policies is crucial to avoid environmental damage during the process of economic growth [71]. Promoting green technological innovation and sustainable economic models can achieve a win–win situation for both the environment and the economy. Facilitating cooperation among regional governments in the southern hilly areas is vital to jointly address ecological environmental issues, share successful experiences, and implement best practices for cross-regional environmental protection and management [72]. Policymaking needs to consider the vastly different impacts that different policy orientations may have on ecosystems. Therefore, ensuring the scientific and stable nature of environmental governance policies is of paramount importance.
In the northern part of the southern hilly areas, where there is a higher rate of deforestation, it is imperative to establish strict forest protection zones and afforestation plans. This is particularly crucial in regions such as Wuhan, Tianmen, and Xiaogan, where efforts should be intensified in the management and protection of forest resources. Encouraging farmers to adopt organic farming methods to reduce the use of chemical pesticides and fertilizers is especially important to preserve soil quality, given the significant conversion of farmland in this region. In the eastern part of the southern hilly areas, especially in areas with a higher conversion of water bodies, stringent control of pollutant emissions, enhanced water resource management, and rational planning of water use methods are necessary to protect aquatic ecosystems. In areas with higher ESV, promoting the development of eco-tourism and green industries is encouraged to boost the local economic income while simultaneously safeguarding the environment. In regions with increased built-up land, such as Changde in the west, it is essential to formulate strict land-use plans to avoid excessive development and construction, thereby protecting the ecological environment. Given the higher ecological risks in the western regions, implementing ecological restoration projects, including afforestation and soil erosion prevention, can help improve the ecological conditions. For areas with lower ESV, such as Yiyang in the south, efforts should be intensified for ecological restoration to enhance ESV, employing measures such as wetland conservation and soil conservation. Promoting sustainable agriculture by reducing the use of pesticides and fertilizers, strengthening farmland environmental protection, and ensuring soil quality is crucial. Tailoring scientifically sound environmental protection plans based on the characteristics of each region, integrating policy resources, and fostering a balance between ecological protection and economic development is essential.
Future efforts should focus on the sustainability of ecosystems. By implementing rational land use and management practices along with environmental protection policies, it is anticipated that ecological risks can be reduced, promoting the recovery and healthy development of ecosystems. Tailoring more precise regional governance strategies based on the results of LUCs and ecological risk assessments in different regions will help achieve ecological balance and protect or restore threatened ecosystems. Establishing a robust monitoring and early warning mechanism is critical. With continuous changes in land use and environmental pressures, ongoing monitoring of the status of ecosystems and early warning of potential ecological risks are necessary for timely intervention. Recognizing the uncertainty of environmental risks and ecosystem changes under different scenarios, future environmental policies should prioritize flexibility and adaptability [72]. These policies need to be quickly adjusted to new circumstances while maintaining a focus on the protection and restoration of ecosystems. Additionally, promoting cooperation and information sharing among different regions in the southern hilly areas is essential to achieve a comprehensive understanding of ecosystem changes for more extensive environmental protection and management [73]. Encouraging scientific research and technological innovation to address environmental issues and enhance the resilience of ecosystems is crucial. Investing in research and technology development helps discover new solutions and tools, providing more possibilities for ecological protection and restoration. Additionally, this study pays little attention to the significant ecological risks brought about by urbanization and impervious surface growth, which is an area with academic prospects and research gaps that need to be filled. In future research, it will be important to focus on and delve into this issue. Furthermore, the scenario settings in this study may not be comprehensive, presenting limitations. Therefore, in future research, it is necessary to comprehensively consider these factors to improve the comprehensiveness, thus better assessing ecosystem risks and changes.
Ensuring accurate assessment of ecosystem risks and changes is crucial for establishing a comprehensive national management approach [74,75]. Close cooperation mechanisms should be established among government departments, including environmental, urban, and rural planning, agriculture, and forestry departments, to ensure integrated management and coordinated implementation of ecosystem risks [76]. Additionally, sound ecosystem risk monitoring and early warning mechanisms should be established to promptly identify ecological environmental problems and risks, and effective measures should be taken to address and handle them [77]. Actively participating in international cooperation, drawing lessons from and learning about international experiences, jointly addressing global ecological environmental challenges, and promoting the sustainable management and protection of global ecosystems are crucial.

5. Conclusions

In this study, a spatial and temporal analysis of LUC data in the southern hilly areas based on multi-scenario simulations was conducted to assess the evolution of ESV and evaluate the uncertainty of ecological risks. The main conclusions are as follows: in the study area, forests had the highest proportion of LUC, ranging from 56% to 58% during the period from 1990 to 2030, followed by farmland, which accounted for 27% to 31%. In the northern and northeastern provinces, there was significant conversion of land types to farmland, while some cities in the western and central regions experienced the transformation of land types into built-up land. In the northeast, there was a notable conversion of land types to water bodies and built-up land. ESV exhibited spatial and temporal distribution differences at the municipal level in different years and forecast scenarios, with some cities in the western and central regions generally showing a higher ESV distribution. From 1990 to 2010, ESV showed an overall increasing trend year by year, but from 2010 to 2020, there was a general decline. In the period from 2020 to 2030, under the EPS and UDS scenarios, ESV showed a clear increasing trend, while under the NDS scenario, it remained relatively stable. The conversion of forests and water bodies into farmland had a strong inhibitory effect on ESV. From 1990 to 2000, areas in the northern part of the study region, including Wuhan, and in the eastern part, including Lishui, had higher ecological risks. From 2010 to 2020, overall ecological risks increased, mainly distributed in the western, central, and southwestern regions, with Yiyang in the west and Jiaxing in the southeast being lower-risk areas. In the period from 2020 to 2030, under the NDS scenario, the overall ecological risks were moderate, while under the EPS scenario, areas in the north, such as Chizhou, had higher ecological risks. Under the UDS scenario, ecological risk values significantly decreased, especially in Changde in the west. In the future, different scenarios of LUC will have a significant impact on ESV and ecological risks. Therefore, when formulating sustainable development strategies, a comprehensive consideration of land-use planning and ecological protection measures is necessary to promote the sustainable development of ecosystems.
In terms of ESV assessment, this study provides a reference basis for the design of ecological compensation mechanisms. By evaluating the ESV of different land use types, governments can better implement ecological compensation policies to promote the coordination of ecological protection and economic development. Assessing ecological risks is essential for forecasting and managing them. The research results reveal the distribution of ecological risks in different regions and scenarios, providing important references for ecological environmental management in relevant areas. This study expands our understanding of the impact of LUCs on ESV and ecological risks. By delving into the effects of land use type conversions on ESV, the inhibitory effect of forest and water area conversion to farmland on ESV was revealed. This finding provides theoretical support for a deeper understanding of the impact of LUC on ecosystem functions, with implications for future related research. The study provides important clues for understanding the impact of LUC on ecosystems in southern hilly regions, offering a theoretical basis and practical guidance for future sustainable development strategies. Particularly in scenarios of uncertainty, comprehensive consideration of land use planning and ecological conservation measures will contribute to advancing the sustainable development of ecosystems in the region.

Author Contributions

Conceptualization, methodology, software, formal analysis, data curation and writing—original draft, C.Y.; conceptualization, resources, H.Q.; conceptualization, resources, S.Z.; writing—review and editing, visualization, supervision, project administration, funding acquisition, L.G. All authors have read and agreed to the published version of the manuscript.

Funding

This research was funded by the National Key Research and Development Program of China (2022YFF1303001).

Data Availability Statement

Data available on request due to restrictions. The data presented in this study are available on request from the corresponding author. The data are not publicly available due to privacy and anonymity.

Conflicts of Interest

The authors declare that they have no known competing financial interests or personal relationships that could have appeared to influence the work reported in this paper.

References

  1. Bing, Z.H.; Qiu, Y.S.; Huang, H.P.; Chen, T.Z.; Zhong, W.; Jiang, H. Spatial distribution of cultural ecosystem services demand and supply in urban and suburban areas: A case study from Shanghai, China. Ecol. Indic. 2021, 127, 107720. [Google Scholar] [CrossRef]
  2. Cai, W.B.; Jiang, W.; Du, H.Y.; Chen, R.S.; Cai, Y.L. Assessing Ecosystem Services Supply-Demand (Mis)Matches for Differential City Management in the Yangtze River Delta Urban Agglomeration. Int. J. Environ. Res. Public Health 2021, 18, 8130. [Google Scholar] [CrossRef] [PubMed]
  3. Chen, F.Y.; Li, L.; Niu, J.Q.; Lin, A.W.; Chen, S.Y.; Hao, L. Evaluating Ecosystem Services Supply and Demand Dynamics and Ecological Zoning Management in Wuhan, China. Int. J. Environ. Res. Public Health 2019, 16, 2332. [Google Scholar] [CrossRef] [PubMed]
  4. Lin, J.Y.; Huang, J.L.; Prell, C.; Bryan, B.A. Changes in supply and demand mediate the effects of land-use change on freshwater ecosystem services flows. Sci. Total Environ. 2021, 763, 143012. [Google Scholar] [CrossRef] [PubMed]
  5. Mashizi, A.K.; Sharafatmandrad, M. Investigating tradeoffs between supply, use and demand of ecosystem services and their effective drivers for sustainable environmental management. J. Environ. Manag. 2021, 289, 112534. [Google Scholar] [CrossRef] [PubMed]
  6. Meng, Q.X.; Zhang, L.K.; Wei, H.J.; Cai, E.X.; Xue, D.; Liu, M.X. Linking Ecosystem Service Supply-Demand Risks and Regional Spatial Management in the Yihe River Basin, Central China. Land 2021, 10, 843. [Google Scholar] [CrossRef]
  7. Metzger, J.P.; Villarreal-Rosas, J.; Suarez-Castro, A.F.; Lopez-Cubillos, S.; Gonzalez-Chaves, A.; Runting, R.K.; Hohlenwerger, C.; Rhodes, J.R. Considering landscape-level processes in ecosystem service assessments. Sci. Total Environ. 2021, 796, 149028. [Google Scholar] [CrossRef] [PubMed]
  8. Rau, A.L.; Burkhardt, V.; Dorninger, C.; Hjort, C.; Ibe, K.; Kessler, L.; Kristensen, J.A.; McRobert, A.; Sidemo-Holm, W.; Zimmermann, H.; et al. Temporal patterns in ecosystem services research: A review and three recommendations. Ambio 2020, 49, 1377–1393. [Google Scholar] [CrossRef]
  9. Shi, Y.S.; Shi, D.H.; Zhou, L.L.; Fang, R.B. Identification of ecosystem services supply and demand areas and simulation of ecosystem service flows in Shanghai. Ecol. Indic. 2020, 115, 106418. [Google Scholar] [CrossRef]
  10. Shui, W.; Wu, K.X.; Du, Y.; Yang, H.F. The Trade-Offs between Supply and Demand Dynamics of Ecosystem Services in the Bay Areas of Metropolitan Regions: A Case Study in Quanzhou, China. Land 2022, 11, 22. [Google Scholar] [CrossRef]
  11. Sun, R.; Jin, X.B.; Han, B.; Liang, X.Y.; Zhang, X.L.; Zhou, Y.K. Does scale matter? Analysis and measurement of ecosystem service supply and demand status based on ecological unit. Environ. Impact Assess. Rev. 2022, 95, 106785. [Google Scholar] [CrossRef]
  12. Wang, B.J.; Tang, H.P.; Zhang, Q.; Cui, F.Q. Exploring Connections among Ecosystem Services Supply, Demand and Human Well-Being in a Mountain-Basin System, China. Int. J. Environ. Res. Public Health 2020, 17, 5309. [Google Scholar] [CrossRef]
  13. Wang, L.J.; Zheng, H.; Wen, Z.; Liu, L.; Robinson, B.E.; Li, R.N.; Li, C.; Kong, L.Q. Ecosystem service synergies/trade-offs informing the supply-demand match of ecosystem services: Framework and application. Ecosyst. Serv. 2019, 37, 100939. [Google Scholar] [CrossRef]
  14. Chen, W.X.; Zeng, J.; Li, N. Change in land-use structure due to urbanisation in China. J. Clean. Prod. 2021, 321, 128986. [Google Scholar] [CrossRef]
  15. Mansour, S.; Al-Belushi, M.; Al-Awadhi, T. Monitoring land use and land cover changes in the mountainous cities of Oman using GIS and CA-Markov modelling techniques. Land Use Pol. 2020, 91, 104414. [Google Scholar] [CrossRef]
  16. Osborne, P.E.; Alvares-Sanches, T. Quantifying how landscape composition and configuration affect urban land surface temperatures using machine learning and neutral landscapes. Comput. Environ. Urban Syst. 2019, 76, 80–90. [Google Scholar] [CrossRef]
  17. Zheng, L.; Wang, Y.; Li, J.F. Quantifying the spatial impact of landscape fragmentation on habitat quality: A multi-temporal dimensional comparison between the Yangtze River Economic Belt and Yellow River Basin of China. Land Use Pol. 2023, 125, 106463. [Google Scholar] [CrossRef]
  18. Guo, L.J.; Liu, R.M.; Shoaib, M.; Men, C.; Wang, Q.R.; Miao, Y.X.; Jiao, L.J.; Wang, Y.F.; Zhang, Y. Impacts of landscape change on net primary productivity by integrating remote sensing data and ecosystem model in a rapidly urbanizing region in China. J. Clean. Prod. 2021, 325, 129314. [Google Scholar] [CrossRef]
  19. Pan, N.H.; Guan, Q.Y.; Wang, Q.Z.; Sun, Y.F.; Li, H.C.; Ma, Y.R. Spatial Differentiation and Driving Mechanisms in Ecosystem Service Value of Arid Region:A case study in the middle and lower reaches of Shule River Basin, NW China. J. Clean. Prod. 2021, 319, 128718. [Google Scholar] [CrossRef]
  20. Schirpke, U.; Tscholl, S.; Tasser, E. Spatio-temporal changes in ecosystem service values: Effects of land-use changes from past to future (1860–2100). J. Environ. Manag. 2020, 272, 111068. [Google Scholar] [CrossRef]
  21. Zhang, X.R.; Song, W.; Lang, Y.Q.; Feng, X.M.; Yuan, Q.Z.; Wang, J.T. Land use changes in the coastal zone of China’s Hebei Province and the corresponding impacts on habitat quality. Land Use Pol. 2020, 99, 104957. [Google Scholar] [CrossRef]
  22. Mascarenhas, A.; Haase, D.; Ramon, T.B.; Santos, R. Pathways of demographic and urban development and their effects on land take and ecosystem services: The case of Lisbon Metropolitan Area, Portugal. Land Use Pol. 2019, 82, 181–194. [Google Scholar] [CrossRef]
  23. Huang, C.B.; Zhao, D.Y.; Deng, L. Landscape pattern simulation for ecosystem service value regulation of Three Gorges Reservoir Area, China. Environ. Impact Assess. Rev. 2022, 95, 106798. [Google Scholar] [CrossRef]
  24. Zhang, F.; Yushanjiang, A.; Jing, Y.Q. Assessing and predicting changes of the ecosystem service values based on land use/cover change in Ebinur Lake Wetland National Nature Reserve, Xinjiang, China. Sci. Total Environ. 2019, 656, 1133–1144. [Google Scholar] [CrossRef]
  25. Yohannes, H.; Soromessa, T.; Argaw, M.; Dewan, A. Impact of landscape pattern changes on hydrological ecosystem services in the Beressa watershed of the Blue Nile Basin in Ethiopia. Sci. Total Environ. 2021, 793, 148559. [Google Scholar] [CrossRef]
  26. Rahman, M.M.; Szabó, G. Impact of Land Use and Land Cover Changes on Urban Ecosystem Service Value in Dhaka, Bangladesh. Land 2021, 10, 793. [Google Scholar] [CrossRef]
  27. Solomon, N.; Segnon, A.C.; Birhane, E. Ecosystem Service Values Changes in Response to Land-Use/Land-Cover Dynamics in Dry Afromontane Forest in Northern Ethiopia. Int. J. Environ. Res. Public Health 2019, 16, 4653. [Google Scholar] [CrossRef]
  28. Chen, X.; Yu, L.; Du, Z.R.; Xu, Y.D.; Zhao, J.Y.; Zhao, H.L.; Zhang, G.L.; Peng, D.L.; Gong, P. Distribution of ecological restoration projects associated with land use and land cover change in China and their ecological impacts. Sci. Total Environ. 2022, 825, 153938. [Google Scholar] [CrossRef] [PubMed]
  29. Marull, J.; Cunfer, G.; Sylvester, K.; Tello, E. A landscape ecology assessment of land-use change on the Great Plains-Denver (CO, USA) metropolitan edge. Reg. Environ. Chang. 2018, 18, 1765–1782. [Google Scholar] [CrossRef]
  30. Shifaw, E.; Sha, J.M.; Li, X.M.; Bao, Z.C.; Zhou, Z.L. An insight into land-cover changes and their impacts on ecosystem services before and after the implementation of a comprehensive experimental zone plan in Pingtan island, China. Land Use Pol. 2019, 82, 631–642. [Google Scholar] [CrossRef]
  31. Jin, Z.H.; Xiong, C.S.; Luan, Q.L.; Wang, F. Dynamic Evolutionary Analysis of Land Use/Cover and Ecosystem Service Values on Hainan Island. Int. J. Environ. Res. Public Health 2023, 20, 776. [Google Scholar] [CrossRef] [PubMed]
  32. Koo, H.; Kleemann, J.; Furst, C. Impact assessment of land use changes using local knowledge for the provision of ecosystem services in northern Ghana, West Africa. Ecol. Indic. 2019, 103, 156–172. [Google Scholar] [CrossRef]
  33. Solovjova, N.V. Ecological risk modelling in developing resources of ecosystems characterized by varying vulnerability levels. Ecol. Model. 2019, 406, 60–72. [Google Scholar] [CrossRef]
  34. Zhao, Z.N.; Zhang, T.Z. Ecological Risk Assessment of China’s Freshwater Ecosystems Applying the Relative Risk Model: Toward an Ecosystem-Based Water Management in China. Hum. Ecol. Risk Assess. 2013, 19, 296–316. [Google Scholar] [CrossRef]
  35. Li, R.L.; Yu, L.Y.; Chai, M.W.; Wu, H.L.; Zhu, X.S. The distribution, characteristics and ecological risks of microplastics in the mangroves of Southern China. Sci. Total Environ. 2020, 708, 135025. [Google Scholar] [CrossRef]
  36. Yan, J.X.; Li, G.; Qi, G.P.; Qiao, H.Q.; Nie, Z.G.; Huang, C.X.; Kang, Y.X.; Sun, D.Y.; Zhang, M.H.; Kang, X.; et al. Landscape ecological risk assessment of farming-pastoral ecotone in China based on terrain gradients. Hum. Ecol. Risk Assess. 2021, 27, 2124–2141. [Google Scholar] [CrossRef]
  37. Zhang, N.; Yuan, R.Y.; Jarvie, S.; Zhang, Q. Landscape ecological risk of China’s nature reserves declined over the past 30 years. Ecol. Indic. 2023, 156, 111155. [Google Scholar] [CrossRef]
  38. Zou, L.L.; Wang, Y.S.; Liu, Y.S. Spatial-temporal evolution of agricultural ecological risks in China in recent 40 years. Environ. Sci. Pollut. Res. 2022, 29, 3686–3701. [Google Scholar] [CrossRef] [PubMed]
  39. Chen, J.J.; Yang, Y.P.; Feng, Z.H.; Huang, R.J.; Zhou, G.Q.; You, H.T.; Han, X.W. Ecological Risk Assessment and Prediction Based on Scale Optimization-A Case Study of Nanning, a Landscape Garden City in China. Remote Sens. 2023, 15, 1304. [Google Scholar] [CrossRef]
  40. Garcia-Llamas, P.; Geijzendorffer, I.R.; Garcia-Nieto, A.P.; Calvo, L.; Suarez-Seoane, S.; Cramer, W. Impact of land cover change on ecosystem service supply in mountain systems: A case study in the Cantabrian Mountains (NW of Spain). Reg. Environ. Chang. 2019, 19, 529–542. [Google Scholar] [CrossRef]
  41. Gong, J.; Li, J.Y.; Yang, J.X.; Li, S.C.; Tang, W.W. Land Use and Land Cover Change in the Qinghai Lake Region of the Tibetan Plateau and Its Impact on Ecosystem Services. Int. J. Environ. Res. Public Health 2017, 14, 818. [Google Scholar] [CrossRef] [PubMed]
  42. Lin, X.; Wang, Z.T. Landscape ecological risk assessment and its driving factors of multi-mountainous city. Ecol. Indic. 2023, 146, 109823. [Google Scholar] [CrossRef]
  43. Zhang, D.; Dong, H. Understanding Arable Land Change Patterns and Driving Forces in Major Grain-Producing Areas: A Case Study of Sichuan Province Using the PLUS Model. Land 2023, 12, 1443. [Google Scholar] [CrossRef]
  44. Xu, W.J.; Song, J.X.; Long, Y.Q.; Mao, R.C.; Tang, B.; Li, B.J. Analysis and simulation of the driving mechanism and ecological effects of land cover change in the Weihe River basin, China. J. Environ. Manag. 2023, 344, 118320. [Google Scholar] [CrossRef] [PubMed]
  45. Lippe, M.; Rummel, L.; Gunter, S. Simulating land use and land cover change under contrasting levels of policy enforcement and its spatially-explicit impact on tropical forest landscapes in Ecuador. Land Use Pol. 2022, 119, 106207. [Google Scholar] [CrossRef]
  46. Lang, Y.Q.; Song, W. Quantifying and mapping the responses of selected ecosystem services to projected land use changes. Ecol. Indic. 2019, 102, 186–198. [Google Scholar] [CrossRef]
  47. Yu, Q.R.; Feng, C.C.; Shi, Y.; Guo, L. Spatiotemporal interaction between ecosystem services and urbanization in China: Incorporating the scarcity effects. J. Clean Prod. 2021, 317, 128392. [Google Scholar] [CrossRef]
  48. Van der Sluis, T.; Pedroli, B.; Frederiksen, P.; Kristensen, S.B.P.; Busck, A.G.; Pavlis, V.; Cosor, G.L. The impact of European landscape transitions on the provision of landscape services: An explorative study using six cases of rural land change. Landsc. Ecol. 2019, 34, 307–323. [Google Scholar] [CrossRef]
  49. Assefa, W.W.; Eneyew, B.G.; Wondie, A. The impacts of land-use and land-cover change on wetland ecosystem service values in peri-urban and urban area of Bahir Dar City, Upper Blue Nile Basin, Northwestern Ethiopia. Ecol. Process. 2021, 10, 39. [Google Scholar] [CrossRef]
  50. Mugiraneza, T.; Ban, Y.F.; Haas, J. Urban land cover dynamics and their impact on ecosystem services in Kigali, Rwanda using multi-temporal Landsat data. Remote Sens. Appl.-Soc. Environ. 2019, 13, 234–246. [Google Scholar] [CrossRef]
  51. Pelorosso, R.; Apollonio, C.; Rocchini, D.; Petroselli, A. Effects of Land Use-Land Cover Thematic Resolution on Environmental Evaluations. Remote Sens. 2021, 13, 1232. [Google Scholar] [CrossRef]
  52. Yang, Y.Y. Evolution of habitat quality and association with land-use changes in mountainous areas: A case study of the Taihang Mountains in Hebei Province, China. Ecol. Indic. 2021, 129, 107967. [Google Scholar] [CrossRef]
  53. Zhang, Z.P.; Xia, F.Q.; Yang, D.G.; Huo, J.W.; Wang, G.L.; Chen, H.X. Spatiotemporal characteristics in ecosystem service value and its interaction with human activities in Xinjiang, China. Ecol. Indic. 2020, 110, 105826. [Google Scholar] [CrossRef]
  54. Hu, Z.E.; Gong, J.J.; Li, J.X.; Li, R.J.; Zhang, Z.Y.; Zhong, F.L.; Wen, C.H. Valuing the coordinated development of urbanization and ecosystem service value in border counties. J. Clean. Prod. 2023, 415, 137799. [Google Scholar] [CrossRef]
  55. Bedla, D.; Halecki, W. The value of river valleys for restoring landscape features and the continuity of urban ecosystem functions-A review. Ecol. Indic. 2021, 129, 107871. [Google Scholar] [CrossRef]
  56. Peng, J.; Liu, Y.X.; Li, T.Y.; Wu, J.S. Regional ecosystem health response to rural land use change: A case study in Lijiang City, China. Ecol. Indic. 2017, 72, 399–410. [Google Scholar] [CrossRef]
  57. Shehab, Z.N.; Jamil, N.R.; Aris, A.Z.; Shafie, N.S. Spatial variation impact of landscape patterns and land use on water quality across an urbanized watershed in Bentong, Malaysia. Ecol. Indic. 2021, 122, 107254. [Google Scholar] [CrossRef]
  58. Shuangao, W.; Padmanaban, R.; Mbanze, A.A.; Silva, J.M.N.; Shamsudeen, M.; Cabral, P.; Campos, F.S. Using Satellite Image Fusion to Evaluate the Impact of Land Use Changes on Ecosystem Services and Their Economic Values. Remote Sens. 2021, 13, 851. [Google Scholar] [CrossRef]
  59. Paudyal, K.; Baral, H.; Bhandari, S.P.; Bhandari, A.; Keenan, R.J. Spatial assessment of the impact of land use and land cover change on supply of ecosystem services in Phewa watershed, Nepal. Ecosyst. Serv. 2019, 36, 100895. [Google Scholar] [CrossRef]
  60. Liang, X.; Guan, Q.F.; Clarke, K.C.; Liu, S.S.; Wang, B.Y.; Yao, Y. Understanding the drivers of sustainable land expansion using a patch-generating land use simulation (PLUS) model: A case study in Wuhan, China. Comput. Environ. Urban Syst. 2021, 85, 101569. [Google Scholar] [CrossRef]
  61. Huang, A.; Xu, Y.Q.; Liu, C.; Lu, L.H.; Zhang, Y.B.; Sun, P.L.; Zhou, G.Y.; Du, T.; Xiang, Y. Simulated town expansion under ecological constraints: A case study of Zhangbei County, Heibei Province, China. Habitat Int. 2019, 91, 101986. [Google Scholar] [CrossRef]
  62. Xie, G.D.; Zhang, C.X.; Zhen, L.; Zhang, L.M. Dynamic changes in the value of China’s ecosystem services. Ecosyst. Serv. 2017, 26, 146–154. [Google Scholar] [CrossRef]
  63. Costanza, R.; d’Arge, R.; de Groot, R.; Farber, S.; Grasso, M.; Hannon, B.; Limburg, K.; Naeem, S.; Oneill, R.V.; Paruelo, J.; et al. The value of the world’s ecosystem services and natural capital. Nature 1997, 387, 253–260. [Google Scholar] [CrossRef]
  64. Liu, H.; Shu, C.; Sun, L.H. Spatiotemporal evolution and influencing factors of ecosystem service value in the Sanjiangyuan nature reserve nature reserve. Adv. Nano Res. 2022, 12, 319–336. [Google Scholar]
  65. Wu, J.H.; Wang, G.Z.; Chen, W.X.; Pan, S.P.; Zeng, J. Terrain gradient variations in the ecosystem services value of the Qinghai-Tibet Plateau, China. Glob. Ecol. Conserv. 2022, 34, e02008. [Google Scholar] [CrossRef]
  66. Yuan, K.Y.; Li, F.; Yang, H.J.; Wang, Y.M. The Influence of Land Use Change on Ecosystem Service Value in Shangzhou District. Int. J. Environ. Res. Public Health 2019, 16, 1321. [Google Scholar] [CrossRef]
  67. Zhang, J.X.; Hu, R.Z.; Cheng, X.L.; Christos, V.; Philbin, S.P.; Zhao, R.; Zhao, X.W. Assessing the landscape ecological risk of road construction: The case of the Phnom Penh-Sihanoukville Expressway in Cambodia. Ecol. Indic. 2023, 154, 110582. [Google Scholar] [CrossRef]
  68. Yang, T.; Zhang, Q.; Wan, X.H.; Li, X.P.; Wang, Y.Y.; Wang, W. Comprehensive ecological risk assessment for semi-arid basin based on conceptual model of risk response and improved TOPSIS model-a case study of Wei River Basin, China. Sci. Total Environ. 2020, 719, 137502. [Google Scholar] [CrossRef]
  69. Fural, S.; Kükrer, S.; Cürebal, I. Geographical information systems based ecological risk analysis of metal accumulation in sediments of Ikizcetepeler Dam Lake (Turkey). Ecol. Indic. 2020, 119, 106784. [Google Scholar] [CrossRef]
  70. Salmanighabeshi, S.; Palomo-Marín, M.R.; Bernalte, E.; Rueda-Holgado, F.; Miró-Rodríguez, C.; Fadic-Ruiz, X.; Vidal-Cortez, V.; Cereceda-Balic, F.; Pinilla-Gil, E. Long-term assessment of ecological risk from deposition of elemental pollutants in the vicinity of the industrial area of Puchuncavi-Ventanas, central Chile. Sci. Total Environ. 2015, 527, 335–343. [Google Scholar] [CrossRef]
  71. Liu, J.; Chen, J.J.; Qin, Q.T.; You, H.T.; Han, X.W.; Zhou, G.Q. Patch Pattern and Ecological Risk Assessment of Alpine Grassland in the Source Region of the Yellow River. Remote Sens. 2020, 12, 3460. [Google Scholar] [CrossRef]
  72. Peng, L.; Dong, B.; Wang, P.; Sheng, S.W.; Sun, L.; Fang, L.; Li, H.R.; Liu, L.P. Research on ecological risk assessment in land use model of Shengjin Lake in Anhui province, China. Environ. Geochem. Health 2019, 41, 2665–2679. [Google Scholar] [CrossRef] [PubMed]
  73. Qu, Z.; Zhao, Y.H.; Luo, M.Y.; Han, L.; Yang, S.Y.; Zhang, L. The Effect of the Human Footprint and Climate Change on Landscape Ecological Risks: A Case Study of the Loess Plateau, China. Land 2022, 11, 217. [Google Scholar] [CrossRef]
  74. Karimova, P.G.; Lee, K.C. An Integrated Landscape-Seascape Approach in the Making: Facilitating Multi-Stakeholder Partnership for Socio-Ecological Revitalisation in Eastern Coastal Taiwan (2016–2021). Sustainability 2022, 14, 4238. [Google Scholar] [CrossRef]
  75. Izakovicová, Z.; Miklós, L.; Miklósová, V.; Petrovic, F. The Integrated Approach to Landscape Management -Experience from Slovakia. Sustainability 2019, 11, 4554. [Google Scholar] [CrossRef]
  76. Sayer, J.A.; Margules, C.; Boedhihartono, A.K.; Sunderland, T.; Langston, J.D.; Reed, J.; Riggs, R.; Buck, L.E.; Campbell, B.M.; Kusters, K.; et al. Measuring the effectiveness of landscape approaches to conservation and development. Sustain. Sci. 2017, 12, 465–476. [Google Scholar] [CrossRef]
  77. Grabs, W.; Tyagi, A.C.; Hyodo, M. Integrated flood management. Water Sci. Technol. 2007, 56, 97–103. [Google Scholar] [CrossRef]
Figure 1. Overview of the study area. Note: the image in the black box in the lower right corner represents an enlarged thumbnail of the South China Sea islands and other parts of the islands.
Land 13 00535 g001
Figure 2. The framework for land simulation.
Land 13 00535 g002
Figure 3. Spatial and temporal changes in land use from 1990 to 2030 under various scenarios. Note: (a.1f.1) represent enlarged versions of thumbnails of sample areas in the northwestern part of the study area, respectively. (a.2f.2) represent enlarged versions of thumbnails of sample areas in the southeastern part of the study area, respectively.
Land 13 00535 g003
Figure 4. Spatial and temporal distribution of ESV in the southern hilly region under multiple scenarios from 1990 to 2030.
Land 13 00535 g004
Figure 5. The evolving trends in changes to the ESV from 1990 to 2020 and the projected scenarios from 2020 to 2030. Note: NDS: Natural Development Scenario; EPS: Ecological Protection Scenario; and UDS: Urban Development Scenario.
Land 13 00535 g005
Figure 6. Impact of different types of LUCs on ESV.
Land 13 00535 g006
Figure 7. Spatiotemporal changes in ERI from 1990 to 2020 and under various forecasting scenarios from 2020 to 2030.
Land 13 00535 g007
Figure 8. Contribution of driving factors to LUC. Note: DH: distance from major highways; DR: distance from the railway; DV: distance from the river; GL: GDP per land; DP: density of population; AT: annual average temperature; and AP: mean annual precipitation.
Land 13 00535 g008
Table 1. Correlation among driving factors.
Driving FactorsGLAPDVDHDRSLOPEDEMATDP
GL1.000.120.08−0.05−0.380.18−0.440.620.24
AP0.121.000.040.01−0.07−0.06−0.100.120.61
DV0.080.041.000.640.05−0.06−0.120.110.00
DH−0.050.010.741.000.260.000.13−0.13−0.05
DR−0.38−0.070.050.261.000.190.67−0.50−0.18
SLOPE0.18−0.06−0.060.000.191.000.41−0.19−0.12
DEM−0.44−0.10−0.120.130.670.411.00−0.68−0.23
AT0.620.120.11−0.13−0.50−0.19−0.681.000.26
DP0.240.610.00−0.05−0.18−0.12−0.230.261.00
Note: DH: distance from major highways; DR: distance from the railway; DV: distance from the river; GL: GDP per land; DP: density of population; AT: annual average temperature; and AP: mean annual precipitation.
Disclaimer/Publisher’s Note: The statements, opinions and data contained in all publications are solely those of the individual author(s) and contributor(s) and not of MDPI and/or the editor(s). MDPI and/or the editor(s) disclaim responsibility for any injury to people or property resulting from any ideas, methods, instructions or products referred to in the content.

