Abstract
Green city areas are crucial in mitigating the Urban Heat Island Effect (UHI). However, the cooling effect of green city areas can be influenced by the surrounding complex urban spatial environment. This study focuses on Changsha, a subtropical city in China, where 40 green city areas were screened and analyzed. The study aims to quantify the specific impact of urban spatial morphology on the cooling effect of green city areas. Through statistical correlation and regression analysis, this study focused on six urban spatial morphology indicators: building density (BD), building floor area ratio (BFR), building volume density (BVD), building evenness index (BEI), building average height (BH), and building height standard deviation (BSD). The results indicate that the cooling effect of green city areas could be influenced by urban spatial morphology. Factors such as BD, BFR, BH, and BSD were found to be significantly correlated with the cooling effect of green city areas, with BH showing the strongest influence. BD and BFR were negatively correlated, while BH and BSD were positively correlated. The range values of BD, BFR, BH, and BSD were determined to achieve the optimal conditions for the cooling effect of green city areas. Additionally, the relative position of the green city areas in the neighboring urban areas affects the cooling effect of the green city areas. The cooling effect is most pronounced in the urban area situated to the south of the green city areas. These findings provide a solid foundation for urban planning around green city spaces and offer scientifically sound evidence for mitigating the UHI.
1. Introduction
Along with the sustained improvement of human society and economy, the process of urbanisation has been accelerated, the urban population has increased dramatically, and urban land resources have been reduced year by year, which makes the global warming phenomenon more serious. Also, the surface temperature has been rising continuously, which has led to a profound change in the urban thermal environment [1,2,3], which is now a common problem in cities worldwide [4,5,6,7]. Changes in the city’s thermal environment decrease the amount of heat dissipated by the city, and also generate, store, absorb, and retain excess heat, resulting in higher temperatures in urban areas than in suburban areas, exacerbating the UHI [8,9]. Simultaneously, with the evolution of the city’s thermal environment, the health of inhabitants and the quality of their living environment will face far-reaching impacts [10,11], which will result in a chain of issues such as reduction in the thermal comfort of urban residents [12], the increases in urban energy consumption, and the destruction of ecosystem diversity [13,14]. Therefore, the present study of the thermal environment of the city is very significant to the mitigation of a changing climate. Therefore, coping with the UHI brought about by municipalisation and climate change has become a significant challenge for current urban development [15,16,17], and practical mitigation measures need to be sought.
As an important portion of the ecological infrastructure for cities, green city areas can help to lower surface temperatures, significantly mitigate the heat island effect and reduce air pollution caused by heat waves [18,19]. Green city areas can also become important habitats that support urban biodiversity [20], having an “oasis effect” [21,22], thereby improving the living environment of citizens and providing important support for sustainable urban development [23]. Since the natural conditions of different regions vary greatly, the study of green city areas in different cities is necessary to improve the ecological environment for cities. Numerous studies have shown that green city areas, whether artificially planted or naturally formed, can influence the local urban microclimate through the regulation of shading, transpiration, and photosynthesis of the vegetation canopy, thus effectively regulating temperatures of the surrounding air and alleviating the UHI [24,25,26]. According to extensive field measurements, the temperature of green city areas is generally lower than that of other surrounding urban land and built-up areas [27,28,29], and demonstrate the cooling effect of green city areas on air temperatures [29,30,31]. Thus, green city areas have significant advantages in reducing the UHI. Meanwhile, in the study of green city areas and UHI [32], the effective cooling distance of green city areas is a key indicator for evaluating the effectiveness of green city areas in mitigating the UHI [33,34]. Therefore, accurate estimation of the range of green city areas cooling is crucial. With the development of remote sensing technology, there is a large number of studies on obtaining surface temperature through satellite remote sensing images [25,35], and at the same time, surface temperature has a significant advantage in describing the overall thermal environment of the city, so it is feasible to utilize surface temperature to measure the cooling effect of green city areas [36,37]. This present study of measuring the range of green city areas cooling, the advantages of stability, accessibility, and urbanisation of surface temperature considers it a widely used indicator to evaluate the cooling effect of green city areas by measuring its changes [38,39,40]. It is important to note that the cooling distance of green city areas is affected by the complex environment in which they are located, and the cooling distance of green city areas varies by city.
Much of the literature demonstrates that the cooling effect of green city areas is affected by several factors, and these factors have two main aspects: internal factors and external factors. Most of the current research focuses on internal factors, which mainly refer to the number and spatial properties of the green city areas themselves. The greater the number of green city areas, the more pronounced the cooling effect on the city, and large contiguous green city areas can form a favourable cold island effect, thus effectively reducing the temperature of the surrounding environment [41]. In addition, the patch size and shape of the green city areas will also affect its favourable cooling effect [42]. Meanwhile, the vegetation characteristics and landscape structure of the green areas will impact its cooling effect [43]. In addition to internal factors, the cooling effect of urban green city areas is affected by external specific considerations such as the morphologic characteristics of the surrounding city, land cover characteristics, and skyscape factors [4,44,45,46]. Therefore, it is valuable to explore the external specific factors affecting the cooling effect of green city areas. With the continuous improvement of urban built-up areas, green city areas have been surrounded by urban buildings, and urban buildings have become important influencing considerations affecting the cooling effect of green city space. The thermal environment change of green city areas will be affected by the type combination and arrangement layout of the surrounding buildings [47], and simultaneously, the block ventilation constituted by the buildings around the green city areas helps strengthen the urban green space cooling effect [48]. However, most current studies focus on the passive cooling effect of green city areas on surrounding buildings in cities [49,50], and the related aspects of building energy consumption [51,52]. There are fewer studies on the influence of the spatial form of the built environment around green city areas on the cooling effect, and there is a lack of complete and specific indicators to quantify the urban spatial form [53].
To summarise, most of the previous studies are based on these characteristics individually, and few of them are based on an integrated and comprehensive perspective for assessment, In contrast, few previous studies have specifically quantified urban spatial morphology indicators to derive specific strategies that are more applicable. Notably, the rapidly developing Chinese megacities are facing increasingly serious climate and environmental problems, and the results and findings of previous studies may not apply to China’s climate zones. Therefore, this study focuses on quantifying the effect of urban spatial morphology indicators for the green city area cooling effect to assess the optimal urban spatial morphology indicator values, analyse the spatial distribution characteristics of the thermal environment in Changsha, a typical subtropical city, through surface inversion, and analyse the cooling effect and the cooling range existing in the green city area through the fitting. By fitting and analysing the cooling effect and cooling range of green city area, we quantified the relationship between the cooling effect and spatial morphology indicator to obtain the most favourable urban spatial morphology indicator values for the diffusion of the cooling effect of green city area. The results are very informative for urban policymakers, which can help them improve the living environment and comfort of urban residents, as well as mitigate UHI.
2. Materials and Methods
2.1. Study Area
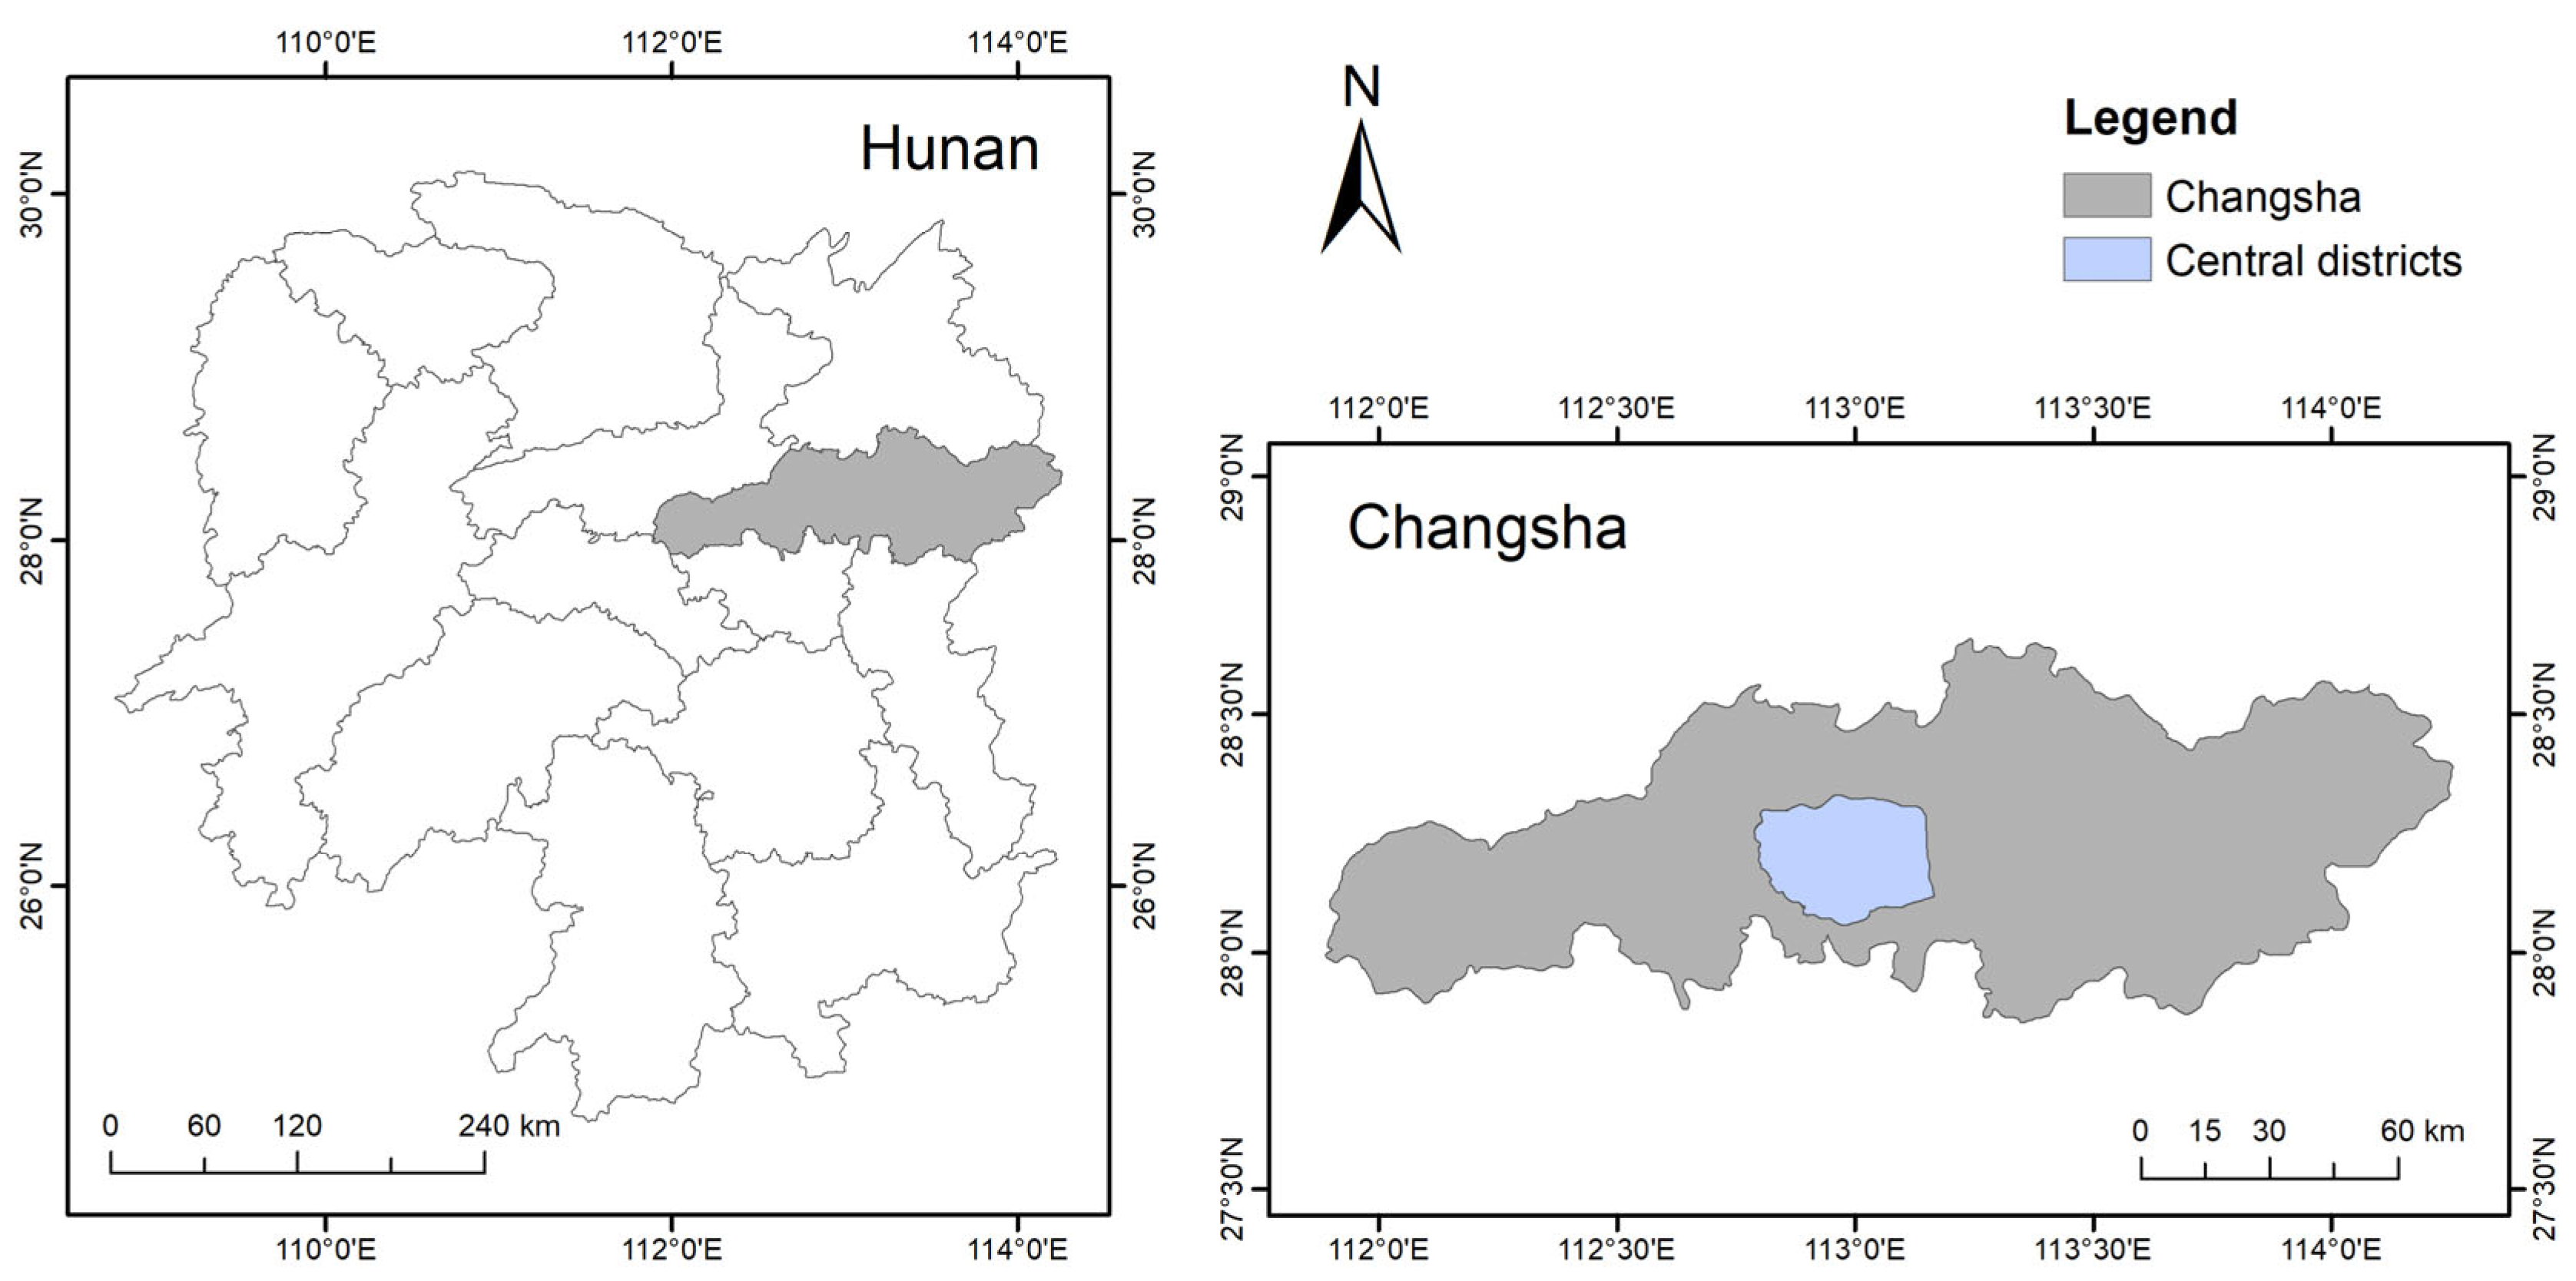
The city chosen for this study is Changsha (Figure 1). Changsha is the capital of Hunan Province, China. It has a typical subtropical monsoon climate, mountainous and hilly topography, hot summers, and many high-temperature days. Therefore, it is crucial to study the distribution particularities of the summer thermal environment spatial morphology in Changsha and the cooling effect of green city areas on the spatial morphology of the surrounding cities. Concurrently, this study focuses on exploring the relationship between green city areas and urban spatial form indicators, and thus selects a central area of well-constructed cities, the Changsha City Ring Road, as the research boundary to examine the core built-up areas within the third ring road of Changsha City.

Figure 1.
The study area is located in the centralised, built-up area of Changsha City.
2.2. Data Processing for Remote Sensing
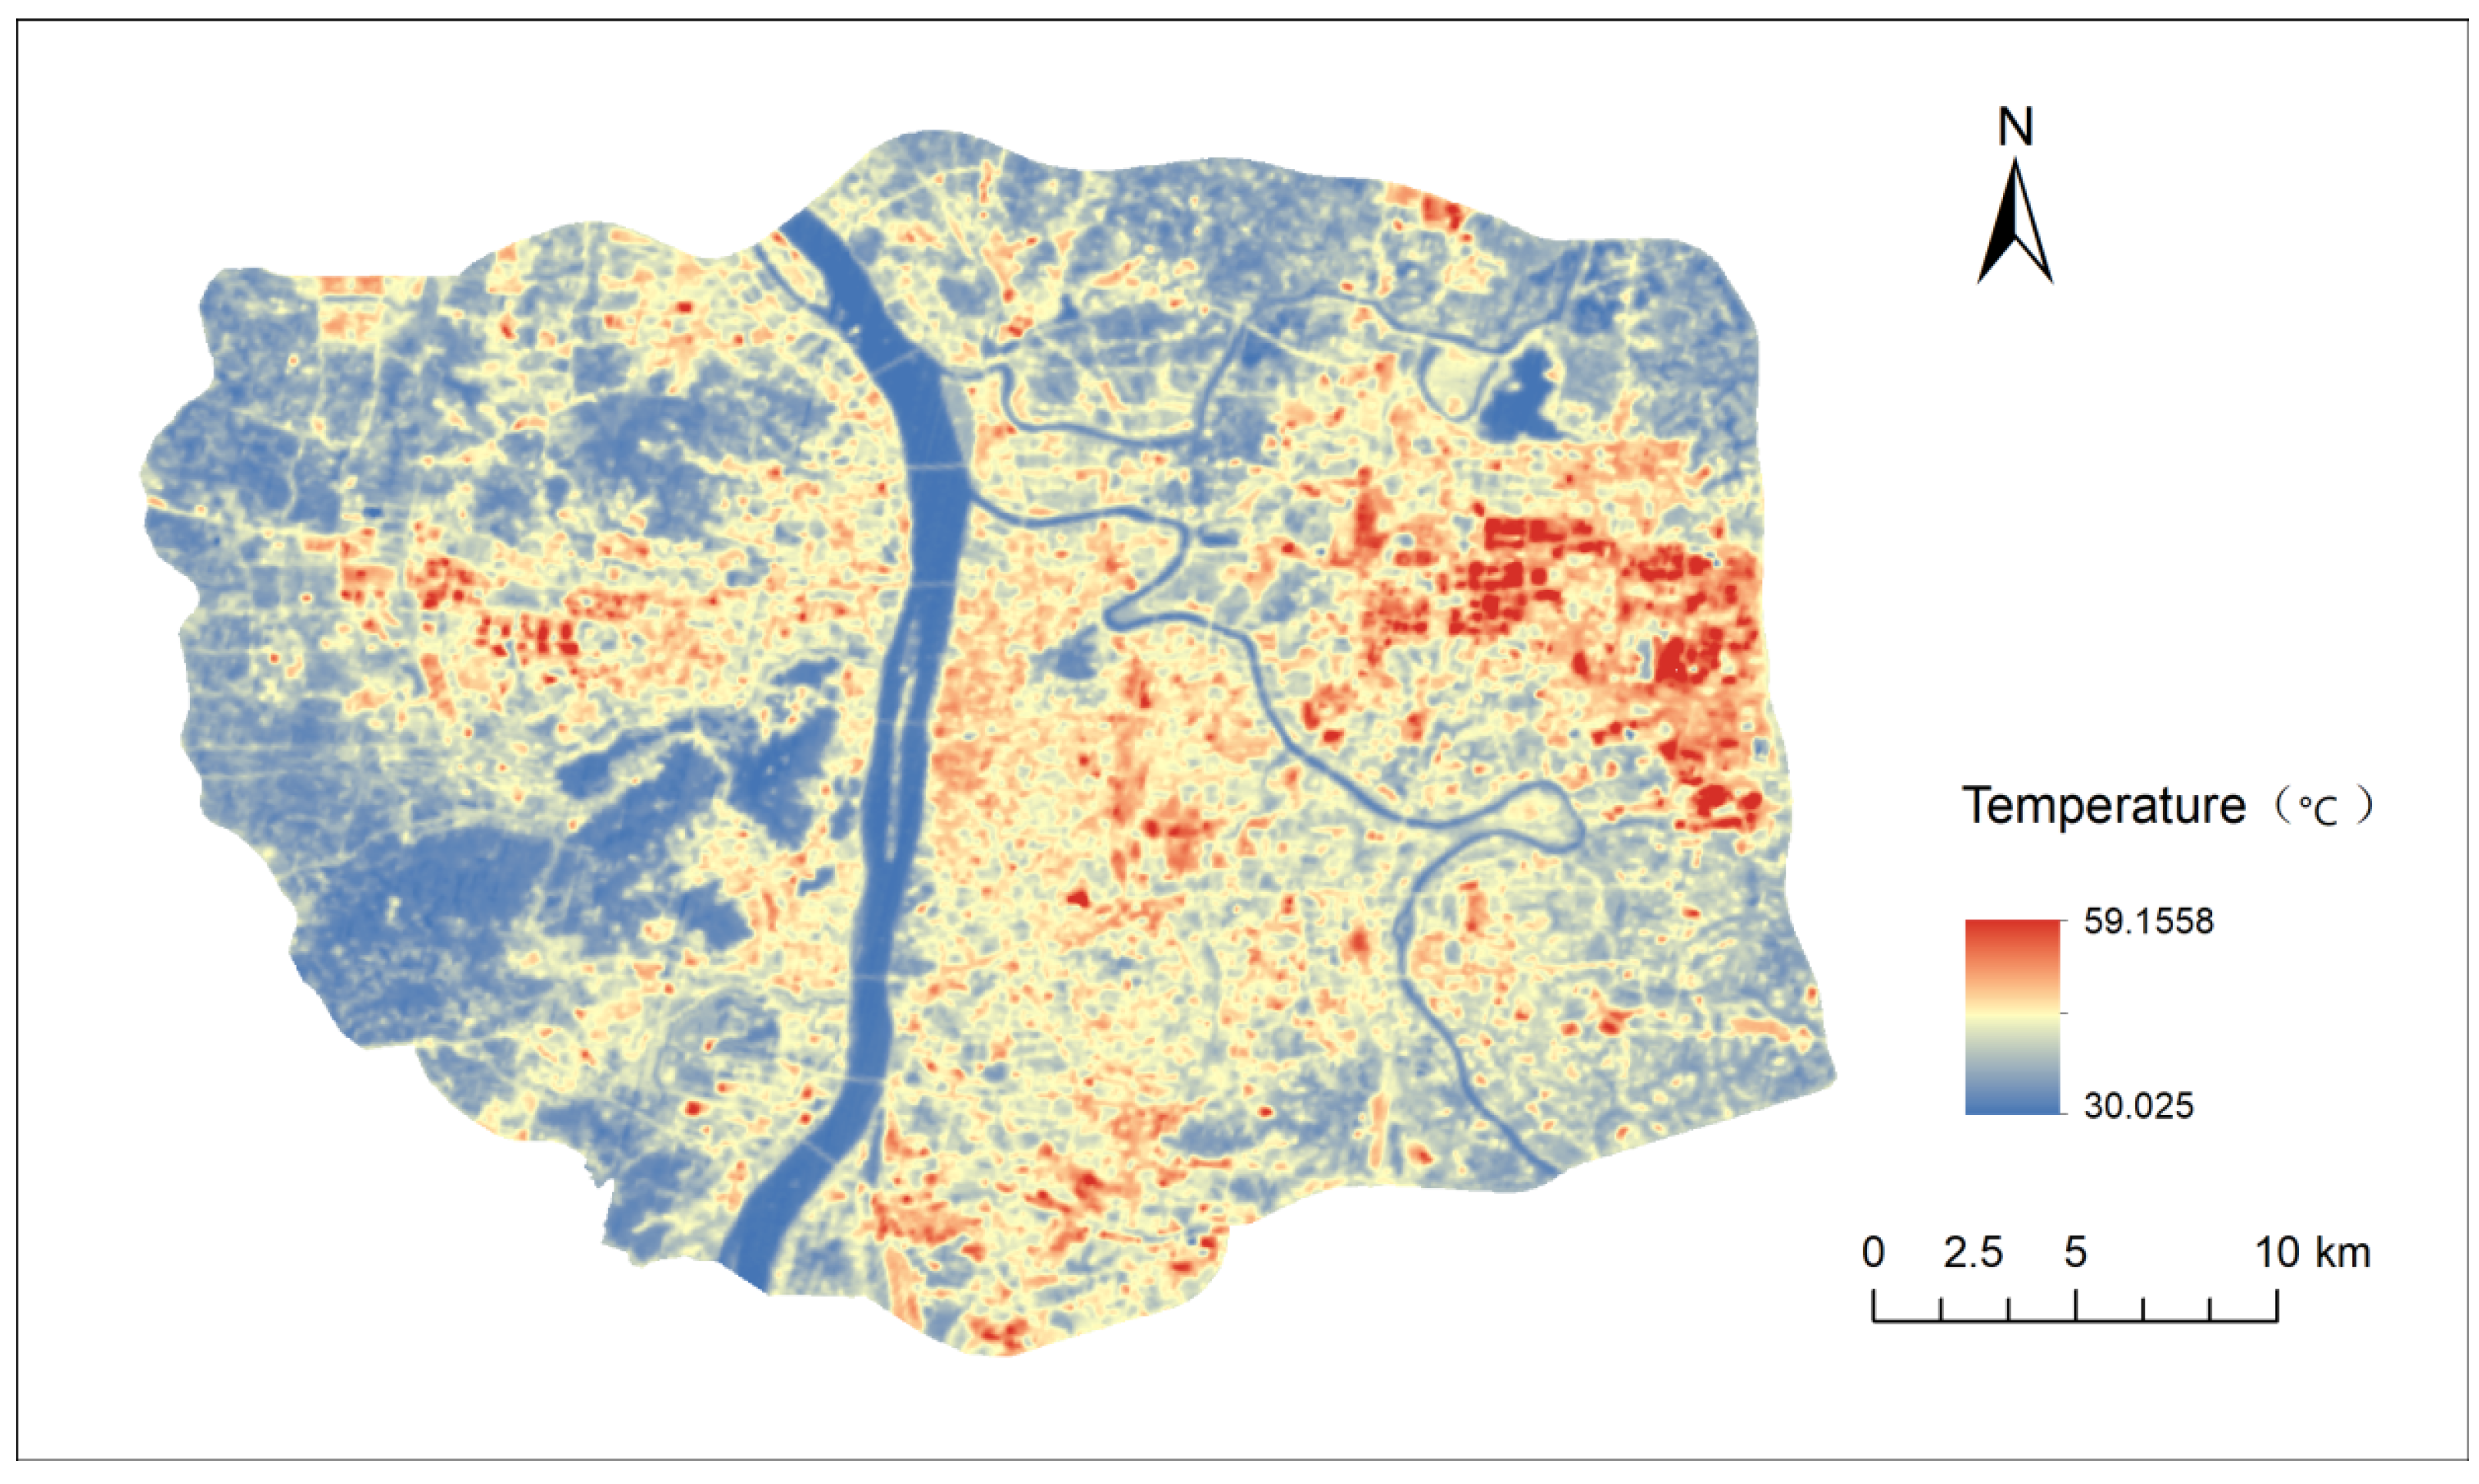
Presently, high spatial resolution remote sensing (RS) has been widely used in urban thermal environment research. Therefore, this study acquired research remote sensing data based on Landsat 8 series satellites (the longest-running Earth observation satellites), with a resolution of 30 m, captured in the summer when the UHI was significant, on 17 August 2019. Next, the remote sensing images were pre-processed using ENVI5. Three software packages for geometric correction, radiometric calibration, atmospheric correction, cropping, and other pre-processing were used to invert the surface temperature, then combined with the single-window inversion method for obtaining the surface temperature readings of downtown Changsha. Additionally, they were used to analyse the characteristics of the geographic distribution of the environmental temperature spatial morphology in the subtropical city of Changsha from the perspective of the spatial morphology at the surface. Figure 2 illustrates Changsha’s surface temperature inversion data on 17 August 2019.

Figure 2.
Surface temperature distribution of Changsha City is based on a single window algorithm.
2.3. Green City Areas Sample Selection
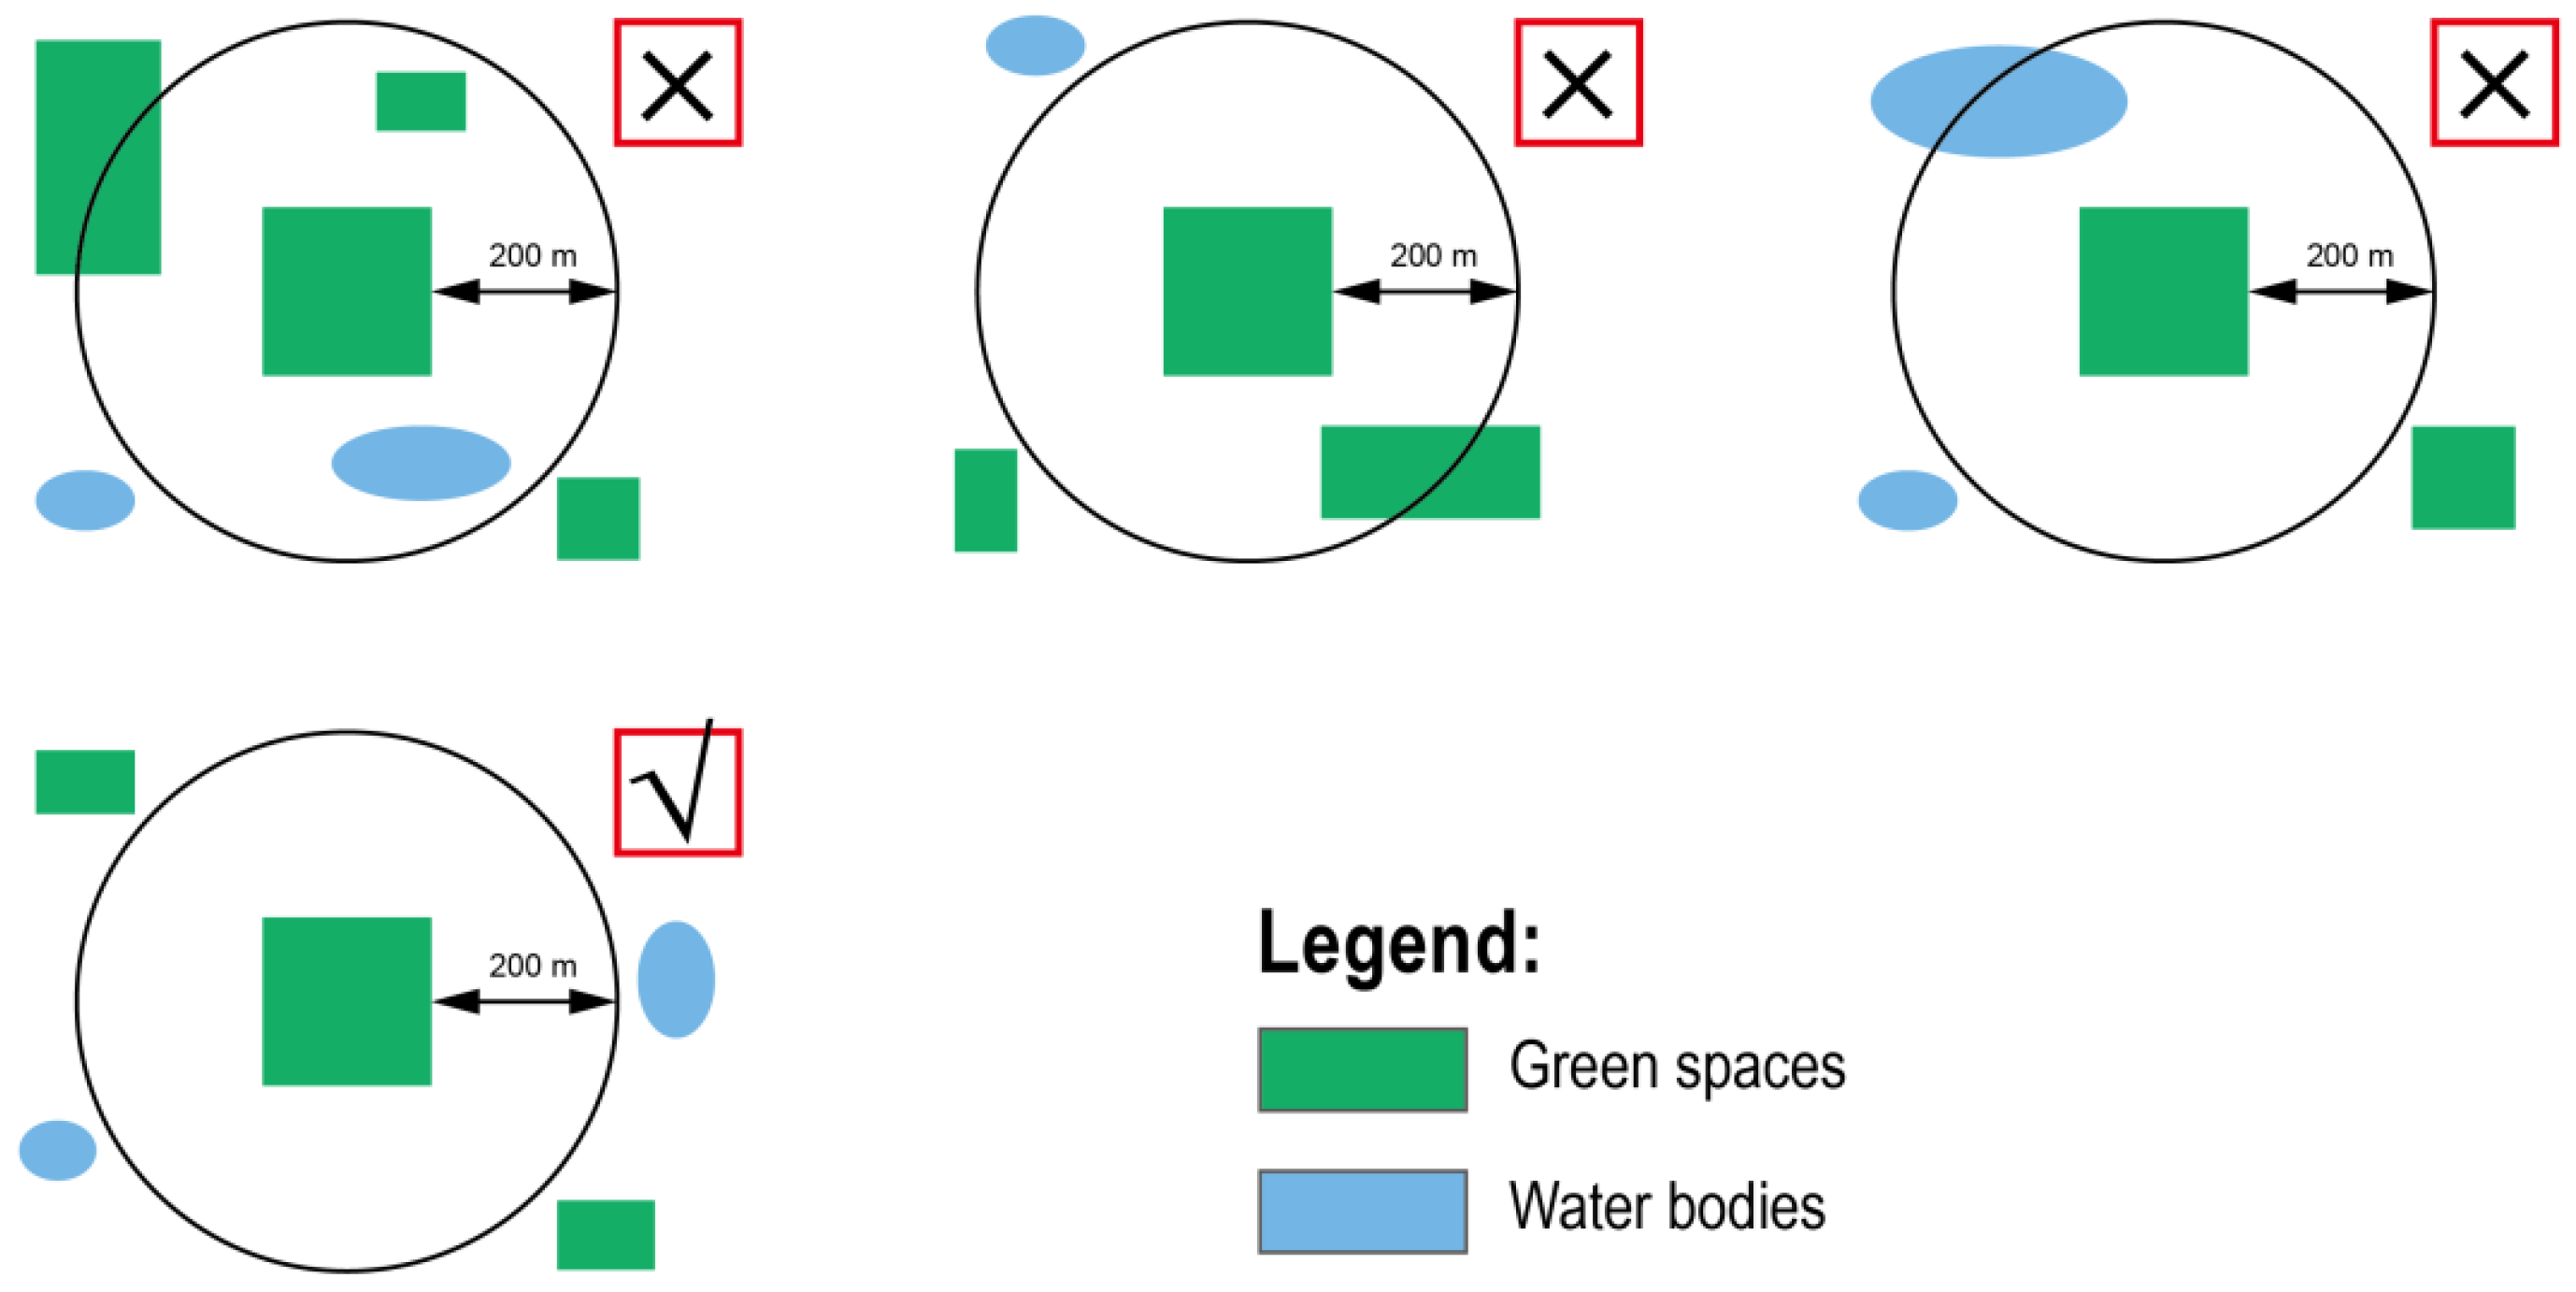
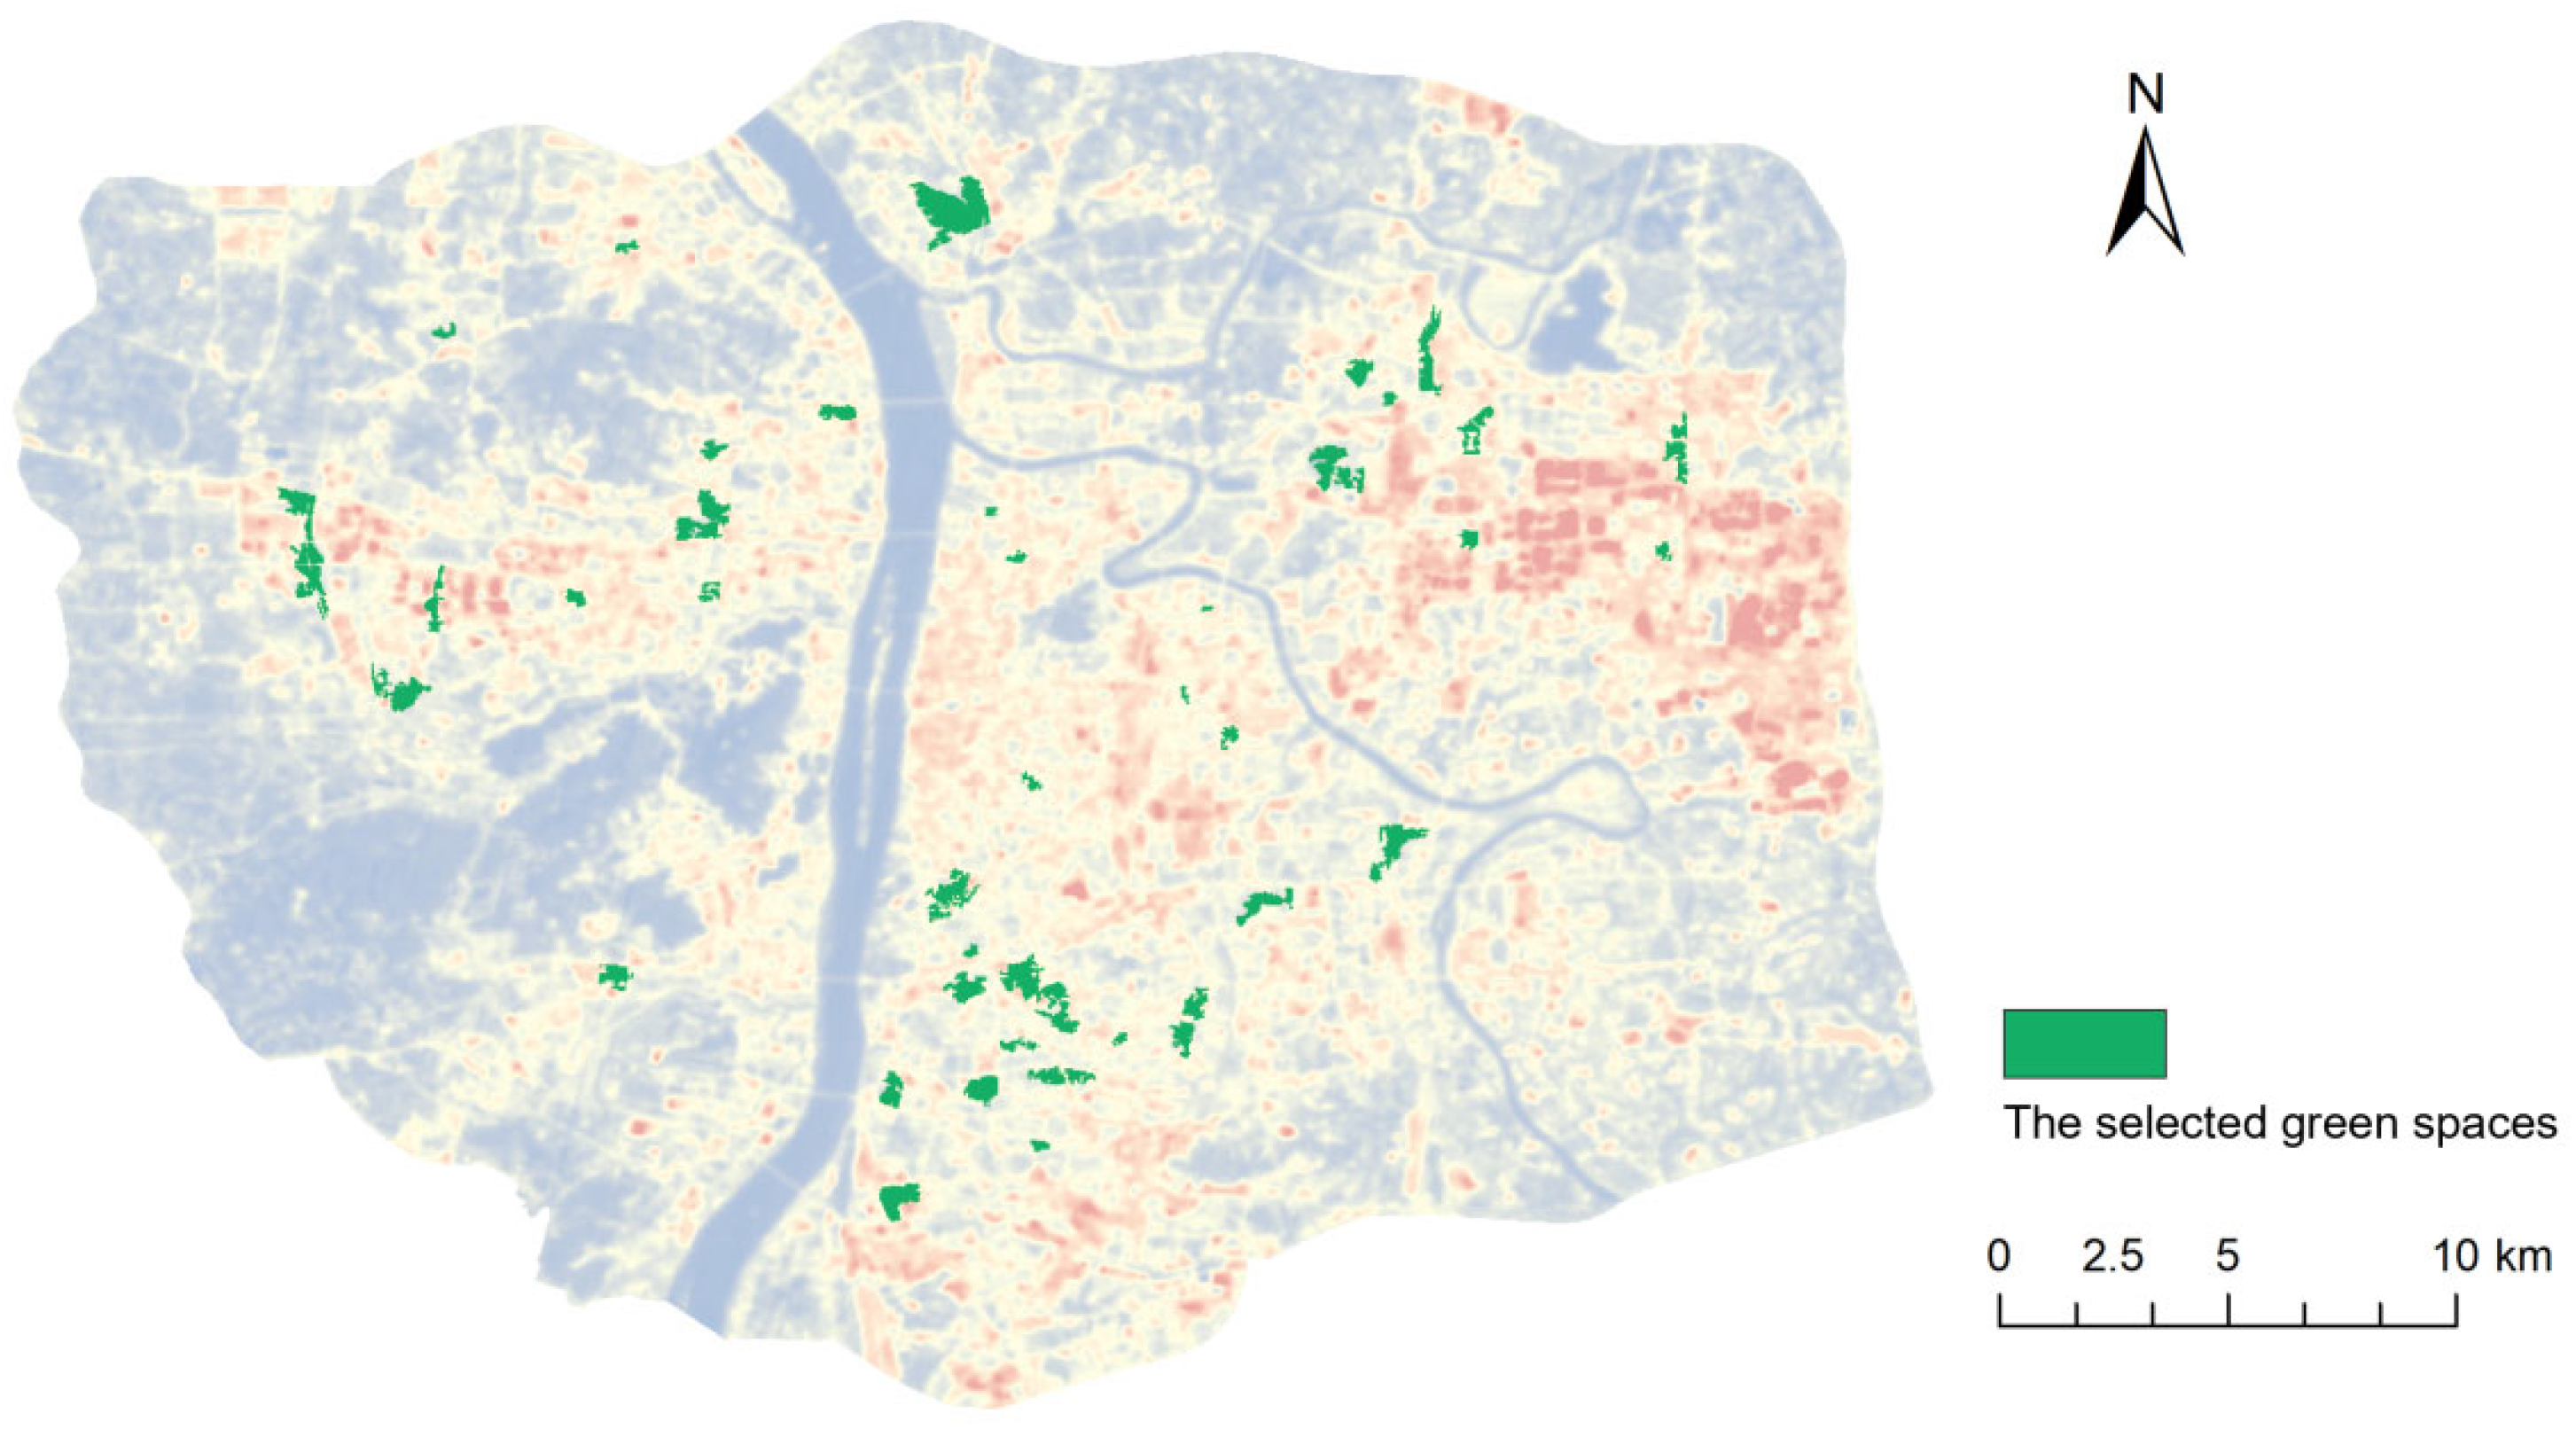
The cooling effect of green city areas is affected by the diversity and complexity of the environment in which they are located; therefore, when selecting the green areas in Changsha city center as a sample, we aimed to select the patches with significant differences in the shape of the green city areas as much as possible, to better study the role of green city areas in reducing temperature and analyse the influencing factors. Therefore, the normalised vegetation index (NDVI) was used to extract urban green patches; it is the most accurate indicator of plant development status and vegetation cover. It is frequently used to detect plant development status and cover and remove localised radiation errors [33,54,55]. Meanwhile, to eliminate cooling impact relationships between green areas or between green areas and water bodies and to increase the analysis’s trustworthiness, we referred to the screening conditions for green city areas in related papers [56,57], with the establishment of the following rules for the selection of urban green area examples based on high-resolution Google Earth imagery, as Figure 3 illustrates: (1) green area samples were chosen to vary in size from their current state; (2) the vegetation cover of the sample of green areas chosen should be greater than 80%; and (3) the samples of green areas chosen have no water bodies within them and should be over two hundred meters distant from additional green areas or water bodies. Finally, because this study focused on urban spatial morphology indicators, greenspace samples far from the built-up areas of urban centres were excluded based on a visual explanation of the corresponding high-resolution Google Earth satellite images and field surveys of subsurface characteristics. Based on these principles, a total of 40 green areas in city samples satisfying the requirements of this study were screened, and the geographic distribution maps of the green area samples in Changsha were created by superimposing the green city areas sample boundary maps with the surface temperature inversion maps (Figure 4).
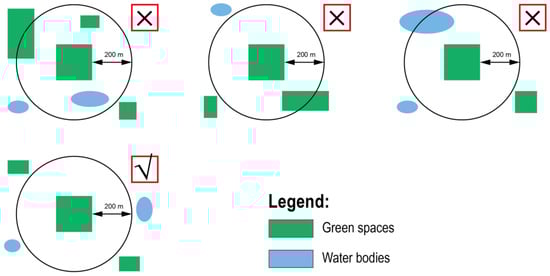
Figure 3.
Schematic diagram of green city areas sample selection (The green areas of the graph labeled “x” are not suitable for selective research, and the green areas of the graph labeled “√” are suitable for research).

Figure 4.
Location of the 40 selected green city areas in Changsha.
2.4. Urban Spatial Morphology Indicators
This study focuses on quantifying urban spatial morphology indicators on the green areas’ cooling effect, due to the correlation between many spatial morphology indicators to comprehensively and thoroughly reflect the characteristics of urban spatial morphology and to reduce redundant information. Referring to previous studies and relevant concepts based on urban form indicators [58,59,60], six urban spatial morphology indicators were selected to express the urban spatial morphology around the green city areas in Changsha (Table 1). They include building density (BD), building floor area ratio (BFR), building volume density (BVD), building evenness index (BEI), building average height (BH), and building height standard deviation (BSD). In addition, the relative positions of the buildings were considered. These indicators can comprehensively reflect the spatial morphological characteristics of the city and can be used as adjustment objects for mitigating urban heat islands. Simultaneously, the three-dimensional spatial information of Changsha City Centre was obtained through the Baidu map and combined with field measurements and the city street map, including city streets, building heights, BD, BFR and other urban spatial data, and the distribution of urban spatial morphology Indicators in Changsha City Centre was mapped in ArcGIS (Figure 5); ESRI, Redlands, CA, USA.

Table 1.
Summary table of urban spatial morphology indicators.
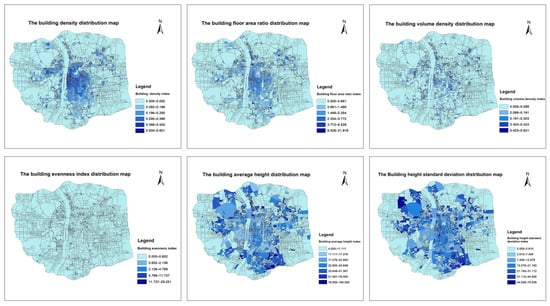
Figure 5.
Distribution of Changsha’s urban spatial morphology (BD, BFR, BVD, BEI, BH, and BSD).
3. Results
3.1. Explanation of the Scope for Green City Area Cooling
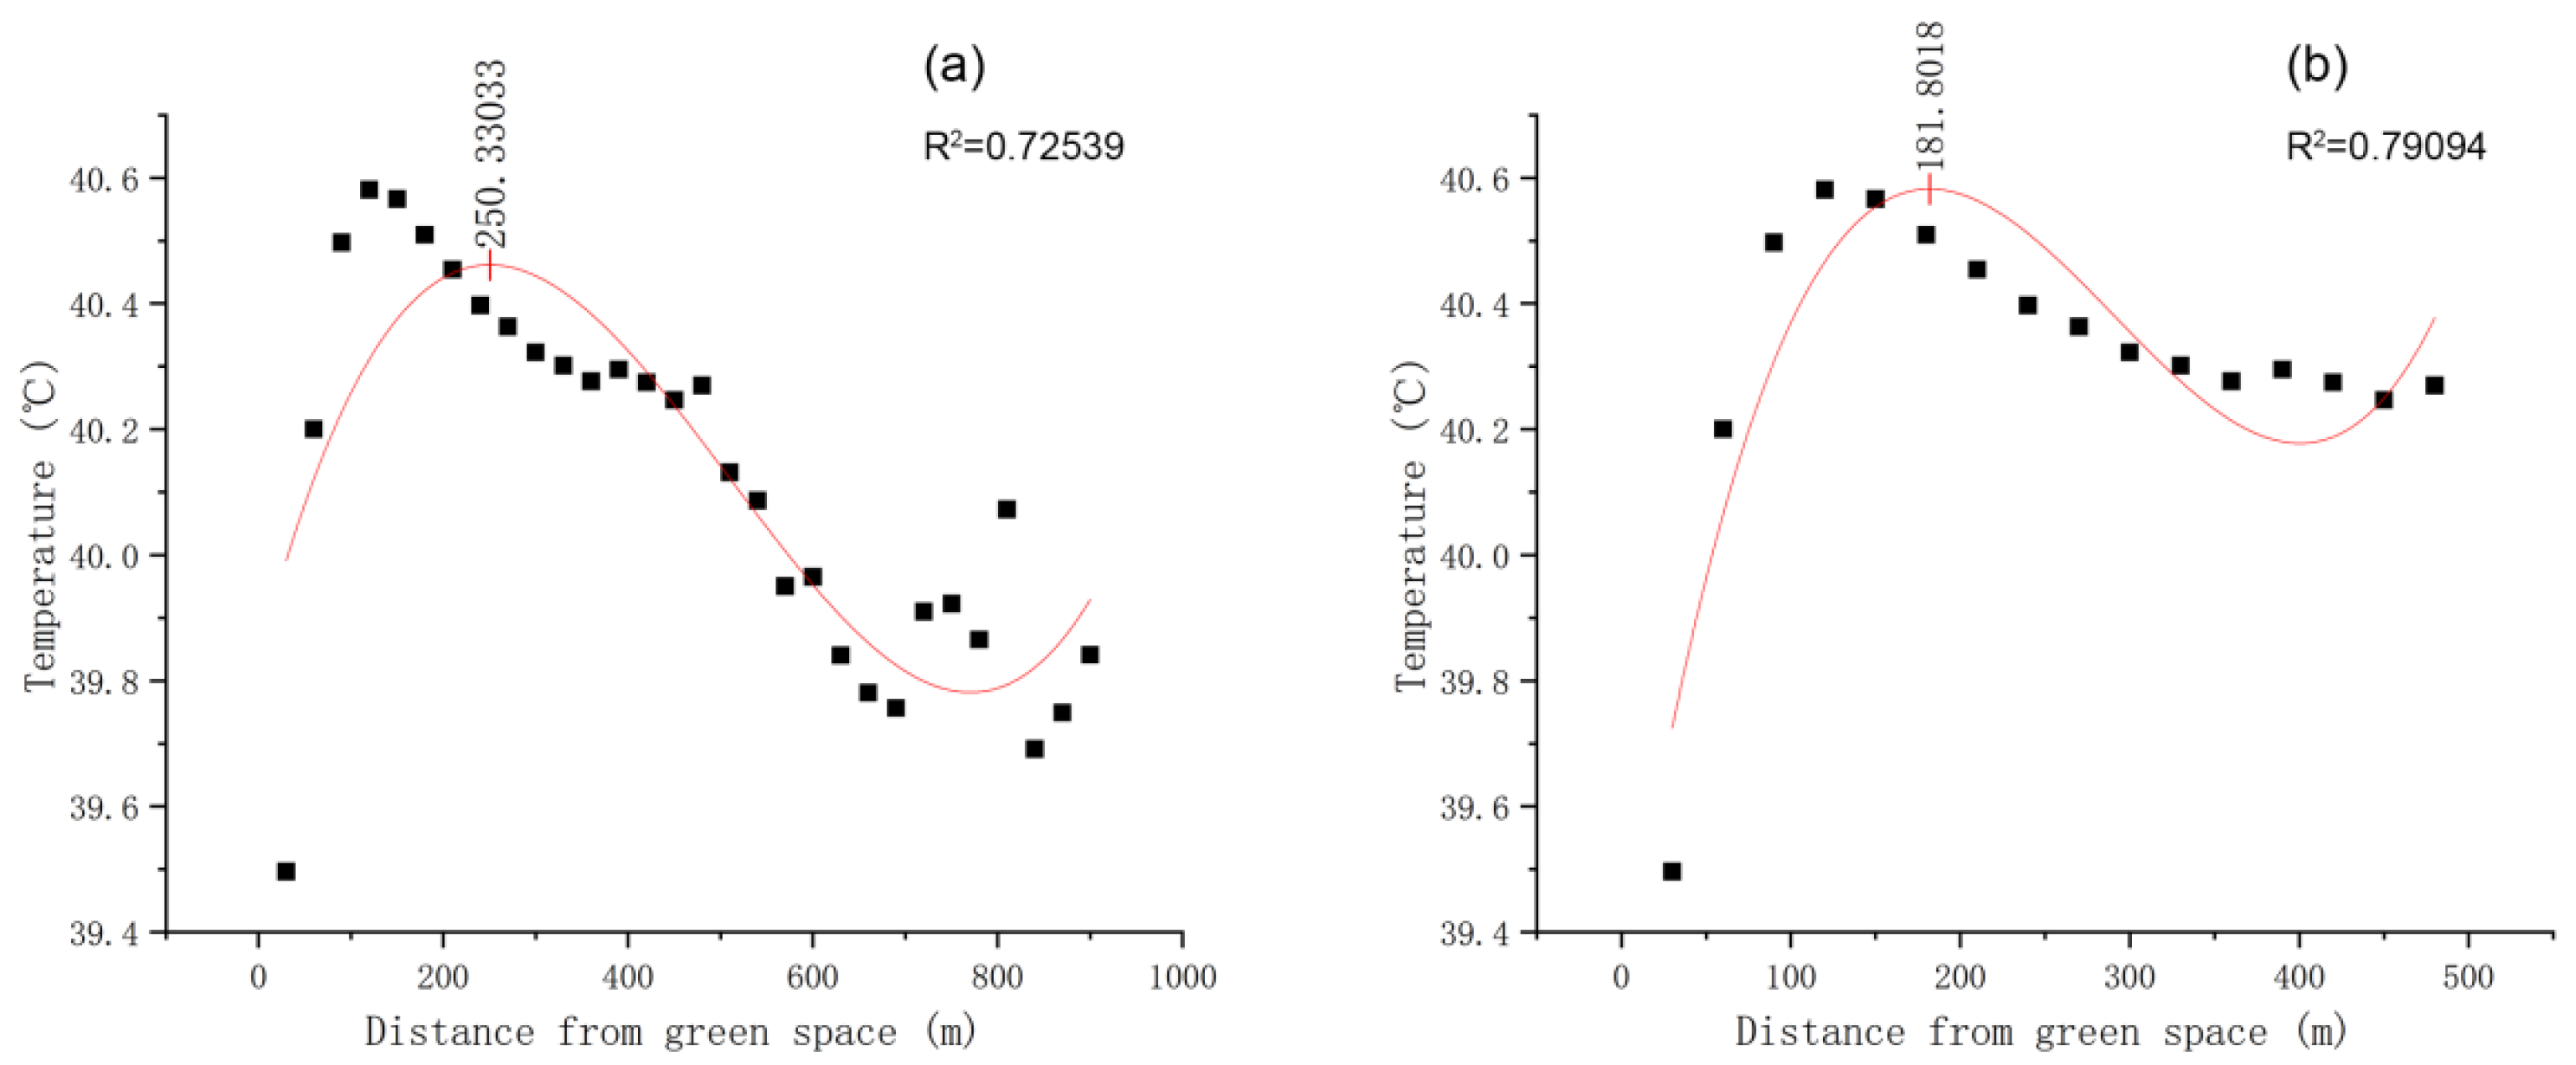
In the present study, the cooling distance of green city areas is the maximum distance that the green areas can mitigate the UHI. In contrast, the cooling magnitude of green city areas is the difference in temperature within the cooling distance of the green areas, and these two data are important indicators for assessing the cooling effect of green city space. It would depend on the resolution of the remote sensing satellite images used in the study and the magnitude of the green city areas; firstly, 10–30 buffer zones were established at 30-metre intervals starting from the edges of selected green city area patches. Next, the change rule of the temperature within 300–900 m of the green city areas was summarised by overlaying the above surface inversion temperature dispersion map with the buffer zones. Finally, we calculated the average surface temperature of each annular buffer to fit a cubic function to the cooling distance versus the average temperature. As Figure 6a illustrates, in terms of cooling distance and average temperature, the cubic function law is demonstrated by the fitted results. With the increase in cooling distance, the cubic polynomial curve shows a tendency of rising, then falling, and then rising, which rises and falls obviously in the first 480 m cooling distance. At the same time, it shows irregular changes in the last 480 m cooling distance, and its overall fitted R2 value is 0.72539.
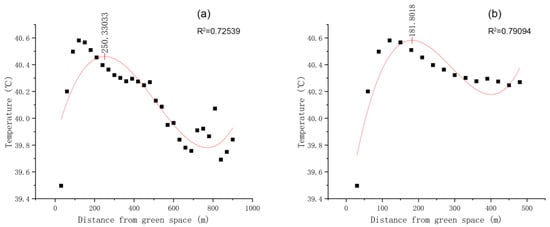
Figure 6.
(a) Schematic illustration of the cooling impact morphology of green areas within a 1000-m radius; (b) schematic illustration of the cooling impact morphology of green areas within a 480-m radius.
Additionally, the fitted curves had a weak match with the data scatter, and related studies proved that the green areas’ cooling range was generally 100–200 m [40,61]. Referring to several references, it was found that most of the buffer zones established in previous studies were 300–500 m [55,62,63,64]. Therefore, the fit results could be further optimised. In summary, in this study, the cooling distance of 480 m was selected as the final study range. By fitting the cubic function of the cooling distance to the average temperature, the fitted results were obtained, as shown in Figure 6b. The fitted R2 value was 0.79094, which is a significantly better fit.
Next, by further analysing the fitted cubic polynomial, the first turning point in the fitted curve was taken as the maximum cooling effect distance of the green areas samples in this study and expressed by Dmax, and then by calculating the cubic polynomial, the temperature of the maximum cooling effect distance of the green areas samples was obtained and expressed by Tmax. At the same time, the 40 greenfield samples were fit separately to obtain the maximum cooling distance and the corresponding temperature for each greenfield sample. Finally, the cooling magnitude was obtained by calculating the difference between Tmax and the temperature at the maximum cooling distance of each green area sample, denoted by ∆t. The average Dmax of the 40 green city areas samples was 180.8018 m, the average Tmax was 40.5820 °C, and the average ∆t was 0.6702 °C. The cooling impact distance of the area around the Star City green areas on Huangxing Avenue was the largest, 509.3994 m, while the cooling impact distance of the area around the Changsha University of Science and Technology’s Jinbengling Campus green areas was the smallest, 62.0420 m; the cooling amplitude of the surrounding area was the largest in the Star City green areas on Huangxing Avenue, 2.3260 °C, while the temperature drops around the green area of the Central South University’s Tiedao Campus was 0.0355 °C.
3.2. Analysis of the Influencing Factors of Urban Spatial Morphology on the Cooling Effect of Green City Areas
This study primarily quantified the effect of urban spatial morphology indicators on the green city space cooling effect, so Pearson correlation analyses were conducted between the six urban spatial form indicators and the cooling magnitude within each green area’s cooling range (Table 2). The structure shows that BD, BFR, BH, and BSD were significantly correlated with the green city areas cooling effect, BD and BFR show negative correlation, BH and BSD show positive correlation, and the correlation between BVD and BEI and the cooling impact of green areas in cities was not significant. Therefore, it is necessary to carry out a more in-depth study on the urban spatial morphology indicators BD, BFR, BH, and BSD, based on the correlation, fitting, and quantitative analyses of the grouping, to explore what kind of relationship exists between the urban spatial morphology and the magnitude of the cooling of the green areas, as well as to determine the range of values of the four urban spatial morphology indicators that are favorable to the cooling impacts of the green areas and try to explain these results.
Table 2.
Correlation between urban spatial morphology indicators around green areas and temperature decrease range.
3.2.1. The Effect of the Building Density on the Cooling Impact of Green Areas
BD is a parameter that quantifies the ratio between the area occupied by the base of a building and the surface area of a unit of space, thus reflecting the coverage of the building on the ground, and is an essential indicator of the level layout characteristics of a built-up area. As different building types are distributed within the same area and have different heights and densities, it is impossible to visualise the overall effect of building density on the cooling effect of green city space. At the same time, green city areas are surrounded by rapidly urbanising buildings, which leads to the cold air from the green areas being blocked by the buildings, which will change the trajectory of the cold air flow, affect the diffusion efficiency of the cold air, and ultimately attenuate the green city space cooling effect. Therefore, this study examines the urban spatial morphology indicator BD, and by studying and analysing the data on the BD values and the magnitude of cooling around the greenfield samples, we can conclude that there is a quantitative correlation between them.
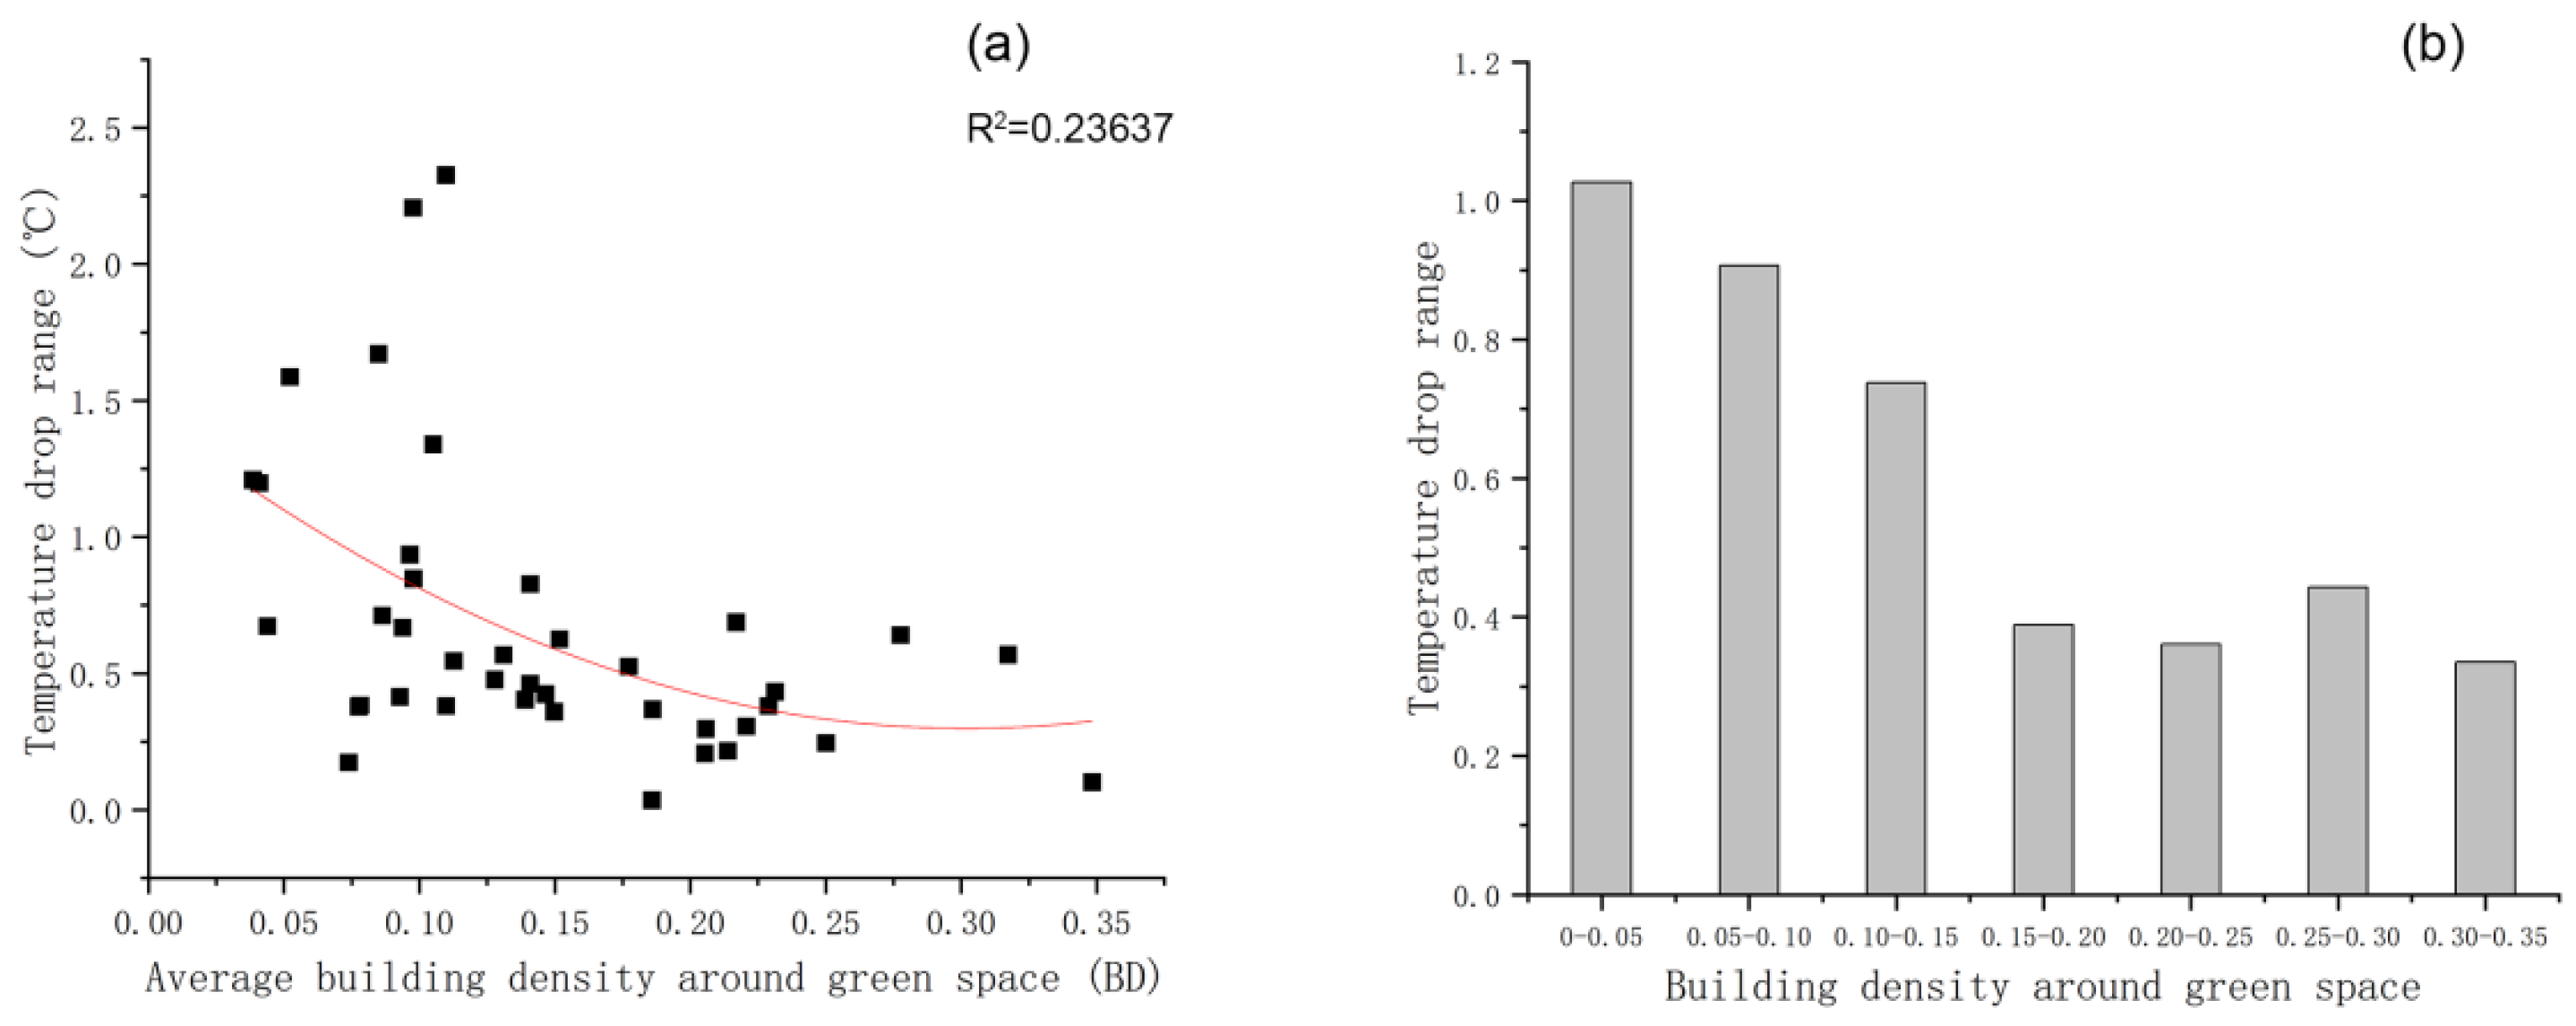
According to Table 2, the Pearson correlation coefficient between the mean BD and cooling range of the 40 greenfield samples was −0.458 (P = 0.003 < 0.01), which indicated that they showed a significant negative correlation. To explore the specific morphology of change, next, the average BD value within the maximum cooling distance of each greenfield sample was calculated and combined with the cooling range of each greenfield sample as mentioned above, and the fitting analysis was performed, with the average BD value as the dependent variable and the temperature drop range as the independent variable. The results prove that, as shown in Figure 7a, the higher the building density, the lower the cooling range, and the relationship between them can be described by fitting the curves with a quadratic polynomial. This phenomenon suggests that the increase in building density causes the reduction in the magnitude of temperature drop, while the next step is to quantitatively analyse the specific range of values.
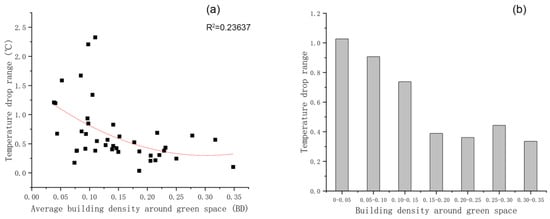
Figure 7.
(a) Fitted analysis between mean BD values and the temperature drop range; (b) Quantitative analysis between mean BD values and the temperature drop range.
To ascertain the precise range of building density (BD) in the vicinity of green areas that promotes a cooling effect, we employed BD as the basis for classification. We partitioned all samples into seven groups based on intervals of 0.05 and then counted the average temperature drop range of the buffer zone around each group of green areas and derived the statistical findings presented in Figure 7b. According to the results, temperatures in the buffer area surrounding the green areas are the lowest, exceeding 1.0 °C, when the BD falls within the range of 0.00 to 0.05. Therefore, this study proves that the smaller the building density, the better the cooling effect created by its green areas.
3.2.2. The Effect of the Building Floor Area Ratio on the Cooling Impact of Green Areas
BFR is a parameter that quantifies the ratio between the total area of above-ground buildings per unit of space and the surface area per unit of space and is an important indicator of the characteristics of the vertical layout of built-up areas. Meanwhile, the numerical size of BFR reflects the intensity of land use and its utilisation efficiency, which is crucial for measuring the intensity of urban construction land use. Due to the distribution of different types of buildings within the same area, their heights and densities vary, and it is not possible to visualise the overall impact of BFR on the green areas’ cooling effect. Concurrently, when the cold air in the green city areas spreads in all directions, it will be affected by the buildings in the perpendicular, which will change the trajectory of the cold air flow and affect the efficiency of the cold air diffusion, and ultimately lead to the attenuation of the cooling effect of the green areas. Therefore, this study examines the urban spatial morphology indicator BFR, and by studying and analysing the data on the BFR values and the magnitude of cooling around the greenfield samples, we can conclude that there is a quantitative correlation between them.
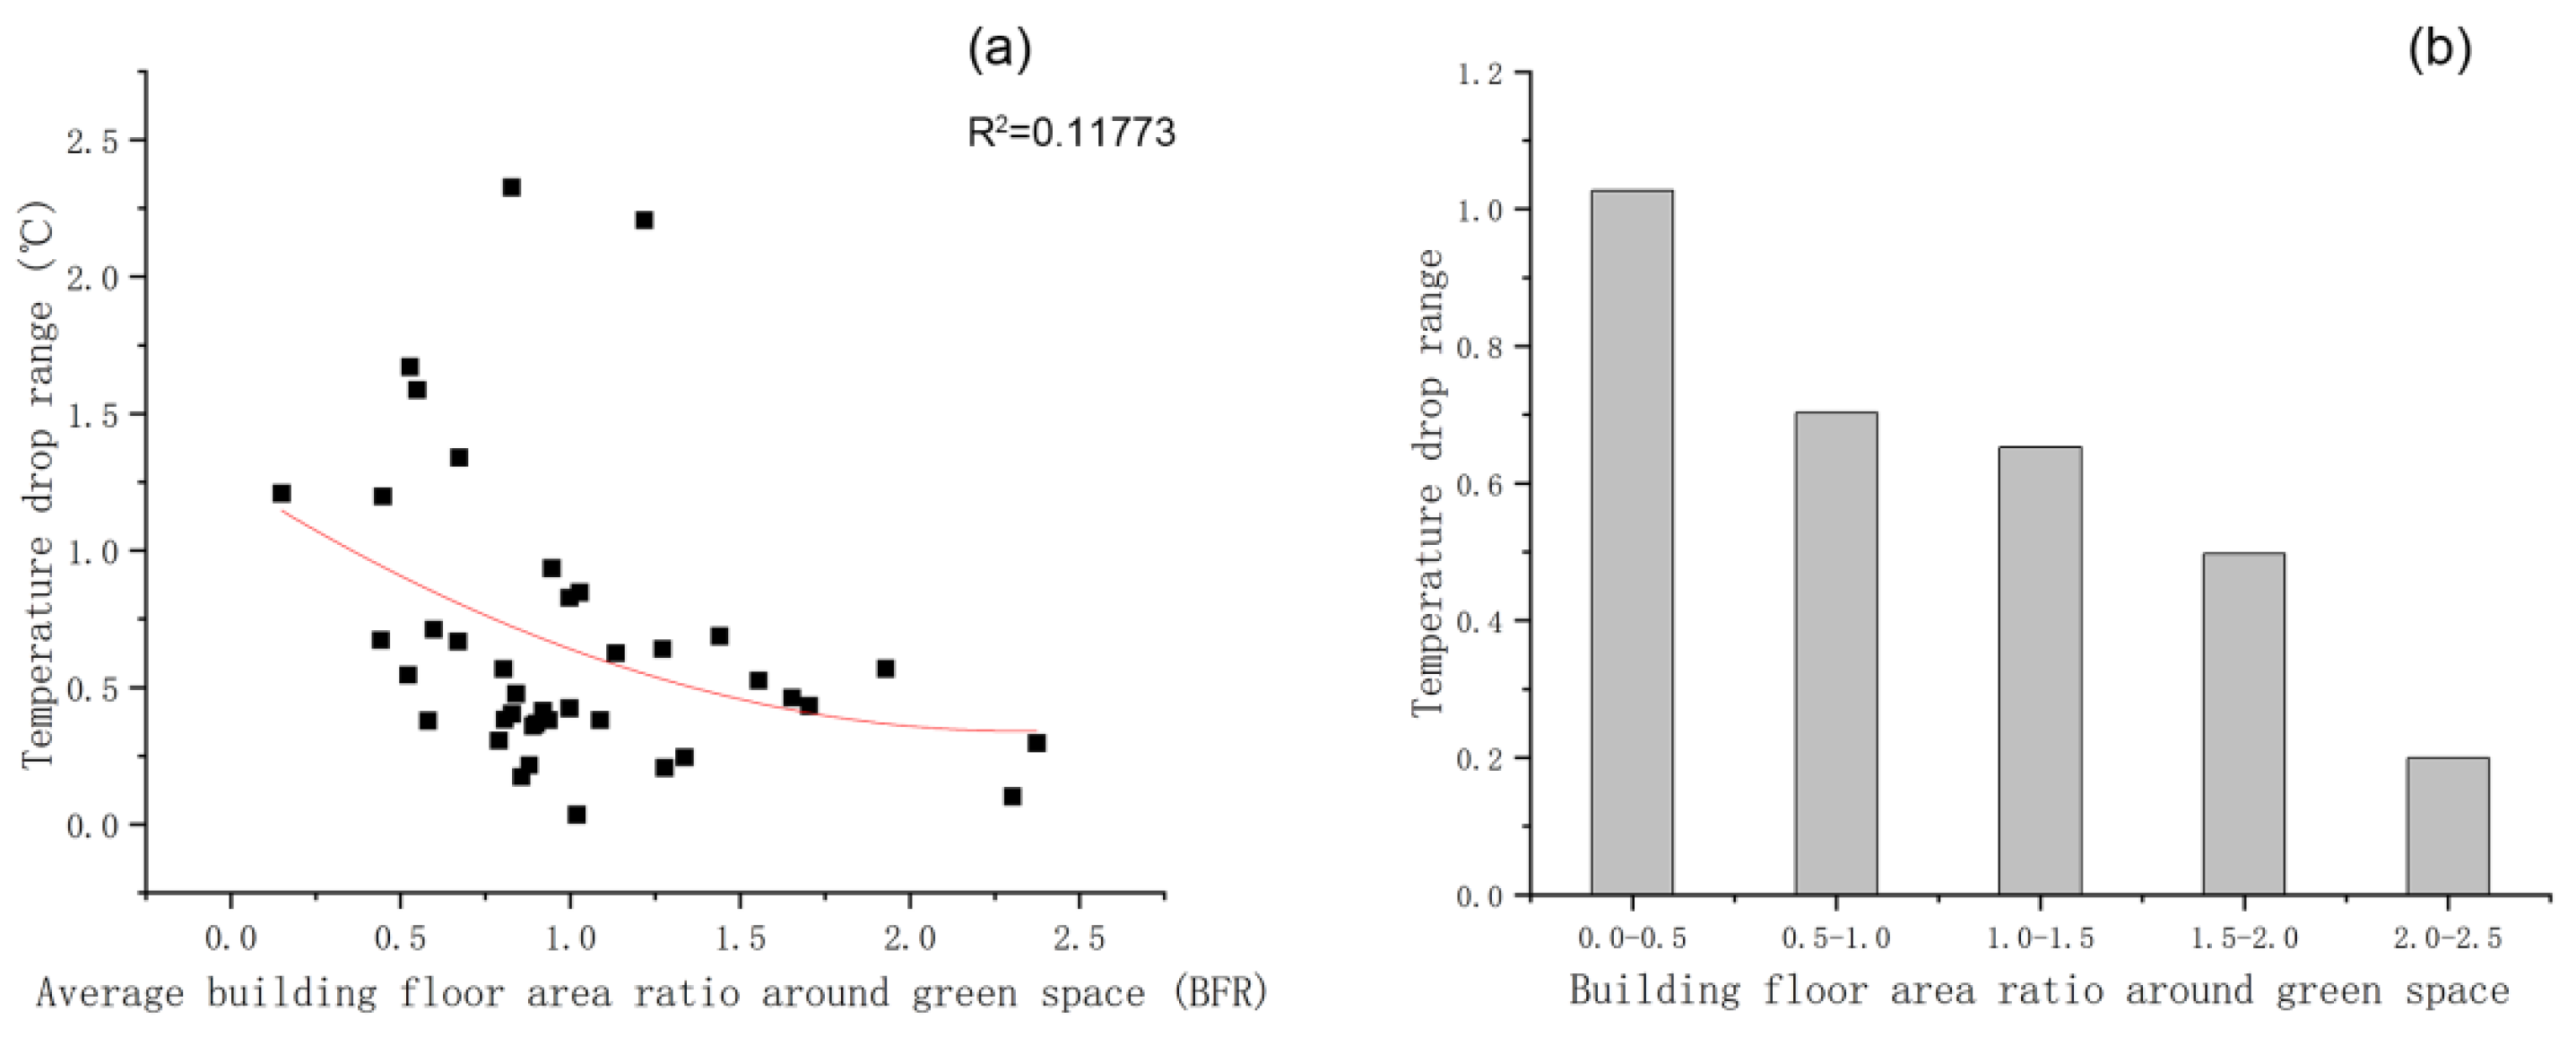
According to Table 2, the Pearson correlation coefficient between the mean BFR and cooling range of the 40 greenfield samples was −0.327 (P = 0.039 < 0.05), which indicates that they show a significant negative correlation. To explore the specific morphology of change, next, the average BFR value within the maximum cooling distance of each greenfield sample was calculated and combined with the cooling range of each greenfield sample as mentioned above, and the fitting analysis was performed, with the average BFR value as the dependent variable and the temperature drop range as the independent variable. The results prove that, as shown in Figure 8a, the higher the building floor area ratio, the lower the cooling range, and the relationship between them could be described by the curves fitting to a quadratic polynomial. This phenomenon suggests that the reduction in the magnitude of the temperature drop is attributed to the increase in the building floor area ratio, while the next step is to quantitatively analyse the specific range of values.
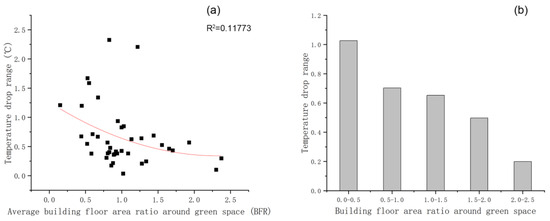
Figure 8.
(a) Fitted analysis between mean BFR values and the temperature drop range; (b) Quantitative analysis between mean BFR values and the temperature drop range.
To ascertain the precise range of building floor area ratio (BFR) in the vicinity of green areas that promotes a cooling effect, we employed BFR as the basis for classification. We partitioned all samples into five groups based on intervals of 0.5 and then counted the average temperature drop range of the buffer zone around each group of green areas and derived the statistical findings presented in Figure 8b. According to the results, temperatures in the buffer area surrounding the green areas are the lowest, exceeding 1.0 °C, when the BD falls within the range of 0.0 to 0.5. Therefore, this study proves that the smaller the building floor area ratio, the better the cooling effect brought by its green areas.
3.2.3. The Effect of The Average Height of Buildings on the Cooling Impact of Green Areas
BH is a parameter that refers to the average value of the height of the ground portion of a building in a certain unit of space and is an important indicator of a city’s level of economic development and urbanisation. Due to the distribution of different types of buildings within the same area, their heights and densities vary, and it is not possible to visualise the overall effect of BH on the cooling effect of green areas. At the same time, when the cold air in the green city areas spreads in all directions, it will be affected by the building height, which affects the convection cooling effect of the local built-up area region, and the higher the average height of the buildings means that the shaded area produced by the building is larger, which has a stronger cooling effect on the outer surface of the urban outdoor. Therefore, this study examines the urban spatial morphology indicator BH, and by studying and analysing the data on the BH values and the magnitude of cooling around the greenfield samples, we can conclude that there is a quantitative correlation between them.
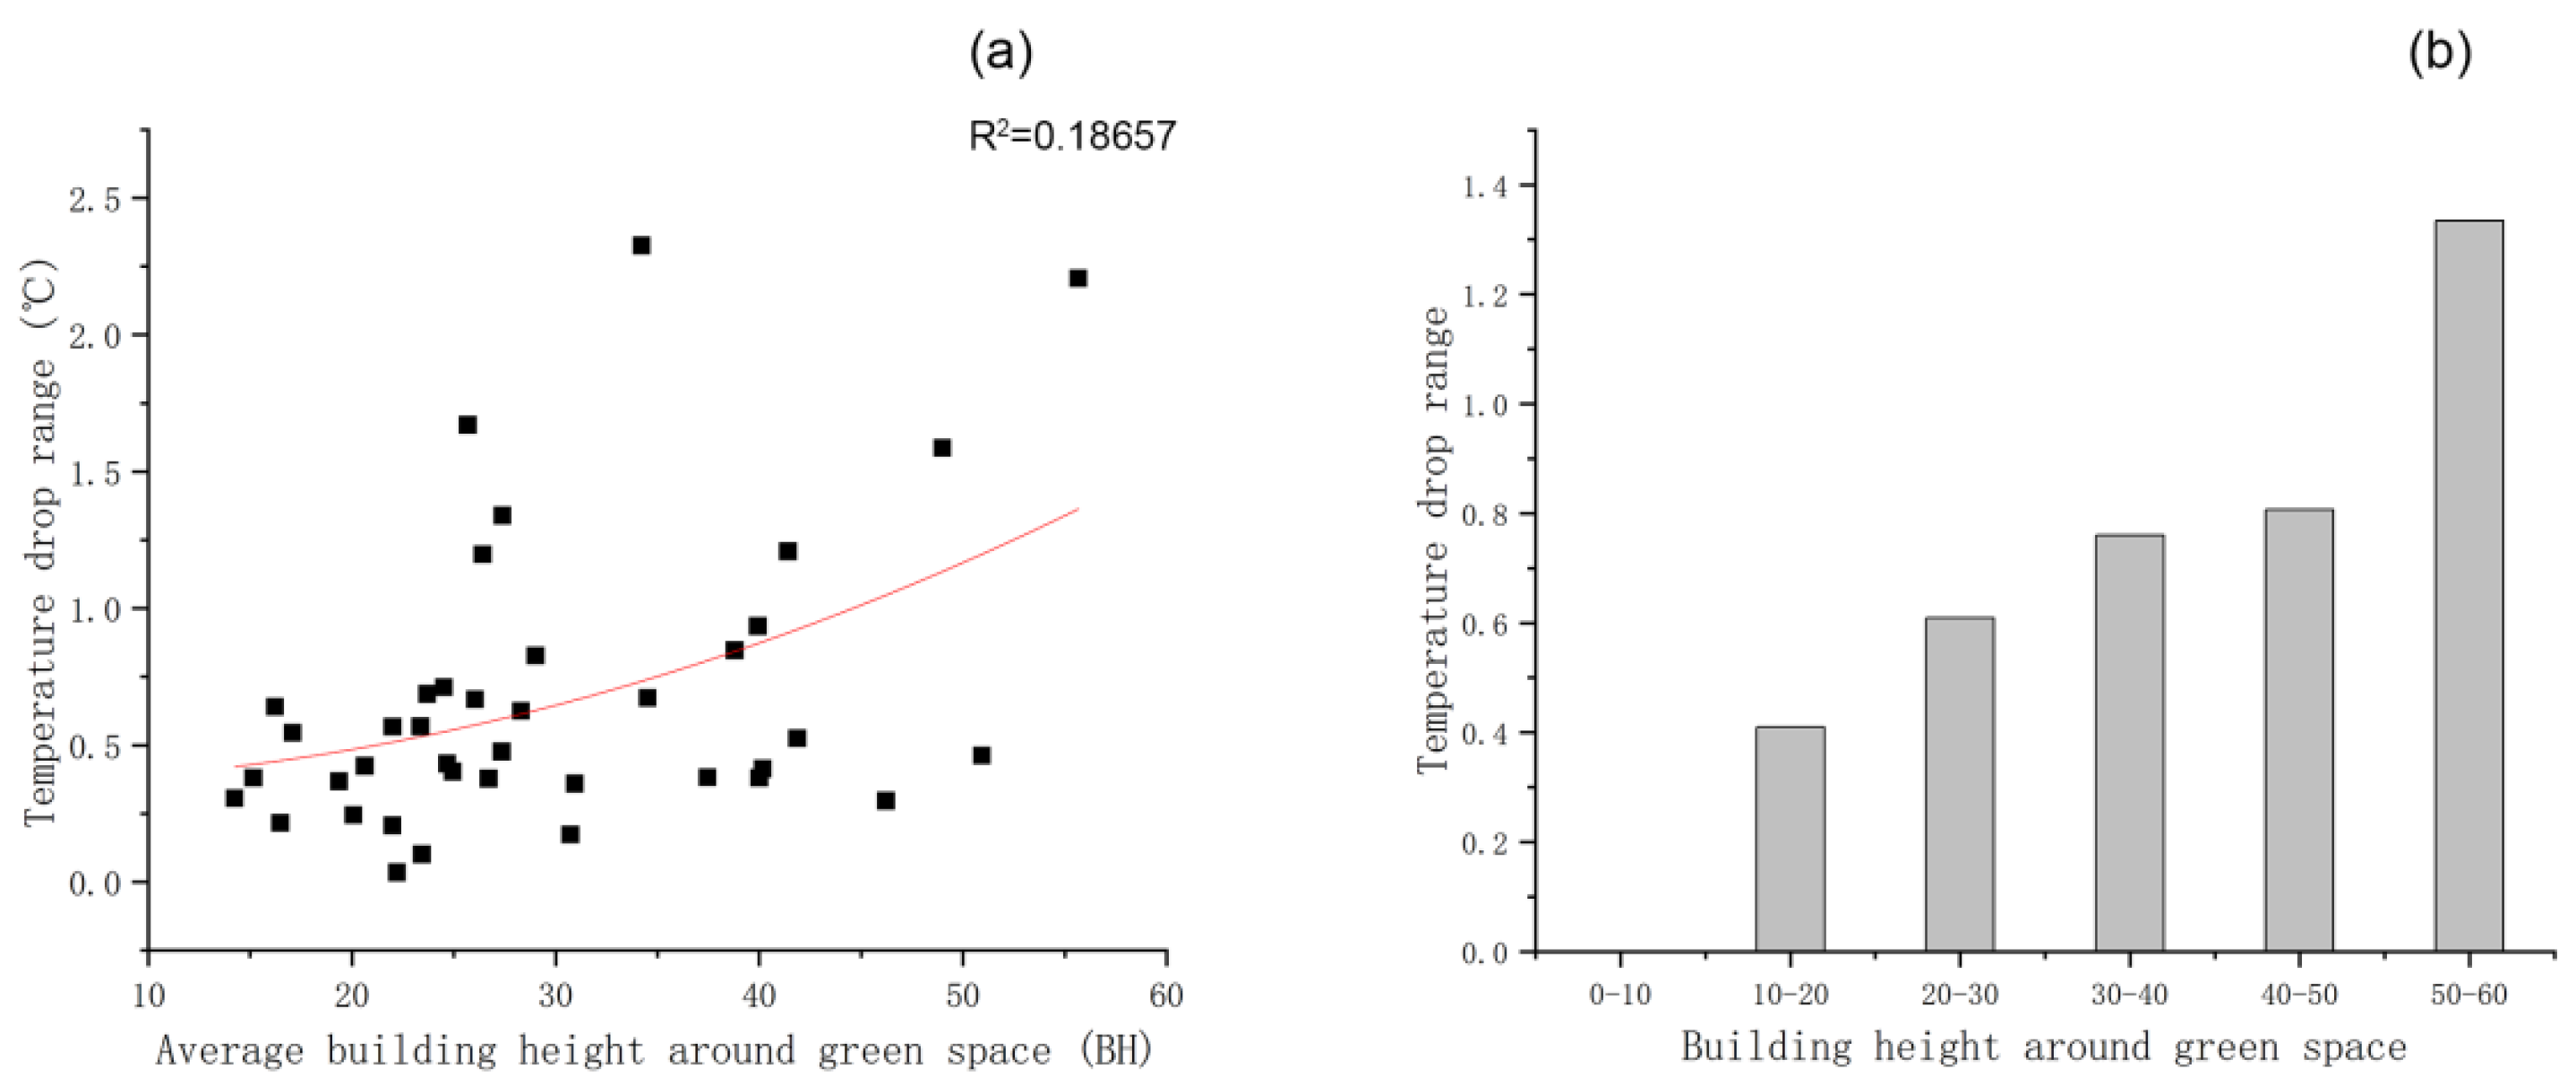
According to Table 2, the Pearson correlation coefficient between the mean BH and cooling range of the 40 greenfield samples was 0.426 (P = 0.006 <0.01), which indicates that they show a significant positive correlation. To explore the specific morphology of change, next, the average BH value within the maximum cooling distance of each greenfield sample was calculated and combined with the cooling range of each greenfield sample as mentioned above, and the fitting analysis was performed, with the average BH value as the dependent variable and the temperature drop range as the independent variable. The results prove that, as shown in Figure 9a, the higher the average height of buildings, the stronger the cooling range and the relationship between them could be described by the curves fitting to a quadratic polynomial. This phenomenon suggests that the increase in the magnitude of temperature drop is attributed to the increase in the average height of buildings, while the next step is to quantitatively analyse the specific range of values.
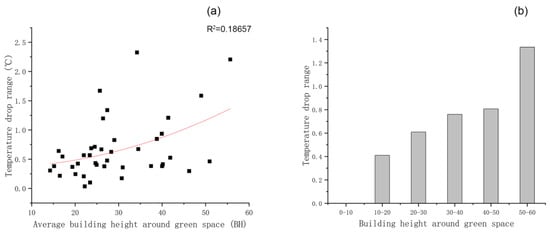
Figure 9.
(a) Fitted analysis between mean BH values and the temperature drop range; (b) Quantitative analysis between mean BH values and the temperature drop range.
To ascertain the precise range of the average height of buildings (BH) in the vicinity of green areas that promote a cooling effect, we employed BH as the basis for classification. We partitioned all samples into six groups based on intervals of 10, and then counted the average temperature drop range of the buffer zone around each group of green areas and derived the statistical findings presented in Figure 9b. According to the results, temperatures in the buffer area surrounding the green areas are the lowest, exceeding 1.3°C, when the BH falls within the range of 50 to 60. Therefore, this study proves that the bigger the average height of buildings, the better the cooling effect brought by their green areas.
3.2.4. The Effect of The Building Height Standard Deviation on the Cooling Impact of Green Areas
BSD is a parameter that refers to the height of all buildings in the space unit standard deviation and is an important indicator of the complexity of the spatial form of a city’s building stock. Due to the distribution of different types of buildings within the same area, their heights and densities vary, and it is not possible to visualise the overall effect of BSD on the cooling effect of green areas. At the same time, when the cold air in the green city areas spreads in all directions, it will be affected by the building height standard deviation, which in turn affects the convection cooling effect of the local built-up area region. Moreover, the bigger the building height standard deviation, the more contrast and complexity of the building in the vertical direction, which is more conducive to heat dissipation from the UHI. Therefore, this study examines the urban spatial morphology indicator BSD, and by studying and analysing the data on the BSD values and the magnitude of cooling around the greenfield samples, we can conclude that there is a quantitative correlation between them.
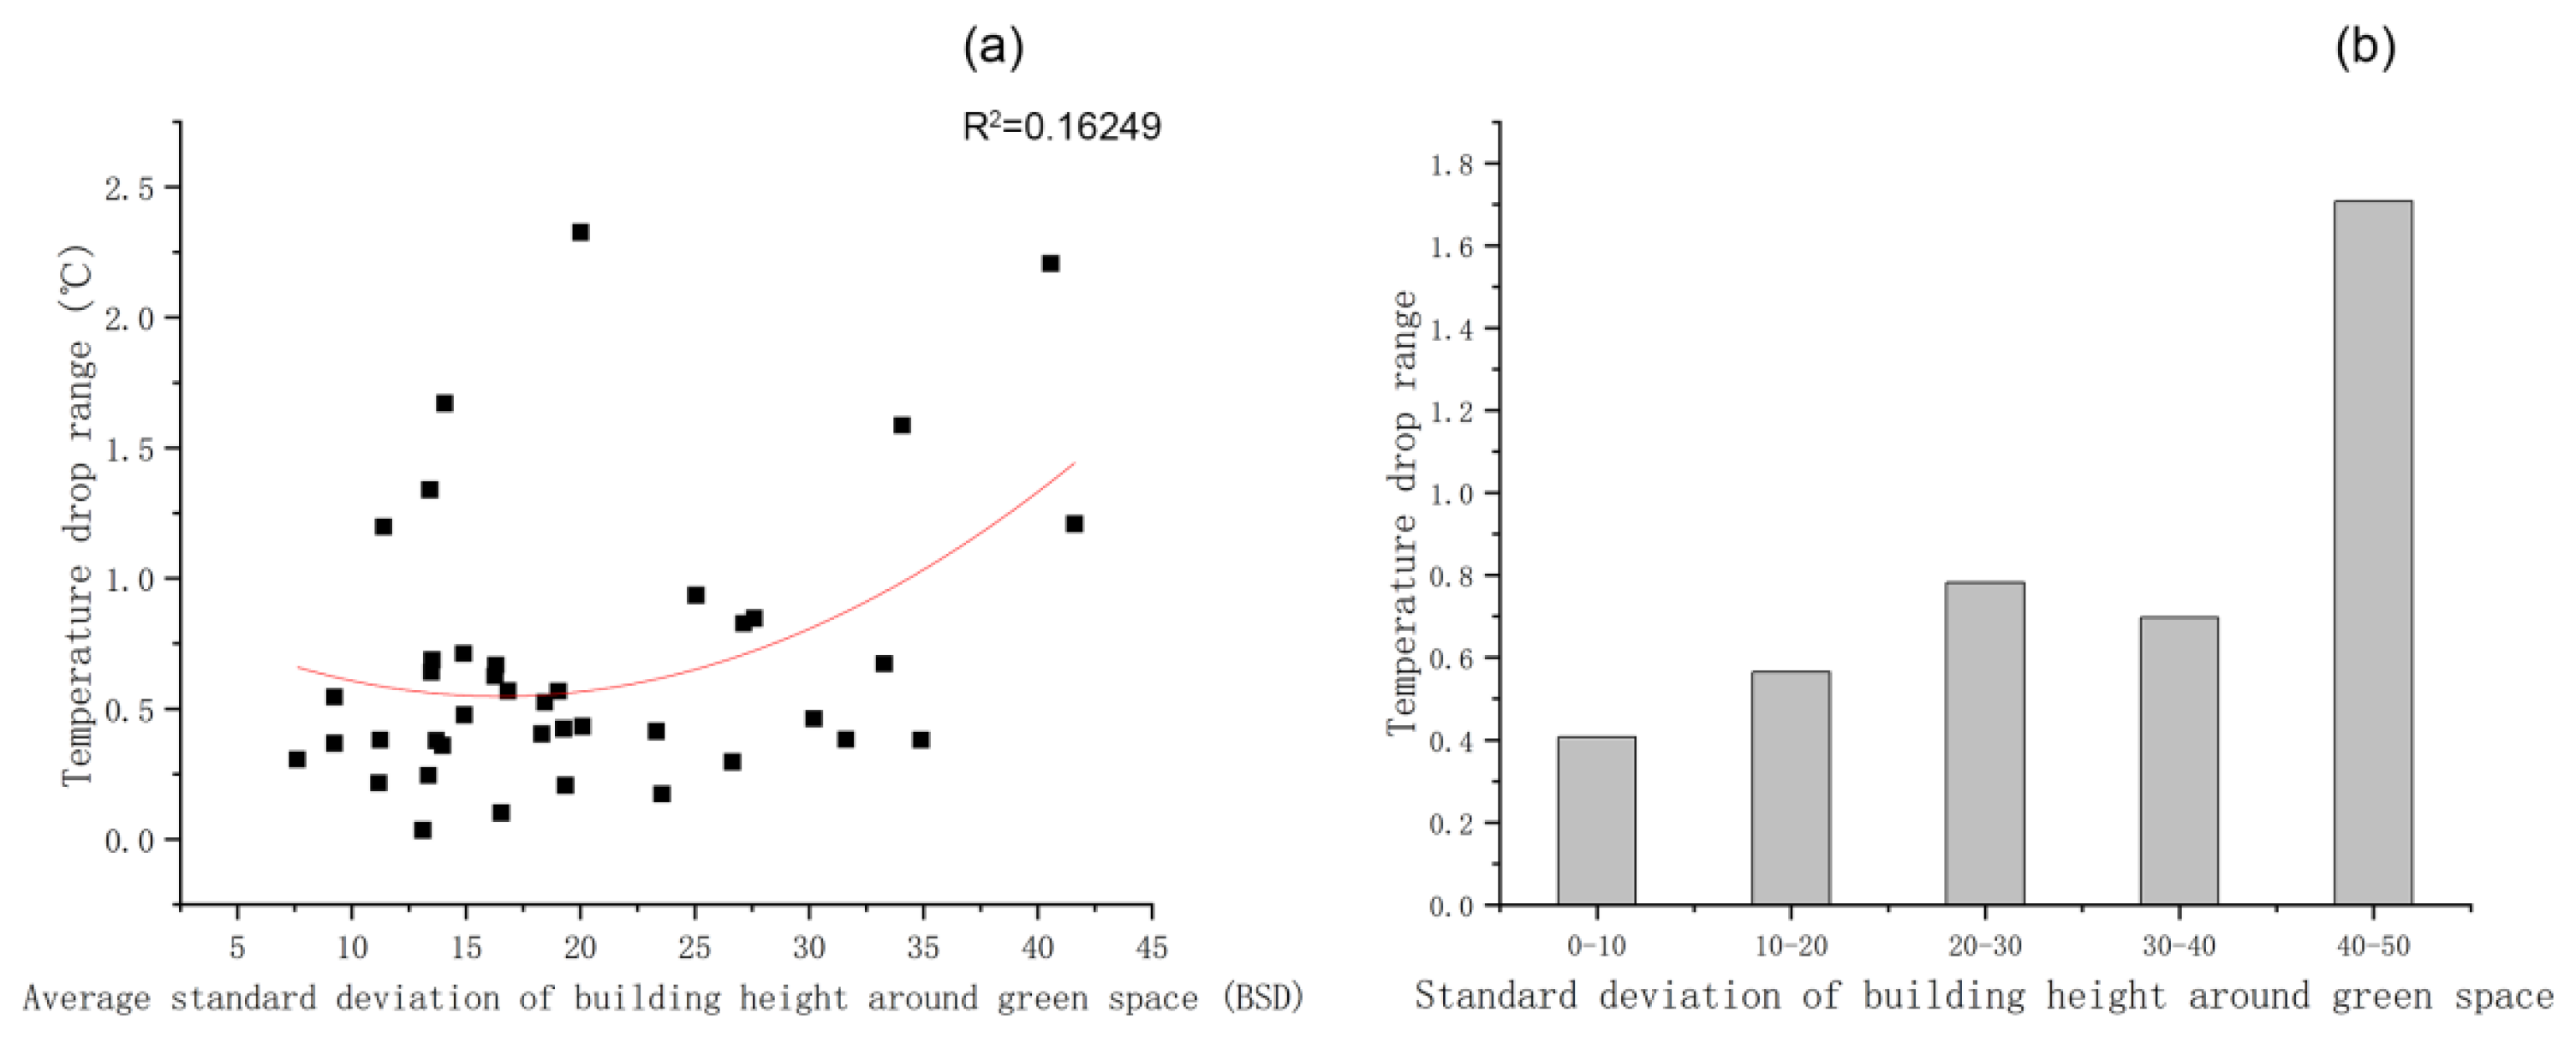
According to Table 2, the Pearson correlation coefficient between the mean BSD and cooling range of the 40 greenfield samples was 0.341 (P = 0.031 < 0.05), which indicates that they show a significant positive correlation. To explore the specific morphology of change, next, the average BSD value within the maximum cooling distance of each greenfield sample was calculated and combined with the cooling range of each greenfield sample as mentioned above, and the fitting analysis was performed, with the average BSD value as the dependent variable and the temperature drop range as the independent variable. The results prove that, as shown in Figure 10a, the bigger the building height standard deviation, the stronger the cooling range, and the relationship between them could be described by the curves fitting to a quadratic polynomial. This phenomenon suggests that the increase in the magnitude of temperature drop is attributed to the increase in the building height standard deviation, while the next step is to quantitatively analyse the specific range of values.
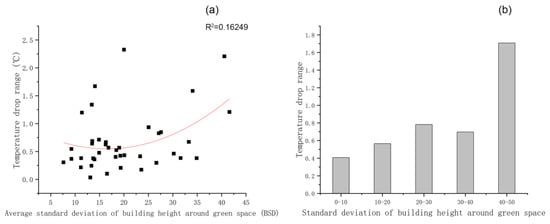
Figure 10.
(a) Fitted analysis between mean BSD values and the temperature drop range; (b) quantitative analysis between mean BSD values and the temperature drop range.
To ascertain the precise range of the building height standard deviation (BSD) in the vicinity of green areas that promotes a cooling effect, we employed BSD as the basis for classification. We partitioned all samples into five groups based on intervals of 10, and then counted the average temperature drop range of the buffer zone around each group of green areas and derived the statistical findings presented in Figure 10b. According to the results, temperatures in the buffer area surrounding the green areas are the lowest, exceeding 1.7 °C, when the BSD falls within the range of 40 to 50. Therefore, this study proves that the bigger the building height standard deviation, the better the cooling effect brought by its green areas.
3.3. Analysis of the Influencing Magnitude of Urban Spatial Morphology on the Cooling Effect of Green City Areas
After the quantitative analysis of the four urban spatial morphology indicators (BD, BFR, BH, BSD), the size of the influence of different independent variables on the dependent variable was further analysed through standardised regression coefficients to explore the size of the influence of BD, BFR, BH, and BSD on the cooling effect of green city areas, and the larger the absolute value of standardised regression coefficients, the greater the influence of this independent variable on the dependent variable. According to the results of the absolute value (Table 3), it can be found that 0.696 > 0.665 > 0.155 > 0.053, so the results show that in these four urban spatial indicators, the average height of the building has the most significant influence. In contrast, the difference in building height has the least influence. Therefore, the average building height should be maximised in the urban planning and design around the green city areas to better utilise the cooling effect of the green city areas and improve the urban heat island effect.
Table 3.
The magnitude of the effect of BD, BFR, BH, and BSD on the cooling effect.
3.4. The Effect of Relative Position of Buildings on Cooling Impacts around Green Areas
The relative position of buildings is also an important index in the study of urban spatial morphology, which is an important parameter that cannot be ignored in urban construction and urban planning. Due to the construction planning of the city in different periods, it is impossible to visualise the overall effect of the relative position of buildings on the cooling effect of green areas. When the cold air in the green city areas spreads in all directions, it will be affected by the wind direction and other factors in the urban built-up area, which affects the convective cooling effect in the urban built-up area. Therefore, the study investigates the relative positions of buildings around green city spaces. Additionally, green city areas can lose their cooling effect when complex urban environments are present, such as the urban spatial morphology indicators described in the previous section. It is necessary to screen the green area samples to avoid, as much as possible, the negative impact of complex factors on the study and to reduce the differences in the spatial morphology of buildings in the built-up area around the green areas. The selection of green area samples should therefore meet the following two criteria: (1) the type of land in the range of the maximum cooling effect of green area samples should be residential land, excluding large-area industrial land (this is because the urban spatial morphology of residential land are more varied and representative than those of industrial land, while industrial land is often remote and has a single building function, and the heat generated by industrial production will affect the accuracy of the study); (2) the type of land in the range of the maximum green area samples should be multi-story buildings, and indicators of urban spatial morphology should be similar as well (this is to further control for differences in the study subjects, and multi-story buildings require avoiding the negative impact of extreme situations, such as vacant lots and squares, on the study). According to the distribution map of six urban spatial morphology indicators in Changsha, eight samples of eligible green city spaces were selected and their average temperatures in four directions were calculated (Table 4).
Table 4.
The temperature of the surface of the green area sample varies in different directions.
After the study, it was found that the temperature was highest in the dense building area of Changsha Changsha City’s west side of the green areas and gradually decreased in the north, east, and south, as shown in Table 3. In this case, the location of buildings affects the cooling effect of green areas. For a subtropical city like Changsha, a building located on the south side of the green area will likely experience better cooling. In contrast, a building located on the west side will encounter the least cooling effect from the green area. The results of this study explain the difference in temperature between the green city areas and the surrounding area. Changsha is in the south of China, close to the Pacific Ocean, and is strongly influenced by the Pacific summer south-eastern monsoon. Buildings on the south side are mainly in shadow. Hence, the south side of the green area experiences a lower average temperature than the other three. Conversely, buildings on the west side are more exposed to the sun and are not shaded, so the temperature of buildings on the west side is usually higher than that of buildings on the east side. In conclusion, under the same conditions, in subtropical urban cities, the built-up areas distributed in the southern part of the greenbelt obtained the most effective cooling impact from the greenbelt, followed by the east, north, and west.
4. Discussion
This study, based on Landsat images of the subtropical city of Changsha, proves that green city areas do have a certain cooling effect and can play a certain role in mitigating the UHI, which has also been confirmed in different urban studies. There are 180.8018 m in the average maximum cooling distance of green city areas, while 0.6702 °C is the average cooling range in green city areas. There is some disagreement between the conclusions of this study and those found in previous studies. Yan et al. found 316 green areas in cities with a cooling range of 100.0 ± 74.4 m and a cooling intensity of 1.7 ± 1.1 °C [65]. However, Du et al. noted that urban green has a substantial cooling island effect, with 68 green areas having a mean cooling range and cooling magnitude of 570 m and 2.63 °C [66], respectively. There are many reasons for the differences in the study, as different cities have different urban environments. For example, the climatic differences of the study cities, the level of urbanisation, and other factors will impact the results. In addition, factors such as the date of the Landsat images of the study cities and the differences between the remote sensing satellite sensors may be included. Therefore, the influence of the above factors can be further reduced in subsequent studies.
This study focuses on quantifying the influence of urban spatial morphology indicators on the cooling effect of green areas. The study proves that the urban spatial morphology around green areas can indeed influence the cooling effect of green areas, including building density, building floor area ratio, building average height, building height standard deviation, and relative position of buildings, and that the building average height has the most significant influence among these four urban spatial morphology indicators. This is consistent with the findings of many studies. A study in Singapore using field measurements and numerical simulations showed that building volume ratio and average building height affected the cooling effect of green areas [67]. A study in Nanjing, China, using spatial regression modeling, showed that sparse high-rise buildings are more conducive to the spread of cooling effects in urban parks than compact high-rise buildings [68].
Meanwhile, a study in Hangzhou, China, using field measurements and numerical simulations, showed that building height, building spacing, and study building orientation all affect cooling in urban parks, while building height has the most significant effect on cooling intensity, which can reach 1.2 °C [69]. Therefore, in the perimeter of green areas, the reduction of building density and building floor area ratio means that the urban space is more open, which is more convenient for the diffusion of the cooling effect of green areas. The increase in building average height and building height standard deviation means more effective shading is provided, reducing or delaying the effect of direct sunlight on near-surface temperatures, thus making the cooling effect of the green areas more significant. This phenomenon has also been observed in previous studies [70,71,72]. This study builds on this by quantifying data specific to urban spatial morphology to maximise the cooling effect of green areas.
Nevertheless, there are some limitations of the current study that deserve further reflection. First of all, the research area of this study is Changsha, China, which has a typical subtropical monsoon climate, so the results of this study have a reference value for cities under subtropical monsoon climate but do not apply to the research under other climates, so the research can be carried out for cities under different climatic characteristics in the follow-up study to explore the commonality and individuality of the cooling effect of the urban green under different climatic characteristics. Secondly, green areas in cities were not considered from an internal perspective, such as density, height, type, and the percentage of different forms of green areas. Also, this study did not consider the external considerations of green city areas, such as the wind speed and direction of the city and the layout morphology of urban buildings. Finally, the research object of this study is urban spatial morphology indicators, which are closely related to the spatial layout of urban buildings and other elements. Combined with relevant references [11,73,74], in the subsequent research, we can take advantage of the ENVI-met software simulation and analysis to explore the relationship between urban spatial morphology and the cooling effect of the green city areas in a more in-depth manner.
5. Conclusions
In this study, the cooling effect of green city spaces was examined in urban spatial morphology indicators. The study samples included 40 green areas in Changsha, a subtropical city, and six urban spatial indicators, namely, BD, BFR, BVD, BEI, BH, and BSD, were quantitatively analysed to determine the influence of the cooling effect of the green areas. Therefore, the main findings include: (1) The study revealed that the building density (BD) of the developed region surrounding the green areas significantly influences its cooling effect. Moreover, a quadratic polynomial relationship was observed between BD and the magnitude of cooling provided by the green areas. Notably, the optimal cooling effect is achieved when the BD of the surrounding area falls within the range of 0.00 to 0.05. (2) The study revealed that the building floor area ratio (BFR) of the developed region surrounding the green areas significantly influences its cooling effect. Moreover, a quadratic polynomial relationship was observed between BFR and the magnitude of cooling provided by the green areas. Notably, the optimal cooling effect is achieved when the BFR of the surrounding area falls within the range of 0.0 to 0.5. (3) The study revealed that the average BH of the developed region surrounding the green areas significantly influences its cooling effect. Moreover, a quadratic polynomial relationship was observed between BH and the magnitude of cooling provided by the green areas. Notably, the optimal cooling effect is achieved when the BH of the surrounding area falls within the range of 50 to 60. (4) The study revealed that the BSD of the developed region surrounding the green areas significantly influences its cooling effect. Moreover, a quadratic polynomial relationship was observed between BSD and the magnitude of cooling provided by the green areas. Notably, the optimal cooling effect is achieved when the BSD of the surrounding area falls within the range of 40 to 50. (5) Buildings in subtropical cities are situated on the south side of the greenbelt, where they receive perfect cooling from the greenbelt under similar conditions.
According to the research results of this study, in order to mitigate the urban heat island effect, the planning and design of the green city areas perimeter can take the following specific measures: (1) Encourage and support low-density and low-volume-rate urban construction, and reduce the density and volume rate of the buildings around the green city areas as much as possible, so as to maximise the cooling effect of the green city areas; (2) implement urban renewal and renovation, and for the old residential areas with excessive density and volume rate around the green city areas, the buildings can be adjusted through urban renewal and renovation; (3) urban architectural design should increase the height and height difference of buildings, and the buildings around the green city areas should adopt the vertical form of high and low undulation, in order to promote the convection and heat dissipation in the vertical direction of the neighborhood, and at the same time take into account the shading effect of the buildings; (4) urban architectural design should reduce the floor area, increase the height of the buildings, and design to reserve more ground space for the layout of the green areas, and at the same time provide more public open space for the nearby residents; (5) among the four urban spatial indicators, namely, BD, BFR, BH, and BSD, the BH has the most significant influence, so the average building height should be maximised in urban planning and design to give full play to the cooling effect that green city areas has as much as possible; (6) at the same time, the guidelines of this study can be used as part of a development strategy for subtropical cities with similar climatic conditions to Changsha City.
Author Contributions
Conceptualization: J.L. and H.W.; Methodology: H.W. and Y.C.; Formal analysis and investigation: H.W., J.Q., G.Z., C.Z. and Y.L.; Writing—original draft preparation: H.W.; Writing—review and editing: J.L. and Y.C.; Funding acquisition: S.L., J.L. and X.C.; Resources: J.L., X.C. and W.L.; Supervision: J.L. and S.L. All authors have read and agreed to the published version of the manuscript.
Funding
This work was supported by the National Natural Science Foundation of China (No. 52108049 and No. 42177072), the Natural Science Foundation of Hunan Province, China (2023JJ30182), the Humanities and Social Science Fund of Ministry of Education of China (No. 20YJCZH003).
Institutional Review Board Statement
Not applicable.
Informed Consent Statement
Not applicable.
Data Availability Statement
The datasets generated and analyzed during the current study are available from the corresponding author on reasonable request.
Conflicts of Interest
The authors declare that they have no known competing financial interests or personal relationships that could have appeared to influence the work reported in this paper.
References
- Arnfield, A.J. Two decades of urban climate research: A review of turbulence, exchanges of energy and water, and the urban heat island. Int. J. Climatol. 2003, 23, 1–26. [Google Scholar] [CrossRef]
- Balany, F.; Ng, A.W.M.; Muttil, N.; Muthukumaran, S.; Wong, M.S. Green Infrastructure as an Urban Heat Island Mitigation Strategy—A Review. Water 2020, 12, 3577. [Google Scholar] [CrossRef]
- Du, S.H.; Zhang, X.K.; Jin, X.; Zhou, X.; Shi, X. A review of multi-scale modelling, assessment, and improvement methods of the urban thermal and wind environment. Build. Environ. 2022, 213, 108860. [Google Scholar] [CrossRef]
- Lee, S.H.; Lee, K.S.; Jin, W.C.; Song, H.K. Effect of an urban park on air temperature differences in a central business district area. Landsc. Ecol. Eng. 2009, 5, 183–191. [Google Scholar] [CrossRef]
- Iping, A.; Kidston-Lattari, J.; Simpson-Young, A.; Duncan, E.; McManus, P. (Re)presenting urban heat islands in Australian cities: A study of media reporting and implications for urban heat and climate change debates. Urban Clim. 2019, 27, 420–429. [Google Scholar] [CrossRef]
- Liu, X.; Zhou, Y.Y.; Yue, W.Z.; Li, X.C.; Liu, Y.; Lu, D.B. Spatiotemporal patterns of summer urban heat island in Beijing, China using an improved land surface temperature. J. Clean. Prod. 2020, 257, 120529. [Google Scholar] [CrossRef]
- Yang, F.; Lau, S.S.Y.; Qian, F. Summertime heat island intensities in three high-rise housing quarters in inner-city Shanghai China: Building layout, density and greenery. Build. Environ. 2010, 45, 115–134. [Google Scholar] [CrossRef]
- He, B.J.; Wang, J.S.; Liu, H.M.; Ulpiani, G. Localized synergies between heat waves and urban heat islands: Implications on human thermal comfort and urban heat management. Environ. Res. 2021, 193, 110584. [Google Scholar] [CrossRef] [PubMed]
- Li, H.D.; Zhou, Y.Y.; Jia, G.S.; Zhao, K.G.; Dong, J.W. Quantifying the response of surface urban heat island to urbanization using the annual temperature cycle model. Geosci. Front. 2022, 13, 101141. [Google Scholar] [CrossRef]
- Patz, J.A.; Campbell-Lendrum, D.; Holloway, T.; Foley, J.A. Impact of regional climate change on human health. Nature 2005, 438, 310–317. [Google Scholar] [CrossRef]
- Lin, B.S.; Lin, C.T. Preliminary study of the influence of the spatial arrangement of urban parks on local temperature reduction. Urban For. Urban Green. 2016, 20, 348–357. [Google Scholar] [CrossRef]
- Ren, Z.B.; Fu, Y.; Dong, Y.L.; Zhang, P.; He, X.Y. Rapid urbanization and climate change significantly contribute to worsening urban human thermal comfort: A national 183-city, 26-year study in China. Urban Clim. 2022, 43, 101154. [Google Scholar] [CrossRef]
- Kim, K.; Yi, C.; Lee, S. Impact of urban characteristics on cooling energy consumption before and after construction of an urban park: The case of Gyeongui line forest in Seoul. Energy Build. 2019, 191, 42–51. [Google Scholar] [CrossRef]
- Grimm, N.B.; Faeth, S.H.; Golubiewski, N.E.; Redman, C.L.; Wu, J.G.; Bai, X.M.; Briggs, J.M. Global change and the ecology of cities. Science 2008, 319, 756–760. [Google Scholar] [CrossRef] [PubMed]
- Yuan, C.; Chen, L. Mitigating urban heat island effects in high-density cities based on sky view factor and urban morphological understanding: A study of Hong Kong. Archit. Sci. Rev. 2011, 54, 305–315. [Google Scholar] [CrossRef]
- Khare, V.R.; Vajpai, A.; Gupta, D. A big picture of urban heat island mitigation strategies and recommendation for India. Urban Clim. 2021, 37, 100845. [Google Scholar] [CrossRef]
- Sheng, S.; Xiao, H.B.; Wang, Y.C. The cooling effects of hybrid landscapes at the district scale in mega-cities: A case study of Shanghai. J. Clean. Prod. 2022, 366, 132942. [Google Scholar] [CrossRef]
- Yin, S.; Shen, Z.M.; Zhou, P.S.; Zou, X.D.; Che, S.Q.; Wang, W.H. Quantifying air pollution attenuation within urban parks: An experimental approach in Shanghai, China. Environ. Pollut. 2011, 159, 2155–2163. [Google Scholar] [CrossRef] [PubMed]
- Vailshery, L.S.; Jaganmohan, M.; Nagendra, H. Effect of street trees on microclimate and air pollution in a tropical city. Urban For. Urban Green. 2013, 12, 408–415. [Google Scholar] [CrossRef]
- Hermy, M.; Cornelis, J. Towards a monitoring method and a number of multifaceted and hierarchical biodiversity indicators for urban and suburban parks. Landsc. Urban Plan. 2000, 49, 149–162. [Google Scholar] [CrossRef]
- Huang, M.; Cui, P.; He, X. Study of the Cooling Effects of Urban Green Space in Harbin in Terms of Reducing the Heat Island Effect. Sustainability 2018, 10, 1101. [Google Scholar] [CrossRef]
- Wang, X.Y.; Miao, S.G.; Liu, H.N.; Sun, J.N.; Zhang, N.; Zou, J. Assessing the Impact of Urban Hydrological Processes on the Summertime Urban Climate in Nanjing Using the WRF Model. J. Geophys. Res. -Atmos. 2019, 124, 12683–12707. [Google Scholar] [CrossRef]
- Masoudi, M.; Tan, P.Y. Multi-year comparison of the effects of spatial pattern of urban green spaces on urban land surface temperature. Landsc. Urban Plan. 2019, 184, 44–58. [Google Scholar] [CrossRef]
- Algretawee, H.; Rayburg, S.; Neave, M. Estimating the effect of park proximity to the central of Melbourne city on Urban Heat Island (UHI) relative to Land Surface Temperature (LST). Ecol. Eng. 2019, 138, 374–390. [Google Scholar] [CrossRef]
- Yu, Z.W.; Guo, X.Y.; Zeng, Y.X.; Koga, M.; Vejre, H. Variations in land surface temperature and cooling efficiency of green space in rapid urbanization: The case of Fuzhou city, China. Urban For. Urban Green. 2018, 29, 113–121. [Google Scholar] [CrossRef]
- Chen, X.T.; Wang, Z.T.; Bao, Y. Cool island effects of urban remnant natural mountains for cooling communities: A case study of Guiyang, China. Sustain. Cities Soc. 2021, 71, 102983. [Google Scholar] [CrossRef]
- Cohen, P.; Potchter, O.; Matzarakis, A. Daily and seasonal climatic conditions of green urban open spaces in the Mediterranean climate and their impact on human comfort. Build. Environ. 2012, 51, 285–295. [Google Scholar] [CrossRef]
- Skoulika, F.; Santamouris, M.; Kolokotsa, D.; Boemi, N. On the thermal characteristics and the mitigation potential of a medium size urban park in Athens, Greece. Landsc. Urban Plan. 2014, 123, 73–86. [Google Scholar] [CrossRef]
- Doick, K.J.; Peace, A.; Hutchings, T.R. The role of one large greenspace in mitigating London’s nocturnal urban heat island. Sci. Total Environ. 2014, 493, 662–671. [Google Scholar] [CrossRef]
- Oliveira, S.; Andrade, H.; Vaz, T. The cooling effect of green spaces as a contribution to the mitigation of urban heat: A case study in Lisbon. Build. Environ. 2011, 46, 2186–2194. [Google Scholar] [CrossRef]
- Ziter, C.D.; Pedersen, E.J.; Kucharik, C.J.; Turner, M.G. Scale-dependent interactions between tree canopy cover and impervious surfaces reduce daytime urban heat during summer. Proc. Natl. Acad. Sci. USA 2019, 116, 7575–7580. [Google Scholar] [CrossRef] [PubMed]
- Murtinova, V.; Gallay, I.; Olah, B. Mitigating Effect of Urban Green Spaces on Surface Urban Heat Island during Summer Period on an Example of a Medium Size Town of Zvolen, Slovakia. Remote Sens. 2022, 14, 4492. [Google Scholar] [CrossRef]
- Park, J.H.; Cho, G.H. Examining the Association between Physical Characteristics of Green Space and Land Surface Temperature: A Case Study of Ulsan, Korea. Sustainability 2016, 8, 777. [Google Scholar] [CrossRef]
- Han, X.Y.; Zhang, J.J.; Rao, Y.H.; Jing, G.L. Hindering the impact of building characteristics on greenbelt cooling effects: A perspective of quantitative simulation with in situ measurements. Sci. Total Environ. 2019, 670, 308–319. [Google Scholar] [CrossRef] [PubMed]
- Mohamed, A.A.; Odindi, J.; Mutanga, O. Land surface temperature and emissivity estimation for Urban Heat Island assessment using medium- and low-resolution space-borne sensors: A review. Geocarto Int. 2017, 32, 455–470. [Google Scholar] [CrossRef]
- Pramanik, S.; Punia, M. Assessment of green space cooling effects in dense urban landscape: A case study of Delhi, India. Model. Earth Syst. Environ. 2019, 5, 867–884. [Google Scholar] [CrossRef]
- Blachowski, J.; Hajnrych, M. Assessing the Cooling Effect of Four Urban Parks of Different Sizes in a Temperate Continental Climate Zone: Wroclaw (Poland). Forests 2021, 12, 1136. [Google Scholar] [CrossRef]
- Song, Y.; Song, X.D.; Shao, G.F. Effects of Green Space Patterns on Urban Thermal Environment at Multiple Spatial-Temporal Scales. Sustainability 2020, 12, 6850. [Google Scholar] [CrossRef]
- Xiao, Y.; Dai, S.Z.; Zhao, B. Mitigation of urban heat island effect with small-scale parks—An empirical study on community parks in Nanjing, Jiangsu province. Landsc. Archit. Front. 2020, 8, 26–43. [Google Scholar] [CrossRef]
- Bao, T.L.G.; Li, X.M.; Zhang, J.; Zhang, Y.J.; Tian, S.Z. Assessing the Distribution of Urban Green Spaces and its Anisotropic Cooling Distance on Urban Heat Island Pattern in Baotou, China. ISPRS Int. Geo-Inf. 2016, 5, 12. [Google Scholar] [CrossRef]
- Xiao, X.D.; Dong, L.; Yan, H.N.; Yang, N.; Xiong, Y.M. The influence of the spatial characteristics of urban green space on the urban heat island effect in Suzhou Industrial Park. Sustain. Cities Soc. 2018, 40, 428–439. [Google Scholar] [CrossRef]
- Cao, X.; Onishi, A.; Chen, J.; Imura, H. Quantifying the cool island intensity of urban parks using ASTER and IKONOS data. Landsc. Urban Plan. 2010, 96, 224–231. [Google Scholar] [CrossRef]
- Wang, X.J.; Cheng, H.M.; Xi, J.; Yang, G.Y.; Zhao, Y.W. Relationship between Park Composition, Vegetation Characteristics and Cool Island Effect. Sustainability 2018, 10, 587. [Google Scholar] [CrossRef]
- Shi, Y.; Lau, K.K.L.; Ren, C.; Ng, E. Evaluating the local climate zone classification in high-density heterogeneous urban environment using mobile measurement. Urban Clim. 2018, 25, 167–186. [Google Scholar] [CrossRef]
- Chang, C.R.; Li, M.H.; Chang, S.D. A preliminary study on the local cool-island intensity of Taipei city parks. Landsc. Urban Plan. 2007, 80, 386–395. [Google Scholar] [CrossRef]
- Yan, H.; Wu, F.; Dong, L. Influence of a large urban park on the local urban thermal environment. Sci. Total Environ. 2018, 622, 882–891. [Google Scholar] [CrossRef]
- Hami, A.; Abdi, B.; Zarehaghi, D.; Bin Maulan, S. Assessing the thermal comfort effects of green spaces: A systematic review of methods, parameters, and plants’ attributes. Sustain. Cities Soc. 2019, 49, 101634. [Google Scholar] [CrossRef]
- Morakinyo, T.E.; Lam, Y.F. Simulation study on the impact of tree-configuration, planting pattern and wind condition on street-canyon’s micro-climate and thermal comfort. Build. Environ. 2016, 103, 262–275. [Google Scholar] [CrossRef]
- Mitterboeck, M.; Korjenic, A. Analysis for improving the passive cooling of building’s surroundings through the creation of green spaces in the urban built-up area. Energy Build. 2017, 148, 166–181. [Google Scholar] [CrossRef]
- Shih, W.Y. The cooling effect of green infrastructure on surrounding built environments in a sub-tropical climate: A case study in Taipei metropolis. Landsc. Res. 2017, 42, 558–573. [Google Scholar] [CrossRef]
- Chen, N.; Tsay, Y.; Chiu, W.J. Influence of vertical greening design of building opening on indoor cooling and ventilation. Int. J. Green Energy 2017, 14, 24–32. [Google Scholar] [CrossRef]
- He, Y.; Yu, H.; Dong, N.N.; Ye, H. Thermal and energy performance assessment of extensive green roof in summer: A case study of a lightweight building in Shanghai. Energy Build. 2016, 127, 762–773. [Google Scholar] [CrossRef]
- Fu, J.W.; Dupre, K.; Tavares, S.; King, D.; Banhalmi-Zakar, Z. Optimized greenery configuration to mitigate urban heat: A decade systematic review. Front. Archit. Res. 2022, 11, 466–491. [Google Scholar] [CrossRef]
- Nejatian, A.; Makian, M.; Gheibi, M.; Fathollahi-Fard, A.M. A novel viewpoint to the green city concept based on vegetation area changes and contributions to healthy days: A case study of Mashhad, Iran. Environ. Sci. Pollut. Res. 2022, 29, 702–710. [Google Scholar] [CrossRef]
- Ekwe, M.C.; Adamu, F.; Gana, J.; Nwafor, G.C.; Usman, R.; Nom, J.; Onu, O.D.; Adedeji, O.I.; Halilu, S.A.; Aderoju, O.M. The effect of green spaces on the urban thermal environment during a hot-dry season: A case study of Port Harcourt, Nigeria. Environ. Dev. Sustain. 2021, 23, 10056–10079. [Google Scholar] [CrossRef]
- Sun, X.; Tan, X.Y.; Chen, K.L.; Song, S.; Zhu, X.D.; Hou, D.L. Quantifying landscape-metrics impacts on urban green-spaces and water-bodies cooling effect: The study of Nanjing, China. Urban For. Urban Green. 2020, 55, 126838. [Google Scholar] [CrossRef]
- Qiu, X.; Kil, S.-H.; Jo, H.-K.; Park, C.; Song, W.; Choi, Y.E. Cooling Effect of Urban Blue and Green Spaces: A Case Study of Changsha, China. Int. J. Environ. Res. Public Health 2023, 20, 2613. [Google Scholar] [CrossRef]
- Santos, T.; Deus, R.; Rocha, J.; Tenedório, J.A. Assessing Sustainable Urban Development Trends in a Dynamic Tourist Coastal Area Using 3D Spatial Indicators. Energies 2021, 14, 5044. [Google Scholar] [CrossRef]
- Wang, Z.Y.; Fan, Y.G.; Shan, B.Y. Impact of Urban Building Spatial Distribution Pattern on Thermal Environment Based on Remote Sensing Images: A Case of Jinan City Center. Laser Optoelectron. Prog. 2023, 60, 0228006. [Google Scholar] [CrossRef]
- Wu, B.; Huang, H.L.; Wang, Y.; Shi, S.X.; Wu, J.P.; Yu, B.L. Global spatial patterns between nighttime light intensity and urban building morphology. Int. J. Appl. Earth Obs. Geoinf. 2023, 124, 103495. [Google Scholar] [CrossRef]
- Tan, X.Y.; Sun, X.; Huang, C.D.; Yuan, Y.; Hou, D.L. Comparison of cooling effect between green space and water body. Sustain. Cities Soc. 2021, 67, 11. [Google Scholar] [CrossRef]
- Feng, X.J.; Yu, J.H.; Xin, C.L.; Ye, T.H.; Wang, T.A.; Chen, H.L.; Zhang, X.M.; Zhang, L.L. Quantifying and Comparing the Cooling Effects of Three Different Morphologies of Urban Parks in Chengdu. Land 2023, 12, 451. [Google Scholar] [CrossRef]
- Li, Z.; Wang, Z.W.; Wen, D.; Wu, L.X. How urban parks and their surrounding buildings affect seasonal land surface temperature: A case study in Beijing, China. Urban For. Urban Green. 2023, 87, 128047. [Google Scholar] [CrossRef]
- Zhang, N.H.; Zhen, W.A.; Shi, D.H.; Zhong, C.Y.; Li, Y. Quantification and mapping of the cooling effect of urban parks on the temperate monsoon climate zone. Sustain. Cities Soc. 2024, 101, 105111. [Google Scholar] [CrossRef]
- Yan, L.; Jia, W.X.; Zhao, S.Q. The Cooling Effect of Urban Green Spaces in Metacities: A Case Study of Beijing, China’s Capital. Remote Sens. 2021, 13, 4601. [Google Scholar] [CrossRef]
- Du, H.Y.; Cai, W.B.; Xu, Y.Q.; Wang, Z.B.; Wang, Y.Y.; Cai, Y.L. Quantifying the cool island effects of urban green spaces using remote sensing Data. Urban For. Urban Green. 2017, 27, 24–31. [Google Scholar] [CrossRef]
- Yu, C.; Hien, W.N. Thermal benefits of city parks. Energy Build. 2006, 38, 105–120. [Google Scholar] [CrossRef]
- Wang, P.; Yang, Y.T.; Ji, C.; Huang, L. Positivity and difference of influence of built environment around urban park on building energy consumption. Sustain. Cities Soc. 2023, 89, 104321. [Google Scholar] [CrossRef]
- Han, Q.; Nan, X.G.; Wang, H.; Hu, Y.J.; Bao, Z.Y.; Yan, H. Optimizing the Surrounding Building Configuration to Improve the Cooling Ability of Urban Parks on Surrounding Neighborhoods. Atmosphere 2023, 14, 914. [Google Scholar] [CrossRef]
- Chan, S.Y.; Chau, C.K. On the study of the effects of microclimate and park and surrounding building configuration on thermal comfort in urban parks. Sustain. Cities Soc. 2021, 64, 102512. [Google Scholar] [CrossRef]
- Perini, K.; Magliocco, A. Effects of vegetation, urban density, building height, and atmospheric conditions on local temperatures and thermal comfort. Urban For. Urban Green. 2014, 13, 495–506. [Google Scholar] [CrossRef]
- Morakinyo, T.E.; Kong, L.; Lau, K.K.L.; Yuan, C.; Ng, E. A study on the impact of shadow-cast and tree species on in-canyon and neighborhood’s thermal comfort. Build. Environ. 2017, 115, 1–17. [Google Scholar] [CrossRef]
- Yang, J.Y.; Hu, X.Y.; Feng, H.Y.; Marvin, S. Verifying an ENVI-met simulation of the thermal environment of Yanzhong Square Park in Shanghai. Urban For. Urban Green. 2021, 66, 127384. [Google Scholar] [CrossRef]
- Wang, H.H.; Cai, Y.; Deng, W.F.; Li, C.; Dong, Y.; Zhou, L.; Sun, J.Y.; Li, C.; Song, B.Z.; Zhang, F.F.; et al. The Effects of Tree Canopy Structure and Tree Coverage Ratios on Urban Air Temperature Based on ENVI-Met. Forests 2023, 14, 80. [Google Scholar] [CrossRef]

Disclaimer/Publisher’s Note: The statements, opinions and data contained in all publications are solely those of the individual author(s) and contributor(s) and not of MDPI and/or the editor(s). MDPI and/or the editor(s) disclaim responsibility for any injury to people or property resulting from any ideas, methods, instructions or products referred to in the content. |
© 2024 by the authors. Licensee MDPI, Basel, Switzerland. This article is an open access article distributed under the terms and conditions of the Creative Commons Attribution (CC BY) license (https://creativecommons.org/licenses/by/4.0/).