Abstract
This study proposes a two-dimensional analytical framework based on urban spatial form and spatial service perspectives, utilizing data on buildings and points of interest (POIs). It integrates fishnet analysis, kernel density analysis, the categorization of POI functionalities, and mixture calculations to enhance our understanding of urban spatial form and function. Taking the main urban area of Zhengzhou as an example, this study identifies image elements that can describe urban spatial characteristics through the results of two-dimensional analysis and enriches the city image in the form of a portrait. The experimental findings demonstrate that the elements of the annular layer, functional landmarks, ring line boundaries, and special districts can fully convey the spatial picture of Zhengzhou City. The performance of the four types of image elements has a high degree of matching with the content of the urban spatial planning of Zhengzhou City, which can effectively identify the urban multi-center structure and development pattern. This paper explores and tests the development status of the city from a new perspective, which can provide an effective reference for the future planning and sustainable development of the city.
1. Introduction
1.1. Research Background and Progress
As socioeconomic progress accelerates, Chinese cities have embarked on a rapid growth trajectory [1]. During this urbanization process, urban spaces have undergone drastic expansion, leading to profound transformations in internal spatial configurations. Nonetheless, this development has also given rise to the “thousand cities, one face” issue, wherein cities across regions exhibit excessive uniformity and a lack of regional and local cultural distinctiveness, significantly diminishing their inter-city identifiability and appeal [2]. A people-oriented urban perspective necessitates a deeper and more scientific understanding of cities, placing emphasis on the cultivation of urban characteristics and spatial structures. Urban spaces, as the physical realm sustaining human existence, serve as not only the hub for amenities such as clothing, food, shelter, and transportation but also as venues closely intertwined with human spatial behaviors [3]. Residents living in these cities form their perceptions of urban characteristics and spatial structures through observing and experiencing the built environment, spatial order, and services provided in their cities [4,5].
The spatial image refers to the cognitive assemblage that individuals form after repeatedly perceiving spatial environments through experiencing informational elements within them, filtered through their cognitive schemas. Urban spatial images, derived from the superimposition of individual spatial perceptions, constitute a “public image” and represent a “collective memory” of urban spaces [6]. Residents formulate perceptions of urban spaces based on their constituent elements, gradually developing a comprehensive urban spatial image through extensive cognitive processes. This image, in turn, influences residents’ behaviors and activities within spatial environments, enhancing their understanding of urban spatial elements and their configurations. As a direct or indirect reflection of how people perceive cities, an urban spatial image expresses urban spatial structures and characteristics through image elements and maps [7], making it a crucial entry point for urban spatial research.
Kevin Lynch’s “Image of the City” theory blazed a new trail in urban research [8]. Using Boston, New Jersey, and Los Angeles as case studies, Lynch analyzed the form, interactions, and behaviors within urban spaces. Through cognitive mapping and street interviews, he captured residents’ perceptions of their cities, ultimately categorizing urban spatial images into five core elements: paths, edges, districts, nodes, and landmarks. He then constructed an image map, providing a visual representation of the city’s spatial structure. Lynch’s five-element framework and image map were quickly validated and adopted upon introduction. Numerous scholars’ empirical studies have not only affirmed the effectiveness of this theoretical framework but have also underscored the pivotal role of urban spatial images in enhancing the understanding of urban spatial structures [7].
As the study of city image theory has progressed, academics have undertaken a number of original attempts to examine the scale and methods of urban spatial image research. The current research scale is mainly divided into two categories. On a microscale, research mainly studies tourist destinations [9], communities [10], campuses [11], and other spaces in the city. The second research scale involves the exploration of one city [6,12], multiple cities [7], and even urban agglomerations at the macroscale [13]. Regarding city image research methods, scholars have gradually moved from qualitative to quantitative analysis [14], but there are still significant differences in the used methods when conducting spatial image research at different scales.
Due to the tiny spatial extent of the research object when researching urban spatial images on a microscale, people’s perceptions and recall of the space still heavily depend on the environmental features of the space [15]. Therefore, at present, many scholars choose the influencing factors of the spatial environment when conducting research on microscale images of space [16], describe the spatial structure using indicators such as building undulation, interface enclosure, greening rate, and sky openness, and obtain the microscale image results by calculating and analyzing the spatial indicators [17].
In this regard, Harvey introduced a measurement method for 12 morphological parameters of street interfaces using Geographic Information System (GIS) technology, such as street proportion, street continuity, and interface enclosure, to better evaluate the quality of street space services [18]. Meanwhile, Middel emulated pedestrians’ perception of the urban environment on streets through Google Street View images and extracted quantitative indicators of urban features at the street level [19]. Furthermore, Ye conducted a quantitative analysis to investigate the spatial characteristics and sense of disorder in the streets of old urban areas. He found that the characteristic elements of street spatial morphology, vision, and interface order can serve as quantitative indicators for the assessment of pedestrians’ sense of disorder [20]. These quantitative research methods and results collectively provide significant references and foundations for understanding urban spatial images.
In existing macrospatial image research, scholars generally start with quantitative methods based on big data, such as remote sensing images [21], photos [22], and textual information from multispecies social software [23]. Big data can cover urban space on a large scale. These data not only have accurate geographic location information but also contain information that can more intuitively express the results of people’s perception. Cities’ spatial image structure and characteristics can be obtained from multiple sources based on different methods such as image identification [7,24], deep learning algorithms [25], and sentiment analysis [26,27].
Liu used network photos and “scene recognition” based on geographic information and the deep learning algorithm to obtain spatial information of multiple dimensions in images and counted and analyzed the category and spatial distribution characteristics of city image elements [28]. Cao used image data, language data, and spatiotemporal data on Sina Weibo, and applied the computer vision deep learning algorithm, the Bossen natural semantic algorithm, and GIS spatial analysis to accurately depict city images based on the three dimensions of image structure, image type, and emotional assessment [29]. Wilkowski et al. attempted to relate city form to human perception by introducing computer vision and machine learning and trained an image classification model to more accurately identify the five types of image elements [30]. These research methods provide multifaceted perspectives and technical support for understanding urban spatial images.
By combing the changes in current research on the scales and methods of city image, we found two problems that remain to be solved as follows: (1) although existing research has begun to use the results of quantitative spatial indices (e.g., interface enclosure index) for spatial cognitive evaluation, these studies mainly focus on microscopic spaces such as gardens, communities, and neighborhoods; and (2) the city image theory is relatively mature in the study of large-scale spaces, and the processing and analysis of crowdsourced data have gradually become a new hot-spot in the study of macroscopic spatial images. However, for the most commonly used photos, text, and other data, there are areas for improvement, such as uneven data distribution, subjective color, and user youthfulness [31], meaning that these methods cannot comprehensively describe the entire research space and can lead to bias in image results.
Therefore, this study intends to integrate these two concerns and investigate how to effectively apply quantitative research methods to the study of macrospatial images. Additionally, we aim to explore data types that are more spatially representative in order to address issues such as uneven data distribution and strong subjectivity in existing research. Ultimately, our hope is to provide more scientific and practical guidance for urban planning and spatial design.
1.2. The Main Goal of the Paper
The main urban area, as the core area with a high concentration of urban functions and urban public life, is densely populated and compatible with a variety of functional services, is the main part of every city, and is also the hub for the complete range of activities in people’s daily lives, including work, study, and recreation. Citizens carry out a variety of activities in the urban space, and thus gradually form a spatial image of the main urban area. This image describes the urban spatial structure and characteristics in people’s minds from a holistic perspective, which is of great practical significance for urban spatial management and environmental planning [32]. Therefore, this paper carries out a study on urban spatial images at the scale of the main city.
To address the limitations of current urban spatial image research in terms of quantitative methods and data, this study leverages the advantages of geographic big data and spatial analysis tools. Geographic spatial data, as one of the primary types of new big data [33], exhibit strong applicability across different scales of research [31]. Urban building [34] and POI [35] data both possess high coverage and timeliness. Spatial analysis tools, serving as quantitative analysis methods for geographic spatial phenomena, play a pivotal role in urban-scale research. These tools can process and analyze vast amounts of geographic spatial data, uncovering the intrinsic patterns and characteristics of the urban spatial structure. They are vital in various fields, such as urban planning [36], environmental assessment [37], economic development [38], and social issue [39] research.
The primary aim of this study is to introduce a novel method for acquiring urban spatial images of major urban areas and to validate its effectiveness through case studies. Diverging from traditional city image research, our approach leverages geospatial data and spatial analysis techniques to formulate a two-dimensional analytical framework that incorporates perspectives on urban spatial forms [40] and spatial services [41]. Specifically, we utilize building masses as descriptors of spatial structure and POI data as descriptors of spatial services. By integrating the outcomes from these two perspectives, we extract image elements that highlight the unique spatial characteristics of major urban areas. The resulting images offer a visual representation of the city’s spatial structure and features, enabling an assessment of its current development status. These insights serve as valuable references for future urban planning and sustainable development strategies.
2. Materials and Methods
2.1. Description of Study Area
This study focused on the main urban area of Zhengzhou City, located in Henan Province, China (Figure 1). Covering approximately 1527.6 km2, this area exhibits advanced and comprehensive urban development compared to surrounding regions. Administratively, the main urban area is subdivided into eight service units, namely Jinshui District, Erqi District, Guancheng Hui Nationality District, Zhongyuan District, and Huiji District, alongside Zhengdong New District, Zhengzhou High-Tech Development Zone, and Zhengzhou Economic and Technological Development Zone. Specifically, Zhengdong New District falls under Jinshui District, the High-Tech Development Zone is part of Zhongyuan District, and the Economic and Technological Development Zone is situated within Guancheng Hui Nationality District.
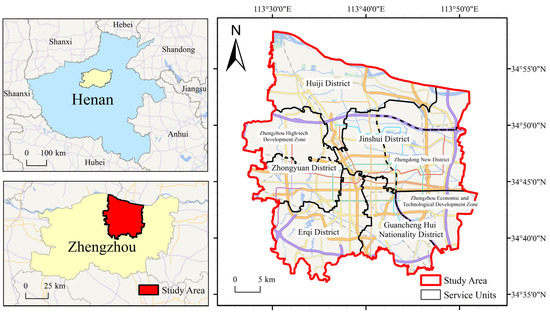
Figure 1.
Geographical location of Zhengzhou City’s main urban area.
2.2. Source of Data
Building data, presented in vector form, represent a collection of information that describes the geographic location, shape, and relevant attributes of buildings in the spatial context. These data play a crucial role in the analysis of the urban spatial structure. By examining the concentrated areas of buildings, their density levels, and patterns of architectural forms, we can uncover the fundamental characteristics of urban spatial structure, providing vital insights for urban planning and land use optimization [34].
The building data used in this study were downloaded from BIGEMAP (http://www.bigemap.com/source/, accessed on 20 December 2022), and the coordinate system was WGS_1984. Upon importing these data into ArcGIS 10.8, it was found to align reasonably well with the buildings depicted in contemporaneous aerial images from Tianditu (https://www.tianditu.gov.cn/, accessed on 20 December 2022). To ensure data accuracy, both positional and attribute checks were conducted on the buildings. Firstly, the building data were compared with a publicly available vector dataset of urban building rooftop outlines provided by the Smart City Perception and Simulation Laboratory at Nanjing Normal University [42]. While this dataset exhibited high spatial accuracy in terms of building locations, its outlines were overly simplified and lacked building attribute information, thus only serving as a means to verify the positional accuracy of the building data used in this study. By comparing the centroid coordinates of corresponding building outlines between the two datasets, it was observed that 92.4% of buildings had centroid deviation values of less than 1 m, indicating negligible spatial discrepancies and obviating the need for the spatial adjustment of the downloaded BIGEMAP building data. Secondly, all building elements included information regarding the number of floors. To ensure the accuracy of floor-level information, a sample of buildings within the central urban area was cross-referenced and validated against housing information scraped from the Zhengzhou Housing Rental website (https://zz.zu.anjuke.com/, accessed on 20 December 2022). This process aimed to verify and rectify the floor data associated with buildings in the central city area. After screening, the scattered buildings on the periphery were deleted, and the data of 102,911 building blocks were obtained.
POI data, within the realm of GIS, represent detailed information that characterizes specific locations or points on a map. These data encapsulate attributes such as location names, addresses, geographical coordinates (latitude and longitude), and categories. The positional and attribute information embedded in POI data offer urban planners a profound understanding of the functional distribution across various urban regions, encompassing the density and diversity of points of interest in sectors like commerce, healthcare, transportation, and more [43]. This comprehension is instrumental in crafting informed urban development strategies, refining spatial layouts, and elevating a city’s functionality and livability [44].
The POI data used in this study were from the AutoNavi map platform (https://lbs.amap.com/, accessed on 4 May 2023). Through QGIS 3.30 software, the original Amap coordinate system data were transformed into the WGS_1984 coordinate system, consistent with the building data. Due to the diverse categories within the Amap POI dataset and the presence of issues such as overlap and duplication between different categories, preprocessing was necessary to remove duplicates and reclassify data. Following preprocessing, a total of 418,932 POI entries were retained within the primary urban area. Combining the classification system of Amap POIs with the urban land use planning categories of Zhengzhou City [45], this study categorized the functional types describing urban spaces into six classes. These categories were used as standards for partitioning and adjusting the classification of POI data, with the refined classification results presented in Table 1.

Table 1.
Community spatial evaluation indicators.
Due to the significant volume of data for both buildings and POIs within the main urban area of Zhengzhou, as well as the heterogeneous distribution of different types of data, this study opted to delineate the study area using a grid system, aiming to highlight the non-uniform spatial characteristics of the city. By quantifying the number and attributes of buildings and POIs within each grid cell and calculating spatial indicators for each cell, it became possible not only to conduct a more detailed analysis of the spatial form and functional categories but also to gain a more intuitive understanding of the spatial distribution and characteristics of different categories.
Initially, three grid configurations with side lengths of 250 m, 500 m, and 1000 m were compared in ArcGIS 10.8. It was observed that the 250 m grid resulted in overly fragmented data, hindering feature summarization, while the 1000 m grid was too large, potentially obscuring local spatial characteristics. Consequently, a grid side length of approximately 500 m was selected. Subsequently, configurations with side lengths of 400 m, 500 m, and 600 m were compared (Figure 2), revealing that the 500 m grid ensured that each street office within the main urban area was described by at least one grid cell (street offices being the smallest administrative units at the municipal level in Zhengzhou). Therefore, a final grid size of 500 m × 500 m was selected, resulting in a total of 6387 grid cells covering the main urban area.
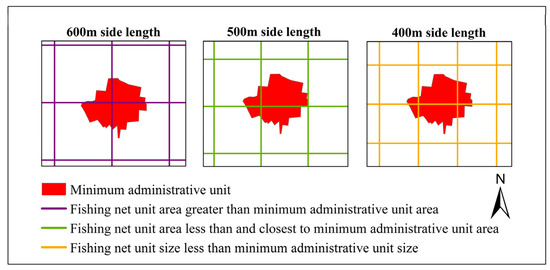
Figure 2.
Comparison of different fishing net units with smallest administrative unit in Zhengzhou City.
2.3. Methods
2.3.1. Fishnet Analysis
Fishnet analysis, a prevalent spatial analysis technique in GISs, is often utilized to investigate the spatial distribution patterns of vector data. This approach involves gridding the map and distributing data features into these grids, subsequently calculating the quantity or density of features within each grid cell. This methodology effectively reveals the spatial distribution patterns and characteristics of geographical phenomena [46]. Fishnet analysis is commonly employed in urban planning, environmental assessment, resource management, and other domains, providing crucial references for spatial decision-making [47].
To highlight the non-uniformly distributed urban architectural features, the construction of fishnets in Zhengzhou City’s main urban area was chosen to achieve the division of the research scope [48]. The average number of floors, the building coverage ratio [49], and the floor area ratio [50,51] for each cell were calculated based on the buildings that fell into different grid units [52,53]. The calculated results allowed us to refine the analysis of building categories.
The calculation formula is as follows:
The average number of floors is used to describe the height information of the buildings in a grid. The building coverage ratio is used to describe the information about the density of buildings in a grid. The floor area ratio is used to describe the intensity of building construction in a grid.
2.3.2. Kernel Density Estimation
The spatial agglomeration properties of data may be extracted using the kernel density estimation approach. This method takes the distance decay function detecting element local density change, and through the “wave peaks” and “valleys” strengthen the spatial distribution pattern [54].
The calculation formula is as follows:
where n is the total number of sample points, K(x) is the kernel function, and h is the bandwidth. The influence of bandwidth on the analysis results was significant [55]. When using this method, it is necessary to take several bandwidth values for detection and analysis. The bandwidth that can show the most apparent spatial distribution characteristics is selected by comparing different results.
2.3.3. Analysis of the POI Function Category
In the case of a large deviation in the number of POIs, the grid density of different types of POIs in a unit cannot accurately represent the functional type of the mesh, so the type of ratio was chosen instead of the grid density [56]. By setting the thresholds, the functional category of the grid units was determined based on the POI type scale.
The calculation formula is as follows:
where i is the number of POI types; j is the number of grids; n is the number of types i POIs in the j-th grid; is the total number of POIs in the j-th grid; is the total number of POIs of class i; is the grid density; is the frequency density; and is the type scale.
Following the criteria established by scholars [35,45], this study sets the threshold for this indicator at 0.5. For the j-th grid, when ≥ 0.5, it is defined as a single-functional unit, and the functional category is the function of the type i POI; when < 0.5, this is defined as mixed-functional units, the top two POIs determine the functional category, and when there is no POI in the mesh, it is defined as no data unit.
2.3.4. Mixing Degree of the POI Function
Analysis of the POI feature category can determine the dominant features of the grid. However, it cannot describe how well other features have developed in the grid. Therefore, this study took the grid unit as the analysis unit in order to determine the degree of functional mixing of the grid unit by calculating the standard deviation value of the POI type ratio in the unit.
The calculation formula is as follows:
where is the discrete degree of the proportion of all POI types in the j-th grid unit. The smaller the value, the smaller the gap in the contribution value of the six types of POIs, the more balanced the degree of development of various functions, the greater the degree of functional mixing of the grid unit, and the greater the overall development degree [57].
2.3.5. Research Framework
The two-dimensional analysis framework based on the urban spatial form and spatial service perspectives proposed in this paper (Figure 3) is shown below:
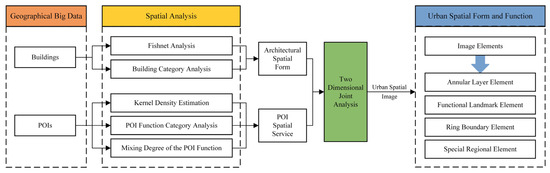
Figure 3.
The experimental research framework of this paper.
- (1)
- Using buildings as the descriptive element of spatial form, the basic form of architectural space was analyzed through architectural indicators.
- (2)
- Using POIs as the descriptive element of spatial service, the spatial function category was obtained through index calculation and analysis.
- (3)
- Through the joint analysis and statistics of the two groups of categories, a unique urban spatial image map of the main urban area of Zhengzhou was obtained, which described the spatial form and function of the study area in the form of different elements.
3. Results
3.1. Analysis of Urban Spatial Form Based on Buildings
3.1.1. Fishnet Analysis of Main Urban Buildings
The average number of floors, building coverage, and floor area ratio of each grid unit were calculated in ArcGIS. The average floor value was divided into categories based on the actual building height in Zhengzhou, while the building coverage and floor area ratio were divided according to the natural interruption method (Figure 4).

Figure 4.
Results of the construction of fishing nets in Zhengzhou City’s main urban area: (a) the average number of floors; (b) a stereoscopic view of the average number of floors; (c) the building coverage ratio; and (d) the floor area ratio.
According to the results of the three indicators, the building space in Zhengzhou City’s main urban area is mainly of medium height, with high building coverage and a high floor area ratio. The overall building height, density, and intensity have a transitional spatial form, but the law of spatial change and the degree of change between the three are inconsistent. In Figure 4a,b, we can see that the building height shows a medium–high–low trend of change from the interior to the surroundings. As the most intuitive factor in people’s spatial structure cognition, the height of urban architectural space can easily prompt people to divide the space into different areas according to the change in height [58,59]. As can be seen in Figure 4c,d, the highest values of both indices are distributed in the interior of the study area, forming a decreasing trend from high to low values from the inside to the outside of the study area. The difference is that the high-value building coverage grid is clustered, while the high-value grid of the floor area ratio is discrete.
3.1.2. Category and Distribution of Architectural Spatial Form
To better analyze the categories of architectural spatial form in the main urban area of Zhengzhou, the indicators of three dimensions are superimposed, and the results of the combination of indicators of different grid units are analyzed. The categories of architectural spatial forms belonging to Zhengzhou City are summarized. When combined, the average number of floors is divided into three categories: a low number of floors (1–7 floors), a medium number of floors (8–20 floors), and a high number of floors (>20 floors). The building coverage is divided into three categories according to 0.001–4.689, 4.690–25.351, and >25.351. The floor area ratio is divided into three categories: 0.001–0.374, 0.375–2.040, and >2.040. The results of the three indicators use “1” to represent the first category, “2” to represent the second category, and “3” to represent the third category, forming a total of 27 types through the combination (a detailed description of all the building form types is provided in Attachment 1). The label “0” corresponds to a grid unit without buildings and is not classified as a building form type.
In the main urban area of Zhengzhou, there are 19 types of architectural forms, of which 113, 213, 231, 321, and 331 are types that should not exist in the index combination, and these types are characterized by the fact that when the average number of floors and the building coverage are the same or similar, the floor area ratio is completely different from the two. The architectural forms 313, 332, and 333 are types that are not formed in the building space of Zhengzhou City. These types correspond to the situation when many high-rise buildings are distributed in the area and a very high level of regional development is present, which does not meet the construction requirements of Zhengzhou City (Figure 5).

Figure 5.
Spatial distribution of building forms and types in Zhengzhou City’s main urban area.
Figure 5 shows that the grid units with the same type of building form do not show aggregation characteristics but have continued distribution in the study area. We set up a multi-ring buffer zone with a growth radius of 2 km from the center of mass of the area and calculated the proportion of each type of building form in different buffer rings (Figure 6).
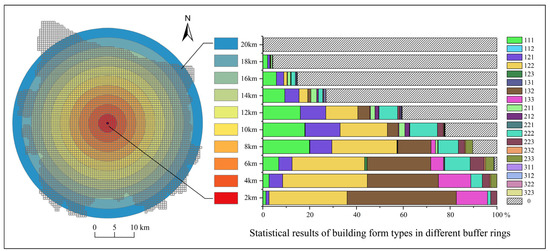
Figure 6.
The distribution of the building form types. Left side: multi-ring buffer; right side: statistical results of building form types in different buffer rings.
By considering Figure 4 and Figure 5, we assume that the spatial distribution of different types of building forms in the main urban area relates to the distance to the central area. However, there are many types of building forms, and the number of different types varies greatly, which blurs the overall characteristics of the building space. In order to emphasize the spatial morphological aspects of the research area, the types must be removed and combined. These steps include the following:
- (a)
- For a smaller number of types, filtering those that do not show prominent spatial characteristics, excluding them, and merging the rest with adjacent categories.
- (b)
- Carrying out secondary merging on the processed date (a), viewing differences between the three indicators of different types and the similarity of their spatial distribution characteristics, and selecting the types with high similarities for merging. Finally, the architectural form category of Zhengzhou City is obtained (Figure 7).
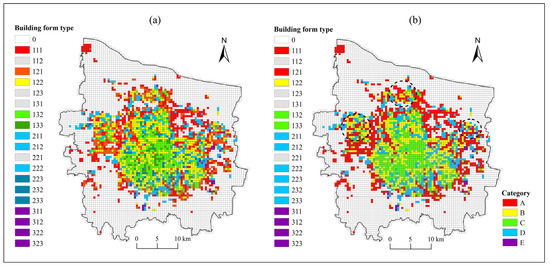 Figure 7. Categories of building forms in Zhengzhou City’s main urban area: (a) first screening and merging, the gray represents the removed types, and the same color represents the same type after the first merger; and (b) the second merging, the same color represents the same type, and all types of the same color are grouped into the same category. The three areas circled by dotted lines in (b) clearly break the spatial transition characteristics of different categories in urban space.
From the results of the classification of architectural forms in the main urban area of Zhengzhou City, different categories are gradually changing from the four sides to the center, and the entire area forms a transitional structure of “Category A-Category D-Category B-Category C”. Category E represents different forms of high-rise types, and the grid of this category is affected by the lack of building data, i.e., the grid contains a small number of buildings with high floors.
The outermost area is characterized by Category A, with “Low-rise building-Low building coverage-Low floor area ratio” characteristics, and these buildings are relatively poorly constructed. Furthermore, the building space is low in height, density, and intensity. When approaching the interior of the urban space, the density of the buildings increases, but the overall space is still low-rise. In addition to the peripheral areas, it can also be found that this type forms some linear areas that extend inward, and we found that these areas contain railways or rivers. The presence of railways and rivers makes the spatial form of the surrounding areas conform to the characteristics of Category A.
After inward transition, the areas are characterized by Category D, with “Mid-rise building-Medium building coverage-Medium floor area ratio” characteristics. The overall degree of construction in these areas increases, and the building space reaches a medium height, density, and intensity. In the plots corresponding to Category D, the number of residential buildings and shops increases significantly, increasing the density of the building space. Among these buildings, residential buildings include many high-rise buildings, increasing the height and intensity of the building space, improving the overall use of space, and providing an important living space in the periphery of the main urban area.
Further inward transition leads to the presence of Category B, with “Low-rise building-Medium building coverage-Medium floor area ratio” characteristics. The buildings in these areas are similar in height, density, and intensity to the characteristics of the area characterized by Category D. Compared to the outermost area, the space represented by Categories D and B displays significant increases in the number of buildings. However, compared to Category D, the proportion of high-rise residential buildings decreases in the area characterized by Category B, while the proportion of shops on the ground floor increases.
The innermost part of the main urban area is characterized by Category C, with the characteristics of “Low-rise building-High building coverage-Medium floor area ratio”. The overall height of the regional architectural space is low, but the building density and intensity reach a high degree. The interior contains the old town of Zhengzhou City as the earliest development and a strong development area, and this is the area that is most closely connected with residents’ life in the city [60]. Although the building height is mostly low, the use of low-rise space is very high, such as the old-fashioned community in the area. The residential buildings do not exceed seven floors, the distribution is compact and there are continuous low-rise shops outside the community.
Among these areas, there are three areas that clearly break the spatial transition characteristics of different categories in urban space, mainly characterized by Category C and B, but they are distributed in the outer areas. These are the High-Tech Zone in the west, the Huiji Convention and Exhibition Zone in the north, and the Longzihu University Town in the east (Figure 7b, dotted line).
3.2. Analysis of Urban Spatial Service Based on POIs
3.2.1. Results of POI Kernel Density Analysis
In kernel density analysis, when the search radius is too large, the contour line will be smoother, which is not suitable for identifying clustered features. A small search radius will result in more areas of high or low values, which is not suitable for identifying the central structure. We analyze the kernel density with 1000, 1500, and 3000 m as the search radius. The search radius was set at 1500 m in order to make the results more intuitive. Using this method, the spatial aggregation characteristics of six types of POIs were obtained, and the results are shown in Figure 8 based on the natural break point method.
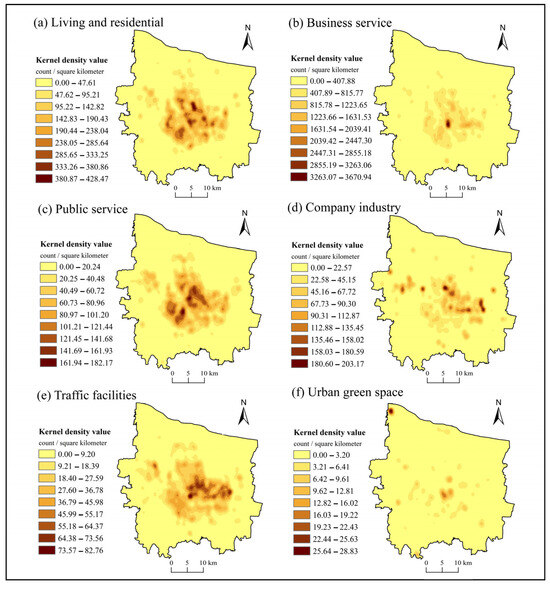
Figure 8.
Nuclear density analysis of six types of POIs: (a) living and residential; (b) business service; (c) public service; (d) company industry; (e) traffic facilities; and (f) urban green space.
From the nuclear density analysis of various POIs in the study area, there are significant differences in the distribution characteristics and agglomeration degree of different types of spatial services.
The scope of services of the living and residential functional space is in accordance with the architectural space in the main urban area of Zhengzhou City. This type of POI is characterized by a large number of functional cores and evenly dispersed in different areas. The business service functional space shows an obvious single-centered core pattern, and the density value of the central core differs greatly from that of the surrounding area. The distribution of the public service functional space is relatively uniform, i.e., the area with a high kernel density value shows a large area distribution in the form of sheets, and the spatial connection of multiple central cores is strong. Multiple high-value central nuclei in the function space of the company industry are scattered in various areas. The service scope of the functional space of traffic facilities is in accordance with the living, residential, and commercial functional space, and there are also a large number of central cores, but the distribution of these cores is not balanced, with clustering in the eastern part of the main urban area. The concentration degree of the functional space of the urban green areas is the weakest, with only one central core with a high-density value, while the rest of the low-density cores are scattered in different urban areas.
3.2.2. Category and Structure of POI Spatial Service Functions
According to the division criteria of POI functional categories, this study obtained the functional unit division of Zhengzhou City’s main urban area (Figure 9a). Figure 9b,c show detailed categories of single- and mixed-functional units. Among them, the single-functional unit consists of 6 POI types, and the mixed-functional unit consists of 15 types after combination (a detailed description of all the functional unit types is provided in Attachment 2).
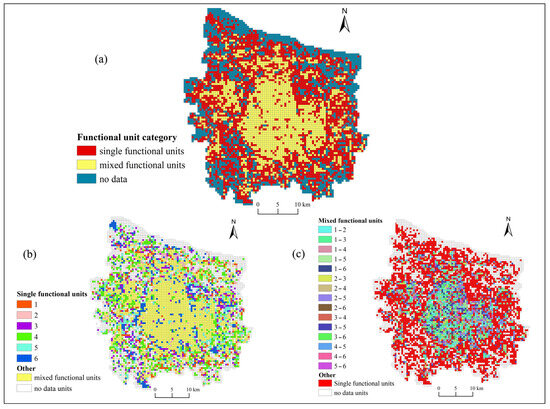
Figure 9.
Distribution of different functional categories and functional units in Zhengzhou City’s main urban area: (a) distribution of functional categories; (b) distribution of single-functional units; and (c) distribution of mixed-functional units.
Various functional units in the major urban area exhibit clear transitional characteristics in their spatial distribution from the standpoint of POI functional units’ spatial distribution, thus showing a gradual transitional structure of “No data-Single function-Mixed function” from the periphery to the center. Units without data are mainly located in the outermost areas of the main urban area, which mainly contain rivers, woodlands, highways, etc. After the transition from the periphery to the middle of the main urban area, the area is mainly composed of single-functional units, while some areas are cross-distributed with mixed-functional units. Mixed-functional units located in the innermost layer occupy the central urban area, and these grids make up the largest part of the main urban area. The distribution of different mixed-functional units is relatively discrete and does not show obvious spatial distribution characteristics. These functional categories are mainly transportation facilities and urban green spaces, such as large transportation hubs (Zhengzhou Railway Station and Zhengzhou East Railway Station in Erqi District) and large urban parks (People’s Park and Bauhinia Mountain Park). The calculation result of the functional mixing degree also reflects the transitional characteristics of the main urban area, and the uniqueness of the three areas, namely the center of the High-Tech Zone, the unique functional area of the Exhibition Zone, and the Longzihu University area (Figure 10).

Figure 10.
Functional mixing degree diagram of grid cells in Zhengzhou City’s main urban area. The three areas circled by dotted lines clearly break the spatial transition characteristics of different categories in urban space.
3.3. The Urban Space Image Results
3.3.1. Joint Analysis of Architectural Spatial Form and POI Spatial Service
This study jointly analyzed the results of the two groups (Figure 7 and Figure 9) with a circular structure and prominent transitional characteristics in the same region. Starting from the building category circle, the functional unit information corresponding to the grid in each circle layer is recorded, and the top five functional categories are used to represent the circle layer. The statistical information (Figure 11) corresponds to the results of the location analysis.

Figure 11.
Comparison between category information of buildings and POIs.
The no-building circle layer consists of two functional units. The circle is situated on the outskirts of the main city, with large rivers and green spaces, lacking buildings and POIs. The rest are the single-functional units and the company’s industrial functional units. These areas have the majority of industrial parks and science and technology parks in Zhengzhou and drive the development of transportation facilities, public services, and commercial service functions in the surrounding areas.
The Category A architectural circle consists of single-functional units. As the building occupancy in this circle is low, it is relatively empty, and transportation facilities are likely to become the dominant function. The proportion of residential buildings in this circle is low, and the number of low-rise factory buildings is large, so many companies and industrial functional units have been established in this area. On the other hand, Zhengzhou Botanical Garden, Xiliu Lake Park, Butterfly Lake Ecological Park, and Longhu Ecological Park are also distributed in this area, forming several functional units of urban green space.
The Category D, B, and C architectural circles mainly have mixed-functional units. The functional categories in these three circles are relatively similar, mainly comprising mixed development space with four types of functions: living and residential, commercial services, public services, and transportation facilities. The Category D circle is the area with the highest building height and the corresponding number of residential mixed-functional units is the largest. The Category B circle has more functional units of urban green space than the other two circles. The existence of community parks makes the lively atmosphere in this circle stronger [61]. The Category C circle represents the core urban area, and the various functional facilities inside this circle are well built, especially in terms of commercial and public services. The degree of functional mixing (Figure 10) also shows that the grid units in this circle have the highest functional mixing and are the most developed in Zhengzhou City’s main urban area.
3.3.2. Recognition and Expression of Spatial Image Elements
Through joint analysis, the characteristics of the spatial form and spatial services in the study area are verified, which will help people to identify the urban spatial structure and environmental vitality and deepen their cognition of urban space. This study identified the image elements that can describe the spatial characteristics of Zhengzhou City’s main urban area based on the characteristics of buildings and POIs (Figure 12).
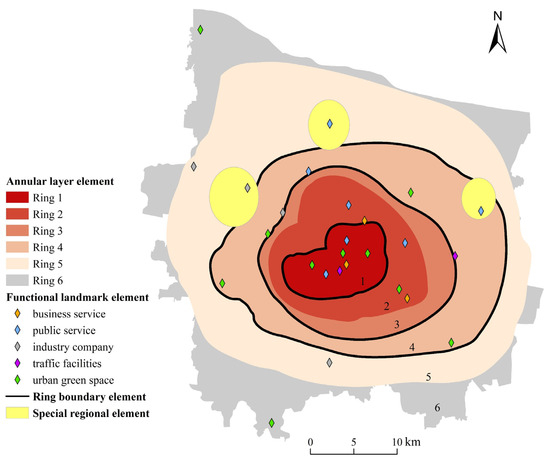
Figure 12.
Spatial image elements of the main urban areas of Zhengzhou City.
- (1)
- Annular layer element
The annular layer element expresses the circle characteristics of the main urban area. Different annular layers have different characteristics of architectural form and functional categories of POIs. The main urban area of Zhengzhou City is divided into six rings from the center to the periphery. Ring 1 is the core area, with a relatively perfect development degree of various facilities, low building height, high density and intensity values, mixed-service functions, and the highest degree of functional mixing. Ring 2 has low building height, good regional facilities, reduced building density, and is an important living space in the main urban area. Ring 3 is also a living space, with the highest building height due to the many high-rise residential buildings distributed in the region. The construction degree of Ring 4 is relatively weak, with a singular service function, which is the green park space in Zhengzhou. The area of Ring 5 is relatively empty, with few buildings and functional facilities, and the leading source of development is related to the companies and industrial category. Ring 6 is the peripheral area of the main urban area. It is relatively desolate and, except for two scenic spots, there are no apparent features.
- (2)
- Functional landmark element
Buildings or places that embody the functional characteristics of the rings are identified as functional landmark elements. They can be used to refine the description of the annular layer elements. The landmark element can express a specific spatial feature or represent a cluster, which coincides with the high kernel density value of different functional POIs. The landmarks in Ring 5 are mostly corporate industrial landmarks. Meanwhile, the proportion of urban green space landmarks is the highest in Ring 4. As a central development area of the city, the types and numbers of landmarks in Rings 1 and 2 are significantly higher than in other circles. Erqi Square, Zhengzhou Railway Station, and People’s Park are in the center, surrounded by the Zhengda First Affiliated Hospital and Zhengzhou People’s Hospital for public services, Guanhutun Commercial Center and Zoo for commercial services, and Bishagang Park and Bauhinia Mountain Park for urban green space.
- (3)
- Ring boundary element
The boundaries between different annular layers coincide with some vital ring lines of the urban space. The corresponding ring boundaries constitute the boundary elements of the main urban area. Among them, the outer boundary of Rings 1, 3, and 4 is an important dividing line, corresponding to the Second Ring Road, Third Ring Road, and Fourth Ring Road in Zhengzhou.
- (4)
- Special regional elements
Special regional elements have obvious spatial differences from the surrounding areas, disrupting the transitional characteristics of the main urban area. According to the experimental results, there are three special regional elements: the High-Tech Zone Cluster in the west, the Huiji Exhibition Special Functional Area in the north, and the Longzihu University Town in the east of the city. The three special regional elements are positioned on the outskirts of the city, but they are well constructed with various functional facilities. The existence of these elements confirms the characteristics of the multi-centric development of Zhengzhou’s spatial structure.
3.4. Inspection Based on City Planning Documents
In 2018, the “Overall Urban Design of Zhengzhou Central Urban Area” (http://zzland.zhengzhou.gov.cn, accessed on 4 May 2023) published by the Zhengzhou Municipal Planning Bureau summarized the main structure of the city into “two main areas, five vices, three rings, two verticals, two horizontals, four special and eight districts” in terms of urban spatial planning [62]. Following the guidelines of urban planning, we here discuss the value of the image elements obtained in this study.
- (1)
- Two main centers
Judging from the image results, it can be found that Erqi Square has a prominent central position. Erqi Square and its surrounding areas are the core of the old city of Zhengzhou, with a dense population and excellent functional facilities. Furthermore, people have long formed the image that Erqi Square is the center of the city. As a new central business district, Zhengdong New District has built commercial office buildings, residential areas, and other infrastructure, but the accompanying service facilities such as supermarkets, restaurants, and banks are not as developed as in the area of Erqi Square. Therefore, Zhengdong New District does not reflect the characteristics of the main center in the image but is shown as a functional landmark element. Accordingly, its construction as one of the main centers has yet to be strengthened.
- (2)
- Five sub-centers
The distribution of the five sub-centers in Zhengzhou is close to highly concentrated areas of various facilities, all of which are areas with relatively complete facilities after years of urban development. However, unlike the main center, a sub-center often has strong development in a certain category, and so is shown as a functional landmark element in the image results of the main urban area. Among them, the Bishagang sub-center and the Longhu sub-center represent urban green space landmarks, and the East Station sub-center and the Futa sub-center represent elements of public and commercial services, respectively, while the Huayuan Road sub-center has not been formed as a functional landmark element. Combining the results of the six types of POIs, it can be found that the area of the Huayuan Road sub-center corresponds to the area with a high kernel density value. Although this area has not formed distinctive image elements, the overall development is balanced, and the role of the urban sub-center is significant.
- (3)
- Third Ring Road
Erqi Square is the center of the city. With the increase in the flow of people, logistics, and traffic, the pace of construction gradually spreads to the surrounding areas, forming a circular pattern of spatial distribution. Subway Line 5 and the Second Ring Road in the main urban area of Zhengzhou are close to each other, and the delimited area is a bustling commercial and residential area. Buildings and POIs are most concentrated within the Third Ring Road, while they are scattered and sparse outside the Fourth Ring Road. The Third Ring Road and the Fourth Ring Road not only divide the inner and outer parts of the city but also carry a greater traffic burden. As one of the important products of Zhengzhou’s urban development, the ring line is one of the essential elements in the results of the spatial image analysis, and its existence further deepens people’s cognition of the circular characteristics of Zhengzhou.
- (4)
- Four special regions and eight districts
These two types of secondary urban centers are scattered throughout the main urban area, mainly between the Third and Fourth Ring Roads. The population density of these regions is lower than that of the Third Ring Road area, and the distribution of buildings and POI elements is relatively sparse, corresponding to the low value of kernel density. From the results of the urban spatial image analysis, we can determine that the Huiji Convention and Exhibition Zone, the Longzihu University Town, and the cluster center of the High-Tech Zone are recognized as special regional elements. Other areas should continue to strengthen construction and move towards urban planning goals, reflecting the spatial characteristics of the corresponding regions.
4. Discussion
4.1. Continuation and Development of Lynch’s City Image Theory
Based on the city image theory of Kevin Lynch, people generally select the form of the urban environment as a fundamental characteristic when forming a city image. The urban form represents a kind of symbol for urban characteristics, providing the most basic description of the urban spatial environment [63], often completed by observing the structure of the urban space. On the surface, the urban form reflects only the external form. However, through the urban form, people can truly understand the city [64], comprehensively analyze the essence of urban development, and recognize all aspects of the city in the process of development, which is crucial to the formation of the urban spatial image.
The construction of the urban space image is inextricably linked to the city’s economic, cultural, social, and other behavioral activities, in addition to its external spatial form [48]. If people are aware that the spatial form of the city initially forms the cognition of the image of the urban space, then the various services provided by the spatial elements can better help people to use and feel the urban space and establish a complete and rich spatial image [65,66].
For the urban core space at a macroscale, there are significant disparities in the progress made in construction and development among different regions. These disparities result in distinct architectural volumes and spatial functions, thus leading to diversity in spatial form and functionality. Therefore, in conducting this research on urban spatial images, we adopted a dual approach. Firstly, we selected relevant indicators based on the inherent spatial characteristics of the urban core, adhering to Lynch’s theory of city images emphasizing the urban spatial form. Secondly, we also chose indicators from the perspective of the diverse functions provided by urban spaces, complementing Lynch’s theory with a description of urban spatial services.
Our focus in developing the city image theory lies primarily in its application to urban contexts. In applying this theory, we made novel choices in terms of research data, methods, and approaches. Specifically, we aimed to leverage geospatial data and analysis techniques to identify image elements and create image maps that are more aligned with the unique characteristics of urban spaces. Ultimately, this development of the theory will lead to research outcomes that exhibit a distinct form compared to the traditional image results proposed by Lynch.
4.2. Differences from Traditional Image Results
Traditional questionnaire statistics and hand-drawn map data struggle to adequately capture the expression of urban spatial image results. In recent years, some open-source websites and application programming interfaces (APIs) provided by websites have become vital channels by which researchers access data [24]. Therefore, this paper opts for various emerging geospatial big data as its research data. While minimizing the time and effort spent on data acquisition and preprocessing, it is possible to obtain image results that better reflect the current urban situation.
While the five traditional elements can depict the urban spatial structure, they lack city-specific characteristics and fail to showcase the rich and diverse spatial features of cities. Our literature review reveals that existing studies on city images primarily apply traditional image elements locally. Scholars delineate the city’s structure based on five elements, namely paths, edges, districts, nodes, and landmarks, and assess residents’ use of urban space by statistically analyzing the frequency of these elements. Although such results provide preliminary insights into city images, they struggle to express and reflect the unique characteristics of different cities. Therefore, research on urban spatial images requires a more efficient, objective, and comprehensive approach to address the current shortcomings.
In this study on urban spatial images, we begin with a broad coverage of geospatial big data, focusing on two types of data: building data, which describe urban spatial morphology, and POI data, which reflect urban spatial services. Subsequently, we choose quantitative indicators suitable for analyzing building data and POI data and calculate these indicators to derive the city’s spatial characteristics. By combining the results from these two perspectives, we extract image elements that reflect the unique spatial characteristics of the city and summarize the characteristics of each image element, providing an intuitive representation of the current state of urban development.
The four unique image elements identified in this study represent a progression of traditional image elements. On the one hand, in terms of element forms, while traditional images consist of three forms—points (node, landmark), lines (path, edge), and areas (district)—the image elements in this study can also be categorized into points (functional landmark), lines (ring boundary), and areas (annular layer, special regional), all possessing readily understandable symbolic characteristics. On the other hand, while traditional image elements can only express the city’s structure through the combination of element symbols, the image elements in this study, in addition to depicting urban spatial structure, can also reflect the city’s spatial functional characteristics. For example, the annular layer element not only indicates the city’s layered structure but also highlights the developmental differences and characteristics of the city in different spaces.
4.3. Application of Image Research Results in Urban Development
The urban spatial structure manifests as the spatial form of various elements within a city through their inherent mechanisms interacting during a specific historical period [48]. Emphasis is placed on exploring the distribution and interaction patterns of constituent elements within a city from a spatial perspective. Combining urban spatial structure theory with city image theory, this study conducts an instance-based image study at the scale of the main urban area. By comparing the research results with the urban planning documents released by Zhengzhou City, significant advantages of these image results in examining urban spatial structure and development status are identified.
On the one hand, the analysis based on image results reveals a high degree of similarity between the development status of Zhengzhou City and the urban planning objectives regarding several aspects. The main centers and sub-centers of Zhengzhou City are represented by functional landmark elements, the spatial positions of the three rings and the ring boundary elements are highly matched, and three out of four special functional zones are identified as special regional elements. On the other hand, the image results provide insights into the current development progress of the city. For example, while both Zhengdong New District and Erqi Square are designated as main centers in the planning documents, their performances in the image results are starkly different. Zhengdong New District is depicted as a functionally singular landmark element [67]. Therefore, it is inferred that there is a need to enhance the construction of its functional facilities to promote its development into a main center with comprehensive services.
As evolving spatial entities, cities require continuous adjustments to their spatial structure and functions to adhere to the principles of sustainable development. During the ongoing process of urban development, governments often formulate corresponding planning documents to determine the city’s future direction and objectives. Image results serve as valuable reference and inspection tools in this process. Building upon urban spatial image research, the integration with practical applications is further advocated. In the pre-planning stage, an understanding of the city’s current spatial structure and characteristics through image results enables the formulation of development goals that are more tailored to the city’s own features. During the planning implementation phase, obtaining image results at various time points allows for monitoring the dynamic development process of the city, providing a basis for urban management decisions. In the planning acceptance phase, combining image results facilitates the examination and evaluation of the degree of the spatial structure and functional construction of the city, aiding planners in comprehensively understanding the city from both spatial form and functional perspectives, and assisting them in formulating more suitable planning objectives for urban sustainable development.
4.4. Contributions and Limitations of the Research
By leveraging geographic big data and advanced spatial analysis tools, this study innovatively explored techniques for capturing urban spatial images, thereby enhancing Lynch’s traditional image theory and its constituent elements. While Zhengzhou serves as an illustrative case, the core research framework presented herein possesses universal applicability. The reliance on comprehensive geographic big data, with their extensive urban coverage and efficient data acquisition, enables the framework’s deployment across diverse urban contexts. The maturity and usability of the spatial analysis methods employed ensure the reproducibility and broad applicability of the proposed urban spatial image research framework.
The practical application of urban spatial images holds significant scientific value. Translating theoretical insights into actionable strategies allows us to tackle urban development challenges more effectively. The validation of our image results against urban planning documents underscores their practical value. These results not only offer a comprehensive visualization of urban spatial structures and characteristics but also serve as a valuable reference for urban planners. This achievement can aid planners in grasping urban spatial dynamics accurately, informing the optimization of urban spatial layouts with scientific rigor.
Despite the in-depth exploration of urban spatial images in this study, there remain limitations that merit further scrutiny in future research. Given the inherent complexity of urban spaces, different individuals or groups often hold varying perspectives and evaluations of the same urban spaces [68]. In the face of this subjectivity and complexity, although we strive for methodological innovation, accurately reflecting the image of all individuals or groups remains a formidable task. Specifically, during the data acquisition phase, while big data provide us with a wealth of perspectives, their coverage and depth are still limited, potentially failing to comprehensively capture the experiences and viewpoints of all residents. This could lead to biases or omissions in our understanding of urban spaces. Additionally, the validation of this study primarily relies on macro-level urban planning documents, which, while useful for examining results from a macroscopic perspective, may overlook residents’ actual sentiments and specific needs.
Looking ahead, geographic big data will remain a crucial support for research, but effectively leveraging these data is an area that needs further exploration [69]. For instance, while this study extracted urban spatial service characteristics through POI data, there is still room for improvement in reflecting transportation service road elements [35]. Therefore, future research should delve deeper into the potential of geographic big data in urban studies and consider integrating multi-dimensional data to enrich and refine the analysis of urban spatial images. Concurrently, we must integrate the study of urban spatial images with practical applications. Future research could incorporate qualitative methods or community participation to gain a deeper understanding of residents’ needs and expectations. Through citizen engagement, collaborative design, and other approaches, we can comprehensively validate and enrich research outcomes, effectively translating them into practical urban planning and design strategies. This will provide valuable guidance and support for urban spatial management and environmental planning.
5. Conclusions
Based on the data of buildings and POIs in Zhengzhou City, this study summarizes the spatial form categories and distribution characteristics of buildings using fishnet analysis and obtains the types and mixing degree of POI spatial services by means of fishnet calculations. Through the results of the two-dimensional analysis, the overall spatial structure and characteristics of the main urban area of Zhengzhou City are investigated.
Compared to traditional image research methods, the data and methods used in this study are optimized. Accessing and processing open source data is more convenient, and the quantitative analysis of spatial phenomena is deeper using the spatial analysis method. The experimental results show that the annular layer elements, functional landmarks, ring boundaries, and special regional elements can fully express the spatial image of the urban scale of Zhengzhou.
By comparing the obtained spatial image of Zhengzhou with the overall urban construction planning, we find that the spatial image results can provide an appropriate description of the spatial characteristics and current situation of the main urban area. This portrait can help us to observe the current construction and development status of the main urban area of the city more intuitively. Among them, the annular layer and the ring boundary elements together describe the annular spatial structure of Zhengzhou City. The functional landmark elements are representative buildings or places that describe the characteristics and functions of different circles. Special regional elements and functional landmark elements jointly confirm the development pattern of Zhengzhou’s multi-centric spatial structure. For different planning centers, the development status of those identified as image elements can be understood through the elements category, while those without image elements will be critical areas for future construction and development.
The extensive coverage of geospatial big data renders the research methodology proposed in this paper broadly applicable, supporting spatial image studies in other cities. Given this significant advantage, we eagerly encourage more scholars to extensively apply the research framework presented in this paper to diverse urban environments. By utilizing similar datasets, research methodologies, and experimental procedures, a series of studies can be conducted to explore the differences in spatial images among various cities. Furthermore, comparing the performance of this research system in different urban spaces will contribute to the continuous improvement and refinement of our indicators and methods. Utilizing time-series data, we can also analyze the dynamic changes in urban spatial images, revealing the spatiotemporal evolution characteristics of the urban spatial structure. Alongside theoretical exploration, effectively translating the research findings and methodologies into practical urban planning and management measures is a crucial step in realizing the transformation of research value. By directly applying these outcomes to urban planning, we can more precisely respond to the needs of urban residents, thereby effectively enhancing the livability and sustainability of cities.
Author Contributions
Conceptualization, methodology, investigation, formal analysis, and writing—original draft preparation, X.Z.; supervision, project administration, funding acquisition, and resources, H.L. and Q.S.; data curation and data validation, J.X.; visualization, writing—review and editing, H.L. and Q.S. All authors have read and agreed to the published version of the manuscript.
Funding
This research was funded by the “Theory and Method of Map and Spatial Cognition under Human-Machine-Environment Collaboration” of the High-level Talents Research Project of Zhengzhou University (135-32310276).
Data Availability Statement
The data presented in this study are available on request from the corresponding author. The data are not publicly available due to the public as the team’s follow-up study is still pending.
Conflicts of Interest
The authors declare no conflicts of interest.
References
- Guan, X.; Wei, H.; Lu, S.; Dai, Q.; Su, H. Assessment on the urbanization strategy in China: Achievements, challenges and reflections. Habitat Int. 2018, 71, 97–109. [Google Scholar] [CrossRef]
- Zhao, L.; Luo, L.; Li, B.; Li, H. Analysis of the Uniqueness and Similarity of City Landscapes Based on Deep Style Learning. ISPRS Int. J. Geo-Inf. 2021, 10, 734. [Google Scholar] [CrossRef]
- Shi, Y.; Zhai, G.; Xu, L.; Zhou, S.; Lu, Y.; Liu, H.; Huang, W. Assessment methods of urban system resilience: From the perspective of complex adaptive system theory—ScienceDirect. Cities 2021, 112, 103141. [Google Scholar] [CrossRef]
- Faria, P.; Ferreira, F.; Jalali, M.S.; Bento, P.; António, N. Combining cognitive mapping and MCDA for improving quality of life in urban areas. Cities 2018, 78, 116–127. [Google Scholar] [CrossRef]
- Zhang, A.; Li, W.; Wu, J.; Lin, J.; Chu, J.; Xia, C. How can the urban landscape affect urban vitality at the street block level? A case study of 15 metropolises in China. Environ. Plan. B Urban Anal. City Sci. 2021, 48, 1245–1262. [Google Scholar] [CrossRef]
- Feng, J. Spatial cognition and image space of Beijing’s residents. Sci. Geogr. Sin. 2005, 2, 142–154. [Google Scholar] [CrossRef]
- Cao, Y.; Long, Y.; Yang, P. City image study based on online pictures: 24 cities case. Planners 2017, 33, 61–67. [Google Scholar]
- Lynch, K. The Image of the City; MIT Press: Cambridge, MA, USA, 1960. [Google Scholar]
- Yang, Z.; Yin, M.; Xu, J.; Lin, W. Spatial evolution model of tourist destinations based on complex adaptive system theory: A case study of Southern Anhui, China. J. Geogr. Sci. 2019, 29, 1411–1434. [Google Scholar] [CrossRef]
- Zhou, X.; Li, H.; Zhang, H.; Zhang, R.; Li, H. A Study on the Cognition of Urban Spatial Image at Community Scale: A Case Study of Jinghu Community in Zhengzhou City. Land 2022, 11, 1654. [Google Scholar] [CrossRef]
- Zhao, Z.; Song, J.; Liang, S.; Yan, T. Campus image space analysis and comprehensive cognitive level measurement: A case study of Nanjing University of Information Science and Technology. Reg. Res. Dev. 2022, 41, 77–83. [Google Scholar]
- Gu, C.; Song, G. Urban image space and main factors in Beijing. Acta Geogr. Sin. 2001, 56, 64–74. [Google Scholar]
- He, D.; Dan, C.; Zhang, P.; Gao, P. Spatial scope cognition of urban agglomeration in the middle reaches of Yangtze River based on cognitive map of college students. Geogr. Res. 2018, 37, 1818–1831. [Google Scholar]
- Huang, J.; Obracht-Prondzynska, H.; Kamrowska-Zaluska, D.; Sun, Y.; Li, L. The image of the City on social media: A comparative study using “Big Data” and “Small Data” methods in the Tri-City Region in Poland. Landsc. Urban Plan. 2021, 206, 103977. [Google Scholar] [CrossRef]
- Mccunn, L.J.; Gifford, R. Place imageability, sense of place, and spatial navigation: A community investigation. Cities 2021, 115, 103245. [Google Scholar] [CrossRef]
- Dai, T.; Zheng, X. Understanding how multi-sensory spatial experience influences atmosphere, affective city image and behavioural intention. Environ. Impact Assess. Rev. 2021, 89, 106595. [Google Scholar] [CrossRef]
- Vanderhaegen, S.; Canters, F. Mapping urban form and function at city block level using spatial metrics. Landsc. Urban Plan. 2017, 167, 399–409. [Google Scholar] [CrossRef]
- Harvey, C.; Aultmanhall, L.; Troy, A.; Hurley, S.E. Streetscape skeleton measurement and classification. Environ. Plan. B. Urban Anal. City Sci. 2017, 44, 668–692. [Google Scholar] [CrossRef]
- Middel, A.; Lukasczyk, J.; Zakrzewski, S. Urban form and composition of street canyons: A human-centric big data and deep learning approach. Landsc. Urban Plan. 2018, 183, 122–132. [Google Scholar] [CrossRef]
- Ye, Y.; Jia, C. Research on the Influence of pedestrian space Characteristics on physical disorder in living streets of old city Based on Street View Image—A case study on theANN area of Harbin. Contemp. Archit. 2022, 35, 72–75. [Google Scholar]
- Chen, Z.; Yu, B.; Wei, S.; Liu, H.; Wu, J. A New Approach for Detecting Urban Centers and Their Spatial Structure with Nighttime Light Remote Sensing. IEEE Trans. Geosci. Remote Sens. 2017, 55, 6305–6319. [Google Scholar] [CrossRef]
- Agustí, D. The clustering of city images on Instagram: A comparison between projected and perceived images. J. Destin. Mark. Manag. 2021, 20, 100608. [Google Scholar] [CrossRef]
- Peng, X.; Bao, Y.; Huang, Z. Perceiving Beijing’ s “City Image” Across Different Groups Based on Geotagged Social Media Data. IEEE Access 2020, 8, 93868–93881. [Google Scholar] [CrossRef]
- Yao, Y.; Wang, J.; Hong, Y.; Qian, C.; Guan, Q.; Liang, X.; Dai, L.; Zhang, J. Discovering the homogeneous geographic domain of human perceptions from street view images. Landsc. Urban Plan. 2021, 212, 104125. [Google Scholar] [CrossRef]
- Yao, Y.; Liang, Z.; Yuan, Z.; Liu, P.; Bie, Y.; Zhang, J.; Wang, R.; Wang, J.; Guan, Q. A human-machine adversarial scoring framework for urban perception assessment using street-view images. Int. J. Geogr. Inf. Sci. 2019, 33, 2363–2384. [Google Scholar] [CrossRef]
- Buchta, P.C. Measuring the resemblance between pictorial and verbal city image spaces. Int. J. Cult. Tour. Hosp. Res. 2012, 6, 326–339. [Google Scholar]
- Chen, X.; Li, J.; Han, W.; Liu, S. Urban Tourism Destination Image Perception Based on LDA Integrating Social Network and Emotion Analysis: The Example of Wuhan. Sustainability 2021, 14, 12. [Google Scholar] [CrossRef]
- Liu, L.; Zhou, B.; Zhao, J.; Ryan, B.D. C-IMAGE: City cognitive mapping through geo-tagged photos. GeoJournal 2016, 81, 817–861. [Google Scholar] [CrossRef]
- Cao, Y.; Yang, P.; Long, Y. Innovation and Expansion of urban image cognition methods based on deep learning: A case study of Chongqing City. Chin. Gard. 2019, 35, 90–95. [Google Scholar] [CrossRef]
- Wilkowski, A.; Mykhalevych, I.; Luckner, M. City Bus Monitoring Supported by Computer Vision and Machine Learning Algorithms: Progress in Automation, Robotics and Measurement Techniques. In Automation 2019; Springer: Echo Bay, ON, Canada, 2020. [Google Scholar]
- Martí, P.; Serrano-Estrada, L.; Nolasco-Cirugeda, A. Social Media data: Challenges, opportunities and limitations in urban studies. Comput. Environ. Urban Syst. 2019, 74, 161–174. [Google Scholar] [CrossRef]
- Isabel, G.; Thomas, B.; Hannes, T.C. New spatial dimensions of global cityscapes: From reviewing existing concepts to a conceptual spatial approach. J. Geogr. Sci. 2016, 26, 355–380. [Google Scholar] [CrossRef]
- Goodchild, M.F. Citizens as sensors: The world of volunteered geography. Geojournal 2007, 69, 211–221. [Google Scholar] [CrossRef]
- Xia, H.; Liu, Z.; Efremochkina, M.; Liu, X.; Lin, C. Study on city digital twin technologies for sustainable smart city design: A review and bibliometric analysis of geographic information system and building information modeling integration. Sustain. Cities Soc. 2022, 84, 104009. [Google Scholar] [CrossRef]
- Xiao, X.; Xue, B.; Zhao, B.; Li, J.; Ren, W. A POI data-based study on urban functional areas of the resources-based city: A case study of Benxi, Liaoning. Hum. Geogr. 2020, 35, 81–90. [Google Scholar] [CrossRef]
- Jiang, Y.; Guo, D.; Li, Z.; Hodgson, M.E. A novel big data approach to measure and visualize urban accessibility. Comput. Urban Sci. 2021, 1, 10. [Google Scholar] [CrossRef]
- Yang, J.; Zhang, Z.; Dawazhaxi; Wang, B.; Li, Q.; Yu, Q.; Ou, X.; Kashif, A. Spatial distribution patterns and intra-specific competition of pine (Pinus yunnanensis) in abandoned farmland under the Sloping Land Conservation Program. Ecol. Eng. 2019, 135, 17–27. [Google Scholar] [CrossRef]
- Feizizadeh, B.; Omarzadeh, D.; Blaschke, T. Spatiotemporal mapping of urban trade and shopping patterns: A geospatial big data approach. Int. J. Appl. Earth Obs. 2021, 128, 103764. [Google Scholar] [CrossRef]
- Nazmfar, H.; Alavi, S.; Feizizadeh, B.; Masodifar, R.; Eshghei, A. Spatial Analysis of Security and Insecurity in Urban Parks: A Case Study of Tehran, Iran. Prof. Geogr. 2020, 72, 383–397. [Google Scholar] [CrossRef]
- Dong, T.; Jiao, L.; Xu, G.; Yang, L.; Liu, J. Towards sustainability? Analyzing changing urban form patterns in the United States, Europe, and China. Sci. Total Environ. 2019, 291, 632–643. [Google Scholar] [CrossRef]
- Chi, J.; Jiao, L.; Dong, T.; Gu, Y.; Ma, Y. Quantitative identification and visualization of urban functional area based on POI data. J. Geomat. 2016, 41, 68–73. [Google Scholar] [CrossRef]
- Zhang, Z.; Qian, Z.; Zhong, T. Vectorized rooftop area data for 90 cities in China. Sci. Data 2022, 9, 66. [Google Scholar] [CrossRef]
- Hu, S.; He, Z.; Wu, L.; Yin, L.; Cui, H. A framework for extracting urban functional regions based on multiprototype word. Comput. Environ. Urban Syst. 2019, 95, 101442. [Google Scholar] [CrossRef]
- Li, J.; Li, J.; Yuan, Y.; Li, G. Spatiotemporal distribution characteristics and mechanism analysis of urban population density: A case of Xi’an, Shaanxi, China. Cities 2019, 86, 62–70. [Google Scholar] [CrossRef]
- Li, J.; Xie, X.; Zhao, B.; Xiao, X.; Qiao, J.; Ren, W. Identification of Urban Functional Area by Using Multisource Geographic Data: A Case Study of Zhengzhou, China. Complexity 2021, 2021, 8875276. [Google Scholar] [CrossRef]
- Musiaka, L.; Nalej, M. Application of GIS Tools in the Measurement Analysis of Urban Spatial Layouts Using the Square Grid Method. ISPRS Int. J. Geo-Inf. 2021, 10, 558. [Google Scholar] [CrossRef]
- Yin, Z.Y. Spatial Patterns of Lightning at Different Spatial Scales in the Western United States during August of 1990—A Case Study Using the Geographic Information Systems Technology. J. Environ. Inform. 2007, 9, 4–17. [Google Scholar] [CrossRef]
- Maselli, L.Z.; Negri, R.G. Urban structure type mapping method using spatial metrics and remote sensing imagery classification. Earth Sci. Inform. 2021, 14, 2357–2372. [Google Scholar] [CrossRef]
- Huang, J.; Lu, X.X.; Sellers, J.M. A global comparative analysis of urban form: Applying spatial metrics and remote sensing. Landsc. Urban Plan. 2007, 82, 184–197. [Google Scholar] [CrossRef]
- Cao, G.; Shi, Q.; Liu, T. An integrated model of urban spatial structure: Insights from the distribution of floor area ratio in a Chinese city. Appl. Geogr. 2016, 75, 116–126. [Google Scholar] [CrossRef]
- Qiao, W.; Gao, J.; Guo, Y.; Ji, Q.; Wu, J.; Cao, M. Multi-dimensional expansion of urban space through the lens of land use: The case study of Nanjing City, China. J. Geogr. Sci. 2019, 29, 749–761. [Google Scholar] [CrossRef]
- Lin, J.; Huang, B.; Chen, M.; Huang, Z. Modeling urban vertical growth using cellular automata—Guangzhou as a case study. Appl. Geogr. 2014, 53, 172–186. [Google Scholar] [CrossRef]
- Ling, Y.; Xin, Y.; Hzab, C.; Jmab, C.; Hui, Z.; Xu, H. Urban morphological regionalization based on 3D building blocks—A case in the central area of Chengdu, China. Comput. Environ. Urban Syst. 2022, 94, 101800. [Google Scholar] [CrossRef]
- Okabe, A.; Satoh, T.; Sugihara, K. A kernel density estimation method for networks, its computational method and a GIS-based tool. Int. J. Geogr. Inf. Sci. 2009, 23, 7–32. [Google Scholar] [CrossRef]
- Sheather, S.J.; Jones, M.C. A reliable data-based bandwidth selection method for kernel density estimation. J. R. Stat. Soc. Ser. B Methodol. 1991, 53, 683–690. [Google Scholar]
- Fu, C.; Tu, X.; Huang, A. Identification and Characterization of Production–Living–Ecological Space in a Central Urban Area Based on POI Data: A Case Study for Wuhan, China. Sustainability 2021, 13, 7691. [Google Scholar] [CrossRef]
- Zheng, Q.; Zhao, X.; Jin, M.; Liu, X. A Study on Diversity of Physical Activities in Urban Parks Based on POI Mixed-use: A Case Study of Futian District, Shenzhen. Planners 2020, 36, 78–86. [Google Scholar]
- Luck, M.; Wu, J. A gradient analysis of urban landscape pattern: A case study from the phoenix metropolitan region, Arizona, USA. Landsc. Ecol. 2002, 17, 327–339. [Google Scholar] [CrossRef]
- Tian, H.; Qu, J.; Wang, Z. Research on the enhancement trend of the urbanity of high-rise buildings. Int. J. High-Rise Build. 2023, 12, 11–18. [Google Scholar]
- Mouratidis, K. Compact city, urban sprawl, and subjective well-being. Cities 2019, 92, 261–272. [Google Scholar] [CrossRef]
- Ma, B.; Zhou, T.; Lei, S.; Wen, Y.; Htun, T.T. Effects of urban green spaces on residents’ well-being. Environ. Dev. Sustain. 2019, 21, 2793–2809. [Google Scholar] [CrossRef]
- Li, X. Recognition of Urban Polycentric Structure Based on Spatial Aggregation Characteristics of POI Elements: A Case of Zhengzhou City. Acta Sci. Nat. Univ. Pekin. 2020, 56, 697–702. [Google Scholar] [CrossRef]
- Tomko, M.; Winter, S. Describing the functional spatial structure of urban environments. Comput. Environ. Urban Syst. 2013, 41, 177–187. [Google Scholar] [CrossRef]
- He, S.; Yu, S.; Li, G.; Zhang, J. Exploring the influence of urban form on land-use efficiency from a spatiotemporal heterogeneity perspective: Evidence from 336 Chinese cities. Land Use Policy 2020, 95, 104576. [Google Scholar] [CrossRef]
- Gao, S.; Janowicz, K.; Couclelis, H. Extracting urban functional regions from points of interest and human activities on location-based social networks. Trans. GIS 2017, 21, 446–467. [Google Scholar] [CrossRef]
- Chen, J.; Gan, Z.; Li, D.; Zhang, Y.; Wang, C.; Tao, X.; Zhu, M. Comprehensive strength evaluation system of commercial centres based on multi-source data: A case of Hefei central city. Sci. Rep. 2023, 13, 17082. [Google Scholar] [CrossRef] [PubMed]
- Yang, T.; Pan, H.; Hewings, G.; Jin, Y. Understanding urban sub-centers with heterogeneity in agglomeration economies-Where do emerging commercial establishments locate? Cities 2019, 86, 25–36. [Google Scholar] [CrossRef]
- Liu, L.; Silva, E.; Wu, C.; Wang, H. A machine learning-based method for the large-scale evaluation of the qualities of the urban environment. Comput. Chem. Eng. 2021, 65, 113–125. [Google Scholar] [CrossRef]
- Tufekci, Z. Big Questions for Social Media Big Data: Representativeness, Validity and Other Methodological Pitfalls. In Proceedings of the Eighth International AAAI Conference on Weblogs and Social Media (ICWSM-14), Ann Arbor, MI, USA, 1–4 June 2014; Volume 8, pp. 505–514. [Google Scholar] [CrossRef]
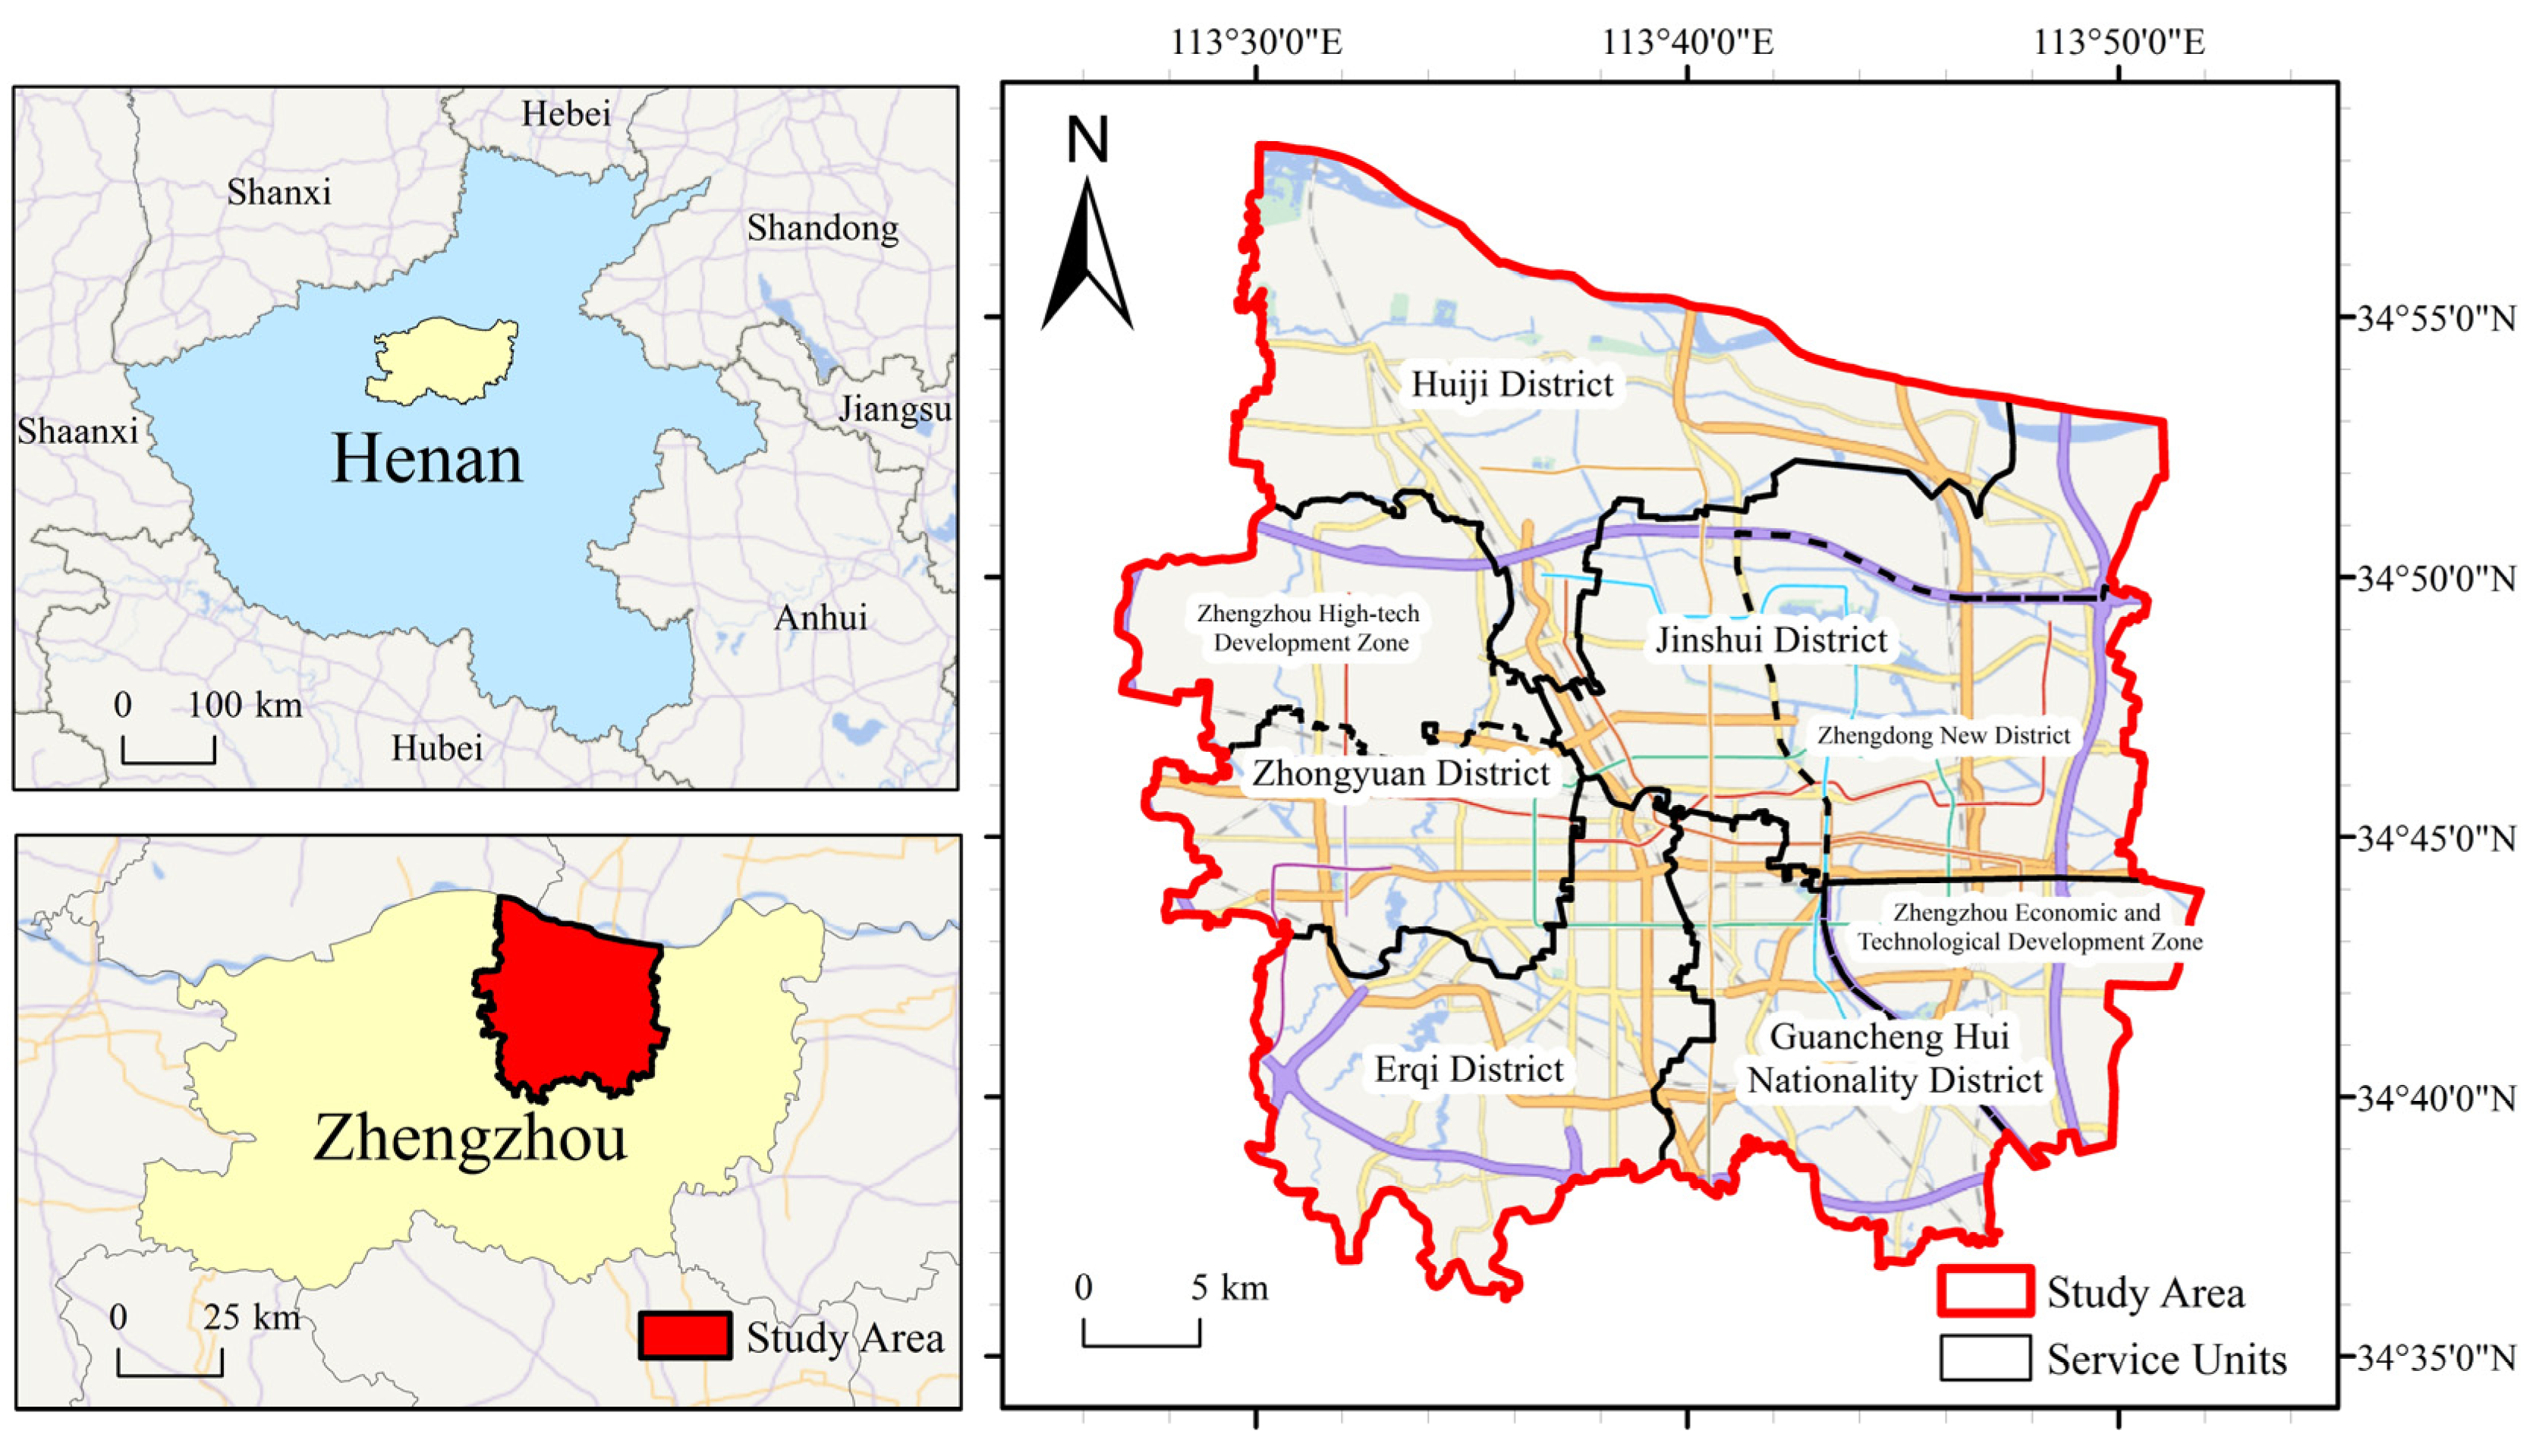
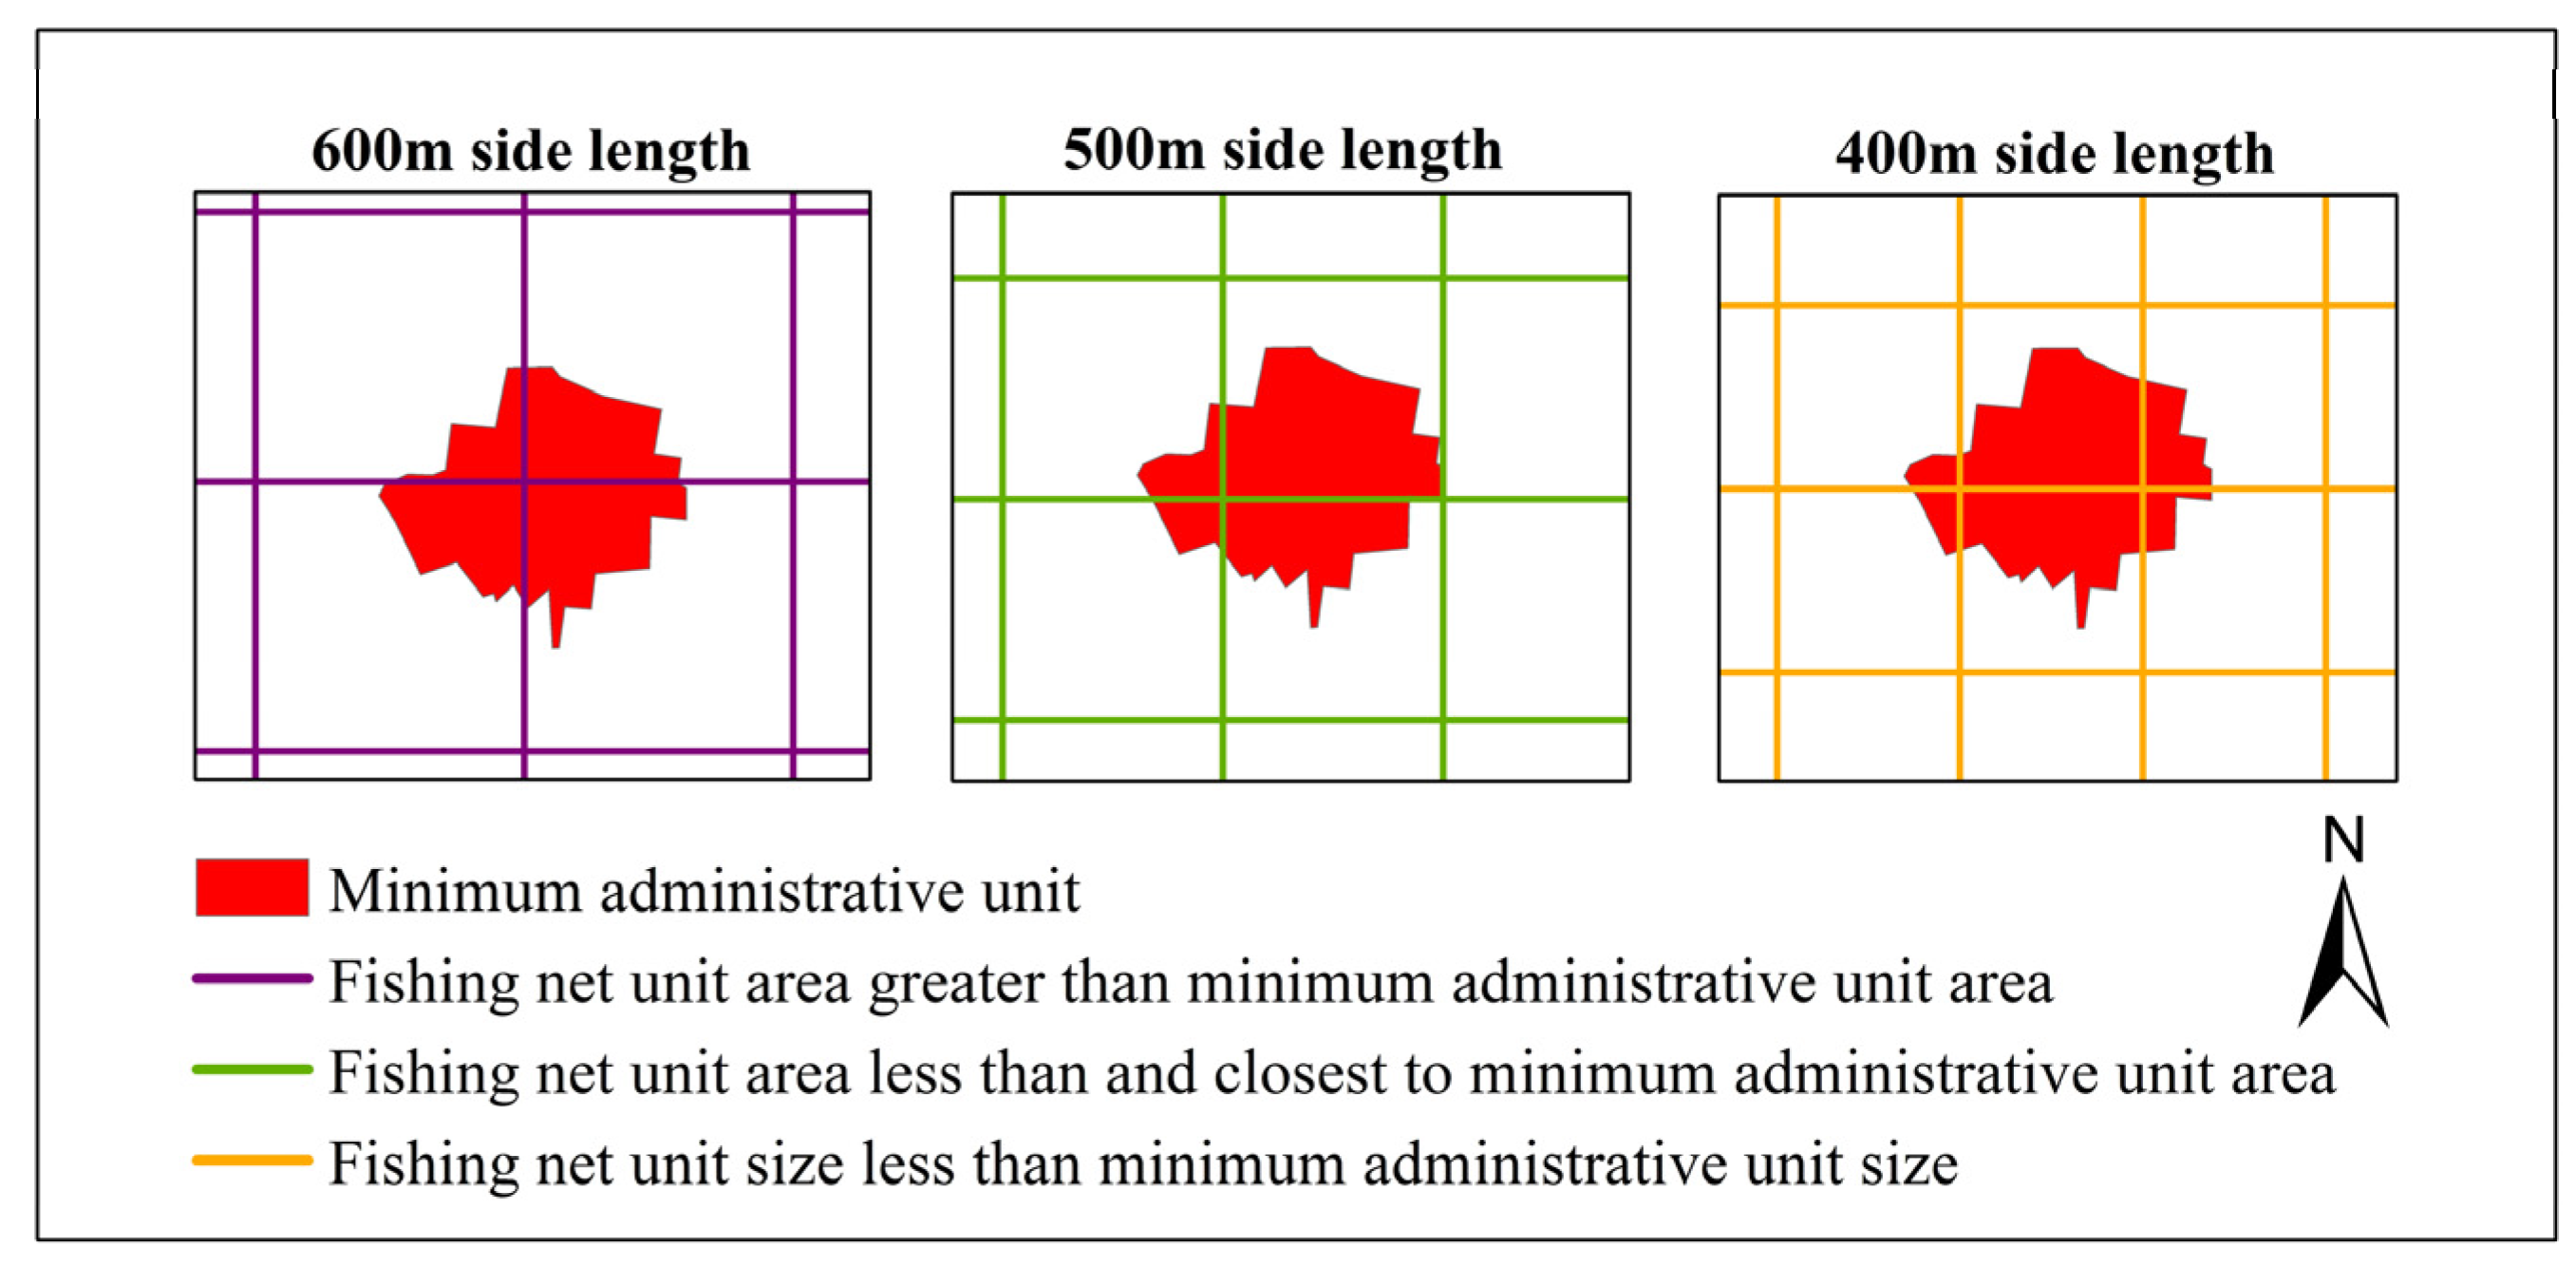
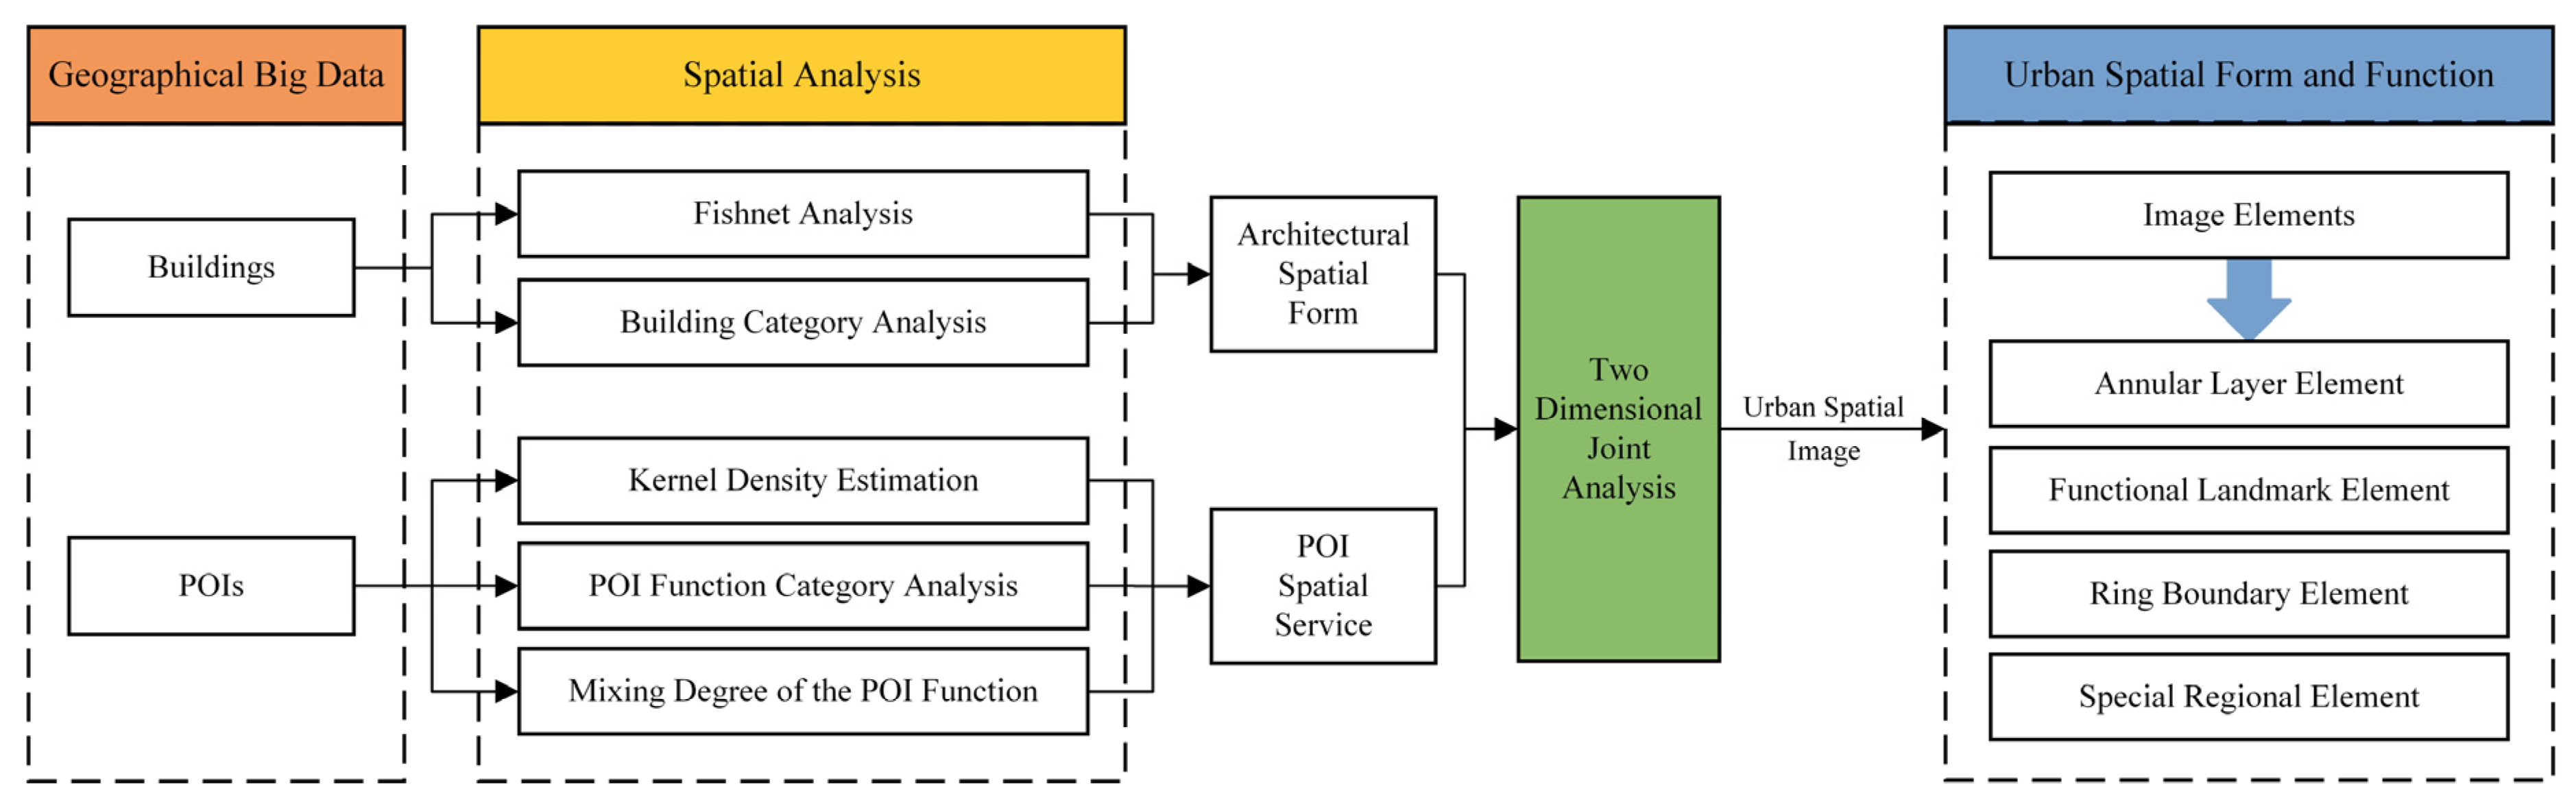
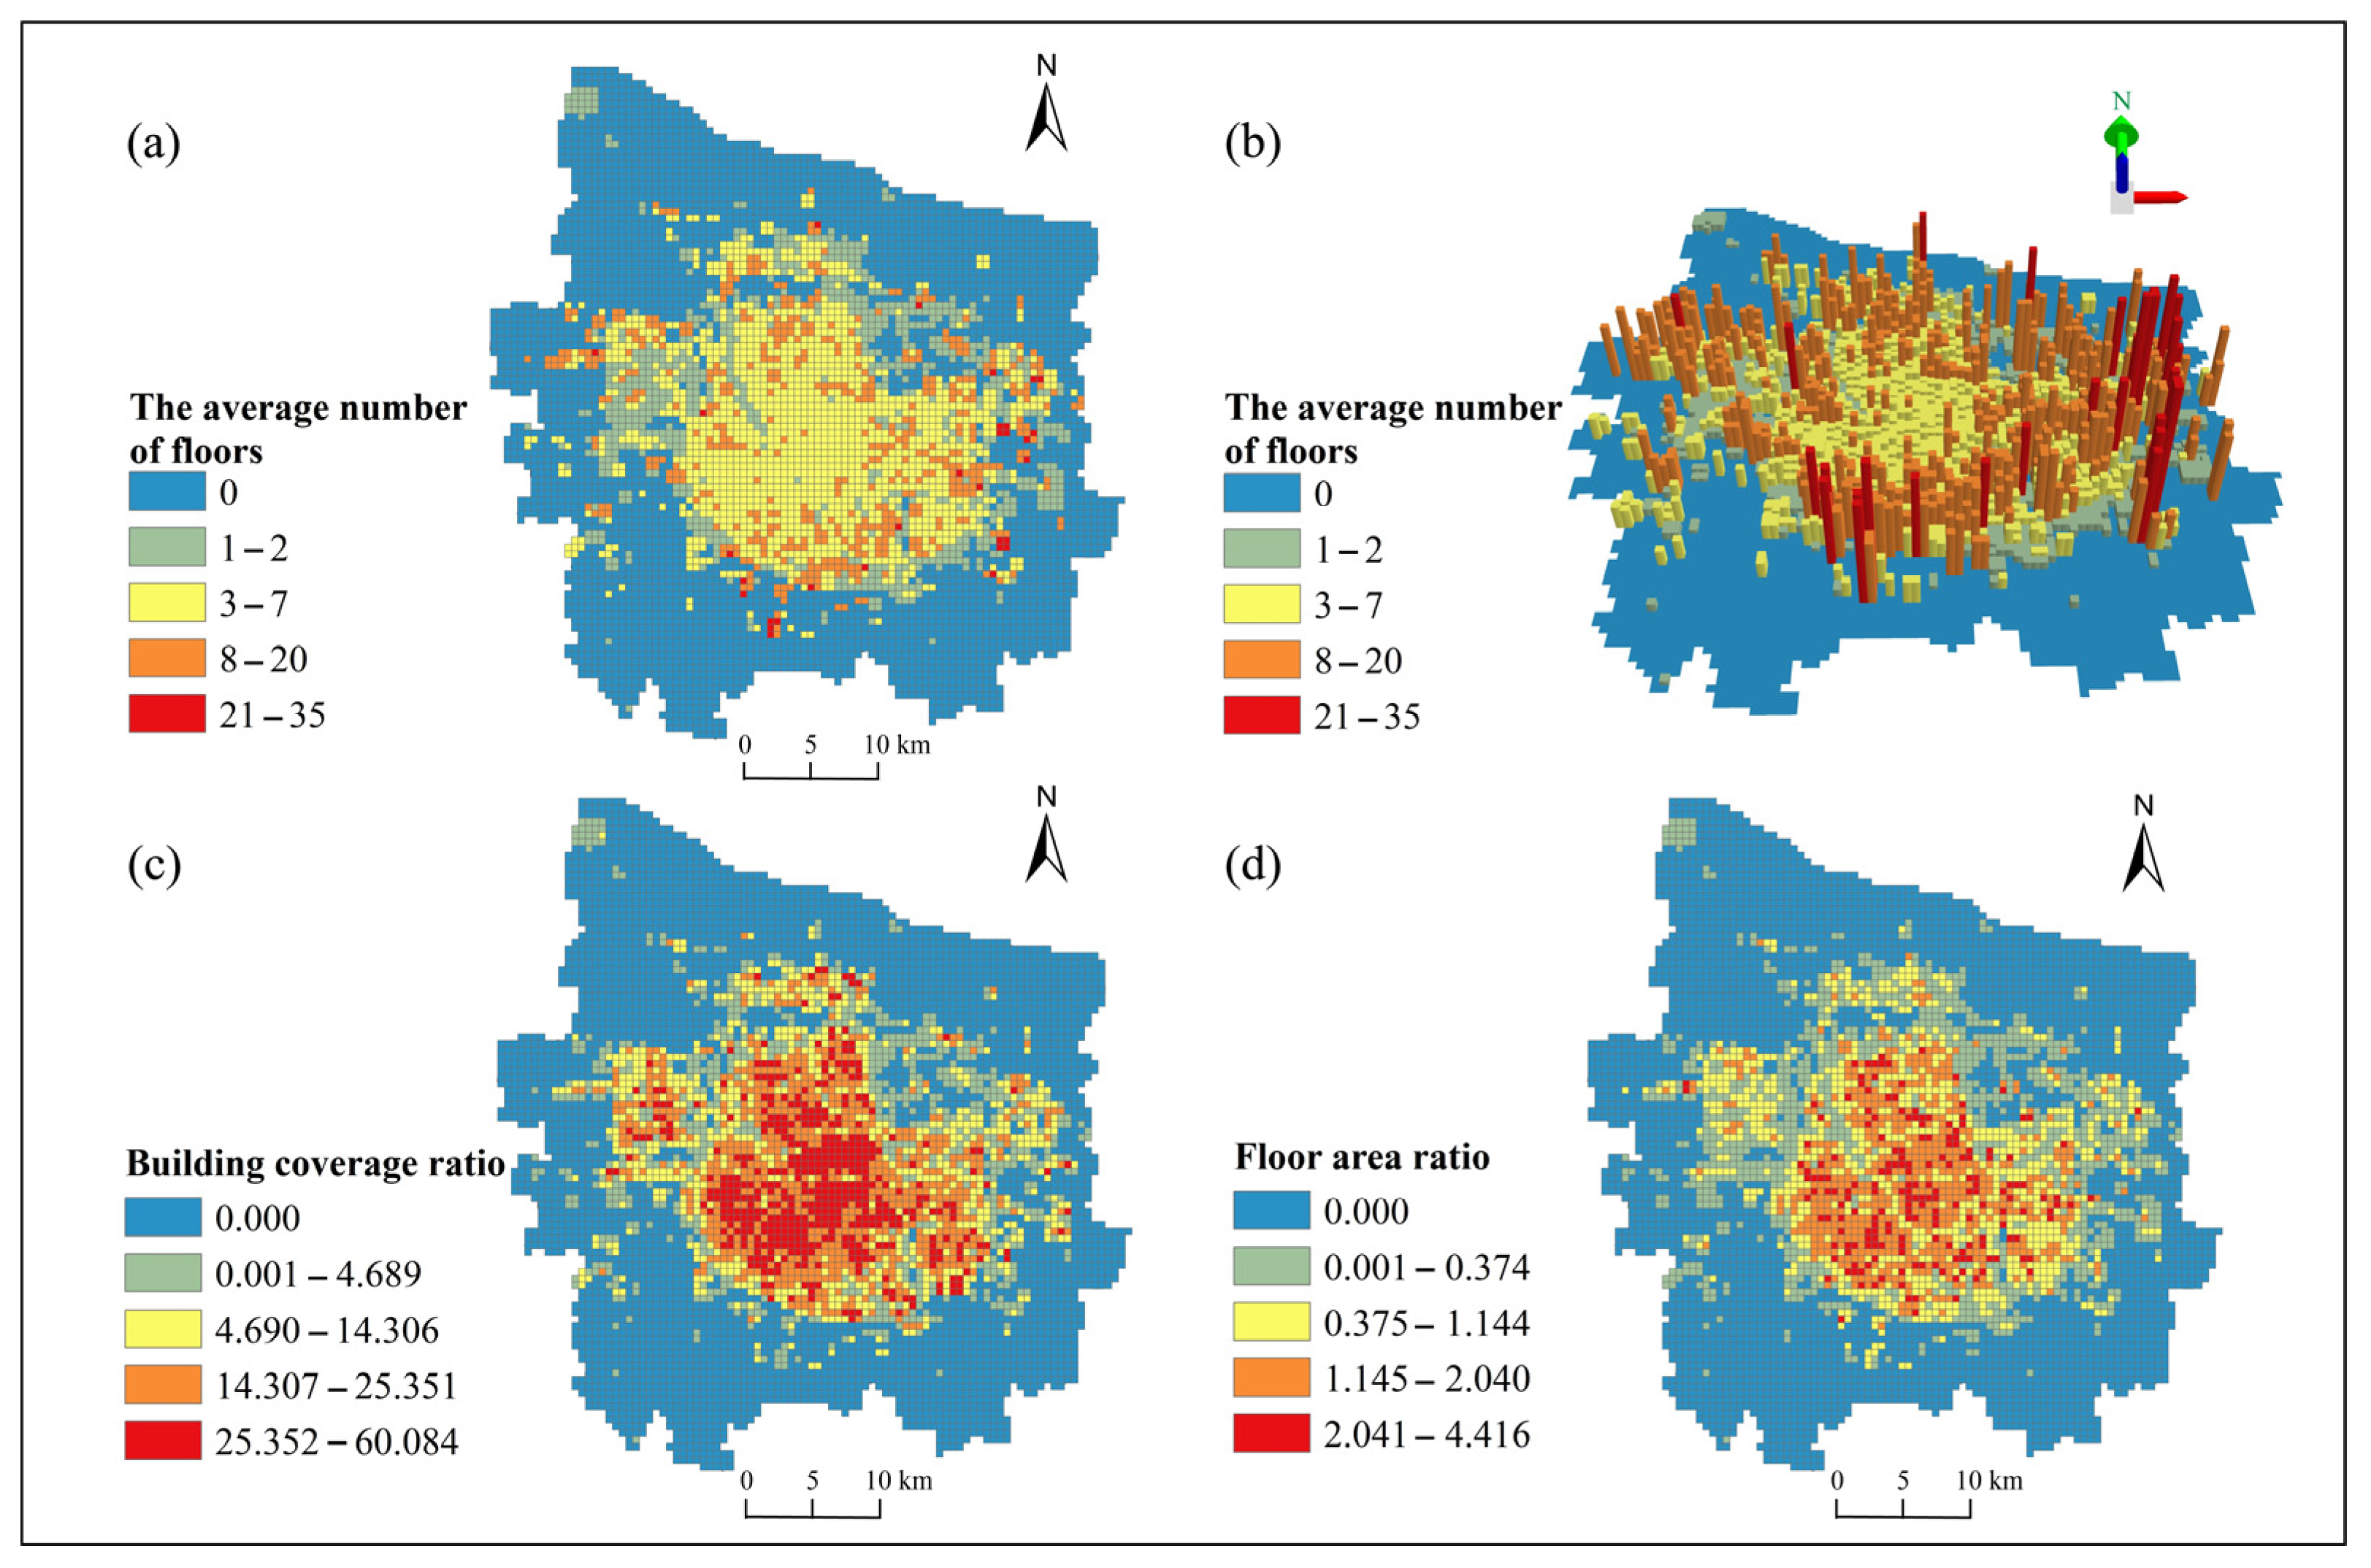
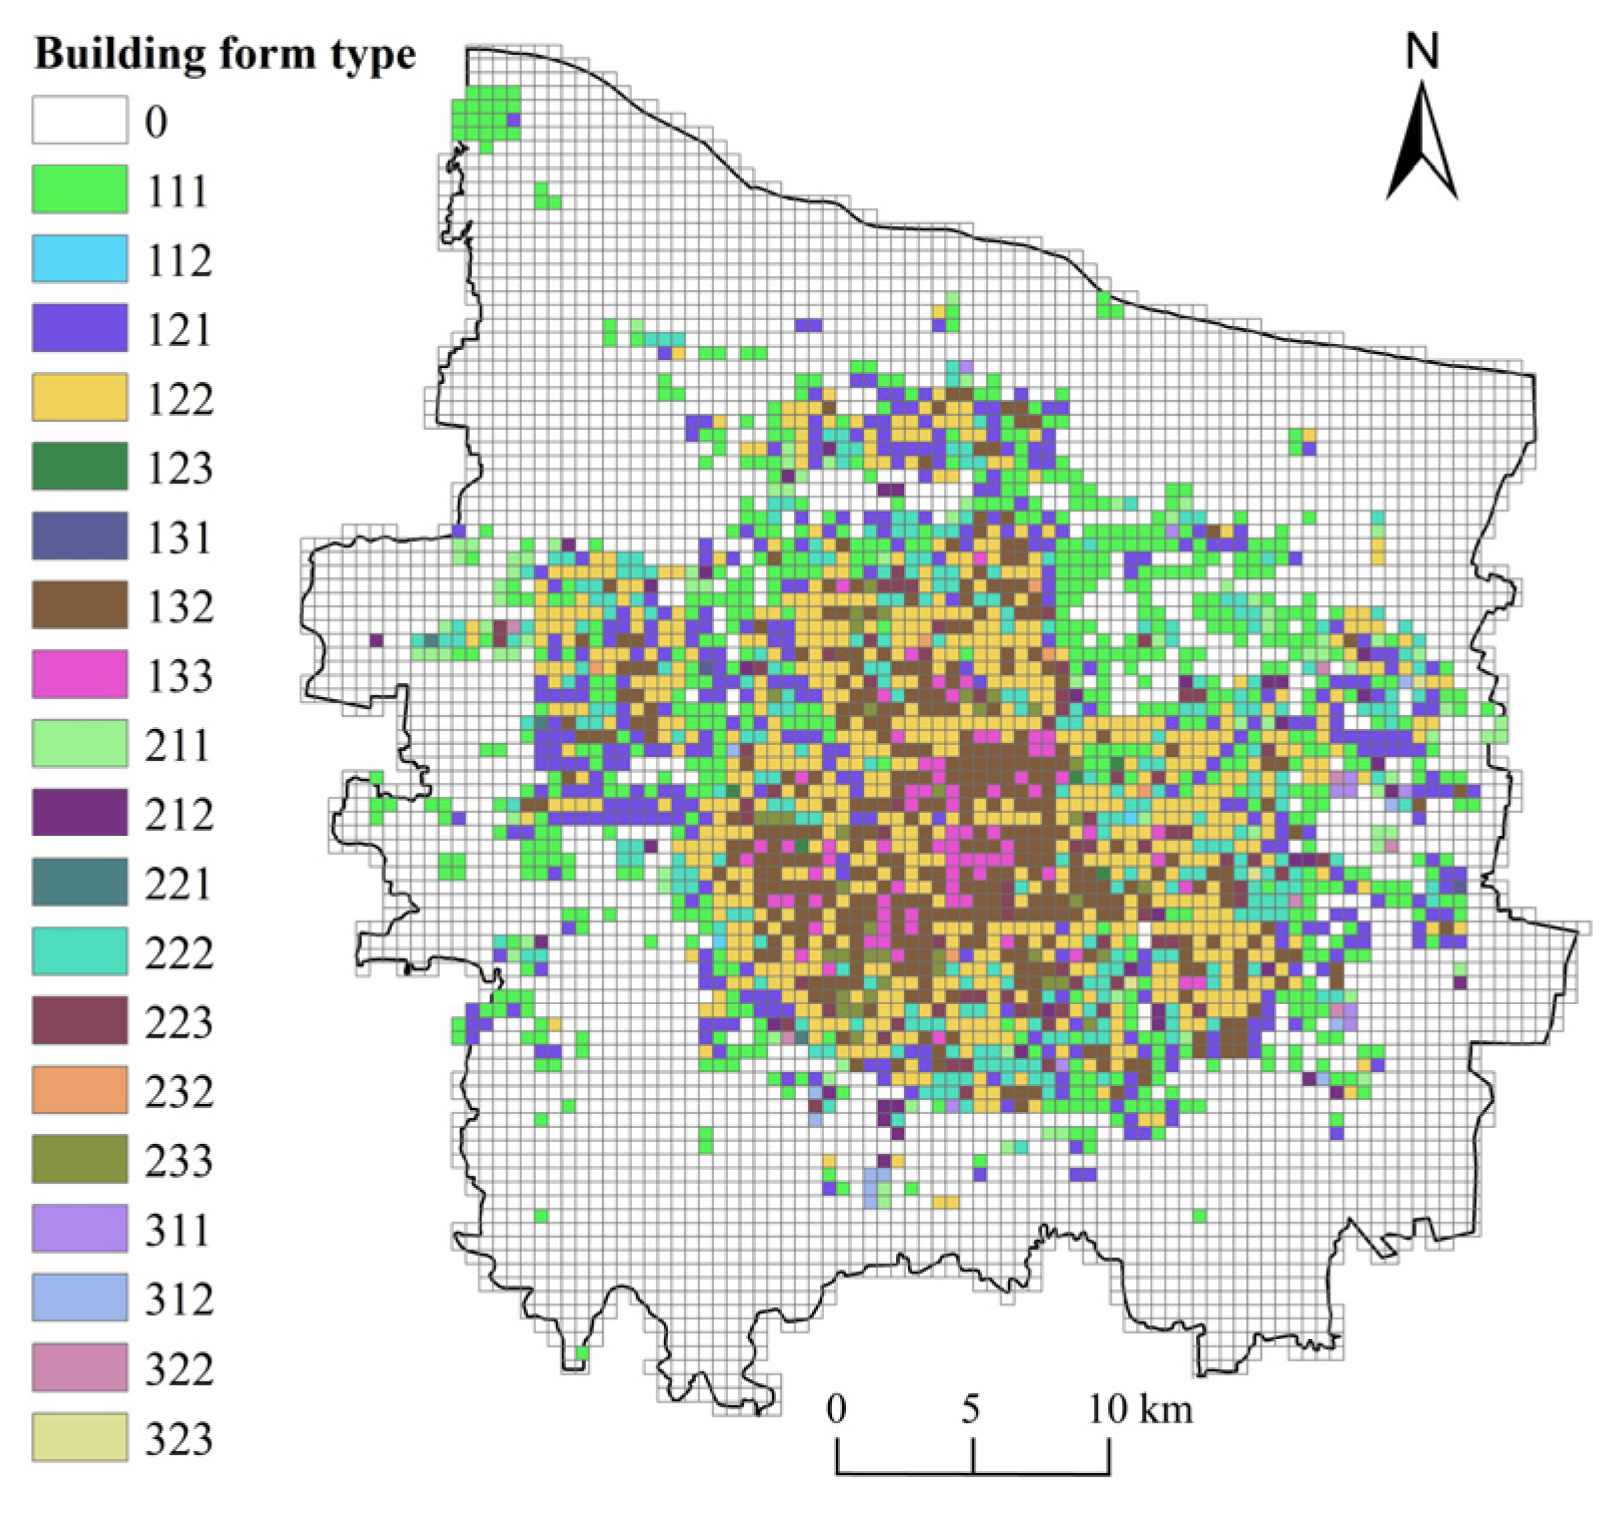
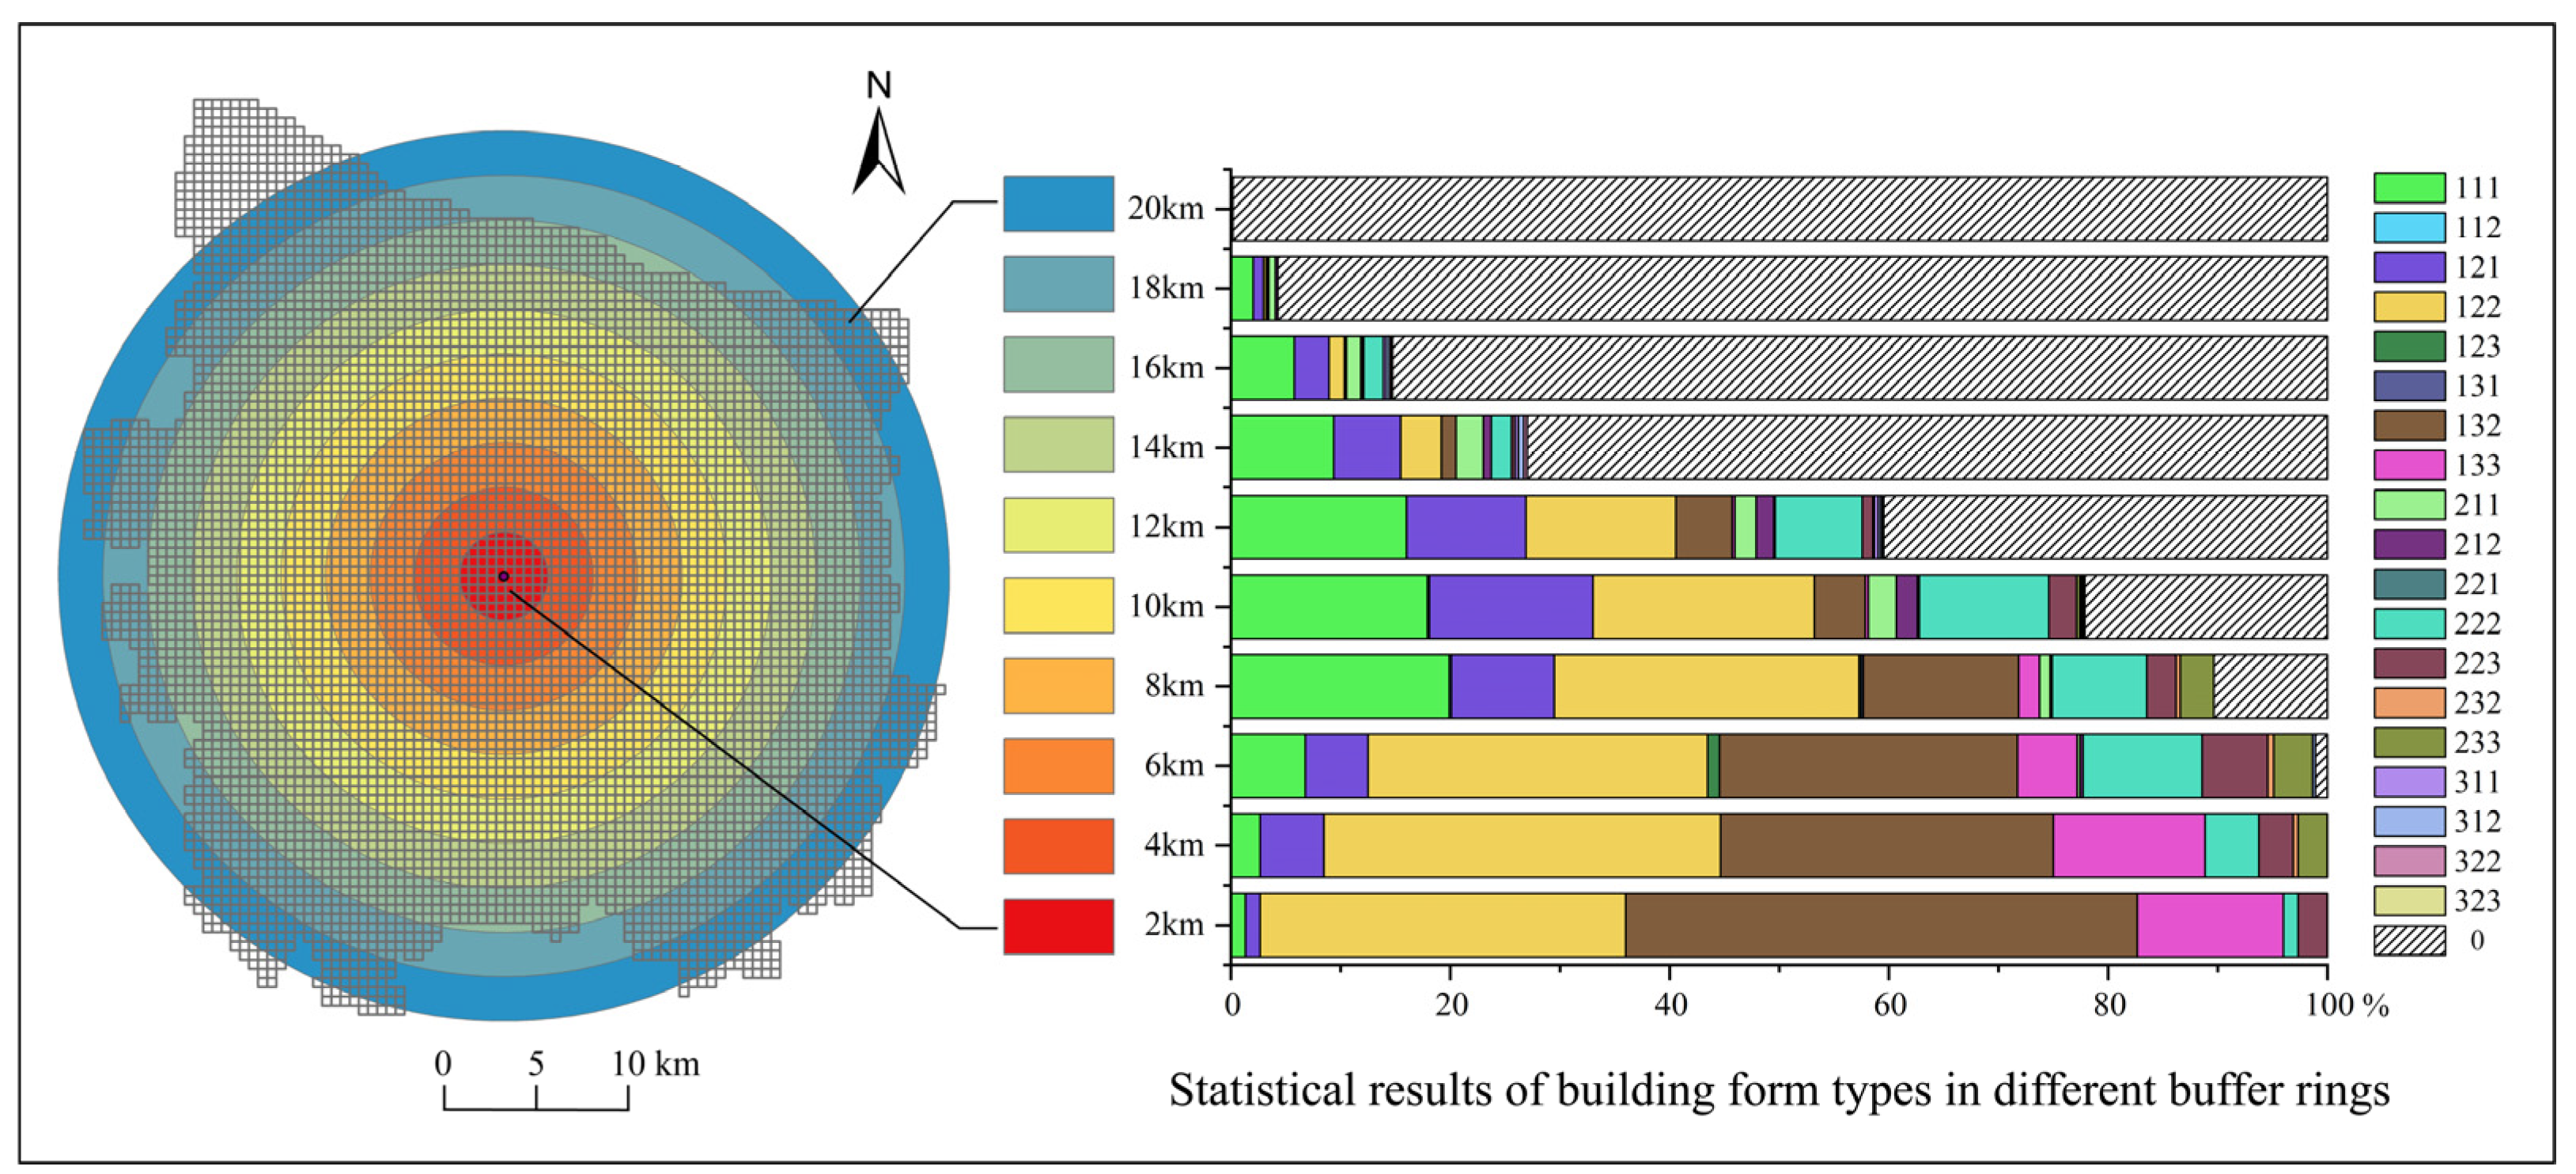
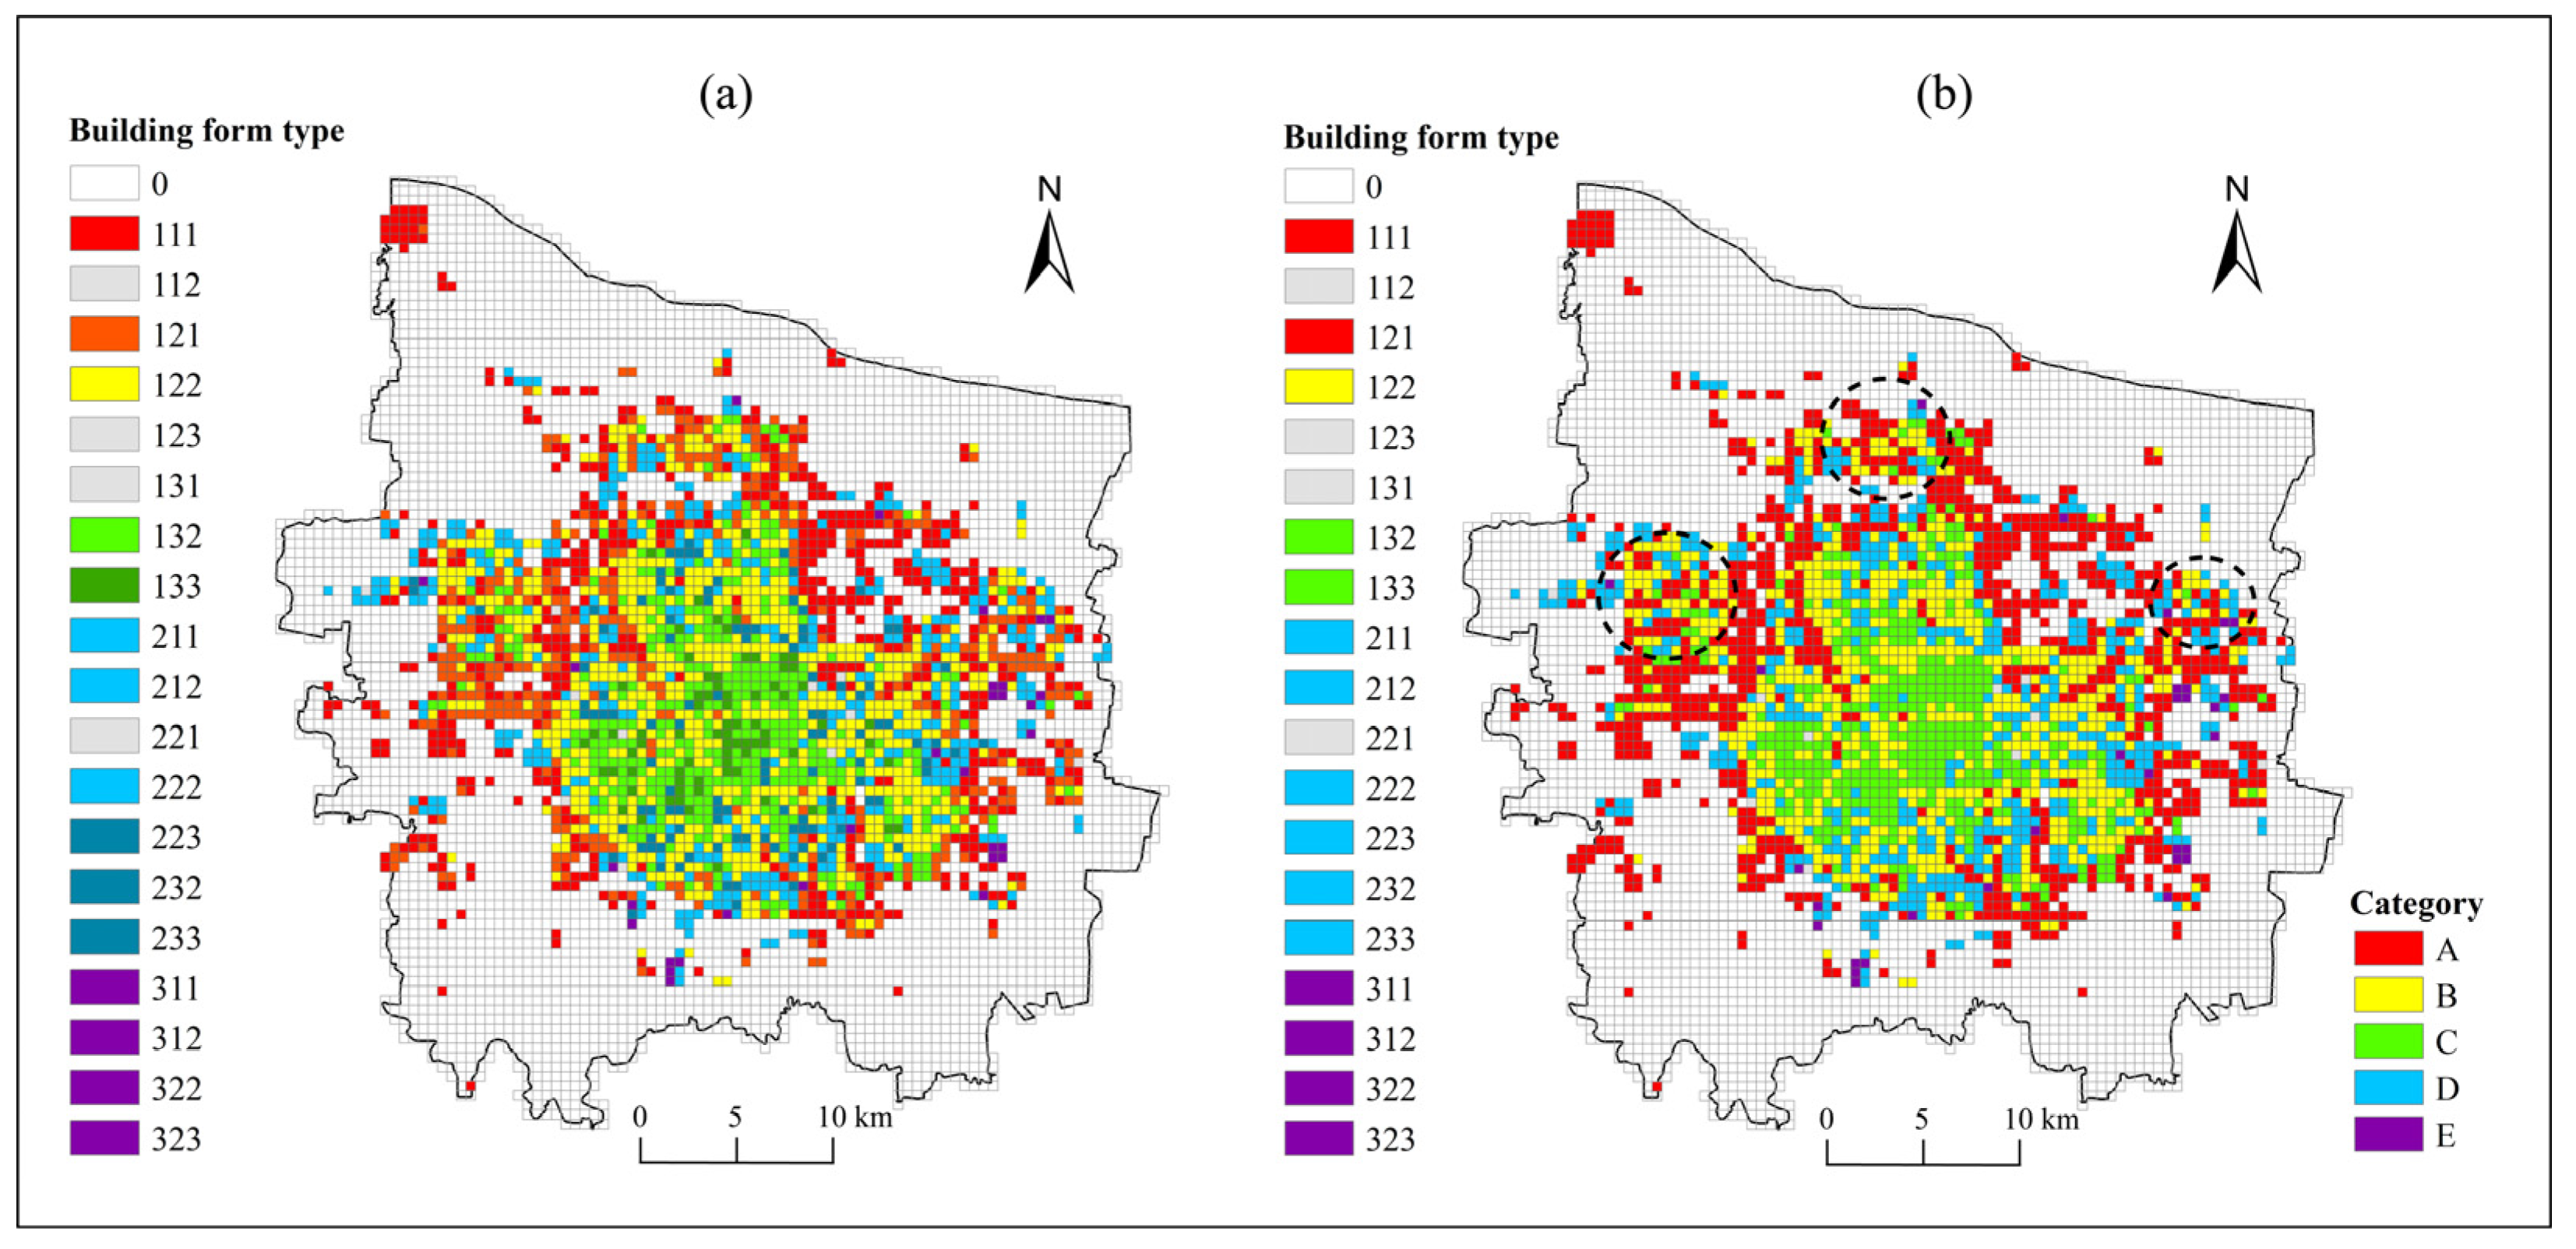
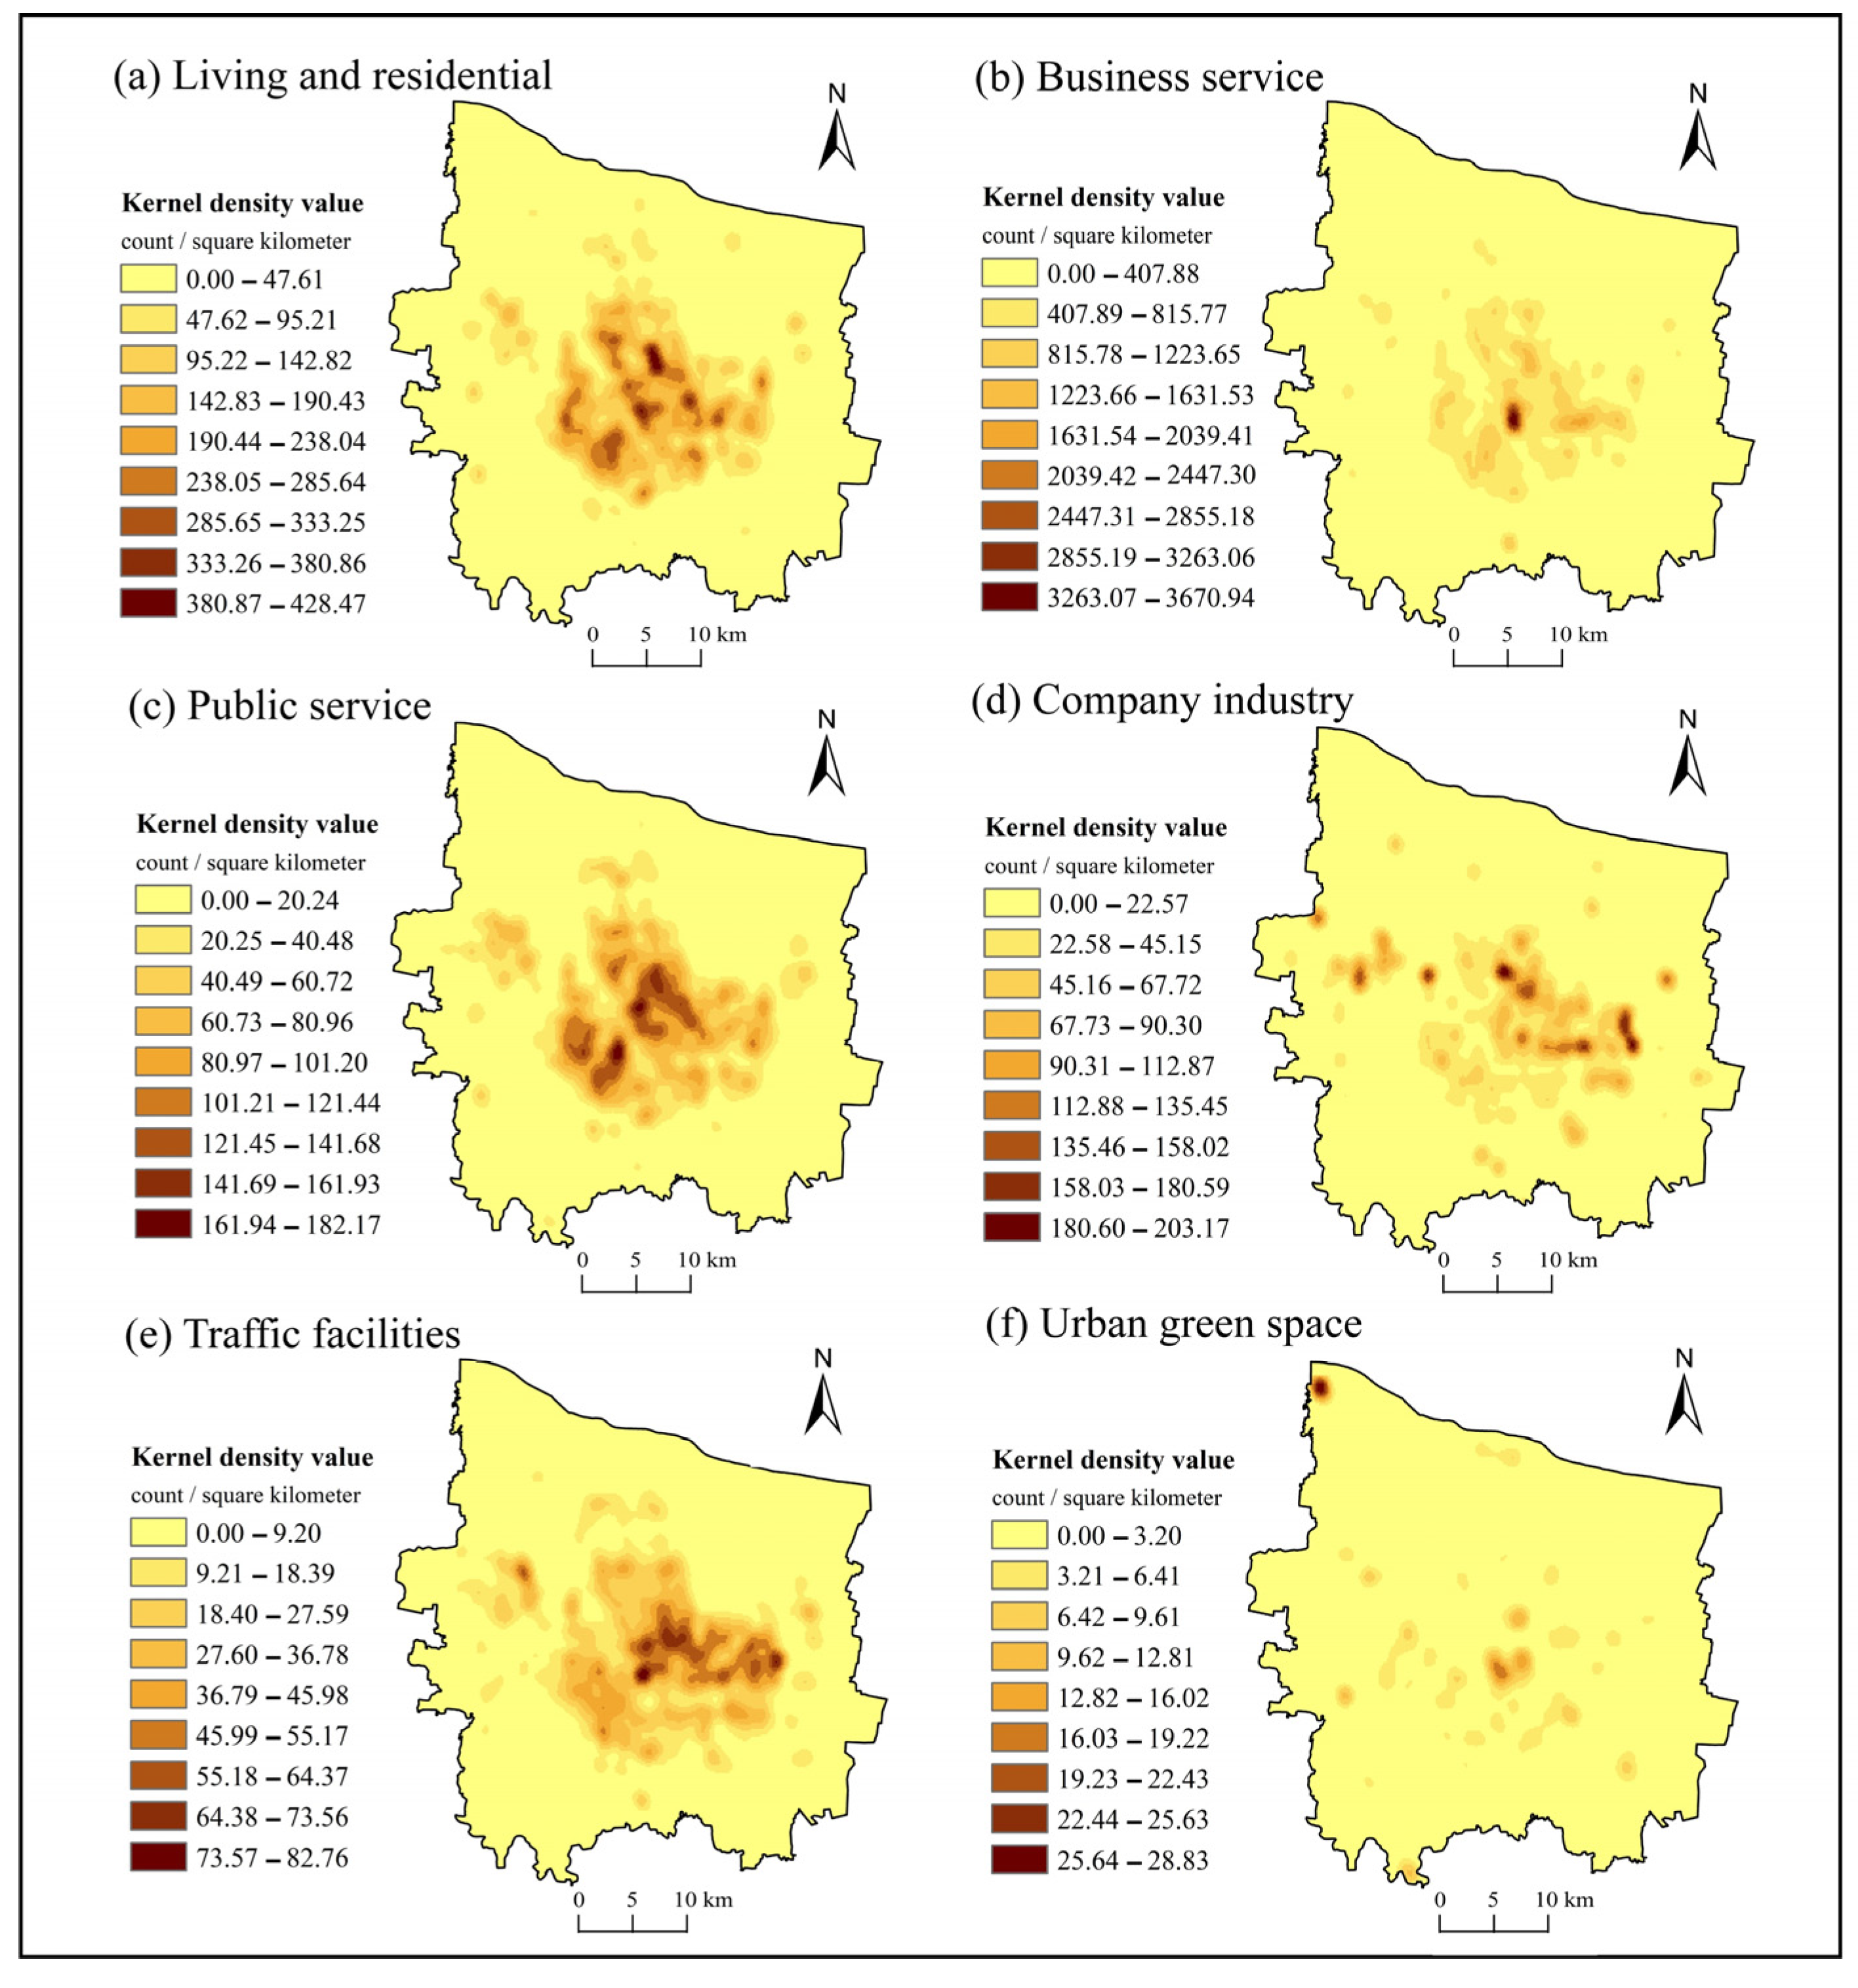

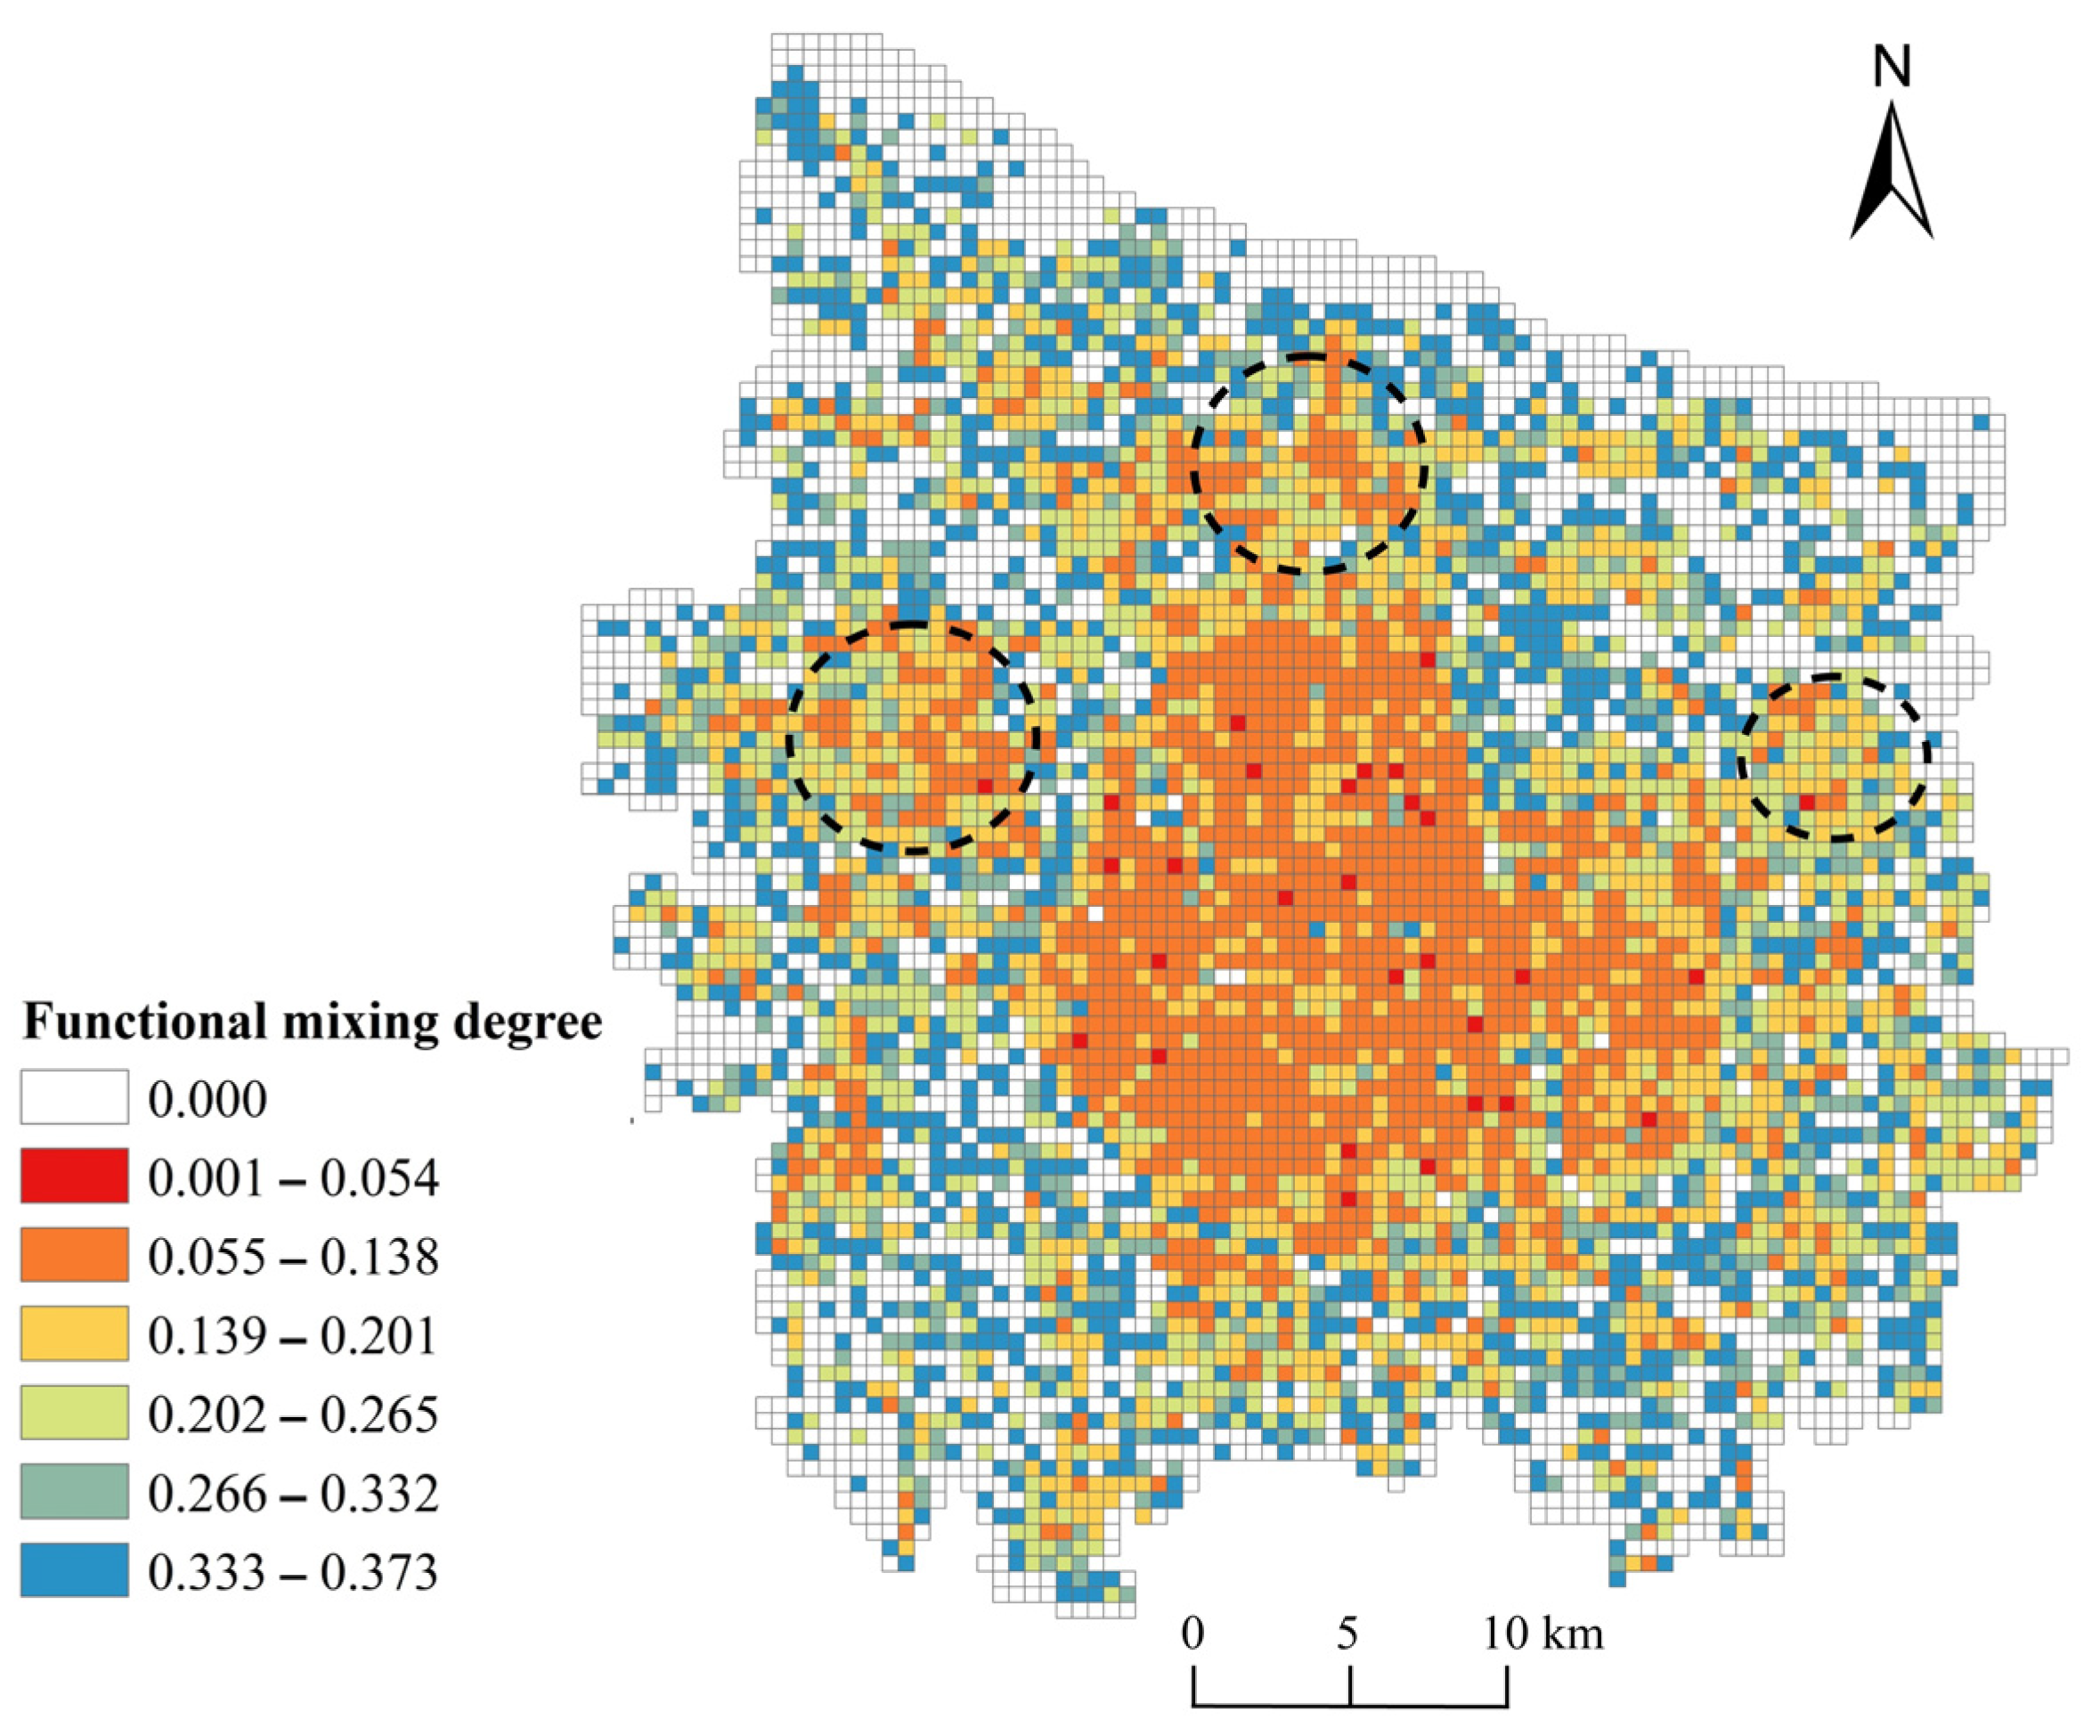
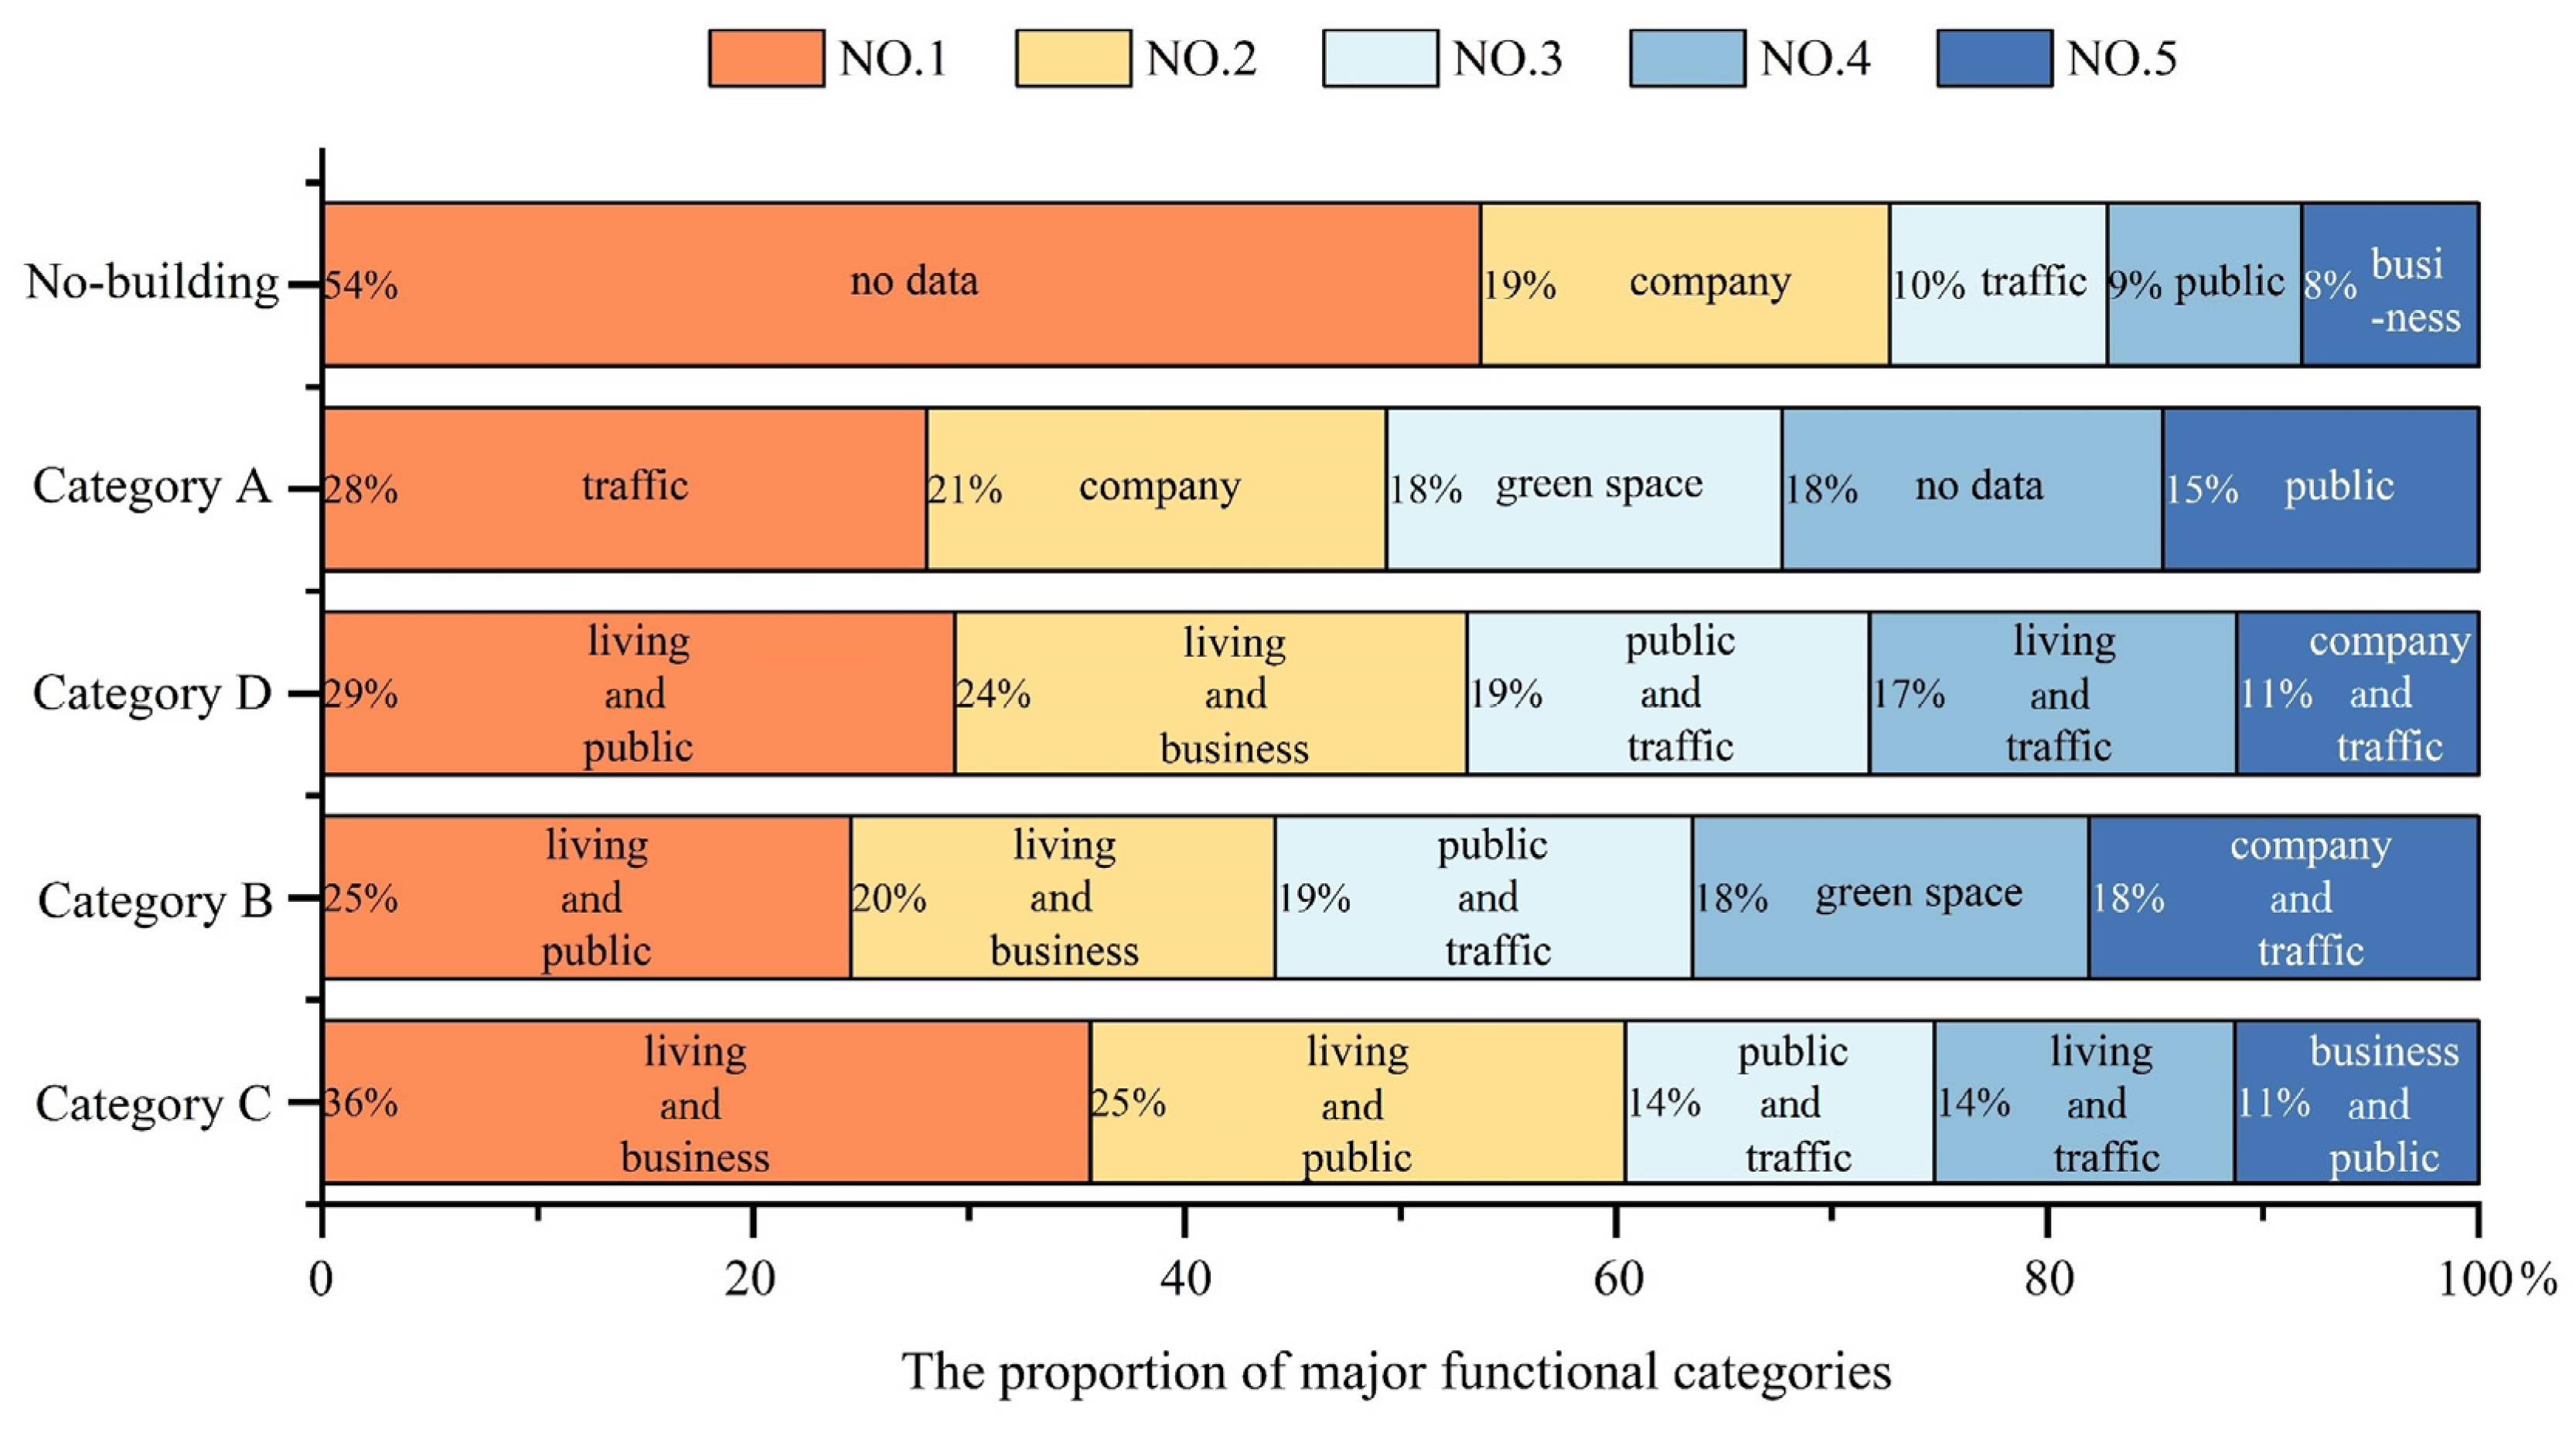
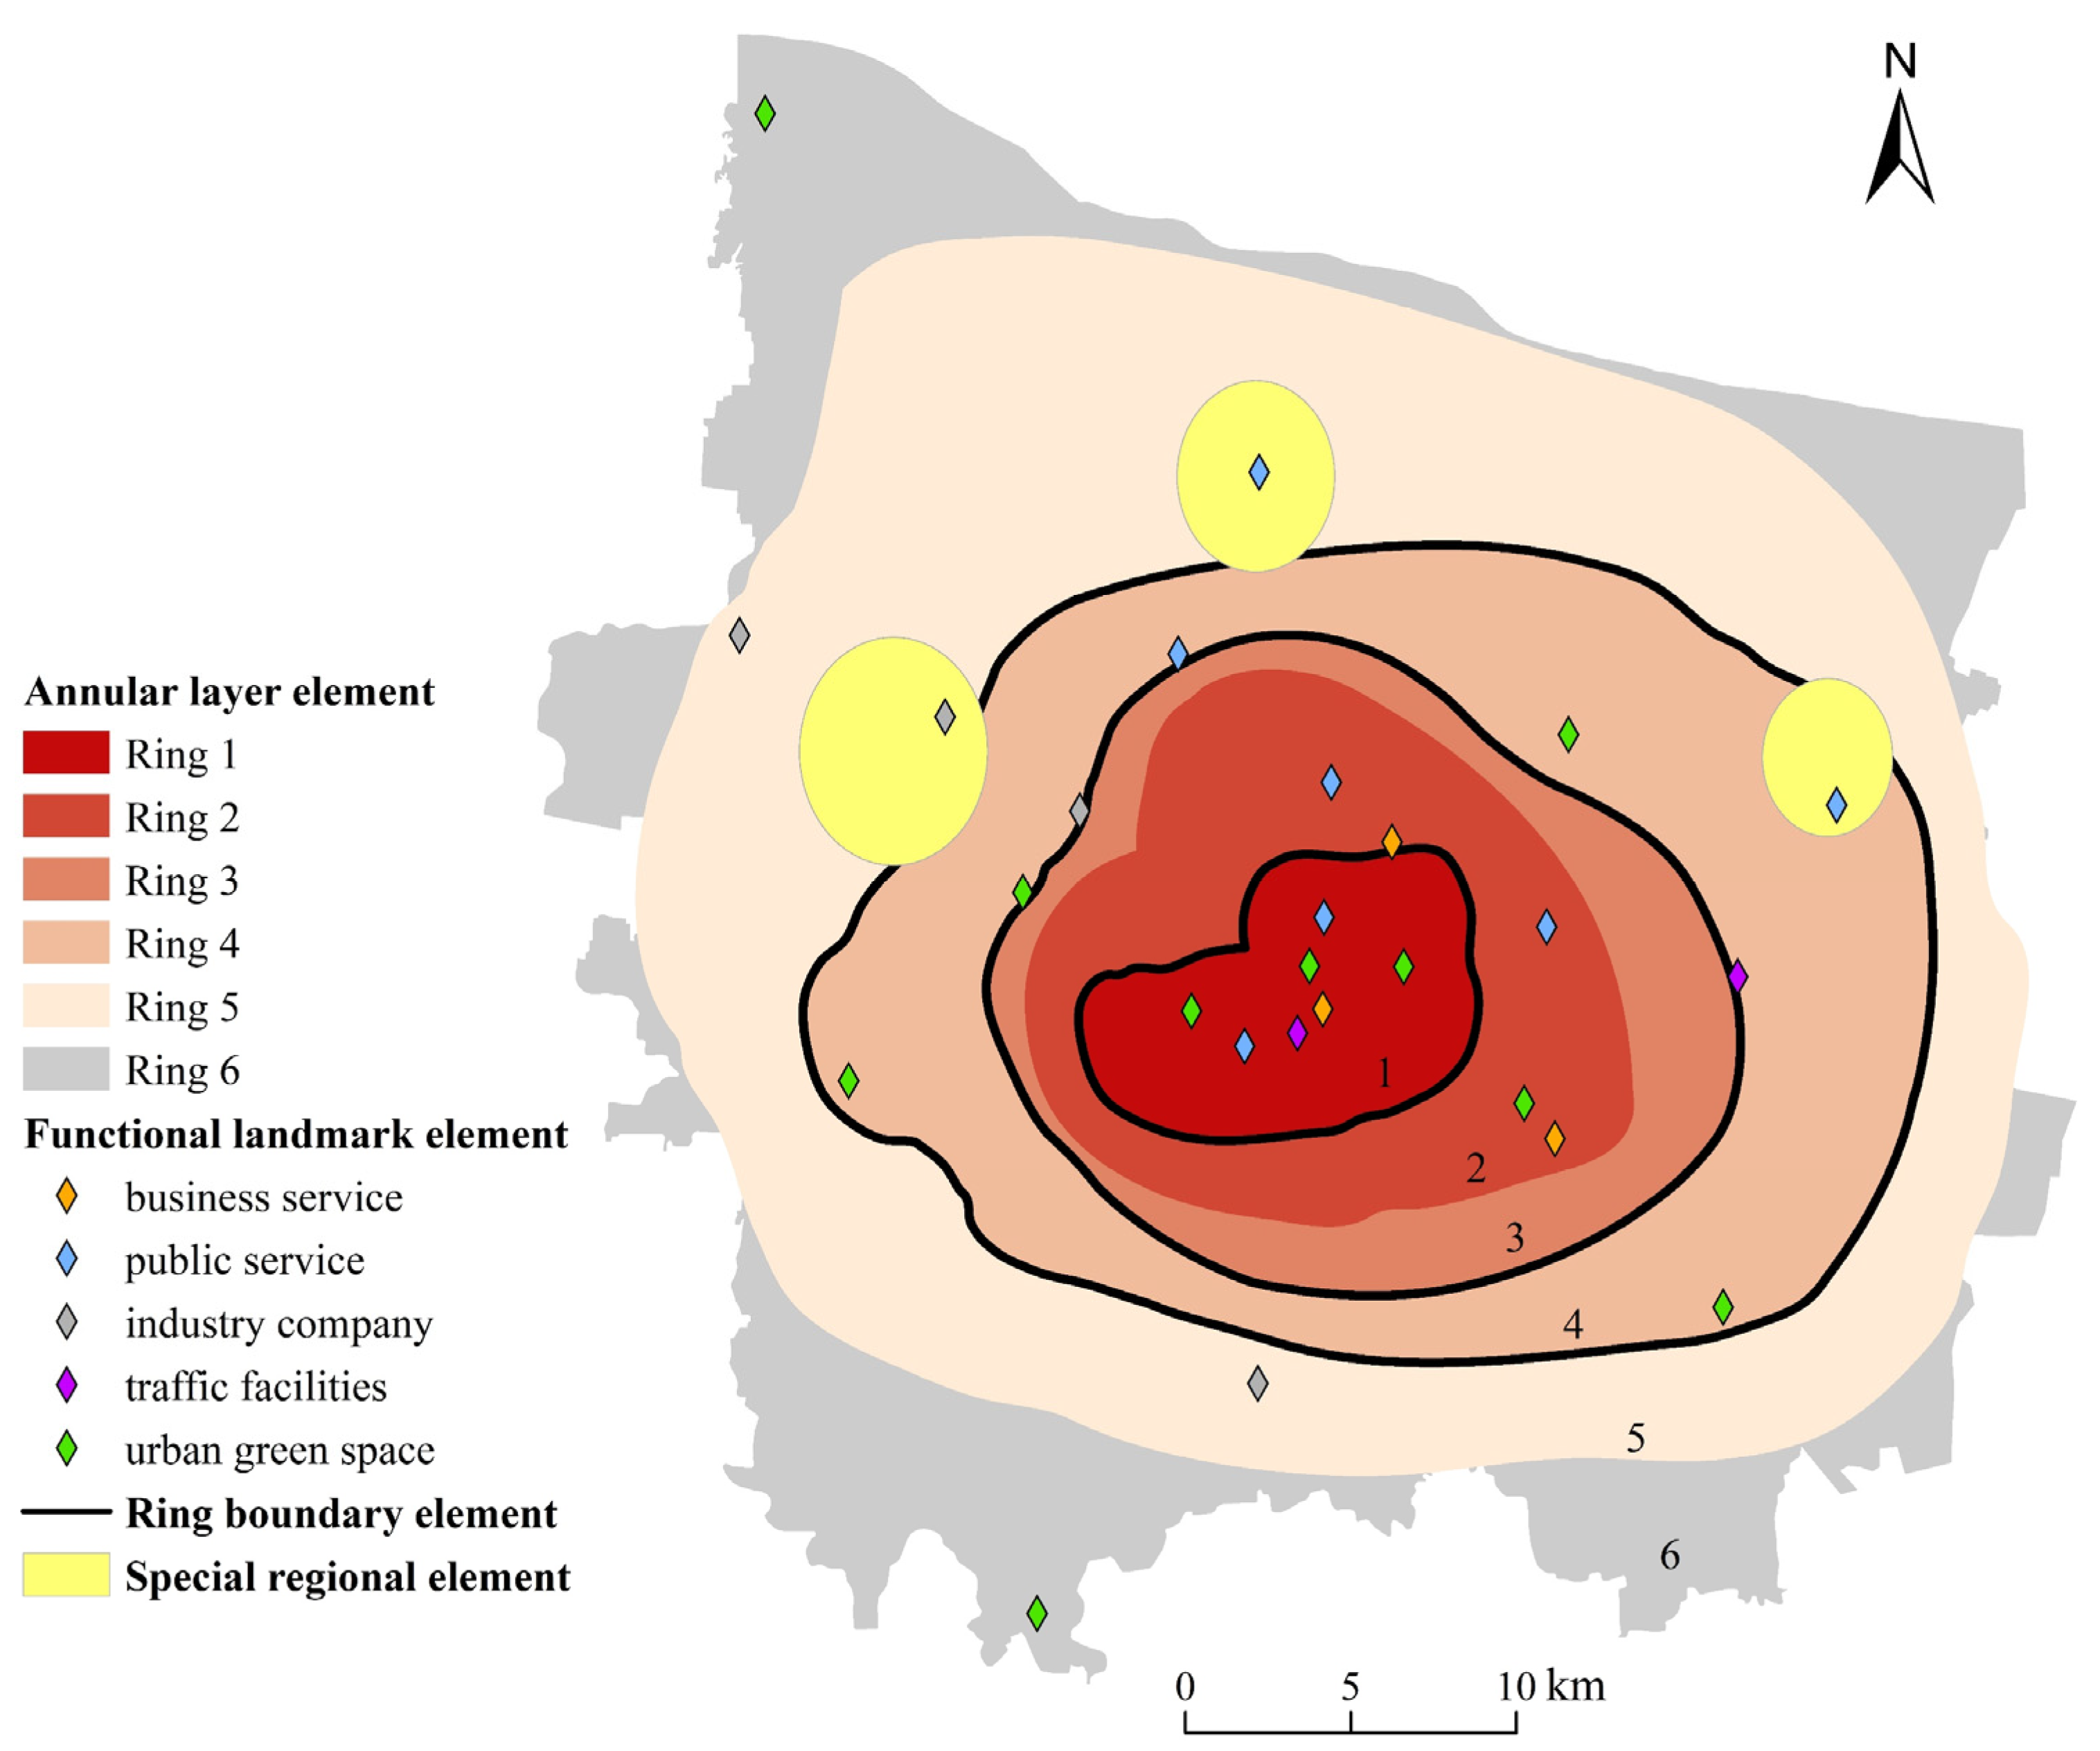
Disclaimer/Publisher’s Note: The statements, opinions and data contained in all publications are solely those of the individual author(s) and contributor(s) and not of MDPI and/or the editor(s). MDPI and/or the editor(s) disclaim responsibility for any injury to people or property resulting from any ideas, methods, instructions or products referred to in the content. |
© 2024 by the authors. Licensee MDPI, Basel, Switzerland. This article is an open access article distributed under the terms and conditions of the Creative Commons Attribution (CC BY) license (https://creativecommons.org/licenses/by/4.0/).