Abstract
The United Nations’ 17 Sustainable Development Goals (SDGs) provide a pivotal framework to guide government policies and mobilize public engagement for sustainability, although further exploration is still needed to analyze the attention given to the SDGs by these stakeholders using multi-source data. To comparatively analyze government and public engagement in the SDGs, based on a case study in China, this study employed a multi-source data and content analysis to assess the perceived importance and performance of the two stakeholders. Then, this study performed an importance–performance analysis (IPA) to assess the SDGs’ priority for further improvement. The results highlight the government’s emphasis on SDG 7, SDG 2, and SDG 9, contrasting with public attention predominantly on SDG 8, SDG 9, and SDG 4. Regarding the performance of the SDGs in China, the greatest achievements have been exhibited for SDG 4 and SDG 1, while SDG 10, SDG 15, and SDG 17 have shown the least progress. Concerning the individual indicators, 12 out of 98 have attained 100% completion, while 19 out of 98 remain below the 50% threshold. According to the IPA results, China should concentrate on SDG 10 and SDG 15 and improve SDGs 6, 7, 14, 16, and 17 as a relatively low priority. The stakeholder analysis indicated that these SDGs are neglected zones by both the public and government. This research innovatively assessed the priorities of SDGs and could strengthen the cooperation between the government and the public to drive the implementation of the Sustainable Development Goals more effectively. This study could contribute to guiding policy directions, inform strategies for public engagement, and enhance the comprehension of sustainable development in China. The framework could serve as a valuable reference for stakeholder engagement in the SDGs in other countries.
1. Introduction
As the world increasingly becomes globalized and interconnected, the United Nations’ Sustainable Development Goals (SDGs) provide a vital framework for guiding and steering global efforts toward a more equitable and sustainable future [1,2]. Adopted by the United Nations in 2015, the 17 goals address a wide array of challenges from poverty and inequality to climate change and peace and justice. In addressing the SDGs, a multi-stakeholder analysis is a widely used approach to analyze the importance of different stakeholders, including governments, international organizations, civil society, and the public [1]. Among these, governments and the public emerge as essential due to their direct influence on policy making and implementation, respectively, to achieve the SDGs [1,3]. As a crucial driver in policy making and implementation, the government plays an instrumental role in aligning resources and efforts toward these goals [4]. Simultaneously, the public wields significant influence through democratic engagement, activism, and consumer choices, effectively shaping the trajectory of sustainable development [5]. Assessing the prioritization of SDGs by integrating the subjective perceptions of the government and the public [5,6,7] could contribute to detecting the objective progress made toward these goals and help generate nuanced insights that guide effective and targeted interventions to reach the SDGs.
Since the SDGs’ inception in 2015, certain policies have evolved, showing varied development focuses based on different economic and political backgrounds. Numerous international organizations and research institutions now provide guidelines to support the SDGs’ implementation [6,8]. Despite the global progress, the unique societal and political context of China, where the government leads matters, especially regarding environmental policies, calls for an examination of the SDGs’ implementation [6,7]. In China, the SDGs, as with environmental policies, are primarily government-led [8]. A performance assessment is crucial to encourage the government to engage in environmental governance [9,10]. The government and the public are important stakeholders in achieving the SDGs [11,12], and there is tension between the roles of government and the public based on their needs. However, a performance assessment may incentivize local governments to prioritize political achievements, potentially neglecting some of the public’s most pressing concerns and other governance responsibilities, resulting in environmental challenges [13]. The untapped potential of the public remains a concern, emphasizing the immediate efforts needed to enhance public awareness, attention, and oversight of the SDGs to facilitate collaborative governance and achieve these goals with greater efficiency and better resource allocation. However, gaps often exist between governmental actions and public interest, presenting potential challenges to the effective achievement of the SDGs [14,15]. An approach to effectively coordinate the two stakeholders and achieve the collaborative governance of the SDGs more efficiently is urgently needed.
A comparative analysis of the attention given to SDGs by the government and the public would be insightful, revealing alignment or divergence, which would assist in refining policy making and public engagement strategies [5,16]. The effective implementation of the SDGs could be facilitated if governmental actions aligned with public interests [1,5,17,18]. For instance, Tiefenbeck demonstrated that households significantly reduced their energy consumption when energy conservation was treated as a shared societal goal [19]. Conversely, the government significantly influences the promotion and realization of SDGs through policy making and resource mobilization [4,20,21]. Therefore, identifying areas of potential disconnection or synergy by comparing governmental and public attention can effectively direct efforts and resources toward mutual sustainability objectives [22]. Although previous research has examined the roles of governmental policies and public engagement in achieving the SDGs [16], the specific degree of attention allocated to these goals by both sectors still needs to be explored. This research gap is particularly noteworthy considering the central role of the SDGs in guiding the global development agenda. To the best of our knowledge, the previous studies have yet to provide a comparative analysis of the attention given to the SDGs by the government and the public, indicating a significant gap in the existing research that our study aims to address.
The digital revolution and the widespread use of social media platforms have profoundly transformed how the public discourse is formed and disseminated [23,24]. In the context of the SDGs, these platforms serve as digital spaces where diverse stakeholders express their perceptions, opinions, and levels of engagement with these global goals [25]. The vast amount of user-generated data offer an invaluable resource, providing unfiltered insights into public attention and opinions toward the SDGs [26,27]. Multi-source data refer to the combination of two or more distinct data sources, aimed at integrating the advantages of different data sources. Previous research has recognized the importance of utilizing multi-source data, especially big data, in monitoring and understanding various societal trends and issues [24,28,29,30]. In the context of the SDGs, multi-source data can provide valuable insights into the awareness and priorities of both public and government stakeholders, thereby enabling policymakers to pinpoint areas in need of heightened attention and public engagement [4]. However, despite the potential benefits of utilizing multi-source data in SDG-related research, the full potential still needs to be explored due to certain technical and methodological challenges. Overcoming these challenges would enable researchers to leverage multi-source data to better understand the public’s engagement with the SDGs, thereby contributing to a more effective and responsive policy-making process.
This research seeks to bridge the identified gaps by establishing a multi-source-data-based framework to assess the priority of improving the SDGs and analyze the attention devoted to the SDGs by the government and the public. Through this comparative analysis involving a case study of China, the research seeks to answer the following key questions:
- (1)
- What are the consistencies and differences in the level of attention given to the SDGs by the two stakeholders in China?
- (2)
- Who are the main leading stakeholders in the various SDGs in China?
- (3)
- Which SDGs require increased attention as high-priority areas for improvement in China?
This research aims to provide a nuanced understanding of the online discourse around the SDGs and shed light on the differing perspectives between the public and government. The findings of this study have the potential to guide policy directions, inform strategies for public engagement, and enhance the comprehension of sustainable development in the digital era.
2. Material and Methods
2.1. Research Framework
For this paper, we proposed a research framework to utilize muti-source data and a content analysis to compare the attention given to the SDGs by the government and the public (Figure 1). This study leveraged multi-source data, including Chinese Voluntary National Reviews, SDG reports, and big data from Sina, China News, and Toutiao. We constructed an SDG keywords list, extracting and supplementing seed words from official SDG reports and China National Knowledge Infrastructure (CNKI) database searches and using the word2Vec model to expand the seed words. After data collection and preprocessing from muti-source data based on the SDG keywords list, we analyzed the relative frequency of references to the 17 SDGs and popular SDG topics made by the public and the government, discerning consistencies or disparities in the attention directed towards these goals. Then, following previous studies [31,32], we took the relative frequency of references to the 17 SDGs as the perceived importance and the SDG realization status in the annual report on the SDGs published by the United Nations as the performance score. On this basis, in this study, we used the IPA analysis to understand the attention towards and prioritization of the SDGs comprehensively.
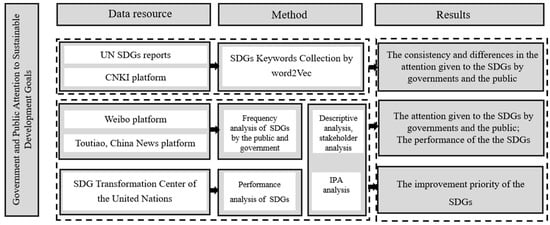
Figure 1.
Research framework.
2.2. Data Collection, Preprocessing, and Analysis
This study first involved a comprehensive SDG keyword collection process, beginning by extracting seed words from the official report, expanding the list through database searches and synonyms, and refining the collection using the word2Vec model for semantic alignment, followed by a manual review for precision. The initial stage of our research involved creating a dedicated SDG keywords collection (Table 1) based on the official SDGs report. The additional keywords were identified and incorporated through a thorough search on CNKI in 2023—the preeminent Chinese research database. According to the official SDGs report and data from CNKI, word frequency calculations were incorporated to extract the top 500 most commonly used words associated with SDGs, resulting in a foundational SDG seed words list [33,34,35]. After constructing the seed words list, five experts in this field assigned these words to the corresponding SDG categories. The coding was done in Excel based on the consensus of two SDG experts each time. In cases of disagreement, a third expert was consulted for adjudication. Furthermore, we expanded the SDG keywords collection by referencing the Chinese Synonym Thesaurus from the Harbin Institute of Technology. The word2Vec model is beneficial for natural language processing tasks, as it can capture semantic relationships and word similarities in a vector space, enabling more accurate language understanding and word embedding processes [36,37]. Additionally, it has the potential to enhance various applications, such as in information retrieval and text classification, by providing context-aware word representations [38]. Following data preprocessing, we employed the word2Vec model to assess the similarity and filter keywords that aligned with the existing seed words, whereby we identified 1384 seed words within 17 SDG categories. All extension steps involved a manual review to ensure the inclusion of only the most pertinent keywords in the SDG keywords collection.

Table 1.
SDG keywords collection.
For the data collection, based on the SDGs keywords list, we utilized web crawling to gather data from Sina Weibo, representing the public’s attention and focus on the SDGs, and from China News and Toutiao, representing the government’s attention and focus on the SDGs. Sina Weibo, one of China’s largest social media networks, allows users to share and engage with content, including short texts, images, videos, and links [39]. It serves as a platform for topic-based discussions, making it a vital source for assessing public discourse and opinion [40]. In parallel, we gathered data from China News and Toutiao to represent the government’s attention and focus on the SDGs. China News is a prominent national-level news organization in China, providing timely, authoritative, and comprehensive news coverage across various fields such as domestic and international politics, economics, culture, and society [41]. Toutiao is a leading personalized news recommendation platform in China that covers various topics, including current affairs, technological innovations, and finance, both domestically and internationally [42,43]. The platform offers interactive features for users to participate in discussions and share their viewpoints, such as commenting, liking, and sharing [44]. However, Toutiao has special sections such as “society” and “new era” for state media coverage of government statements. At the same time, its moderation and filtering systems can manage user-generated content to ensure alignment with government priorities. All of the platforms, including Weibo, Toutiao, and China News, employ sophisticated search engines and recommendation algorithms that are capable of identifying, matching, and prioritizing content based on SDG-related keywords and synonyms.
Along with the annual SDG report published by the United Nations in June 2023 [45], our data collection period spanned from 1 January 2022 to 19 June 2023. This period reflects China’s annual efforts toward sustainable development and aligns with the previous SDG evaluation timeline. The data collection period coincided with phases of stable macroeconomic growth, enhanced social wellbeing, intensified ecological initiatives aimed at achieving a “beautiful China”, and active participation in global development initiatives. The collected data were then filtered using the SDG keywords collection as the keywords, allowing us to extract relevant texts for each specific SDG. For China News and Toutiao, which primarily represent the government’s focus on and initiatives regarding the SDGs, we collected information on publication times and posted content. The data from these platforms help track the alignment of government communications with the Sustainable Development Goals. When collecting Weibo user information, we collected each individual’s user name, region, number of followers, number of Weibo posts, certification conditions, post content, number of collections, number of comments, number of likes, post times, and other information. To ensure the quality and consistency of the data, a thorough cleaning process was undertaken, including removing irrelevant, meaningless texts, as well as texts with confusing formats or missing content. To accurately reflect the public’s attention using the Weibo data, we filtered out messages posted by official or government accounts on Sina Weibo. Finally, we obtained over 160,000 data points from Sina Weibo and over 60,000 data points from China News and Toutiao.
Due to the original dataset being intermixed with a substantial amount of text irrelevant to the event, even after removing invalid results during data collection and preprocessing, there remained a significant presence of duplicate and irrelevant texts. XGBoost models based on decision trees, which can process various types of data and feature selection capabilities, as well as being less sensitive to ranges of variable values, are suitable for the classification problems encountered in this study [46,47,48]. Consequently, following precedents in previous studies, the XGBoost model was chosen as the classifier to filter out irrelevant microblogs, yielding content that was highly pertinent to each event [49]. We manually set up the training and sample sets to construct a machine learning model for efficient classification. The training and validation sets were allocated at a ratio of 8:2, with 500 microblogs randomly selected from each SDG theme in the preprocessed dataset, totaling 8500 topics for manual annotation. According to our calculations, this classification model achieved an accuracy rate of 90.36% and an F1 score of 88.74% for the microblog dataset. These results underscore the model’s effective classification capabilities, significantly enhancing the filtration of texts for relevance to an event, thereby validating their effectiveness in capturing relevant content.
2.3. Evaluation of the Prioritization of SDGs Based on the Importance–Performance Analysis (IPA) Method
The IPA method allows for a dual-dimensional assessment framework that evaluates both the importance and performance at the same time to show the urgency and priority of the attributes directly. The IPA method, initially developed as a decision-making tool in the marketing sector, facilitates the evaluation of attributes and informs the creation of strategic management measures to enhance the user experience [50]. This technique has extensive applications across a range of sectors, proving its versatility and efficacy, including in tourism [51,52], transportation [53], and e-commerce [54]. The IPA method provides a straightforward way to analyze and display the prioritization of and urgency towards implementing the SDGs. The IPA framework enables the classification of the SDGs into four distinct quadrants (Figure 2) based on their perceived importance and performance levels. The “keep up the good work zone” (Q1) represents attributes or services that are perceived as of high importance and performance levels to stakeholders. These elements are considered strengths for achieving the SDGs in this country and should be maintained at their current high performance levels. In the “maintenance zone” (Q2) quadrant, the stakeholders perceive the attributes as being less important but showing high performance levels. These elements should be consistently maintained to ensure high performance levels to achieve the 2030 Agenda. The “neglected zone” (Q3) includes attributes perceived as less important by stakeholders and yielding low performance levels. Long-term strategies should address these areas to improve the stakeholders’ perceptions and enhance the overall performance to achieve the 2030 Agenda. The “improvement zone” (Q4) consists of attributes or services that are perceived as highly important but delivering low performance. These elements required immediate attention and improvement to achieve the 2030 Agenda. However, using the IPA method to analyze the SDGs and achieve the 2030 Agenda remains an underexplored area.
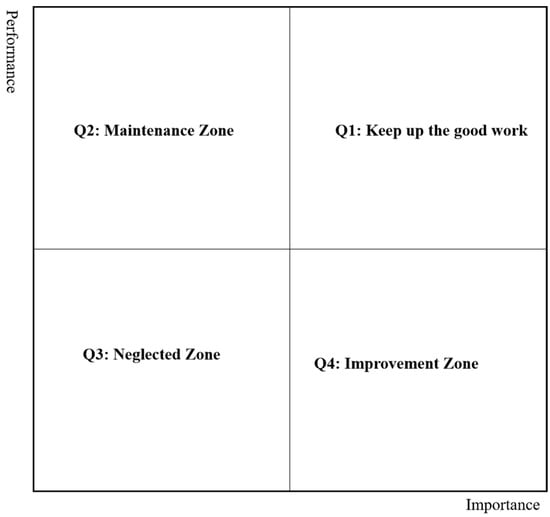
Figure 2.
Quadrants of IPA results.
To avoid reaching a ceiling in our efforts using the IPA, namely, that most attributes often fail in the “keep up the good work” quadrant, since the respondents are prone to give high performance and importance ratings, a data-scale-centered method was proposed in some studies, where average values of importance and performance were used as the crosshair [9]. Meanwhile, the IPA diagram revealed the improvement priorities clearly for decision making. We then classified the IPA results for easy decision making.
2.4. Calculating the Perceived Importance Scores Using a Relative Frequency Analysis
In this study, we employed the SDGs as a coding scheme to gauge the relative frequency of each SDG from the total comments, aiming to explore the attention devoted to these goals by both the public and government [31,32]. We assessed the frequency of SDG comments to identify any consistencies or differences in attention towards these SDGs. Finally, we examined the focus on popular SDG-related topics within both government and public discussions, entailing an assessment of the relative frequency rates of words associated with the SDGs to identify any consistencies or differences in attention towards these subjects. The relative frequency is calculated as follows:
where i represents the different SDGs; is the absolute importance of the different SDGs; represent the number of times an SDG is mentioned in the public and government comments, respectively; and represent the total number of public and government comments, respectively. The theoretical value of ranges from 0% to 100%; the closer to 100%, the more important the attribute, while the closer to 0%, the less important the attribute.
2.5. Calculating the Performance Scores of Each SDG
In this study, we calculated the performance scores of each SDG in China based on the SDG Report 2023 by The SDG Transformation Center for the United Nations [55]. Initiated in 2015 as part of the United Nations’ 2030 Agenda for Sustainable Development, the 17 SDGs are complemented by 169 specific targets, aimed at guiding global efforts towards sustainable development. Due to the extensive system of indicators, many scholars have found it particularly challenging to collect comprehensive data to monitor SDG progress [56,57]. For instance, as of 2023, only 65 indicators were accessible for China in the United Nations SDG database (https://unstats.un.org/sdgs/dataportal/database, accessed on 6 June 2024). Therefore, by comparing the availability, recency, and previous studies of the data, we selected the Sustainable Development Report 2023 by The SDG Transformation Center, which is an initiative of the UN Sustainable Development Solutions Network (SDSN) for the United Nations (https://sdgtransformationcenter.org/, accessed on 6 June 2024). The Sustainable Development Report 2023 provides the most comprehensive assessment of the SDG performances of all 193 UN Member Nations. The methodology of the SDSN Index was audited by the EU’s Joint Research Commission in July 2019 and has undergone peer review by Nature Geoscience and Cambridge University Press [58]. This annual report and regional editions have become world-leading references for monitoring progress on the SDGs. The Sustainable Development Report is accessed online over 300,000 times each year by government officials, researchers, investors, policymakers, and consulting firms [55]. For the 2023 SDG Index Edition, two-thirds of the data were sourced from official statistics, typically provided by UN-hosted agencies, while the remaining one-third came from non-traditional sources such as research centers, universities, and NGOs. The SDG Report 2023 by the SDG Transformation Center for the United Nations includes the 98 indicators of the 17 SDGs and their corresponding values.
Following the instructions proposed by the SDG Transformation Center, the procedure for calculating the SDG Index comprises three steps [58]: (i) establish performance thresholds and censor extreme values from the distribution of each indicator; (ii) rescale the data to ensure comparability across indicators (normalization); (iii) aggregate the indicators within and across SDGs. Following the methodology proposed by the SDG Transformation Center, the lower bound is specifically defined at the 2.5th percentile of the distribution for each indicator for all of the countries. The upper bounds for each indicator are determined by the following decision tree:
- For SDGs with specific targets, such as zero poverty, universal education, and full gender equality, the use of absolute quantified thresholds is prescribed.
- In the absence of explicit targets, the principle of “leaving no one behind” is applied, setting universal access or zero deprivation as the upper limits.
- For goals with a future achievement date, such as zero carbon emissions from greenhouse gases by no later than 2050 or limiting global warming to 1.5 °C, relevant scientific targets are used to establish the 100% upper limits.
- For all other indicators, the average of the top five performing indicators is used.
As indicated in the SDG Report 2023 by the SDG Transformation Center for the United Nations, several rounds of expert consultations on the early drafts of the SDG Index clearly indicated that there is almost no consensus among different academic communities regarding the weighting of some SDGs over others. Therefore, as a normative assumption, the SDG Report assigns a fixed and equal weight to each SDG, reflecting policymakers’ commitment to treat all SDGs equally and as a cohesive and indivisible set of goals. This means that countries need to focus on all goals to improve their SDG score, although special attention should be paid to those goals that are farthest from achievement [55], being expected to show the quickest incremental progress. To calculate the SDG scores, the SDG Report first estimated the score for each goal using the arithmetic mean of the goal’s indicators. These goal scores were then averaged across all 17 SDGs to obtain the final index score. Various sensitivity analyses were conducted for the SDG Report, the results of which are available online, including comparisons between arithmetic and geometric means and Monte Carlo simulations at the index and goal levels. The score for each SDG indicator is calculated as follows:
3. Results
3.1. Analysis of the Government and Public Attention on SDGs
3.1.1. Frequency Analysis of the Government and Public Attention on SDGs
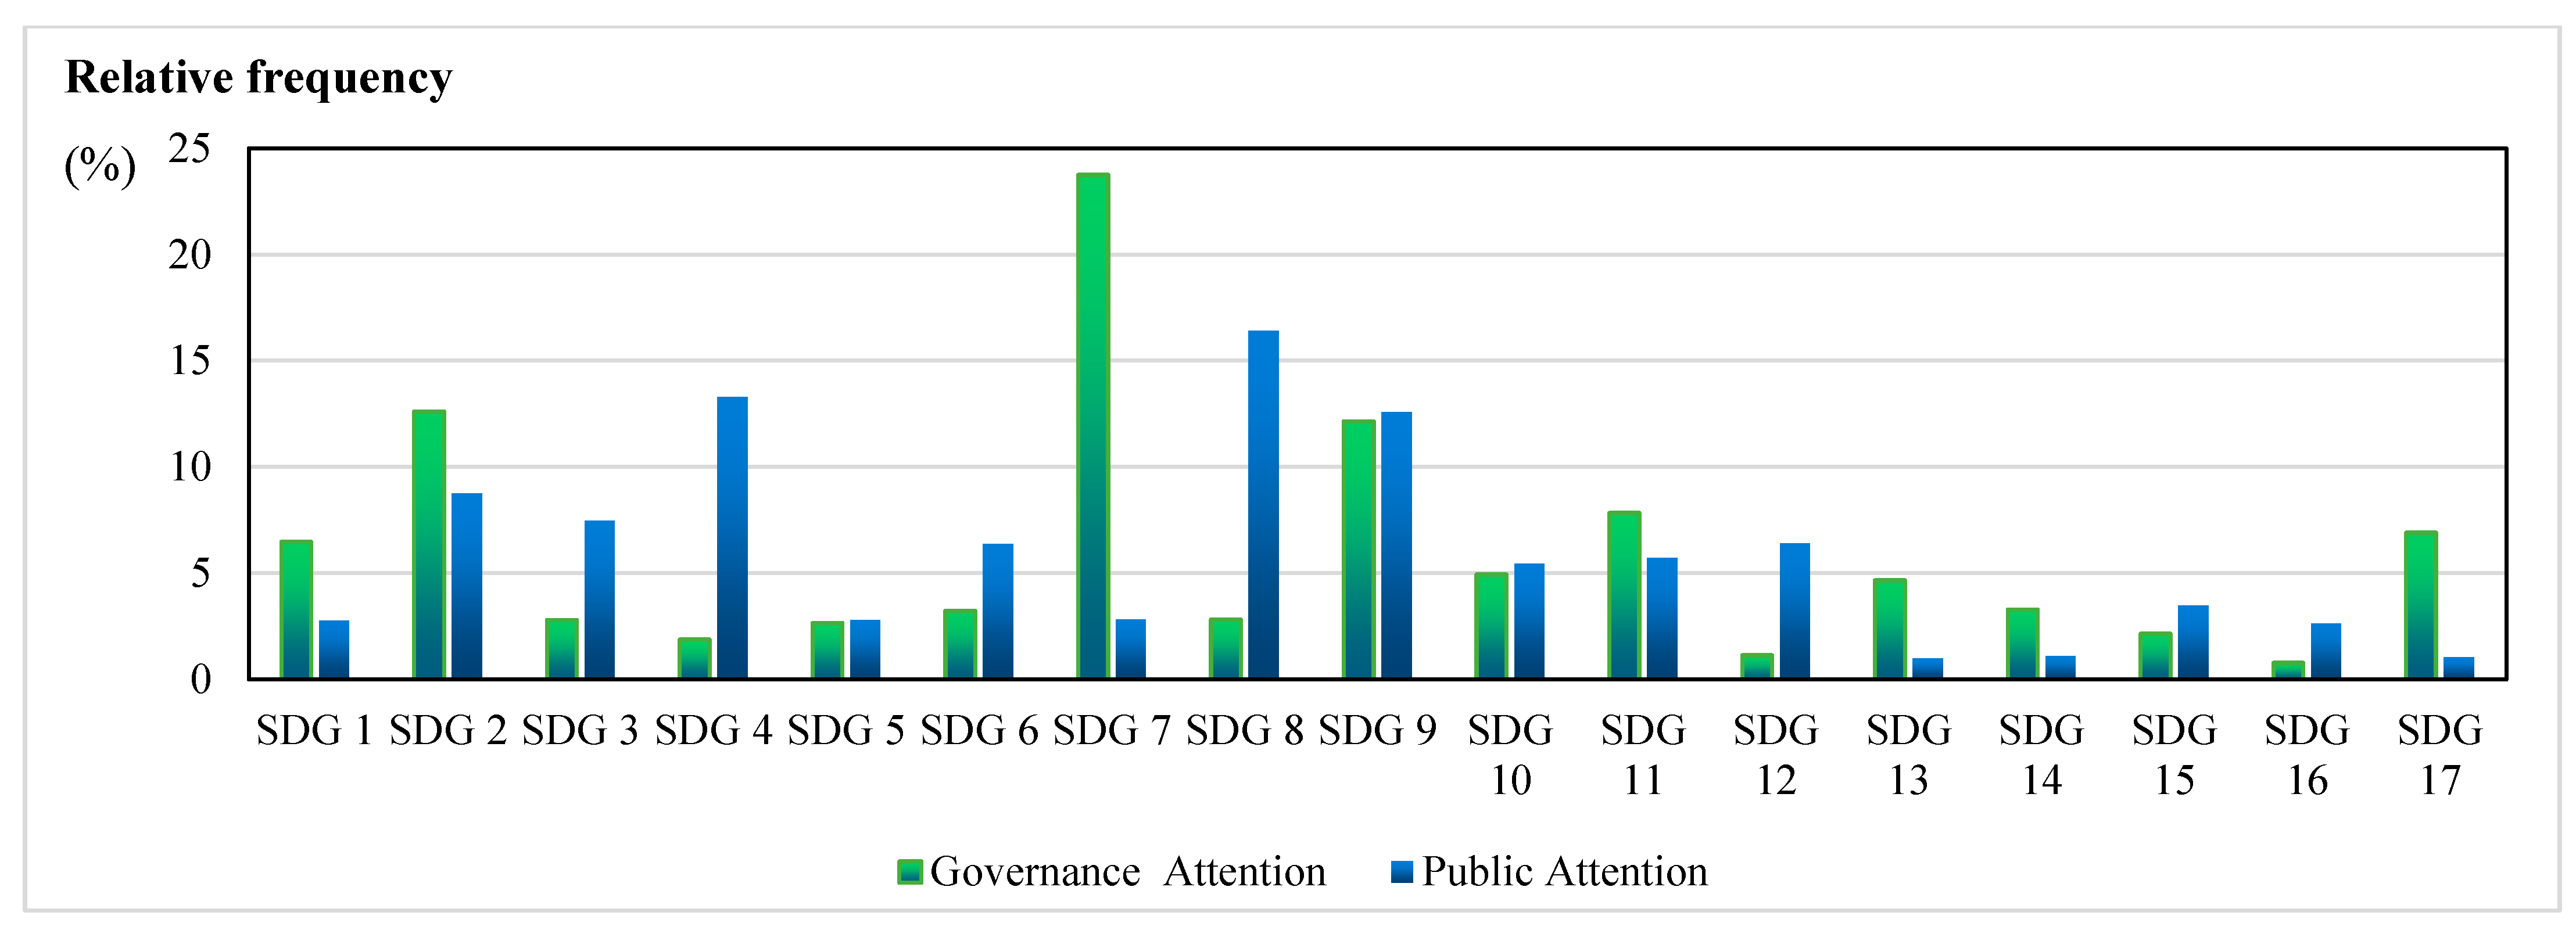
The results showed that the government has strongly focused on SDG 7, SDG 2, and SDG 9, while allocating less attention to SDG 16, SDG 12, and SDG 4 (Figure 3). Notably, Affordable and Clean Energy (SDG 7) received the highest level of attention (23.75%). Correspondingly, Industry, Innovation, and Infrastructure (SDG 9) and Zero Hunger (SDG 2) also received relatively high levels of attention, accounting for 12.15% and 12.61%, respectively. However, in comparison to other goals, the government’s attention given to Peace, Justice, and Strong Institutions (SDG 16) and Responsible Consumption and Production (SDG 12) was relatively low, accounting for only 0.78% and 1.13%, respectively.
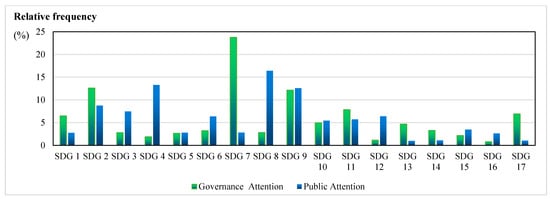
Figure 3.
Government and public attention given to the SDGS.
The public’s attention is mainly concentrated on SDG 8, SDG 9, and SDG 4, with the least attention given to SDG 13, SDG 14, and SDG 17 (Figure 3). Among the SDGs, Decent Work and Economic Growth (SDG 8) leads with 16.41%, indicating the public’s high level of attention given to employment and economic development. This is followed by Quality Education (SDG 4) and Industry, Innovation, and Infrastructure (SDG 9), accounting for 13.29% and 12.58%, respectively, possibly indicating that the public attaches great importance to the role of education and innovation in socio-economic development. However, the attention given to Climate Action (SDG 13), Life Below Water (SDG 14), and Partnerships for the Goals (SDG 17) is relatively low, accounting for 1.00%, 1.09%, and 1.04%, respectively.
When comparing the government and public’s focus on each Sustainable Development Goal (SDG), we can identify areas of consensus and divergence in China.
Consensus is evident in the attention both stakeholders devote to Industry, Innovation, and Infrastructure (SDG 9), with the two stakeholders allocating 12.15% and 12.58% of their focus, respectively. Similarly, Zero Hunger (SDG 2) accounts for 12.61% of the government’s focus and 8.74% of the public’s focus, reflecting the importance of food security and agricultural development in society. However, divergence can be seen in several areas. Affordable and Clean Energy (SDG 7) receives 23.75% of the government’s focus but only 2.81% from the public. Conversely, Decent Work and Economic Growth (SDG 8) accounts for 16.41% of the public’s attention compared to a modest 2.81% from the government. At the same time, it is worth noting that although Climate Action (SDG 13) receives low attention from both stakeholders, other goals related to environmental and climate change, such as SDG 7 and Responsible Consumption and Production (SDG 12), receive a certain level of attention from both stakeholders in China.
3.1.2. Relative Frequency Analysis of the Government and Public Attention Given to the SDGs Topics
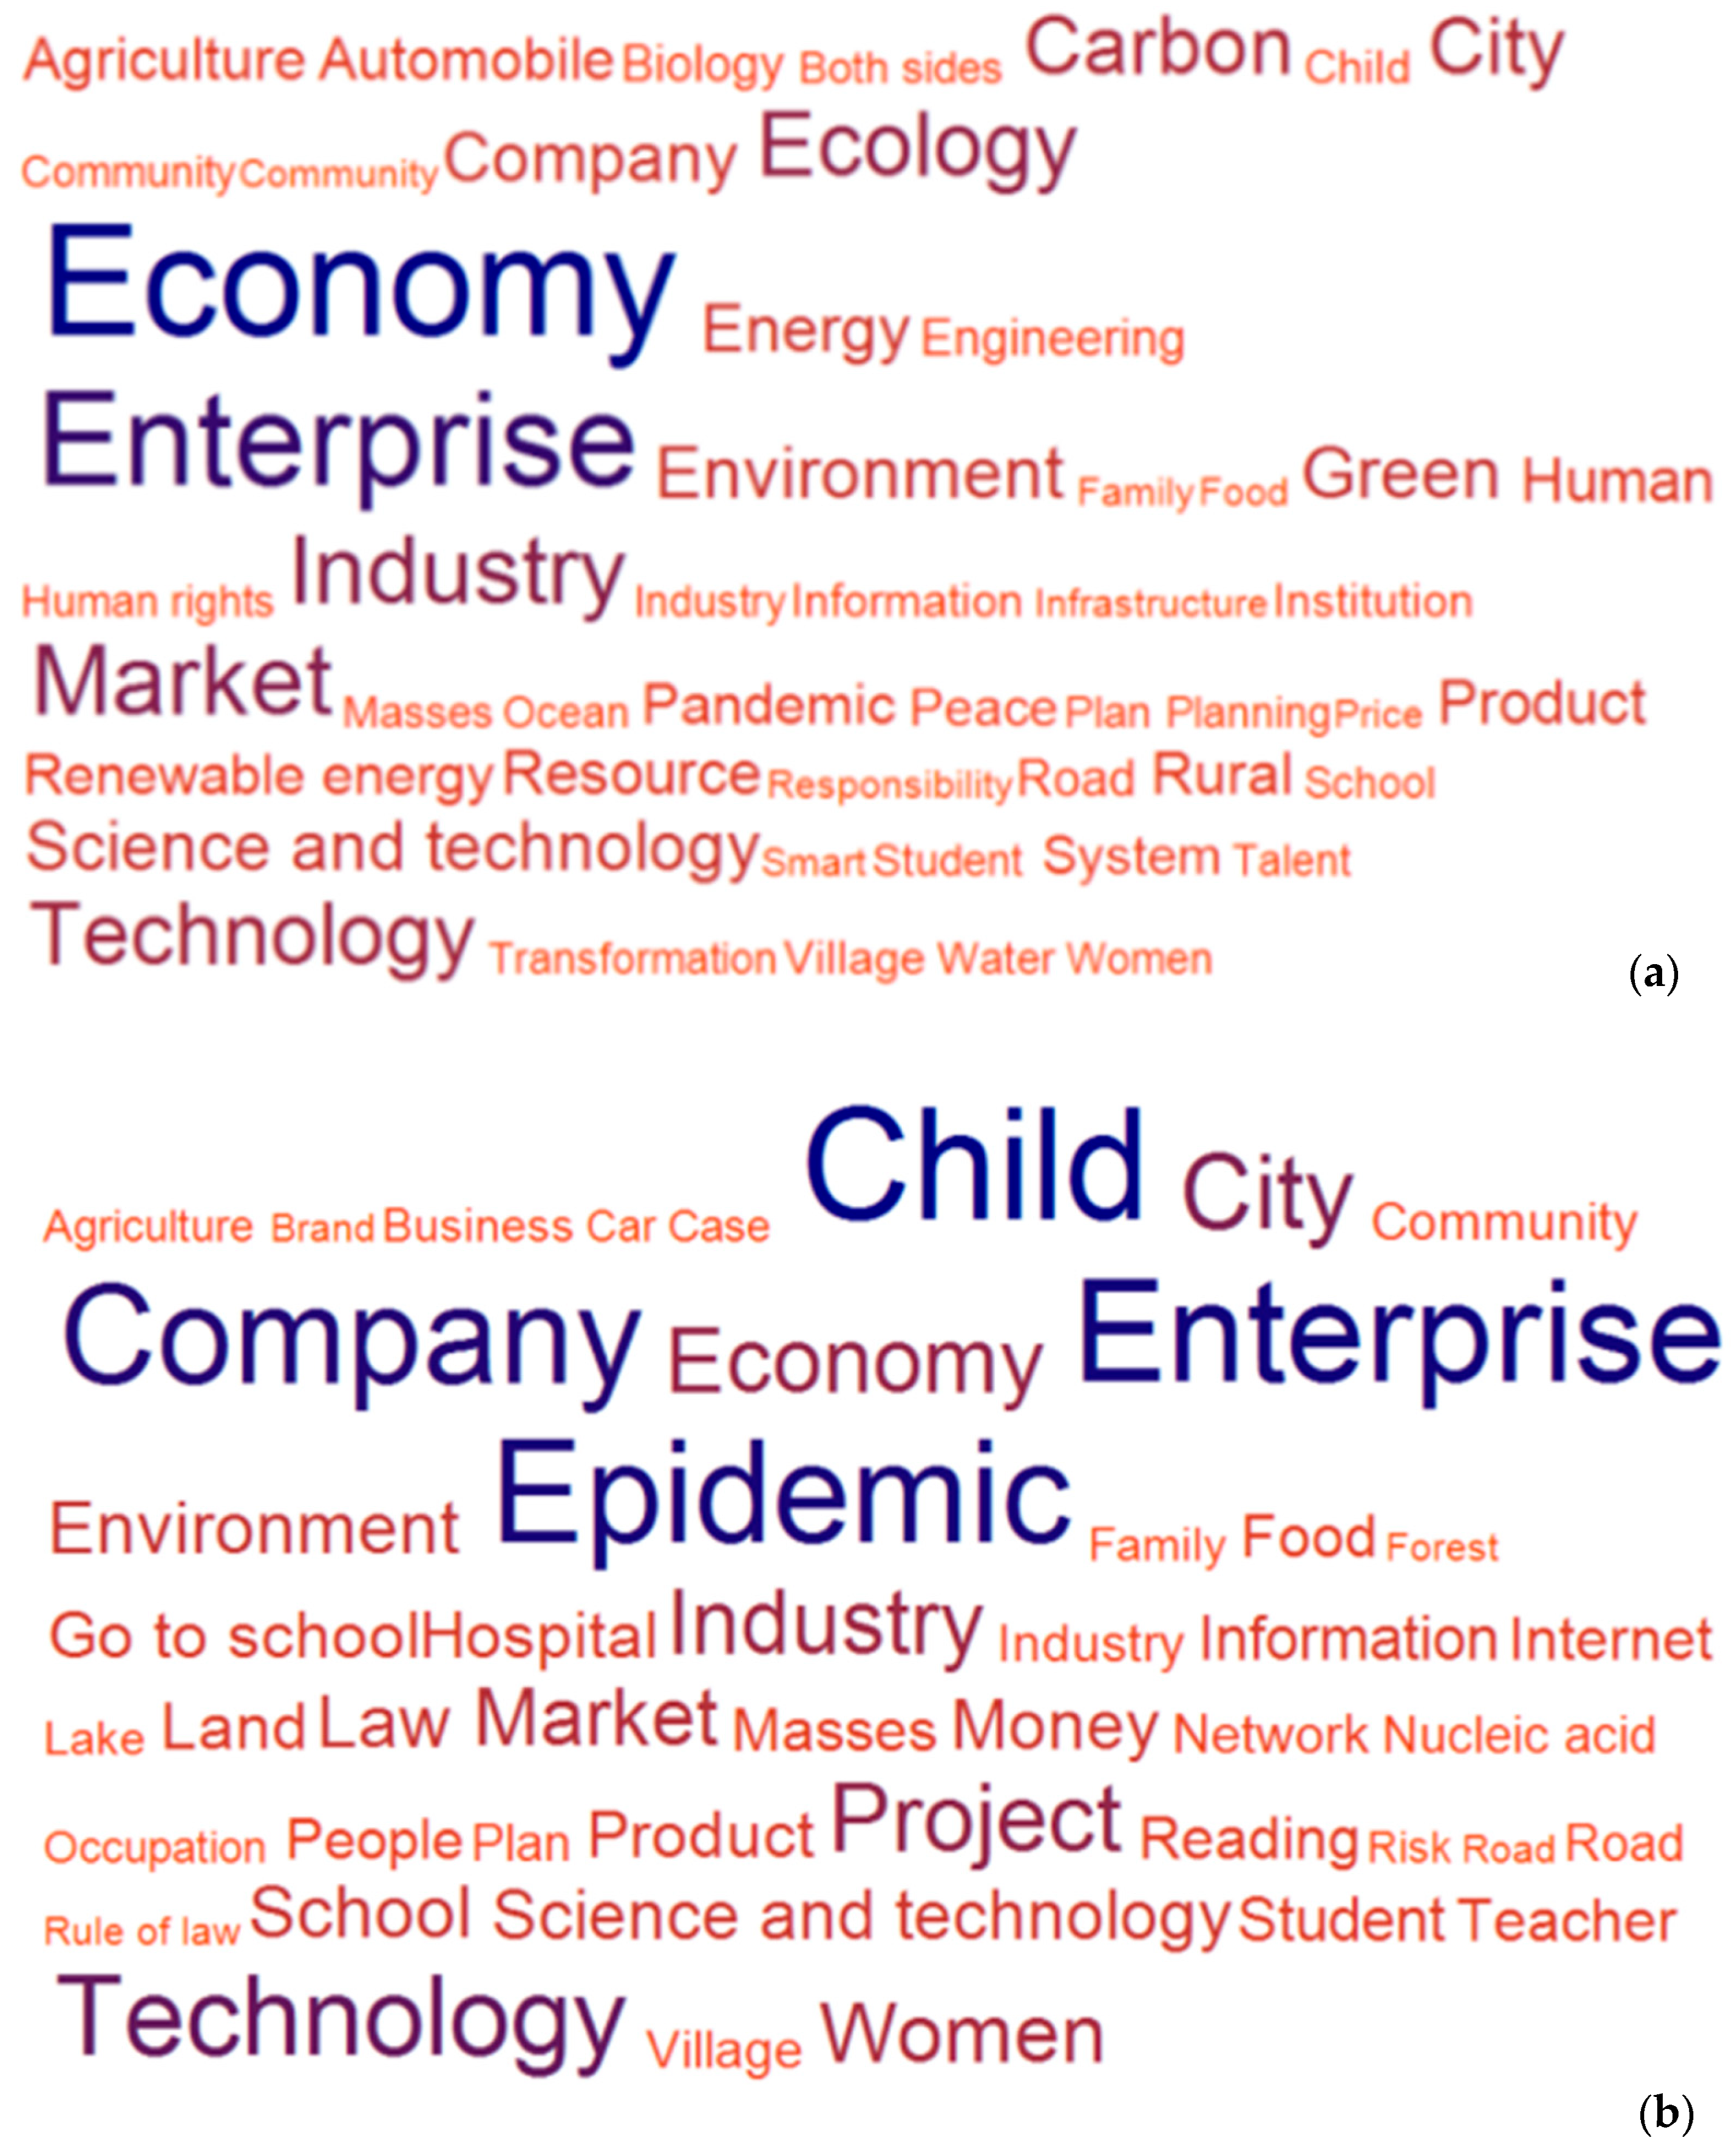
The government’s popular topics mainly involve SDG 8 (Decent Work and Economic Growth), SDG 9 (Industry, Innovation, and Infrastructure), SDG 13 (Climate Action), and SDG 3 (Good Health and Wellbeing) (Figure 4a). For SDG 8 (Decent Work and Economic Growth), keywords such as economy (3.98%), enterprises (3.41%), market (2.27%), and industry (2.27%) frequently appear, which show the government’s focus on economic development, enterprise development, market prosperity, and industrial innovation. This indicates a robust governmental effort to bolster economic growth and improve industrial competitiveness. For SDG 9 (Industry, Innovation, and Infrastructure), the keywords science and technology (2.10%), information (0.84%), and infrastructure (0.58%) frequently appear, indicating the government’s high level of attention given to innovative technology, information technology, and their roles in promoting industrial progress. Regarding SDG 11 (Sustainable Cities and Communities), the frequent appearance of keywords such as city (1.91%), village (1.21%), and housing (0.46%) highlights the government’s focus on the construction and improvement of cities and villages, including citizen’s living conditions, to create more sustainable and livable communities. In terms of SDG 13 (Climate Action) and other environmental issues, the focus on keywords such as ecology (2.31%), carbon (1.97%), and environment (1.62%) shows the government’s proactive stance on environmental protection and climate action. In particular, the focus here is on tackling climate change and promoting carbon neutrality. The appearance of keywords such as epidemic (1.21%), COVID-19 (0.44%), medical care (0.43%), and hospital (0.42%) relating to from SDG 3 (Good Health and Wellbeing) indicates that the government is paying attention and responding to public health crises, especially the COVID-19 epidemic.

Figure 4.
(a) Government attention given to SDG topics. (b) Public attention given to SDG topics. Note: The sizes of the words reflect the results of the relative frequency analysis.
The analysis of the public attention around SDG topics revealed a concentrated focus on SDG 4 (Quality Education), SDG 8 (Decent Work and Economic Growth), SDG 3 (Good Health and Wellbeing), and SDG 5 (Gender Equality) (Figure 4b). Regarding SDG 4 (Quality Education), the public focuses mainly on children’s education and the school environment. The high relative frequency of keywords such as children (2.50%), schools (1.25%), going to school (1.24%), students (1.10%), and teachers (1.10%) show the public’s strong attention given to improving the quality of education, ensuring educational fairness, and providing education opportunities for all. Regarding SDG 8 (Decent Work and Economic Growth), the high relative frequency of the keywords enterprises (2.38%) and companies (2.28%) suggest public concerns about corporate social responsibility, the impact of corporate operations on the economy and society, and the state of the job market. Meanwhile, the appearance of the keywords market (1.38%) and economy (1.60%) reflects the public’s attention given to economic trends, industry development trends, and market competition. Regarding SDG 3 (Good Health and Wellbeing), the public attention’s is centered on epidemic prevention and control and public health services. The appearance of the keywords epidemic (2.33%) and COVID-19 (0.63%) reflects the public’s concerns about epidemic prevention and control, the distribution of medical resources, and public health services. The appearance of the keywords hospitals (1.15%), doctors (0.63%), and cases (0.85%) shows the public’s concerns about the quality of medical services, accessibility of medical resources, and disease treatment and prevention. For SDG 5 (Gender Equality), the public’s attention is mainly focused on protecting women’s rights and gender equality issues. The frequent appearance of the keywords women (1.44%), gender (0.50%), woman (0.05%), female students (0.40%), and women’s rights (0.38%) underlines the public’s concern for gender equality, the protection of women’s rights, and gender discrimination.
The commonalities in the topics of interest related to the SDGs indicate shared concerns and priorities regarding SDG 3 (Good Health and Wellbeing) and SDG 8 (Decent Work and Economic Growth) (Table 2). SDG 3 (Good Health and Wellbeing) primarily focuses on pandemic prevention, public health services, and medical resources. This result shows that public health is a topic of common concern to both the public and the government. As for SDG 8 (Decent Work and Economic Growth), the focus on economic development is mainly reflected in business development, market conditions, and economic situations.
Table 2.
Topics frequently discussed by the government and the public related to each SDG.
Regarding the differences in the topics related to the SDGs, the public is more concerned about education, health, and employment, while the government is more concerned about economic development, social equity, and environmental protection. To be specific, for SDG 2 (Zero Hunger), based on the frequent occurrence of the keywords food and diet, it can be seen that the public has a high degree of concern for food safety, healthy eating, and nutritional intake. For SDG 16 (Peace, Justice, and Strong Institutions), the public has a relatively high level of concern for social safety, justice, and various forms of violence, as indicated by the frequent occurrence of the keywords crime, law, and violence. However, compared to other issues, the government is less concerned about these topics. Conversely, SDG 9 (Industry, Innovation, and Infrastructure), SDG 11 (Sustainable Cities and Communities), and SDG 10 (Reduced Inequalities) are topics of high importance to the government. However, these topics are not considered as significant in the public’s opinion.
3.2. Performance Analysis of the Government and Public Focus on SDGs
Regarding the performance indicators for the Sustainable Development Goals (SDGs), the greatest achievements were found for SDG 4 (Quality Education) and SDG 1 (No Poverty), while SDG 10 (Reduced Inequalities), SDG 15 (Life on Land), and SDG 17 (Partnerships for the Goals) demonstrated the least progress (Figure 5). Specifically, the targets set in the 2030 Agenda for SDG 4 and SDG 1 have nearly been achieved, with accomplishment rates of 97.99% and 99.24%, respectively. In contrast, approximately 50% of the 2030 Agenda goals have been reached for SDG 10, SDG 15, and SDG 17, with progress indicators of 34.93%, 49.24%, and 41.37%, respectively. These goals require increased focus to fulfill the objectives of the 2030 Agenda.
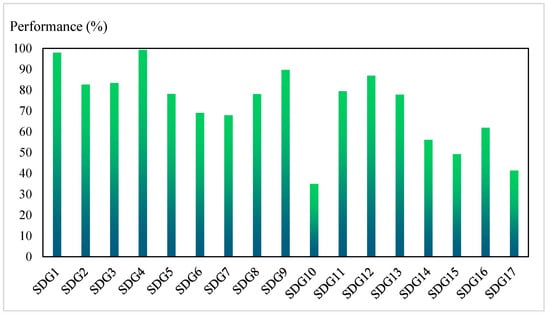
Figure 5.
Performance scores for the SDGs.
Concerning the individual indicators, 100% completion has been attained for 12 out of 98, while 19 out of 98 remain below the 50% threshold (Table 3). Of these, 12 indicators across nine SDGs have been completed, with SDG 9 (Industry, Innovation, and Infrastructure) performing exceptionally well, fulfilling four indicators. However, there appears to be a discrepancy in the report, as it also states that 19 out of 98 indicators for 12 SDGs have reached 100%, with SDG 9 (Industry, Innovation, and Infrastructure) notably achieving all four of its indicators. This inconsistency requires clarification. For SDGs 14 (Life Below Water), 15 (Life on Land), 16 (Peace, Justice, and Strong Institutions), and 17 (Partnerships for the Goals), the situation is particularly severe, as they encompass the most underperforming indicators, each with three indicators significantly lagging. Notably, there are five indicators, including those in SDG 6 (Clean Water and Sanitation), 8 (Decent Work and Economic Growth), 10 (Reduced Inequalities), and 16 (Peace, Justice, and Strong Institutions), which have not shown any progress, marked by a score of 0%.
Table 3.
Performance results for each SDG. Note: the SDG values are sourced from the SDG Report 2023 by the SDG Transformation Center [55].
3.3. Analyzing the Leading Stakeholder for Each SDG
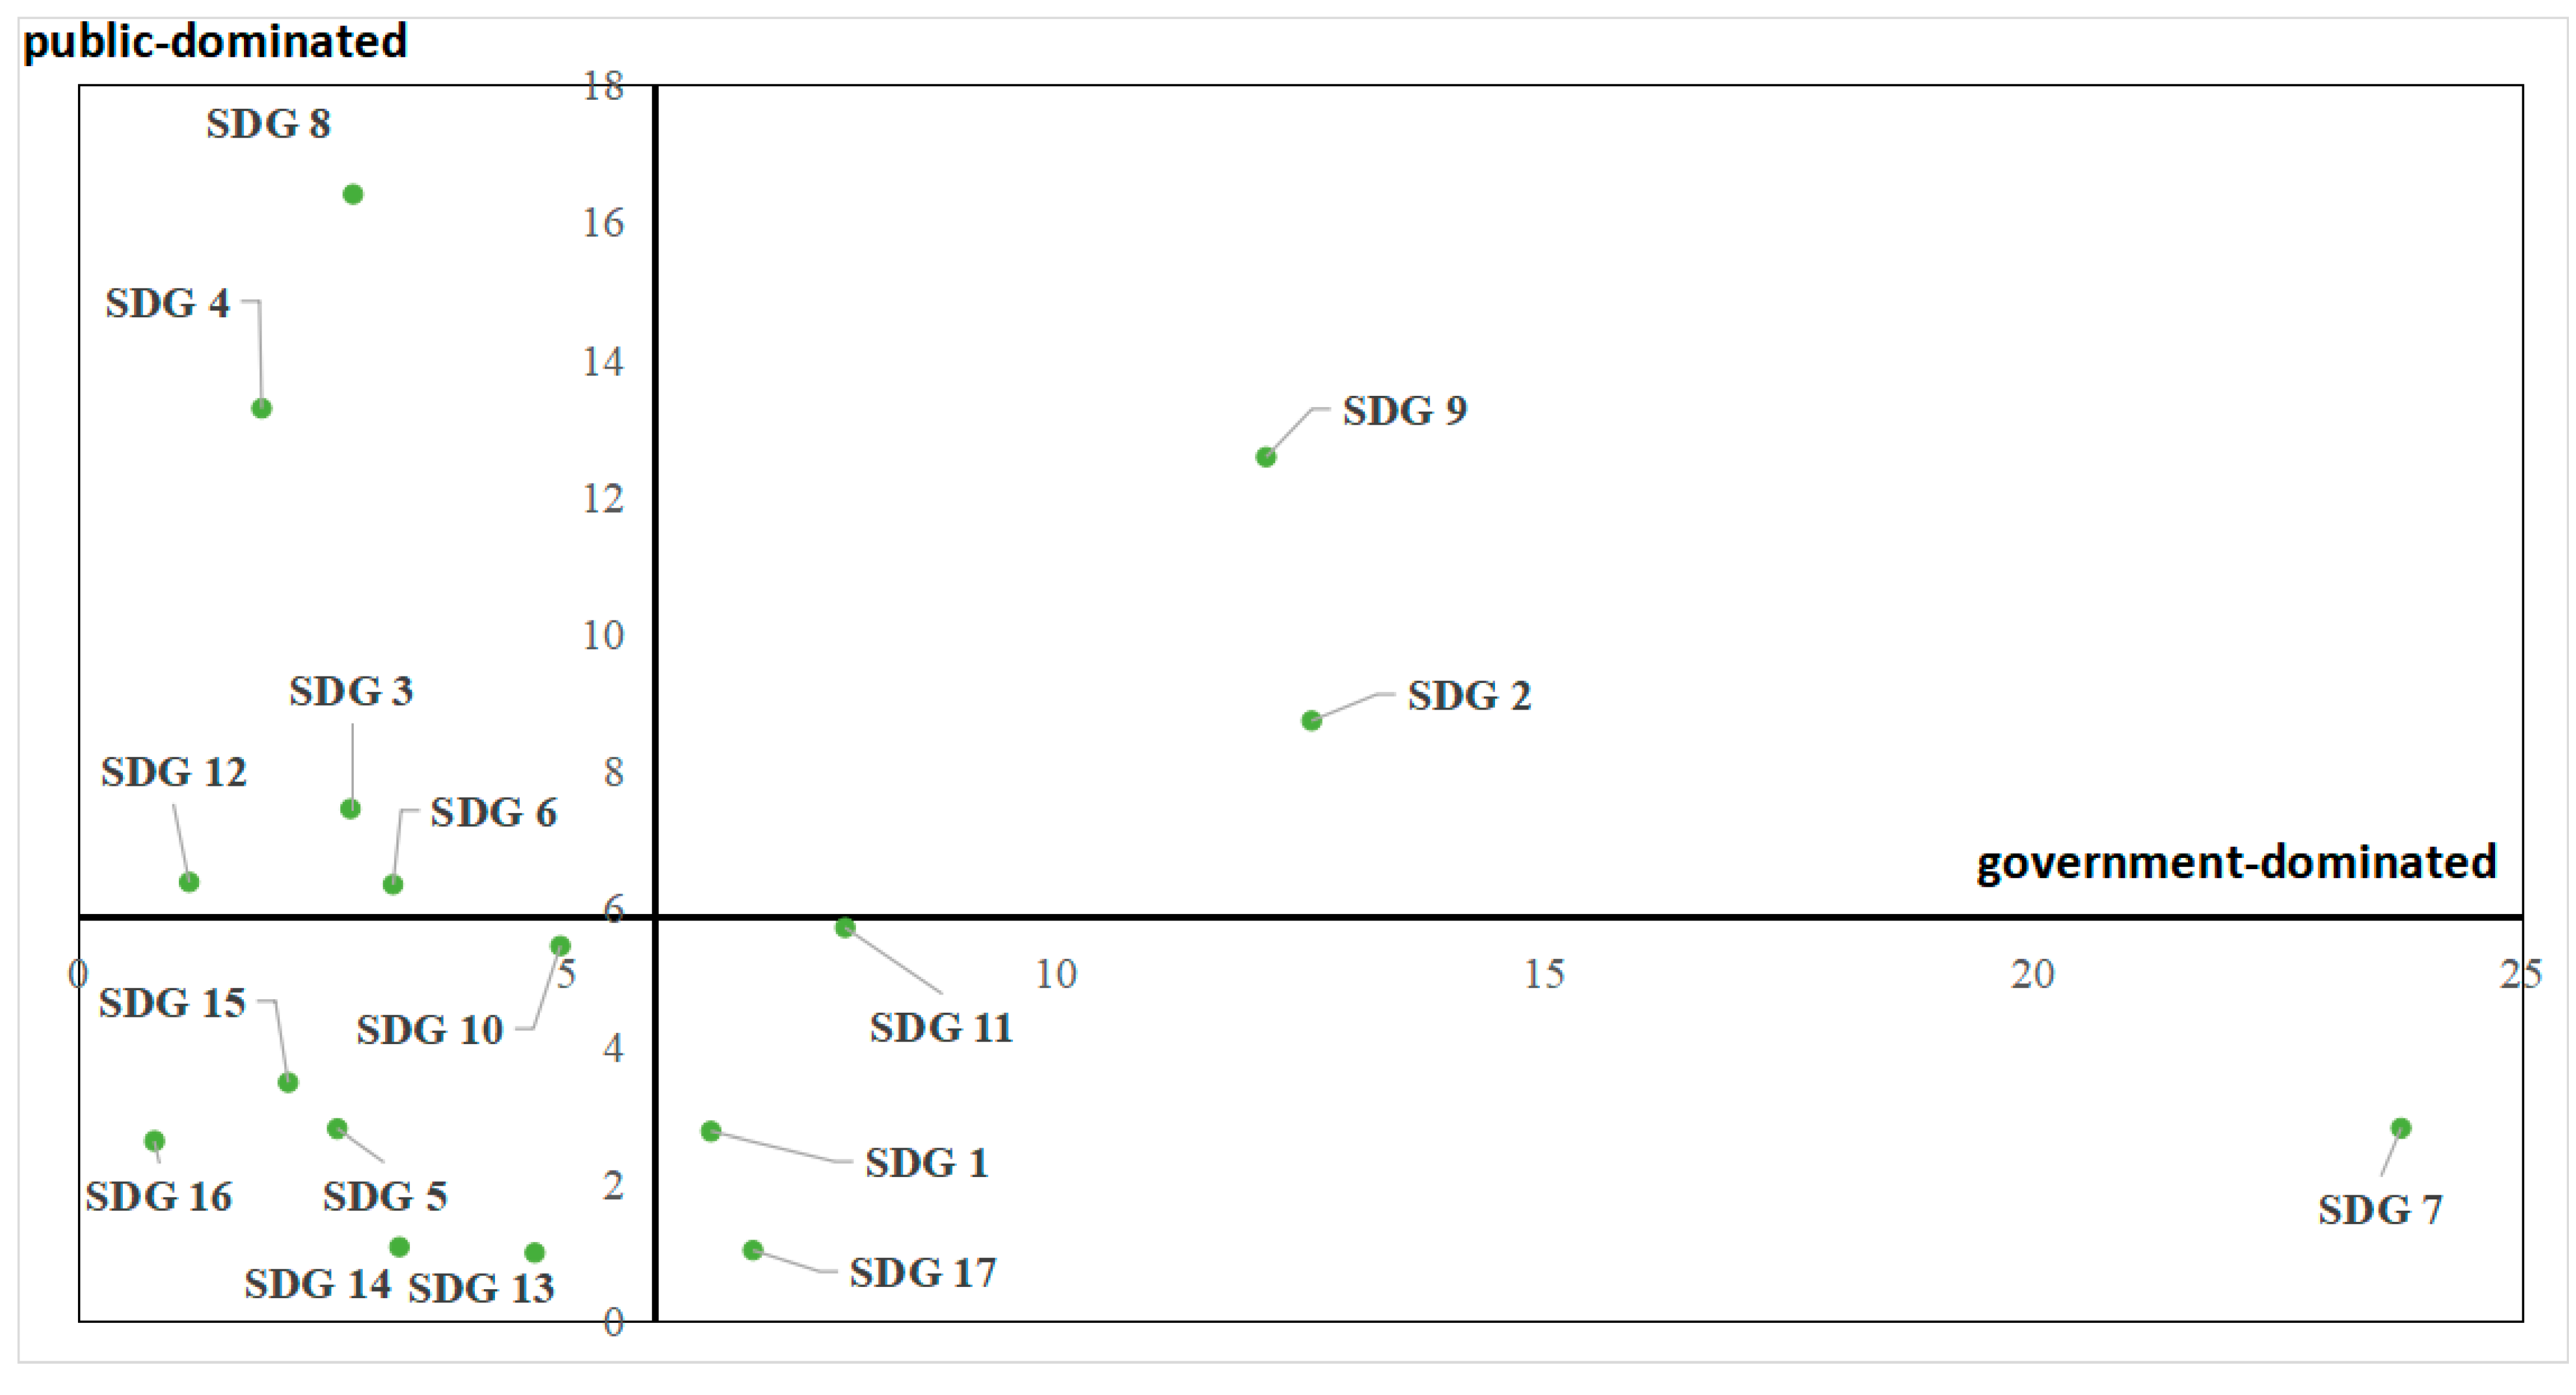
The 17 United Nations SDGs are divided into four quadrants according to the relative frequency of the topics mentioned by the two stakeholders, each corresponding to different states of focus, states of management, and drivers (Figure 6). Consistent with the IPA method used to avoid ceiling effects, the average public- and government-dominated values are used as the crosshair.
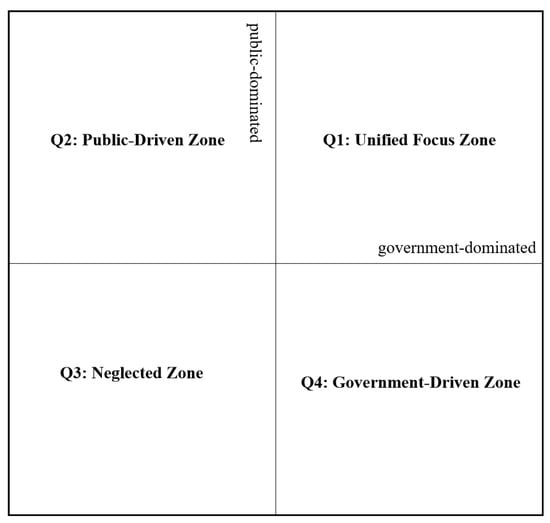
Figure 6.
Stakeholder analysis for each SDG.
The results (Figure 7) show that the “unified focus zone” (quadrant 1) contains two SDGs, SDG 2 (Zero Hunger) and SDG 9 (Industry, Innovation, and Infrastructure). These goals demonstrate that the public and the government focus on the critical issues of hunger and infrastructure. The “public-driven zone” (quadrant 2) contains five SDGs, namely, SDG 3 (Good Health and Wellbeing), SDG 4 (Quality Education), SDG 6 (Clean Water and Sanitation), SDG 8 (Decent Work and Economic Growth), and SDG 12 (Responsible Consumption and Production). The high level of public attention to these goals indicates a strong desire for good health, educational opportunities, job security, a clean environment, and sustainable economic practices. The “neglected zone” (quadrant 3) contains six SDGs, namely, SDG 5 (Gender Equality), SDG 10 (Reduced Inequalities), SDG 13 (Climate Action), SDG 14 (Life Underwater), SDG 15 (Life on Land), and SDG 16 (Peace, Justice, and Strong Institutions). The goals in this quadrant are critically important, although they appear to be receiving insufficient attention from both the public and the government. Despite their significance, they might be overlooked due to perceived complexities or a lack of immediate visibility. The “government-driven zone” (quadrant 4) contains four SDGs, namely, SDG 1 (No Poverty), SDG 7 (Affordable and Clean Energy), SDG 11 (Sustainable Cities and Communities), and SDG 17 (Partnerships for the Goals). These goals reflect high levels of government attention, suggesting they are strategically important or a high priority at the policy level.
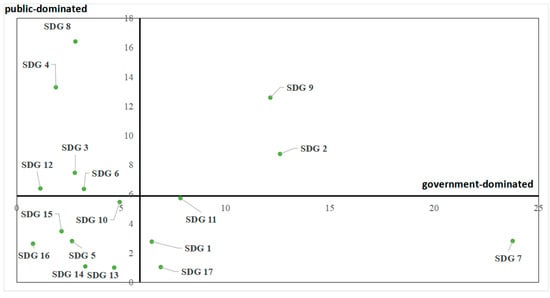
Figure 7.
Stakeholder analysis results for each SDG.
3.4. SDG Assessment Using the Importance–Performance Analysis
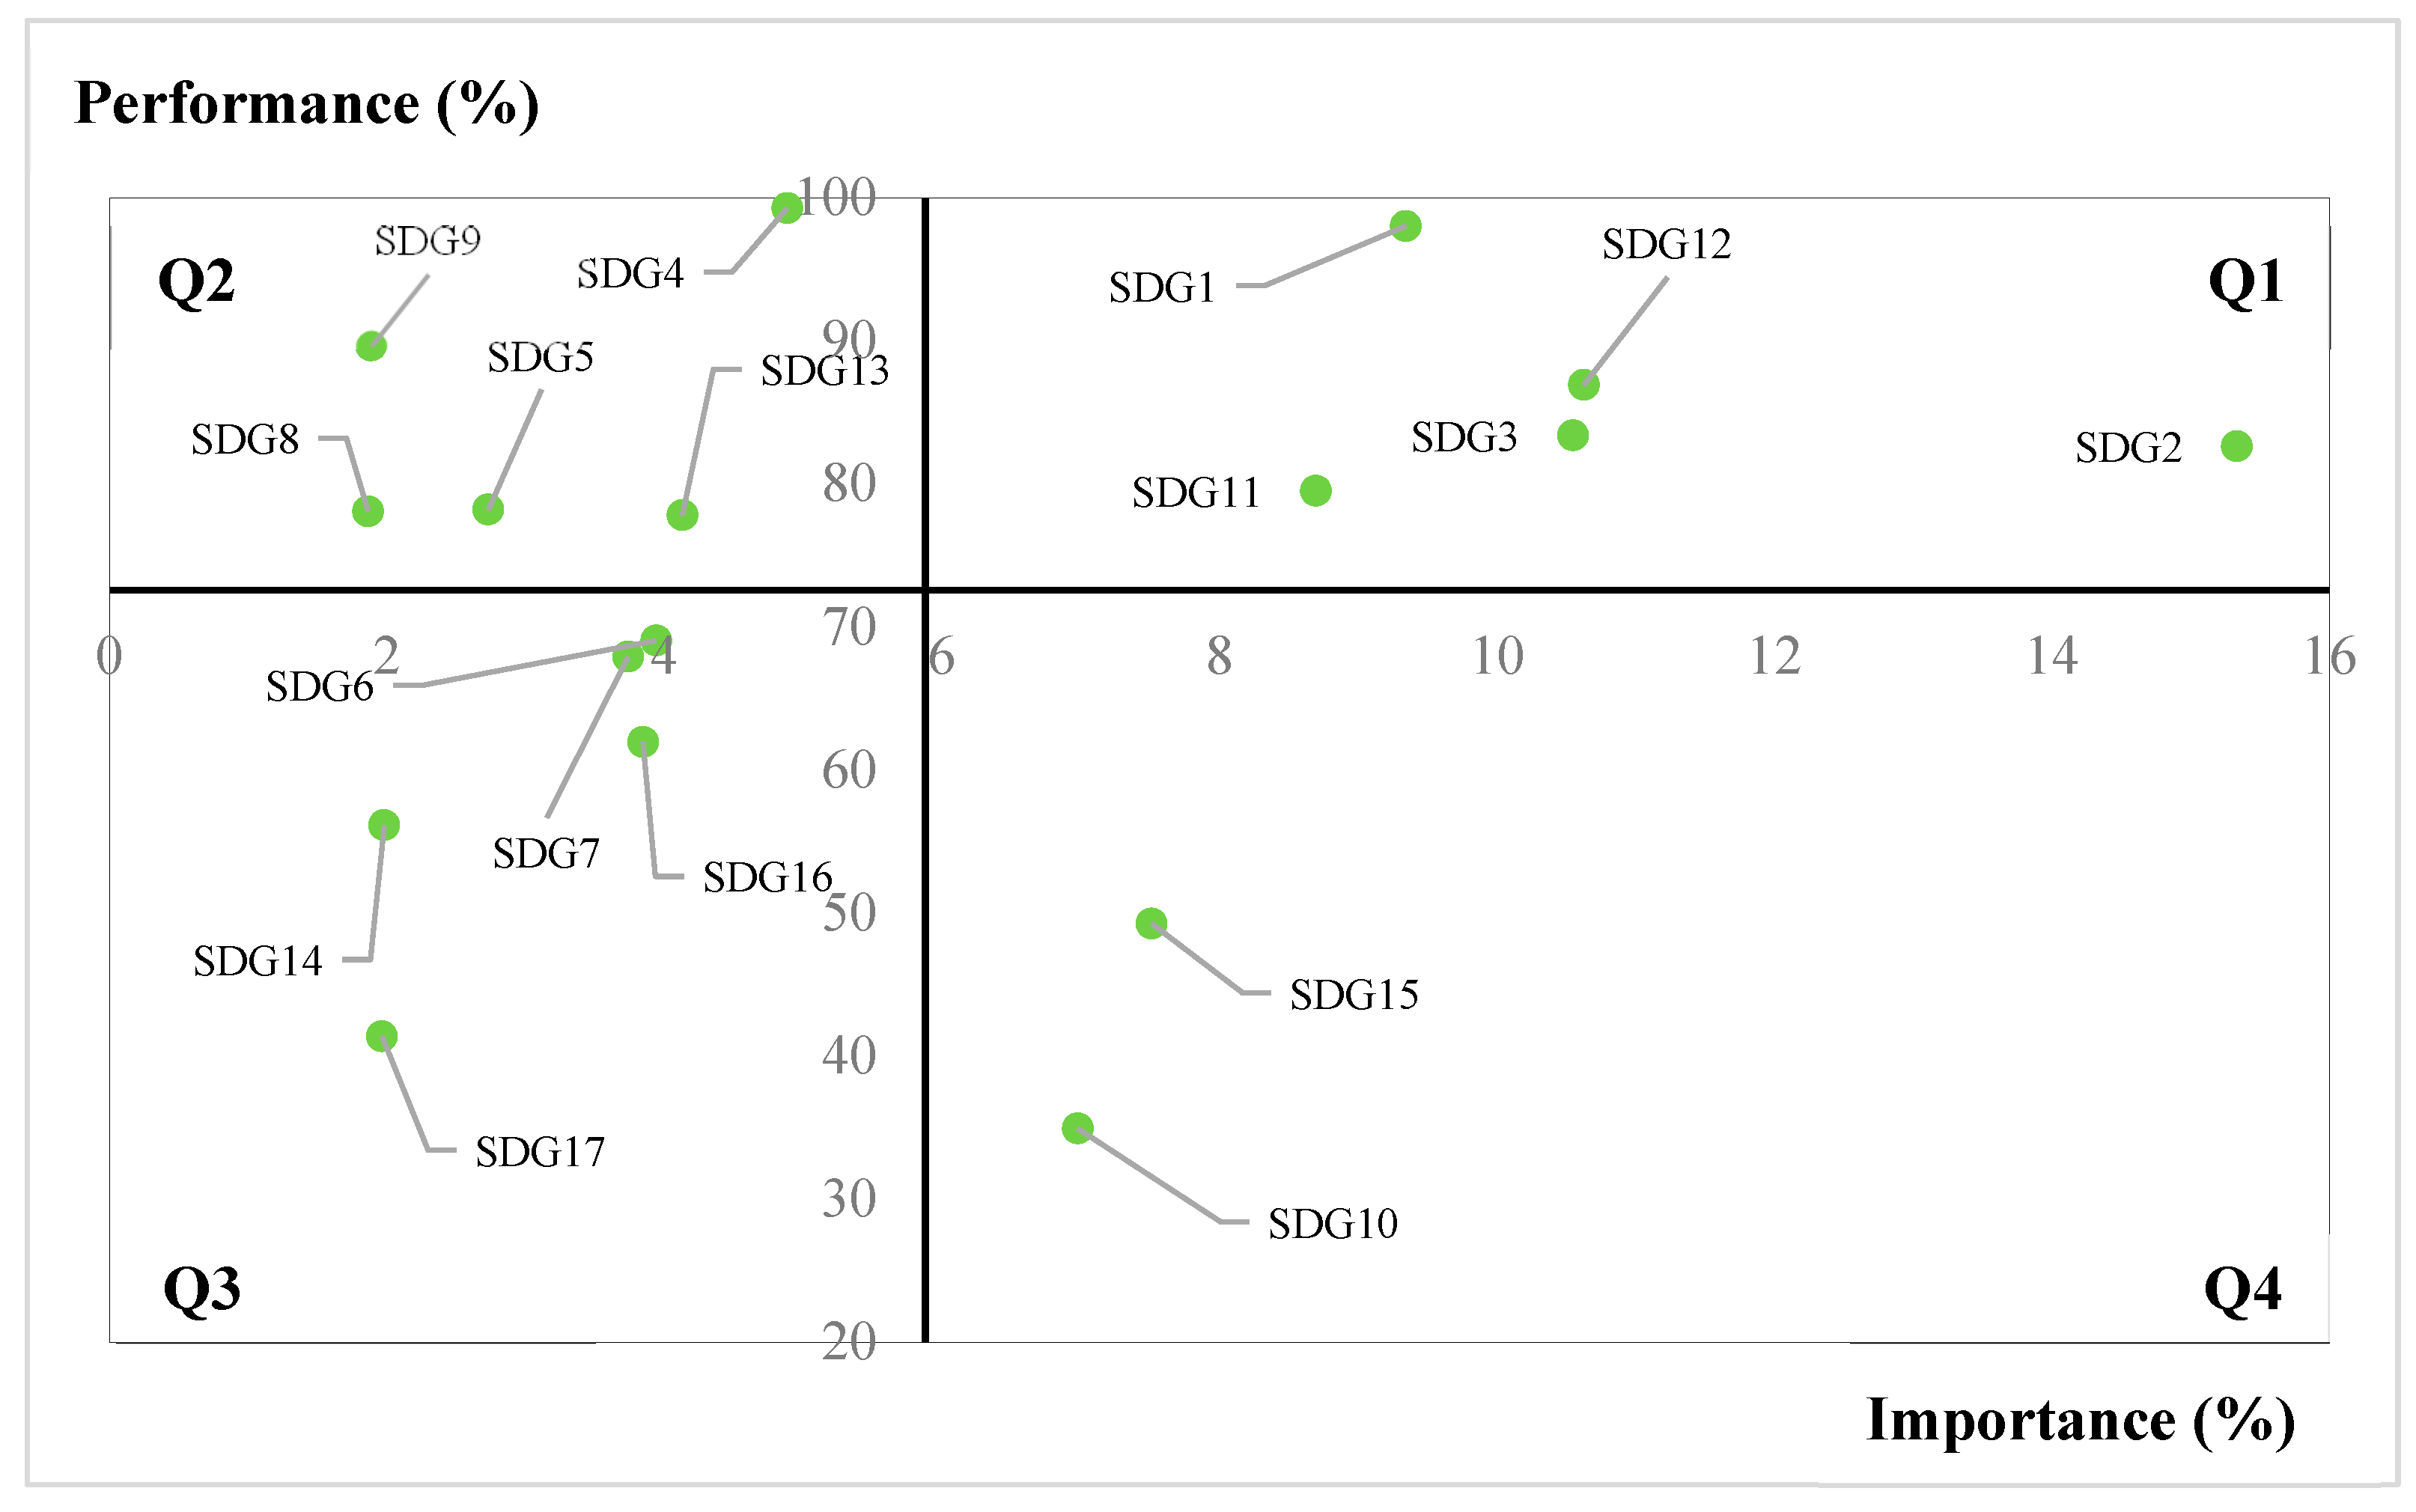
According to the IPA results (Figure 8), China should concentrate on SDG 10, Reduced Inequalities, and SDG 15, Life on Land. These two SDGs are perceived as highly important but are associated with low performance, which is why they are in the “improvement zone”. Additionally, these two SDGs are in the “neglected zone” according to the stakeholder analysis results (Table 4), so the public and government should pay more attention to the two SDGs. Five SDGs, namely, SDGs 6, 7, 14, 16, and 17, are perceived to hold low importance and show poor performances. Additionally, these SDGs are in the “neglected zone” according to the stakeholder analysis results, so the public and government should pay more attention to these SDGs. SDG 7 and SDG 17 are currently government-driven, while SDG 6 is public-driven. The corresponding stakeholders should assess the SDGs’ status, integrate other stakeholders’ strengths if necessary, and improve their performance accordingly to achieve the 2030 Agenda. SDGs 14 and 16 are in the neglected zone, so the public and government should pay more attention to these two SDGs. Five SDGs, namely, SDGs 1, 2, 3, 11, and 12, are in Q1, which shows the strength of China’s progress towards achieving the 2030 Agenda goals. These SDGs are perceived as of high importance with high levels of performance. Additionally, these SDGs have received attention from both the public and the government, who should keep up their good work towards reaching the 2030 Agenda goals. Five SDGs, namely, SDGs 4, 5, 8, 9, and 13, are in Q2, which are perceived as having low importance but with high levels of performance. China should maintain these SDGs to achieve the 2030 Agenda goals.
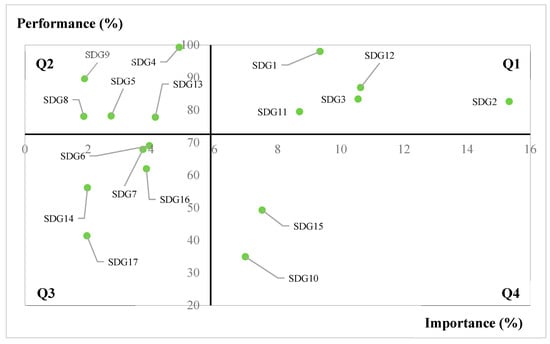
Figure 8.
IPA results for each SDG.
Table 4.
IPA results for each SDG and the associated stakeholder analysis results.
4. Discussion
4.1. Consistencies and Differences in Government and Public Attention Given to the SDGs
The United Nations’ 17 SDGs provide a comprehensive framework that is crucial in guiding government policies and mobilizing public participation toward sustainability [3]. Comparative analyses have been employed to explore national adaptation pathways for the SDGs [59,60]. The previous research has predominantly focused on analyzing the attention dedicated to the SDGs by either the public, business stakeholders, or government stakeholders across various countries [61,62]. However, few studies have conducted a comparative analysis of the attention directed toward the SDGs by both the public and the government, who are the two most important stakeholders in implementing the SDGs. Our comparative analysis of these two entities’ attention toward the SDGs is particularly insightful due to the potential disparities between governmental actions and public interests. Taking the example of China, in this research we employed multi-source data to comparatively analyze the attention dedicated to the SDGs by both stakeholders. This study could help in achieving a more comprehensive understanding of the areas of attention of the two stakeholders in implementing the SDGs. These insights could inform the development of more effective collaborative strategies to achieve the common goals of sustainable development.
The results show that both stakeholders in China currently share common interests in certain SDGs and topics related to people’s basic needs. They jointly prioritize SDG 2 (Zero Hunger) and SDG 9 (Industry, Innovation, and Infrastructure), SDG 3 (Good Health and Wellbeing), and some other themes in SDG 4 (Quality Education) and SDG 8 (Decent Work and Economic Growth). According to Maslow’s hierarchy of needs, basic needs such as food, security, and health must be met before any society can focus on higher-order needs such as sustainability and justice [63]. The mutual focus is on SDGs related to basic welfare and economic stability, as fulfilling these needs is a prerequisite for achieving higher societal goals for both stakeholders. The importance of economic development is reflected in the attention given to business development, market conditions, and economic situations [64]. Additionally, both stakeholders prioritize certain aspects of SDG 5 (e.g., gender equality). The public focuses mainly on women’s rights and gender equality, while the government’s attention is reflected in the frequent use of the keyword “female”, indicating that the government should critically reflect on whether their attention and policies can enhance gender equality [65].
The results reveal that the public tends to prioritize specific SDGs and topics that directly impact their welfare, while the SDGs associated with public goods require government intervention for their provision. According to the theoretical framework of Maslow’s hierarchy of needs, individuals are motivated to fulfill basic needs such as health and economic security before addressing higher-level social issues [63]. The findings indicate that SDG 4 (Quality Education), SDG 3 (Good Health and Wellbeing), and SDG 8 (Decent Work and Economic Growth) are of particular interest as they relate closely to the public’s wellbeing [64,65]. The SDGs related to the quality of children’s education, family health, and employment status significantly affect their quality of life. SDG 16 (Peace, Justice, and Strong Institutions) garners public concern for social safety, justice, and violence. The public looks to the government to provide improved services and support in these areas. Moreover, the lack of public focus on SDGs related to macro-level concerns might stem from a gap in understanding the importance of these issues or the absence of an immediate personal connection. From the perspective of rational ignorance theory, the public might choose not to acquire knowledge about certain complex SDGs that require significant cognitive investment with comparatively little personal return [66,67,68]. Furthermore, according to the collective action theory [69,70], some SDGs, especially those involving collective goods, such as environmental sustainability or climate action, are more challenging for individuals to engage with due to the diffuse benefits and costs. Along with the public goods theory [71,72], these public goods, which are non-excludable and non-rivalrous, require government intervention for their provision, since the public is less motivated to invest in or provide goods and services that lead to sustainable development due to the lack of direct profitability. Hence, there is a significant need for the government to bridge this gap by enhancing public awareness and engagement through effective education and clear policy communication initiatives.
The research findings indicate the importance of the government in coordinating large-scale responses and policy measures for SDGs involving collective goods or public goods. The results suggest that the government is concerned about certain macro-level issues encapsulated in SDG 7 (Affordable and Clean Energy), SDG 10 (Reduced Inequalities), SDG 11 (Sustainable Cities and Communities), and SDG 17 (Partnerships for the Goals). However, these subjects do not command significant public attention. The government, operating with a broader administrative perspective, emphasizes macro-level issues and long-term planning encapsulated in goals such as SDG 11 and SDG 10 [73,74]. This divergence can be viewed through potential differences between government action and public interest. According to the collective action theory [69,70], the government may play a more prominent role in addressing these SDGs (especially those involving collective goods) because it can coordinate large-scale responses and policy measures beyond the scope of individual actions. The government prioritizes areas that require structured long-term strategies, such as SDG 17 and SDG 7, which involve extensive policy frameworks and international negotiations. Furthermore, due to their non-excludability and non-rivalrous nature, some SDGs require government intervention for their provision [75,76,77,78]. For instance, SDGs 11 and 13 often require government intervention and regulation. These areas require technological innovation, bolstering the national industrial competitiveness, and strategic urban and rural development planning [77,78,79], which may not yield immediately visible benefits, resulting in less public attention being attracted. These issues, although crucial for long-term sustainability, might not align closely with the immediate daily experiences or urgent needs of the general public.
4.2. Stakeholder Analysis for the Sustainable Development Goals
This study utilized a two-dimensional matrix to assess the attention given by the government and the public in China to different SDGs. By categorizing the SDGs into discrete quadrants based on their respective attention levels, this analysis unveiled the harmonies and disparities between the two stakeholders regarding the attention and prioritization of these goals. This approach provides a comprehensive framework for understanding the consistencies and differences between the two stakeholders in prioritizing and driving SDGs. It highlights the need for collaboration, targeted efforts, and increased public education to bridge gaps, align priorities, and enhance the progress towards sustainable development. The findings from this analysis can serve as a valuable guide for policymakers and stakeholders in making informed decisions about resource allocation, policy formulation, and advocacy efforts.
The application of the two-dimensional matrix framework effectively categorizes the SDGs into specific quadrants, providing a clear and structured means to assess their prominence and the need for focused action. The findings indicate that certain SDGs receive greater attention from both the government and the public in China, including SDG 2 (Zero Hunger) and SDG 9 (Industry, Innovation, and Infrastructure). This suggests that shared efforts and resources are dedicated to these goals, enhancing the likelihood of successful progress [79]. The “neglected zone” highlights SDGs that receive little attention from either stakeholder in China. The neglected zone encompasses SDG 5 (Gender Equality), SDG 10 (Reduced Inequalities), SDG 13 (Climate Action), SDG 14 (Life Under Water), SDG 15 (Life on Land), and SDG 16 (Peace, Justice, and Strong Institutions), which require increased attention and resources from both stakeholders in China. These goals risk being overlooked or stagnating without concerted efforts to raise awareness, allocate resources, and foster commitment [80,81]. Their multifaceted and long-term nature may present challenges that necessitate robust awareness-raising strategies and resource mobilization efforts to drive meaningful progress.
The approach used in this study could help enhance the understanding of consistencies and differences in attention given to SDGs by employing a two-dimensional matrix to distinctly categorize public-driven and government-driven SDGs. The public-driven zone comprises SDGs that garner high levels of public attention but comparatively lower levels of government attention. In the public-driven zone, SDG 3 (Good Health and Wellbeing), SDG 4 (Quality Education), and others are prioritized due to their direct impact on people’s daily lives. However, the notably lower level of government attention in this quadrant underscores the necessity to align policy priorities with public expectations. While the public interest is conspicuous, driving these goals forward may require more substantial government support and policy interventions. Lastly, the government-driven zone encompasses SDGs that attract high levels of government attention but relatively lower levels of public interest. In the government-driven zone, SDGs such as SDG 1 (No Poverty), SDG 7 (Affordable and Clean Energy), and SDG 11 (Sustainable Cities and Communities) receive high levels of government attention, indicating their strategic importance. Promoting greater public understanding and engagement with these goals can help in leveraging the high level of trust that the Chinese public reportedly has in their government. This high level of trust could facilitate more effective SDG advocacy and execution. Previous research by Edelman Global Public Relations has shown that among the general populations from 26 countries and regions, the Chinese public has the highest level of trust in its government (88% of the informed public) [82,83]. Therefore, the proposed research method contributes to understanding the differences in attention between the government and the public, facilitating the better implementation of SDGs.
5. Conclusions
Based on our case study of China, this paper innovatively underscores the importance of bridging the gaps in attention given to SDGs between the government and the public using multi-source data. This study offers valuable insights into unveiling alignments or discrepancies in attention and commitment, aligning SDG priorities, and strengthening cooperation for more effective SDG implementation between the two stakeholders. This study provides a novel perspective and tool for policymakers and stakeholders to understand and address key issues in driving the implementation of SDGs. The findings of this study have the potential to guide policy direction processes, inform strategies for public engagement, and enhance the comprehension of sustainable development in the digital era.
The results reveal that the public tend to prioritize specific SDGs and topics that directly impact their welfare, while the SDGs involving collective goods or public goods require government intervention for their provision and in coordinating large-scale responses and policy measures. The findings indicate a pronounced emphasis by the government on SDG 7, SDG 2, and SDG 9, with relatively lower levels of attention allocated to SDG 16, SDG 12, and SDG 4. Conversely, the public attention is predominantly centered around SDG 8, SDG 9, and SDG 4, with minimal focus directed toward SDG 13, SDG 14, and SDG 17. Both governmental and public entities exhibited a shared priority for SDGs associated with hunger, industry, innovation, infrastructure, and economic growth.
In examining the progress of the SDGs, the findings highlight the uneven progress across the SDGs and underscores the need for targeted, equitable, and holistic strategies to bolster the lagging indicators towards the 2030 Agenda. SDG 4 and SDG 1 stand out for the considerable strides that have been made toward their targets, while SDG 10, SDG 15, and SDG 17 show a concerning lack of advancement. Delving into specific metrics, the objectives have been fully achieved for a subset of 12 indicators, although nearly one-fifth of the indicators hover below the halfway mark, signaling areas where intensified action is necessary.
Analyzing the stakeholder’s focus zones provides valuable insights for policy direction recommendations to enhance the alignment of government and public efforts towards the SDGs. In the unified focus zone (quadrant 1), both stakeholders in China share high levels of attention towards SDG 2 and SDG 9. Policymakers should capitalize on this common ground and shift the policy direction by launching financial products and digital media platforms to promote agricultural products, providing preferential loans to start-up companies and traditional industries. In the public-driven zone (quadrant 2), the public places high importance on wellbeing, health, and education. Policymakers should focus on policies that directly impact the public’s wellbeing, such as establishing a trustworthy health system, particularly focusing on primary healthcare, infectious disease control, and non-communicable disease management. Furthermore, given the public’s strong emphasis on SDG 4, the government should consider a comprehensive overhaul of the education system. In the government-driven zone (quadrant 4), where the government places high levels of attention on certain SDGs with lower public interest, policymakers should initiate campaigns and policies to inform the public about the relevance of these goals from a macro-level perspective. This could include structured dialogues and communication campaigns that build trust, share knowledge, and clarify the importance of these SDGs for the public.
According to the IPA results, not all SDGs attracting the greatest levels of attention from the public and the government have shown the most progress towards achieving the 2030 Agenda goals. China should concentrate on SDG 10 and SDG 15 and improve SDGs 6, 7, 14, 16, and 17 as a relatively low priority. This study also reveals certain SDGs that receive low levels of attention from the two stakeholders, categorized as the neglected quadrant, necessitating increased attention and resource allocation from the two stakeholders.
This study still has some limitations that require further research in the future. First, it is likely that some content will be subject to censorship by social media platforms. Some content related to SDG barriers could not be collected. Social media platforms can reduce the frequency of mentions by stakeholders, which would consequently reduce the level of public attention, so they still represent an effective reflection of the actual situation regarding public attention. Although social media data are a great and reliable resource to reflect public opinions on SDGs, along with the previous social media data-based studies, it is essential to integrate the advantages of traditional surveys and social media data to comprehensively reflect the perspectives of the public regarding the SDGs. In specific, future studies could collect individual-level data on the attention each SDG receives from members within the stakeholder groups through surveys. This would provide a more detailed and statistically robust understanding of their perspectives. Secondly, Weibo, China News, and Toutiao are not the only three representatives of Chinese social media platforms. Recently, two short video platforms, TikTok and Kuaishou, have attracted many users. Whether our findings can be extended to short video platforms will hopefully be addressed in further research. Finally, our study only focused on the two main stakeholders, the public and the government. Future research studies could be further expanded to other stakeholders.
Author Contributions
Conceptualization: H.F., L.F., K.Z., Q.Z. and L.D.D.; methodology: H.F. and L.F.; writing—original draft preparation: H.F., L.F., K.Z. and Q.Z.; writing—review and editing: H.F., L.F., K.Z., Q.Z. and L.D.D.; visualization: K.Z., Q.Z. and L.D.D.; supervision: K.Z., Q.Z. and L.D.D. All authors have read and agreed to the published version of the manuscript.
Funding
This research received funding from the Fundamental Research Funds for the Central Universities of Central South University (2024ZZTS340).
Data Availability Statement
Data developed in this study will be made available on request to the corresponding authors.
Conflicts of Interest
The authors declare no conflicts of interest.
References
- Sachs, J.D. From Millennium Development Goals to Sustainable Development Goals. Lancet 2012, 379, 2206–2211. [Google Scholar] [CrossRef] [PubMed]
- Huck, W. Transforming Our World: The 2030 Agenda for Sustainable Development. In Sustainable Development Goals; Springer: New York, NY, USA, 2023. [Google Scholar]
- Bain, P.G.; Kroonenberg, P.M.; Johansson, L.O.; Milfont, T.L.; Crimston, C.R.; Kurz, T.; Bushina, E.; Calligaro, C.; Demarque, C.; Guan, Y.; et al. Public Views of the Sustainable Development Goals across Countries. Nat. Sustain. 2019, 2, 819–825. [Google Scholar] [CrossRef]
- Sachs, J.; Schmidt-Traub, G.; Kroll, C.; Durand-Delacre, D.; Teksoz, K. SDG Index and Dashboards Report 2017; SDSN: New York, NY, USA, 2017. [Google Scholar]
- Hák, T.; Janoušková, S.; Moldan, B. Sustainable Development Goals: A Need for Relevant Indicators. Ecol. Indic. 2016, 60, 565–573. [Google Scholar] [CrossRef]
- Li, Z.; Zheng, K.; Zhong, Q. Comprehensive Evaluation and Spatial-Temporal Pattern of Green Development in Hunan Province, China. Sustainability 2022, 14, 6819. [Google Scholar] [CrossRef]
- Zhong, Q.; Li, Z. Long-Term Trends of Vegetation Greenness under Different Urban Development Intensities in 889 Global Cities. Sustain. Cities Soc. 2024, 106, 105406. [Google Scholar] [CrossRef]
- Fu, H.; Liu, J.; Dong, X.; Chen, Z.; He, M. Evaluating the Sustainable Development Goals within Spatial Planning for Decision-Making: A Major Function-Oriented Zone Planning Strategy in China. Land 2024, 13, 390. [Google Scholar] [CrossRef]
- Ormanovic, S.; Ciric, A.; Talovic, M.; Alic, H.; Jeleskovic, E.; Causevic, D. Importance-Performance Analysis: Different Approaches. Acta Kinesiol. 2017, 11, 58–66. [Google Scholar]
- George, T.E.; Karatu, K.; Edward, A. An Evaluation of the Environmental Impact Assessment Practice in Uganda: Challenges and Opportunities for Achieving Sustainable Development. Heliyon 2020, 6, e04758. [Google Scholar] [CrossRef] [PubMed]
- Meuleman, L. Public Administration and Governance for the Sdgs: Navigating between Change and Stability. Sustainability 2021, 13, 5914. [Google Scholar] [CrossRef]
- Zhao, Z.; Pan, Y.; Zhu, J.; Wu, J.; Zhu, R. The Impact of Urbanization on the Delivery of Public Service–Related SDGs in China. Sustain. Cities Soc. 2022, 80, 103776. [Google Scholar] [CrossRef]
- Wang, B.; Xu, S.; Sun, K.; Chang, X.; Wang, Z.; Zhao, W. Government Responsive Selectivity and Public Limited Mediation Role in Air Pollution Governance: Evidence from Large Scale Text Data Content Mining. Resour. Conserv. Recycl. 2022, 187, 106553. [Google Scholar] [CrossRef]
- Van Tulder, R.; Rodrigues, S.B.; Mirza, H.; Sexsmith, K. The UN’s Sustainable Development Goals: Can Multinational Enterprises Lead the Decade of Action? J. Int. Bus. Policy 2021, 4, 1–21. [Google Scholar] [CrossRef]
- De Guimarães, J.C.F.; Severo, E.A.; Júnior, L.A.F.; Da Costa, W.P.L.B.; Salmoria, F.T. Governance and Quality of Life in Smart Cities: Towards Sustainable Development Goals. J. Clean. Prod. 2020, 253, 119926. [Google Scholar] [CrossRef]
- Kanie, N.; Biermann, F. Governing through Goals: Sustainable Development Goals as Governance Innovation; MIT Press: Cambridge, MA, USA, 2017. [Google Scholar]
- Shulla, K.; Leal Filho, W.; Sommer, J.H.; Salvia, A.L.; Borgemeister, C. Channels of Collaboration for Citizen Science and the Sustainable Development Goals. J. Clean. Prod. 2020, 264, 121735. [Google Scholar] [CrossRef]
- Dalampira, E.; Nastis, S.A. Mapping Sustainable Development Goals: A Network Analysis Framework. Sustain. Dev. 2020, 28, 46–55. [Google Scholar] [CrossRef]
- Tiefenbeck, V.; Staake, T.; Roth, K.; Sachs, O. For Better or for Worse? Empirical Evidence of Moral Licensing in a Behavioral Energy Conservation Campaign. Energy Policy 2013, 57, 160–171. [Google Scholar] [CrossRef]
- Ilyas, S.; Hu, Z.; Wiwattanakornwong, K. Unleashing the Role of Top Management and Government Support in Green Supply Chain Management and Sustainable Development Goals. Environ. Sci. Pollut. Res. 2020, 27, 8210–8223. [Google Scholar] [CrossRef]
- Forestier, O.; Kim, R.E. Cherry-picking the Sustainable Development Goals: Goal Prioritization by National Governments and Implications for Global Governance. Sustain. Dev. 2020, 28, 1269–1278. [Google Scholar] [CrossRef]
- Le Blanc, D. Towards Integration at Last? The Sustainable Development Goals as a Network of Targets. Sustain. Dev. 2015, 23, 176–187. [Google Scholar] [CrossRef]
- Bruns, A.; Burgess, J. Crisis Communication in Natural Disasters: The Queensland Floods and Christchurch Earthquakes. Twitter Soc. 2014, 89, 373–384. [Google Scholar]
- Tufekci, Z. Engineering the Public: Big Data, Surveillance and Computational Politics. First Monday 2014, 19, 7. [Google Scholar] [CrossRef]
- Stieglitz, S.; Mirbabaie, M.; Ross, B.; Neuberger, C. Social Media Analytics—Challenges in Topic Discovery, Data Collection, and Data Preparation. Int. J. Inf. Manag. 2018, 39, 156–168. [Google Scholar] [CrossRef]
- Saura, J.R.; Ribeiro-Soriano, D.; Palacios-Marqués, D. From User-Generated Data to Data-Driven Innovation: A Research Agenda to Understand User Privacy in Digital Markets. Int. J. Inf. Manag. 2021, 60, 102331. [Google Scholar] [CrossRef]
- Ostherr, K.; Borodina, S.; Bracken, R.C.; Lotterman, C.; Storer, E.; Williams, B. Trust and Privacy in the Context of User-Generated Health Data. Big Data Soc. 2017, 4, 1–11. [Google Scholar] [CrossRef]
- Zhang, B.; Yin, J.; Jiang, H.; Chen, S.; Ding, Y.; Xia, R.; Wei, D.; Luo, X. Multi-Source Data Assessment and Multi-Factor Analysis of Urban Carbon Emissions: A Case Study of the Pearl River Basin, China. Urban Clim. 2023, 51, 101653. [Google Scholar] [CrossRef]
- Zheng, Y.; Du, S.; Zhang, X.; Bai, L.; Wang, H. Estimating Carbon Emissions in Urban Functional Zones Using Multi-Source Data: A Case Study in Beijing. Build. Environ. 2022, 212, 108804. [Google Scholar] [CrossRef]
- Zhou, Y.; Yi, P.; Li, W.; Gong, C. Assessment of City Sustainability from the Perspective of Multi-Source Data-Driven. Sustain. Cities Soc. 2021, 70, 102918. [Google Scholar] [CrossRef]
- Esmailpour, J.; Aghabayk, K.; Vajari, M.A.; De Gruyter, C. Importance–Performance Analysis (IPA) of Bus Service Attributes: A Case Study in a Developing Country. Transp. Res. Part A Policy Pract. 2020, 142, 129–150. [Google Scholar] [CrossRef]
- Yang, T.; Dang, Y.; Wu, J. Dynamic Perceived Quality Analysis Using Social Media Data at Macro-and Micro-Levels. Ind. Manag. Data Syst. 2023, 123, 1465–1495. [Google Scholar] [CrossRef]
- Watanabe, K.; Zhou, Y. Theory-Driven Analysis of Large Corpora: Semisupervised Topic Classification of the UN Speeches. Soc. Sci. Comput. Rev. 2022, 40, 346–366. [Google Scholar] [CrossRef]
- Karan, M.; Vulić, I.; Korhonen, A.; Glavaš, G. Classification-Based Self-Learning for Weakly Supervised Bilingual Lexicon Induction; Association for Computational Linguistics: Stroudsburg, PA, USA, 2020. [Google Scholar]
- Husain, F. OSACT4 Shared Task on Offensive Language Detection: Intensive Preprocessing-Based Approach. arXiv 2020, arXiv:2005.07297. [Google Scholar]
- Viswanathan, R. Word Relationships Are Not Created Equally. In Proceedings of the 2021 IEEE Pune Section International Conference (PuneCon), Pune, India, 16–19 December 2021; IEEE: Piscataway, NJ, USA, 2021; pp. 1–6. [Google Scholar]
- Fouad, M.M.; Mahany, A.; Aljohani, N.; Abbasi, R.A.; Hassan, S.-U. ArWordVec: Efficient Word Embedding Models for Arabic Tweets. Soft. Comput. 2020, 24, 8061–8068. [Google Scholar] [CrossRef]
- Chen, M.; Mussalli, G.; Amel-Zadeh, A.; Weinberg, M.O. NLP for SDGs: Measuring Corporate Alignment with the Sustainable Development Goals. J. Impact ESG Invest. 2022, 2, 61–81. [Google Scholar] [CrossRef]
- Ling, M.; Chen, Q.; Sun, Q.; Jia, Y. Hybrid Neural Network for Sina Weibo Sentiment Analysis. IEEE Trans. Comput. Soc. Syst. 2020, 7, 983–990. [Google Scholar] [CrossRef]
- Chen, Q.; Min, C.; Zhang, W.; Wang, G.; Ma, X.; Evans, R. Unpacking the Black Box: How to Promote Citizen Engagement through Government Social Media during the COVID-19 Crisis. Comput. Human. Behav. 2020, 110, 106380. [Google Scholar] [CrossRef] [PubMed]
- Chen, H.; Huang, X.; Li, Z. A Content Analysis of Chinese News Coverage on COVID-19 and Tourism. Curr. Issues Tour. 2022, 25, 198–205. [Google Scholar] [CrossRef]
- Kuai, J.; Lin, B.; Karlsson, M.; Lewis, S.C. From Wild East to Forbidden City: Mapping Algorithmic News Distribution in China through a Case Study of Jinri Toutiao. Digit. J. 2023, 11, 1521–1541. [Google Scholar] [CrossRef]
- Chang, L.-C.; Wang, X.; Zhang, S.-Q.; Chen, C.-B.; Yuan, Z.-H.; Zeng, X.-J.; Chu, J.-Q.; Tsai, S.-B. User-Driven Business Model Innovation: An Ethnographic Inquiry into Toutiao in the Chinese Context. Asia Pac. Bus. Rev. 2021, 27, 359–377. [Google Scholar] [CrossRef]
- Wagner, T.; Guhl, D.; Langhals, B. The Impact of Data Preparation and Model Complexity on the Natural Language Classification of Chinese News Headlines. Algorithms 2024, 17, 132. [Google Scholar] [CrossRef]
- United Nations. The Sustainable Development Goals Report 2023. 2023. Available online: https://sdgs.un.org/documents/sustainable-development-goals-report-2023-53220 (accessed on 10 April 2024).
- Osman, A.I.A.; Ahmed, A.N.; Chow, M.F.; Huang, Y.F.; El-Shafie, A. Extreme Gradient Boosting (Xgboost) Model to Predict the Groundwater Levels in Selangor Malaysia. Ain. Shams Eng. J. 2021, 12, 1545–1556. [Google Scholar] [CrossRef]
- Fang, Z.; Yang, S.; Lv, C.; An, S.; Wu, W. Application of a Data-Driven XGBoost Model for the Prediction of COVID-19 in the USA: A Time-Series Study. BMJ Open 2022, 12, e056685. [Google Scholar] [CrossRef] [PubMed]
- Amjad, M.; Ahmad, I.; Ahmad, M.; Wróblewski, P.; Kamiński, P.; Amjad, U. Prediction of Pile Bearing Capacity Using XGBoost Algorithm: Modeling and Performance Evaluation. Appl. Sci. 2022, 12, 2126. [Google Scholar] [CrossRef]
- Zamzuri, M.H.A.; Sofian, N.; Hassan, R. Forecasting of Poverty Using the Ensemble Learning Classification Methods. Int. J. Perceptive Cogn. Comput. 2023, 9, 1. [Google Scholar] [CrossRef]
- Martilla, J.A.; James, J.C. Importance-Performance Analysis. J. Mark. 1977, 41, 77–79. [Google Scholar] [CrossRef]
- Jou, R.-C.; Day, Y.-J. Application of Revised Importance–Performance Analysis to Investigate Critical Service Quality of Hotel Online Booking. Sustainability 2021, 13, 2043. [Google Scholar] [CrossRef]
- Jin, C.; Zhu, D.; Chen, X.; He, J. Evaluation of the Tourists’ Satisfaction of Smart Tourist Attractions Using Importance-Performance Analysis: —Taking Jiuzhaigou as an Example. In Proceedings of the Distributed, Ambient and Pervasive Interactions: 8th International Conference, DAPI 2020, Held as Part of the 22nd HCI International Conference, HCII 2020, Copenhagen, Denmark, 19–24 July 2020; Proceedings 22. Springer: Berlin/Heidelberg, Germany, 2020; pp. 391–399. [Google Scholar]
- Saransi, F.; Erlinda, N. Assessing Service Quality and Passenger Satisfaction: A Quantitative Study of Sea Transportation on the Padang Mentawai. Asian J. Econ. Bus. Account 2024, 24, 347–355. [Google Scholar] [CrossRef]
- Ulkhaq, M.M.; Wijayanti, W.R.; Dilaga, D.A.; Qadarullah, A.A.; Arfi, F. Combining the Analytic Hierarchy Process and Importance-Performance Analysis to Assess Service Quality of m-Commerce: A Case of Indonesian m-Commerce. In Proceedings of the 2021 IEEE 8th International Conference on Industrial Engineering and Applications (ICIEA), Chengdu, China, 23–26 April 2021; IEEE: Piscataway, NJ, USA, 2021; pp. 6–10. [Google Scholar]
- The SDG Transformation Center for the United Nations. Sustainable Development Report 2023. 2023. Available online: https://sdgtransformationcenter.org/reports/sustainable-development-report-2023 (accessed on 10 April 2024).
- Shuai, C.; Yu, L.; Chen, X.; Zhao, B.; Qu, S.; Zhu, J.; Liu, J.; Miller, S.A.; Xu, M. Principal Indicators to Monitor Sustainable Development Goals. Environ. Res. Lett. 2021, 16, 124015. [Google Scholar] [CrossRef]
- Giles-Corti, B.; Lowe, M.; Arundel, J. Achieving the SDGs: Evaluating Indicators to Be Used to Benchmark and Monitor Progress towards Creating Healthy and Sustainable Cities. Health Policy 2020, 124, 581–590. [Google Scholar] [CrossRef] [PubMed]
- Sachs, J.D.; Kroll, C.; Lafortune, G.; Fuller, G.; Woelm, F. Sustainable Development Report 2022; Cambridge University Press: Cambridge, UK, 2022; ISBN 1009210084. [Google Scholar]
- Sebestyén, V.; Abonyi, J. Data-Driven Comparative Analysis of National Adaptation Pathways for Sustainable Development Goals. J. Clean. Prod. 2021, 319, 128657. [Google Scholar] [CrossRef]
- Fekih Zguir, M.; Dubis, S.; Koç, M. Embedding Education for Sustainable Development (ESD) and SDGs Values in Curriculum: A Comparative Review on Qatar, Singapore and New Zealand. J. Clean. Prod. 2021, 319, 128534. [Google Scholar] [CrossRef]
- Fowler, A.; Biekart, K. Multi-Stakeholder Initiatives for Sustainable Development Goals: The Importance of Interlocutors. Public Adm. Dev. 2017, 37, 81–93. [Google Scholar] [CrossRef]
- Yamane, T.; Kaneko, S. Impact of Raising Awareness of Sustainable Development Goals: A Survey Experiment Eliciting Stakeholder Preferences for Corporate Behavior. J. Clean. Prod. 2021, 285, 125291. [Google Scholar] [CrossRef]
- Maslow, A.; Lewis, K.J. Maslow’s Hierarchy of Needs. Salenger Inc. 1987, 14, 987–990. [Google Scholar]
- Frey, D.F. Economic Growth, Full Employment and Decent Work: The Means and Ends in SDG 8. Int. J. Hum. Rights 2017, 21, 1164–1184. [Google Scholar] [CrossRef]
- Leal Filho, W.; Raath, S.; Lazzarini, B.; Vargas, V.R.; de Souza, L.; Anholon, R.; Quelhas, O.L.G.; Haddad, R.; Klavins, M.; Orlovic, V.L. The Role of Transformation in Learning and Education for Sustainability. J. Clean. Prod. 2018, 199, 286–295. [Google Scholar] [CrossRef]
- Somin, I. Rational Ignorance. In Routledge International Handbook of Ignorance Studies; Routledge: London, UK, 2022; pp. 313–322. [Google Scholar]
- Bromberger, S. Rational Ignorance. Synthese 1988, 47–64. [Google Scholar] [CrossRef]
- Krek, A. Rational Ignorance of the Citizens in Public Participatory Planning. In Proceedings of the 10th symposium on Information-and Communication Technologies (ICT) in Urban Planning and Spatial Development and Impacts of ICT on Physical Space, CORP, Vienna, Austria, 22–25 February 2005; Volume 5, p. 420. [Google Scholar]
- DeMarrais, E.; Earle, T. Collective Action Theory and the Dynamics of Complex Societies. Annu. Rev. Anthropol. 2017, 46, 183–201. [Google Scholar] [CrossRef]
- Ostrom, E. Collective Action Theory. In The Oxford Handbook of Comparative Politics; Oxford Academic: Oxford, UK, 2009. [Google Scholar]
- Holcombe, R.G. A Theory of the Theory of Public Goods. Rev. Austrian Econ. 1997, 10, 1–22. [Google Scholar] [CrossRef]
- Oakland, W.H. Theory of Public Goods. In Handbook of Public Economics; Elsevier: Amsterdam, The Netherlands, 1987; Volume 2, pp. 485–535. ISBN 978-0-444-87908-0. [Google Scholar]
- Howlett, M. Governance Modes, Policy Regimes and Operational Plans: A Multi-Level Nested Model of Policy Instrument Choice and Policy Design. Policy Sci. 2009, 42, 73–89. [Google Scholar] [CrossRef]
- Rabie, A. Government Policy Reviews and Reforms Relating to the Environment. S. Afr. J. Environ. Law Policy 1999, 6, 121–148. [Google Scholar]
- Kejžar, K.Z.; Ponikvar, N. Global Public Goods in Light of the New Paradigm of Sustainable Development under the Challenges Facing Today’s World. In Global Public Goods and Sustainable Development in the Practice of International Organizations; Brill: Leiden, The Netherlands, 2023; pp. 21–41. ISBN 9004687262. [Google Scholar]
- Olusa, A. Public Goods in Attainment of Sustainable City Growth in Ibadan, Nigeria. Available online: https://www.researchgate.net/profile/Adekemi-Olusa/publication/353606541_Public_Goods_in_Attainment_of_Sustainable_City_Growth_in_Ibadan_Nigeria/links/61057793169a1a0103cc7bfd/Public-Goods-in-Attainment-of-Sustainable-City-Growth-in-Ibadan-Nigeria.pdf (accessed on 6 June 2024).
- Sæbø, J.I.; Nicholson, B.; Nielsen, P.; Sahay, S. Digital Global Public Goods. arXiv 2021, arXiv:2108.09718. [Google Scholar]
- Anwar, M.S.; Ruhtiani, M.; Hendriana, R. Blue Carbon: Integrative Management of Coastal Ecosystems Based on Regional Autonomy. Jambe Law J. 2023, 6, 185–204. [Google Scholar] [CrossRef]
- Zhong, Q.; Fu, H.; Yan, J.; Li, Z. How Does Energy Utilization Affect Rural Sustainability Development in Traditional Villages? Re-Examination from the Coupling Coordination Degree of Atmosphere-Ecology-Socioeconomics System. Build. Environ. 2024, 111541. [Google Scholar] [CrossRef]
- Beck, D.; Ferasso, M. How Can Stakeholder Capitalism Contribute to Achieving the Sustainable Development Goals? A Cross-Network Literature Analysis. Ecol. Econ. 2023, 204, 107673. [Google Scholar] [CrossRef]
- Glass, L.M.; Newig, J.; Ruf, S. MSPs for the SDGs—Assessing the Collaborative Governance Architecture of Multi-Stakeholder Partnerships for Implementing the Sustainable Development Goals. Earth Syst. Gov. 2023, 17, 100182. [Google Scholar] [CrossRef]
- Guan, T.; Meng, K.; Liu, W.; Xue, L. Public Attitudes toward Sustainable Development Goals: Evidence from Five Chinese Cities. Sustainability 2019, 11, 5793. [Google Scholar] [CrossRef]
- Trust Barometer. 2019 Edelman Trust Barometer-Global Report. 2019. Available online: https://www.edelman.com/sites/g/files/aatuss191/files/2019-03/2019_Edelman_Trust_Barometer_Global_Report.pdf?utm_source=website&utm_medium=global_report&utm_campaign=downloads/ (accessed on 10 April 2024).


Disclaimer/Publisher’s Note: The statements, opinions and data contained in all publications are solely those of the individual author(s) and contributor(s) and not of MDPI and/or the editor(s). MDPI and/or the editor(s) disclaim responsibility for any injury to people or property resulting from any ideas, methods, instructions or products referred to in the content. |
© 2024 by the authors. Licensee MDPI, Basel, Switzerland. This article is an open access article distributed under the terms and conditions of the Creative Commons Attribution (CC BY) license (https://creativecommons.org/licenses/by/4.0/).