Abstract
Vegetation, serving as the primary constituent of terrestrial ecosystems, plays a crucial role in regulating energy flow and material cycles and providing vital resources for human socio-economic activities. This study analyzes the spatio-temporal patterns of economic density and vegetation coverage in the Yellow River Basin (YRB) based on forest resource inventory and socio-economic data from 448 counties in 2008, 2013, and 2018. A three-tiered criterion layer is constructed using economic density as the core explanatory variable, encompassing social development factors, land use factors, and natural factors. A two-way fixed effects model is then utilized to analyze the impact of economic density on vegetation coverage. Results reveal that: (1) Spatially, economic density demonstrates a “low in the west and high in the east” pattern, with an overall upward trend in the YRB. Conversely, vegetation cover exhibits a “high in the west and low in the east” pattern, displaying a downward trend. (2) Over the 2008–2018 period, a significant negative correlation between economic density and vegetation cover is observed in each county of the YRB, with vegetation cover decreasing by 1.108% for every 1 unit increase in economic density. Notably, the upstream areas of the YRB experience a significant increase in vegetation coverage, while the middle and lower reaches witness a decrease. (3) Considering control variables, the proportion of the primary industry, urbanization rate, forest protection level, and cultivated land area exert a significant influence on vegetation coverage across the entire basin. Policymakers should formulate relevant policies to achieve sustainable development in the YRB, as discussed in the proposed countermeasures. This study delineates a practical pathway for high-quality economic development and high-level ecological protection in the YRB, offering a valuable reference for analogous research in other regions.
1. Introduction
In the context of global warming and extreme climatic events, the loss of biodiversity is increasingly evident [1], making the study of vegetation cover changes a crucial topic in discussions about global ecosystem shifts. Forest ecosystems play a vital role in mitigating climate change, preserving biodiversity, and safeguarding water resources [2]. However, climate change can alter forest vegetation distribution, impact forest growth and development, and potentially lead to ecosystem instability and species loss [3]. Vegetation dynamics, heavily influenced by climate change, are crucial for forest ecosystems to effectively respond to human disturbances and the significant impacts of climate change. In recent decades, intensified human activities combined with ongoing climate change have led to rapid changes in vegetation. This is particularly evident in the Yellow River Basin (YRB), where vegetation restoration has become a critical aspect of ecological protection and socioeconomic development. The degradation and dysfunction of ecosystems, driven by human activities and climate change, pose significant threats to biodiversity, productivity, and the basin’s ecological services, impacting regional socio-economic development and environmental protection [4].
As an important ecological shield and economic zone in China, the YRB plays an important role in China’s economic and social development and ecological security. The YRB plays an important role in preventing wind, stabilizing sandy soil and maintaining ecological balance [5,6]. However, the fluctuations in vegetation cover within the YRB not only impact regional ecological equilibrium but also exert profound effects on climate and the environment in the basin and beyond. In addition to climate factors, human activities have become a major contributing factor to vegetation cover change [7]. The study revealed that climatic factors enhance vegetation suitability in the YRB, whereas the influence of human activities on vegetation suitability is dependent on specific circumstances [8]. Excessive human activities will interfere with vegetation suitability, such as over-irrigation and over-fertilization [9], economic density [10], and gross domestic product [11]. Scientifically driven vegetation restoration is crucial for promoting socioeconomic development in the basin to mitigate the YRB’s ecological fragility.
The potential contributions of this paper are multifaceted. Firstly, historically, scholars have often concentrated on segmenting research areas, focusing primarily on specific river basins or sections. This research tended to explore the impact of natural factors or human activities on vegetation while overlooking the similarities and differences in economic density. Therefore, it is imperative to examine vegetation coverage while considering regional heterogeneity from an economic density perspective. This involves comparing and analyzing the economic development and resource endowment of different regions. Secondly, previous studies have predominantly taken a macro perspective when discussing the influence of socio-economic factors on vegetation coverage. Despite a general consensus within the academic community, further research is needed to delve deeper into the depth and specific mechanisms of this influence. Thirdly, in terms of index selection, many scholars have focused on factors such as economic development level, industrial structure, and economic development speed. However, there is limited research on the relationship between economic density and vegetation coverage. In this study, we integrate three primary indicators—social development factors, land use factors, and climate factors—along with nine secondary indicators, comprehensively considering various aspects. This approach minimizes the impact of external factors on experimental results.
The YRB encompasses diverse landscapes, ranging from densely populated urban areas to rural agricultural regions, spanning multiple provinces. Understanding the relationship between economic density and vegetation cover in this vital watershed is crucial for informing sustainable development strategies, environmental conservation efforts, and land use planning initiatives. This study utilizes data from the 7th to 9th National Forest Resource Inventory and ArcGIS (version 10.8) software to analyze the spatio-temporal patterns of economic density and vegetation cover changes across 448 counties in the YRB. We employ a two-way fixed effects model to investigate the impact of economic density on vegetation cover, explore underlying mechanisms, and identify spatial variations in these impacts. Based on the findings, actionable recommendations are proposed to enhance ecological protection and support the socioeconomic development of the YRB.
The structure of the paper is as follows: The second part comprises the literature review, followed by the third part detailing the materials and methods, including an introduction to the study area, data sources, the Fraction of Vegetation Cover (FVC) index system, ArcGIS spatial analysis, two-way fixed effects model, and variable selection. The fourth part presents the empirical results, followed by the discussion in the fifth part, and concluding remarks in the sixth part.
2. Literature Review
As the paramount socio-economic center in northern China and a traditionally delicate ecological zone, changes in vegetation coverage within the YRB have consistently captured the attention of scholars. However, previous studies have predominantly focused on specific river basins or sections. For instance, in the Gansu section of the YRB, vegetation cover has exhibited a continuous decline from the southwest to the northeast between 2000 and 2018 [12]. In the Henan section, areas with high and medium-high vegetation cover are predominantly concentrated in the western Funiu Mountain, northern Taihang Mountain, and eastern plain areas. Conversely, regions with medium, medium-low, and low vegetation cover are mainly found in the central Luoyang to Zhengzhou section, with bare land primarily distributed along the water system and both sides of the YRB [13]. The Inner Mongolia section, situated in an arid-semiarid region, relies on groundwater for vegetation, and increased rainfall stands as the primary driver for heightened vegetation cover [14]. In the Shanxi section, the most notable increase in vegetation cover occurs in the reforestation (grass) areas in the north of Shanxi [15]. Evidently, substantial variations in vegetation cover exist across different sections of the YRB.
In terms of influencing factors, climate change emerges as a crucial element affecting vegetation growth, while human activities also wield influence on changes in vegetation cover, often with predominant negative effects. However, there are periods where positive effects become more pronounced [16,17]. Specifically, in the middle section of the YRB, vegetation cover demonstrates a positive correlation with precipitation and temperature. The impact of topographic factors on vegetation cover is primarily manifested through elevation and slope. As elevation and slope increase, vegetation cover experiences an initial rise followed by a subsequent decline. Under diverse topographic conditions, vegetation cover appears to be more influenced by temperature than rainfall. From 2000 to 2002, the FVC of the urban agglomeration in central Yunnan showed an overall improvement trend, with an average value of 0.496 and an annual growth rate of 0.0024, showing a temporal and spatial distribution of high in the west and low in the east, while human activities had a positive impact on its FVC, accounting for 55.1% of the regional proportion [18]. Vegetation cover stands as a primary indicator of ecosystem alterations, and understanding vegetation dynamics and their responses to both natural and anthropogenic factors play a pivotal role in enhancing ecosystem structure and function amid the backdrop of global warming [19].
Regarding research methodologies, previous research has utilized various indicators to measure vegetation cover, encompassing FVC [20], Ecological Vulnerability Index (EVI) [21], MODIS NDVI vegetation index [22,23], Moran’s index and coefficient of variation [24], and Ratio Vegetation Index (RVI) [25], among others. These indices provide a comprehensive framework for monitoring vegetation dynamics and offer critical insights for environmental management and conservation strategies. Various statistical approaches, such as the Dimidiate Pixel Model, linear regression, mean method, partial correlation analysis, and regression residual method, have been employed for spatio-temporal analyses of vegetation cover in the YRB [26,27,28]. Geographic detectors are commonly utilized to analyze the driving factors behind spatio-temporal changes in vegetation cover [29]. Existing studies have predominantly concentrated on vegetation cover changes within specific sections of the YRB, with limited research encompassing the entire basin. Therefore, the comparability of research conclusions necessitates further examination. Additionally, current studies on the influencing factors of vegetation cover tend to adopt a more macroscopic approach. While scholars generally agree on the impact of socio-economic factors on vegetation cover, further exploration is required to understand the extent and mechanisms of this impact.
Economic density refers to the concentration of labor, population, and tangible capital in a specific area, reflecting the efficient operation of economic activities and the intensive utilization of land resources. Various factors such as population, land, production, basic environmental conditions, transportation infrastructure, socio-economic infrastructure, industrialization level, structure, and regional economic development strategy and policies contribute to measuring the overall economic density level [30]. In the Yangtze River Delta, the quality of human capital has notably improved, attributed mainly to advancements in human capital levels, urbanization promotion, foreign direct investment influx, and economic scale expansion [31]. This has led to enhanced economic prosperity and ecological health in the YRB, signifying a high degree of coordination and balance between economic development and environmental protection [32]. The harmonious coexistence of economic development and ecological environment bodes well for the region’s socioeconomic development. The ecological status of the YRB has shown a trend of initial decline followed by improvement, indicating a correlation between ecological environment enhancement and economic development. However, significant disparities exist in ecological coordination among different regions, with light intensity being linked to urban economic development levels, showing a consistent upward trajectory [33]. Furthermore, scholars have evaluated economic development and ecological situations, as well as the coupling degree, in the YRB based on economy, energy consumption, ecology, and water resources [34]. Given the critical ecological protection and socioeconomic development role of areas such as the YRB in China, economic development, albeit progressing towards in a good direction, advances at a relatively slow pace. Notably, the reduction in resource and environmental pressures suggests a relaxation of the coupling relationship between economic growth and resource utilization, with the environmental decoupling index significantly influencing the overall decoupling scenario [35]. In China, achieving the coordinated development of the industrial economy, resource conservation, and environmental protection has become imperative for promoting ecological civilization construction and socioeconomic development [36]. The eco-economic coordination model serves as an effective tool for evaluating the consistency between ecosystem value and economic growth, often measured by gross domestic product. From 2001 to 2015, the ecological carrying capacity of the YRB exhibited a unique changing trend, with the total ecological carrying capacity and ecological carrying capacity per unit area showing a “U” pattern. While about 55.6% of the region experienced an increase in ecosystem service value (ESV), ESV decline was mainly concentrated in the western and northern regions of the basin, illustrating the complex interplay between economic development and ecological protection in the YRB [37]. As an indicator of efficient economic activity and intensive land resource utilization, economic density comprehensively reflects various economic aspects through indicators such as labor concentration, population density, capital investment, land utilization rate, gross domestic product, and industrial structure. This provides a comprehensive and in-depth perspective for evaluating regional economic development. Given the YRB’s significance as an ecological protection and socioeconomic development experimental area, special attention to the coordinated relationship between economic development and the ecological environment is necessary to achieve sustainable development.
In terms of economic density and vegetation coverage, the Vegetation Coverage Rate (VFC) stands as a critical global indicator used to assess land use changes, ecosystem health, and landscape characteristics. It quantifies the ratio of vegetation to land surface, offering insights into land use alterations, vegetation distribution shifts, and ecosystem functionality enhancements [38]. Economic density is intertwined with factors such as wages, innovation, rent, accessibility to amenities, public service provision costs, transportation, and environmental conditions [39]. Furthermore, economic density indirectly influences vegetation coverage trends through urbanization, vegetation types, gross domestic product, and population density. For instance, urban economic density serves as a robust measure of a city’s economic scale and elucidates the drivers behind rapid urbanization efforts in the region. Against the backdrop of global urbanization, vegetation coverage in urban areas is undergoing transformations. While vegetation coverage is generally declining in the southern hemisphere, it is increasing in eastern North America and certain European urban locales. Moreover, numerous urban areas with high vegetation coverage are witnessing expansion [40]. Changes in vegetation coverage in the urban core and peripheral areas (buffer zones 5 km, 10 km, and 15 km away from the urban core) correlate with variations in urbanization rates, gross domestic product, population density, and urban development stages among cities [41]. Despite their advantageous geographical locations, urban expansions result in an overall loss of vegetation. However, San Diego’s urban dynamic index has risen, albeit with only a slight increase in vegetation coverage in its urban core area [42]. In the Qaidam Basin, vegetation coverage varies across different vegetation types. The Vegetation Classification Inversion (VCI) can estimate the Fraction of Vegetation Cover (FVC). In areas with relatively high vegetation coverage density (FVC > 60%), the empirical model (EM) for mixed vegetation FVC estimation differs from that of mixed vegetation inversion (VMI). Pixel Decomposition Model (PDM)-derived VCI yields lower inversion values for very low-density vegetation cover (FVC ≤ 10%) and higher inversion values for high-density vegetation cover (FVC > 80%) [43]. Nevertheless, research on whether economic density directly impacts vegetation coverage remains nascent and necessitates further development. Through a thorough investigation of this relationship, we can better strike a balance between economic development and the ecological environment, ultimately achieving sustainable social and economic development.
In conclusion, previous studies predominantly focused on segmented research areas, particularly specific river basins or sections, often discussing the impact of natural factors or human activities on vegetation while neglecting differences in economic density. To comprehensively understand vegetation coverage, it is crucial to fully consider regional heterogeneity from the perspective of economic density and conduct a detailed analysis of the region’s economic development and resource endowment. Moreover, although past studies have analyzed the impact of socio-economic factors on vegetation coverage from a macro level, further exploration is needed to delve into the deep-seated and specific mechanisms of this impact. Investigating the internal logic of this relationship can reveal its essence more comprehensively. Additionally, while many scholars focus on indicators such as economic development level, industrial structure, and economic development speed, research on economic density and vegetation coverage is relatively scarce. Hence, this paper integrates social development, land use, and climate and selects nine secondary indicators—including the proportion of primary and secondary industries—to enhance the comprehensiveness of the study and reduce the influence of external factors on experimental results. Furthermore, previous research data have been relatively macroscopic and rough, necessitating improved data accuracy. In this paper, is employed to ensure data accuracy based on forest resource inventory and socio-economic data from 448 counties in 2008, 2013, and 2018. Lastly, regarding the research method, the two-way fixed effects model adopted herein can simultaneously model causal and reverse relationships, providing a comprehensive perspective on the influence between variables. This model not only addresses endogeneity issues but also fully considers individual and time heterogeneity, thereby enhancing the accuracy and reliability of research results.
The effects of economic density on vegetation coverage are analyzed in this paper based on forest resource inventory and socio-economic data from the YRB in 2008, 2013, and 2018. ArcGIS software is employed, utilizing the existing literature to analyze the spatio-temporal patterns of economic density and vegetation cover changes in the YRB, with a two-way fixed effects model utilized to analyze the relationship between economic density and vegetation cover. Through result analysis and comparison with relevant scholars’ research conclusions, suggestions for economic development and ecological protection in the YRB and other areas are proposed. The research hypotheses in this paper are as follows:
Hypothesis 1:
economic density in the YRB exhibits a negative correlation with vegetation cover.
Hypothesis 2:
economic density varies in its impact on vegetation cover across different watersheds.
The YRB spans a total length of 5464 km, with a water surface difference of 4480 m and a total basin area of 795,000 km2. The geographical landform, climate, and ecological environment of the upper, middle, and lower reaches significantly differ, manifesting varying degrees of conflict between human activities and ecological preservation across different sections. In the upper reaches, characterized by steep terrain, soil erosion, and desertification pose significant challenges. Prolonged periods of excessive human activities, irrational agricultural practices, and overgrazing have resulted in extensive soil erosion and desert encroachment. Conversely, the downstream areas exhibit high levels of urbanization, with industrial and mining activities surrounding urban centers leading to significant river pollution. Rapid urbanization exacerbates environmental degradation, marked by land overexploitation and indiscriminate logging.
The YRB spans nine provinces in China, with downstream regions experiencing higher population densities. Increased human activities, particularly urbanization, contribute to forest degradation. This study considers economic density as the core explanatory variable to test the aforementioned hypotheses and incorporates nine control variables, such as social development, land use, and natural factors. The study utilizes ArcGIS software spatial analysis and a two-way fixed effects model to analyze forest resource inventory data from 2008, 2013, and 2018, exploring the influence of economic density and other variables on vegetation cover across different areas of the YRB.
3. Materials and Methods
3.1. Study Area
The YRB is situated between 96° E and 119° E, 32° N and 42° N [44]. By the end of 2021, the total population of the YRB will be 420.63 million, accounting for 29.14% of China, while Gross Domestic Product is USD 396634 × 104, accounting for 25.08%; the forest area is 7.32 × 10⁷ hm2, accounting for 31.72%; the forest stock is 4.60 × 10⁸ m3, accounting for 26.22%. The topography of the region exhibits higher elevations in the west, with the average elevation in the western source area surpassing 4000 m, and lower elevations in the east, ranging from 1000–2000 m in the central area [45]. The YRB, spanning 19% of China’s land area, the YRB is divided into three basins: upstream, middle and downstream (refer to Figure 1), traverses nine provincial-level administrative regions: Qinghai, Sichuan, Gansu, Ningxia, Inner Mongolia, Shaanxi, Shanxi, Henan, and Shandong. Within the basin, there are 168 counties in the upper reaches, 219 in the middle reaches, and 61 in the lower reaches (refer to Appendix A). The basin exhibits three distinct climate zones: the plateau climate zone, the temperate zone, and the warm temperate zone [46]. Water resources within the basin are inherently scarce, characterized by an average annual precipitation of less than 450 mm and notable regional differences in average temperatures [47]. The vegetation coverage in the YRB generally exhibits a distribution feature with high coverage in the southeast and west and lower coverage in the northeast and north [48]. The primary land use types contributing to vegetation coverage include forest land, grassland, and cultivated land [49]. Population growth, land reclamation, deforestation, and urbanization have hastened the exploitation of land and water resources in the YRB, presenting significant challenges to ecosystem restoration in recent decades.
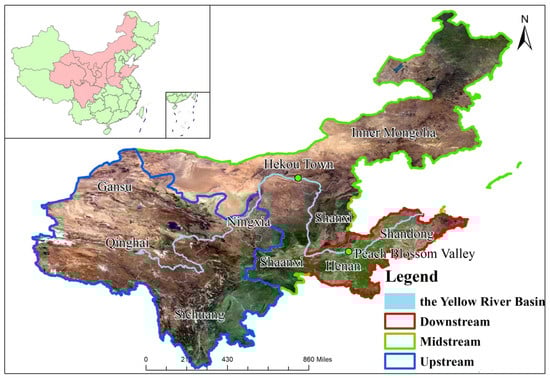
Figure 1.
Map of the study area. In the regional map of China above, pink represents the YRB and green represents other regions. The boundary point between the middle and upper reaches of the YRB is Hekou Town, Toktuo County, Inner Mongolia Autonomous Region, and the boundary point between the middle and lower reaches of the YRB is Taohuayu, Xingyang County, Zhengzhou City, Henan Province.
3.2. Data Sources and Variable Selection
3.2.1. Data Sources
Vegetation cover: Vegetation cover data are sourced from the forest inventory data in periods 7–9 (2008, 2013, 2018). The vegetation cover level for each county is calculated utilizing the weighted average method based on the sample plot data.
Economic and social development: data from the China County Statistical Yearbook.
Land use: land use data is extracted from the datasets of 2008, 2013, and 2018, as released by the Resource and Environmental Science Data Center of the Chinese Academy of Sciences.
Climate: climate data are obtained from the World Climate Database (https://www.worldclim.org/, accessed on 12 January 2024).
3.2.2. Variable Selection
- (1)
- Explained variable: vegetation cover. Vegetation cover, an essential indicator for gauging regional ecological changes, typically denotes the ratio of forest area to the total land area [50]. As a widely used indicator of vegetation response, it mirrors the growth status of surface vegetation and serves as a measure for regional ecological environment changes [51]. Thus, this study adopts the vegetation coverage of each county (district) as the dependent variable for the empirical model.
- (2)
- Core explanatory variable: The correlation between socio-economic factors and vegetation cover or land use change in urban systems has garnered escalating interest [52]. Thus, delineating the relationship between socio-economic indicators and vegetation cover assumes pivotal significance in enhancing both socio-economic development and ecological environments. Economic density: This study investigates the influence of economic development levels on vegetation coverage, selecting economic density as the key measure based on previous research findings. “Economic density” refers to the measure of economic activity per unit area of land, often quantified as the output value per square kilometer of land. It is typically calculated as the gross regional product divided by the administrative area (billion yuan/km2). Beyond measuring the efficiency of economic activities and land use intensity in a city, economic density also represents the intensity of economic activities within a region [53]. Moreover, it serves as a crucial foundation for devising regional policies and evaluating implementation processes [54]. Consequently, this article designates the economic density of each county (district) as the core explanatory variable.
- (3)
- Control variables: Previous studies indicate that, apart from economic density, numerous factors can influence the vegetation coverage of each county (district). This article establishes three primary indicators by building upon prior research conclusions [55]: social development factors, land use factors, and natural factors. Corresponding secondary indicators are constructed, encompassing the proportion of the primary industry, the proportion of the secondary industry, population density, urbanization rate, forest protection level, proportion of cultivated land area, proportion of construction land, annual precipitation, and monthly average temperature. Specific variable descriptions are outlined in Table 1.
 Table 1. Description of variables.
3.3. Methods
3.3.1. ArcGIS Spatial Analysis
Spatial analysis involves the manipulation of geospatial information using geographic technology and associated mathematical models. It encompasses a set of functions that describe spatial correlations within and beyond a single dataset. In recent years, GIS technology has assumed an increasingly pivotal role in surveying and data processing. ArcGIS software, being a well-established GIS software, holds the highest market share and popularity in the industry [56]. It boasts robust tools and functionalities for map production and analysis. This study employs ArcGIS software to process forest resource inventory data from the 7th to 9th periods, extracting vector data. Subsequently, it conducts an analysis of the vector data pertaining to vegetation coverage and economic density in the YRB.
3.3.2. Two-Way Fixed Effects Model
This study employs a two-way fixed effects model for fundamental regression analysis to assess the extent of the influence of socio-economic activities on vegetation cover in the YRB [57]. The two-way fixed effects model is a statistical technique primarily utilized for panel data analysis. It excels in managing inter-regional heterogeneity that remains constant over time, effectively mitigating biased coefficient estimation arising from omitted variables.
The equation of the model is as follows:
where denotes the vegetation cover of the 448 counties in the YRB, is the economic density of each county (district), and is the main coefficient under observation in this study, representing the coefficients reflecting the influence of socio-economic development on vegetation cover. denotes the control variables, encompassing variables that may impact vegetation cover, excluding the level of socio-economic development. represents the individual effect, which remains constant over time, represents the time-fixed effect, unchanging based on individual differences between cities, and denotes the random interference term. This paper’s data analysis is grounded in panel data, and hence, the two-way fixed effects model is utilized for analysis. This approach offers advantages such as improved accuracy in observations.
4. Results
4.1. Spatial-Temporal Evolution of Vegetation Cover and Economic Density
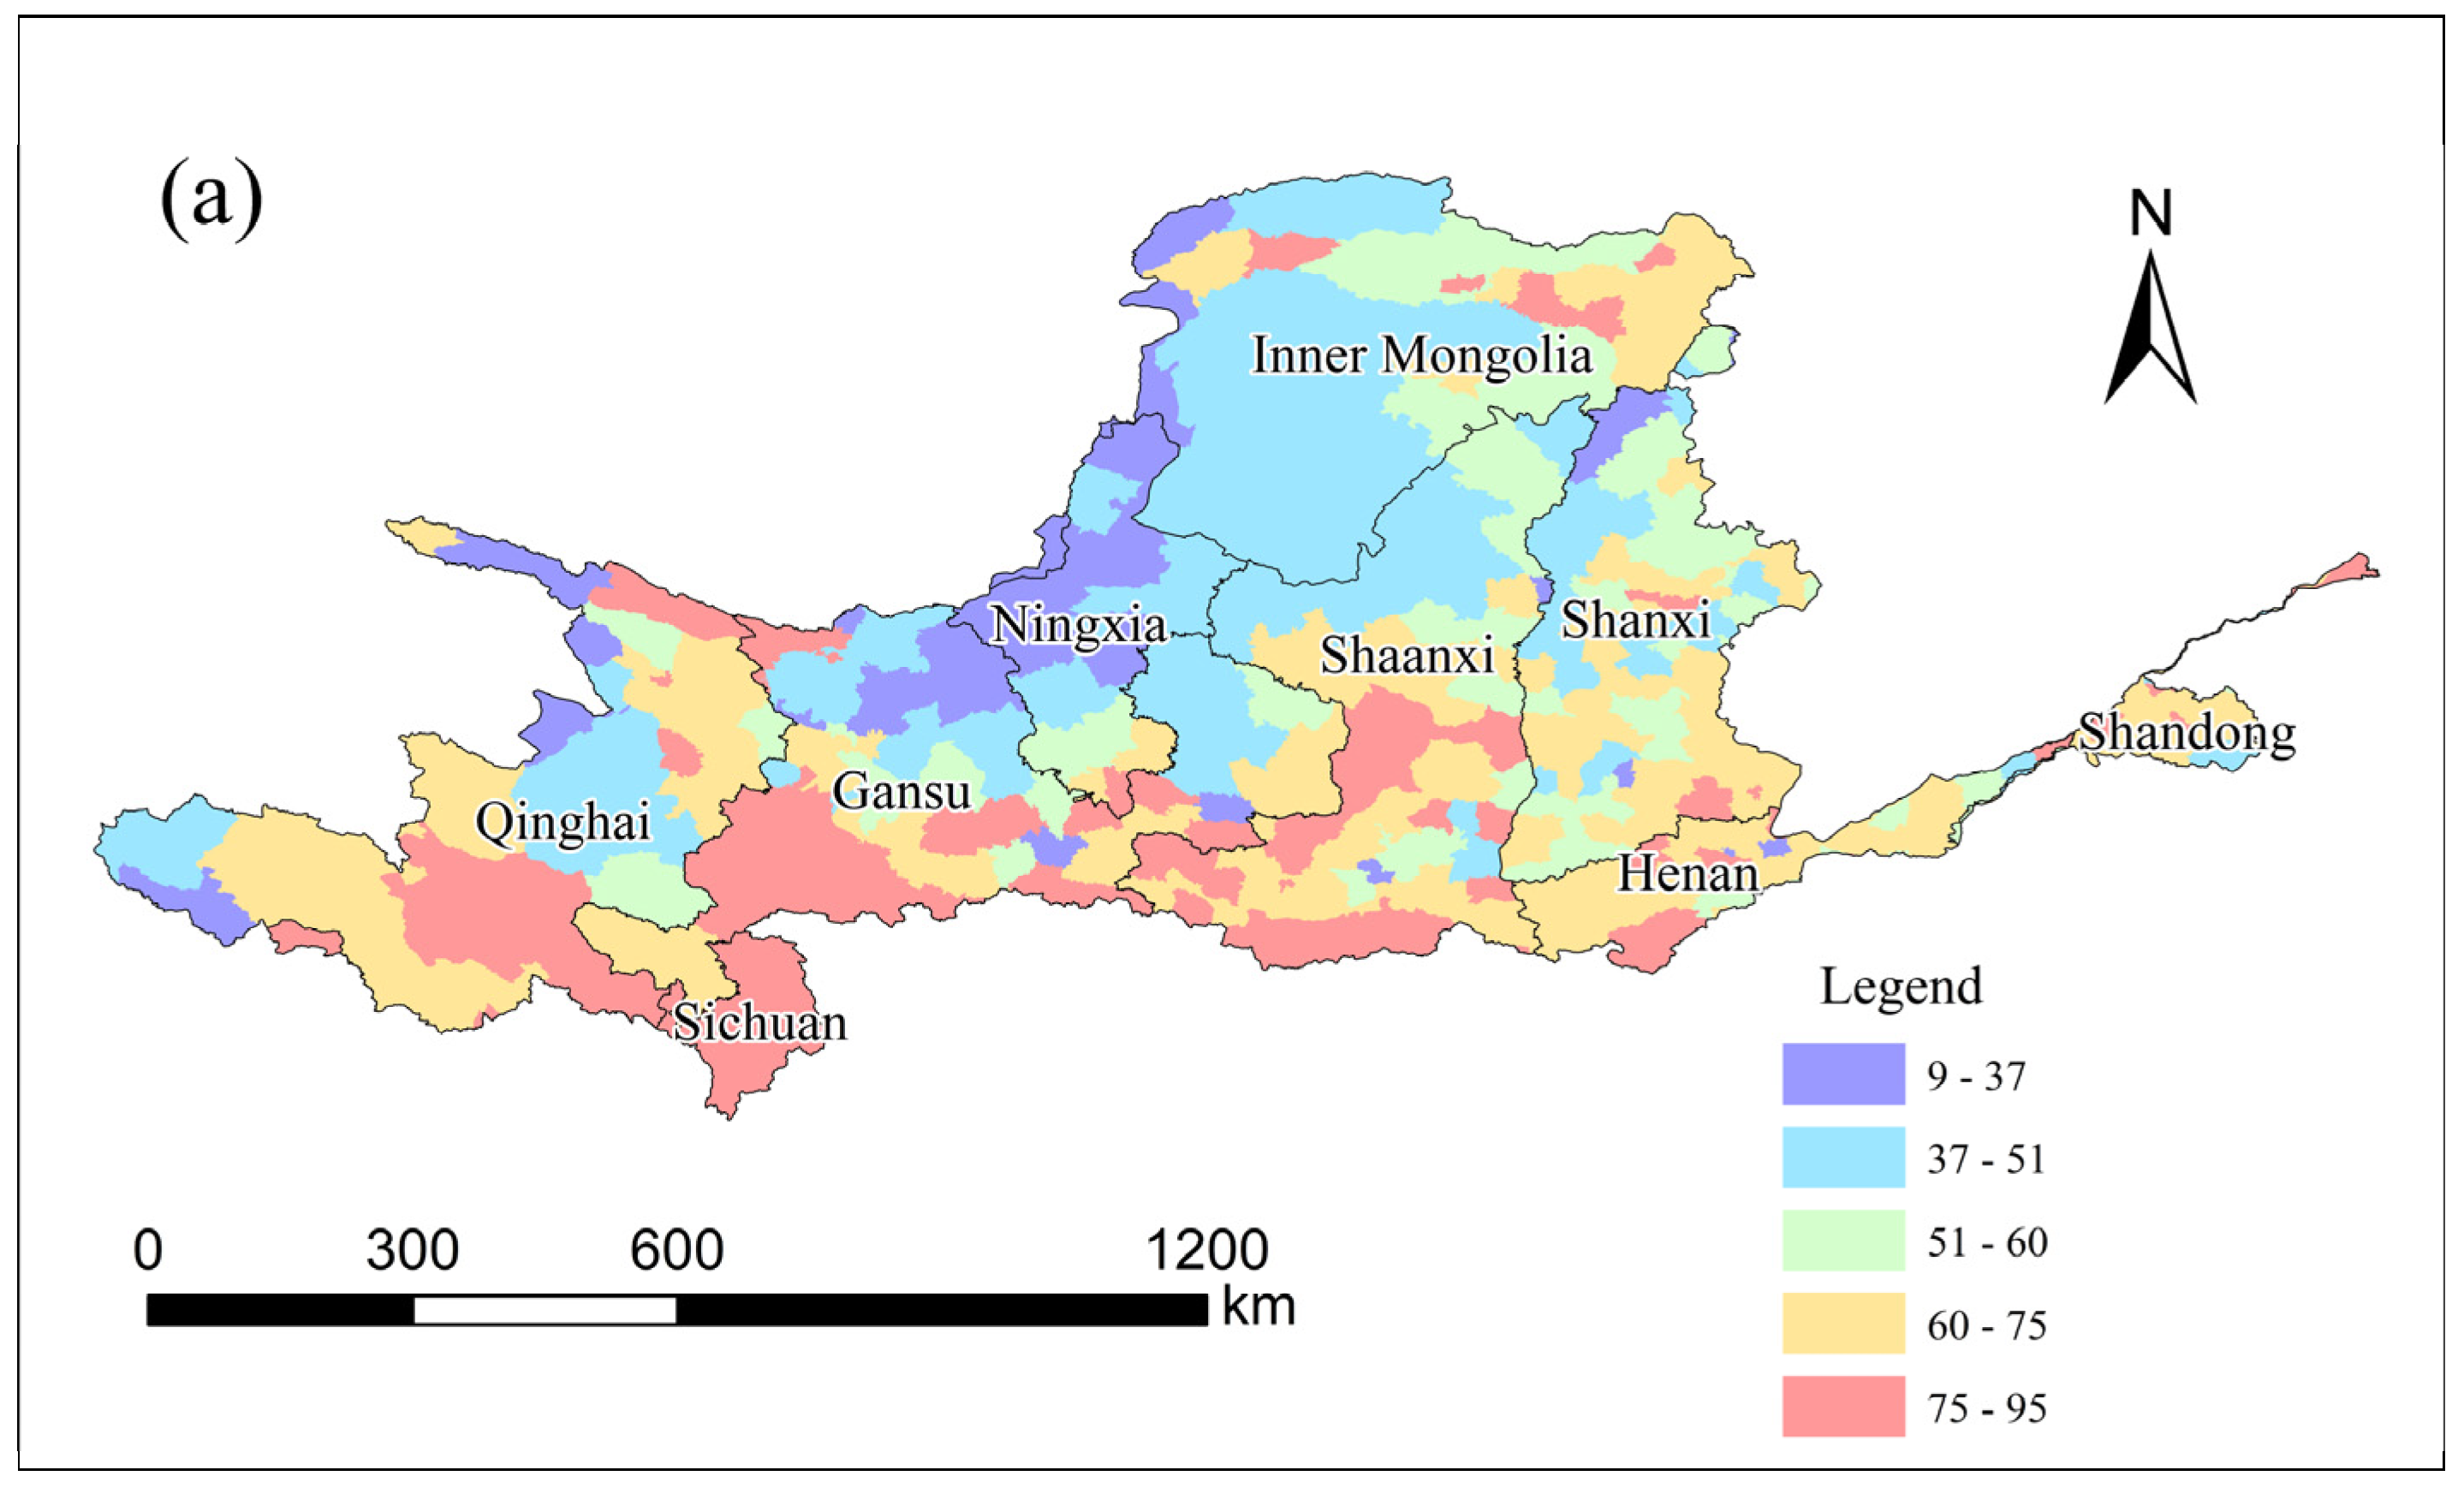
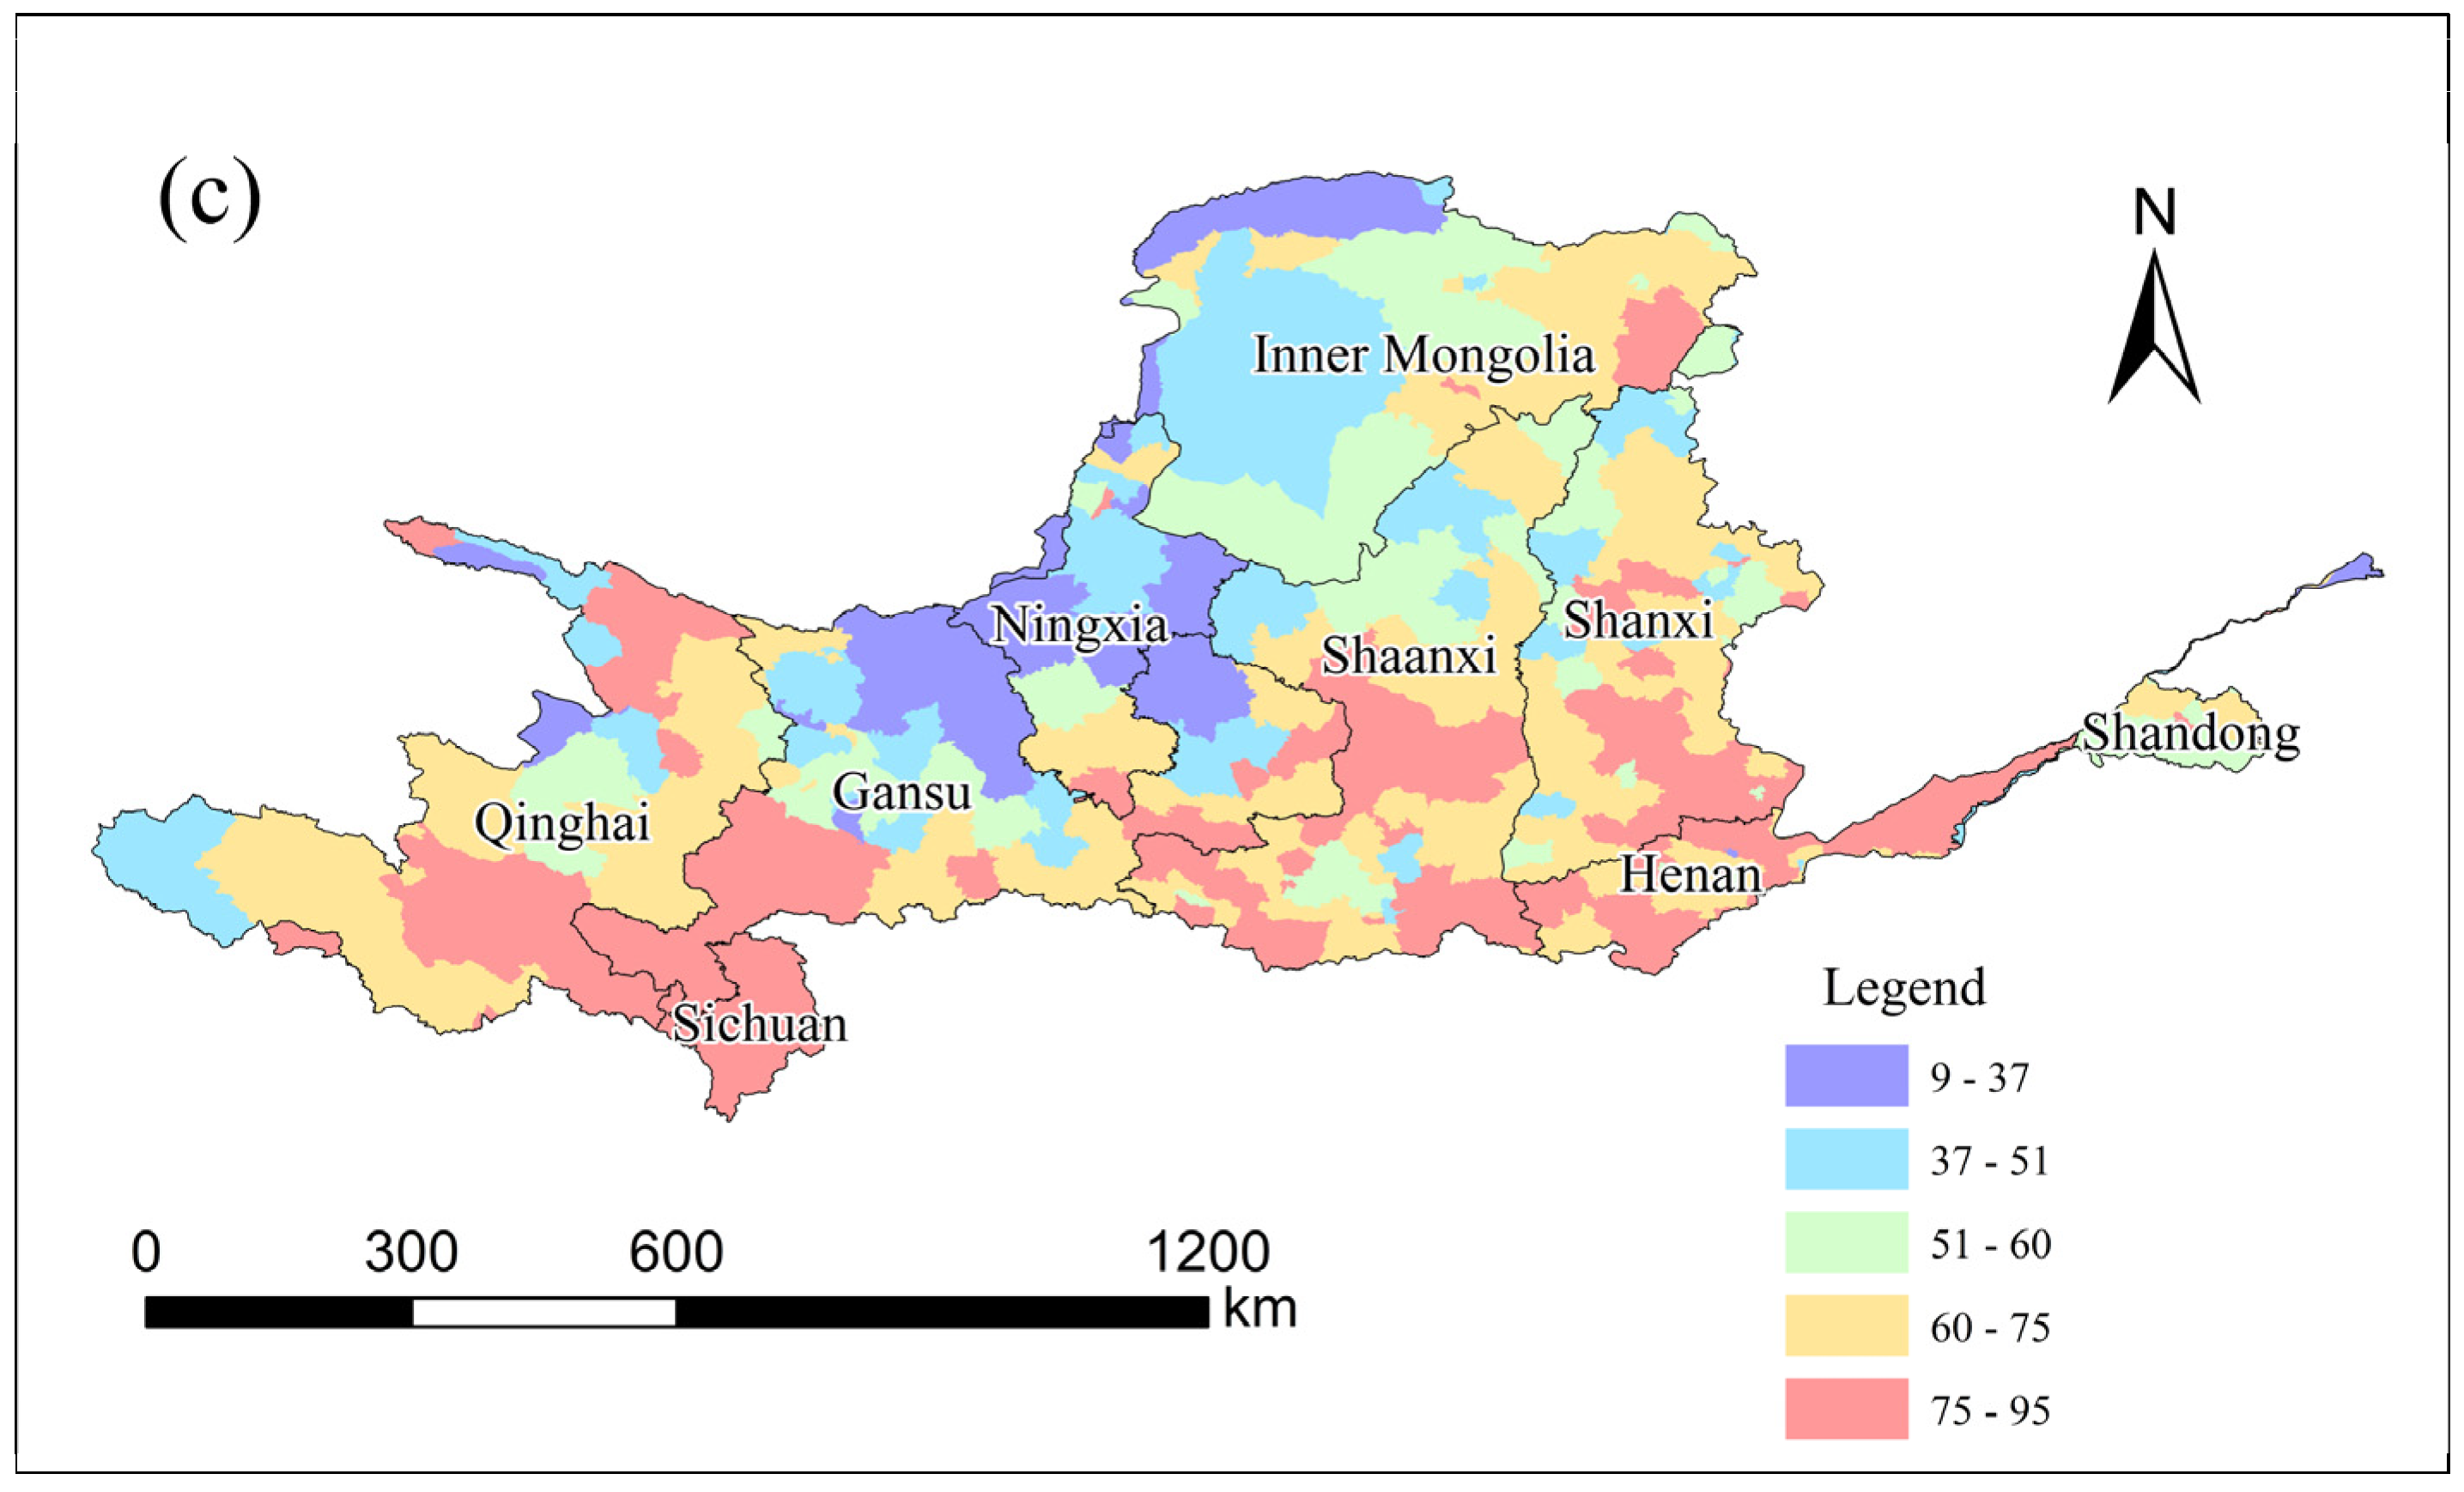
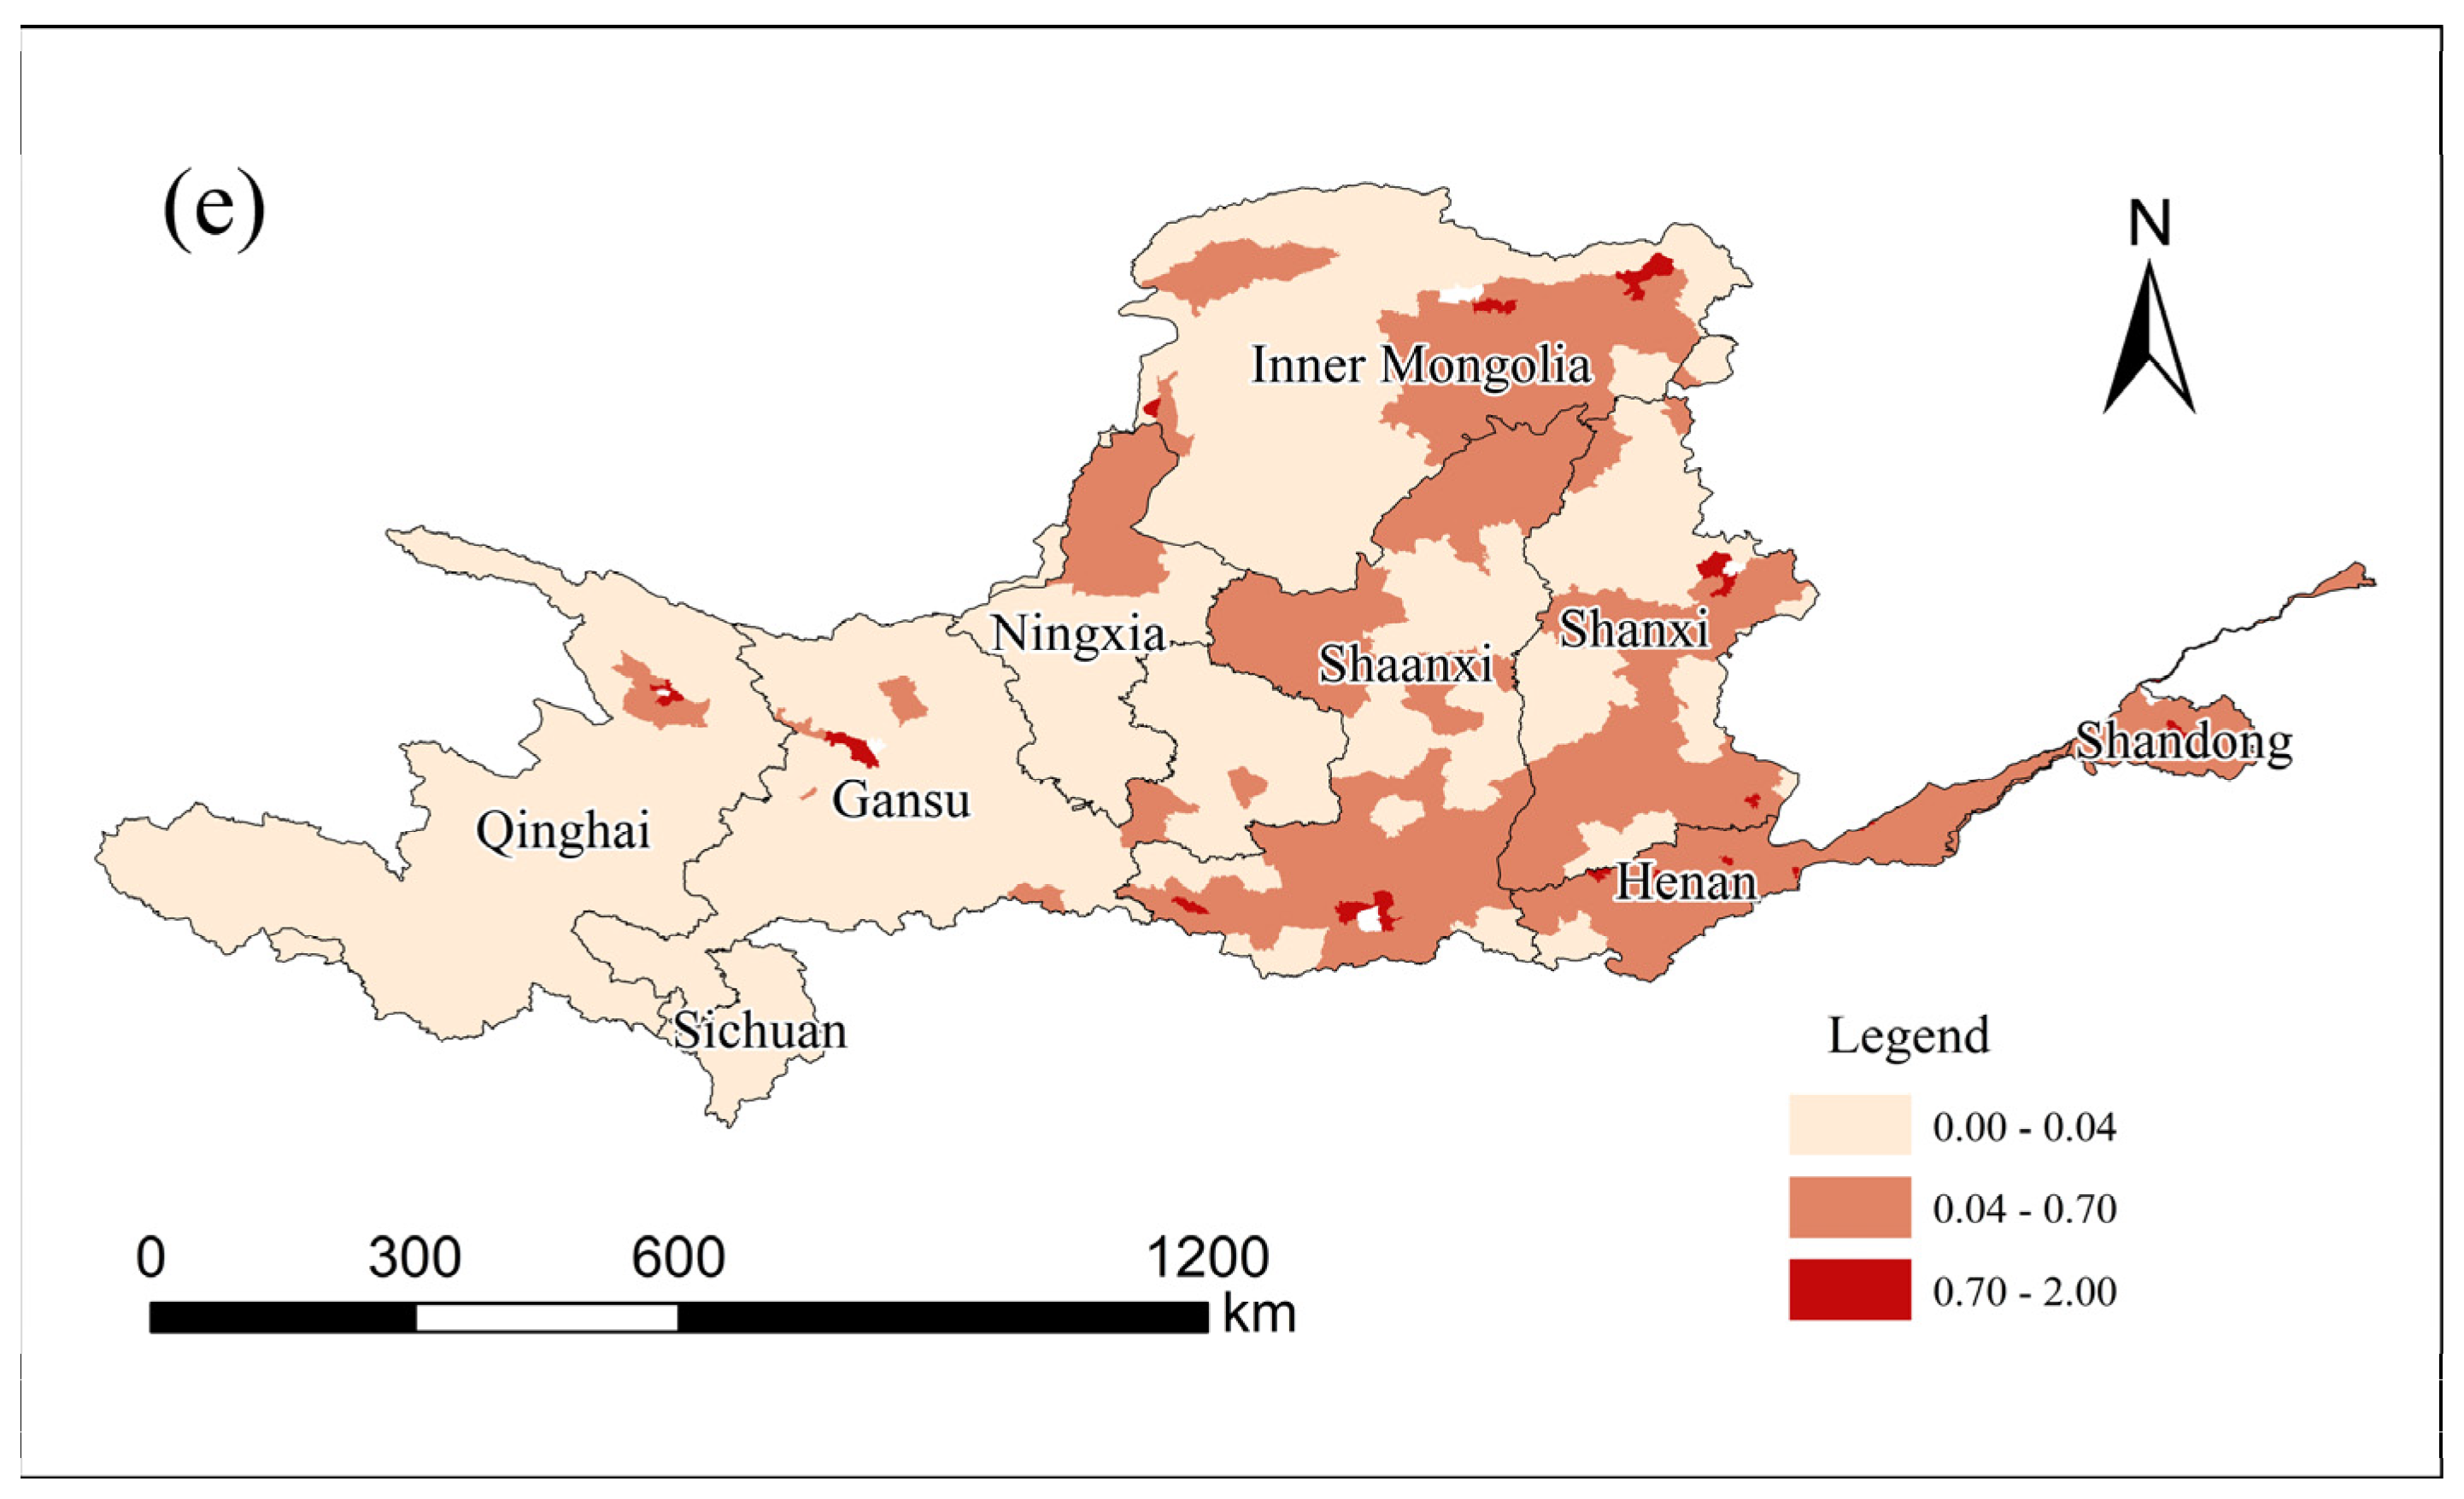
This study delves into the spatio-temporal evolution patterns of vegetation coverage and economic density in 2008, 2013, and 2018, as illustrated in Figure 2, Figure 3, Figure 4, Figure 5, Figure 6 and Figure 7. Figure 2, Figure 3 and Figure 4 depict the spatiotemporal evolution patterns of vegetation coverage in 2008, 2013, and 2018. Figure 5, Figure 6 and Figure 7 depict the spatiotemporal evolution patterns of economic density in 2008, 2013, and 2018.
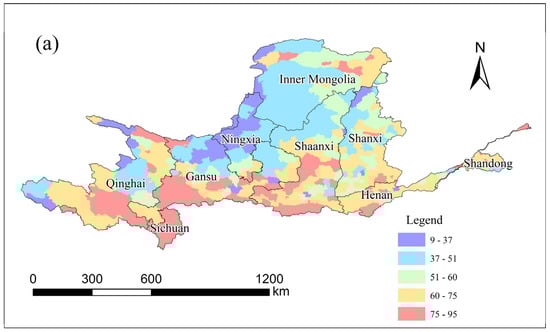
Figure 2.
Spatio-temporal pattern of vegetation cover from 2008.
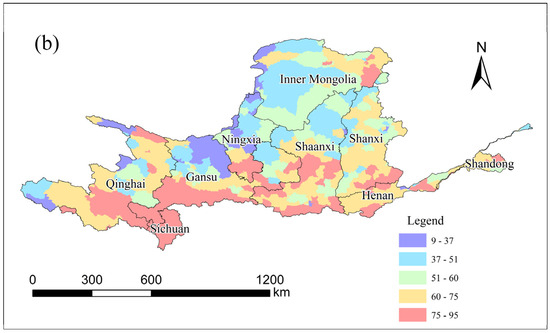
Figure 3.
Spatio-temporal pattern of vegetation cover from 2013.

Figure 4.
Spatio-temporal pattern of vegetation cover from 2018.
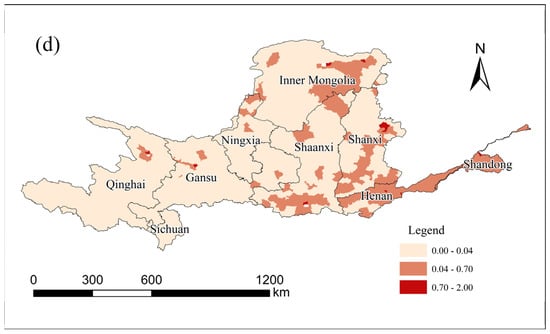
Figure 5.
Spatio-temporal pattern of economic density from 2008.
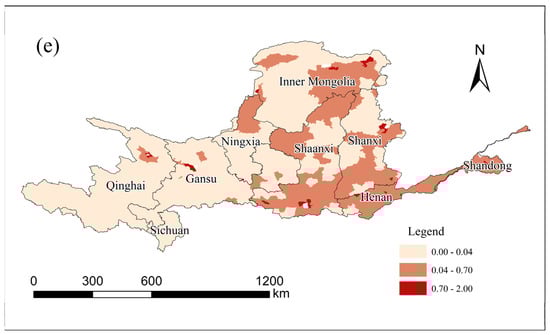
Figure 6.
Spatio-temporal pattern of economic density from 2013.
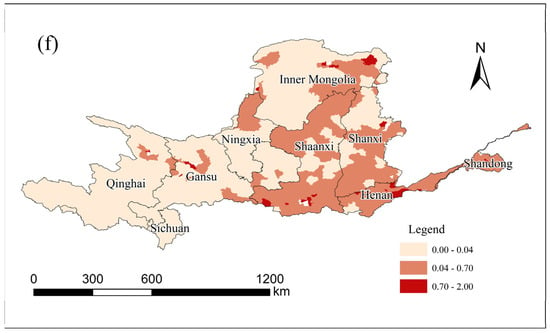
Figure 7.
Spatio-temporal pattern of economic density from 2018.
Vegetation cover serves as a reliable measure of an area’s ecological environment [58]. The analysis results reveal that in 2008, certain regions in the middle and upper reaches of the YRB exhibited low vegetation cover. However, as the government increasingly prioritizes ecological environment protection and various ecological projects are gradually implemented, there has been a significant improvement in vegetation cover in the middle and upper reaches of the YRB over the 10-year period from 2008 to 2018. Particularly noteworthy is the sustained high vegetation cover in certain counties and cities in Sichuan and Qinghai, with a more concentrated distribution of areas with elevated vegetation cover. In 2008, the vegetation cover in the lower reaches of the YRB was relatively robust, with some counties and cities in Henan Province exceeding 75%. However, over the past decade, the vegetation cover in the lower reaches of the YRB has experienced a noteworthy decline compared with the previous period. The number of areas with higher vegetation cover has become scarce in this region.
In terms of spatial distribution, the economic development in the middle and lower reaches of the YRB is more pronounced, particularly in Shandong and Henan, where economic density exhibits a substantial difference compared to the other seven provinces. Over the period of 2008 to 2018, the regions within the YRB witnessed rapid economic development, marked by a significant increase in economic density compared with the preceding period. In the middle reaches of the YRB, the economic level has experienced a substantial and notable increase in the past decade. The economic development of the lower reaches continues to maintain a high growth rate, with a more concentrated distribution of areas characterized by high economic density. However, the upper reaches of the YRB are developing at a slower pace, and the distribution of areas with high economic density is more dispersed.
As illustrated in Figure 2, Figure 3, Figure 4, Figure 5, Figure 6 and Figure 7, there exists a correlation between the temporal and spatial changes in economic density and vegetation coverage. As economic density continues to rise across various regions of the YRB, vegetation coverage has, to some extent, experienced a decrease. The subsequent discussion employs a two-way fixed effects model to provide a more intuitive description of the relationship between economic density and vegetation coverage in diverse regions of the YRB.
4.2. Regression Results
In this section, the fixed effects model is applied to examine the forest resource inventory data in the YRB. Following a comprehensive analysis of the YRB, the study further divides it into three segments: upstream, midstream, and downstream. The outcomes of this analysis are presented in Table 2.
Table 2.
Regression results.
Simultaneous with socio-economic development, it exerts a certain impact on vegetation coverage in various regions [59]. Owing to substantial differences in economic development levels and quality among counties in the YRB, the influence of economic density on vegetation coverage also varies. According to the results of the regression analysis covering the entire basin, the economic density of each county in the YRB exhibited a negative impact on vegetation coverage from 2008 to 2018. The correlation coefficient of economic density is −1.108, indicating a particularly significant impact on the dependent variable, vegetation coverage. Every increase of 1 km2 in land output value corresponds to a 1.108% decrease in vegetation coverage. There was no significant correlation between economic density and vegetation coverage in the upper and lower reaches of the YRB from 2008 to 2018 after analyzing the watershed-specific regressions. However, a significant negative correlation was observed between economic density and vegetation coverage in the middle reaches of the YRB. For every 1 km2 increase in land output value, vegetation coverage experiences a decrease of 1.103%. This suggests that the economic density in the middle reaches of the YRB has the most substantial impact on vegetation coverage, resulting in a negative correlation between economic density in the YRB and vegetation coverage.
Considering the control variables, it is evident that the proportion of the primary industry, urbanization rate, forest protection level, and cultivated land area in the entire YRB significantly impact vegetation coverage. Specifically, in the following:
Every 1% increase in the proportion of the primary industry results in a 0.114% increase in vegetation coverage; every 1% increase in the urbanization rate leads to a 0.095% increase in vegetation coverage; every 1 unit increase in the forest land protection level corresponds to a 2.165% decrease in vegetation coverage; every 1% increase in the proportion of arable land leads to a 0.120% increase in vegetation coverage.
Moreover, there is a notable correlation between the proportion of the primary industry, annual precipitation in the upper reaches of the YRB, and vegetation coverage. Specifically, in the following:
Every 1% increase in the proportion of the primary industry results in a 0.197% increase in vegetation coverage; every 1 mm increase in annual precipitation leads to a 0.024% increase in vegetation coverage.
In the middle reaches of the YRB, economic density, urbanization rate, forest protection level, and the proportion of cultivated land area also exhibit significant correlations with vegetation coverage. Specifically, in the following:
Every 1 km2 increase in land output value leads to a 1.103% decrease in vegetation coverage; every 1% increase in the urbanization rate results in a 0.145% increase in vegetation coverage; every 1 unit increase in the forest land protection level corresponds to a decrease of 3.364% in vegetation coverage; every 1% increase in the proportion of arable land leads to a 0.224% increase in vegetation coverage.
4.3. Robust Test
This paper employs a variable replacement method to conduct a robustness test on the original basic regression model to enhance the robustness and credibility of the research findings. The core variable, economic density, is replaced by a comparable variable, GDP (the final outcome of production activities in the region over a certain period of time), for a two-way fixed effects model test. The regression results obtained are presented in Table 3.
Table 3.
Robustness test results.
The results indicate that the correlation coefficient of the replaced core variable GDP is negative, and it has a significant impact on the explained variable, vegetation coverage. Therefore, the economic development level of the entire basin and the middle reaches of the region align with the basic regression results in terms of direction and significance.
5. Discussion
5.1. Analysis of Spatio-Temporal Pattern
5.1.1. Vegetation Coverage Trend
From 2008 to 2018, the upper reaches of the YRB experienced a significant increase in vegetation coverage, with notable improvements in regions like Ningxia Hui Autonomous Region and Gansu. However, some areas, such as Sichuan, Gansu, and Qinghai, maintain high vegetation coverage. The middle reaches of the YRB witnessed a significant decrease in vegetation coverage, particularly in areas like Shaanxi and Shanxi, which experienced a substantial decline compared with 2008. Although there was an increase from 2013 to 2018, it remained lower than 2008 levels. The lower reaches of the YRB saw a significant decrease in vegetation coverage, especially from 2008 to 2013. However, there was a certain degree of improvement in vegetation coverage by 2018. Some areas in Henan Province that had high vegetation coverage in 2008 experienced a significant decrease by 2018.
5.1.2. Economic Density Trend
From 2008 to 2018, economic development in the upper reaches of the YRB was relatively slow, significant changes occurred in the overall economic density pattern in the middle reaches, and rapid economic development was observed in the lower reaches, particularly in Shandong and Henan. The YRB has been an agricultural area for a long time in history, and the industrial development started slowly, which has a certain impact on the development of the social economy. The geographical location of this region is relatively harsh, natural disasters such as soil erosion are serious, and the ecological environment is fragile, which brings no small challenge to the development of an urban economy.
5.2. Analysis of the Relationship between Vegetation Coverage and Economic Density
Economic density growth has had a certain impact on vegetation coverage, but the decline in vegetation coverage is attributed to multifaceted factors such as climate change, human activities, and natural disasters [60]. Rapid social and economic development, coupled with human construction activities and the acceleration of industrialization, have led to vegetation destruction. Initiatives like the Grain Greening Project and the Natural Forest Protection Project in the middle and upper reaches of the YRB have promoted vegetation growth [61]. However, despite these efforts, overall vegetation coverage continues to exhibit a downward trend.
5.2.1. The Whole Basin of the YRB
Upon a comprehensive analysis of the YRB, it becomes evident that economic density exhibits a negative correlation with vegetation coverage. The intricate interplay of various factors contributes to the fluctuation in vegetation, with key influences being the proportion of primary industry, urbanization rate, and cultivated land area.
A notable insight arises from the regression findings, suggesting a seemingly negative association between forest protection levels and vegetation coverage. However, a more nuanced interpretation emerges when considering the classification criteria for forest resource inventory’s continuous forest land protection levels. Under the classification standards of forest protection levels in forest resource inventory, there are four levels ranging from I to IV. Interestingly, lower forest protection levels correspond to higher vegetation coverage. The forest resource inventory process entails continuously addressing structural changes in demand for forest products and services, as well as ecological environment protection, in response to social, economic, and environmental developments. Starting from the growth, distribution patterns, and characteristics of forest resources themselves, combined with China’s national conditions, forest conditions, and forest resource management characteristics, it comprehensively prices the current situation and changes in forest resources and provides corresponding technical drawings. Therefore, the higher the protection level, the more positively it influences vegetation coverage, aligning with on-ground protection practices. The positive correlation between forest land protection and vegetation coverage highlights the beneficial impact of conservation efforts. This study underscores a crucial point—economic development and ecological protection in the YRB can coexist harmoniously. The path forward involves prioritizing the improvement of industrial quality and ensuring that economic growth aligns with environmental preservation. The complex economic system, encompassing factors like economic growth, urbanization, agricultural activities, and commercialization, collectively shapes and influences vegetation coverage.
5.2.2. The Sub-Basin of the YRB
Considering the significant disparity in economic development levels among the upper, middle, and lower reaches of the YRB, industrial development priorities vary accordingly. Upon integrating the analysis of economic density’s role, it becomes evident that the upper reaches of the YRB, characterized by relatively lagging economic development, seek to enhance their economic status by leveraging geographical advantages. Initiatives such as the establishment of the Qingtongxia Hydropower Station and the Laxiwa Hydropower Station have not only safeguarded the ecological integrity of the upper reaches but also spurred economic growth. Meanwhile, the middle reaches serve as a crucial energy hub and industrial center in China. However, the absence of incentives for traditional industrial transformation and upgrading has led to the proliferation of resource-intensive industries, resulting in environmental degradation and diminished vegetation cover. As the economy continues to evolve, downstream counties and cities witness escalating levels of economic prosperity. The Huanghuaihai Plain, occupying a substantial portion of arable land in the downstream region, offers opportunities for enhancing vegetation coverage through the development of a modernized agricultural economy.
The ecological sensitivity and strategic geographical location designate the upper reaches of the YRB as a key restricted development zone at the national level. Despite a relatively gradual pace of economic development, this region holds immense potential for large-scale forest nurturing [62]. Notably, the fluctuations in economic density have minimal repercussions on vegetation coverage in this area. Instead, the paramount influence emerges from natural environmental factors, with annual precipitation significantly shaping the vegetative landscape. While emphasizing the preservation of vegetation coverage, it remains imperative for the upper reaches of the YRB to address economic development. The resolute implementation of the Western Development Strategy [63] stands as a crucial directive. This strategy encompasses a comprehensive approach, aiming not only at ecological conservation but also at enhancing the economic landscape. It calls for concerted efforts to improve the income and welfare of residents in the upper reaches, addressing the challenge of economic backwardness. By striking a harmonious balance between ecological well-being and economic progress, the upper reaches can chart a sustainable and prosperous future.
The middle reaches of the YRB witnessed robust economic development during the period from 2008 to 2018, accompanied by significant environmental challenges, particularly evident in the Loess Plateau, where soil erosion became a prominent issue. The region, endowed with abundant coal resources, underwent extensive coal exploitation as part of its economic expansion. Unfortunately, this rapid development, coupled with an outdated technological infrastructure, contributed to a range of ecological problems, hastening the decline of the local ecological environment [64]. A notable consequence of this economic surge was the concurrent increase in urbanization rates. As urbanization progressed, there was a positive correlation observed with vegetation coverage—a phenomenon often driven by public awareness of the importance of ecological sustainability. The rise in wealth acted as a catalyst, intensifying the demand for both high-quality and substantial vegetation coverage [55]. Recognizing the ecological toll of economic activities, various regions in the middle reaches of the YRB have taken proactive measures to address environmental concerns. These initiatives include the implementation of ecological and environmental protection measures and a steadfast commitment to policies encouraging the conversion of farmland back to forests and grasslands. Through such concerted efforts, the aim is to mitigate the adverse impact of economic activities on vegetation coverage and restore the regional ecological equilibrium.
The lower reaches of the YRB, boasting an advantageous geographical location with proximity to the capital, Beijing, and encompassing coastal cities, laid a strong foundation for robust economic development [65]. In comparison to the upper and middle reaches of the YRB, the lower reaches exhibited a higher level of economic development, a superior ecological environment, and a more pronounced degree of ecological and economic coordination, albeit still below the national average [66]. The economic density in the lower reaches of the YRB demonstrated a minimal impact on vegetation coverage. However, the continuous march of industrialization underscores the need to guard against potential declines in vegetation coverage arising from ecological and economic imbalances. The heightened population density in the lower reaches amplifies the importance of judiciously utilizing limited land resources, presenting a pivotal factor in enhancing vegetation coverage. As the lower reaches navigate the intricate interplay between economic prosperity and environmental preservation, it becomes imperative to implement strategic measures that foster a harmonious coexistence. Addressing ecological and economic imbalances, especially in the face of increasing industrialization, stands as a key consideration for sustaining and enhancing vegetation coverage in this vital region.
5.3. Limitation
This study delineates a pragmatic trajectory for the high-level preservation of forest resources and the high-quality advancement of the social economy across the upper, middle, and lower reaches of the YRB, offering valuable insights for other developing nations and regions. Nonetheless, it is subject to certain limitations. Primarily, in terms of study scope, our analysis is grounded in socio-economic and vegetation coverage data from the YRB spanning 2008 to 2018, thus limiting its generalizability to other countries and regions. The YRB, characterized by ecological fragility, exhibits a weak resistance to interference, with human activities exerting a profound impact on its ecological landscape. The basin’s unique geographical features, predominantly sloping hills and its passage through the Loess Plateau, render it susceptible to soil erosion and other natural calamities. In contrast, regions like the Yangtze River Basin boast high vegetation suitability owing to their favorable geographic positioning, with forest reserves accounting for 25% of the national total [67]. Consequently, the findings of our study are specific to the YRB. Future research endeavors will expand the scope to explore the nexus between China’s national economic development and forest resource conservation. Secondly, our analysis may overlook variables, potentially omitting other factors influencing vegetation cover in the YRB. Subsequent research will comprehensively consider the interplay of climate change and economic development, which jointly impact forest vegetation cover.
6. Conclusions
6.1. Conclusions
Based on vector data, the spatial-temporal pattern of vegetation coverage and economic density in the YRB from 2008 to 2018 was analyzed using ArcGIS software. The results revealed that vegetation coverage displayed a pattern of high levels in the west and low levels in the east, with an overall declining trend across the YRB. Conversely, economic density exhibited a pattern of low levels in the west and high levels in the east, displaying an overall increasing trend. The outcomes of the two-way fixed effects model indicated a negative correlation between economic density and FVC in the YRB, particularly evident in the middle reaches of the YRB. Specifically, across the entire YRB, vegetation coverage decreased by 1.108% for every 1 unit increase in economic density, while in the middle reaches of the Yellow River, it decreased by 1.103% with a similar increase in economic density. The encroachment of large-scale industrial activities on forest land has adversely impacted vegetation coverage [68], suggesting that the development and utilization of natural resources may undermine vegetation coverage in the Yangtze River Delta amid economic growth. Notably, no significant correlation between economic density and vegetation coverage was observed in the upper and lower Yellow River regions during 2008–2018. Furthermore, factors such as forest protection level, urbanization rate, and proportion of primary industry influence vegetation coverage through various mechanisms, exacerbating spatial disparities in vegetation coverage within the YRB. Results indicate a positive impact of the primary industry on vegetation coverage in the YRB, attributed to advancements in agricultural modernization, adoption of water-saving irrigation technologies, and improved production conditions, all contributing to agricultural improvements and increased vegetation coverage. Additionally, higher forest protection levels in the YRB correspond to more pronounced improvements in vegetation coverage. Ecological restoration projects initiated by the Chinese government since the early 21st century have augmented vegetation coverage across parts or even the entire YRB [69]. Previous research on the dynamic nature of China’s vegetation area underscores the significant influence of socio-economic factors on vegetation change, offering valuable insights for sustainable development strategies in the YRB and beyond [70].
6.2. Countermeasures
In conclusion, the YRB, endowed with abundant resources but facing ecological fragility, necessitates a transformative approach to economic development, prioritizing green practices and emphasizing responsible resource exploitation and utilization. Several key recommendations emerge.
Upstream: Environmental Conservation
Implement afforestation policies by closing mountain areas to human activities, allowing natural ecology to recover. Strengthen ecological protection in mountainous regions, focusing on safeguarding vegetation and water sources and preventing overgrazing and deforestation. Enhance the sustainable development of the primary industry, encouraging green agricultural practices to minimize damage to vegetation.
Midstream: Economic and Ecological Harmony
Recognize the negative correlation between vegetation coverage and economic density in the middle reaches. Reduce human activities based on the environmental carrying capacity of vegetation, continuing initiatives like returning farmland to forest and grassland for promoting vegetation restoration. Control the growth rate of economic density, implement rational land use planning, and mitigate industrial impacts on vegetation. Plan urban construction thoughtfully, prioritizing the protection of natural landscapes and ecological environments, strengthening forestland protection, and improving forestry management systems.
Downstream: Urban Development with Ecological Focus
Focus on ecological restoration projects in downstream areas, including wetland protection, riverbank greening and urban forest and green space development. Implement measures to control pollution and promote regional ecological protection and socio-economic development in human settlement areas. By incorporating these recommendations, the YRB can strike a balance between economic development and ecological preservation, fostering sustainability and resilience in the face of environmental challenges.
Themes such as “global forest coverage and changes”, “global land degradation situation”, and “global major natural disasters and their impacts” have become focal points in the ecological discourse, with the coordinated development of green ecology and the economy emerging as a shared objective for nations worldwide. Since the onset of the 21st century, there has been a slight decline in the global forest coverage area, prompting other countries to consider emulating China’s green ecological policies. Firstly, countries should prioritize the protection and restoration of the ecological environment, striving to enhance and sustain forest vegetation coverage to contribute significantly to maintaining the global forest coverage equilibrium. Secondly, adopting China’s ethos of “Lucid waters and lush mountains are Invaluable Asset” is essential, wherein economic development is pursued alongside the preservation of green ecology. Improving global forest vegetation coverage not only mitigates land degradation but also helps mitigate the impacts of climate change.
Author Contributions
Conceptualization, X.Z. and Y.D.; methodology, Q.W. and B.W.; validation, G.W.; formal analysis, X.Y. and B.W.; writing—original draft preparation, B.W. and X.Y.; writing—review and editing, Y.D., Q.W. and X.Z.; visualization, Y.L.; supervision, G.W.; funding acquisition, X.Z. All authors have read and agreed to the published version of the manuscript.
Funding
This research was funded by the Fundamental Research Funds of CAF, Theoretical Framework and Method for Accurate Estimation of the Full Life-Cycle Carbon Sink Potential in Masson Pine Artificial Monoculture Forests (CAFYBB2023MB019), China Scholarship Council Chinese Government Scholarship (202203270009), and the Fundamental Research Funds of CAF, Precision Estimation Study of Carbon Sink Potential in Deciduous Forests in the Yellow River Basin (CAFYBB2023PA006-02).
Informed Consent Statement
This article does not contain any studies with human participants or animals performed by any of the authors. Informed consent was obtained from all the individual participants included in the study.
Data Availability Statement
The data presented in this study are available upon request from the corresponding author.
Acknowledgments
Thank you to the anonymous reviewer and editor.
Conflicts of Interest
The authors declare no conflicts of interest.
Appendix A
| Basin | Province | City | Country |
| Upper reaches | Qinghai | Xining | Chengdong, Central, Chengxi, Chengbei, Huangzhong, Datong Hui and Tu Autonomous, Huangyuan |
| Haidong | Ledu, Ping An, Minhe Hui and Tu Autonomous, Huzhu Tu Autonomous, Hualong Hui Autonomous, Xunhua Salar Autonomous | ||
| Haibei Tibetan Autonomous Prefecture | Menyuan Hui Autonomous, Qilian, Haiyan, Gangcha, Tongren, Jainca, Zeku, Henan Mongol Autonomous, Gonghe, Tongde, Guide, Xinghai, Guinan, Maqin, Banma, Gande, Dari, Jiuzhi, Maduo, Chengduo, Qumalai, Dulan, Tianjun | ||
| Sichuan | Aba Tibetan and Qiang Autonomous Prefecture | Malcolm, Songpan, Aba, Ruoergai, Hongyuan | |
| Ganzi Tibetan Autonomous Prefecture | Shiqu | ||
| Gansu | Lanzhou | Chengguan, Qilihe, Xigu, Anning, Honggu, Yongdeng, Gaolan, Yuzhong | |
| Baiyin | Baiyin, Pingchuan, Jingyuan, Huining, Jingtai | ||
| Tianshui | Qinzhou, Maiji, Qingshui, Qin’an, Gangu, Wushan, Zhangjiachuan Hui Autonomous | ||
| Wuwei | Gulang, Tianzhu Tibetan Autonomous | ||
| ZhangYe | Shandan | ||
| Pingliang | Kongtong, Jingchuan, Lingtai, Chongxin, Huating, Zhuanglang, Jingning | ||
| Qingyang | Xifeng, Qingcheng, Huan, Huachi, Heshui, Zhengning, Ning, Zhenyuan | ||
| Dingxi | Anding, Tongwei, Longxi, Weiyuan, Lintao, Zhang, Min | ||
| Longnan | Dangchang, Li | ||
| Linxia Hui Autonomous Prefecture | Linxia (a), Linxia (b), Kangle, Yongjing, Guanghe, Hezheng, Dongxiang Autonomous Condado, Jishishan Bao’an Dongxiang Salar Autonomous | ||
| Gannan Tibetan Autonomous Prefecture | Hezuo, Lintan, Zhuoni, Diebu, Maqu, Luqu, Xiahe | ||
| Ningxia Hui Autonomous Region | Yinchuan | Xingqing, Xixia, Jinfeng, Yongning, Helan, Lingwu | |
| Shizuishan | Dawukou, Huinong, Pingluo | ||
| Wuzhong | Litong, Hongsibao, Yanchi, Tongxin, Qingtongxia | ||
| Guyuan | Yuanzhou, Xiji, Longde, Jingyuan, Pengyang | ||
| Zhongwei | Shapotou, Zhongning, Haiyuan | ||
| Inner Mongolia Autonomous Region | Hohhot | Xincheng, Huimin, Yuquan, Saihan, Tumote Left Banne, Tokto, Helingeer, Qingshuihe, Wuchuan | |
| Baotou | Donghe, Kundulun, Qingshan, Shiguai, Bayan Obo, Jiuyuan, Tumed Right Banner, Guyang, Darhamo Ming’an United Banner | ||
| Wuhai | Haibowan, Hainan, Wuda | ||
| Ordos | Dongsheng, Kangbashi, Dalad Banner, Jungar Banner, Otog Front Banner, Etuoke Banner, Hangjin Banner, Wushen Banner, Ejin Horo Banner | ||
| Bayan Nur | Linhe, Wuyuan, Dengkou, Urat Front Banner, Urad Middle Banner, Urat Rear Banner, Hanggin Rear Banner | ||
| Ulanqab | Zhuozi, Liangcheng, Chahar Right Middle Banner, Siziwang Banner | ||
| Alxa | Alxa Left Banner | ||
| Middle reaches | Shaanxi | Xi’an | Xincheng, Beilin, Lianhu, Baqiao, Weiyang, Yanta, Yanliang, Lintong, Chang’an, Gaoling, Huayi, Lantian, Zhouzhi |
| Tongchuan | Wangyi, Yintai, Yaozhou, Yijun | ||
| Baoji | Weibin, Jintai, Chencang, Fengxiang, Qishan, Fufeng, Mei, Long, Qianyang, Linyou, Feng, Taibai | ||
| Xianyang | Qindu, Yangling, Weicheng, Sanyuan, Jingyang, Qian, Liquan, Yongshou, Changwu, Xunyi, Chunhua, Wugong, Xingping, Binzhou | ||
| Weinan | Linwei, Huazhou, Tongguan, Dali, Heyang, Chengcheng, Pucheng, Baishui, Fuping, Hancheng, Huayin | ||
| Yan’an | Baota, Ansai, Yanchang, Yanchuan, Zhidan, Wuqi, Ganquan, Fu, Luochuan, Yichuan, Huanglong, HuangLing, Zichang | ||
| Hanzhong | Foping | ||
| Yulin | Yuyang, Hengshan, Fugu, Jingbian, Dingbian, Suide, Mizhi, Jia, Wubao, Qingjian, Zizhou, Shenmu | ||
| Ankang | Ningshan | ||
| Shangluo | Shangzhou, Luonan, Danfeng, Zhashui | ||
| Shanxi | Taiyuan | Xiaodian, Yingze, Xinghualing, Jiancaoping, Wanbailin, Jinyuan, Qingxu, Yangqu, Loufan, Gujiao | |
| Datong | Zuoyun | ||
| Yangquan | urban area, mining area, suburbs, Pingding, Yu | ||
| Changzhi | Shangdang, Tunliu, Zhangzi, Wuxiang, Qin, Qinyuan | ||
| Jincheng | urban area, Qinshui, Yangcheng, Lingchuan, Zezhou, Gaoping | ||
| Shuozhou | Shuocheng, Pinglu, Youyu | ||
| Jinzhong | Yuci, Taigu, Yushe, Heshun, Xiyang, Shouyang, Qi, Pingyao, Lingshi, Jiexiu | ||
| Yuncheng | Yanhu, Linyi, Wanrong, Wenxi, Jishan, Xinjiang, Jiangxian, Yuanqu, Xia, Pinglu, Ruicheng, Yongji, Hejin | ||
| Xinzhou | Xinfu, Ningwu, Jingle, Shenchi, Wuzhai, Kelan, Hequ, Baode, Pianguan, Yuanping | ||
| Linfen | Yaodu, Quwo, Yicheng, Xiangfen, Hongdong, Gu, Anze, Fushan, Ji, Xiangning, Daning, Xi, Yonghe, Pu, Fenxi, Houma, Huozhou | ||
| lvliang | Lishi, Wenshui, Jiaocheng, Xing, Lin, Liulin, Shilou, Lan, Fangshan, Zhongyang, Jiaokou, Xiaoyi, Fenyang | ||
| Henan | Zhengzhou | Jinshui, Shangjie, Huiji, Zhongmou, Gongyi, Xingyang, Xinmi, Dengfeng | |
| Luoyang | Old Town, Xigong, Chanhe Hui Autonomous Region, Jianxi, Jili, Luolong, Mengjin, Xin’an, Luanchuan, Song, Ruyang, Yiyang, Luoning, Yichuan, Yanshi | ||
| Pingdingshan | Ruzhou | ||
| Anyang | Hua, Neihuang | ||
| Hebi | Xun | ||
| Jiaozuo | Bo’ai, Wuzhi, Wen, Qinyang, Mengzhou | ||
| Sanmenxia | Hubin, Shaanzhou, Mianchi, Lushi, Yima, Lingbao | ||
| Nanyang | Xixia | ||
| Jiyuan | Jiyuan | ||
| Lower reaches | Henan | Kaifeng | Longting, Shunhe Hui, Gulou, Yuwangtai, Xiangfu, Lankao |
| Xinxiang | Hongqi, Xinxiang, Huojia, Yuanyang, Yanjin, Fengqiu, Weihui, Changyuan | ||
| Puyang | Hualong, Fan, Taiqian, Puyang | ||
| Shandong | Jinan | Lixia, Shizhong, Huaiyin, Tianqiao, Licheng, Changqing, Zhangqiu, Jiyang, Laiwu, Gangcheng, Pingyin | |
| Zibo | Zichuan, Boshan, Gaoqing, Yiyuan | ||
| Dongying | Dongying, Hekou, Kenli, Lijin | ||
| Jining | Wenshang, Sishui, Liangshan, Qufu | ||
| Tai’an | Taishan, Daiyue, Ningyang, Dongping, Xintai, Feicheng | ||
| Linyi | Pingyi, Mengyin | ||
| Dezhou | Qihe | ||
| Binzhou | Bincheng, Huimin, Boxing, Zouping | ||
| Heze | Mudan, Yuncheng, Juancheng, Dongming |
References
- Johnson, C.N.; Balmford, A.; Brook, B.W.; Buettel, J.C.; Galetti, M.; Guangchun, L.; Wilmshurst, J.M. Biodiversity losses and conservation responses in the Anthropocene. Science 2017, 356, 270–275. [Google Scholar] [CrossRef] [PubMed]
- Forzieri, G.; Dakos, V.; McDowell, N.G.; Ramdane, A.; Cescatti, A. Emerging signals of declining forest resilience under climate change. Nature 2022, 608, 534–539. [Google Scholar] [CrossRef] [PubMed]
- Kijowska-Oberc, J.; Staszak, A.M.; Kamiński, J.; Ratajczak, E. Adaptation of Forest Trees to Rapidly Changing Climate. Forests 2020, 11, 123. [Google Scholar] [CrossRef]
- Wang, H.; Zhou, S.; Li, X.; Liu, H.; Chi, D.; Xu, K. The influence of climate change and human activities on ecosystem service value. Ecol. Eng. 2016, 87, 224–239. [Google Scholar] [CrossRef]
- Zhang, W.; Wang, Y.; Li, J.; Hao, Z. Coupling Coordination Network Analysis of Ecological Protection and High-quality Economic Development in the Yellow River Basin. Ecol. Econ. 2022, 38, 179–189. [Google Scholar]
- Jin, F.; Ma, L.; Xu, D. Environmental Stress and Optimized Path of Industrial Development in the Yellow River Basin. Resour. 2020, 42, 127–136. [Google Scholar] [CrossRef]
- Deng, C.; Bai, H.; Gao, S.; Liu, R.; Ma, X.; Huang, X.; Meng, Q. Spatial-temporal variation of the vegetation coverage in Qinling Mountains and its dual response to climate change and human activities. J. Nat. Resour. 2018, 33, 425–438. [Google Scholar]
- Zhang, S.L.; Gu, X.; Zhao, X.B.; Zhu, J.F.; Zhao, Y.R. Influences of climatic factors and human activities on Forest–Shrub–Grass suitability in the Yellow River Basin, China. Forests 2023, 14, 1198. [Google Scholar] [CrossRef]
- Wu, Q.J.; Zhu, J.F.; Zhao, X.D. Effects of human social-economic activities on vegetation suitability in the Yellow River Basin, China. Forests 2023, 14, 234. [Google Scholar] [CrossRef]
- Zhang, Y.; He, Y.; Li, Y.; Jia, L. Spatiotemporal variation and driving forces of NDVI from 1982 to 2015 in the Qinba Mountains, China. Environ. Sci. Pollut. Res. 2022, 29, 52277–52288. [Google Scholar] [CrossRef]
- Zhang, M.; Du, H.; Zhou, G.; Mao, F.; Li, X.; Zhou, L.; Zhu, D.; Xu, Y.; Huang, Z. Spatiotemporal Patterns and Driving Force of Urbanization and Its Impact on Urban Ecology. Remote Sens. 2022, 14, 1160. [Google Scholar] [CrossRef]
- Lu, Y.; Zhang, Q.; Li, X.H.; Yang, S.X.; Yang, Q. Temporal and spatial variation of vegetation coverage and its response to climate factors in Gansu section of Yellow River Basin. Bull. Soil. Water Conserv. 2020, 40, 232–238. [Google Scholar]
- Wang, L.; Li, N.; Wen, G.C.; Yang, Y.H. Vegetation coverage changes and driving forces in Henan section of the Yellow River basin. Bull. Soil. Water Conserv. 2022, 42, 393–399. [Google Scholar]
- Zhang, H.Y.; Zhan, C.S.; Xia, J.; Hu, S.; Ning, L.K.; Deng, X.J. Spatio-temporal variations and strip pattrns of vegetation in the Inner Mongolia of Yellow River Basin. Acta Ecol. Sin. 2022, 42, 8818–8829. [Google Scholar]
- He, H.J.; Wang, Z.; Dong, J.F.; Wang, J.; Zou, J.Y. Synergy and trade-off between vegetation change and urbanization development in the Yellow River Basin of Shanxi Province based on satellite remote sensing data. Acta Ecol. Sin. 2022, 42, 3536–3545. [Google Scholar]
- Sheng, Y.; Liu, L.F.; Yuan, Y.; Wang, S.; Li, J.; An, L. Effects of climate change and human activities on vegetation coverage in arsenic sandstone area of Yellow River basin. Bull. Soil. Water Conserv. 2023, 43, 412–420. [Google Scholar]
- Li, Y.J.; Chen, Q.C.; Fang, H.; Li, J. Spatial heterogeneity of vegetation evolution and its influencing factors in the Yangtze River Basin based on multi-scale geographical weighted regression. China Environ. Sci. 2024, 44, 352–362. [Google Scholar]
- Wang, R.; Ding, X.; Yi, B.J.; Wang, J.L. Spatiotemporal characteristics of vegetation cover change in the Central Yunnan urban agglomeration from 2000 to 2020 based on Landsat data and its driving factors. Geocarto. Int. 2024, 39, 2316643. [Google Scholar] [CrossRef]
- Zhang, Z.Q.; Liu, H.; Zuo, Q.T.; Yu, J.T.; Li, Y. Spatiotemporal change of fractional vegetation cover in the Yellow River Basin during 2000–2019. Resour. Sci. 2021, 43, 849–858. [Google Scholar]
- Zhang, W.; Wang, L.; Xiang, F.; Qin, W.; Jing, W. Vegetation dynamics and the relations with climate change at multiple time scales in the Yangtze River and Yellow River Basin, China. Ecol. Indic. 2020, 110, 105892. [Google Scholar] [CrossRef]
- Zhang, Q.; Wang, G.; Yuan, R.; Singh, V.P.; Wu, W.; Wang, D.Z. Dynamic responses of ecological vulnerability to land cover shifts over the Yellow River Basin, China. Ecol. Indic. 2022, 144, 109554. [Google Scholar] [CrossRef]
- Sun, G.P.; Liu, X.F.; Wang, X.H.; Li, S.S. Changes in vegetation coverage and its influencing factors across the Yellow River Basin during 2001-2020. J. Desert Res. 2021, 41, 205–212. [Google Scholar]
- Zhang, X.J.; Wang, G.Q.; Xue, B.L.; Ying, L.A. Changes in vegetation cover and its influencing factors in the inner Mongolia reach of the Yellow River basin from 2001 to 2018. Environ. Res. 2022, 215, 114253. [Google Scholar] [CrossRef] [PubMed]
- Liu, C.X.; Zhang, X.D.; Wang, T.; Chen, G.Z.; Zhu, K.; Wang, Q.; Wang, J. Detection of vegetation coverage changes in the Yellow River Basin from 2003 to 2020. Ecol. Indic. 2022, 138, 108818. [Google Scholar] [CrossRef]
- Chen, S.; He, L.; Yan, F. Spatio-temporal evolution of vegetation coverage in Beijing-Tianjin-Hebei and its response to natural anthropogenic changes. China Environ. Sci. 2024, 1–18. [Google Scholar]
- Zhang, J.; Du, J.Q.; Sheng, Z.L.; Zhang, Y.C.; Wu, J.H.; Liu, B. Spatio-temporal changes of vegetation cover and their influencing factors in the Yellow River Basin from 1982 to 2015. Ecol. Environ. 2021, 30, 929. [Google Scholar]
- Wang, X.L.; Shi, S.H.; Chen, Z.X. Change and driving factors of vegetation coverage in the Yellow River Basin. China Environ. Sci. 2022, 42, 5358–5368. [Google Scholar]
- Ciccone, A.; Hall, R.E. Productivity and density of economic activity. The American Economic Review. 1996, 86, 54–70. [Google Scholar]
- Jie, L.I. A simulation approach to optimizing the vegetation covers under the water constraint in the Yellow River Basin. Forest Policy Econ. 2021, 123, 102377. [Google Scholar]
- Zhang, P.; Pang, B.; Li, Y.; He, J.; Hong, X.; Qin, C.; Zheng, H. Analyzing spatial disparities of economic development in Yellow River Basin, China. GeoJournal 2019, 84, 303–320. [Google Scholar] [CrossRef]
- Wang, Y.; Yang, N. Differences in High-Quality Development and Its Influencing Factors between Yellow River Basin and Yangtze River Economic Belt. Land 2023, 12, 1461. [Google Scholar] [CrossRef]
- Ke Liu, K.; Qiao, Y.R.; Shi, T.; Zhou, Q. Study on coupling coordination and spatiotemporal heterogeneity between economic development and ecological environment of cities along the Yellow River Basin. Environ. Sci. Pollut. R. 2021, 28, 6898–6912. [Google Scholar] [CrossRef] [PubMed]
- Zhang, Z.; Li, H.; Cao, Y. Research on the Coordinated Development of Economic Development and Ecological Environment of Nine Provinces (Regions) in the Yellow River Basin. Sustainability 2022, 14, 13102. [Google Scholar] [CrossRef]
- Zhao, Y.; Hou, P.; Jiang, J.; Zhai, J.; Chen, Y.; Wang, Y.; Bai, J.; Zhang, B.; Xu, H. Coordination Study on Ecological and Economic Coupling of the Yellow River Basin. Int. J. Environ. Res. Public Health 2021, 18, 10664. [Google Scholar] [CrossRef] [PubMed]
- Zhao, X.; Li, X.; Deng, G.; Xi, Y. Decoupling Relationship between Resource Environment and High-Quality Economic Development in the Yellow River Basin. Sustainability 2023, 15, 9385. [Google Scholar] [CrossRef]
- Song, C.; Yin, G.; Lu, Z.; Chen, Y. Industrial ecological efficiency of cities in the Yellow River Basin in the background of China’s economic transformation: Spatial-temporal characteristics and influencing factors. Environ. Sci. Pollut. R. 2022, 29, 4334–4349. [Google Scholar] [CrossRef] [PubMed]
- Guo, A.; Zhang, Y.; Zhong, F.; Jiang, D. Spatiotemporal Patterns of Ecosystem Service Value Changes and Their Coordination with Economic Development: A Case Study of the Yellow River Basin, China. Int. J. Environ. Res. Public. Health 2020, 17, 8474. [Google Scholar] [CrossRef] [PubMed]
- Hill, M.J.; Guerschman, J.P. The MODIS Global Vegetation Fractional Cover Product 2001–2018: Characteristics of Vegetation Fractional Cover in Grasslands and Savanna Woodlands. Remote Sens. 2020, 12, 406. [Google Scholar] [CrossRef]
- Ahlfeldt, G.M.; Pietrostefani, E. The economic effects of density: A synthesis. J. Urban Econ. 2019, 111, 93–107. [Google Scholar] [CrossRef]
- Henderson, J.V.; Nigmatulina, D.; Kriticos, S. Measuring Urban Economic Densit. J. Urban Econ. 2019, 125, 103188. [Google Scholar] [CrossRef]
- Richards, D.R.; Belcher, R.N. Global Changes in Urban Vegetation Cover. Remote Sens. 2020, 12, 23. [Google Scholar] [CrossRef]
- Zhang, Y.; Wang, P.; Wang, T.; Li, J.; Li, Z.; Teng, M.; Gao, Y. Using Vegetation Indices to Characterize Vegetation Cover Change in the Urban Areas of Southern China. Sustainability 2020, 12, 9403. [Google Scholar] [CrossRef]
- Zhang, S.; Chen, H.; Fu, Y.; Niu, H.; Yang, Y.; Zhang, B. Fractional Vegetation Cover Estimation of Different Vegetation Types in the Qaidam Basin. Sustainability 2019, 11, 864. [Google Scholar] [CrossRef]
- Li, C.H.; Yang, Z.F. Spatio-temporal changes of NDVI and their relations with precipitation and runoff in the Yellow River Basin. Geogr. Res.-Aust. 2004, 23, 753–759. [Google Scholar]
- McVicar, T.R.; Van Niel, T.G.; Li, L.; Hutchinson, M.F.; Mu, X.; Liu, Z. Spatially distributing monthly reference evapotranspiration and pan evaporation considering topographic influences. J. Hydrol. 2007, 338, 196–220. [Google Scholar] [CrossRef]
- Zhou, K.; Wang, Y.M.; Chang, J.X.; Zhou, S.; Guo, A.J. Spatial and temporal evolution of drought characteristics across the Yellow River basin. Ecol. Indic. 2021, 131, 108–207. [Google Scholar] [CrossRef]
- Liu, H.; Liu, F.; Zheng, L. Effects of climate change and human activites on vegetation cover change in the Yellow Rive Basin. J. Soil. Water Conserv. 2021, 35, 143–151. [Google Scholar]
- Li, Q.Q.; Cao, Y.P.; Miao, S.L. Spatio-temporal variation in vegetation coverage and its response to climate factors in the Yellow River Basin, China. Acta Ecol. Sin. 2022, 42, 4041–4054. [Google Scholar]
- Yuan, L.H.; Jiang, W.G.; Shen, W.M.; Liu, Y.H.; Wang, W.J.; Tao, L.L.; Zheng, H.; Liu, X.F. The spatio-temporal variations of vegetation cover in the Yellow River Basin from 2000 to 2010. Acta Ecol. Sin. 2013, 33, 7798–7806. [Google Scholar]
- Wang, K.; Zhou, J.; Tan, M.L.; Lu, P.; Xue, Z.; Liu, M.; Wang, X. Impacts of vegetation restoration on soil erosion in the Yellow River Basin, China. Catena 2024, 234, 107547. [Google Scholar] [CrossRef]
- Piao, S.L.; Fang, J.Y. Dynamic vegetation cover change over the last 18 years in China. Quat. Sci. Rev. 2001, 21, 294–302. [Google Scholar]
- Lopez, E.; Bocco, G.; Mendoza, M.; Duhau, E. Predicting land cover and land-use change in the urban fringe, A case in Morelia city, Mexico. Landsc. Urban Plan. 2001, 55, 271–285. [Google Scholar] [CrossRef]
- Percoco, M. Path dependence, institutions and the density of economic activities: Evidence from Italian cities. Pap. Reg. Sci. 2014, 93, 53–76. [Google Scholar] [CrossRef]
- Wheeler, D.; Hammer, D.; Kraft, R.; Dasgupta, S.; Blankespoor, B. Economic dynamics and forest clearing: A spatial econometric analysis for Indonesia. Ecol. Econ. 2013, 85, 85–96. [Google Scholar] [CrossRef]
- Chen, W.Y.; Wang, D.T. Economic development and natural amenity: An econometric analysis of urban green spaces in China. Urban. For. Urban Green. 2013, 12, 435–442. [Google Scholar] [CrossRef]
- Ding, Y. Spatial distribution characteristics and impact analysis of national wetland parks in the Yellow River basin from the perspective of arcgis. SPIE 2023, 12797, 105–110. [Google Scholar]
- Cicia, G.; Giudice, T.; Scarpa, R. Consumers’ perception of quality in organic food: A random utility model under preference heterogeneity and choice correlation from rank-orderings. Brit. Food J. 2002, 104, 200–213. [Google Scholar] [CrossRef]
- Liu, X.; Pan, Y.; Zhu, X.; Li, S. Spatio-temporal variation of vegetation coverage in Qinling-Daba Mountains in relation to environmental factors. Acta Geogr. Sin. 2015, 70, 705–716. [Google Scholar]
- Luck, G.W.; Smallbone, L.T.; O’Brien, R. Socio-economics and vegetation change in urban ecosystems: Patterns in space and time. Ecosystems 2009, 12, 604–620. [Google Scholar] [CrossRef]
- Ren, Z.; Tian, Z.; Wei, H.; Liu, Y.; Yu, Y. Spatio-temporal evolution and driving mechanisms of vegetation in the Yellow River Basin, China during 2000–2020. Ecol. Indic. 2022, 138, 108832. [Google Scholar] [CrossRef]
- Fang, J.; Yu, G.; Liu, L.; Hu, S.; Chapin, F.S. Climate change, human impacts, and carbon sequestration in China. Proc. Nat. Acad. Sci. USA 2018, 115, 4015–4020. [Google Scholar] [CrossRef] [PubMed]
- Liu, W.; Shi, C.; Zhou, Y. Trends and attribution of runoff changes in the upper and middle reaches of the Yellow River in China. J. Hydro.-Environ. Res. 2021, 37, 57–66. [Google Scholar] [CrossRef]
- Li, P.; Tian, Y.; Wu, J.; Xu, W. The Great Western Development policy: How it affected grain crop production, land use and rural poverty in western China. Agricultural Economic Review. 2021, 13, 319–348. [Google Scholar] [CrossRef]
- Zhang, Z.; Chang, T.; Qiao, X.; Yang, Y.; Guo, J.; Zhang, H. Eco-economic coordination analysis of the Yellow River Basin in China: Insights from major function-oriented zoning. Sustainability 2021, 13, 2715. [Google Scholar] [CrossRef]
- Zhang, G.X.; Su, Z.X. Construction and measurement of high-quality development evaluation system for the central cities in the Yellow River Basin. Ecol. Econ. 2020, 36, 37–43. [Google Scholar]
- Chen, Y.; Syvitski, J.P.; Gao, S.; Overeem, I.; Kettner, A.J. Socio-economic impacts on flooding: A 4000-year history of the Yellow River. China Ambio 2012, 41, 682–698. [Google Scholar] [CrossRef] [PubMed]
- Qu, S.; Wang, L.; Lin, A.; Yu, D.; Yuan, M. Distinguishing the impacts of climate change and anthropogenic factors on vegetation dynamics in the Yangtze River Basin, China. Ecol. Indic. 2020, 108, 105724. [Google Scholar] [CrossRef]
- Zhao, W.; Li, J.; Chu, L.; Wang, T.; Li, Z.; Cai, C. Analysis of spatial and temporal variations in vegetation index and its driving force in Hubei Province in the last 10 years. Acta Ecol. Sin. 2019, 39, 7722–7736. [Google Scholar]
- Ma, F.; Zhuo, J.; He, H.J.; Han, S.S. Ecological evolution and driving mechanism of vegetation in Yulin City, Shaanxi Province. Bull. Soil. Water Conserv. 2020, 40, 257–261. [Google Scholar]
- Lu, Y.; Zhang, L.; Feng, X.; Zeng, Y.; Fu, B.; Yao, X.; Li, J.; Wu, B. Recent ecological transitions in China: Greening, browning, and influential factors. Sci. Rep. 2015, 5, 8732. [Google Scholar] [CrossRef]


Disclaimer/Publisher’s Note: The statements, opinions and data contained in all publications are solely those of the individual author(s) and contributor(s) and not of MDPI and/or the editor(s). MDPI and/or the editor(s) disclaim responsibility for any injury to people or property resulting from any ideas, methods, instructions or products referred to in the content. |
© 2024 by the authors. Licensee MDPI, Basel, Switzerland. This article is an open access article distributed under the terms and conditions of the Creative Commons Attribution (CC BY) license (https://creativecommons.org/licenses/by/4.0/).