Article

Towards a Comprehensive Framework for Regional Transportation Land Demand Forecasting: Empirical Study from Yangtze River Economic Belt, China

1
Key Laboratory of Remote Sensing and Digital Earth, Aerospace Information Research Institute, Chinese Academy of Sciences, Beijing 100101, China
2
School of Land Science and Technology, China University of Geosciences, 29, Xueyuan Road, Haidian District, Beijing 100083, China
3
Key Laboratory of Land Consolidation and Rehabilitation, Ministry of Natural Resources, Beijing 100083, China
*
Authors to whom correspondence should be addressed.
Land 2024, 13(6), 847; https://doi.org/10.3390/land13060847
Submission received: 18 April 2024 / Revised: 27 May 2024 / Accepted: 12 June 2024 / Published: 13 June 2024

Abstract

:
China is currently experiencing rapid expansion in its transportation land. To promote sustainable land use, accurately estimating transportation land demand is crucial. This study aims to develop a comprehensive framework for urban transportation land forecasting within the Yangtze River Economic Belt (YREB), providing support for optimizing regional land allocation. Employing methods such as meta-analysis, statistical analysis, and BP neural network analysis, this study forecasts the transportation land demand of 127 cities in the YREB. The study findings indicate that cities with high transportation land demand are mainly distributed in the middle and upper reaches of the Yangtze River. Moreover, the growth rate of transportation land in the upper reaches significantly outstrips that in the middle and lower reaches, suggesting a focus shift in transportation infrastructure construction toward the upper regions. Additionally, some cities within the YREB face a mismatch between the supply and demand of transportation land, necessitating proactive adjustments to their land supply plans to achieve a balance between supply and demand. The main contribution of this study is the development of a comprehensive and adaptable framework that guides the development of future strategies for optimal land allocation by forecasting transportation land demand at a regional level.

1. Introduction

With the deepening of industrialization and urbanization, land scarcity has become increasingly pronounced [1]. Transportation land, which is used for transport activities, is essential infrastructure for daily life and economic production. The rapid concentration of populations and urban expansion have intensified travel and logistics demands, leading to a significant increase in the need for transportation infrastructure and, consequently, an expansion of transportation land [2]. The demand for global land transportation infrastructure is rapidly increasing [3]. According to statistics from the International Energy Agency (IEA), by 2050, it is projected that there will be at least 25 million kilometers of new roads and 335,000 km of railways globally, representing a 60% increase in total land transportation network length compared to 2010. In terms of land area requirements for transportation infrastructure, roads, railways, and parking facilities are estimated to encompass an area of 250,000 to 350,000 square kilometers by 2050, which is approximately equivalent to the size of the UK and Germany, respectively [4]. Over the past decade, China has experienced rapid development in its transportation sector, accompanied by a substantial expansion in the land area allocated for transportation [5]. Since 2015, the area allocated to transportation land in China has surpassed all other types of construction land. By 2020, urban transportation land comprised 12.8% of the total urban construction land area. In comparison, developed countries such as Germany (36.9% in 2015) and Japan (41.5% in 2020) allocate a larger percentage of their urban land to transportation, indicating that China has a greater need for transportation land supply. Therefore, accurately forecasting transportation land demand in China is crucial. It enables policymakers and planners to understand future trends and the scale of transportation land needs, assisting them in developing more effective land use plans.
Previous research has shown that the actual developed and utilized area of land can significantly deviate from the planned area by government [6]. This deviation sometimes reflects the insufficient consideration given during the planning process, highlighting the need for timely adjustments to land use plans to better align with local development needs [7]. Therefore, as the conflict between land supply and demand intensifies, accurately estimating transportation land demand becomes crucial for devising targeted land supply strategies. Investigating and modeling land use change patterns are essential for improving land demand forecasting. Typically, land demand forecasting is mathematically modeled by systematically considering the trends, correlations, similarities, and probabilities of various factors [8,9,10]. Given the complex decision-making process involving socio-economic systems in land use studies, identifying factors that influence the transportation system is essential for the accurate forecasting of transportation land demand. The relationship between transportation infrastructure development and socio-economic factors has been widely discussed [11,12]. The positive interaction between transportation infrastructure construction and economic development is widely recognized [13,14,15,16]. Moreover, factors such as population size, income level [17], consumption level [18], infrastructure investment [19], industrial development [20], employment [21], urbanization [22], car ownership [23], ecological protection [24,25], and policy directives [26] have an important impact on the transportation development. Research on land demand forecasting has predominantly focused on urban construction land [27], with fewer studies dedicated to transportation land demand forecasting, which often emphasizes forecasting traffic volumes and transport infrastructure demand [28,29,30,31]. As the availability of urban land continues to decrease, there is growing attention to the demand for specific types of land to support the development of detailed supply plans. These include demand forecasts for residential, commercial, industrial, public service, and transportation land [32,33,34].
Research in land use forecasting typically falls into two main categories: One involves constructing mathematical models using statistical methods to forecast the scale and structure of land use [35]. The other simulates the spatial and temporal expansion of land uses incorporating spatial data from remote sensing and geographic information technology [36,37]. Statistical methods such as trend extrapolation, indicator-based methods, and multiple regression analysis are widely employed for forecasting the scale and type of land demand [38]. Trend extrapolation forecasts future urban built-up land area based on historical usage trends [39], focusing solely on land area changes and often neglecting socio-economic drivers, which limits its use to short-term forecasting with considerable uncertainty. Indicator-based methods establish quantitative models linking land use demand to key influencers, setting fixed indicators for each land type based on historical data analysis [40], such as residential land per capita, industrial land per unit of GDP, and transportation land density [41]. Regression analysis is an effective method for forecasting future land demand by modeling the relationships between land use and various economic, demographic, and environmental factors [42,43,44,45]. Moreover, as research into land use change intensifies, advanced algorithmic models such as system dynamics, decision trees, neural networks, support vector machines, and random forests are increasingly being applied to forecast land demand [46,47,48]. With advances in remote sensing and GIS technology, modeling land use changes using satellite data has become a significant research focus [49]. Current studies primarily focus on forecasting the expansion of urban impervious surfaces and simulating the structural evolution of land use [50,51]. However, forecasting the expansion of transportation land use through remote sensing is challenging due to the complex factors that influence it [52]. Therefore, statistical methods are still better suited for macro-level land supply decision-making and development planning.
Unlike land demand driven primarily by economic objectives, such as residential, commercial, and industrial purposes, transportation land demand focuses on supporting socio-economic benefits by facilitating services essential for human production and lifestyle needs [53,54,55]. Consequently, accurately forecasting transportation land demand and developing an effective land supply strategy are essential for the sustainable development of regional transportation. The literature reviews reveal a predominant focus on urban construction land demand forecasting, with limited empirical investigation into transportation land demand at a regional level. Moreover, despite extensive discourse on the relationship between transportation demand and its influencing factors, a systematic review and comparison of these influencing factors are notably absent. This deficiency has resulted in insufficient research on regional transportation land supply and demand, thereby complicating the support for integrated regional development strategies and the formulation of regional territorial spatial plans. The growth of transportation land is a nonlinear and complex process influenced by various factors, necessitating the use of specific rules, indicators, or models in the forecasting process. Therefore, this study aims to develop a framework to forecast regional urban transportation land demand, thereby assisting governmental bodies in strategic planning. The specific objectives of this study are as follows: (1) to construct a framework using meta-analysis and data modeling for forecasting regional urban transportation land demand and (2) to analyze the supply and demand characteristics of urban transportation land at the regional level, thus guiding future governmental land supply decisions. The main contribution of this study is the development of a comprehensive framework for forecasting transportation land demand at the regional level, offering a holistic perspective for decision-makers to effectively develop and update land supply plans. The findings provide valuable insights for optimizing the allocation of regional urban land resources.
The remainder of this paper is organized as follows: Section 2 outlines the research framework, data sources, and methodology employed. Section 3 details the main factors influencing transportation land demand, forecasts the area of urban transportation land in the study area, and analyzes the supply and demand characteristics of transportation land. Section 4 and Section 5 discuss the study’s findings and provide conclusions, respectively.

2. Materials and Methods

2.1. Overview of the Study Area

The Yangtze River Economic Belt (YREB) includes nine provinces and two centrally administered municipalities—Shanghai, Jiangsu, Zhejiang, Anhui, Jiangxi, Hubei, Hunan, Chongqing, Sichuan, Yunnan, and Guizhou—encompassing one hundred and twenty-seven prefecture-level units across approximately 2.05 million square kilometers (Figure 1). This region is a key strategic development area in China, focusing on constructing a comprehensive three-dimensional transportation network that integrates land, water, and air, anchored by the Yangtze River, which cuts across eastern and western China. The population and economic output of the YREB collectively account for over 45 percent of China’s totals, yet the region’s land area represents just 21.4 percent of the national territory, highlighting significant land resource scarcity that constrains regional development. As of 2020, the YREB boasted 44,620 km of operational railway, accounting for 30.49% of China’s total. The highway network spanned 2.35 million kilometers, making up 45.14% of the national total, while inland waterways reached 90,833 km, constituting 71.14% of the nation’s total. Notably, the YREB handles nearly half of China’s passenger and freight traffic, with both cargo volumes and passenger counts surpassing 40% of national levels. As China’s golden waterway, the YREB needs to further rationalize the allocation of transportation land to achieve the construction of a coordinated and sustainable integrated three-dimensional transportation network.

2.2. Policy Timeline for the Transportation Development of the YREB

Since China’s reform and opening up, the transportation system in the Yangtze River Economic Belt has undergone rapid development, with the length of transportation routes expanding significantly and consistently accounting for over 40% of the nation’s total. The evolution of transportation policy in the YREB can be categorized into three stages (Figure 2). The first stage is the early conception stage (1980–1992). In the 1980s, China’s central government put forward the strategic concept of “one line, one axis”. One line refers to the coastal line, and one axis refers to the Yangtze River. The second stage, the mid-term exploration stage (1992–2012), marked the YREB’s inclusion in a major national development strategy for the first time. During the 14th National Congress of the Communist Party of China (CPC) in 1992, it was proposed that Pudong’s development in Shanghai should spearhead the further opening of Yangtze River cities, boosting the economic growth of the Yangtze River Delta and the entire basin. In 2005, seven provinces and two cities along the river signed the “YREB Cooperation Agreement” to enhance transportation development, though administrative barriers often led to fragmented progress. The “Rise of Central China” strategy, introduced by the State Council in 2006, emphasized that accelerating transportation development was crucial for the region’s growth and its coordinated development. In 2010, Hubei Province released the “Master Plan for the Opening and Development of the YREB”, aiming to establish an integrated transportation system centered around the Yangtze River waterway. The third stage, the comprehensive development stage (2013 to present), began following the 18th National Congress of the CPC, marking a period of accelerated transportation development within the YREB. In 2013, General Secretary Xi Jinping highlighted the vision of transforming the entire Yangtze River basin into a golden waterway during an inspection in Wuhan. Subsequently, in 2014, the State Council unveiled the “YREB Comprehensive Three-dimensional Transportation Corridor Plan”, aiming to establish a complete three-dimensional transportation system by 2020. Following this, the Chinese government introduced several policies and plans that significantly boosted the transportation development of the YREB.
An analysis of the YREB’s policy timeline reveals that transportation construction has been a crucial component of the region’s development. For this study, the YREB has been chosen as the study area, aligning with China’s major strategic development initiatives. Moreover, studying the demand for transportation land serves as a fundamental element in supporting the coordinated and integrated development of regional transportation [56].

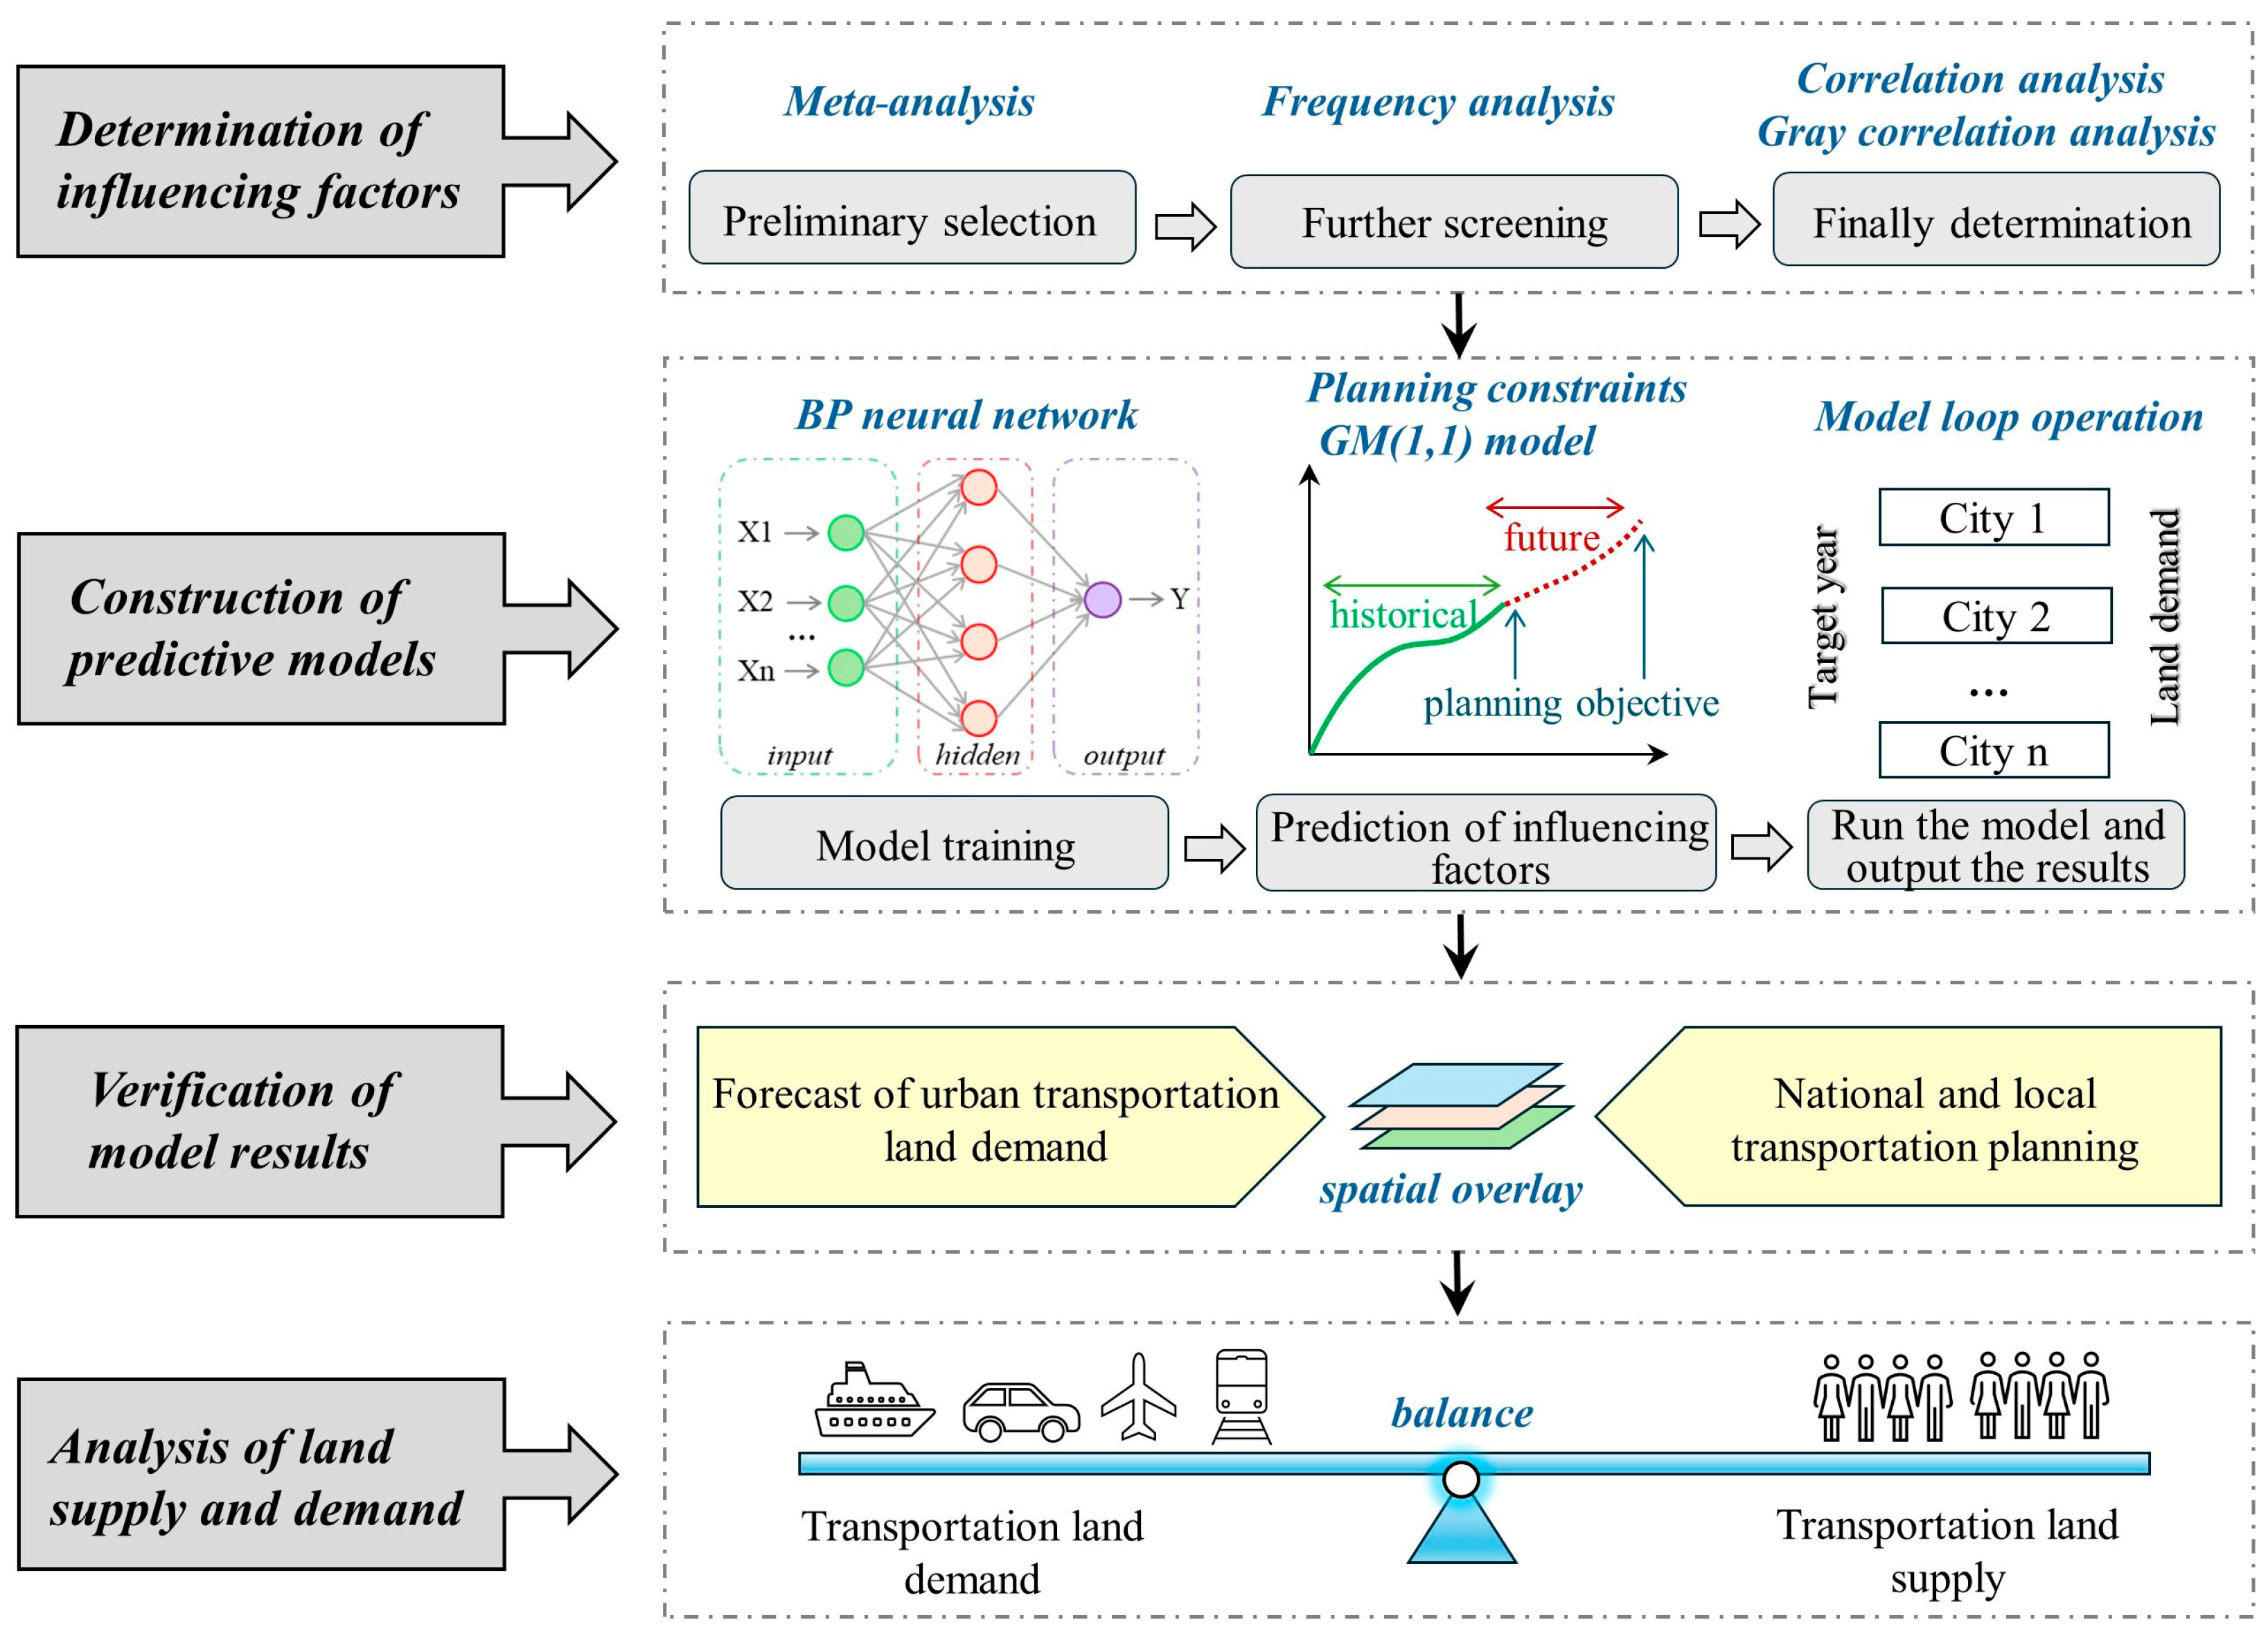
2.3. Considerations for the Study Framework

Under the new economic normal, the contradiction between the supply and demand of land resources in China remains a significant challenge. The scale of transportation land supply directly affects the potential and direction of urban transportation development. Over the past decade, transportation infrastructure in China has expanded rapidly, making the area of land allocated for transportation the largest among all types of urban construction land. Quantitative analysis of urban transportation land demand is essential for optimizing the allocation of regional land, providing decision-makers with guidance for future land supply plans to improve regional land use efficiency. This study aims to analyze the demand for urban transportation land in the Yangtze River Economic Belt (YREB) across four dimensions: identifying influencing factors, constructing models, verifying results, and conducting empirical analysis. The main contribution of this research framework is the development of an effective transportation land demand forecasting method system that assists decision-makers in formulating or adjusting future land use plans more effectively.
Identifying the influencing factors is a crucial initial step in estimating urban transportation land demand. To mitigate subjectivity in selecting factors, this study adopts a meta-analysis and develops a structured framework for screening main influencing factors. Initially, it involves reviewing the relevant literature and extracting essential information to pinpoint factors affecting transportation land demand. Preliminary selection of these factors is conducted through frequency analysis, with their validity further confirmed using statistical methods, ultimately determining the main influencing factors (Figure 3). Building on this, this study constructs a gray–BP neural network model under planning constraints and forecasts the transportation land demand of 127 cities in the YREB for the target year through influencing factor input, model training, and forecasting result output. In addition, a spatial overlay analysis between the forecasted transportation land demand and the planned transportation infrastructure network is conducted to further assess the model’s reliability. Lastly, a matching analysis between the forecasted transportation land demand and historical transportation land supply is performed, revealing supply–demand characteristics and informing future transportation land supply strategies. Forecasts of transportation land demand in regional cities offer valuable insights into the dynamics of transportation land use and identify cities with a greater need for transportation land supply. For cities experiencing a mismatch between transportation land supply and demand, these forecasts can guide the optimization of land allocation by adjusting land supply strategies accordingly.

2.4. Data Sources

The data used in this article are categorized into three types: official statistical data, spatial information data, and text data. The primary data for this study include transportation land area and land supply area. In this context, “transportation land” encompasses roads, railways, airports, ports, terminals, and transportation stations, excluding rural roads (Figure 4). The transportation land area data (2009–2020) were sourced from the land survey results shared via the application service platform of the Ministry of Natural Resources of China (https://gtdc.mnr.gov.cn/Share#/, accessed on 30 December 2023). Data on transportation land supply (2011–2020) were obtained from the China Land Market (https://landchina.com/#/, accessed on 30 December 2023). Socio-economic-related statistical data (2009–2020) were collected from the statistical yearbooks and statistical communiqué of the provinces and cities within the study area. Spatial information data include vector and raster data: vector data primarily define the administrative boundaries of the study area (national, provincial, and city boundaries) and are sourced from the standard map service of the Surveying and Mapping Department of the Ministry of Natural Resources of China (http://bzdt.ch.mnr.gov.cn/, accessed on 30 December 2023). Raster data mainly comprise transportation and land use planning maps that include spatial information about planned road networks, railway networks, waterways, and airports. Text data encompass provincial and municipal land spatial planning, land use master plans, and state-owned construction land supply plans, all of which are publicly released by the government.

2.5. Method

2.5.1. Determination of Main Factors Affecting Transportation Land Demand

We developed an empirical analysis methodology that integrates a systematic review of the literature to identify and synthesize the factors influencing urban transportation land demand. Initially, we adhered to the Preferred Reporting Items for Systematic Reviews and Meta-Analyses (PRISMA) protocol to identify potentially relevant studies from the literature databases [57]. Subsequently, factors impacting urban transportation land demand were derived through detailed literature review and critical information extraction. These influencing factors were then screened through frequency analysis and expert judgment. Finally, grey relation analysis and correlation analysis were employed to validate the relevance and applicability of these impact factors.
(1)
Methodology of the systematic literature review
The PRISMA protocol is extensively applied across diverse research fields, including socio-economic, environmental, land management, and sustainable development studies. It employs a structured approach to analyze data and evidence from existing research, significantly reducing author bias and thus enhancing the scientific integrity of the findings [58]. The PRISMA protocol outlines a four-stage systematic screening process for including and excluding publications in a review. First, using a defined search strategy, a total of 4055 papers were selected from the Web of Science (WoS) and China National Knowledge Infrastructure (CNKI) databases, with search terms applied exclusively to titles. The considered studies were limited to articles published in English or Chinese, including those in other languages with English translations, across peer-reviewed journals, conferences, and dissertations. The specific search terms used and the corresponding number of articles identified are detailed in Table 1. Secondly, duplicates were removed, and titles and abstracts were screened for relevance. Publications not directly related to our study objectives were then excluded. Finally, we read the full text of the remaining studies, and included 69 studies in our systematic review.
(2)
Grey correlation analysis
Grey correlation analysis, a multivariate statistical method, assesses the presence of connections and the degree of correlation among factors by comparing their change trends and differentiation magnitudes. It introduces the grey correlation degree as a quantitative index to gauge the correlation level between factors. Grey correlation analysis involves three main steps: First, dimensionless processing on the original data of factors necessary for this research is conducted. Second, the grey correlation coefficients between factors are calculated. Third, the grey correlation degree among factors is determined. The gray correlation degree is then utilized to compare and analyze the degree of connection between factors. The specific calculation process is as follows:
x i ( k ) = x i ( k ) x i ( 1 )
ε i k = min i min k   y ( k ) -   x i ( k ) + ρ max i max k   y ( k ) - x i ( k ) y ( k ) - x i ( k ) + ρ max i max k   y ( k ) - x i ( k )
r i = 1 n k = 1 n ε i k , k = 1 , 2 , n
where x i is the normalized value of variable i. x i is the raw value of variable i. x i ( 1 ) is the value of the first sample of variable i. y(k) is an ideal data set, and x(k) are the alternative data sets of the same length. n is the number of samples. k is the k-th sample. ε i k denotes the grey relational coefficients. ρ denotes the dynamic distinguishing coefficient, in the interval of 0–1; the value in this study is 0.5. r i denotes the grey relational degree.

2.5.2. Construction of Land Demand Forecasting Model of Gray–BP Neural Network under the Constraints of Planning Objectives

The backpropagation (BP) neural network algorithm is a multilayer feedforward network trained using the error backpropagation algorithm and stands as one of the most commonly used neural network models [59]. Compared to traditional statistical methods commonly used for land demand forecasting, such as trend extrapolation, regression analysis, and indicator-based methods, the BP neural network model excels in iterative learning through sample training and an error-limiting output mechanism, making it exceptionally suitable for nonlinear prediction tasks. Moreover, it can handle multiple input variables simultaneously, providing more comprehensive and accurate predictions. Existing research has also confirmed that the BP neural network model achieves high accuracy in complex land area demand forecasting [60]. However, forecasting land demand presents a complex socio-economic challenge, as nonlinear forecasting methods often struggle to accurately reflect the primary driving factors and their mechanisms. To address this, this study integrates grey system theory with the BP neural network model to improve the accuracy of land demand forecasting. Additionally, the GM(1,1) grey model is well adapted to constraints such as short data series, small sample sizes, and limited information, facilitating more precise predictions of short-term changes in sample data [61]. The specific forecasting process of this study involves training the historical data (2009–2020) on transportation land area and its influencing factors using a BP neural network to verify the model’s accuracy. Based on this, the influencing factors for the target year (2025) are predicted using GM(1,1) grey prediction and planning constraints, and these factors are then input into the trained neural network model to forecast the transportation land area for the target year. The computational procedures and formulas for both the BP neural network model and the GM(1,1) prediction model are detailed below:
  • BP neural network model
(1) Network initialization: Assign random numbers in the range of (−1, 1) to each connection weight, set the error function e, and give the calculation accuracy ε and the maximum number of learning times M. The formula is as in (4).
f x = 1 2 j = 1 n y i - y j 2
where n represents the output node, y i represents the actual output value, and y j represents the target output value.
(2) Weight correction: Calculate the output for each unit in the hidden and output layers based on the input sample values and expected output values; then, adjust the weights of each neuron’s input nodes according to the gradient direction. The formula is as follows:
ω ij = - η × ε ω ij = - η × ε I j × I j ω ij
where ω ij is the connected weights from node i to node j in the output layer; η is the learning efficiency value, and Ij is the transfer function of the jth hidden layer. The output layer to the hidden layer are tansig functions, while the hidden layer to the output layer are trainlm functions.
(3) Iteration: Select the next input mode and return to the second step. If the output layer does not produce the desired result, it sends an error signal back along the original connection pathway. Throughout the iteration process, the weights of each neuron are adjusted to minimize the error signal, and the process continues until the output error meets the specified accuracy requirement.
2.
GM(1,1) prediction model
Based on grey system theory, the GM(1,1) prediction model can utilize limited information to construct a model that closely approximates complete information by transforming time series data into differential equations using the differential fitting method. This model is extensively used in parameter prediction across socio-economic and ecological fields, demonstrating high accuracy for short- to medium-term forecasts, particularly for parameters with brief historical time series. The formula is as follows:
x ^ ( 1 ) ( k ) = x ^ ( 0 ) ( 1 ) - b a e - a ( k - 1 ) + b a , k = 1 , 2 , , n
where x ^ ( 0 ) ( 1 ) is the original data sequence in the urban transportation land demand system. x ^ ( 1 ) k is the accumulated value of the original data sequence. k is the time series. a is the development coefficient, which mainly controls the development trend of the system. b is the gray action quantity, which reflects the relationship between data changes.
To ensure the accuracy of the grey model, an error test is essential. The GM(1,1) model typically employs a post-test method for error testing. The formula used is as follows:
C = S 1 / S 0
P = P ε ( 0 ) k - ε ¯ ( 0 ) < 0.6745 S 0
where C is a posterior difference ratio, P is the small error probability, S 0 is the variance in the original sequence, S 1 is the variance in the residuals, and ε ( 0 ) is the residual. When C < 0.35 and P > 0.95, the model is generally considered to be reliable, and the model can be used for prediction.

3. Results

3.1. Main Factors Affecting Transportation Land Demand

Through a literature meta-analysis, we extracted factors that influence the demand for transportation land and grouped similar factors together. For instance, resident income and per capita disposable income were categorized under income levels. Using frequency analysis, we then filtered out infrequently mentioned factors, ultimately identifying 10 main influencing factors: economic development level, population size, investment level, urbanization level, urban construction level, industrial development level, income level, industrial structure, employment, and consumption level. These factors cover economic, demographic, social, and industrial aspects and commonly affect transportation land demand. Specifically, areas with a high level of economic development typically exhibit more frequent internal and external connections, thereby generally requiring more transportation land. Additionally, areas with high population densities and significant levels of urbanization see increased demand for travel. Social development levels, reflecting human well-being, directly impact the development of transportation infrastructure. Variations in industry types also influence inputs to the transportation sector.
Based on the screening of commonly influencing factors, a correlation matrix between multiple variables is constructed using statistical data from 127 prefecture-level administrative units in the YREB (Figure 5). By analyzing the correlation coefficients and significance levels, we can verify the applicability of these main influencing factors and explore the presence of multicollinearity among them. The results showed that, except for the correlation between investment and urban construction level, which was significant at the 0.05 level (p < 0.05), all other correlations were significant at the 0.01 level (p < 0.01), indicating a significant linear relationship between these influencing factors and transportation land demand. Comparing correlation coefficients, the strongest linear relationship was with urban construction level, with a coefficient exceeding 0.95. This was followed by the urbanization rate, total industrial output value, and the number of urban employees, all with coefficients above 0.6. Additionally, GDP, investment, and industrial structure had correlation coefficients above 0.5. Correlation analysis reveals that all the 10 main influencing factors obtained in this study have significant correlation with the transportation land area. In addition, the correlation analysis revealed a degree of multicollinearity among the influencing factors, necessitating the elimination of influencing factors with strong covariance to enhance the model’s accuracy. Consequently, we further refined the influencing factors through grey correlation analysis.
The results of the grey correlation analysis indicate that fixed asset investment (X3) has the most substantial impact, followed by population size (X2), urban construction level (X4), industrial development (X6), consumption level (X8), GDP (X1), employment (X10), income level (X7), urbanization rate (X5), and, finally, industrial structure (X9). Generally, a grey relational degree above 0.8 signifies a high correlation between two factors, a degree between 0.5 and 0.8 suggests a moderate correlation, and a degree below 0.5 implies a negligible or non-existent correlation. The grey relational degrees of all influencing factors exceed 0.5, confirming the suitability of the factors identified through the literature meta-analysis. All factors, except for X9, demonstrated a grey relational degree above 0.8 with transportation land demand. Due to the relatively low grey relational degree of X9 and its correlation coefficient with multiple other independent variables exceeding 0.8, this factor was excluded from further analysis. Consequently, this study identifies nine factors (X1, X2, X3, X4, X5, X6, X7, X8, X10) as determinants in developing a demand forecast model for urban transportation land (Table 2).

3.2. Forecasting Urban Transportation Land Demand in the YREB

3.2.1. An Empirical Result of Urban Transportation Land Demand Forecasting Models—Shanghai Example

To elucidate the process of urban transportation land demand forecasting, this study utilizes Shanghai, a leading city in the YREB, as a case study for empirical analysis. The nine main influencing factors outlined in Section 3.1 serve as input neurons for the neural network. Socio-economic data from Shanghai, covering the years 2009 to 2020, are employed as training samples. The BP neural network’s simulation and prediction code, developed using MATLAB R2020b, was executed with a maximum of 5000 training iterations and a minimum learning rate of 0.05. Following extensive debugging, the model achieved a minimal fitting residual of 0.000077 with an optimal hidden layer size of 12. The results from the trained BP neural network model demonstrate a low error margin, with the relative error of the simulated values for each year being less than 0.01, an average error of 0.0035, and a standard deviation of errors at 0.0031. These results indicate the high accuracy of the prediction model trained using the BP neural network, demonstrating its suitability for forecasting urban transportation land demand (Figure 6).
Leveraging the existing planning objectives of Shanghai and a grey prediction model, this study establishes the future values for each influencing factor for the year 2025 (Table 3). Specifically, the constrained target values of GDP, total retail sales of consumer goods, and per capita disposable income for 2025 are sourced from the Outline of Shanghai’s 14th Five-Year Plan. Meanwhile, the constrained target values of population size and urban construction land size are based on the Shanghai City Master Plan (2017–2035) and the Shanghai Territory Development Plan (2021–2035), respectively. For influencing factors without explicit planning targets, this study employs the grey prediction model to estimate their predicted values. On this basis, the planned or forecasted values of the influencing factors are substituted into the developed neural network simulation model to forecast the theoretical demand area of transportation land in Shanghai. According to the forecasted outcomes of this study, the urban transportation land area in Shanghai is predicted to reach 346.16 square kilometers by 2025, indicating that about 30 square kilometers of urban transportation land will need to be supplied during the 14th Five-Year Plan period (2021–2025).

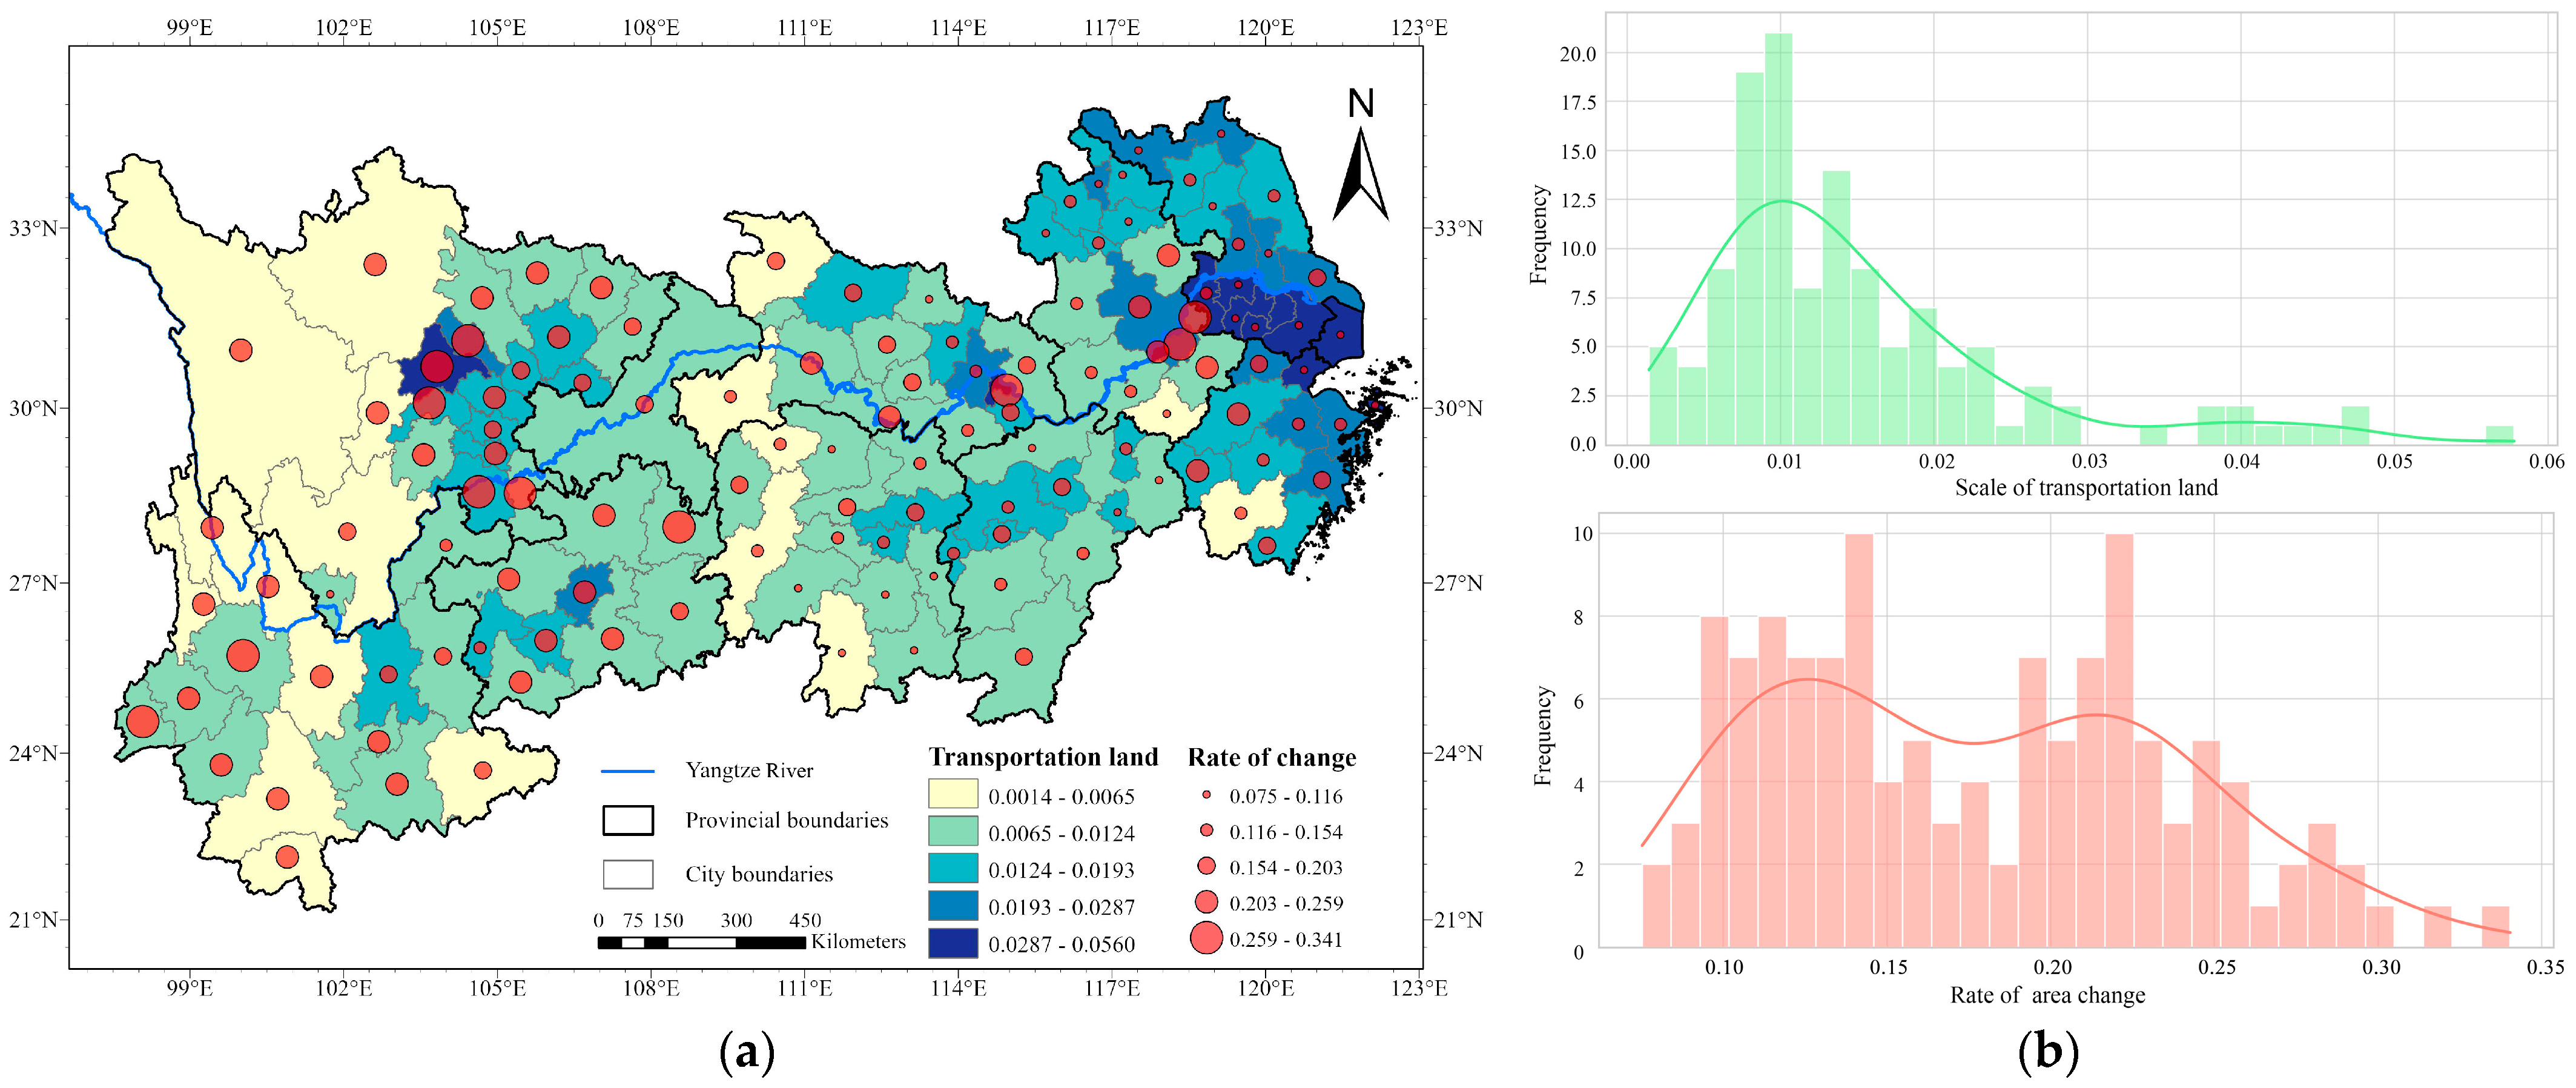
3.2.2. Comparative Analysis of the Differential Characteristics of Urban Transportation Land Demand in the YREB

Utilizing the grey-BP neural network land demand forecasting model, developed under the constraints of the planning objectives, this study forecasts the transportation land area for 127 cities in the YREB for the year 2025. By integrating these data with the transportation land area data from 2020, this study derives the projected transportation land area demand for these cities over the next five years. To eliminate potential biases in assessing urban transportation land use due to administrative division size, this study quantifies the scale of urban transportation land use through the ratio of urban transportation land area to total urban area.
Examining the spatial distribution of transportation land within the YREB reveals that the scale of urban transportation land in the lower reaches (Shanghai, Jiangsu, Zhejiang, and Anhui) significantly exceeds that in the middle (Jiangxi, Hubei, and Hunan) and upper reaches (Chongqing, Guizhou, Sichuan, and Yunnan). Furthermore, urban transportation land exhibits marked spatial agglomeration, with high-scale transportation land primarily located in three national urban agglomerations: the Yangtze River Delta urban agglomeration, the Yangtze River middle reaches urban agglomeration, and the Chengdu–Chongqing urban agglomeration. The scale of urban transportation land within each province of the YREB also presents a pattern of spatial reduction from central and sub-central cities to their surrounding cities. Furthermore, the scale of transportation land in cities within the YREB exhibits a marked left-skewed distribution, suggesting that urban transportation land scale across the YREB is predominantly low. This highlights significant polarization among cities and an uneven distribution of transportation land resources across the region.
Cities exhibiting higher demand for urban transportation land are predominantly located in the lower reaches of the Yangtze River. However, the analysis of the transportation land area growth rate between 2020 and 2025 indicates a faster expansion of urban transportation land in the middle and upper reaches of the Yangtze River. This suggests a strategic shift in the focus of transportation infrastructure development within the YREB towards these regions. The frequency curve of transportation land area growth rates within the YREB exhibits a bimodal distribution, with most cities distributed in the two ranges of 10–15% and 20–25%. Cities within the 10–15% range are mainly located in the middle and lower reaches of the Yangtze River, whereas those in the 20–25% range tend to be in the upper reaches. Notably, 15 cities exhibited a transportation land area growth rate exceeding 25%, with over 70% of these cities situated in the upper reaches. The coordinated integration strategy for the YREB has catalyzed a pronounced regional radiating effect in transportation land demand, leading to significant growth in the transportation land area of cities surrounding these national urban agglomerations (Figure 7).

3.3. Validation of the Reasonableness of the Forecasted Results

To validate the rationality of the forecasted results from this study, the forecasted transportation land areas were spatially overlaid with the planned transportation infrastructure for the 14th Five-Year Plan period, including the planned highway network, railway network, high-grade waterways, and airports. A subsequent correlation analysis was conducted between the forecasted transportation land areas and the planned transportation infrastructure. The findings indicate that this study’s forecasted results largely align with the planning objectives set by government departments (Figure 8). Specifically, Chongqing emerges as the city with the highest demand for transportation land and the most extensive land transportation network planned from 2020 to 2025. Additionally, Chongqing is expected to construct two new civil airports within this period. In contrast, cities with lower demand for transportation land tend to have a more limited transportation infrastructure layout, and most of these cities are third- or fourth-tier cities, such as Maanshan, Huaibei, Xinyu, and Suining. Notably, underdeveloped marginal cities such as Liangshan Yi Autonomous Prefecture, Aba Tibetan and Qiang Autonomous Prefecture, and Garze Tibetan Autonomous Prefecture have smaller forecasted transportation land areas but larger planned transportation infrastructure networks. On the contrary, regional core cities such as Chengdu and Guiyang have larger forecasted transportation land areas but smaller planned transportation infrastructure networks.

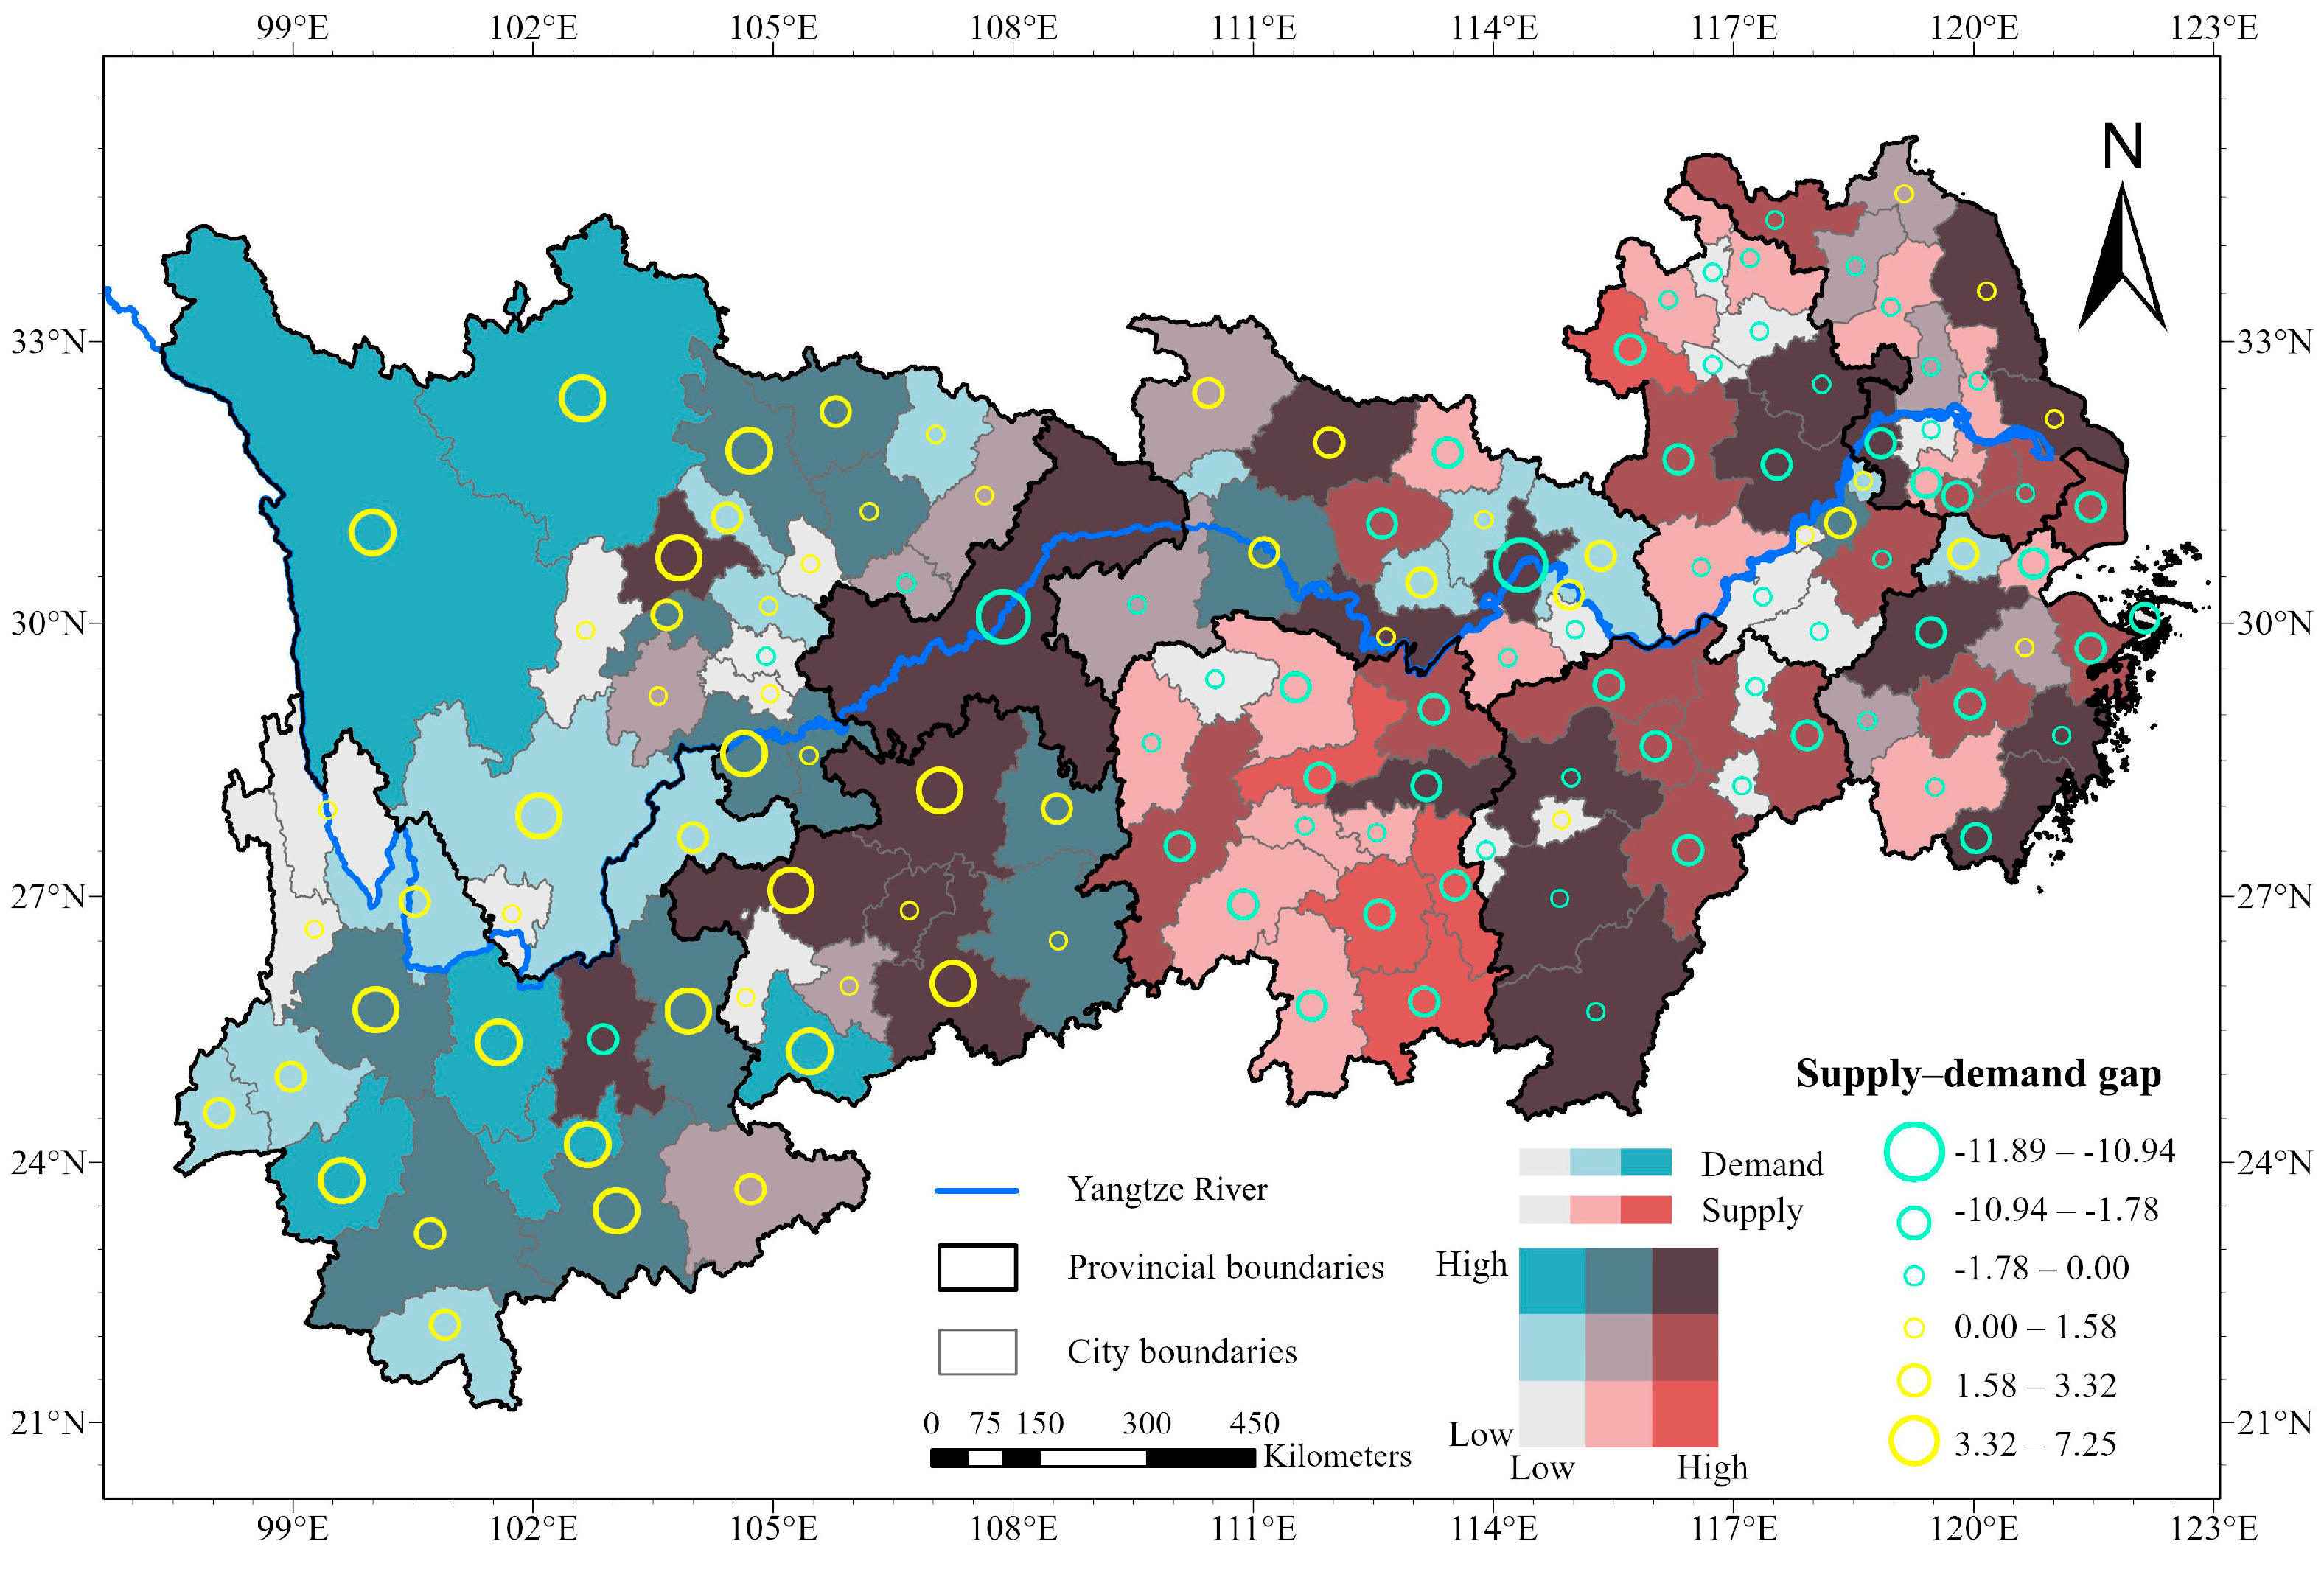
3.4. Analysis of Supply and Demand of Urban Transportation Land in the YREB

This study aligns the average annual demand for urban transportation land in the YREB from 2020 to 2025 with the average annual land supply from the 2011–2020 period (12th and 13th Five-Year Plans), providing a reference for future transportation land supply decisions in cities within the YREB. The results indicate that the demand for transportation land generally matches the historical supply in the YREB, with over half of the cities showing demand levels consistent with past supply. This suggests that these cities can draw from their historical land supply experiences when formulating new land supply plans. Specifically, cities with higher transportation land demand typically have higher historical land supplies and are often economically more developed or function as major regional transportation hubs, such as Chongqing, Hangzhou, Hefei, Changsha, Wuhan, Chengdu, and Kunming. Conversely, cities with lower transportation land demand, which have historically smaller land supplies, tend to be distant from the region’s core development areas, such as Yaan, Panzhihua, Nujiang Lisu Autonomous Prefecture, and Diqing Tibetan Autonomous Prefecture (Figure 9).
Despite efforts to match the demand and supply of transportation land in the YREB, significant mismatches still exist in some cities, with notable spatial disparities. Cities facing a high demand but low supply of transportation land are predominantly located in the upper reaches of the Yangtze River. These cities are often remote from core development areas and face challenges in expanding transportation infrastructure due to geographical constraints. Conversely, cities with low demand and high supply are mainly located in the middle and lower reaches of the Yangtze River, often near regional core cities. The influence of these core cities has intensified transportation infrastructure development in the surrounding areas over the past decade. There is a significant spatial aggregation in the mismatch between the demand for transportation land and the historical supply across the YREB. Cities with a demand significantly exceeding supply are in the upper reaches, whereas those with supply exceeding demand are primarily in the middle and lower reaches. Most provincial capitals have a historical average supply of transportation land that exceeds future demand. Thus, these cities should consider controlling their transportation land supply when formulating land supply plans. In less developed cities, it is common for the supply of transportation land to fall short of demand. The future land supply plans in these areas could consider increasing the supply of transportation land.

4. Discussion

4.1. Implications and Applications

China is a country of public ownership of land, where land is centrally managed and controlled by the State, and the government is responsible for the allocation, planning, and approval of land use [62]. As the conflict between urban growth and land availability in China intensifies, the rational allocation of land resources has become a crucial challenge for government departments. The question of how to utilize limited land resources to achieve sustainable development is a subject of ongoing debate [63,64]. Transportation land serves as vital infrastructure supporting both people’s livelihoods and economic activities, playing a significant role in a city’s capacity for population mobility, its economic growth potential, and the direction of its industrial development. Therefore, to promote coordinated and integrated regional transportation development, it is essential to optimize land use by addressing the variations in regional land demand. Developing the YREB as a strategic priority for China, the sustainable use of land resources plays a crucial role in supporting high-quality regional development. Furthermore, the YREB is actively engaged in constructing a comprehensive three-dimensional transport system to enhance both internal and external connections [65]. Consequently, accurately forecasting urban transportation land demand in the region is essential for crafting effective land supply strategies. However, studies focusing on regional urban transportation land demand are scarce, posing challenges to decision-making for optimal land resource allocation at the regional level. This study establishes a comprehensive framework for forecasting urban transportation land at the regional level, serving as a reference for the YREB to devise future transportation land supply plans and providing a foundation for systematic analyses of urban transportation land demand in other regions.
The foundation for accurately estimating regional transportation land demand lies in identifying the main factors that influence it. Compared to other types of built-up land, transportation land serves a broader array of functions, leading to a more complex set of factors influencing its demand. Therefore, decision-makers should thoroughly consider future regional socio-economic development when formulating land use plans. The core findings of this study reveal that socio-economic factors such as economic development, population size, industrial development, urbanization level, scale of urban construction, infrastructure investment levels, and the consumption and income of residents are the primary factors driving future demand for transportation land. Development plans formulated by central and local governments in China typically outline specific values for these key socio-economic factors. Almost every city presents expected economic and population sizes for the medium to long term within their national economic and social development plans, providing crucial data for forecasting future demand for transportation land. This study considers the factors affecting transportation land demand identified in previous research and refines and synthesizes these factors through meta-analysis. Compared to existing studies, the framework of influencing factors developed in this study is more applicable and comprehensive [5]. Furthermore, the model constructed in this study incorporates the constraints of future socio-economic development objectives, ensuring that the forecasted area of land for transportation aligns with future socio-economic goals and is deemed reasonable.
The results of forecasting regional urban transportation land demand can elucidate the spatial and temporal patterns of transportation development changes and provide essential guidelines for developing targeted land supply plans for the region. Although China is actively constructing a comprehensive three-dimensional transportation system in the YREB, this study reveals significant spatial disparities in the demand for transportation land across the region’s cities, aligning with the phased patterns of transportation development in China [66]. Initially, when transportation infrastructure is underdeveloped, the regional demand for transportation land is substantial, aiming primarily to expand the land allocation area. As transportation land expands, regional transportation development gradually matures, shifting the focus from increasing land supply to enhancing land use efficiency. For instance, core cities or major transportation hubs in the YREB have largely completed their comprehensive transportation networks, and their demand for transportation land is gradually decreasing as they shift towards improving land use efficiency. However, most cities in the YREB, characterized by limited transportation facilities and a single mode of transport, are experiencing a significant surge in transportation land demand driven by regional integration initiatives. Therefore, the allocation of regional transportation land should be tailored to the specific stages of urban transportation development, implementing differentiated land supply strategies. However, promoting integrated regional transportation development does not imply a large-scale supply of transportation land to areas with underdeveloped transportation infrastructure; instead, it requires ensuring that the transportation land supply plans can accommodate future development needs. The excessive supply of transportation land can lead to large tracts of unused land, thereby diminishing land use efficiency.
The alignment of supply and demand for regional transportation land constitutes the foundation for decision-making in developing future land supply strategies. While historical land supply data can serve as a reference for transportation land supply planning, it is crucial to thoroughly assess whether past supply levels align with future land demand. Therefore, analyzing the balance between supply and demand and identifying gaps in regional transportation land availability are critical steps for policymakers in developing future land supply strategies. By comparing the matching levels of transportation land supply and demand across the region, it becomes clearer which cities need to adjust their transportation land supply strategies. In cities with a high historical land supply but low future demand, this suggests that the city’s transportation infrastructure is gradually completing, and the area allocated for transportation land should be carefully controlled in the future to prevent excess supply. Conversely, in cities with a low historical land supply but high future demand, it indicates that transportation development is accelerating, and the area dedicated to transportation land should be increased to ensure that the supply meets the upcoming needs for transportation infrastructure construction.

4.2. Limitations and Prospects

Transportation land demand forecasting is a multifaceted study that necessitates a comprehensive consideration of socio-economic development and policy orientation, which leads to inevitable uncertainties in this study. To reduce the uncertainty associated with forecasting, this study presents a robust forecasting method for urban transportation land demand at the regional level, which enables decision-makers to identify areas with urgent transportation land demand and those where supply should be controlled. This study conducts transportation land demand forecasting for cities in the YREB using a unified framework that comprehensively considers the impact of socio-economic factors on land demand. However, the impact of policy factors on urban transportation land demand was not considered, which could lead to discrepancies between forecasted and actual demands. Typically, shifts in policy orientation can cause transportation land demand to diverge from normal socio-economic development patterns. For instance, increased government support for the development of regions with underdeveloped transportation infrastructure can lead to a short-term surge in transportation land demand. Such forecasts are subject to potential uncertainties due to policy changes. Guided by the principles of coordinated and integrated development, the YREB is actively constructing a comprehensive transportation system. We assume that local policy orientation within the YREB will remain relatively stable during the study period, with policy factors having a pervasive and significant influence across the region. This leads us to conclude that the primary determinant of urban transportation land demand is the region’s own development needs. Future research should further investigate the impact of policy changes on transportation land demand.
It is crucial to note that the forecasting framework in this study ensures high accuracy for short- and medium-term transportation land demand forecasts. However, the model’s uncertainty increases when applied to long-term land use forecasting (beyond ten years). Despite this, short- and medium-term forecasts provide practical guidance for development planning, while long-term planning focuses more on envisioning the future. Since this study accounts for the common influencing factors affecting transportation land demand and demonstrates robustness in short- and medium-term forecasts, the forecasting framework developed here can be applied to other regions in China, such as the Beijing–Tianjin–Hebei region, the Yellow River High-Quality Development Area, and the Pearl River Delta urban agglomeration. However, for practical applications, it is advisable for decision-makers to thoroughly consider the local development context and policy orientations to enhance the accuracy of the forecasting framework. Moreover, this study’s forecast of urban transportation land was limited to considering each city’s own future development, without including spatial influences from the model. Future research should explore the spatial interactions between cities and their neighboring or central counterparts, integrating these spatial impacts into the forecasting model to enhance its interpretability.

5. Conclusions

Clarifying land demand is crucial for the optimal allocation of regional land resources. In China, transportation land has been the largest category of construction land supplied over the last decade. Consequently, the accurate forecasting of transportation land demand is essential for developing effective future land supply strategies. This study presents a comprehensive framework for forecasting regional urban transportation land by employing a literature meta-analysis and statistical forecasting models and aligning with regional development goals, supporting the sustainable development of transportation infrastructure in the region.
The main achievement of this paper is the development of a comprehensive framework for forecasting transportation land demand at the regional level, which significantly guides the optimal allocation of regional transportation resources. This study finds that socio-economic factors, including economic development level, population size, urbanization level, urban construction scale, industrial structure, industrial development level, investment level, and resident income and consumption levels, predominantly influence transportation land demand. By 2025, cities with large-scale transportation land in the YREB will still be mainly concentrated in the lower reaches of the Yangtze River national urban agglomeration, and most of these cities are municipalities directly under the central government, provincial capitals, or core cities of regional development. However, transportation land demand in these cities is decelerating, and optimizing land use structure is becoming critical for enhancing land use efficiency. A high demand for transportation land is increasingly found in the middle and upper reaches of the Yangtze River, indicating a shift in the focus of transportation infrastructure development from the lower to the middle and upper reaches. The forecasting results of this study align with the goals of comprehensive transportation development planning set by government bodies, demonstrating the feasibility and applicability of the proposed forecasting framework. Cities with significant transportation land demand over the next five years are identified as major centers for transportation development in the YREB.
Despite general stability in the supply and demand levels for transportation land across most YREB cities, mismatches remain in some areas. Cities with historically high land supply but low current demand are predominantly distributed in the middle reaches of the Yangtze River. These cities have significantly increased their investment in transportation infrastructure over the past decade. However, the decreasing demand for land reminds these cities to control transportation land supply and prevent resource wastage by avoiding idle land. Conversely, cities with historically low land supply but high current demand are found in the upper reaches of the Yangtze River, typically distant from regional development cores and with slower transportation growth. As regional integration and development accelerate, enhancing transportation infrastructure in these cities is becoming crucial, and the area allocated for transportation land should be appropriately increased in the future.

Author Contributions

Conceptualization, L.W. and K.W.; methodology, J.Z. and K.W.; software, K.W.; validation, K.W. and L.W.; formal analysis, K.W.; data curation, K.W.; writing—original draft preparation, K.W.; writing—review and editing, K.W., J.Z. and L.W.; visualization, K.W. and L.W; supervision, L.W. and J.Z.; project administration, K.W.; funding acquisition, K.W. All authors have read and agreed to the published version of the manuscript.

Funding

This research was funded by the China Postdoctoral Science Foundation (Grant Number: 2023M733579) and the National Natural Science Foundation of China (Grant Number: 42301340).

Data Availability Statement

The data presented in this study are available upon request from the corresponding author. The data are not publicly available due to privacy.

Acknowledgments

The authors would like to thank the anonymous reviewers for their comments and suggestions.

Conflicts of Interest

The authors declare no conflicts of interest.

References

  1. Chen, G.; Li, X.; Liu, X.; Chen, Y.; Liang, X.; Leng, J.; Xu, X.; Liao, W.; Qiu, Y.a.; Wu, Q.; et al. Global projections of future urban land expansion under shared socioeconomic pathways. Nat. Commun. 2020, 11, 537. [Google Scholar] [CrossRef] [PubMed]
  2. Schuckmann, S.W.; Gnatzy, T.; Darkow, I.-L.; von der Gracht, H.A. Analysis of factors influencing the development of transport infrastructure until the year 2030—A Delphi based scenario study. Technol. Forecast. Soc. Chang. 2012, 79, 1373–1387. [Google Scholar] [CrossRef]
  3. Laurance, W.F.; Clements, G.R.; Sloan, S.; O’Connell, C.S.; Mueller, N.D.; Goosem, M.; Venter, O.; Edwards, D.P.; Phalan, B.; Balmford, A.; et al. A global strategy for road building. Nature 2014, 513, 229–232. [Google Scholar] [CrossRef] [PubMed]
  4. Dulac, J. Global Land Transport Infrastructure Requirements: Estimating Road and Railway Infrastructure Capacity and Costs to 2050; International Energy Agency: Paris, France, 2013. [Google Scholar]
  5. Zeng, L.; Li, H.; Wang, X.; Yu, Z.; Hu, H.; Yuan, X.; Zhao, X.; Li, C.; Yuan, D.; Gao, Y. China’s transport land: Spatiotemporal expansion characteristics and driving mechanism. Land 2022, 11, 1147. [Google Scholar] [CrossRef]
  6. Li, C.; Wu, K.; Gao, X. Manufacturing industry agglomeration and spatial clustering: Evidence from Hebei Province, China. Environ. Dev. Sustain. 2020, 22, 2941–2965. [Google Scholar] [CrossRef]
  7. Huang, Z.; Du, X. Government intervention and land misallocation: Evidence from China. Cities 2017, 60, 323–332. [Google Scholar] [CrossRef]
  8. Ewing, R.; Bartholomew, K. Comparing Land Use Forecasting Methods: Expert Panel versus Spatial Interaction Model. J. Am. Plan. Assoc. 2009, 75, 343–357. [Google Scholar] [CrossRef]
  9. Han, H.; Yang, C.; Song, J. Scenario Simulation and the Prediction of Land Use and Land Cover Change in Beijing, China. Sustainability 2015, 7, 4260–4279. [Google Scholar] [CrossRef]
  10. Li, B.; Cao, X.; Xu, J.; Wang, W.; Ouyang, S.; Liu, D. Spatial–Temporal Pattern and Influence Factors of Land Used for Transportation at the County Level since the Implementation of the Reform and Opening-Up Policy in China. Land 2021, 10, 833. [Google Scholar] [CrossRef]
  11. Aljoufie, M. Toward an effective analysis of public transportation demand factors in car-dependent cities: Case of Makkah City, Saudi Arabia. Urban Plan. Transp. Res. 2021, 9, 257–275. [Google Scholar] [CrossRef]
  12. Ma, L.; Liang, J.; Gao, D.; Sun, J.; Li, Z. The Future Demand of Transportation in China: 2030 Scenario based on a Hybrid Model. Procedia—Soc. Behav. Sci. 2012, 54, 428–437. [Google Scholar] [CrossRef]
  13. Magazzino, C.; Mele, M. On the relationship between transportation infrastructure and economic development in China. Res. Transp. Econ. 2020, 88, 100947. [Google Scholar] [CrossRef]
  14. Pradhan, R.P.; Bagchi, T.P. Effect of transportation infrastructure on economic growth in India: The VECM approach. Res. Transp. Econ. 2013, 38, 139–148. [Google Scholar] [CrossRef]
  15. Banerjee, A.; Duflo, E.; Qian, N. On the road: Access to transportation infrastructure and economic growth in China. J. Dev. Econ. 2020, 145, 102442. [Google Scholar] [CrossRef]
  16. Du, Q.; Wang, X.; Li, Y.; Zou, P.X.W.; Han, X.; Meng, M. An analysis of coupling coordination relationship between regional economy and transportation: Empirical evidence from China. Environ. Sci. Pollut. Res. 2022, 29, 34360–34378. [Google Scholar] [CrossRef]
  17. Liddle, B. Long-run relationship among transport demand, income, and gasoline price for the US. Transp. Res. Part D Transp. Environ. 2009, 14, 73–82. [Google Scholar] [CrossRef]
  18. Kim, E. Determinants of Optimal Level of Transportation Infrastructure. J. Urban Plan. Dev. 2002, 128, 150–163. [Google Scholar] [CrossRef]
  19. Fisch-Romito, V.; Guivarch, C. Transportation infrastructures in a low carbon world: An evaluation of investment needs and their determinants. Transp. Res. Part D Transp. Environ. 2019, 72, 203–219. [Google Scholar] [CrossRef]
  20. Feng, X.; Sun, Q.; Qian, K.; Liu, M. Cointegration Relationship of Regional Integrated Transport Demand and Industrial Structure. J. Transp. Syst. Eng. Inf. Technol. 2012, 12, 10–16. [Google Scholar] [CrossRef]
  21. Albalate, D.; Fageda, X. High-Technology Employment and Transportation: Evidence from the European Regions. Reg. Stud. 2016, 50, 1564–1578. [Google Scholar] [CrossRef]
  22. Maparu, T.S.; Mazumder, T.N. Transport infrastructure, economic development and urbanization in India (1990–2011): Is there any causal relationship? Transp. Res. Part A Policy Pract. 2017, 100, 319–336. [Google Scholar] [CrossRef]
  23. Yang, Z.; Jia, P.; Liu, W.; Yin, H. Car ownership and urban development in Chinese cities: A panel data analysis. J. Transp. Geogr. 2017, 58, 127–134. [Google Scholar] [CrossRef]
  24. Asher, S.; Garg, T.; Novosad, P. The Ecological Impact of Transportation Infrastructure. Econ. J. 2020, 130, 1173–1199. [Google Scholar] [CrossRef]
  25. Xi, F.; He, H.S.; Hu, Y.; Bu, R.; Chang, Y.; Wu, X.; Liu, M.; Shi, T. Simulating the impacts of ecological protection policies on urban land use sustainability in Shenyang-Fushun, China. Int. J. Urban Sustain. Dev. 2009, 1, 111–127. [Google Scholar] [CrossRef]
  26. Mishalani, R.G.; Goel, P.K.; Westra, A.M.; Landgraf, A.J. Modeling the relationships among urban passenger travel carbon dioxide emissions, transportation demand and supply, population density, and proxy policy variables. Transp. Res. Part D Transp. Environ. 2014, 33, 146–154. [Google Scholar] [CrossRef]
  27. Xiong, Y.; Chen, Y.; Peng, F.; Li, J.; Yan, X. Analog simulation of urban construction land supply and demand in Chang-Zhu-Tan Urban Agglomeration based on land intensive use. J. Geogr. Sci. 2019, 29, 1346–1362. [Google Scholar] [CrossRef]
  28. Plakandaras, V.; Papadimitriou, T.; Gogas, P. Forecasting transportation demand for the U.S. market. Transp. Res. Part A Policy Pract. 2019, 126, 195–214. [Google Scholar] [CrossRef]
  29. Benjamin, J. A time-series forecast of average daily traffic volume. Transp. Res. Part A Gen. 1986, 20, 51–60. [Google Scholar] [CrossRef]
  30. Mrówczyńska, B.; Łachacz, K.; Haniszewski, T.; Sładkowski, A. A comparison of forecasting the results of road transportation needs. Transport 2012, 27, 73–78. [Google Scholar] [CrossRef]
  31. Li, Z.; Hensher, D.A. Toll Roads in Australia: An Overview of Characteristics and Accuracy of Demand Forecasts. Transp. Rev. 2010, 30, 541–569. [Google Scholar] [CrossRef]
  32. Li, C.; Gao, X.; Wu, J.; Wu, K. Demand prediction and regulation zoning of urban-industrial land: Evidence from Beijing-Tianjin-Hebei Urban Agglomeration, China. Environ. Monit. Assess. 2019, 191, 412. [Google Scholar] [CrossRef] [PubMed]
  33. Batista e Silva, F.; Koomen, E.; Diogo, V.; Lavalle, C. Estimating Demand for Industrial and Commercial Land Use Given Economic Forecasts. PLoS ONE 2014, 9, e91991. [Google Scholar] [CrossRef] [PubMed]
  34. Shi, Y.; Li, M.; Fu, Y.; Wang, L.; Sun, M.; Hao, J. Multi-scenario traffic land demand forecasting based on grey system-BP neural network model: A case study of urban agglomeration in the middle reaches of the Yangtze River. J. China Agric. Univ 2020, 25, 142–153. [Google Scholar] [CrossRef]
  35. Jun, M.-J. Forecasting Urban Land-Use Demand Using a Metropolitan Input-Output Model. Environ. Plan. A Econ. Space 2005, 37, 1311–1328. [Google Scholar] [CrossRef]
  36. Xiao, J.; Shen, Y.; Ge, J.; Tateishi, R.; Tang, C.; Liang, Y.; Huang, Z. Evaluating urban expansion and land use change in Shijiazhuang, China, by using GIS and remote sensing. Landsc. Urban Plan. 2006, 75, 69–80. [Google Scholar] [CrossRef]
  37. Pastorino, M.; Gallo, F.; Di Febbraro, A.; Moser, G.; Sacco, N.; Serpico, S.B. Multimodal Fusion of Mobility Demand Data and Remote Sensing Imagery for Urban Land-Use and Land-Cover Mapping. Remote Sens. 2022, 14, 3370. [Google Scholar] [CrossRef]
  38. Hoymann, J. Quantifying demand for built-up area—A comparison of approaches and application to regions with stagnating population. J. Land Use Sci. 2012, 7, 67–87. [Google Scholar] [CrossRef]
  39. Jiang, H.; Guo, H.; Sun, Z.; Xing, Q.; Zhang, H.; Ma, Y.; Li, S. Projections of urban built-up area expansion and urbanization sustainability in China’s cities through 2030. J. Clean. Prod. 2022, 367, 133086. [Google Scholar] [CrossRef]
  40. Erb, K.-H. Actual land demand of Austria 1926–2000: A variation on Ecological Footprint assessments. Land Use Policy 2004, 21, 247–259. [Google Scholar] [CrossRef]
  41. Jackson, L.E.; Bird, S.L.; Matheny, R.W.; O’Neill, R.V.; White, D.; Boesch, K.C.; Koviach, J.L. A Regional Approach to Projecting Land-Use Change and Resulting Ecological Vulnerability. Environ. Monit. Assess. 2004, 94, 231–248. [Google Scholar] [CrossRef]
  42. Lee, C.; Lee, S. Analyzing spatiotemporal land use change using an urban growth model based on multilevel logistic regression and future land demand scenarios. Appl. Geogr. 2023, 160, 103099. [Google Scholar] [CrossRef]
  43. Ustaoglu, E.; Batista e Silva, F.; Lavalle, C. Quantifying and modelling industrial and commercial land-use demand in France. Environ. Dev. Sustain. 2020, 22, 519–549. [Google Scholar] [CrossRef]
  44. Wang, L.; Wang, K.; Zhang, J.; Zhang, D.; Wu, X.; Zhang, L. Multiple objective-oriented land supply for sustainable transportation: A perspective from industrial dependence, dominance and restrictions of 127 cities in the Yangtze River Economic Belt of China. Land Use Policy 2020, 99, 105069. [Google Scholar] [CrossRef]
  45. Sun, H.; Chen, Y.Y.; Fan, Z.Q. Study the Residential Land Demand by Ridge Regression and Multiple Linear Regression. Key Eng. Mater. 2011, 467–469, 1250–1255. [Google Scholar] [CrossRef]
  46. Samardžić-Petrović, M.; Kovačević, M.; Bajat, B.; Dragićević, S. Machine Learning Techniques for Modelling Short Term Land-Use Change. ISPRS Int. J. Geo-Inf. 2017, 6, 387. [Google Scholar] [CrossRef]
  47. Pijanowski, B.C.; Brown, D.G.; Shellito, B.A.; Manik, G.A. Using neural networks and GIS to forecast land use changes: A Land Transformation Model. Comput. Environ. Urban Syst. 2002, 26, 553–575. [Google Scholar] [CrossRef]
  48. Aburas, M.M.; Ahamad, M.S.S.; Omar, N.Q. Spatio-temporal simulation and prediction of land-use change using conventional and machine learning models: A review. Environ. Monit. Assess. 2019, 191, 205. [Google Scholar] [CrossRef] [PubMed]
  49. Rogan, J.; Chen, D. Remote sensing technology for mapping and monitoring land-cover and land-use change. Prog. Plan. 2004, 61, 301–325. [Google Scholar] [CrossRef]
  50. Hu, X.; Li, Z.; Cai, Y.; Wu, F. Urban construction land demand prediction and spatial pattern simulation under carbon peak and neutrality goals: A case study of Guangzhou, China. J. Geogr. Sci. 2022, 32, 2251–2270. [Google Scholar] [CrossRef]
  51. Almeida, C.M.D.; Monteiro, A.M.V.; Câmara, G.; Soares-Filho, B.S.; Cerqueira, G.C.; Pennachin, C.L.; Batty, M. GIS and remote sensing as tools for the simulation of urban land-use change. Int. J. Remote Sens. 2005, 26, 759–774. [Google Scholar] [CrossRef]
  52. Warth, G.; Braun, A.; Assmann, O.; Fleckenstein, K.; Hochschild, V. Prediction of Socio-Economic Indicators for Urban Planning Using VHR Satellite Imagery and Spatial Analysis. Remote Sens. 2020, 12, 1730. [Google Scholar] [CrossRef]
  53. Needham, B.; Louw, E.; Metzemakers, P. An economic theory for industrial land policy. Land Use Policy 2013, 33, 227–234. [Google Scholar] [CrossRef]
  54. Zhou, L.; Tian, L.; Cao, Y.; Yang, L. Industrial land supply at different technological intensities and its contribution to economic growth in China: A case study of the Beijing-Tianjin-Hebei region. Land Use Policy 2021, 101, 105087. [Google Scholar] [CrossRef]
  55. Miller, P.; de Barros, A.G.; Kattan, L.; Wirasinghe, S.C. Public transportation and sustainability: A review. KSCE J. Civ. Eng. 2016, 20, 1076–1083. [Google Scholar] [CrossRef]
  56. Chen, Y.; Zhang, S.; Huang, D.; Li, B.-L.; Liu, J.; Liu, W.; Ma, J.; Wang, F.; Wang, Y.; Wu, S. The development of China’s Yangtze River Economic Belt: How to make it in a green way. Sci. Bull. 2017, 62, 648–651. [Google Scholar] [CrossRef] [PubMed]
  57. Moher, D.; Liberati, A.; Tetzlaff, J.; Altman, D.G. Preferred Reporting Items for Systematic Reviews and Meta-Analyses: The PRISMA Statement. Ann. Intern. Med. 2009, 151, 264–269. [Google Scholar] [CrossRef] [PubMed]
  58. Matthew, J.P.; Joanne, E.M.; Patrick, M.B.; Isabelle, B.; Tammy, C.H.; Cynthia, D.M.; Larissa, S.; Jennifer, M.T.; Elie, A.A.; Sue, E.B.; et al. The PRISMA 2020 statement: An updated guideline for reporting systematic reviews. BMJ 2021, 372, n71. [Google Scholar] [CrossRef] [PubMed]
  59. Wong, F.S. Time series forecasting using backpropagation neural networks. Neurocomputing 1991, 2, 147–159. [Google Scholar] [CrossRef]
  60. Guan, Q.; Wang, L.; Clarke, K.C. An Artificial-Neural-Network-based, Constrained CA Model for Simulating Urban Growth. Cartogr. Geogr. Inf. Sci. 2005, 32, 369–380. [Google Scholar] [CrossRef]
  61. Ju-Long, D. Control problems of grey systems. Syst. Control. Lett. 1982, 1, 288–294. [Google Scholar] [CrossRef]
  62. Ding, C. Land policy reform in China: Assessment and prospects. Land Use Policy 2003, 20, 109–120. [Google Scholar] [CrossRef]
  63. Zander, P.; Kächele, H. Modelling multiple objectives of land use for sustainable development. Agric. Syst. 1999, 59, 311–325. [Google Scholar] [CrossRef]
  64. Mao, X.; Huang, X.; Song, Y.; Zhu, Y.; Tan, Q. Response to urban land scarcity in growing megacities: Urban containment or inter-city connection? Cities 2020, 96, 102399. [Google Scholar] [CrossRef]
  65. Ren, Y.; Tian, Y.; Xiao, X. Spatial effects of transportation infrastructure on the development of urban agglomeration integration: Evidence from the Yangtze River Economic Belt. J. Transp. Geogr. 2022, 104, 103431. [Google Scholar] [CrossRef]
  66. Jin, F.; Ding, J.; Wang, J.E.; Liu, D.; Wang, C. Transportation development transition in China. Chin. Geogr. Sci. 2012, 22, 319–333. [Google Scholar] [CrossRef]
Figure 1. Study area.
Land 13 00847 g001
Figure 2. Policy development timeline of the YREB.
Land 13 00847 g002
Figure 3. Research framework.
Land 13 00847 g003
Figure 4. Sample map of transportation land. (a) Highway land (Guiyang Longdongbao Bus Terminal); (b) railway land (Shanghai Hongqiao Railway Station); (c) port terminal land (Wuhan Yangluo New Port); (d) airport land (Chongqing Jiangbei Airport).
Land 13 00847 g004
Figure 5. Correlation matrix of main factors influencing urban transportation land demand. (X0, X1, X2, X3, X4, X5, X6, X7, X8, X9, and X10 represent transportation land area, GDP, population, investment, urban construction level, urbanization, industrial output, income level, consumption level, industrial structure, and employment, respectively.) Arabic numerals represent the Pearson correlation coefficient between the influencing factors. ***, ** are significance levels of 1%, 5%, respectively. The curves in the figure are kernel density estimates for different influencing factors.
Land 13 00847 g005
Figure 6. BP neural network sample simulation training results.
Land 13 00847 g006
Figure 7. Forecast of urban transportation land demand in the YREB in 2025. (a) Spatial distribution characteristics of transportation land demand in the YREB; (b) frequency density curve of transportation land scale and its change rate.
Land 13 00847 g007
Figure 8. Validation of forecasted results. (a) Spatial characteristics of forecasted transportation land demand and planned transportation network; (b) correlation analysis between forecasted transportation land demand and the planned transportation network.
Land 13 00847 g008
Figure 9. Characteristics of transportation land supply and demand in the YREB.
Land 13 00847 g009
Table 1. Search terms, sources, and the corresponding number of papers identified.
Search TermNumber of Publications from WoSNumber of Publications from CNKISearch Date
TITLE ((Transportation OR Transport OR Traffic OR Highway OR Road OR Railway OR Airport OR Port) AND land)31708856 November 2023
Table 2. Grey relational degree of factors affecting transportation land demand.
Influencing FactorsGrey Relational DegreeDescription
Economic development level (X1)0.85529GDP
Population size (X2)0.89608Number of individuals present
Investment (X3)0.90119Fixed-asset investment
Urban construction level (X4)0.88750Urban construction land area
Urbanization rate (X5)0.80576Ratio of urban population to total population
Industrial development (X6)0.87040Gross industrial output value
Income level (X7)0.83050Per capita disposable income
Consumption level (X8)0.85628Total retail sales of consumer goods
Industrial structure (X9)0.67864Ratio of secondary and tertiary industries to GDP
Employment (X10)0.85312Employed population
Table 3. Forecasting results of transportation land area and related influencing factors in Shanghai.
Factors 1Planned or Forecasted ValueMethods and Constraints
X149,392.8414th Five-Year Plan
X22500City’s master plan
X33200Territorial spatial plan
X40.9GM (1,1) model
X539,136GM (1,1) model
X610,265.15GM (1,1) model
X71400GM (1,1) model
X820,00014th Five-Year Plan
X998,648.3914th Five-Year Plan
Transportation land area in 2025346.16Gray–BP neural network model under planning constraints
1 The influencing factors X1, X2, X3, X4, X5, X6, X7, X8, and X9 represent GDP, population size, urban construction land area, urbanization rate, gross industrial output value, fixed-asset investment, employed population, total retail sales of consumer goods, and per capita disposable income, respectively.
Disclaimer/Publisher’s Note: The statements, opinions and data contained in all publications are solely those of the individual author(s) and contributor(s) and not of MDPI and/or the editor(s). MDPI and/or the editor(s) disclaim responsibility for any injury to people or property resulting from any ideas, methods, instructions or products referred to in the content.

