Article

Evaluation of Rice–Crayfish Field Fragmentation Based on Landscape Indices: A Case Study of Qianjiang City, China

1
Key Laboratory for Geographical Process Analysis & Simulation of Hubei Province, Central China Normal University, Wuhan 430079, China
2
College of Urban and Environmental Sciences, Central China Normal University, Wuhan 430079, China
*
Author to whom correspondence should be addressed.
Land 2024, 13(7), 1001; https://doi.org/10.3390/land13071001 (registering DOI)
Submission received: 31 May 2024 / Revised: 3 July 2024 / Accepted: 5 July 2024 / Published: 6 July 2024

Abstract

:
Since the 21st century, rice–crayfish fields have been widely distributed in the Yangtze River Basin in China. However, the spontaneous construction of these fields by farmers has given rise to the issue of rice–crayfish field fragmentation (RCFF) in certain areas. This study introduced a novel method for evaluating RCFF using township-level administrative regions as the evaluation units. Three key evaluation elements, including five landscape indices, were employed: area and edge metrics (rice–crayfish area ratio), shape metrics (perimeter–area ratio distribution), and aggregation metrics (rice–crayfish patch density, percentage of like adjacencies, and rice–crayfish contagion index). The RCFF was quantified and its spatial distribution pattern was analyzed through the entropy method and GIS spatial analysis. Empirical studies conducted in Qianjiang city yielded insightful results: (1) The contribution of evaluation elements to the RCFF was ranked in descending order as follows: aggregation metrics > shape metrics > area and edge metrics. (2) The RCFF of Yunlianghu farm was the lowest at 0.06, while the RCFF of Yangshi subdistrict 2 was the highest at 0.94. The spatial distribution of the RCFF exhibited a distinct trend, showing a gradual decrease from the northeast to the southwest in Qianjiang, and a low-RCFF area in the southwest. This evaluation system enables local government decisionmakers to comprehend the current status of rice–crayfish field management and construction. It facilitates the scientific planning of rice–crayfish field layouts and provides guidance for farmers in their expansion strategies. This method can be promoted in counties (cities) where rice–crayfish fields are primarily distributed in the Yangtze River Basin, promoting the transition of traditional agriculture to environmentally friendly agriculture in China.

1. Introduction

Food security is an global concern. The Green Revolution in the mid-20th century had greatly reduced the frequency of global famines [1]. However, the ever-increasing demand for food is placing higher requirements on the sustainability of agriculture [2]. Transforming our World: The 2030 Agenda for Sustainable Development outlined 17 Sustainable Development Goals (SDGs), giving equal importance to achieving zero hunger and protecting the ecological environment [3]. With the global population projected to continue growing, the demand for food is expected to increase by 1.1% per year until 2050, often conflicting with the preservation of the ecological environment during large-scale agricultural production [4]. To address this predicament, ecological agriculture is being applied to achieve harmony between agricultural production and environmental protection [5]. China has successfully developed numerous efficient and sustainable ecological agricultural models in farming practice. One such model is rice–fish co-cultivation, recognized by the Food and Agriculture Organization of the United Nations as a Globally Important Agricultural Heritage System (GIAHS) [6,7]. In the 1990s, the growing market demand for crayfish (Procambarus clarkii) in China gave rise to rice–crayfish co-cultivation [8], serving as a prominent example of integrated farming practices. Rice–crayfish co-cultivation has attracted extensive research attention due to its alignment with the SDGs related to food security, ecological benefits, and farmers’ livelihoods [9,10,11].
The rice–crayfish co-cultivation model is a complex agroecological model. This model requires digging an approximately 4 m wide and 1.5 m deep circular crayfish gully around the rice field to raise crayfish. The rice is harvested at the end of September to early October, after which crayfish larvae are put into the gully. Before rice transplanting in April to June of the following year, the crayfish are gradually harvested, and then the next co-cultivation cycle begins [12]. The crayfish in rice–crayfish fields utilize rice stubble as their food source [13], accelerating the conversion of rice stubble into humus and promoting small-scale soil biological cycles. This innovative model offers multiple benefits, including reducing reliance on pesticides and fertilizers, enhancing the organic matter content and carbon sequestration capacity of soil, reducing greenhouse gas emissions, improving the utilization of farmland resources, and increasing rice yield and farmer income [12,14,15,16,17,18]. Consequently, the area dedicated to rice–crayfish fields has experienced rapid growth in recent years, expanding from 5660 km2 to 15,600 km2 from 2017 to 2022. Currently, rice–crayfish fields are widely distributed across 24 provinces in China. In 2022, China recorded a total crayfish production of 2.89 million tons, with an output value of CNY 458 billion. Notably, out of the top four county-level administrative regions in terms of crayfish production, three are located in Hubei Province, namely, Jianli (162,700 tons), Honghu (133,200 tons), and Qianjiang (121,900 tons). Motivated by the allure of substantial profits, numerous farmers have spontaneously converted paddy fields and ponds into rice–crayfish fields [19]. Rice–crayfish fields in the southern part of Qianjiang city are mostly centrally managed by local governments or companies, such as Yunlianghu farm and Haokou town. In the northeastern part of Qianjiang, the levels of urbanization and industrialization are relatively high, and rice–crayfish fields are commonly managed and extensively farmed by individual farmers, such as in the Zhoujis subdistrict. These conditions result in irregular and scattered rice–crayfish fields [20] and present significant obstacles to the efficient mechanization and cohesive management of rice–crayfish fields. Since 2010, with the rapid expansion of rice–crayfish co-cultivation, the degree of cultivated land fragmentation in Qianjiang has continued to increase [21]. As a result, it has become imperative to evaluate rice–crayfish field fragmentation (RCFF).
Cultivated land fragmentation (CLF) refers to the breaking up of cultivated land caused by various natural or human factors [22]. Due to the influence of natural topography and the characteristics of small-scale farming economies, the cultivated land in China is generally fragmented and scattered. The land equalization system under the household contract responsibility system, in place since the 1980s, has further exacerbated the fragmentation of the cultivated land in China [23,24]. According to the Third National Agricultural Census in China, the average plot size of cultivated land is 0.144 hm2, which is only 4.97% of that in the Netherlands [25]. The escalating CLF poses challenges to farmers in terms of implementing large-scale mechanization, efficient management, and productive agricultural practices [26]. This situation leads to increased labor intensity and costs for farmers [27,28], consequently impeding the improvement in agricultural productivity [29,30]. Additionally, CLF could enhance the loss of soil nutrients, weaken the carbon sequestration capacity of cultivated land, reduce the value of agro-ecosystem services, and have adverse effects on agricultural production [31,32,33,34,35]. Given that rice–crayfish co-cultivation represents a unique agro-ecosystem model, the impact of RCFF on the sustainable development of rice–crayfish co-cultivation cannot be overlooked. Therefore, conducting a timely investigation on RCFF is crucial.
Landscape indices play a vital role in quantitatively capturing the characteristics of landscape patterns and their dynamics, facilitating the analysis of the relationship between landscape structure and various processes or phenomena [36]. Widely applied in investigating the CLF and its driving mechanisms [22], these indices have demonstrated success in diverse areas such as land use change [37], cultivated land quality evaluation [38], ecological security assessment of cultivated land [39], and prediction of the spatial distribution of soil organic carbon of cultivated land [40]. However, previous studies have primarily focused on assessing the regularity of individual plots, overlooking their contiguity and flexibility. Consequently, it has become imperative to develop a scientific and comprehensive evaluation system for RCFF that can effectively capture the spatial heterogeneity and connectivity of the landscape.
The fragmentation of rice–crayfish fields has a significant impact on the sustainability of rice–crayfish agro-ecosystems, necessitating the establishment of a scientific and comprehensive RCFF evaluation system. The results of such an evaluation can provide valuable insights for the ecological management of rice–crayfish fields, enhancing their ecological benefits. In this study, we focused on Qianjiang city, Hubei province, as our research area. Three key evaluation elements, including five landscape indices, were employed to quantify the RCFF: area and edge metrics (rice–crayfish area ratio), shape metrics (perimeter–area ratio distribution), and aggregation metrics (rice–crayfish patch density, percentage of like adjacencies, and rice–crayfish contagion index). Based on the rice–crayfish field special survey database in Qianjiang city, Fragstats 4.2 was employed to calculate these indices, establishing an evaluation system for RCFF. Spatial autocorrelation analysis and kernel density analysis were applied to analyze the spatial distribution characteristics of the RCFF in Qianjiang. The RCFF evaluation system developed in this study can be promoted in other counties (cities) where rice–crayfish fields are primarily distributed in the Yangtze River Basin, facilitating the sustainable development of rice–crayfish co-cultivation.

2. Materials and Methods

2.1. Study Area

Qianjiang city, Hubei province (112°29′ E~113°01′ E, 30°04′ N~30°39′ N), located in central China, is situated in the hinterland of the Jianghan Plain. Qianjiang city boasts an average elevation of 38 m and spans a total land area of 2004 km2. Nestled within the north subtropical monsoon humid climate zone, Qianjiang experiences an average annual temperature of 16.1 °C and an average annual precipitation of 1100 mm. Enriched by an extensive network of rivers and lakes, Qianjiang is bordered by the Han River to the north and the Yangtze River to the south, with a crisscrossing network of ditches and canals shaping its landscape. The Dongjing River and Xijing River meander through the entire region. As of 2020, the forest land occupied 9.32% of the total area of Qianjiang city, water bodies occupied 4.59%, and construction land occupied 10.13%. The cultivated land area in Qianjiang had expanded to 1205.25 km2, with paddy fields constituting 55.3% of the total. These paddy fields were primarily concentrated in perennial stagnant areas near low-wet waterfront lakes.
The inherent characteristics of Qianjiang, as the birthplace and central hub of rice–crayfish co-cultivation, position it as an ideal candidate for the transformation into rice–crayfish fields (Figure 1) [12]. From 2016 to 2020, the rice–crayfish field area in Qianjiang experienced a remarkable expansion, demonstrating an impressive average annual growth rate of 33.35%. According to the China Crayfish Industry Development Report, the crayfish production in Qianjiang has increased year by year. From 2016 to 2022, the average annual growth rate of crayfish production in Qianjiang reached 21.4%, the highest in Hubei province, with the production exceeding 120,000 tons in 2022. Moreover, Qianjiang’s National Modern Agriculture Industry Park, dominated by rice–crayfish co-cultivation, was selected as one of the first batches of national modern agriculture industry parks. The Hubei crayfish industry cluster, in which Qianjiang city participates, was selected for the list of advantageous and distinctive industry clusters for construction in 2020. In 2022, the comprehensive output value of the rice–crayfish industry in Qianjiang exceeded CNY 66 billion, indicating a promising development prospect for the rice–crayfish co-cultivation.
Qianjiang is administratively divided into three main types of township-level regions: subdistricts, towns, and farms. As of 2019, Qianjiang city had jurisdiction over 6 subdistricts, 10 towns, 6 farms, and 1 province-level economic development zone. Among these, the subdistricts primarily represent urban built-up areas, while the farms are established through governmental investments to facilitate large-scale intensive agricultural production in specific regions.

2.2. Data Sources

The rice–crayfish field distribution data used in this study were derived from the rice–crayfish field special survey result database of Qianjiang city. These data were verified onsite, plot by plot, by surveyors from the Qianjiang Natural Resources and Planning Bureau during the third national land survey, ensuring an accuracy rate of 100%. To facilitate further analysis, the vector data were converted into a 2 m × 2 m grid format using ArcGIS 10.7 software (ESRI)and subsequently exported as a GeoTiff file. The calculation of landscape indices was performed in Fragstats 4.2 software (copyrighted by Eduard Ene and Kevin Mcgarigal).
The socio-economic data utilized in this study was sourced from the China Crayfish Industry Development Report and the Qianjiang Statistical Yearbook (2020). These sources provided detailed information on various evaluation units in Qianjiang city, including evaluation unit area, crayfish production, crayfish industry output value, and so on. By relying on these reliable and up-to-date sources, the accuracy and validity of our socio-economic dataset were confirmed.

2.3. Methods

2.3.1. Determining Evaluation Units

Considering the specific development context of Qianjiang city, this study selected it as the research area, with a primary focus on evaluating the RCFF. Each township-level administrative region was treated as an evaluation unit for assessing the RCFF. To ensure the accuracy of our evaluation, certain regions lacking crayfish production data, such as Taifeng subdistrict, Haokou farm, Qianjiang Economic Development Zone, and Shayang’ Guanghua Prison, were excluded from the analysis. To differentiate between various scattered areas within the same administrative region, such as the Yangshi subdistrict, Xiongkou farm, and Yuyang town, numeric markings were added after region names. Moreover, due to the recent adoption of the urbanization development model in Zhouji farm, it has been integrated with surrounding towns. Therefore, Zhouji farm was categorized as a town in this study (Table 1).

2.3.2. Construct an Evaluation System

With the help of GIS, landscape indices provide a means to quantify landscape patterns, offering effective tools for analysis and evaluation of the CLF at the landscape level [41]. At the patch level, the landscape patterns are influenced by multiple factors, including the size, shape, edge effects, aggregation. Area and edge metrics offer insights into the characteristics and edge effects of patches, reflecting the fragmentation patterns of land cover. Shape metrics focus on the geometric shapes and fractal characteristics of patches, effectively capturing the geometric complexity of landscapes. Lastly, aggregation metrics illuminate the degree of patch dispersion in space, visualizing the “contagious” distribution process of patches [42].
To comprehensively describe the RCFF, with the above three metrics as evaluation elements, five landscape indices were selected. The area and edge metric included class area (CA); the shape metric included perimeter–area ratio distribution (PARA_MN); the aggregation metrics included patch density (PD), percentage of like adjacencies (PLADJ), and contagion index (CONTAG). All calculations were performed using Fragstat 4.2 software.
To ensure the comparability among the five landscape indices across different evaluation units, we accounted for the influence of the administrative area factor. Consequently, CA, PD, and CONTAG were improved to achieve consistency across evaluation units (Table 2). To distinguish these improved indices from original ones, the improved CA was named rice–crayfish area ratio (RCAR), the improved PD was named rice–crayfish patch density (RCPD), and the improved CONTAG was named rice–crayfish contagion index (RCCI).
The RCFF evaluation system was structured into three layers: target layer, element layer, and index layer [43,44]. Within the element layer, three categories were identified: area and edge metrics, shape metrics, and aggregation metrics. The area and edge metrics encompassed the RCAR, while the shape metrics comprised the PARA_NM. The aggregation metrics consisted of the PLADJ, RCPD, and RCCI (Table 3).

2.3.3. Calculating the RCFF

To address the issue of noncomparability arising from the varying dimensions of each landscape index, the range standardization method was employed to normalize the original data [45]. The calculation formulas are as follows:
Positive indices:
r i j = X i j X j m i n X j m a x X j m i n
Negative indices:
r i j = X j m a x X i j X j m a x X j m i n
Here, r i j represents the range-normalized value of evaluation index j for evaluation unit i; X i j represents the original value of evaluation index j for evaluation unit i; X j m a x represents the maximum original value of index j; X j m i n is the minimum original value of index j.
The entropy method is a method for calculating the weight of each index by comprehensively considering the information order degree in the evaluation indices [46]. It was used to determine the weight of each index in the evaluation system in this study. The calculation formulas are as follows:
P ij = r i j i = 1 m r i j
e i j = K i = 1 m P i j ln P i j
W j = ( 1 e j ) / j = 1 n ( 1 e j )
Here, i = 1, 2, …, m, m is the total number of evaluation units; j = 1, 2, …, n, n is the total number of evaluation indicators; r i j represents the index value of index j for evaluation unit i; P i j is the proportion of index j in evaluation unit i in the total index; e j is the information entropy of index j, 0 ≤ e j ≤ 1; K is the adjustment coefficient, K = 1 ln m ; W j is the weight of index j.
The weighted sum method was used to construct the RCFF. The calculation formula is as follows:
Y i = j = 1 n W j r i j
Here, Y i is the RCFF of evaluation unit i.
The natural breakpoint method was used in ArcGIS 10.7 to classify the five evaluation indices and the RCFF in each evaluation unit.

2.3.4. Spatial Analysis of the RCFF

The global spatial autocorrelation index (global Moran’s I) is commonly used to measure the overall spatial clustering or dispersion of geographic features in a study area [47]. It was used to measure the overall clustering degree of the RCFF in Qianjiang city. The calculation formula is as follows:
g l o b a l   M o r a n s   I = n W i = 1 n j = 1 n w i j x i x ¯ x j x ¯ i = 1 n x i x ¯ 2
Here, n is the number of evaluation units indexed by i and j; x is a variable of the RCFF; x ¯ is the mean of x; w i j is a matrix of evaluation units with zeroes on the diagonal; W is the sum of all w i j .
The standardized z value is commonly used to examine the significance level of Moran’s I. The calculation formula is as follows:
Z s c o r e = I E I V A R I
Here, E(I) is the expected value for autocorrelation; VAR(I) is variance; Z s c o r e is the threshold value representing the standardized statistic.
As the global Moran’s I can only reflect the overall distribution of variables, indicating whether there are clustering areas, it cannot precisely specify which areas are clustered. Therefore, we adopted the local spatial autocorrelation index (local Moran’s I) and used a LISA plot to analyze the spatial clustering areas of the RCFF [48]. The calculation formula is as follows:
l o c a l   M o r a n s   I = x i x ¯ j = 1 m w i j x j x ¯ 1 n i = 1 n x i x ¯ 2
Here, n is the total number of evaluation units; w i j is the spatial weight matrix; x i x ¯ and x j x ¯ are the difference between the observed value and the average value for unit i and unit j.
Kernel density analysis can reflect the distance decay effect in the spatial distribution of geographical features [49] and can be used to detect the hot and cold spots of spatial features. It was used to detect the hot and cold spot areas of RCFF in spatial distribution. The calculation formula is as follows:
f s = 1 n h i = 1 n k x x i h
Here, h is the bandwidth; n is the number of points within the bandwidth; k( ) is the kernel function; ( x x i ) is the distance between estimating point x and sample point x i .

3. Results

3.1. Spatial Distribution Characteristics of Indices

The rice–crayfish field patches in the northern part of Qianjiang were generally smaller, whereas those in the southern part were larger. Moreover, the distribution of RCAR in Qianjiang was spatially uneven. This disparity was exemplified by higher values of RCAR in the western part and lower values in the northeast (Figure 2a). Notably, due to the distinct rice–crayfish development patterns in Yunlianghu farm, it registered the highest RCAR value of 6.99, while Zhugentan town recorded the lowest value of 0.02. The coefficient of variation for RCAR was 83.79%, confirming significant differences in the RCAR among the evaluation units.
Figure 2. Distribution of five evaluation indices in Qianjiang city, including: (a) rice–crayfish area ratio (RCAR), (b) rice–crayfish patch density (RCPD), (c) perimeter–area ratio distribution (PARA_MN), (d) percentage of like adjacencies (PLADJ), (e) rice–crayfish contagion index (RCCI). For detailed classification information, please refer to Table 4.
Land 13 01001 g002
There were notable spatial differences in the density of rice–crayfish field patches, with lower values of RCPD observed in the west and higher values in the north (Figure 2b). Yangshi Subdistrict 2 held the highest RCPD value of 6.25, while the Xiongkou Farm 1 reported the lowest value of 0.02. This difference could be attributed to the collaborative efforts of Huashan Aquatic Products Co., Ltd., and Xiongkou farm in constructing several high-standard rice–crayfish fields, effectively reducing the RCPD. Notably, the coefficient of variation for RCPD was 96.82%, indicating a substantial variation in RCPD among the evaluation units.
The rice–crayfish field patches in the central and western part of Qianjiang City exhibited regular shapes, whereas those in the eastern part displayed irregular shapes. This distinction was evident from the indices, with lower values of PARA_MN observed in the central and western parts and higher values in the eastern part (Figure 2c). Notably, Zongkou farm registered the highest PARA_MN value of 1006.15, attributed to the comprehensive development of various industries here, where the rice–crayfish industry did not hold a dominant position, thereby affecting the regularization of the rice–crayfish field patches. Conversely, Xiongkou Farm 1 reported the lowest value of 72.66. Furthermore, the coefficient of variation for PARA_MN was calculated at 45.77%, indicating a certain level of variation in the PARA_MN among the evaluation units.
The rice–crayfish field patches in the southern part of Qianjiang demonstrated considerable continuity, while those in the northern part displayed a lower degree of continuity. This distinction was manifested in the indices, with higher PLADJ values observed in the southwest and lower values in the northeast, illustrating a gradual decline from the southwest to the northeast (Figure 2d). Notably, the coefficient of variation for PLADJ was 0.78%, indicating a relatively close mutual adjacency of rice–crayfish field patches among the evaluation units.
The rice–crayfish field patches in Qianjiang city exhibited a pronounced phenomenon of aggregation in the western part, while the aggregation degree was comparatively lower in the northeastern part. This contrast was reflected in the higher values of RCCI observed in the west and lower values in the northeast (Figure 2e). Notably, Haokou town presented the highest RCCI value of 2879.60, likely influenced by the presence of a crayfish breeding base established by Hubei Laike Aquatic Products Co., Ltd. in this region, resulting in a concentration of rice–crayfish field patches. On the other hand, Zhouji Farm 1 recorded the lowest value of 4.57. Additionally, the coefficient of variation for RCCI was calculated at 105.23%, indicating a significant variation in the RCCI among the evaluation units.

3.2. Comparison of Elements’ Contribution

Using the standardized landscape indices, the weights of the evaluation indices were calculated (Table 5).
The contribution of the three evaluation elements to the RCFF in Qianjiang city was ranked as follows: aggregation metrics made the highest contribution, followed by shape metrics, and then area and edge metrics. In the RCFF evaluation system, the area and edge metrics carried a weight of 0.1292, while the shape metrics had a weight of 0.1416. Together, they greatly influenced the RCFF in the southwestern part of Qianjiang city. However, the aggregation metrics, with a weight of 0.7292, exerted the most substantial influence on the distribution pattern of the RCFF, characterized by being high in the northeast and low in the southwest.

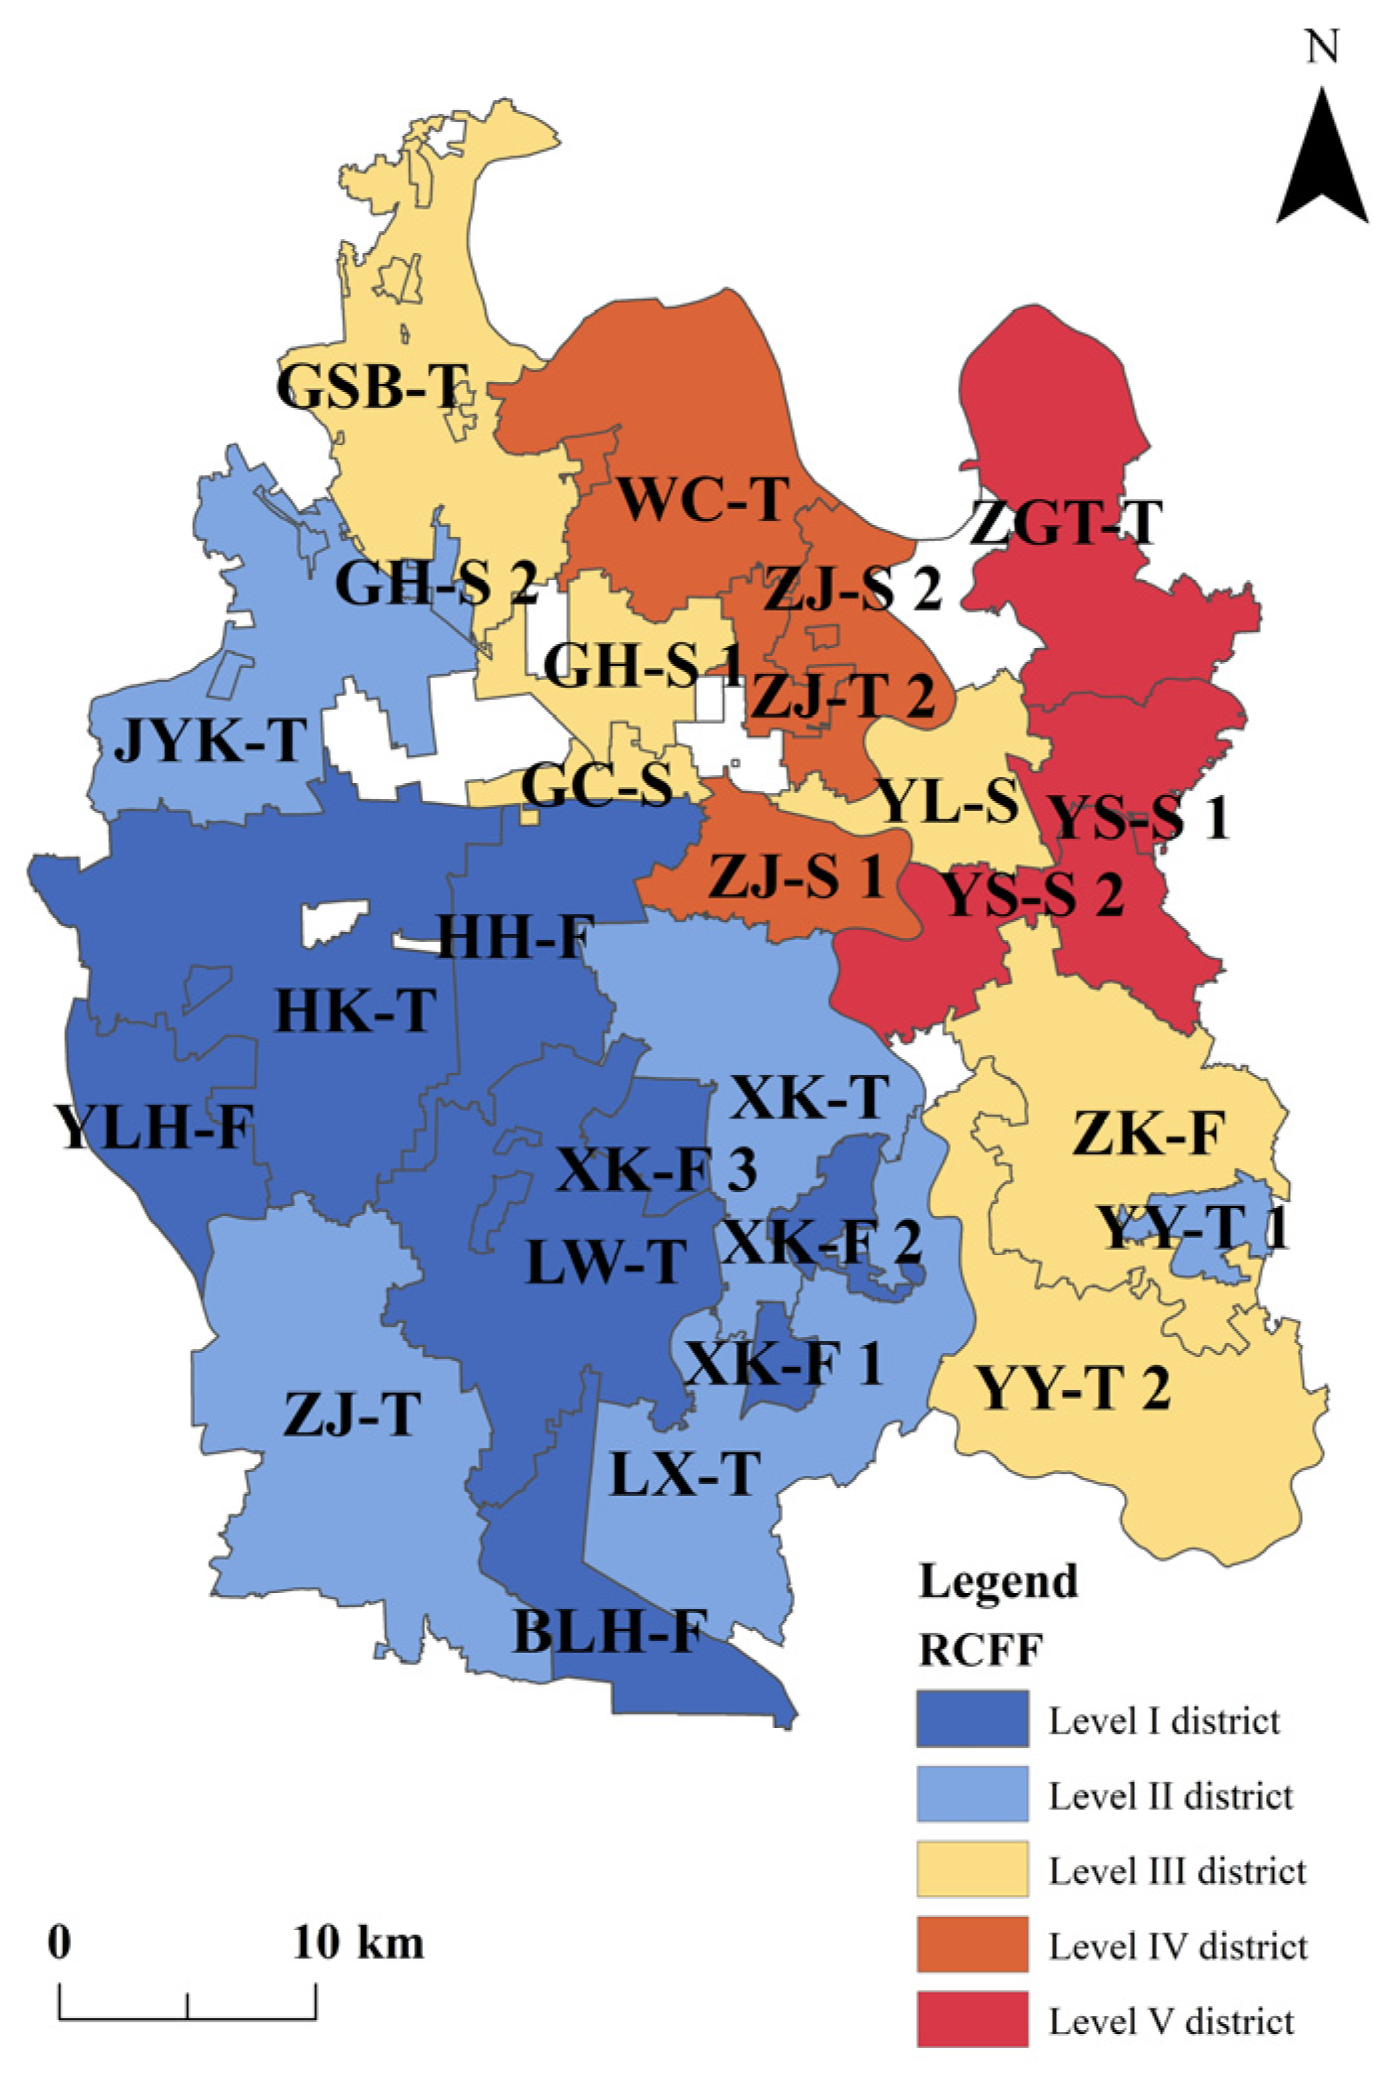
3.3. RCFF Evaluation Results

The RCFF of each evaluation unit was calculated using the weights in Table 5. The RCFF of Yunlianghu farm was the lowest, at 0.06, while the RCFF of Yangshi Subdistrict 2 was the highest at 0.94. Employing the natural breakpoint method, these evaluation units were classified into five equal-value zones: Level I districts (0.06–0.21), Level II districts (0.214–0.35), Level III districts (0.35–0.51), Level IV districts (0.51–0.71), and Level V districts (0.71–0.94) (Figure 3). The RCFF in Qianjiang exhibited significant spatial differentiation across the evaluation units, following a distribution pattern characterized by being “high in the east and low in the west, high in the north and low in the south, gradually decreasing from the northeast to the southwest”. Among these evaluation units, Yunlianghu farm showcased the lowest RCFF, while Yangshi Subdistrict 2 reported the highest RCFF.
The Level I districts of the RCFF were primarily located in the western and central-southern part of Qianjiang, covering the largest expanse of rice–crayfish fields (223.67 km2). The Level II districts were dispersed across the central, southern, and northwestern regions of Qianjiang, surrounding the Level I districts and encompassing a relatively large area of rice–crayfish fields (157.53 km2). The Level III districts were found in the northern and eastern parts of Qianjiang, ranking third in terms of rice–crayfish field area (60.12 km2), with Zhangjin town exhibiting a relatively large proportion. The Level IV districts, characterized by a higher RCFF, were situated in the northern part of Qianjiang, ranking fourth in terms of rice–crayfish field area (8.40 km2). The Level V districts, characterized by the highest RCFF, were located in the northeastern part of Qianjiang, representing the smallest area of rice–crayfish fields (1.62 km2).
Through the analysis of evaluation unit types, it was observed that the Level I districts were predominantly situated in the southwestern farms, characterized by concentrated and contiguous rice–crayfish fields. These farms enjoyed the advantages of well-developed infrastructure and favorable location conditions for rice–crayfish co-cultivation. The Level II districts were primarily distributed in towns surrounding the southwestern farms, forming a transitional zone influenced by farms. In contrast, the Level III, Level IV, and Level V districts were mainly found in other towns and subdistricts, with relatively fewer rice–crayfish fields.
The RCFF and range-standardized area and edge metrics, shape metrics, aggregation metrics were all ranked in ascending order. However, there were interesting variations in the rankings. For instance, Haokou town ranked fifth in the RCFF, yet its range-standardized area and edge metrics ranked eleventh. This discrepancy suggested that the RCAR played a crucial role as a factor limiting the RCFF in Haokou town. The range-standardized shape metrics ranks of Xiongkou Farm 3, Zongkou farm, Laoxin town, and Xiongkou town were significantly lower than their respective RCFF ranks. This implied that the rice–crayfish field patches in these areas exhibited irregular shapes, contributing to a higher PARA_MN. Furthermore, the range-standardized aggregation metrics ranks of Xiongkou Farm 1 and Guanghua subdistrict were significantly lower than their respective RCFF ranks. This highlighted the importance of PLADJ, RCCI, and RCPD as influential factors affecting the RCFF in these particular areas.

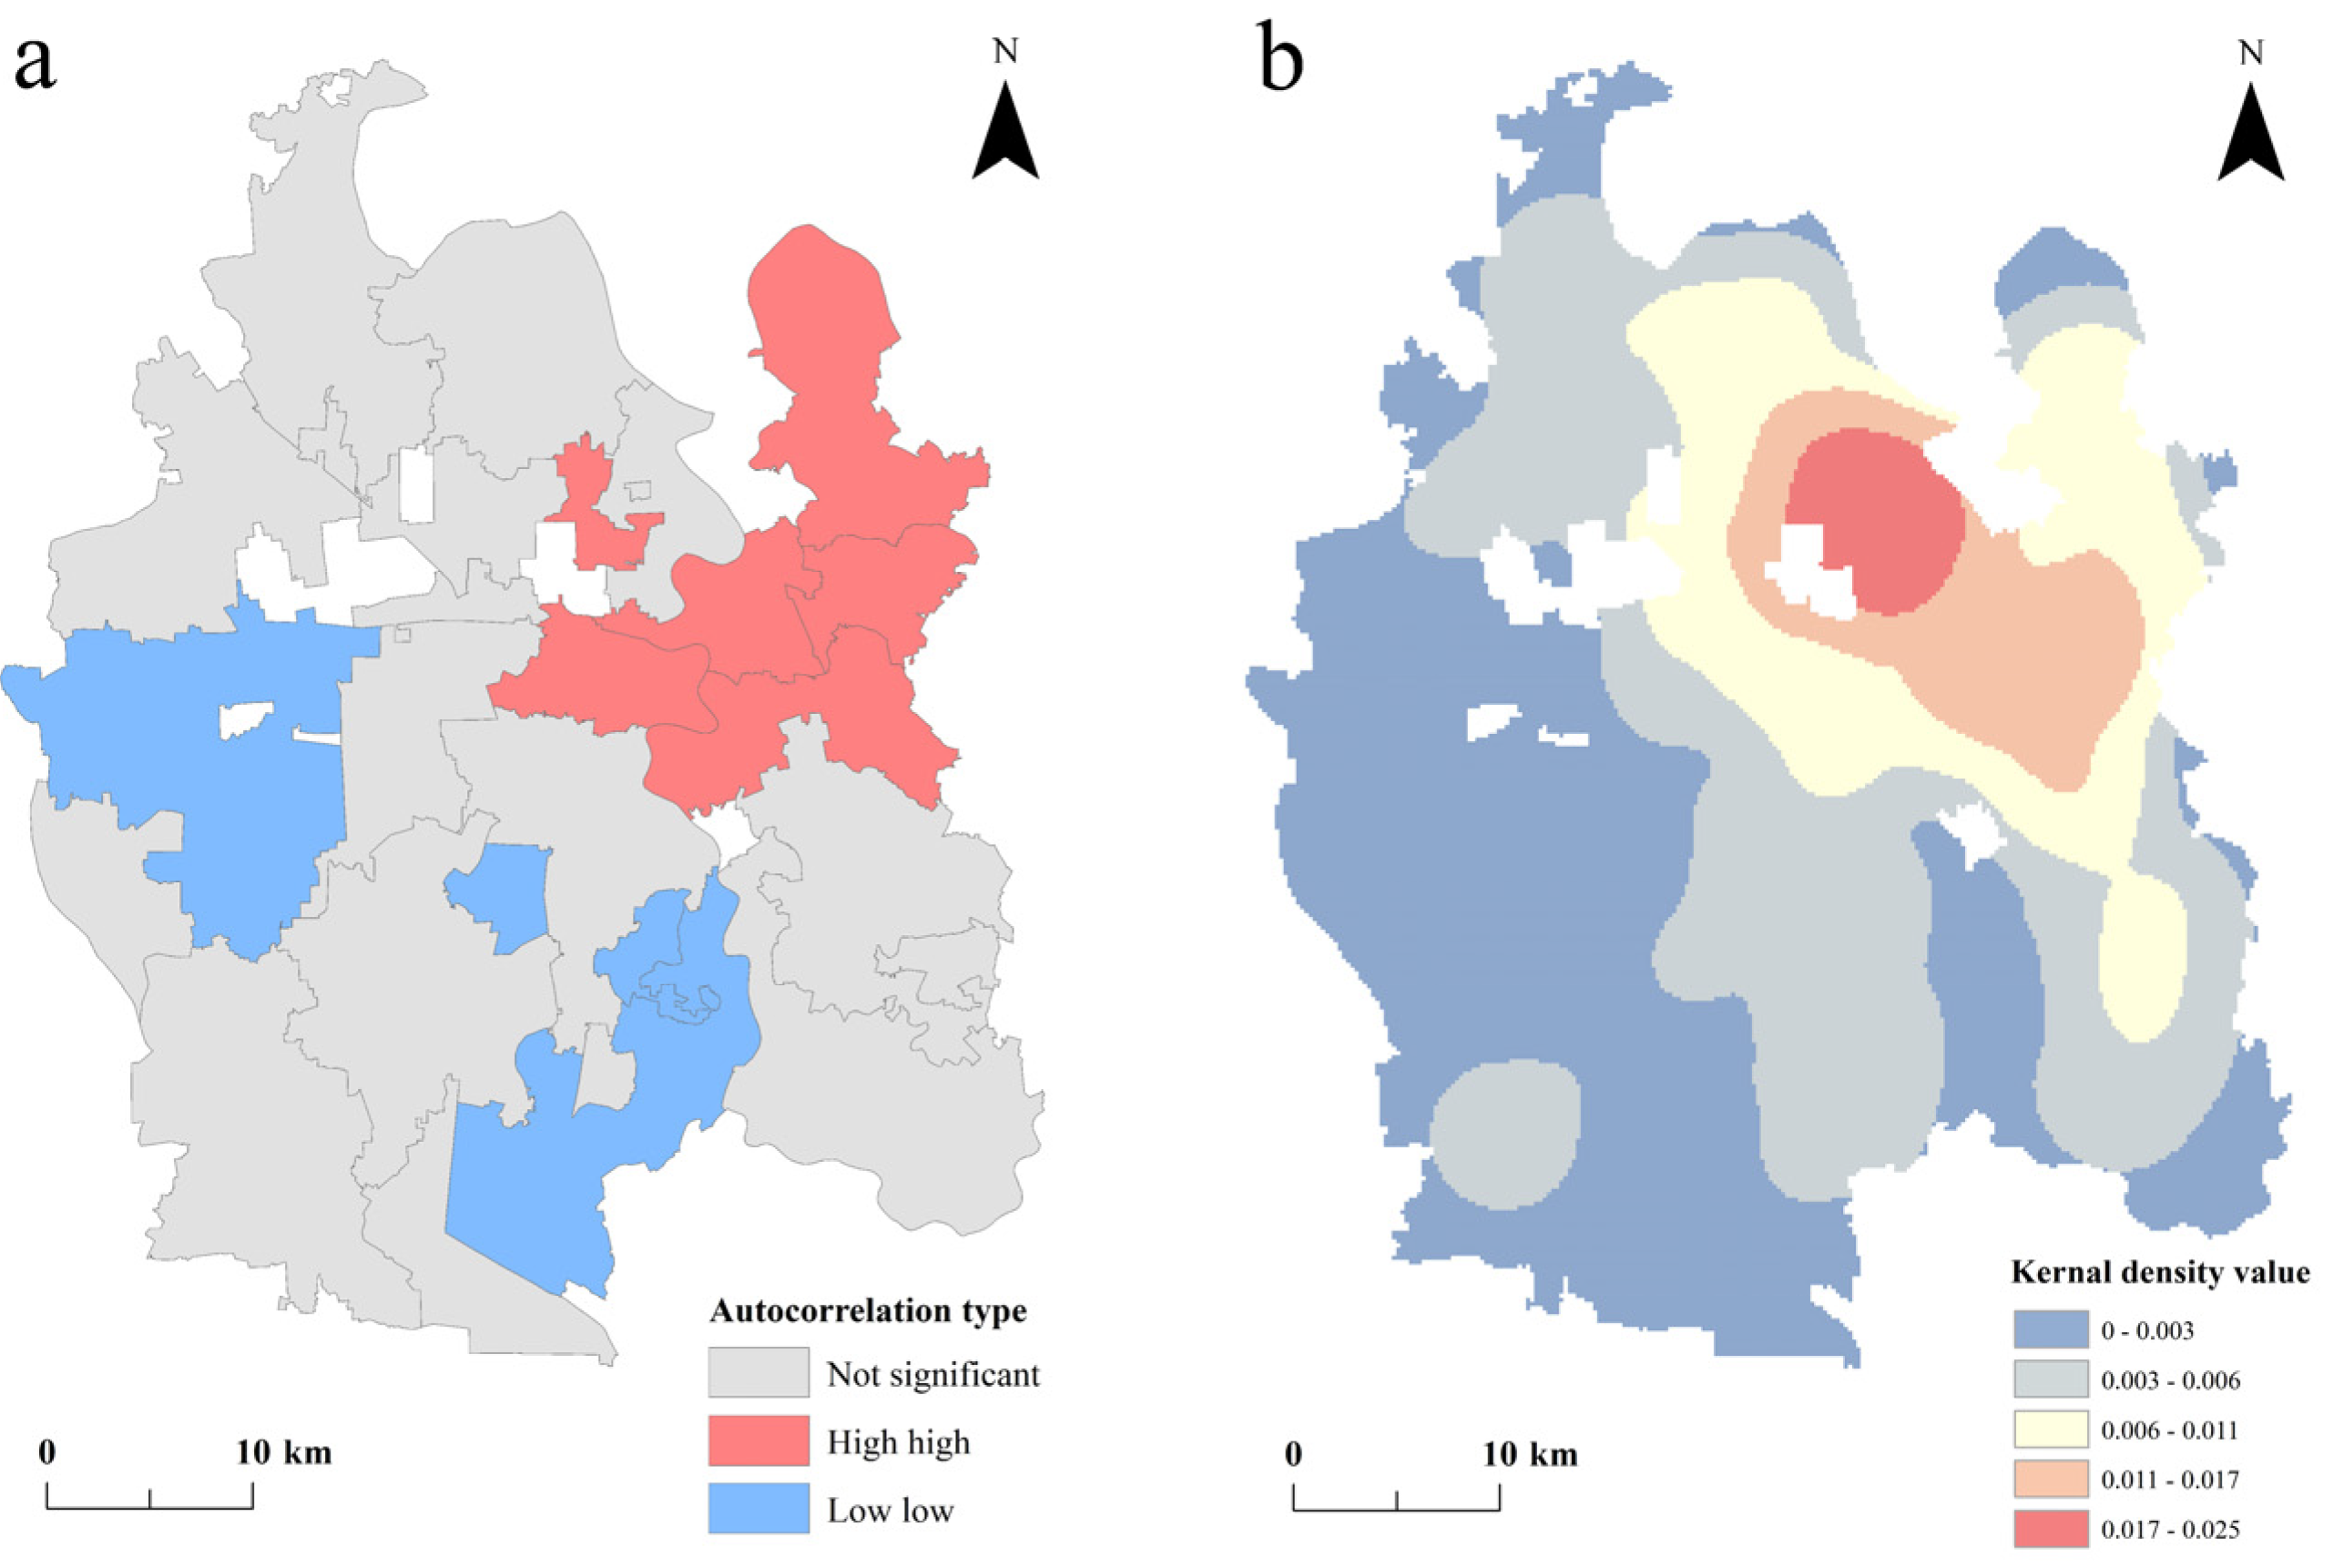
3.4. Spatial Characteristics Analysis of the RCFF

From the overall perspective of Qianjiang city, the global Moran’s I of the RCFF stood at 0.65, with a z-score of 4.45. This indicated that the RCFF in Qianjiang exhibited strong spatial clustering.
At the township level, a local spatial autocorrelation analysis of the RCFF was conducted. The LISA plots for the RCFF (Figure 4a) show that there was significant spatial heterogeneity in the RCFF. The northeastern part was a high–high cluster area, indicating that high RCFF evaluation units were surrounded by high RCFF evaluation units, while the southwestern part was a low–low cluster area, indicating that low RCFF evaluation units were surrounded by low RCFF evaluation units.
A kernel density analysis was conducted on the RCFF, and the results indicated that the northeastern part of Qianjiang was a hot spot for the RCFF (Figure 4b). In these areas, subdistricts and towns were the two main types of evaluation unit. In contrast, the southwestern part of Qianjiang was a cold spot for the RCFF, with farms being the main type of evaluated unit. The significant contrast in the RCFF between these two areas suggested that farms demonstrated a higher level of standardized construction and management of rice–crayfish fields than subdistricts and towns. This disparity emphasizes the need to reorganize rice–crayfish field patches in towns and subdistricts to mitigate the RCFF.

4. Discussion

4.1. Quantitative Evaluation of the RCFF

This paper proposed a method for evaluating RCFF. This method explicitly recognizes that RCFF is influenced by three key elements, including area and edge metrics, shape metrics, and aggregation metrics. The RCAR index was selected to express area and edge metrics; the PARA_MN index was selected to express shape metrics; and the PLADJ, RCPD, and RCCI indices were selected to express aggregation metrics. Using these five indices, an RCFF evaluation system was established. After determining the weights through the entropy method, RCFF was calculated using a weighted sum method, enabling a quantitative assessment of the degree of rice–crayfish field fragmentation. This method provides not only a theoretical foundation for comprehending the development status of rapidly expanding rice–crayfish fields but also technical support for local government decisionmakers in controlling and guiding the construction of rice–crayfish fields.
Rice–crayfish fields represent a new form of land use that combines the functionalities of rice production and aquaculture [50,51]. Therefore, in terms of fulfilling the rice production function, this study drew inspiration from the evaluation methodology applied to the CLF [52,53]. Specifically, we employed RCAR as an area and edge metric and PARA_MN as a shape metric. These indices were chosen to articulate the area and shape characteristics of rice–crayfish fields, effectively capturing the geometry features of the landscape formed by rice–crayfish field patches [42].
However, to achieve crayfish farming, in addition to building ditches and roads like with traditional farmland, rice–crayfish fields also require the establishment of supporting power facilities. These facilities require the installing of electricity grids in fields, facilitating regular water replacement and purification, thereby maintaining optimal water quality [9,16]. Clustering rice–crayfish fields prove advantageous, as it reduces the installation costs of power facilities and enhances electricity utilization efficiency. Conversely, a low degree of clustering escalates the costs for farmers. Furthermore, proper tailwater treatment is imperative of the wastewater discharged from rice–crayfish fields. In instances of low clustering, centralized purification of tailwater becomes challenging, potentially impacting the ecological environment of rice–crayfish fields [54]. Therefore, PLADJ was selected to reflect the adjacency between rice–crayfish fields patches, while RCPD and RCCI were chosen to represent the density and clustering of these patches. Collectively, these three indices effectively conveyed the clustering characteristics of rice–crayfish fields [42].

4.2. Ecological Significance of the Evaluation

Rice–crayfish co-cultivation offers substantial ecological benefits, representing a sustainable agricultural model with positive environmental impacts [55,56,57]. Throughout the rice growth cycle, crayfish activities such as feeding, excretion, and burrowing, collectively influence the energy flow and material cycle within the rice–crayfish field ecosystem. In comparison to traditional rice monoculture, rice–crayfish co-cultivation produces a notable increase in total organic carbon (TOC) in the deep soil, registering a remarkable 31.6% rise in the 30–40 cm soil layer. Beyond soil health, rice–crayfish co-cultivation yields additional advantages, including a 56% reduction in nitrogen fertilizer input, a 75% decrease in pesticide input, and a 58% reduction in fish drug input [58]. These reductions contribute to mitigating the risk of eutrophication in the water bodies hosting aquaculture. Additionally, rice–crayfish co-cultivation leads to an 18.1–19.6% reduction in methane emissions and a 16.8–22.0% decrease in global warming potential, underscoring its positive ecological benefits [59]. These studies have revealed the ecological advantages of rice–crayfish cultivation from a micro perspective. In contrast, this study primarily explored the development status of rice–crayfish co-cultivation from the perspective of agricultural landscapes. In Europe and North America, large-scale homogeneous agricultural landscapes are often associated with a decline in biodiversity and a reduction in the amount of edge habitats [60,61,62]. Therefore, increasing the heterogeneity of cultivated landscapes to protect biodiversity in agricultural ecosystems has become a major goal of agricultural management in these regions [63]. However, in China, where cultivated land fragmentation is obvious, the negative impacts of RCFF might outweigh its positive effects when the plot size is very small. Applying the same heterogeneity goals to all landscapes may not maximize biodiversity, known as “second-order homogeneity” [64]. Therefore, it is necessary to gradually address the phenomena of the RCFF and determine the appropriate operational scale for rice–crayfish fields.
The scientific planning and management of rice–crayfish fields play a crucial role in advancing agricultural modernization, ensuring food security [11] and contributing to the achievement of SDGs, including zero hunger as well as responsible consumption and production. The RCFF evaluation system proposed in this paper serves as a valuable tool for local government decisionmakers, offering insights into the fragmentation characteristics of rice–crayfish field landscapes. The RCFF index developed in this study proved effective in quantifying the rice–crayfish field fragmentation degree. This evaluation can facilitate a comprehensive understanding of the management and construction aspects of rice–crayfish fields, guiding strategic land consolidation efforts aimed at mitigating fragmentation.
Reducing the fragmentation of rice–crayfish fields involves both merging plots and reducing field ridges, as well as adjusting and distributing land ownership. During the process of merging plots, disputes over land use rights often arise due to the fragmented ownership and lack of standardized land management, which limits the positive effects of fragmentation control [24,65]. In the future, local government should strengthen the regulation of land use changes, standardize land transactions, and guide farmers to contract their cultivated land to cooperatives, promoting the intensive development of rice–crayfish fields. In areas with high RCFF, the shape of rice–crayfish field plots should be standardized, and the degree of concentration and continuity of field plots should be increased. In areas with medium RCFF, the construction of agricultural water conservancy projects, power grids, and other infrastructure should be improved. Through these measures, the landscape pattern of rice–crayfish fields can be effectively improved, and the efficiency of treating tailwater from rice–crayfish fields can be enhanced. This can elevate the ecological benefits derived from rice–crayfish fields, fostering the sustainable development of rice–crayfish co-cultivation. The integration of such insights into decision-making processes contributes to a more ecologically sound approach to agricultural practices.

4.3. Future Prospects and Limitation

According to the China Crayfish Industry Development Report (2023), in 2022, the primary areas for rice–crayfish fields were concentrated in the five provinces in the Yangtze River Basin, namely, Hubei, Anhui, Hu’nan, Jiangsu, and Jiangxi. Among them, 20 counties (cities), such as Jianli and Honghu, had a crayfish farming production of over 30,000 tons. These counties (cities) lacked systematic and scientific management of rice–crayfish fields [66], highlighting the urgent need for an evaluation of RCFF to strengthen the scientific management of rice–crayfish fields. The majority of these areas are located in central China, sharing similar natural conditions with Qianjiang city. Consequently, the RCFF evaluation system constructed in this study could be broadly applied for assessing the degree of rice–crayfish field fragmentation in central China. In the future, the RCFF evaluation system can be promoted in these areas to provide references for the ecological management of rice–crayfish fields and amplify the environmental benefits of the complex rice–crayfish agro-ecosystem. Rice–crayfish field fragmentation is a consequence of various factors, encompassing the natural, social, and economic dimensions. Moving forward, when evaluating rice–crayfish field fragmentation, it is essential to integrate factors such as natural conditions, socio-economic development, and policy implementation into the evaluation framework. This will facilitate a scientific and comprehensive understanding of the factors influencing RCFF, thereby aiding in reducing RCFF.

5. Conclusions

This paper proposed a county-level evaluation method for rice–crayfish field fragmentation (RCFF), and we conducted an empirical study on this phenomenon in Qianjiang city, located in central China. This evaluation method provided a quantitative expression of RCFF for township-level administrative regions, revealing the spatial distribution differences in RCFF. Understanding rice–crayfish field fragmentation is crucial for enhancing the ecological benefits of the complex rice–crayfish agro-ecosystem and achieving sustainable development of rice–crayfish co-cultivation. The evaluation method proposed in this paper could be applied to other counties (cities) where rice–crayfish fields are predominantly distributed in the Yangtze River Basin. This can contribute to the transition of traditional agriculture to environmentally friendly agriculture in China.

Author Contributions

Conceptualization, L.S., B.H. and L.Y.; data curation, L.S. and X.H.; funding acquisition, L.Y.; methodology, X.H., B.H. and L.Y.; project administration, L.Y.; resources, L.Y.; supervision, L.Y.; validation, J.L.; visualization, B.H.; writing—original draft, L.S., X.H., B.H. and J.L.; writing—review and editing, L.S., X.H., B.H. and J.L. All authors have read and agreed to the published version of the manuscript.

Funding

This research was funded by National Natural Science Foundation of China, grant number No. 42171270.

Data Availability Statement

The raw data supporting the conclusions of this article will be made available by the authors on request.

Conflicts of Interest

The authors declare no conflicts of interest.

References

  1. Mavroeidis, A.; Roussis, L.; Kakabouki, L. The role of alternative crops in an upcoming global food crisis: A concise review. Foods. 2022, 11, 3584. [Google Scholar] [CrossRef] [PubMed]
  2. Laurett, R.; Pao, A.; Mainardes, E.W. Sustainable development in agriculture and its antecedents, barriers and consequences—An exploratory study. Sustain. Prod. Consump. 2021, 27, 298–311. [Google Scholar] [CrossRef]
  3. United Nations (UN). Transforming Our World: The 2030 Agenda for Sustainable Development. Available online: https://www.un.org/en/development/desa/population/migration/generalassembly/docs/globalcompact/A_RES_70_1_E.pdf (accessed on 7 November 2023).
  4. Alexandratos, N.; Bruinsm, J. World Agriculture Towards 2030/2050: The 2012 Revision; ESA Working Paper No. 12-03; ESA: Rome, Italy, 2012; p. 3. [Google Scholar]
  5. Jeffrey, A.M.; Sara, J.S. Common Ground, Common Future: How Ecoagriculture Can Help Feed the World and Save Wild Biodiversity. Available online: https://portals.iucn.org/library/node/8854 (accessed on 7 November 2023).
  6. Wan, N.F.; Li, S.X.; Li, T.; Cavalieri, A.; Weiner, J.; Zheng, X.Q.; Ji, X.Y.; Zhang, J.Q.; Zhang, H.L.; Zhang, H.; et al. Ecological intensification of rice production through rice-fish co-culture. J. Clean. Prod. 2019, 234, 1002–1012. [Google Scholar] [CrossRef]
  7. Xie, J.; Hu, L.L.; Tang, J.J.; Wu, X.; Chen, X. Ecological mechanisms underlying the sustainability of the agricultural heritage rice–fish coculture system. Proc. Natl. Acad. Sci. USA 2011, 108, 19851–19852. [Google Scholar] [CrossRef]
  8. Li, Q.M.; Xu, L.; Xu, L.J.; Qian, Y.G.; Jiao, Y.; Bi, Y.H.; Zhang, T.L.; Zhang, W.; Liu, Y.J. Influence of consecutive integrated rice–crayfish culture on phosphorus fertility of paddy soils. Land Degrad. Dev. 2018, 29, 3413–3422. [Google Scholar] [CrossRef]
  9. Hou, J.; Styles, D.; Cao, Y.X.; Ye, X.X. The sustainability of rice-crayfish coculture systems: A mini review of evidence from Jianghan plain in China. J. Sci. Food Agric. 2021, 101, 3843–3853. [Google Scholar] [CrossRef]
  10. Xu, Q.; Liu, T.; Guo, H.L.; Duo, Z.; Gao, H.; Zhang, H.C. Conversion from rice-wheat rotation to rice-crayfish coculture increases net ecosystem service values in Hung-tse Lake area, east China. J. Clean. Prod. 2021, 319, 128883. [Google Scholar] [CrossRef]
  11. Zhou, Y.; Yan, X.Y.; Gong, S.L.; Li, C.W.; Zhu, R.; Zhu, B.; Liu, Z.Y.; Wang, X.L.; Cao, P. Changes in paddy cropping system enhanced economic profit and ecological sustainability in central China. J. Integr. Agric. 2022, 21, 566–577. [Google Scholar] [CrossRef]
  12. Cao, C.G.; Jiang, Y.; Wang, J.P.; Yuan, P.L.; Chen, S.W. “Dual character” of rice-crayfish culture and strategies for its sustainable development. Chin. J. Eco-Agric. 2017, 25, 1245–1253. [Google Scholar] [CrossRef]
  13. Wang, Q.D.; Cheng, L.; Liu, J.S.; Li, Z.J.; Xie, S.Q.; De Silva, S.S.; Wang, Q.D.; Cheng, L.; Liu, J.S.; Li, Z.J. Freshwater aquaculture in PR China: Trends and prospects. Rev. Aquacult. 2015, 7, 283–302. [Google Scholar] [CrossRef]
  14. Hou, J.; Wang, X.L.; Xu, Q.; Cao, Y.X.; Zhang, D.Y.; Zhu, J.Q. Rice-crayfish systems are not a panacea for sustaining cleaner food production. Environ. Sci. Pollut. Res. 2021, 28, 22913–22926. [Google Scholar] [CrossRef] [PubMed]
  15. Si, G.H.; Peng, C.L.; Yuan, J.F.; Xu, X.Y.; Zhao, S.J.; Xu, D.B.; Wu, J.S. Changes in soil microbial community composition and organic carbon fractions in an integrated rice–crayfish farming system in subtropical China. Sci. Rep. 2017, 7, 2856–2866. [Google Scholar] [CrossRef] [PubMed]
  16. Sun, Q.Y.; Khoshnevisan, B.; Zhu, J.Q.; Wang, W.W.; Liu, Y.L.; Pan, J.T.; Fan, X.P.; Zhang, D.Y.; Wu, M.Q.; Liu, H.B. Comprehensive assessment of integrated rice-crayfish farming system as a new paradigm to air-water-food nexus sustainability. J. Clean. Prod. 2022, 377, 134247. [Google Scholar] [CrossRef]
  17. Xu, Q.; Dai, L.X.; Zhou, Y.; Dou, Z.; Gao, W.Y.; Yuan, X.C.; Gao, H.; Zhang, H.C. Effect of nitrogen application on greenhouse gas emissions and nitrogen uptake by plants in integrated rice-crayfish farming. Sci. Total. Environ. 2023, 905, 167629. [Google Scholar] [CrossRef]
  18. Yuan, P.L.; Wang, J.P.; Guo, C.; Guo, Z.Y.; Guo, Y.; Cao, C.G. Sustainability of the rice—Crayfish farming model in waterlogged land: A case study in Qianjiang County, Hubei Province. China J. Integr. Agric. 2022, 21, 1203–1214. [Google Scholar] [CrossRef]
  19. Chen, S.W.; Jiang, Y.; Wang, J.P.; Cao, C.G. Situation and countermeasures of integrated rice-crayfish farming in Hubei Province. J. Huazhong Agric. Univ. 2020, 39, 1–7. [Google Scholar] [CrossRef]
  20. Xia, T.; Wu, J.Y.; Zhu, Y.Y.; Yu, L.; Zhao, X.M.; Wan, M.; Ye, Y.W. Spatio-temporal Evolution and Regional Development Model of Rice-Crayfish Fields in Main Agricultural Production Regions of Central China. Econ. Geogr. 2023, 43, 183–191. [Google Scholar] [CrossRef]
  21. Xia, T.; Fang, H.N.; Ji, W.W.; Li, H.T.; Yan, H.; Wu, W.B. Spatiotemporal characteristics of cropland in Qianjiang City under the development of rice-crayfish integrated. Resour. Environ. Yangtze Basin 2020, 29, 2709–2718. [Google Scholar]
  22. Cheng, L.; Xia, N.; Jiang, P.H.; Zhong, L.S.; Pian, Y.Z.; Duan, Y.W.; Huang, Q.H.; Li, M.C. Analysis of farmland fragmentation in China modernization demonstration zone since “Reform and Openness”: A case study of south Jiangsu Province. Sci. Rep. 2015, 5, 11797. [Google Scholar] [CrossRef]
  23. Tan, S.; Heerink, N.; Qu, F. Land fragmentation and its driving forces in China. Land Use Policy 2006, 23, 272–285. [Google Scholar] [CrossRef]
  24. Gu, T.; Chen, W.; Liang, J.; Pan, S.; Ye, X. Identifying the driving forces of cultivated land fragmentation in China. Environ. Sci. Pollut. Res. 2023, 30, 105275–105292. [Google Scholar] [CrossRef] [PubMed]
  25. Wu, S.M.; Meng, S.X.; Lu, X.H. Effect of different modes of property rights adjustment in rural land consolidation on cultivated land fragmentation. J. Agro-For. Econ. Manag. 2023, 22, 527–534. [Google Scholar] [CrossRef]
  26. Latruffe, L.; Piet, L. Does land fragmentation affect farm performance? A case study from Brittany. Agric. Syst. 2013, 129, 68–80. [Google Scholar] [CrossRef]
  27. Hao, W.; Hu, X.D.; Wang, J.M.; Zhang, Z.X.; Shi, Z.Z.; Zhou, H. The impact of farmland fragmentation in China on agricultural productivity. J. Clean. Prod. 2023, 425, 138962. [Google Scholar] [CrossRef]
  28. Tan, S.H.; Heerink, N.; Kruseman, G.; Qu, F.T. Do fragmented landholdings have higher production costs? Evidence from rice farmers in Northeastern Jiangxi province, P.R. China. China Econ. Rev. 2008, 19, 347–358. [Google Scholar] [CrossRef]
  29. Qiu, L.F.; Zhu, J.X.; Pan, Y.; Wu, S.H.; Yang, H. The positive impacts of landscape fragmentation on the diversification of agricultural production in Zhejiang Province, China. J. Clean. Prod. 2019, 251, 119722. [Google Scholar] [CrossRef]
  30. Milne, G.; Byrne, A.W.; Campbell, E.; Graham, J.; McGrath, J.; Kirke, R.; McMaster, W.; Zimmermann, J.; Adenuga, A.H. Quantifying land fragmentation in Northern Irish cattle enterprises. Land 2022, 11, 402. [Google Scholar] [CrossRef]
  31. Fazlolah, A.M.; Bubak, S. Effect of landscape fragmentation on soil quality and ecosystem services in land use and landform types. Environ. Earth Sci. 2022, 81, 330. [Google Scholar] [CrossRef]
  32. Gashaw, T.A.; Zewdu, B.A.; Assefa, A.B. Effects of land fragmentation on productivity in Northwestern Ethiopia. Adv. Agric. 2017, 2017, 4509605. [Google Scholar] [CrossRef]
  33. Kennedy, C.M.; Hawthorne, P.L.; Miteva, D.A.; Baumgarten, L.; Kei, S.C.; Matsumoto, M.; Evans, J.S.; Polasky, S.; Hamel, P.; Vieira, E.M. Optimizing land use decision-making to sustain Brazilian agricultural profits, biodiversity and ecosystem services. Biol. Conserv. 2016, 204, 221–230. [Google Scholar] [CrossRef]
  34. Wang, X. Changes in cultivated land loss and landscape fragmentation in China from 2000 to 2020. Land 2022, 11, 684. [Google Scholar] [CrossRef]
  35. Wu, Z.H.; Chen, Y.Y.; Yang, Z.; Zhu, Y.L.; Han, Y.R. Mapping soil organic carbon in low-relief farmlands based on stratified heterogeneous relationship. Remote Sens. 2022, 14, 3575. [Google Scholar] [CrossRef]
  36. Fu, G.; Wang, W.; Li, J.S.; Xiao, N.W.; Qi, Y. Prediction and selection of appropriate landscape metrics and optimal scale ranges based on multi-scale interaction analysis. Land 2021, 10, 1192. [Google Scholar] [CrossRef]
  37. Feng, Y.X.; Luo, G.P.; Lu, L.; Zhou, D.C.; Han, Q.F.; Xu, W.Q.; Yin, C.Y.; Zhu, L.; Dai, L.; Li, Y.Z.; et al. Effects of land use change on landscape pattern of the Manas River watershed in Xinjiang, China. Environ. Earth Sci. 2011, 64, 2067–2077. [Google Scholar] [CrossRef]
  38. Zhang, C.; Wang, X.; Liu, Y.J. Changes in quantity, quality, and pattern of farmland in a rapidly developing region of China: A case study of the Ningbo region. Landsc. Ecol. Eng. 2019, 15, 323–336. [Google Scholar] [CrossRef]
  39. Zhang, H.B.; Yan, Q.Q.; Xie, F.F.; Ma, S.C. Evaluation and prediction of landscape ecological security based on a CA-Markov Model in overlapped area of crop and coal production. Land 2023, 12, 207. [Google Scholar] [CrossRef]
  40. Wu, Z.H.; Wang, B.Z.; Huang, J.L.; An, Z.H.; Jiang, P.; Chen, Y.Y.; Liu, Y.F. Estimating soil organic carbon density in plains using landscape metric-based regression Kriging model. Soil Tillage Res. 2019, 195, 104381. [Google Scholar] [CrossRef]
  41. Chen, W.B.; Xiao, D.N.; Li, X.C. Classification, application, and creation of landscape indices. Chin. J. Appl. Ecol. 2002, 12, 121–125. [Google Scholar]
  42. Mcgarigal, K. Fragstats Help Version 4.2 [WWW Document]. Available online: https://www.fragstats.org/index.php/documentation (accessed on 7 November 2023).
  43. Ekumah, B.; Armah, F.A.; Afrifa, E.K.A.; Aheto, D.W.; Odoi, J.O.; Afitiri, A. Geospatial assessment of ecosystem health of coastal urban wetlands in Ghana. Ocean Coast. Manag. 2020, 193, 105226. [Google Scholar] [CrossRef]
  44. Huang, Q.P.; Huang, J.J.; Zhan, Y.J.; Cui, W.; Yuan, Y.B. Using landscape indicators and Analytic Hierarchy Process (AHP) to determine the optimum spatial scale of urban land use patterns in Wuhan, China. Earth Sci. Inform. 2018, 11, 567–578. [Google Scholar] [CrossRef]
  45. Wei, L.; Luo, Y.; Wang, M.; Su, S.L.; Pi, J.L.; Li, G.E. Essential fragmentation metrics for agricultural policies: Linking landscape pattern, ecosystem service and land use management in urbanizing. China Agric. Syst. 2020, 182, 102833. [Google Scholar] [CrossRef]
  46. Zhou, L.L.; Shi, Y.S.; Cao, X.Y. Evaluation of land intensive use in Shanghai Pilot Free Trade Zone. Land 2019, 8, 87. [Google Scholar] [CrossRef]
  47. Arthur, G.; Ord, J.K. The analysis of spatial association by use of distance statistics. Geogr. Anal. 1992, 24, 189–206. [Google Scholar] [CrossRef]
  48. Anselin, L. Local Indicators of spatial association—LISA. Geogr. Anal. 1995, 27, 93–115. [Google Scholar] [CrossRef]
  49. Atsuyuki, O.; Toshiaki, S.; Kokichi, S. A kernel density estimation method for networks, its computational method and a GIS-based tool. Int. J. Geogr. Inf. Sci. 2009, 23, 7–32. [Google Scholar] [CrossRef]
  50. Hu, N.J.; Liu, C.H.; Chen, Q.; Zhu, L.Q. Life cycle environmental impact assessment of rice-crayfish integrated system: A case study. J. Clean. Prod. 2021, 280, 124440. [Google Scholar] [CrossRef]
  51. Yuan, P.L.; Wang, J.P.; Li, C.F.; Xiao, Q.Q.; Liu, Q.J.; Sun, Z.C.; Wang, J.H.; Cao, C.G. Soil quality indicators of integrated rice-crayfish farming in the Jianghan Plain, China using a minimum data set. Soil Tillage Res. 2020, 204, 104732. [Google Scholar] [CrossRef]
  52. Wang, D.J.; Yang, H.; Hu, Y.M.; Zhu, A.X.; Mao, X.Y. Analyzing spatio-temporal characteristics of cultivated land fragmentation and their Iinfluencing factors in a rapidly developing region: A case study in Guangdong Province, China. Land 2022, 11, 1750. [Google Scholar] [CrossRef]
  53. Xu, M.Y.; Niu, L.; Wang, X.B.; Zhang, Z.F. Evolution of farmland landscape fragmentation and its driving factors in the Beijing-Tianjin-Hebei region. J. Clean. Prod. 2023, 418, 138031. [Google Scholar] [CrossRef]
  54. Wu, X.; Xie, J.; Chen, X.; Chen, J. Edge effect of trench-pond pattern on rice grain and economic benefit in rice-fish co-culture. Chin. J. Eco-Agric. 2010, 18, 995–999. [Google Scholar] [CrossRef]
  55. Bashir, M.A.; Liu, J.; Geng, Y.C.; Wang, H.Y.; Pan, J.T.; Zhang, D.; Rehim, A.; Aon, M.; Liu, H.B. Co-culture of rice and aquatic animals: An integrated system to achieve production and environmental sustainability. J. Clean. Prod. 2020, 249, 119310. [Google Scholar] [CrossRef]
  56. Ning, K.; Ji, L.; Zhang, L.; Zhu, X.; Wei, H.M.; Han, M.Z.; Wang, Z. Is rice-crayfish co-culture a better aquaculture model: From the perspective of antibiotic resistome profiles. Environ. Pollut. 2022, 292, 118450. [Google Scholar] [CrossRef]
  57. Xu, Q.; Peng, X.; Guo, H.L.; Che, Y.; Dou, Z.; Xing, Z.P.; Hou, J.; Styles, D.; Gao, H.; Zhang, H.C. Rice-crayfish coculture delivers more nutrition at a lower environmental cost. Sustain. Prod. Consump. 2022, 29, 14–24. [Google Scholar] [CrossRef]
  58. Yuan, P.L.; Wang, J.P.; Chen, S.W.; Guo, Y.; Cao, C.G. Certified rice–crayfish as an alternative farming modality in waterlogged land in the Jianghan Plain region of China. Agron. J. 2021, 113, 4568–4580. [Google Scholar] [CrossRef]
  59. Sun, Z.C.; Guo, Y.; Li, C.F.; Cao, C.G.; Yuan, P.L.; Zou, F.L.; Wang, J.H.; Jia, P.G.; Wang, J.P. Effects of straw returning and feeding on greenhouse gas emissions from integrated rice-crayfish farming in Jianghan Plain, China. Environ. Sci. Pollut. Res. 2019, 26, 11710–11718. [Google Scholar] [CrossRef]
  60. Benton, T.G.; Vickery, J.A.; Wilson, J.D. Farmland biodiversity: Is habitat heterogeneity the key? Trends Ecol. Evol. 2003, 18, 182–188. [Google Scholar] [CrossRef]
  61. Fahrig, L.; Arroyo-Rodríguez, V.; Bennett, J.R.; Boucher-Lalonde, V.; Cazetta, E.; Currie, D.J.; Eigenbrod, F.; Ford, A.T.; Harrison, S.P.; Jaeger, J.A.G.; et al. Is habitat fragmentation bad for biodiversity? Biol. Conserv. 2019, 230, 179–186. [Google Scholar] [CrossRef]
  62. Hartvigsen, M. Land reform and land fragmentation in Central and Eastern Europe. Land Use Policy 2014, 36, 330–341. [Google Scholar] [CrossRef]
  63. Clough, Y.; Kirchweger, S.; Kantelhardt, J. Field sizes and the future of farmland biodiversity in European landscapes. Conserv. Lett. 2020, 13, 12752. [Google Scholar] [CrossRef]
  64. Fahrig, L.; Baudry, J.; Ns, L.I.S.B.; Burel, F.; Crist, T.O.; Fuller, R.J.; Sirami, C.E.L.; Siriwardena, G.M.; Martin, J. Functional landscape heterogeneity and animal biodiversity in agricultural landscapes. Ecol. Lett. 2011, 14, 101–112. [Google Scholar] [CrossRef]
  65. Wu, S.M.; Ye, Y.M.; Zhang, C.Z.; Wen, G.H. Impacts of different modes of rural land consolidation on cultivated land fragmentation and its regional differences: Empirical evidence from Jianghan Plain and Wuling Mountain Area in Hubei Province. China Land Sci. 2021, 35, 98–106. [Google Scholar] [CrossRef]
  66. Xue, L.; Cao, P.; Xu, D.Z.; Guo, Y.; Wang, Q.F.; Zheng, X.F.; Han, R.J.; You, A.Q. Agricultural land suitability analysis for an integrated rice–crayfish culture using a fuzzy AHP and GIS in central China. Ecol. Indic. 2023, 148, 109837. [Google Scholar] [CrossRef]
Figure 1. Geographical location of study area and distribution of rice–crayfish fields.
Land 13 01001 g001
Figure 3. Distribution of the RCFF in Qianjiang city. Level I, Level II, Level III, Level IV, Level V districts, respectively, represent districts where the RCFF was 0.06–0.21, 0.214–0.35, 0.35–0.51, 0.51–0.71, 0.71–0.94.
Land 13 01001 g003
Figure 4. Spatial analysis of the RCFF in Qianjiang. (a) LISA plot for the RCFF, (b) the kernel density analysis of the RCFF.
Land 13 01001 g004
Table 1. Evaluation units of the RCFF in Qianjiang city.
Evaluation Unit TypeEvaluation Unit NameCodeEvaluation Unit Area/km2Ratio of Rice–Crayfish Fields/%
SubdistrictYangshi Subdistrict 1YS-S 137.020.26
Yangshi Subdistrict 2YS-S 268.421.94
Gaochang SubdistrictGC-S16.1522.96
Guanghua Subdistrict 1GH-S 139.4111.27
Guanghua Subdistrict 2GH-S 26.3528.02
Yuanlin SubdistrictYL-S43.511.79
Zhouji Subdistrict 1ZJ-S 142.099.52
Zhouji Subdistrict 2ZJ-S 242.723.07
TownGaoshibei TownGSB-T120.833.82
Haokou TownHK-T175.5532.21
Jiyukou TownJYK-T107.7633.58
Laoxin TownLX-T125.5830.40
Longwan TownLW-T135.7344.13
Wangchang TownWC-T106.391.71
Xiongkou TownXK-T101.8133.93
Yuyang Town 1YY-T 114.6641.98
Yuyang Town 2YY-T 2130.9913.99
Zhangjin TownZJ-T154.3626.36
Zhugentan TownZGT-T95.070.21
Zhouji Farm 1ZJ-T 10.876.47
Zhouji Farm 2ZJ-T 216.467.29
FarmBailuhu FarmBLH-F54.4852.22
Houhu FarmHH-F71.4930.74
Xiongkou Farm 1XK-F 18.6965.78
Xiongkou Farm 2XK-F 216.0444.21
Xiongkou Farm 3XK-F 317.8859.48
Yunlianghu FarmYLH-F47.8969.63
Zongkou FarmZK-F113.6724.85
Table 2. Evaluation indices of the RCFF.
IndexFormulaExplanationIndex Direction
RCARRCAR = CA/DARCAR is equal to the rice–crayfish field area (CA) divided by the district area (DA). -
RCPDRCPD = NP/DARCPD is equal to the number of rice–crayfish field patches (NP) divided by the district area (DA). +
PARA_MN P A R A _ M N = j = 1 j p i j / a i j PARA_MN is equal to the average perimeter– area ratio of rice–crayfish field patches, reflecting the regularity of the shape of the rice–crayfish fields. +
PLADJ P L A D J = g i i k = 1 m g i k × 100 %PLADJ reflects the adjacency of rice–crayfish field patches.-
RCCI R C C I = C A 1 + i = 1 m j = 1 m P i j ln P i j 2 ln m
×100%
RCCI is equal to the rice–crayfish field area (CA) multiplied by CONTAG, reflecting the aggregation of rice–crayfish field patches.-
Note: p i j is the perimeter (m) of patch j of landscape type i; a i j is the area (m2) of patch j of landscape type i; g i i is the number of like adjacencies (joins) between pixels of patch type i based on the double-count method; g i k is number of adjacencies (joins) between pixels of patch types i and k based on the double-count method; m is the number of patch types; P i j is equal to P i g i k / k = 1 m g i k ; P i is the proportion of the landscape occupied by patch type i.
Table 3. Evaluation system of the RCFF.
Target LayerElement LayerIndex LayerUnit
RCFFArea and Edge metricsRCAR%
Shape metricsPARA_MNNone
Aggregation metricsPLADJ%
RCPDNumber per 1 square meter
RCCINone
Table 4. Classification of evaluation results.
RCARRCPDPARA_MNPLADJRCCI
Level I district4.50–6.990.02–0.2872.66–194.4199.17–99.68135.73–175.55
Level II district2.59–4.500.28–1.01194.41–356.3298.77–99.1795.07–135.73
Level III district1.41–2.511.01–1.59356.32–502.9097.96–98.7754.48–95.07
Level IV district0.33–1.411.59–4.04502.90–656.1097.28–97.9617.88–54.48
Table 5. Weight of evaluation indices.
Evaluation ElementEvaluation Element WeightEvaluation IndexEvaluation Index Weight
Area and Edge Metrics0.1292RCAR0.1292
Shape Metrics0.1416PARA_MN0.1416
Aggregation Metrics0.7292PLADJ0.2178
RCPD0.3951
RCCI0.1163
Disclaimer/Publisher’s Note: The statements, opinions and data contained in all publications are solely those of the individual author(s) and contributor(s) and not of MDPI and/or the editor(s). MDPI and/or the editor(s) disclaim responsibility for any injury to people or property resulting from any ideas, methods, instructions or products referred to in the content.

