Article

Analyzing Spatial Distribution and Influencing Factors of Soil Organic Matter in Cultivated Land of Northeast China: Implications for Black Soil Protection

1
College of Geographical Sciences, Harbin Normal University, Harbin 150025, China
2
State Key Laboratory of Black Soils Conservation and Utilization, Northeast Institute of Geography and Agroecology, Chinese Academy of Sciences, Changchun 130102, China
*
Authors to whom correspondence should be addressed.
These authors contributed equally to this work.
Land 2024, 13(7), 1028; https://doi.org/10.3390/land13071028
Submission received: 1 June 2024 / Revised: 7 July 2024 / Accepted: 8 July 2024 / Published: 9 July 2024

Abstract

:
Soil organic matter (SOM) in cultivated land is vital for land quality and food security. This study examines SOM distribution and influencing factors in northeastern China, providing insights for sustainable agriculture. Utilizing 10 m resolution SOM data, the analysis covers regions including the Greater and Lesser Khingan Mountains, Liaohe Plain, Sanjiang Plain, Songnen Plain, the northwest semi-arid region, and the low hilly areas of Paektu Mountain. The Geodetector method is employed to assess various influencing factors. The key findings are as follows: (1) The average SOM content in Northeast China (37.70 g/kg) surpasses the national average, is highest in the Greater and Lesser Khingan Mountains (49.32 g/kg), and lowest in the northwest semi-arid region (26.15 g/kg). (2) SOM content is maximized in regions with high altitudes, steep slopes, low temperatures, and moderate precipitation. (3) The annual average temperature is the primary factor influencing SOM distribution, with a combination of temperature and administrative divisions providing better explanatory power. (4) SOM trends vary across protected areas, with slope being critical in semi-humid plains, elevation in arid regions, and no dominant factors identified in the Sanjiang Plain. These findings underscore the need for tailored black soil protection policies to effectively leverage local resources and preserve ecosystem integrity.

1. Introduction

Soil organic matter (SOM) is rich in nutrients essential for plant growth and serves as a key indicator of agricultural productivity [1,2]. Northeast China, a major agricultural hub, contributes to half of the nation’s increased food production [3]. This area has a vast terrain and a relatively small population, and the organic matter content of the soil is considerably higher than that in other parts of the country [4]. Accurately grasping the spatial distribution characteristics of SOM and its influencing factors is of great significance for targeted fertilizer application and agricultural production management, controlling and managing the soil quality of cultivated land, and grain yield enhancement [5].
In recent years, the study of the factors affecting the spatial distribution of SOM has gradually become a hot spot of attention. Researchers have conducted numerous studies on the spatial distribution of SOM content in different regions. These regions include the Kastoria region of northern Greece and the northern shore of Lake Orestiada [6], Ghana [7], France [8], Southwest Spain [9], Belgium [10], and the Bashang Plateau, Hebei Province, North China [11], among others. Studies have shown that areas with higher SOM levels are usually located in temperate and mid-latitude regions [12]. This phenomenon can be explained by the fact that temperate climatic conditions provide favorable conditions for the accumulation of organic matter [13]. Marco A. Jiménez-González et al. analyzed 33 soils from various environmental contexts in Spain using pyrolysis–gas chromatography–mass spectrometry (Py-GC/MS) and a modified van Krevelen diagram [14]. They discovered that the molecular composition of SOM varied systematically with environmental factors in the following order: climate > vegetation > geological substrate [14]. In addition to natural factors, the researchers found that human factors are also important drivers of differences in the spatial distribution of SOM [15]. These factors include population agglomeration density [5], local economic development [16], local area policy [17], and practices such as manual fertilization and irrigation [18], among others.
The current research on SOM products by many scholars is based on ground-based measurement techniques, where soil samples are collected and analyzed in laboratories, usually with higher accuracy. But, it has lower coverage due to various human factors, and its resolution, which depends on the density and spatial distribution of the samples, usually ranges between 30 m and 250 m. In this study, we use a more accurate 10 m SOM product based on remote sensing inversion, which better represents the spatial heterogeneity of the SOM compared to the product obtained by spatial interpolation.
Numerous scholars have transitioned from initial qualitative expressions to quantitative analyses of changes in SOM content and its drivers, usually using methods such as geographically weighted regression, autocorrelation analysis, and spatial superposition analysis models to explore the correlation between the changes in SOM content and the drivers [19]. However, they have obvious limitations in dealing with nonlinear relationships. And most of the studies failed to accurately reveal the interactions between the influencing factors [20]. The Geodetector model is a useful method for spatial statistics, offering advantages over autocorrelation analysis and geographically weighted regression in assessing the impact of explanatory variables [21]. It identifies the primary factors influencing a spatio-temporal phenomenon, as well as the interactions between different factors, without the need to address multicollinearity issues [22].
This study on the spatial distribution characteristics of SOM content and its influencing factors in northeastern China uses 10 m resolution SOM content mapping products, and in order to pursue a more precise and detailed study, the northeastern region is divided into six regions based on the six black soil conservation areas in northeastern China classified by the Ministry of Agriculture of China as the following: Greater and Lesser Khingan Mountains (GLKM), Liaohe Plain (LHP), Sanjiang Plain (SJP), Songnen Plain (SNP), northwest semi-arid region (NSA), and the low mountain and hilly area of Paektu Mountain (LHPM). The spatial distribution of cultivated land SOM in Northeast China was analyzed in relation to geospatial elements like elevation and slope. Influencing factors considered included elevation, precipitation, temperature, slope, soil pH, and policy factors. Using the Geodetector model, both single-factor impacts and multifactor interactions on SOM spatial distribution were examined. The study aimed to (1) analyze SOM spatial distribution in Northeast China’s cultivated lands; (2) identify the most obvious factors affecting SOM distribution; and (3) propose zoning protection strategies based on key factors influencing SOM distribution across different regions.

2. Materials and Methods

2.1. Overview of the Study Area

Northeast China (Figure 1) is located between longitudes 115°12′~135°5′ E and latitudes 38°43′~53°33′ N, encompassing Liaoning Province, Jilin Province, Heilongjiang Province, and four leagues in eastern Inner Mongolia. This region covers an area of approximately 1,520,000 square kilometers, featuring vast expanses of land and a rich diversity of agricultural products. It is recognized as one of the world’s four major black soil regions, with soil types primarily including black soil, brown soil, black calcium soil, and white pulp soil. The cultivated land utilization rate exceeds 60%. The climate in Northeast China is characterized by dry, cold winters with little precipitation and warm, humid summers with obvious rainfall. The annual average temperature ranges from −3.94 °C to 12.01 °C, and the annual average precipitation varies between 208 mm and 1022 mm. These climatic conditions create favorable natural environments for the growth and development of crops, making this region a crucial commercial grain base in China.

2.2. Image Data

In this study, we utilized data on SOM content distribution and cultivated land area distribution in the northeast region, sourced from the Northeast Institute of Geography and Agroecology, Chinese Academy of Sciences. The SOM product has been tested and demonstrated to have excellent accuracy and other properties, making it suitable for spatial analyses [23]. The maps of China’s administrative districts, river distribution network, and transportation network were obtained from Standard Map Service (http://bzdt.ch.mnr.gov.cn/).

2.3. Data on Natural and Human Factors

The study primarily employs natural and human factors to assess the explanatory strength of influencing variables on the spatial distribution characteristics of SOM content using Geodetector. Specifically, elevation data (in TIFF format with a 30 m resolution) were sourced from the official Google Earth Engine website (https://earthengine.google.com/). The soil acidity and alkalinity dataset, the soil type dataset in Northeast China, the spatial distribution of China’s kilometer grid population dataset, and the month-by-month average temperature dataset of China were obtained from the National Earth System Science Data Center (http://www.geodata.cn/). China’s historical GDP spatial distribution kilometer grid dataset and China’s month-by-month precipitation dataset were obtained from the National Data Center for Tibetan Plateau Science (https://data.tpdc.ac.cn/). Slope data were obtained from elevation data processing.

2.4. Basic Data Analysis of SOM Content in the Northeast and Its Six Regions

By using ArcGIS 10.8 software, we can visualize the maximum, average, and minimum values, as well as the coefficient of variation in SOM content for cultivated lands across the entire northeast region and its six regions. This allows us to understand the differences in SOM content within the northeast region and among the six areas. Our analyses are grounded in descriptive statistical methods.

2.5. Spatial Analysis of SOM Content in the Northeast and Its Six Regions

In this study, we analyzed the spatial distribution characteristics of SOM content in cultivated lands across the northeast region and its six regions, focusing on four geographic features where SOM distribution is notably pronounced: elevation, annual average precipitation, average annual temperature, and slope [24]. The elevation and annual average temperature of the northeast region and its six regions were categorized into five levels using the natural breakpoint method; the annual average precipitation and slope of the northeast region and its six regions were categorized into four and five levels, respectively, according to the national grading standards; and the average SOM content of cultivated land was counted within each geographic feature level for analysis.

2.6. Driver Analysis Using Geodetector

Based on existing studies regarding factors influencing the spatial distribution of SOM, and considering the study area’s specifics, data availability challenges, extensive geographical coverage, and complex river and transportation networks, the present study selected the following influencing factors: elevation (DEM) and slope (SLP); climatic factors: annual average temperature (TEMP) and annual average precipitation (PRE); soil attribute factors: soil acidity and alkalinity (SOILPH) and soil type (SOILT); policy factors: classification of dry and wet fields (POL1) and administrative area division (POL2); human factors: GDP and spatial distribution of population (POP); and other factors: distance to river (RLSF) and distance to transportation line (TFC). In total, there are 12 variables in 6 aspects (Figure 2, Table 1).
In this study, based on the ArcGIS 10.8 “Create Fishing Net” function, a grid layer of 5000 m × 5000 m was superimposed to cover the whole cultivated land area in Northeast China, and the average value of SOM content in each grid was counted to obtain a total of 38,726 usable grids with data, and then the maximum value of the grading of the impact factor in each grid was counted to obtain the corresponding impact factor grid for each grid with SOM content. The maximum value of the impact factor classification within each grid was then counted to obtain the corresponding impact factor grid for each grid containing SOM content. Then, all the data were sequentially organized into an Excel table to implement Geodetector’s analysis of the spatial differentiation of dependent variable X and independent variable Y based on R language.
In this study, two detectors in the Geodetector model will be employed to examine the spatial distribution characteristics of SOM content in cultivated land and its influencing factors in Northeast China:
Single factor detection is used to detect the spatial divergence of the dependent variable Y (SOM content of cultivated land) and the degree of explanatory power of each influencing factor X on the spatial divergence of the SOM content of cultivated land. Expressed in terms of the q-value, the expression is as follows:
S S W = h = 1 L N h σ h 2 , S S T = N σ 2
q = 1 h = 1 L N h σ h 2 N σ 2 = 1 S S W S S T
In Equation (1), h = 1 , 2, 3 …, L denotes the stratification of the independent variable Y or dependent variable X, or is known as grading or classification. N h and N are the number of cells in stratum h and the whole region, respectively. σ h 2 and σ 2 are the variance of the values of Y in stratum h and the whole region, respectively. S S W is the sum of the variances within the stratum, and S S T is the total variance in the whole region. The value range of q in Equation (2) is [0, 1], and the larger the value of q , the greater the explanatory power of the independent variable X on the dependent variable Y [25].
Interaction detectors are used to measure the interaction between two factors, i.e., to assess questions such as whether the joint effect between two factors enhances or weakens the explanatory power of the dependent variable Y, or whether the two effects on Y are independent of each other. The interaction categories can be divided into the following classes.
Nonlinear attenuation:
q ( X 1 X 2 ) < Min ( q ( X 1 ) , q ( X 2 ) )
Single-factor nonlinear attenuation:
Min ( q ( X 1 ) , q ( X 2 ) ) < q ( X 1 X 2 ) < Max ( q ( X 1 ) ) , q ( X 2 ) )
Double-factor enhancement:
q ( X 1 X 2 ) > Max ( q ( X 1 ) ) , q ( X 2 ) )
Mutual independence:
q ( X 1 X 2 ) = q ( X 1 ) + q ( X 2 )
Nonlinear enhancement:
q ( X 1 X 2 ) > q ( X 1 ) + q ( X 2 )

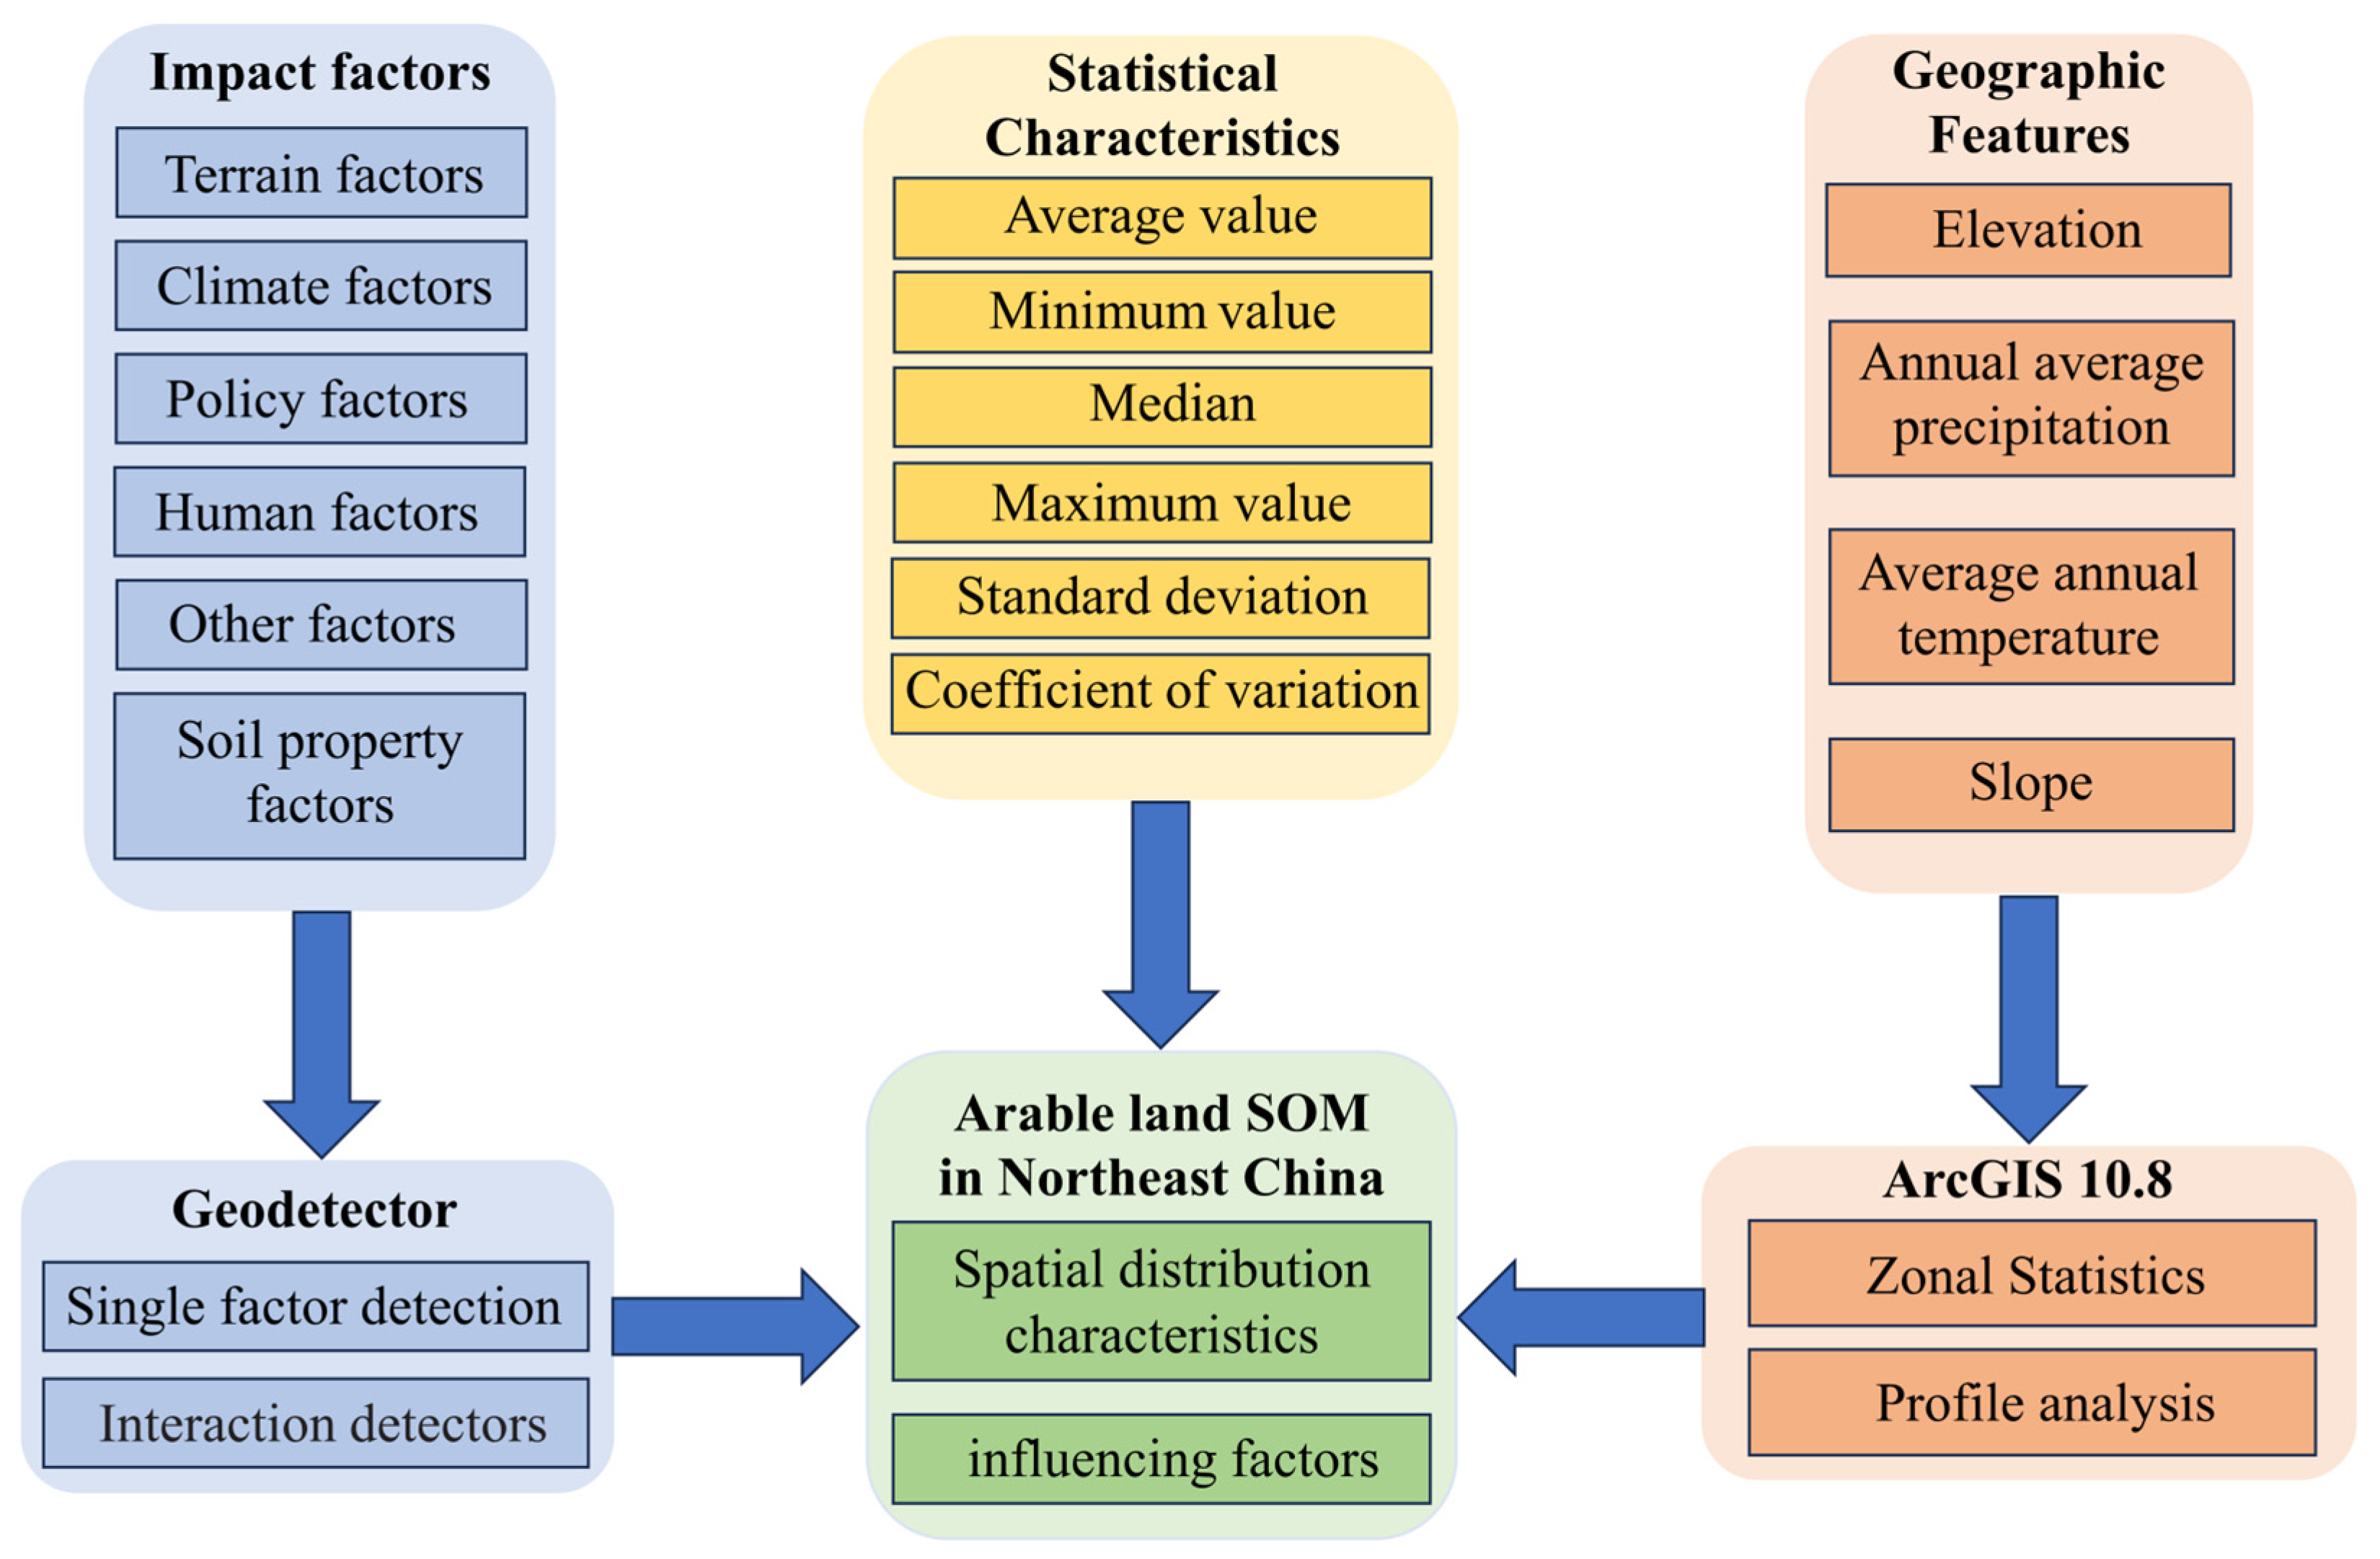
2.7. Research Framework

The research framework of this paper is illustrated in Figure 3.

3. Results

3.1. Basic Data Analysis of SOM Content in Various Regions

As depicted in Table 2, the SOM content in the surface 0–20 cm layer of cultivated land in Northeast China ranged from 8.61 g/kg to 104.91 g/kg, with an average value of 37.70 g/kg. This average value is considerably higher than the national average SOM content in the surface layer of cultivated land (24.65 g/kg). The median value of 55.03 g/kg indicates that most of the cultivated lands in the Northeast are richer in SOM than most of the cultivated lands in China. The coefficient of variation of 36.71% indicated a moderate degree of variability and reliable data stability.
There were notable variations in the average surface SOM content of cultivated land across different geomorphological zones in the northeast region. Among them, the average value of surface SOM content of cultivated land in GLKM was as high as 49.32 g/kg, which was much higher than the average value of LHP (28.78 g/kg) and the average value of NSA (26.15 g/kg). There was no obvious difference in the minimal values of surface SOM content of cultivated land in each area, but the median value of surface SOM content of cultivated land in LHPM was considerably smaller than that of cultivated land in the northeast region and five other regions. There were no obvious differences in the maximum values of surface SOM content of cultivated land in each region, except for the NSA and LHP, which were slightly smaller than the other four regions. The coefficients of variation of the surface organic matter content of cultivated land in these six different geomorphic regions were all moderately varied, with the largest degree of variation in NSA and the smallest degree of variation in SJP, and the surface SOM content of cultivated land in these six different geomorphic regions was normally distributed.

3.2. Analysis of Spatial Distribution Characteristics of SOM Content

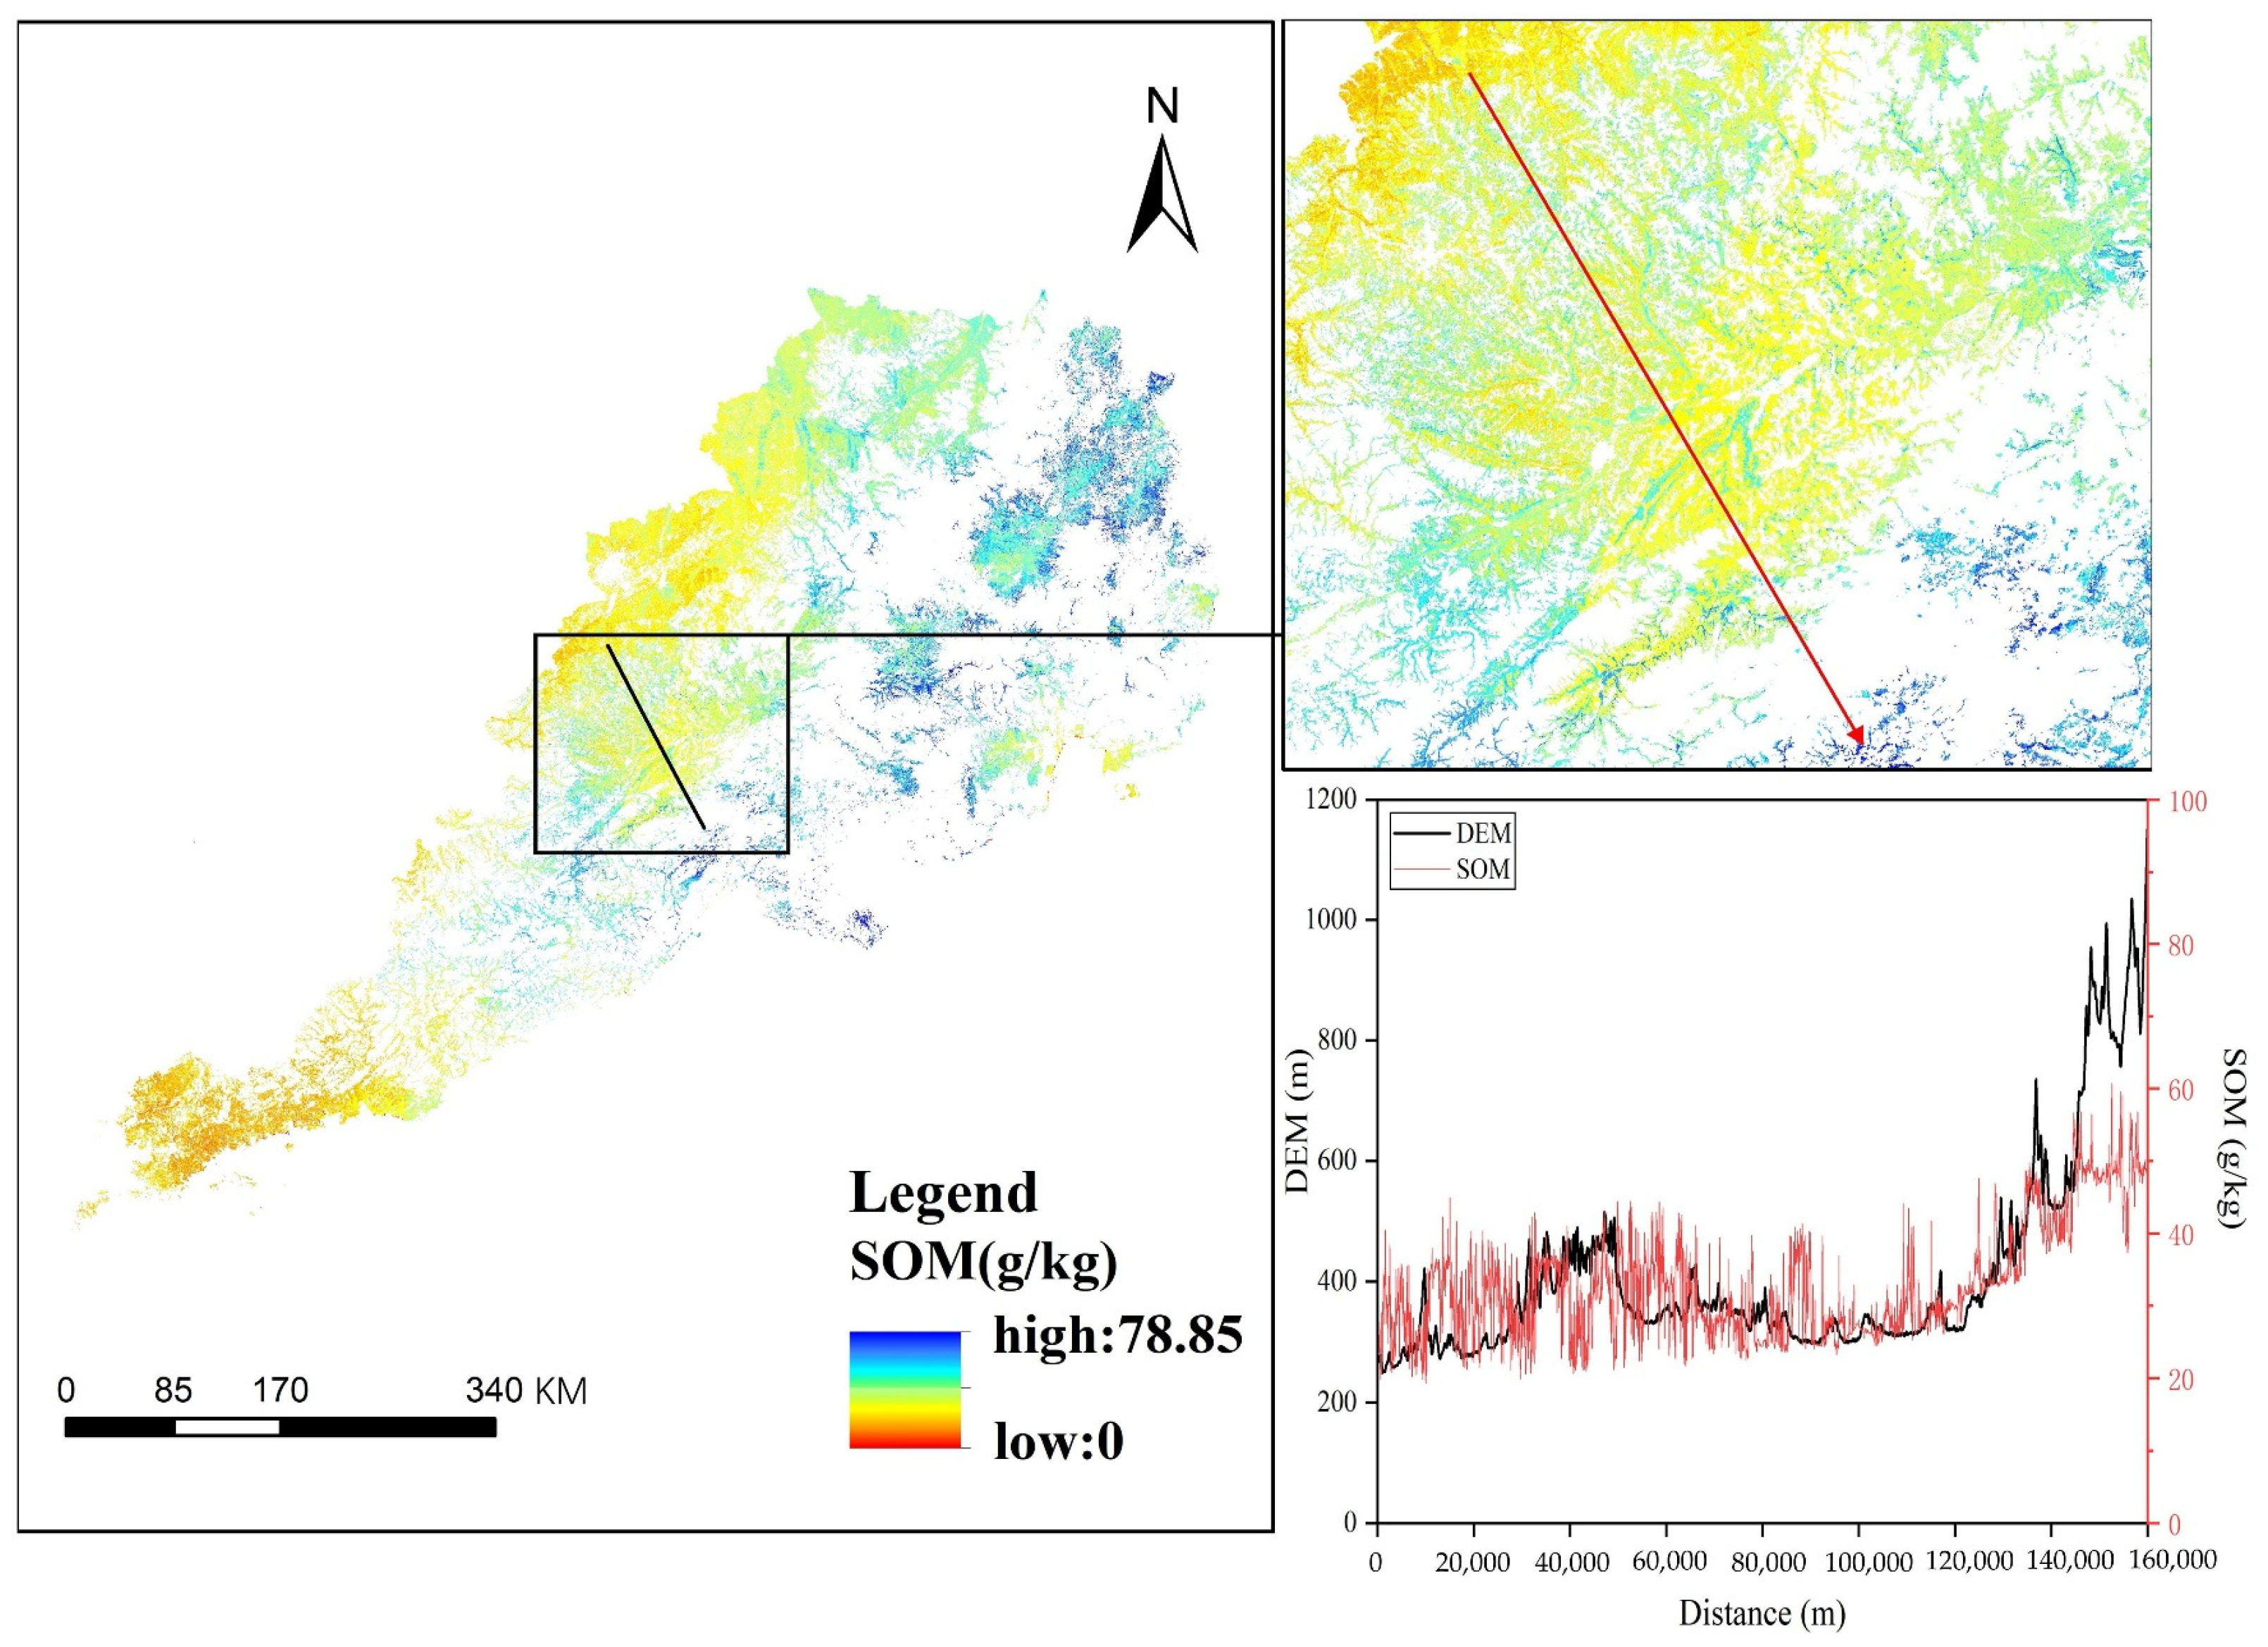
3.2.1. Characteristics of SOM Spatial Distribution of Cultivated Land

The spatial distribution of SOM content in cultivated land across Northeast China exhibits an obvious geographical trend (Figure 4). From south to north, the SOM content gradually increases, and this upward trend is also observed as one moves from the central region to the surrounding areas. Specifically, the SOM content in the LHP is considerably lower than in the other five regions, while the GLKM region has the highest SOM content. The SOM distributions in the NSA, SNP, and LHPM span a wide range of values, showing a tendency to change directionally across these areas. In contrast, the SOM content in the SJP is more concentrated and does not show obvious variation.

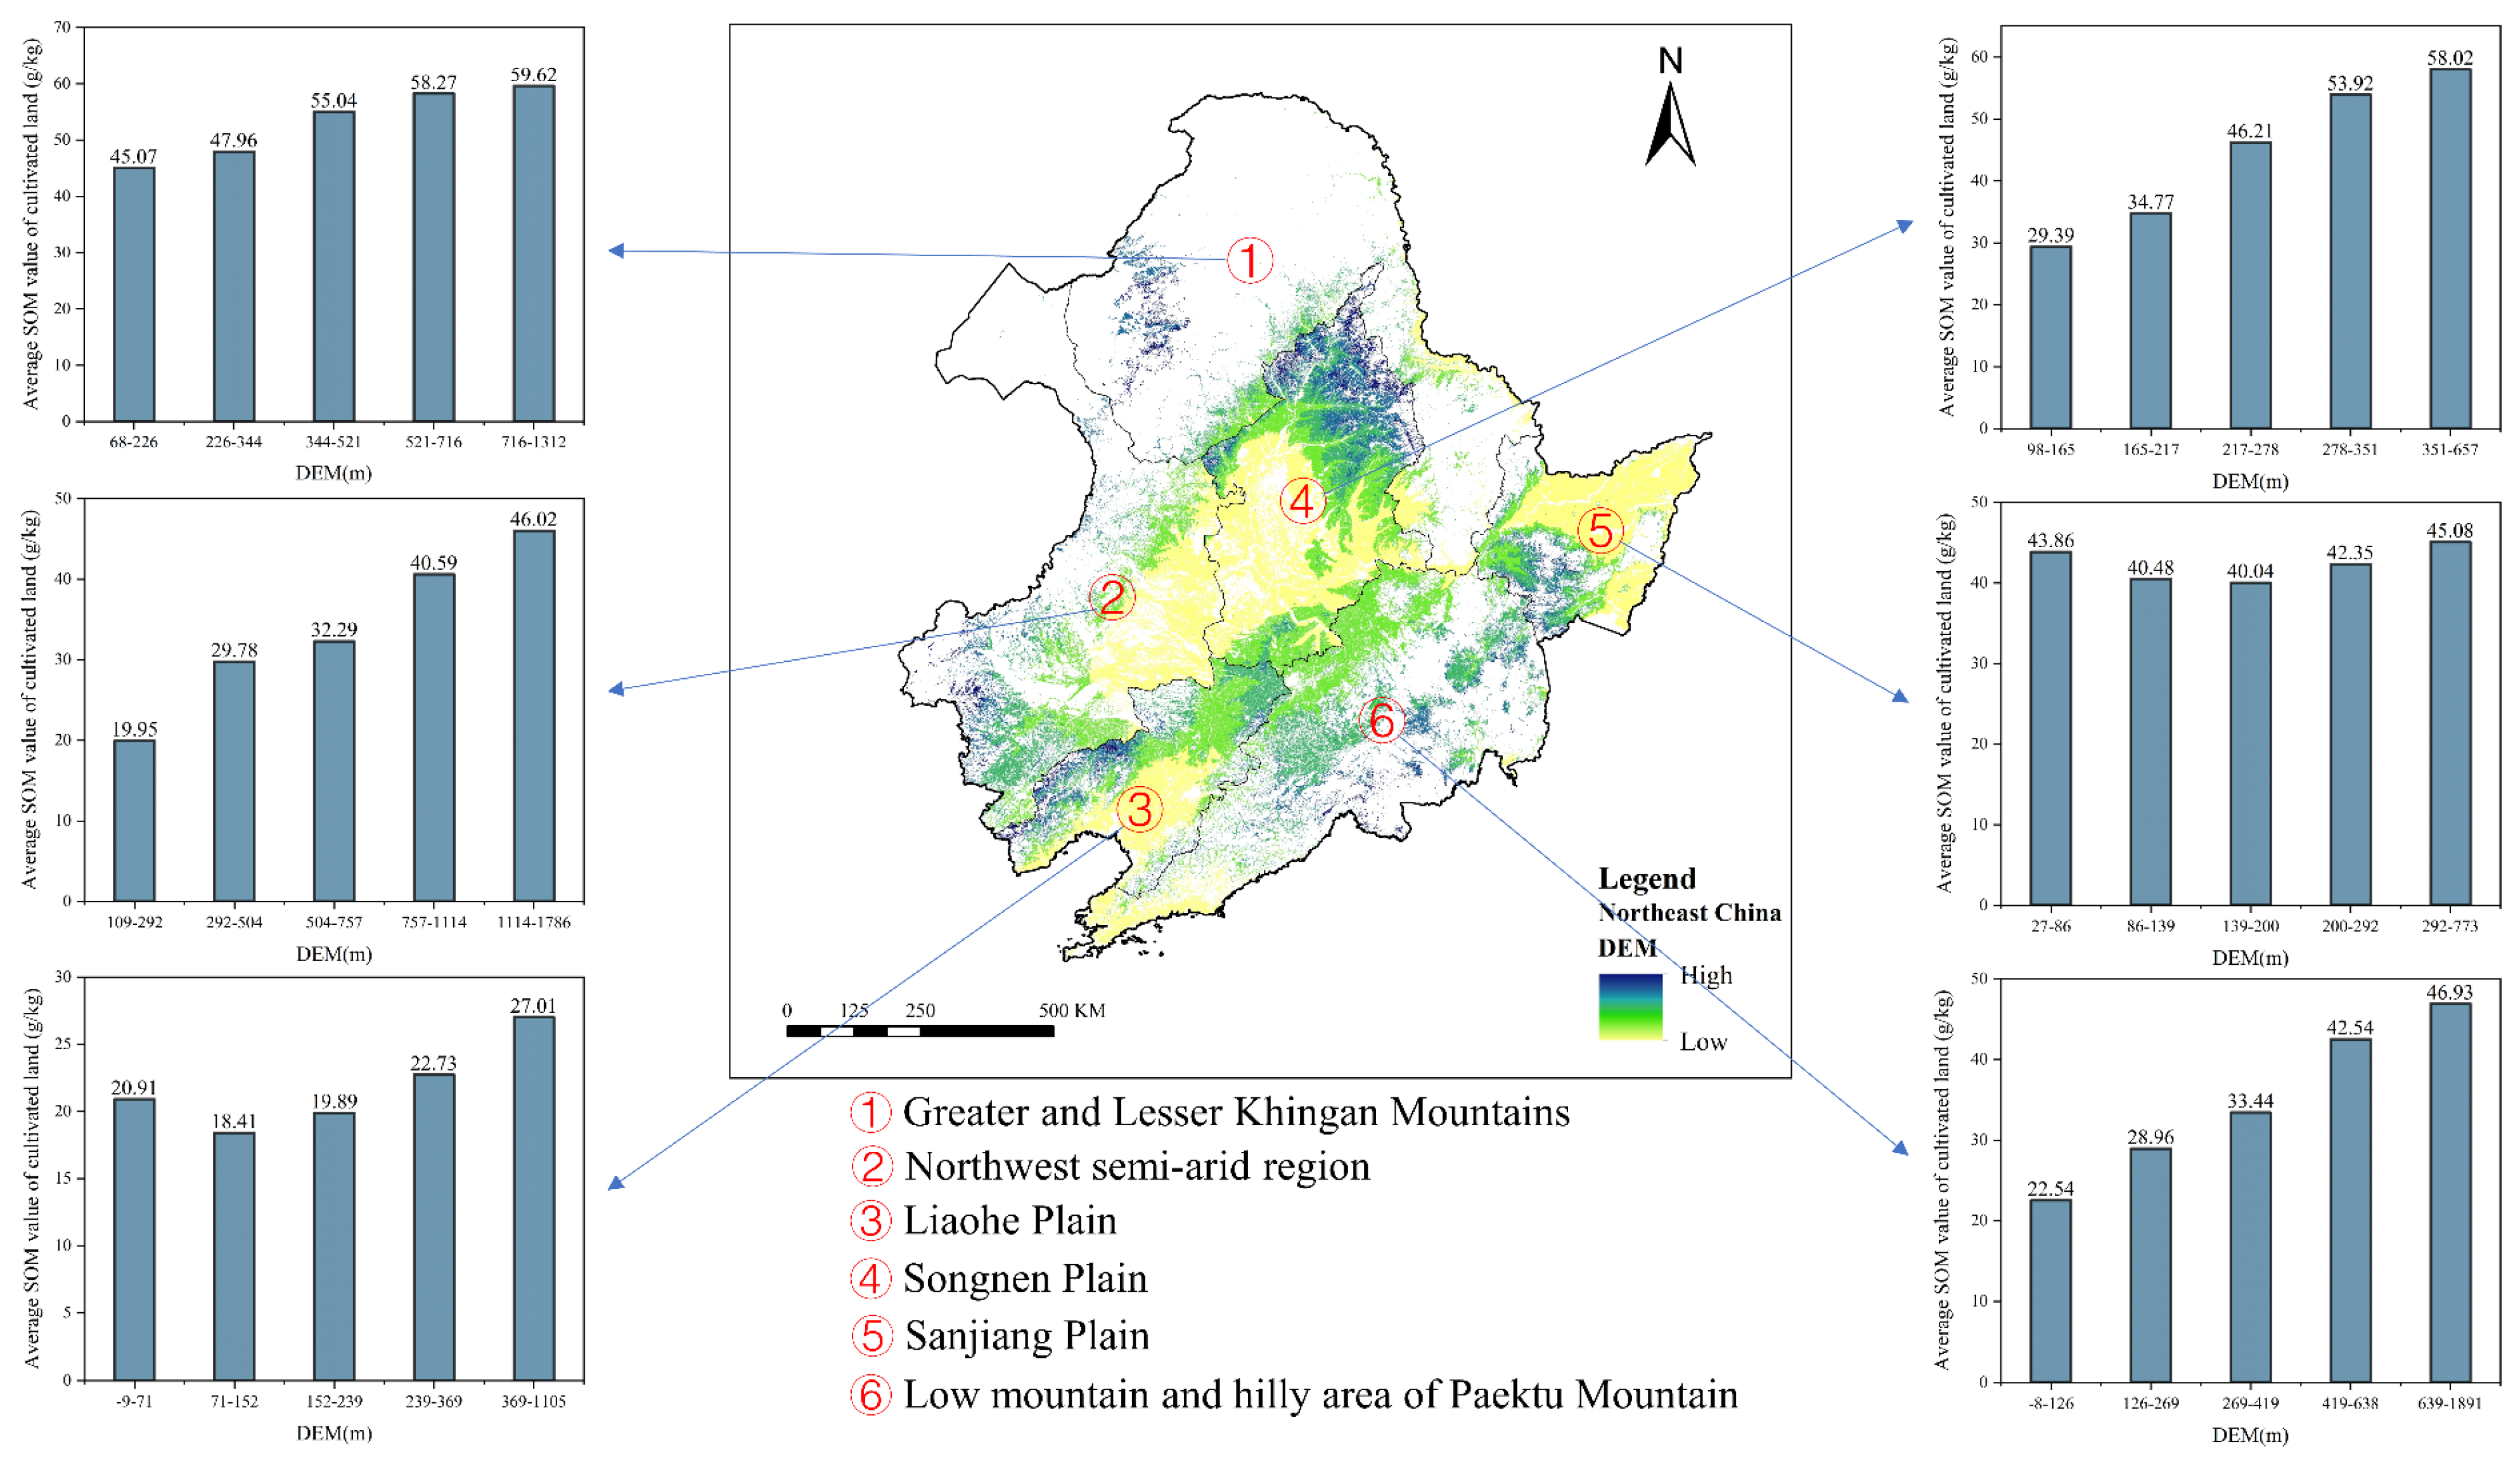
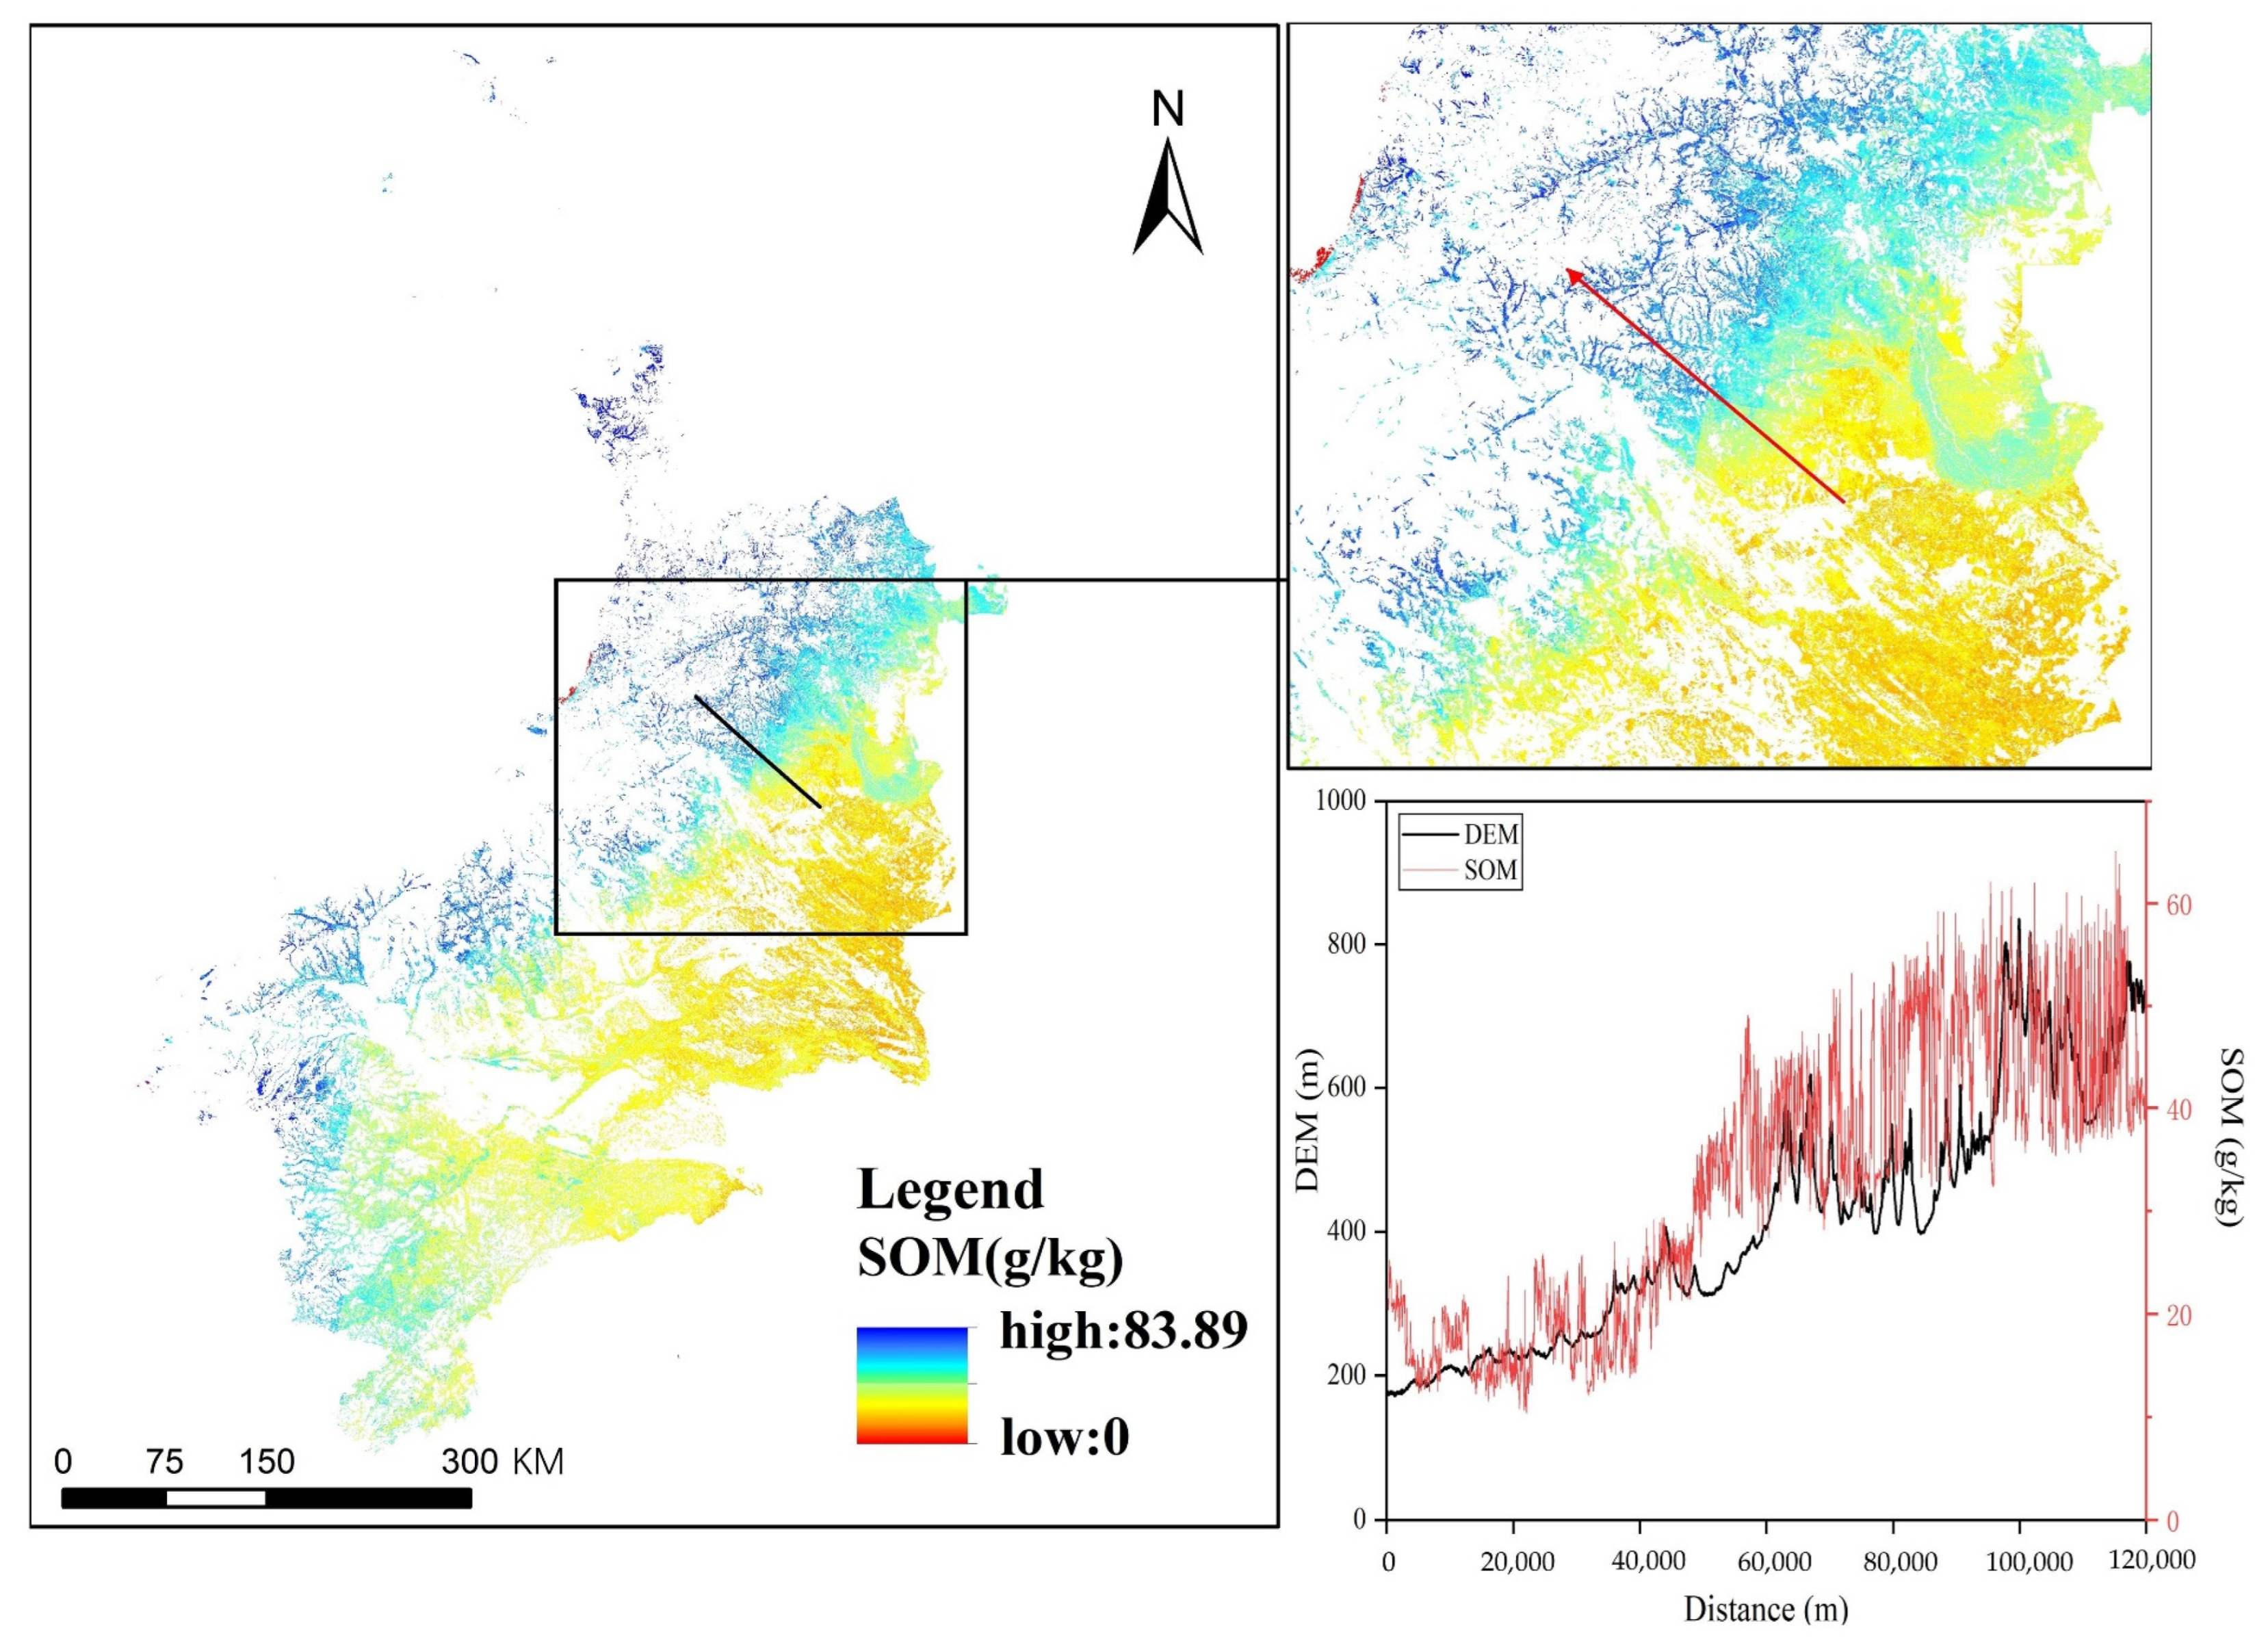
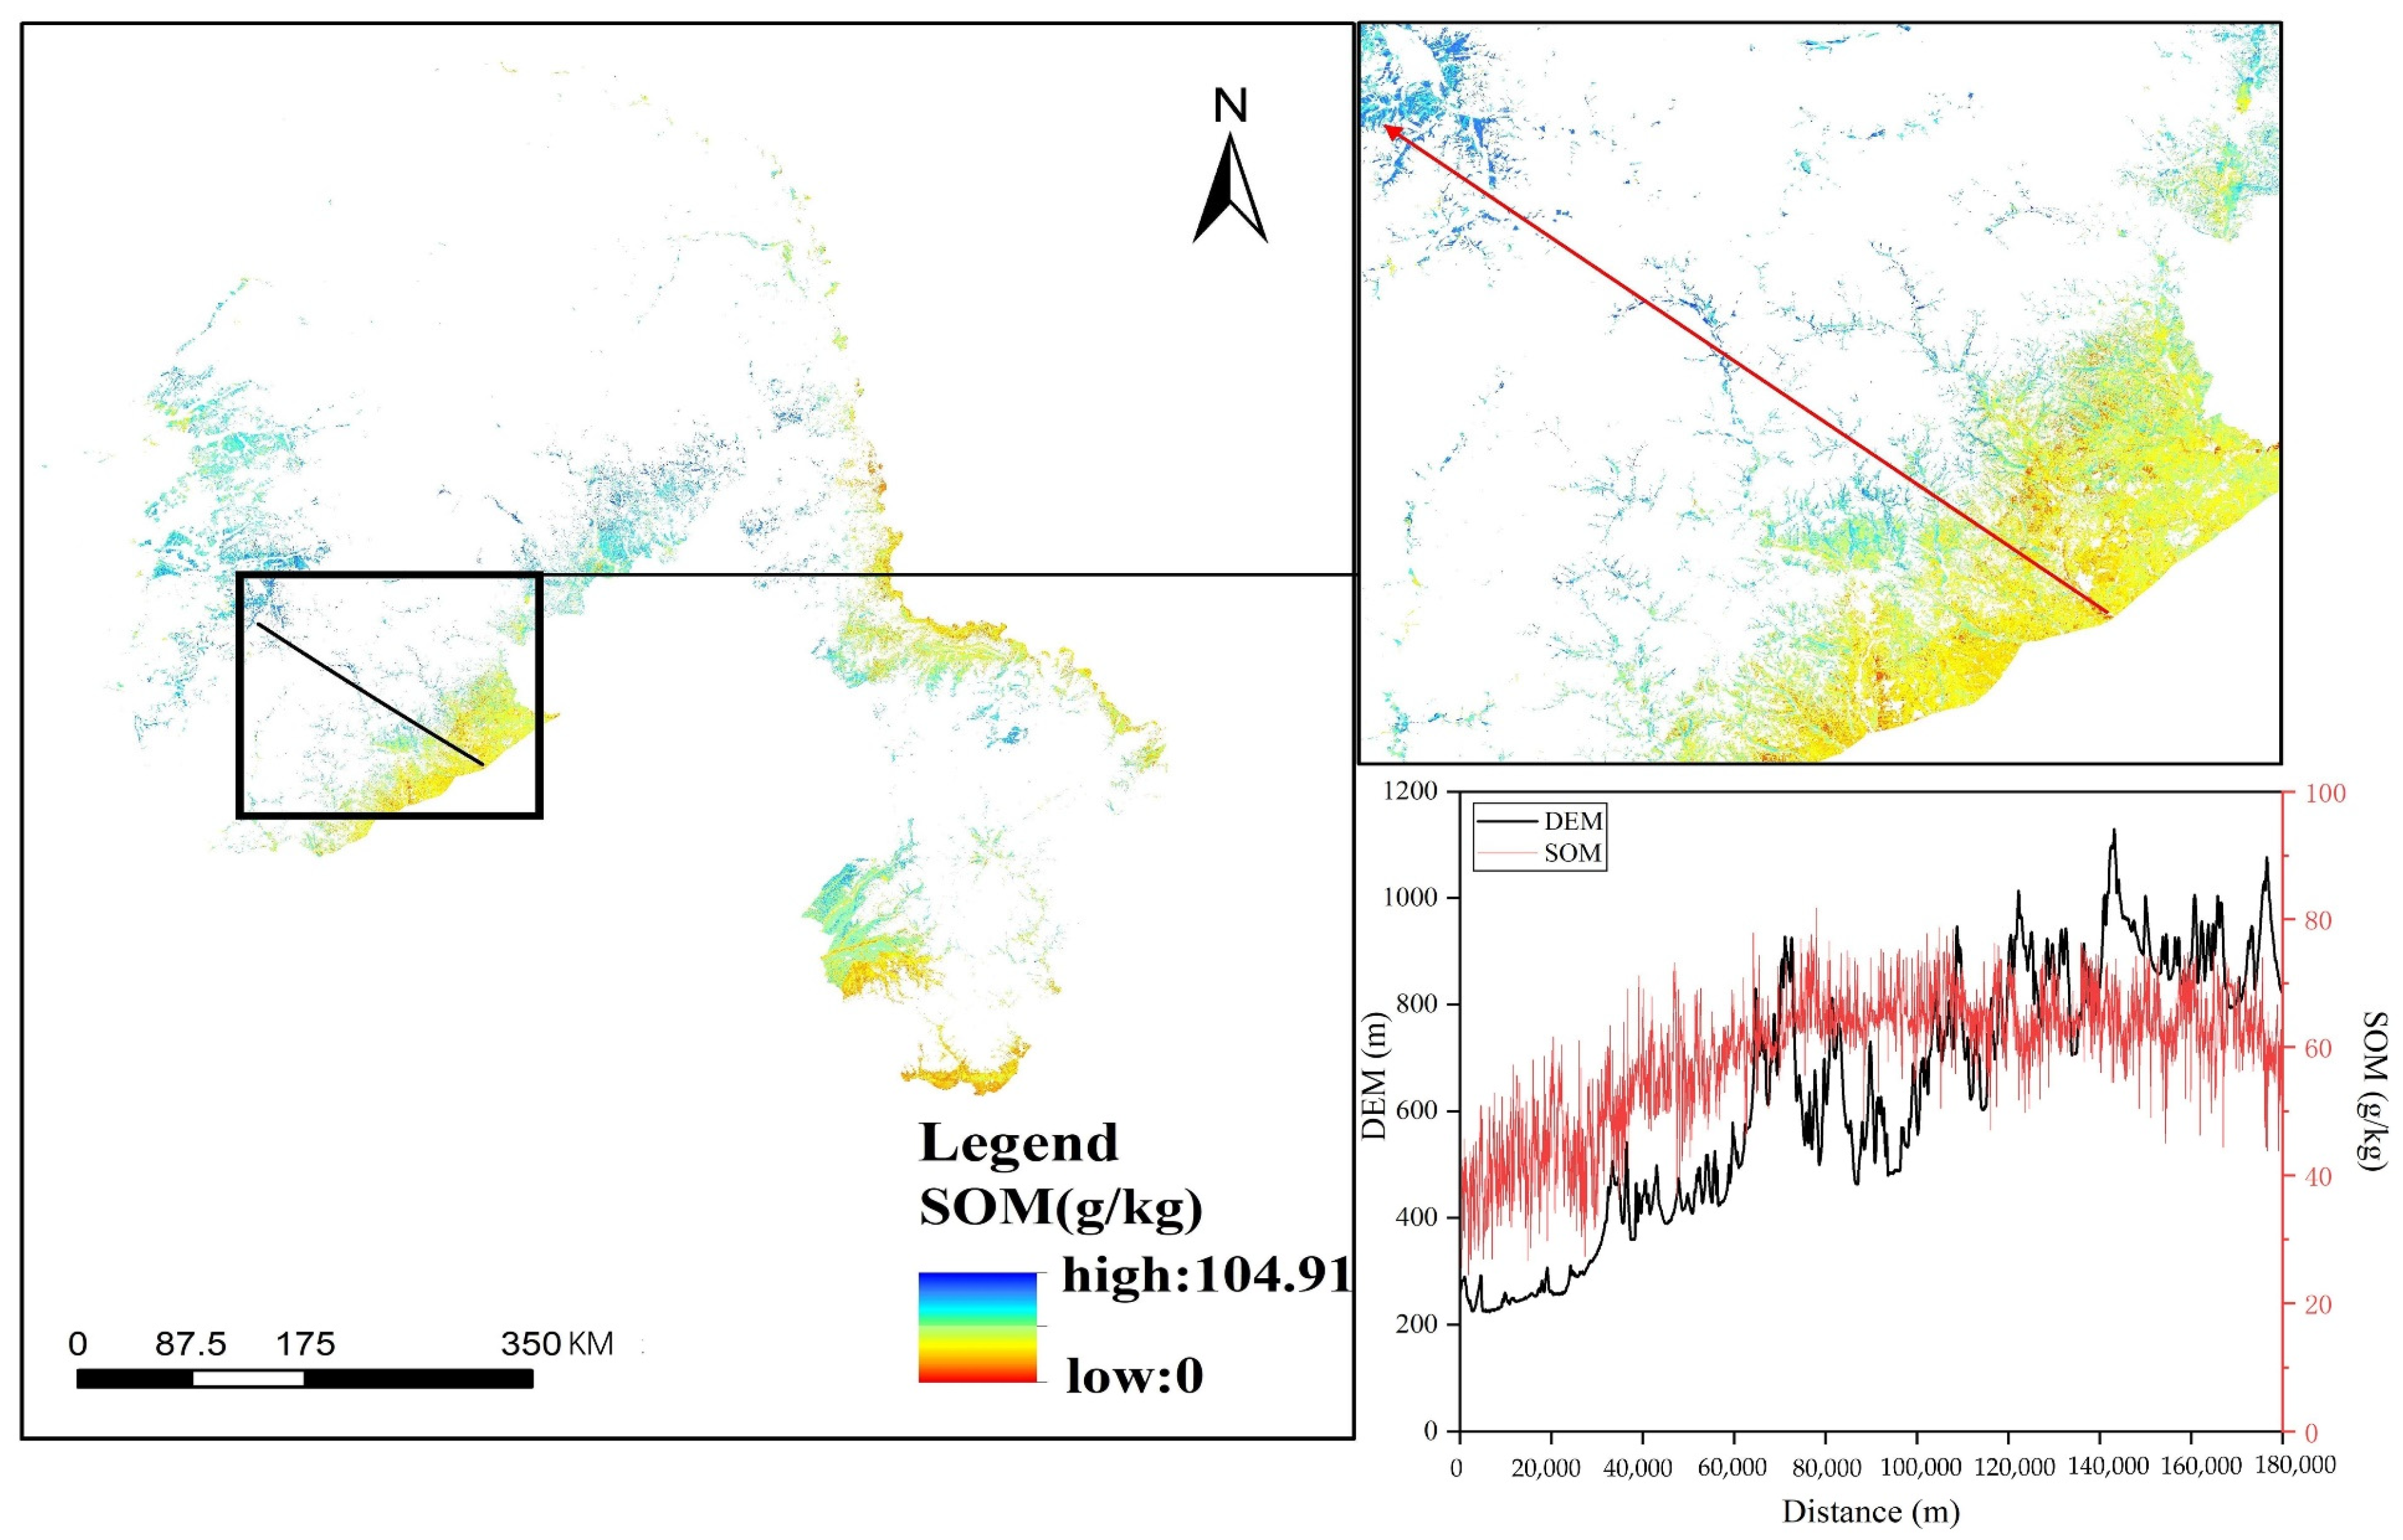
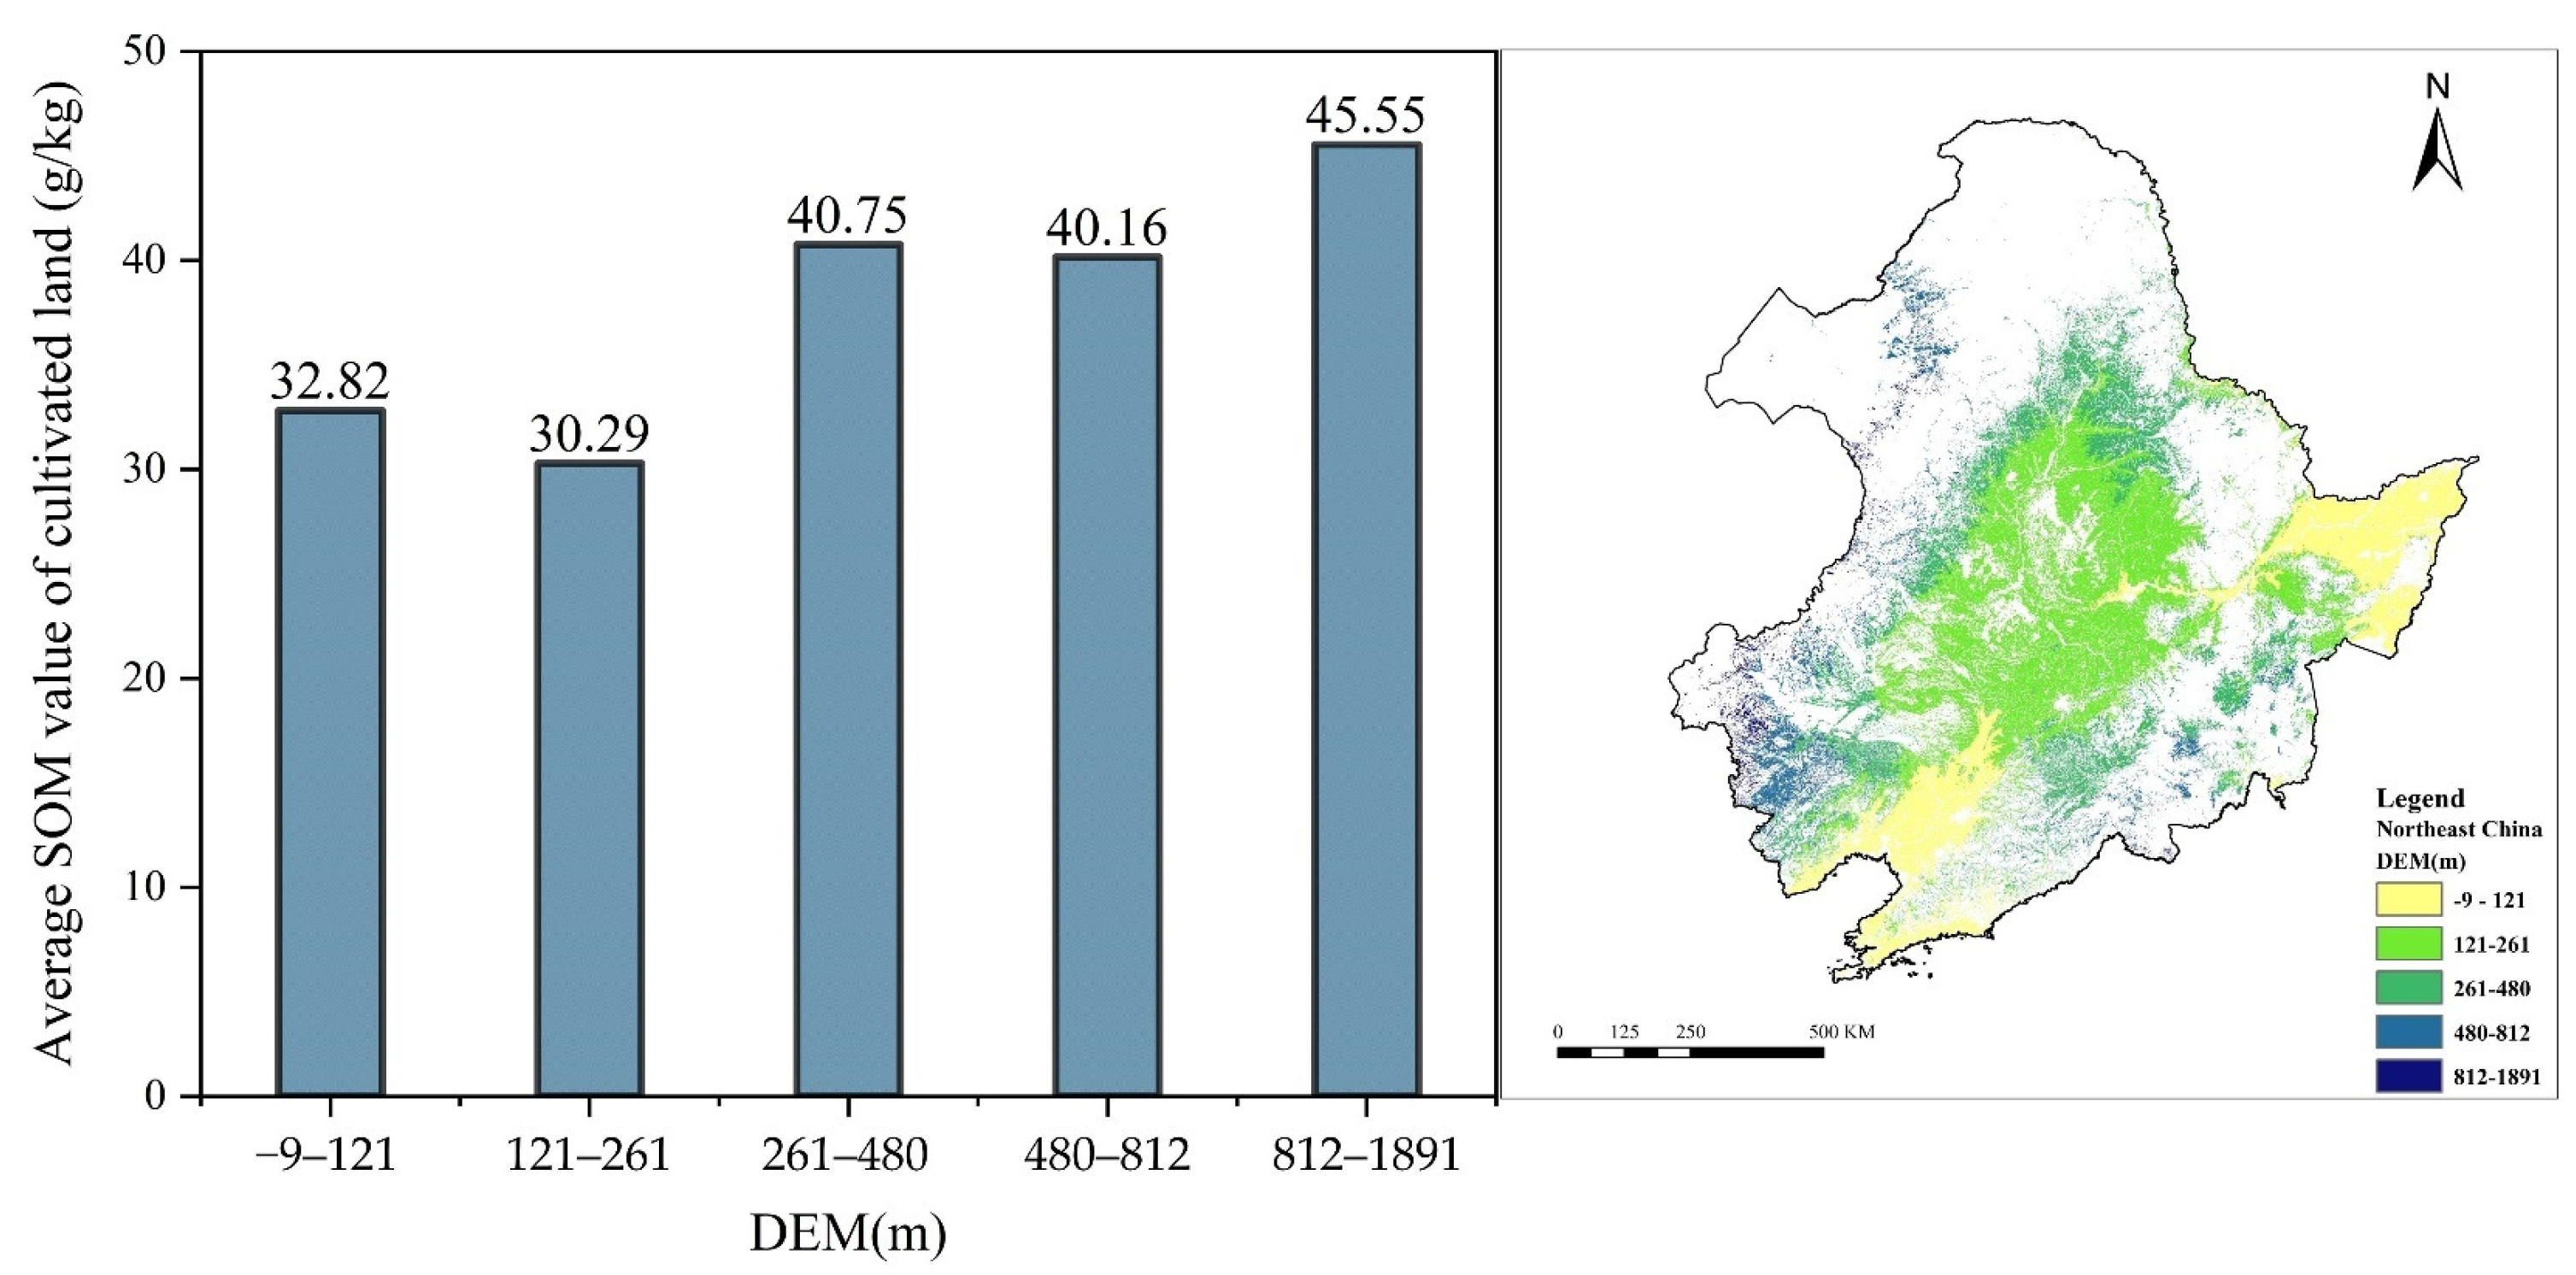
3.2.2. Characteristics of SOM Content Distribution over Elevation

Cultivated land SOM content in the northeast region showed a fluctuating increase with elevation (Figure 5), with a difference of 15.26 g/kg between the lowest value (30.29 g/kg) and the highest value (45.55 g/kg). Cultivated land SOM content of the six regions in their respective regional elevation classifications also showed a trend of obvious change with elevation change (Figure A1), with GLKM, NSA, SNP, and LHPM cultivated land SOM all increasing with increasing elevation. In LHP and SJP, however, the SOM content exhibited a “U”-shaped pattern, first decreasing and then increasing with elevation.

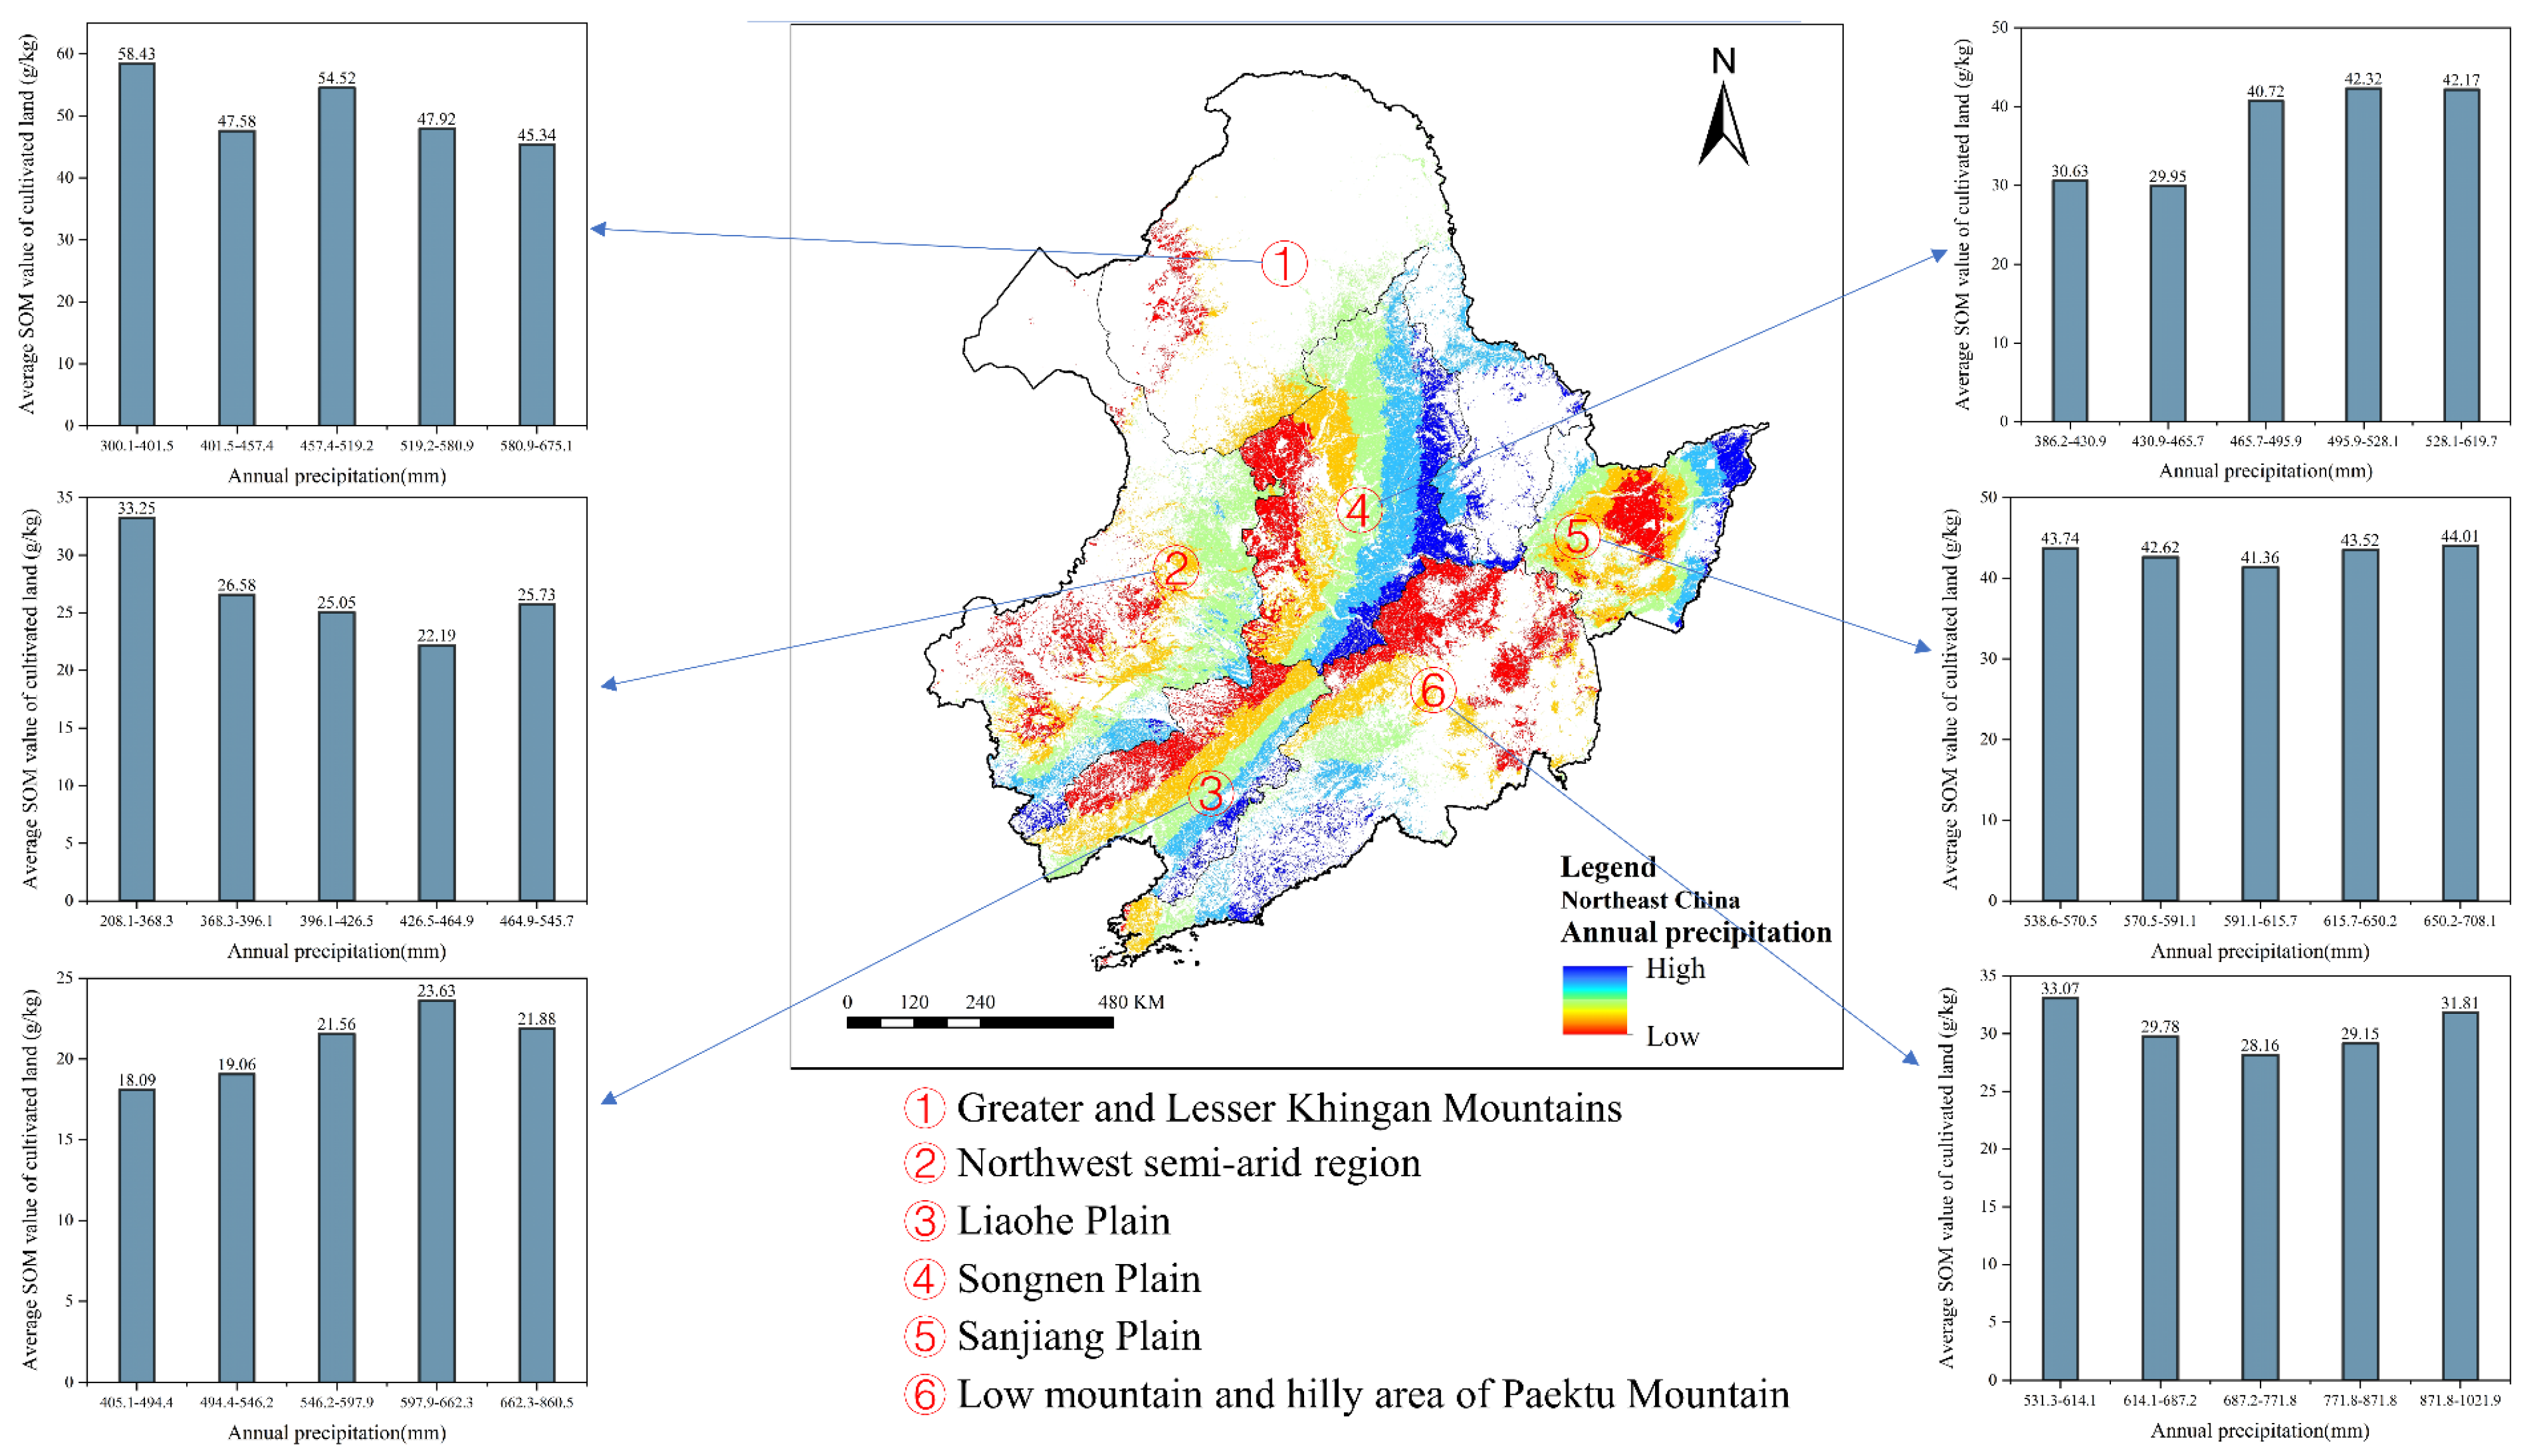
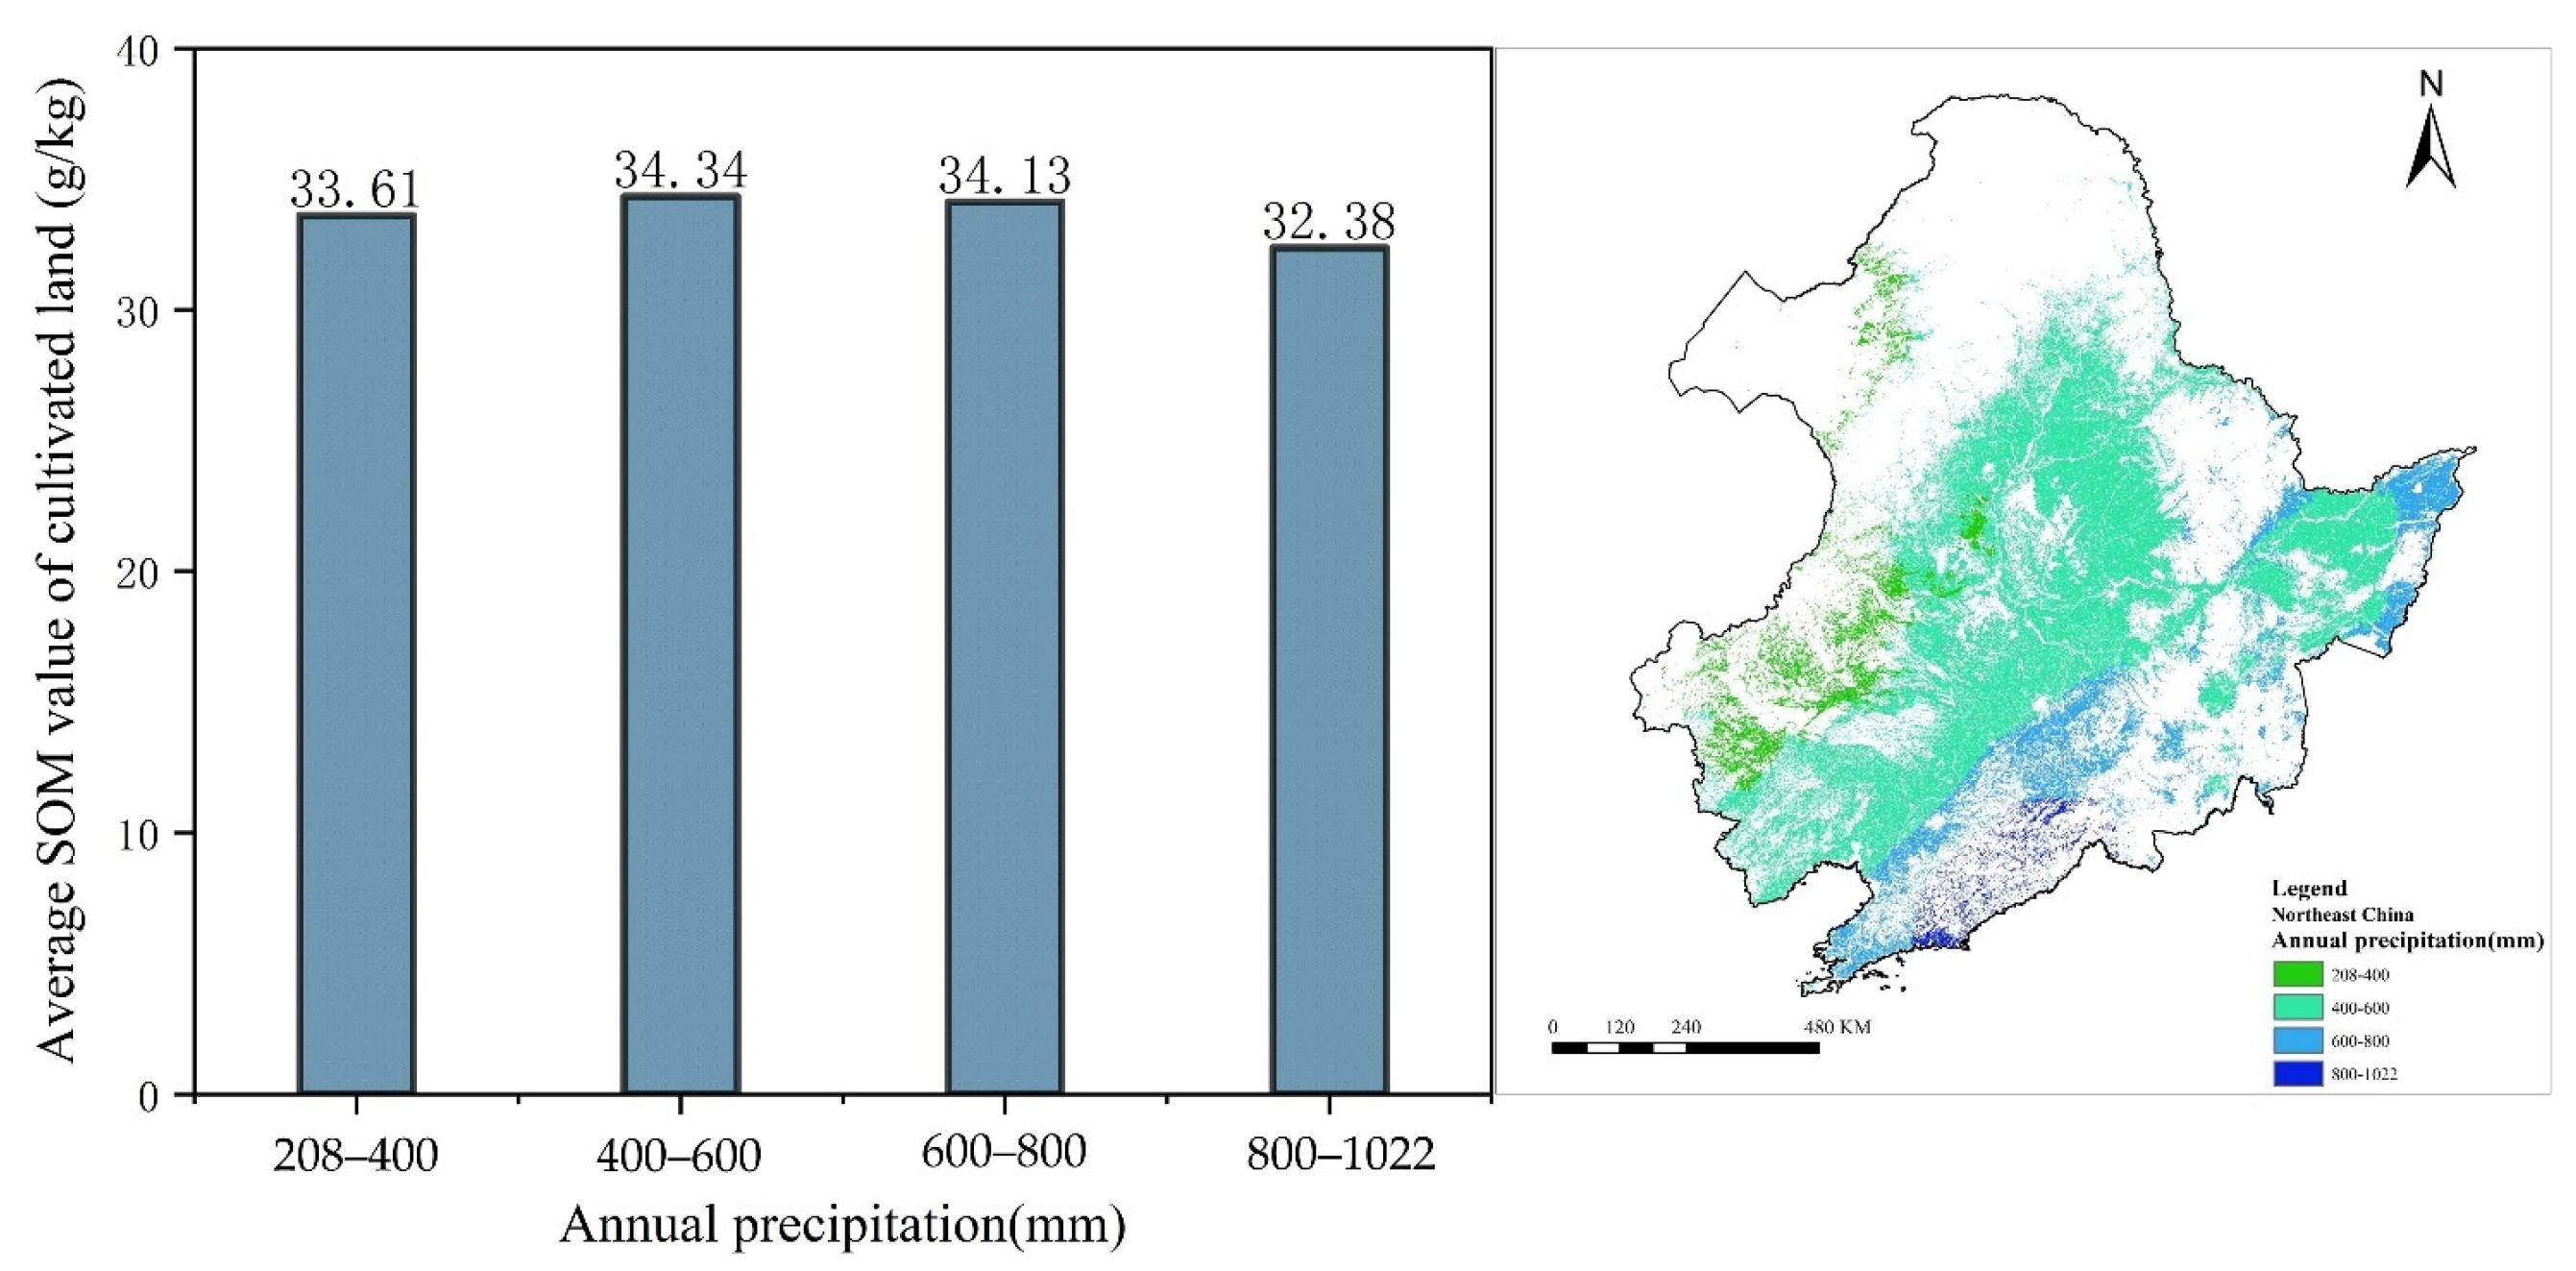
3.2.3. Characteristics of the Distribution of SOM Content over Annual Average Precipitation

The average value of cultivated land SOM content in the northeast region did not change considerably under different annual average precipitation classifications (Figure 6). Only the average value of cultivated land SOM content in the region receiving between 800 mm and 1022 mm of precipitation was lower than 33 g/kg. In contrast, the average value of cultivated land SOM content in the other three classified regions ranged from 33.61 g/kg to 34.34 g/kg. The SOM content of cultivated land in the six regions varied considerably under different annual average precipitation classifications (Figure A2). Among them, the NSA and LHPM exhibited a “U-shaped” phenomenon, characterized by an initial decrease followed by an increase, whereas there was no obvious change observed in SJP.

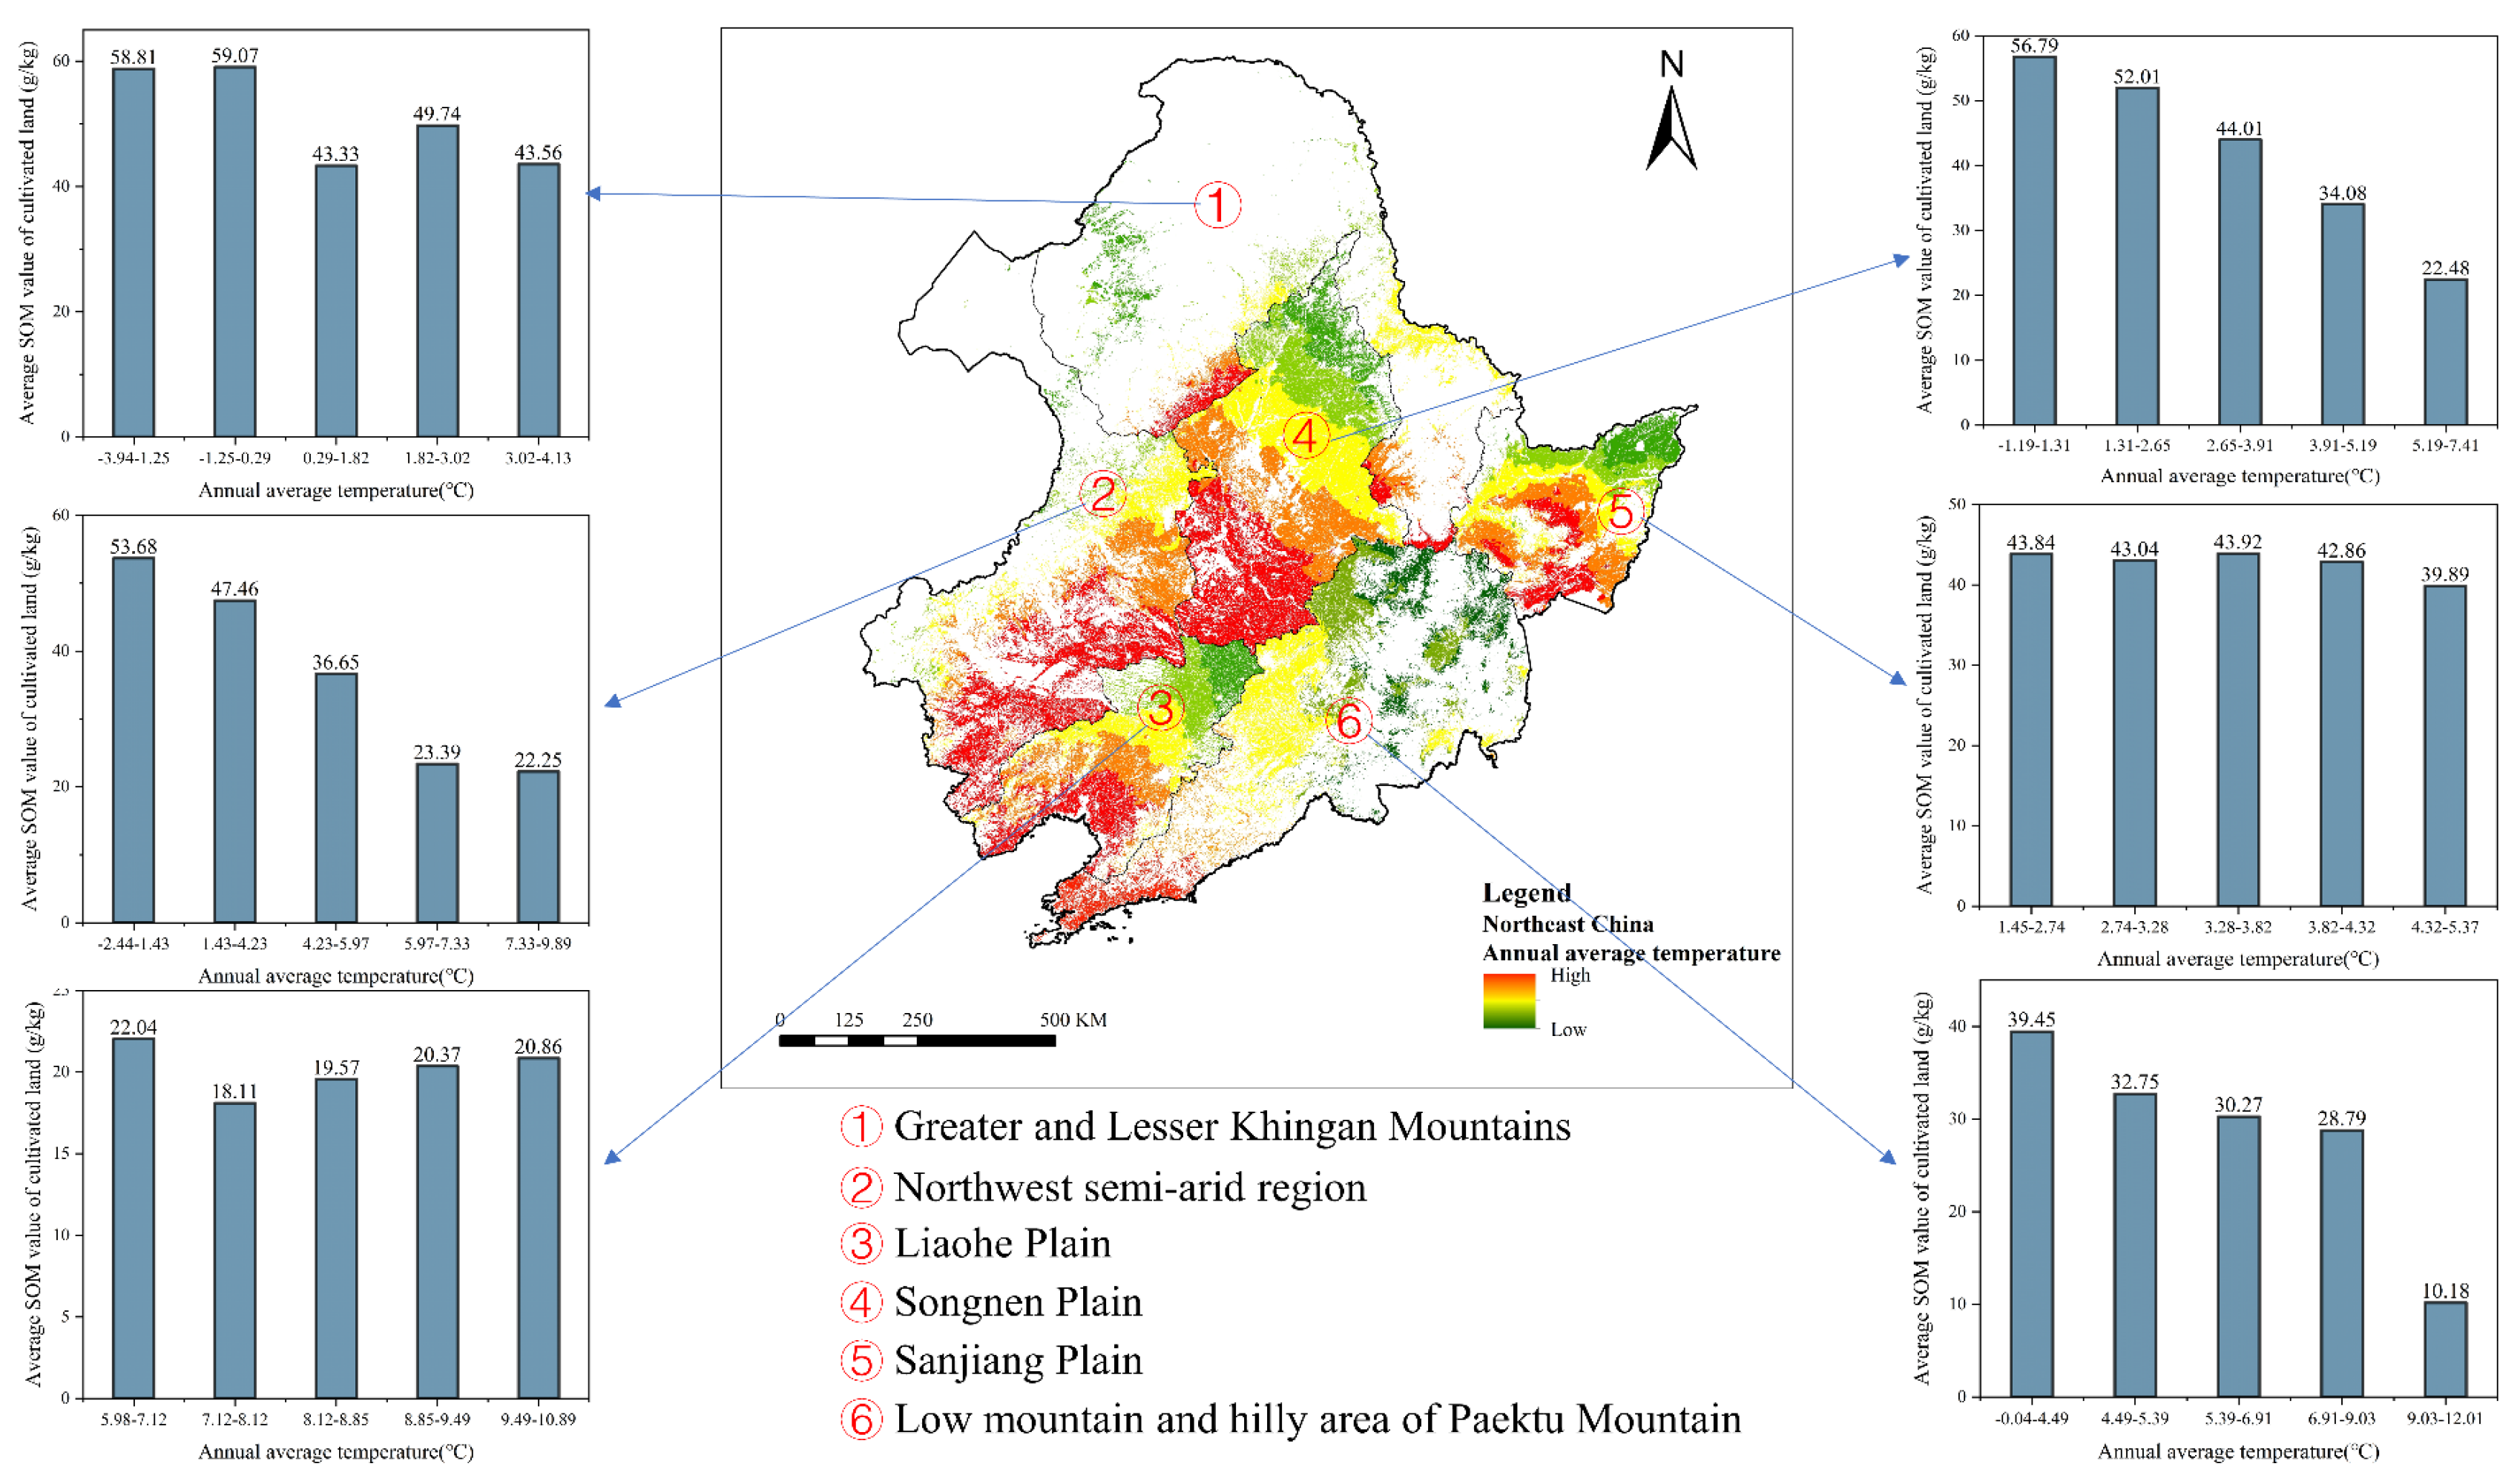
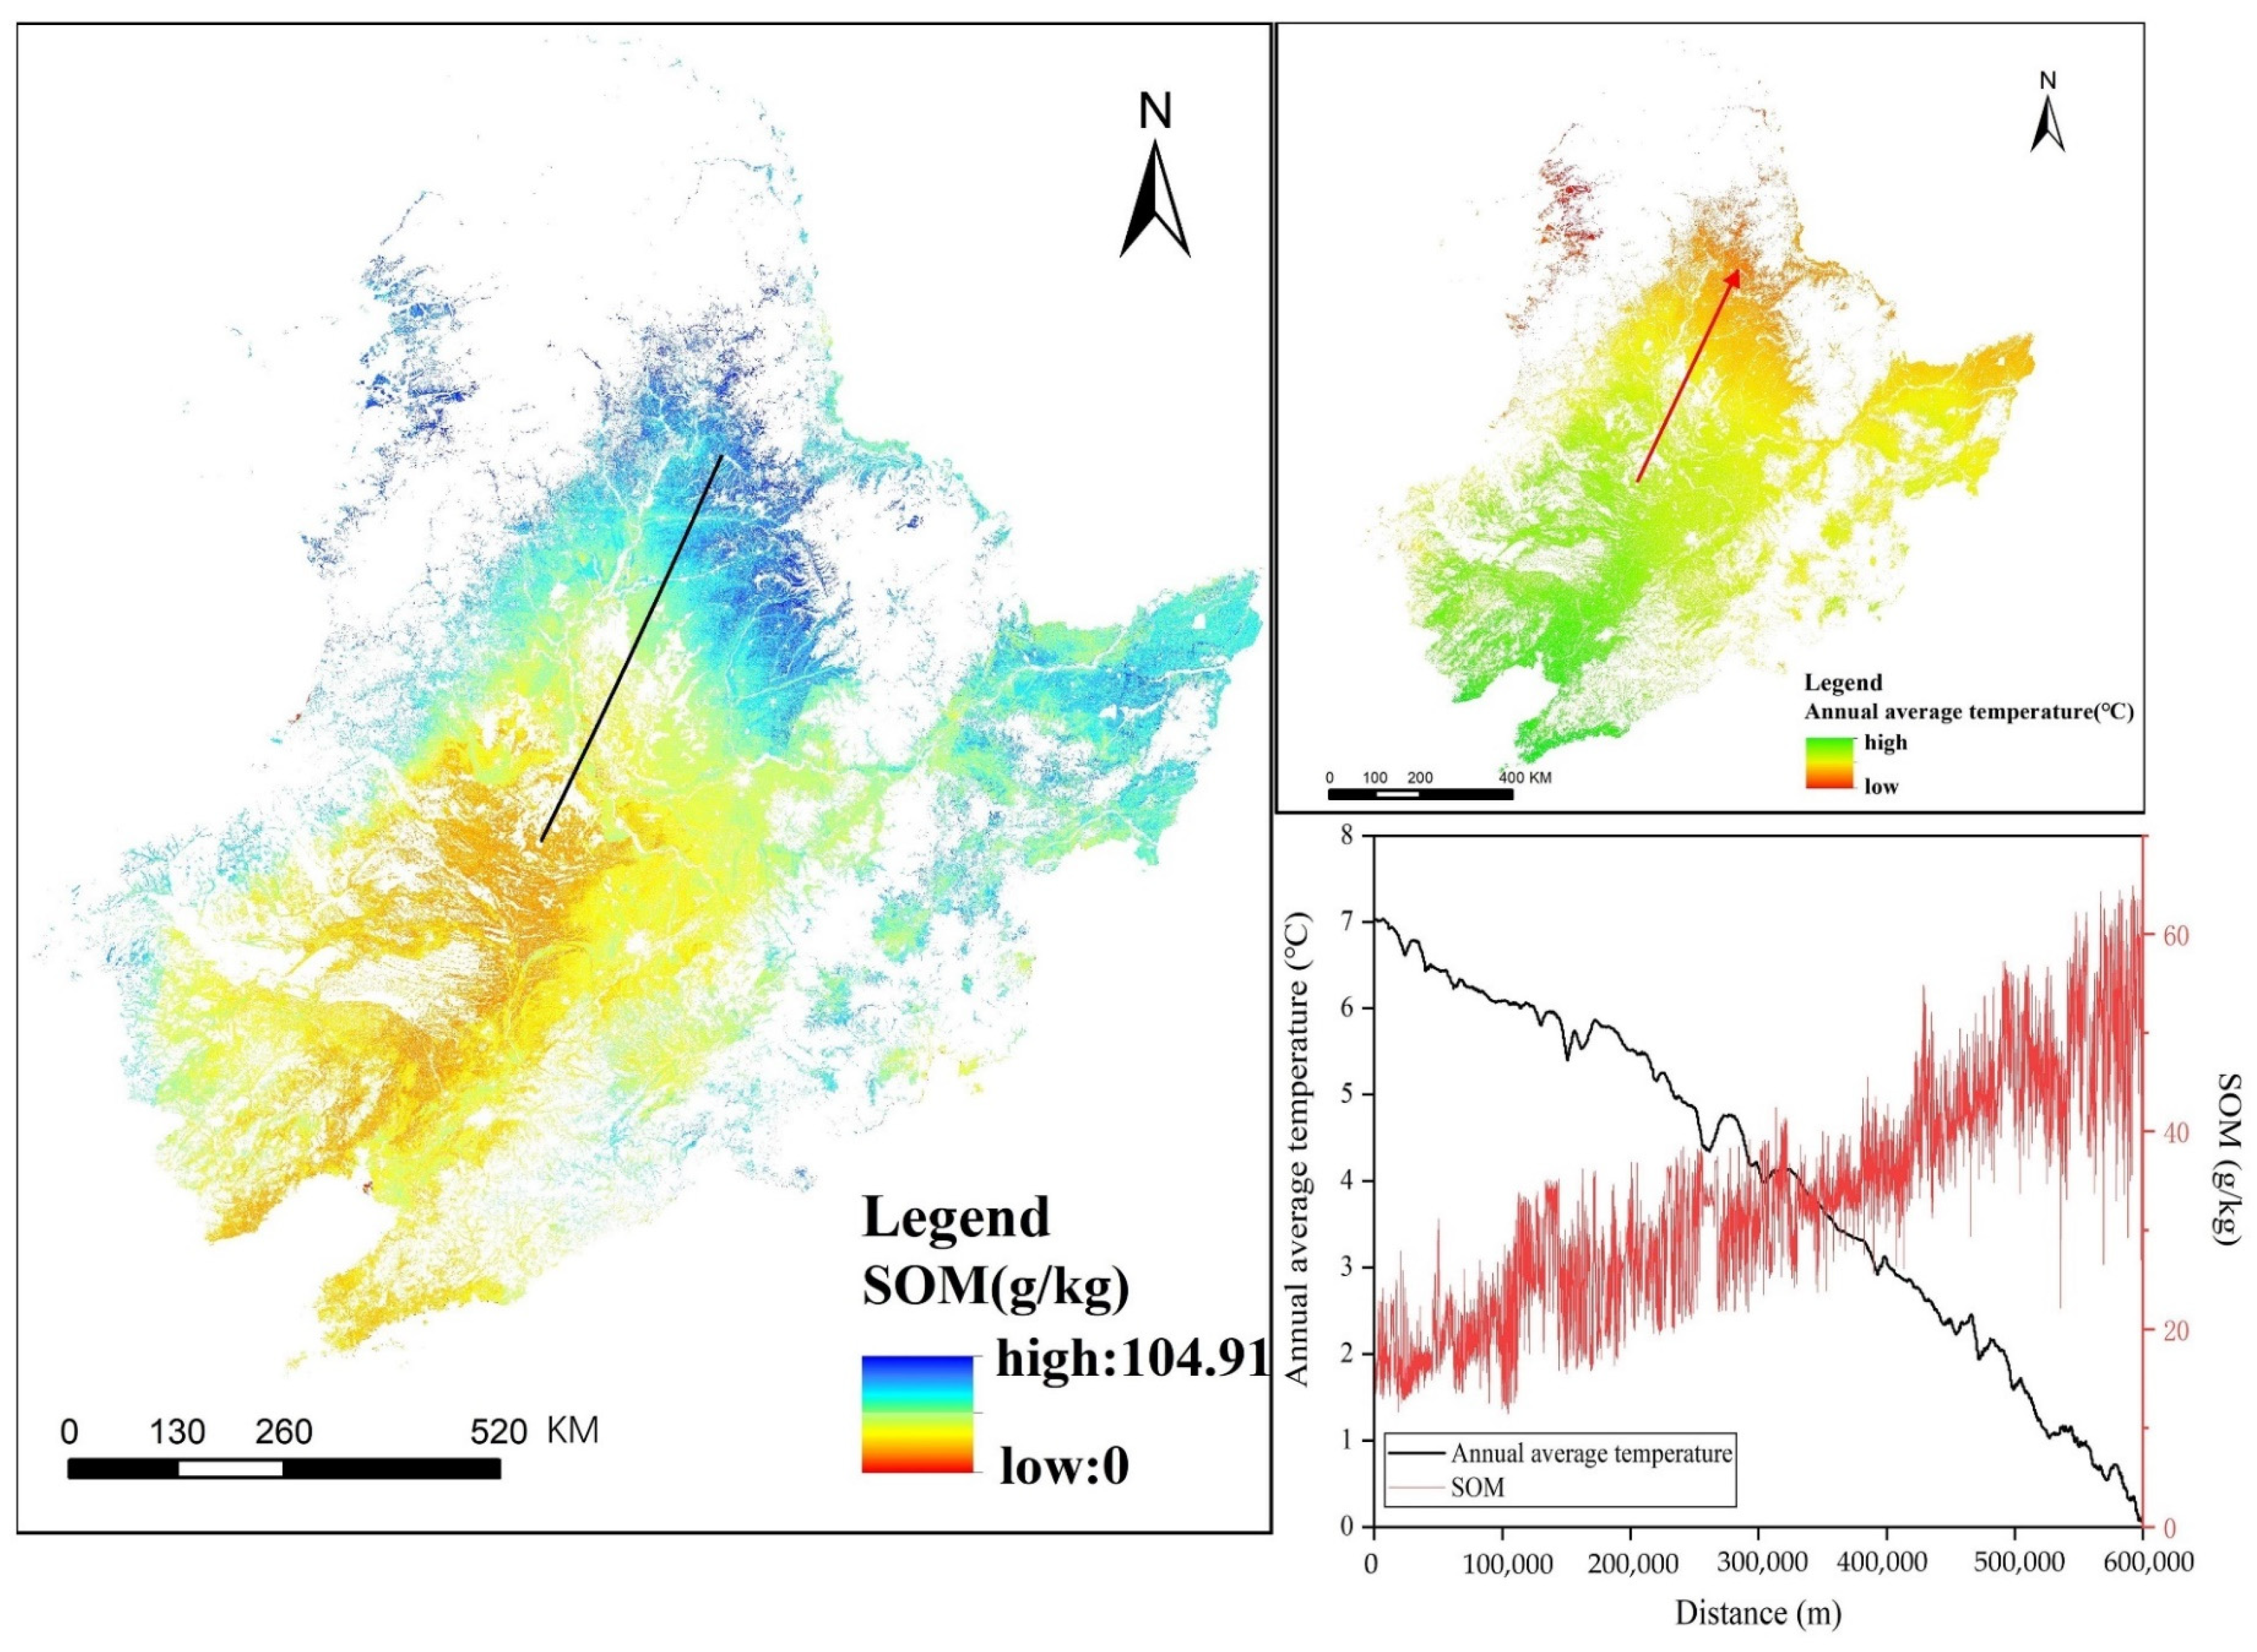
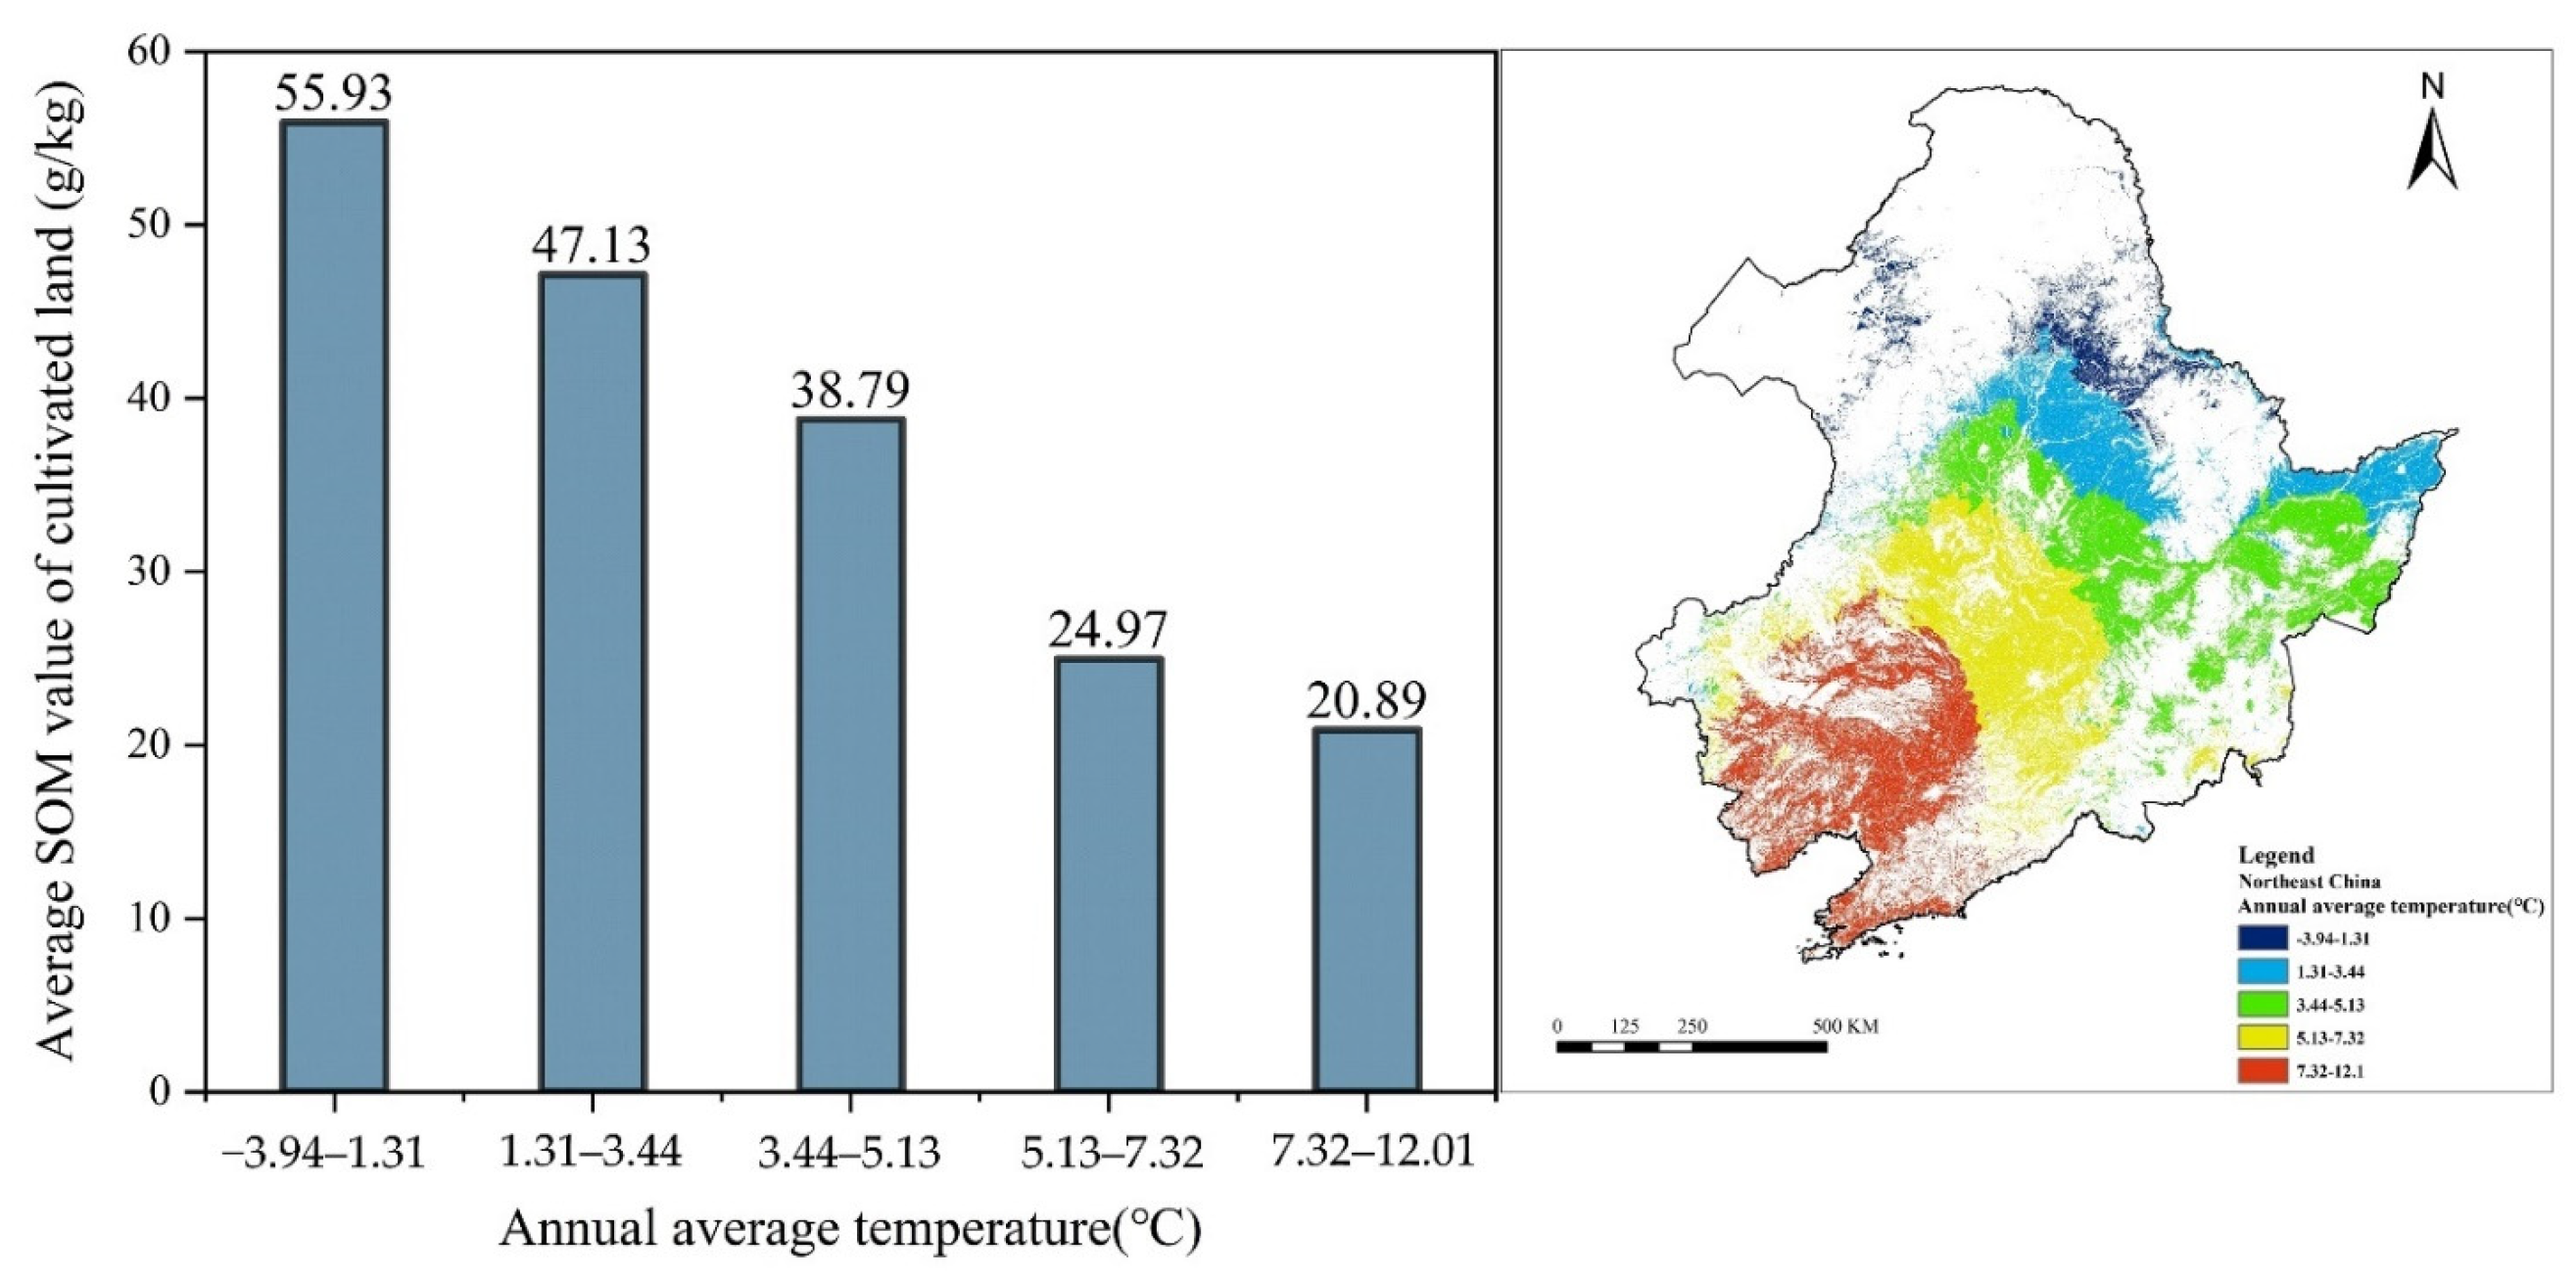
3.2.4. Characteristics of the Distribution of SOM Content over Annual Average Temperature

As shown in Figure 7, the average SOM content of cultivated land in each annual average temperature grading band is considerably associated with each annual average temperature grading. The average SOM content of cultivated land in the Northeast declined sharply with increasing annual average temperature. The individual annual average temperature classifications within the six regions all showed a trend of decreasing temperatures from south to north (Figure A3), in which the SOM content of cultivated land in the NSA, SNP, and LHPM decreased gradually with increasing annual average temperature, GLKM showed fluctuating changes, and there was no obvious trend in SJP.

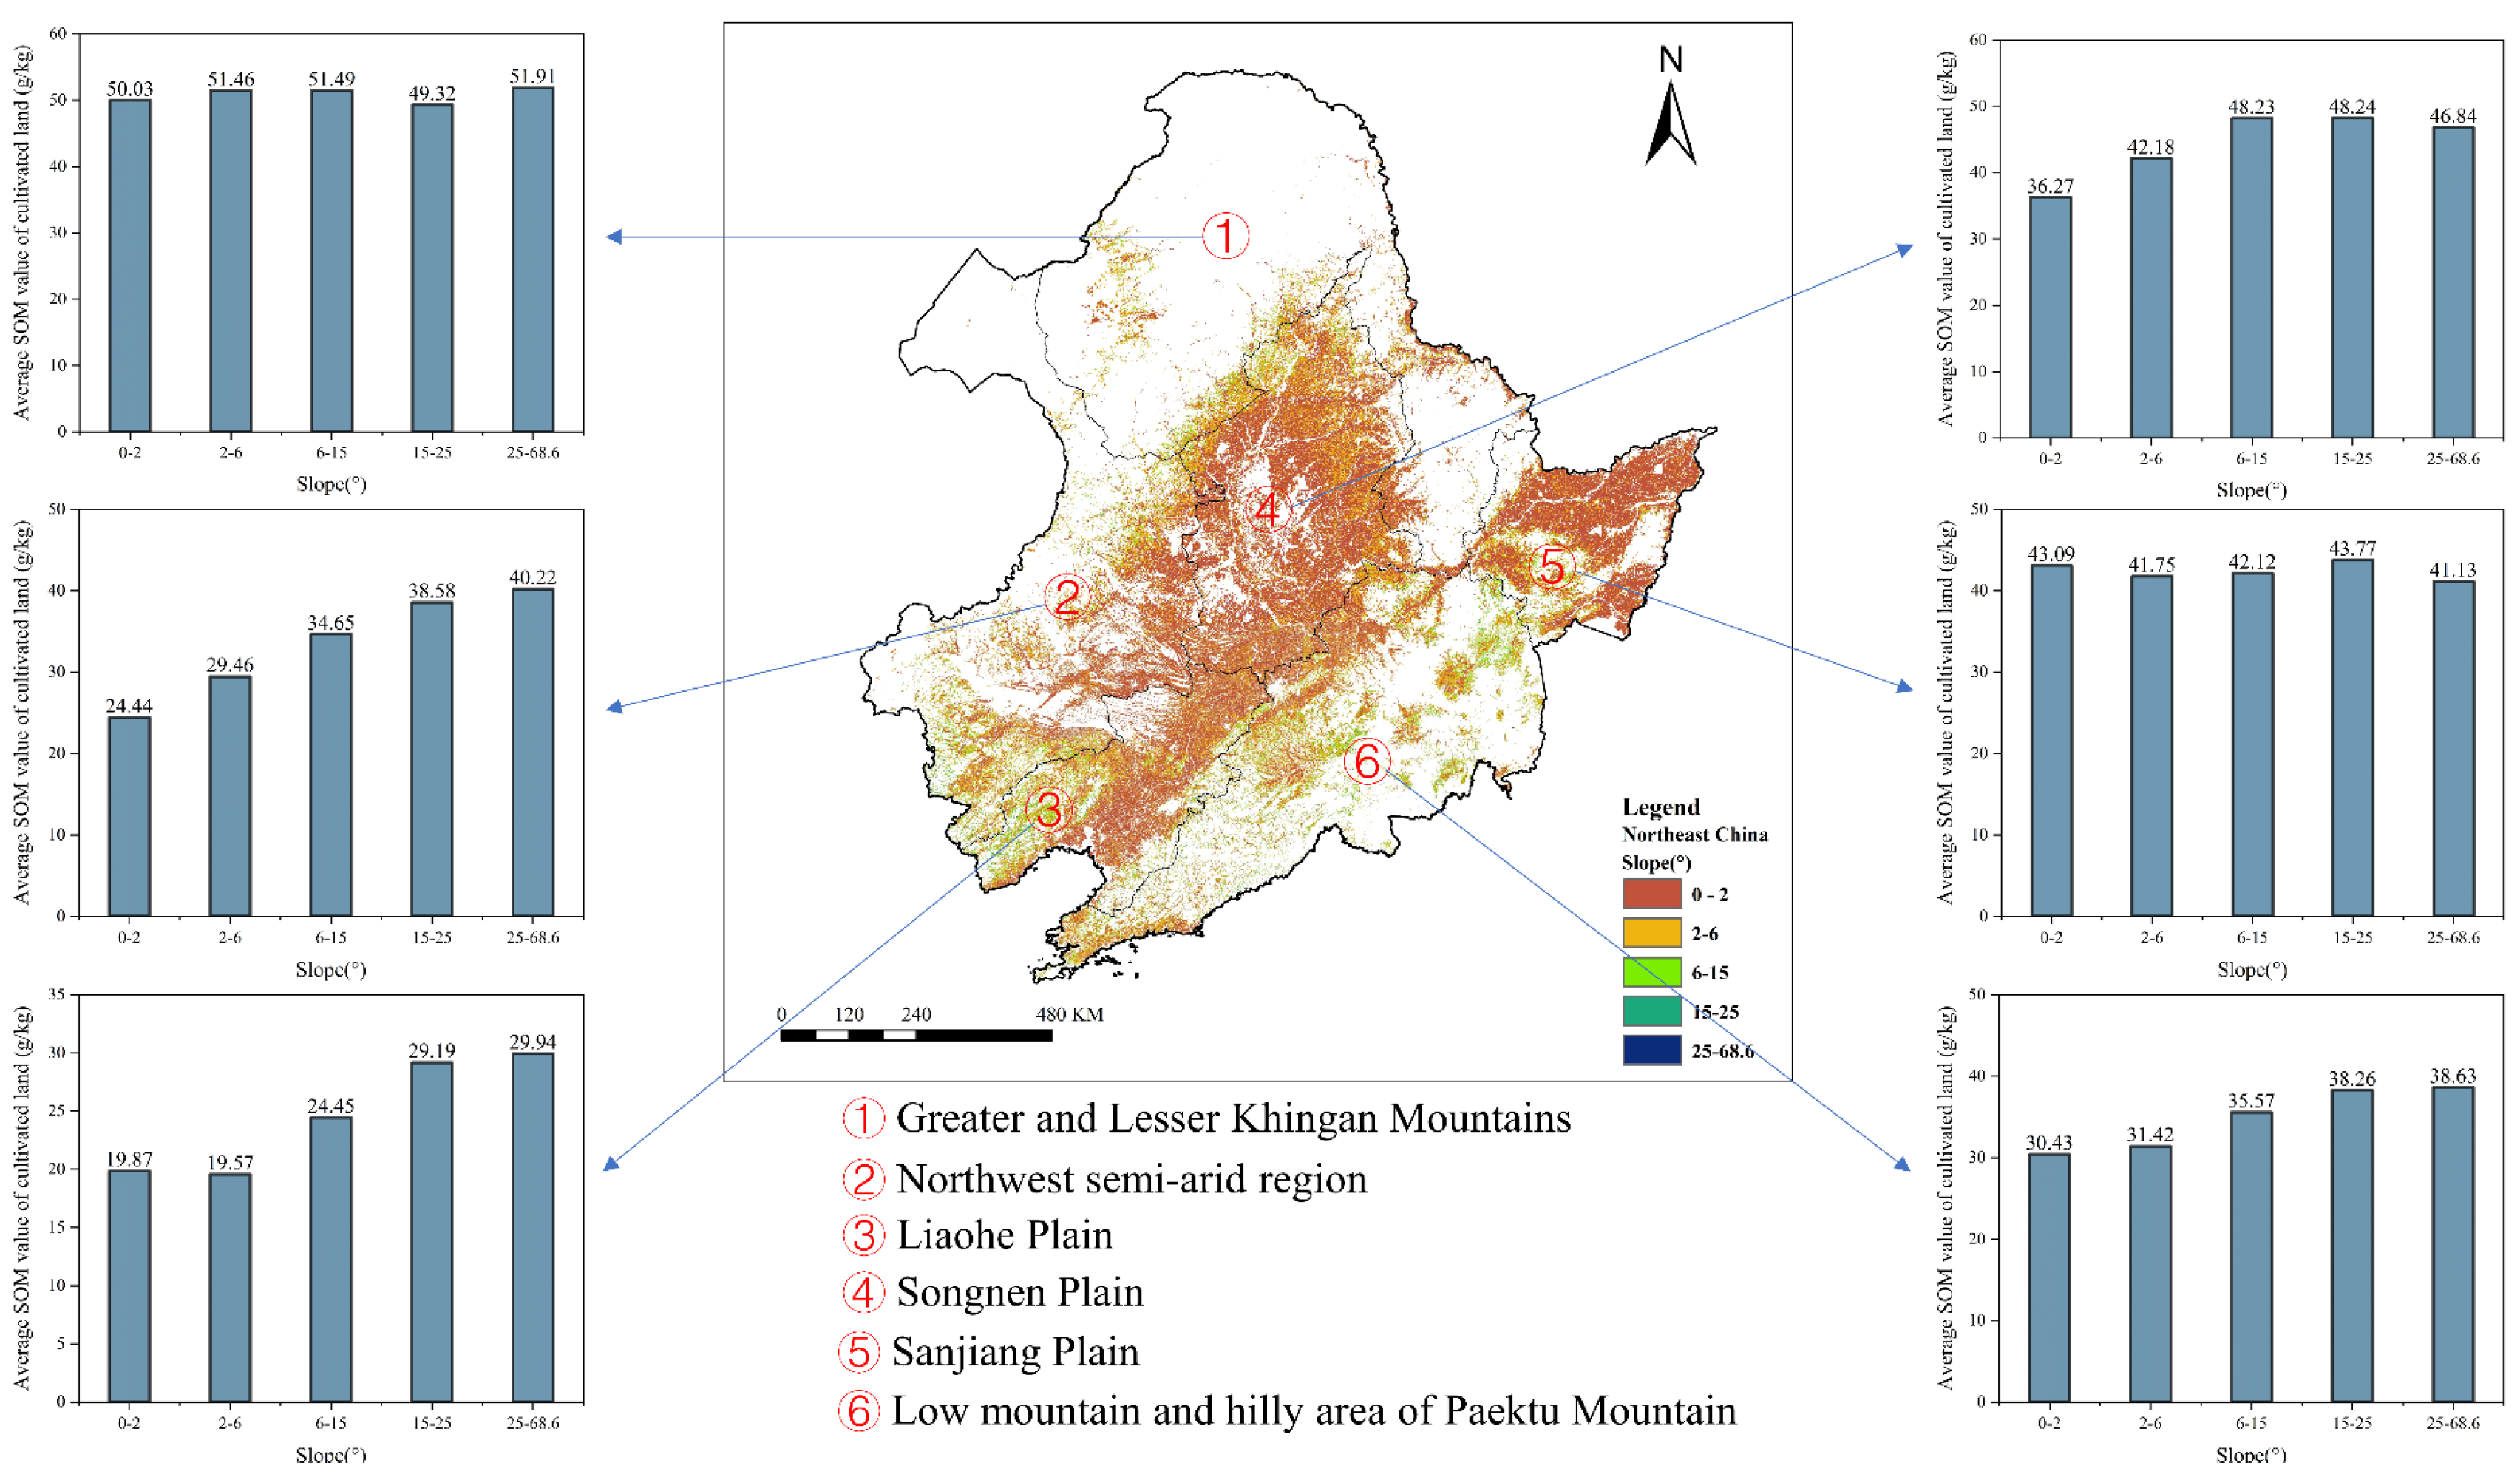
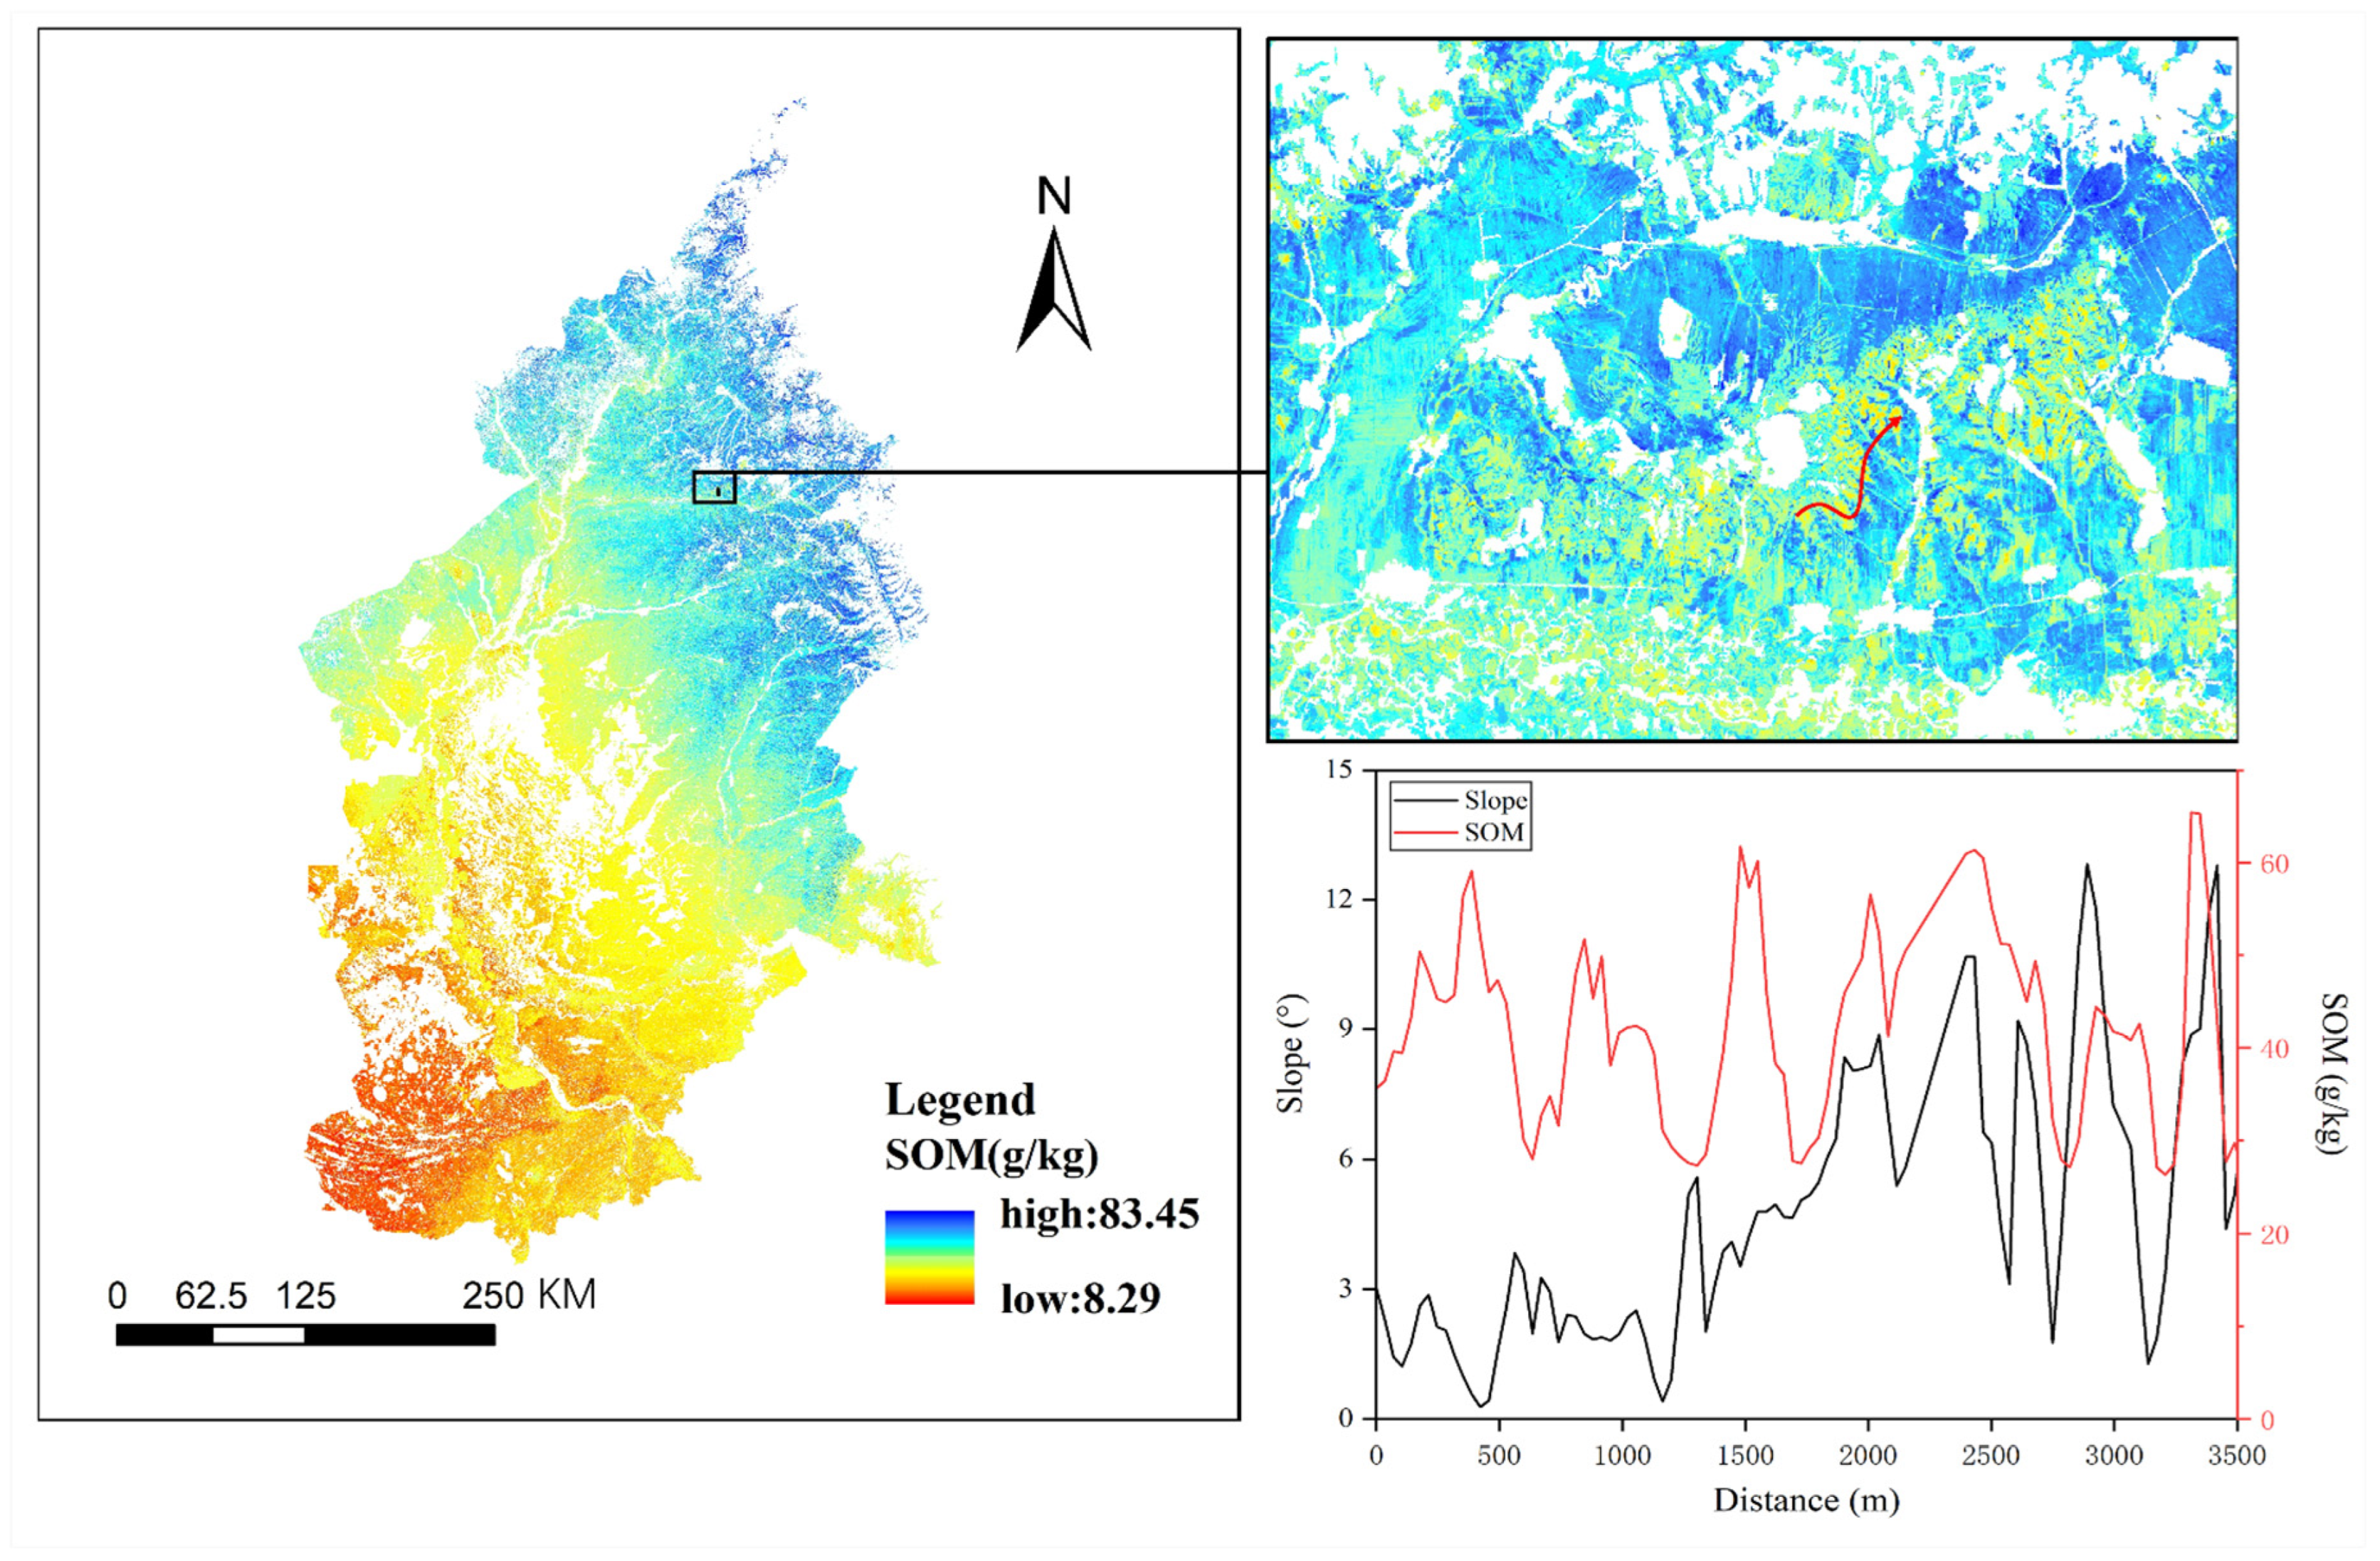
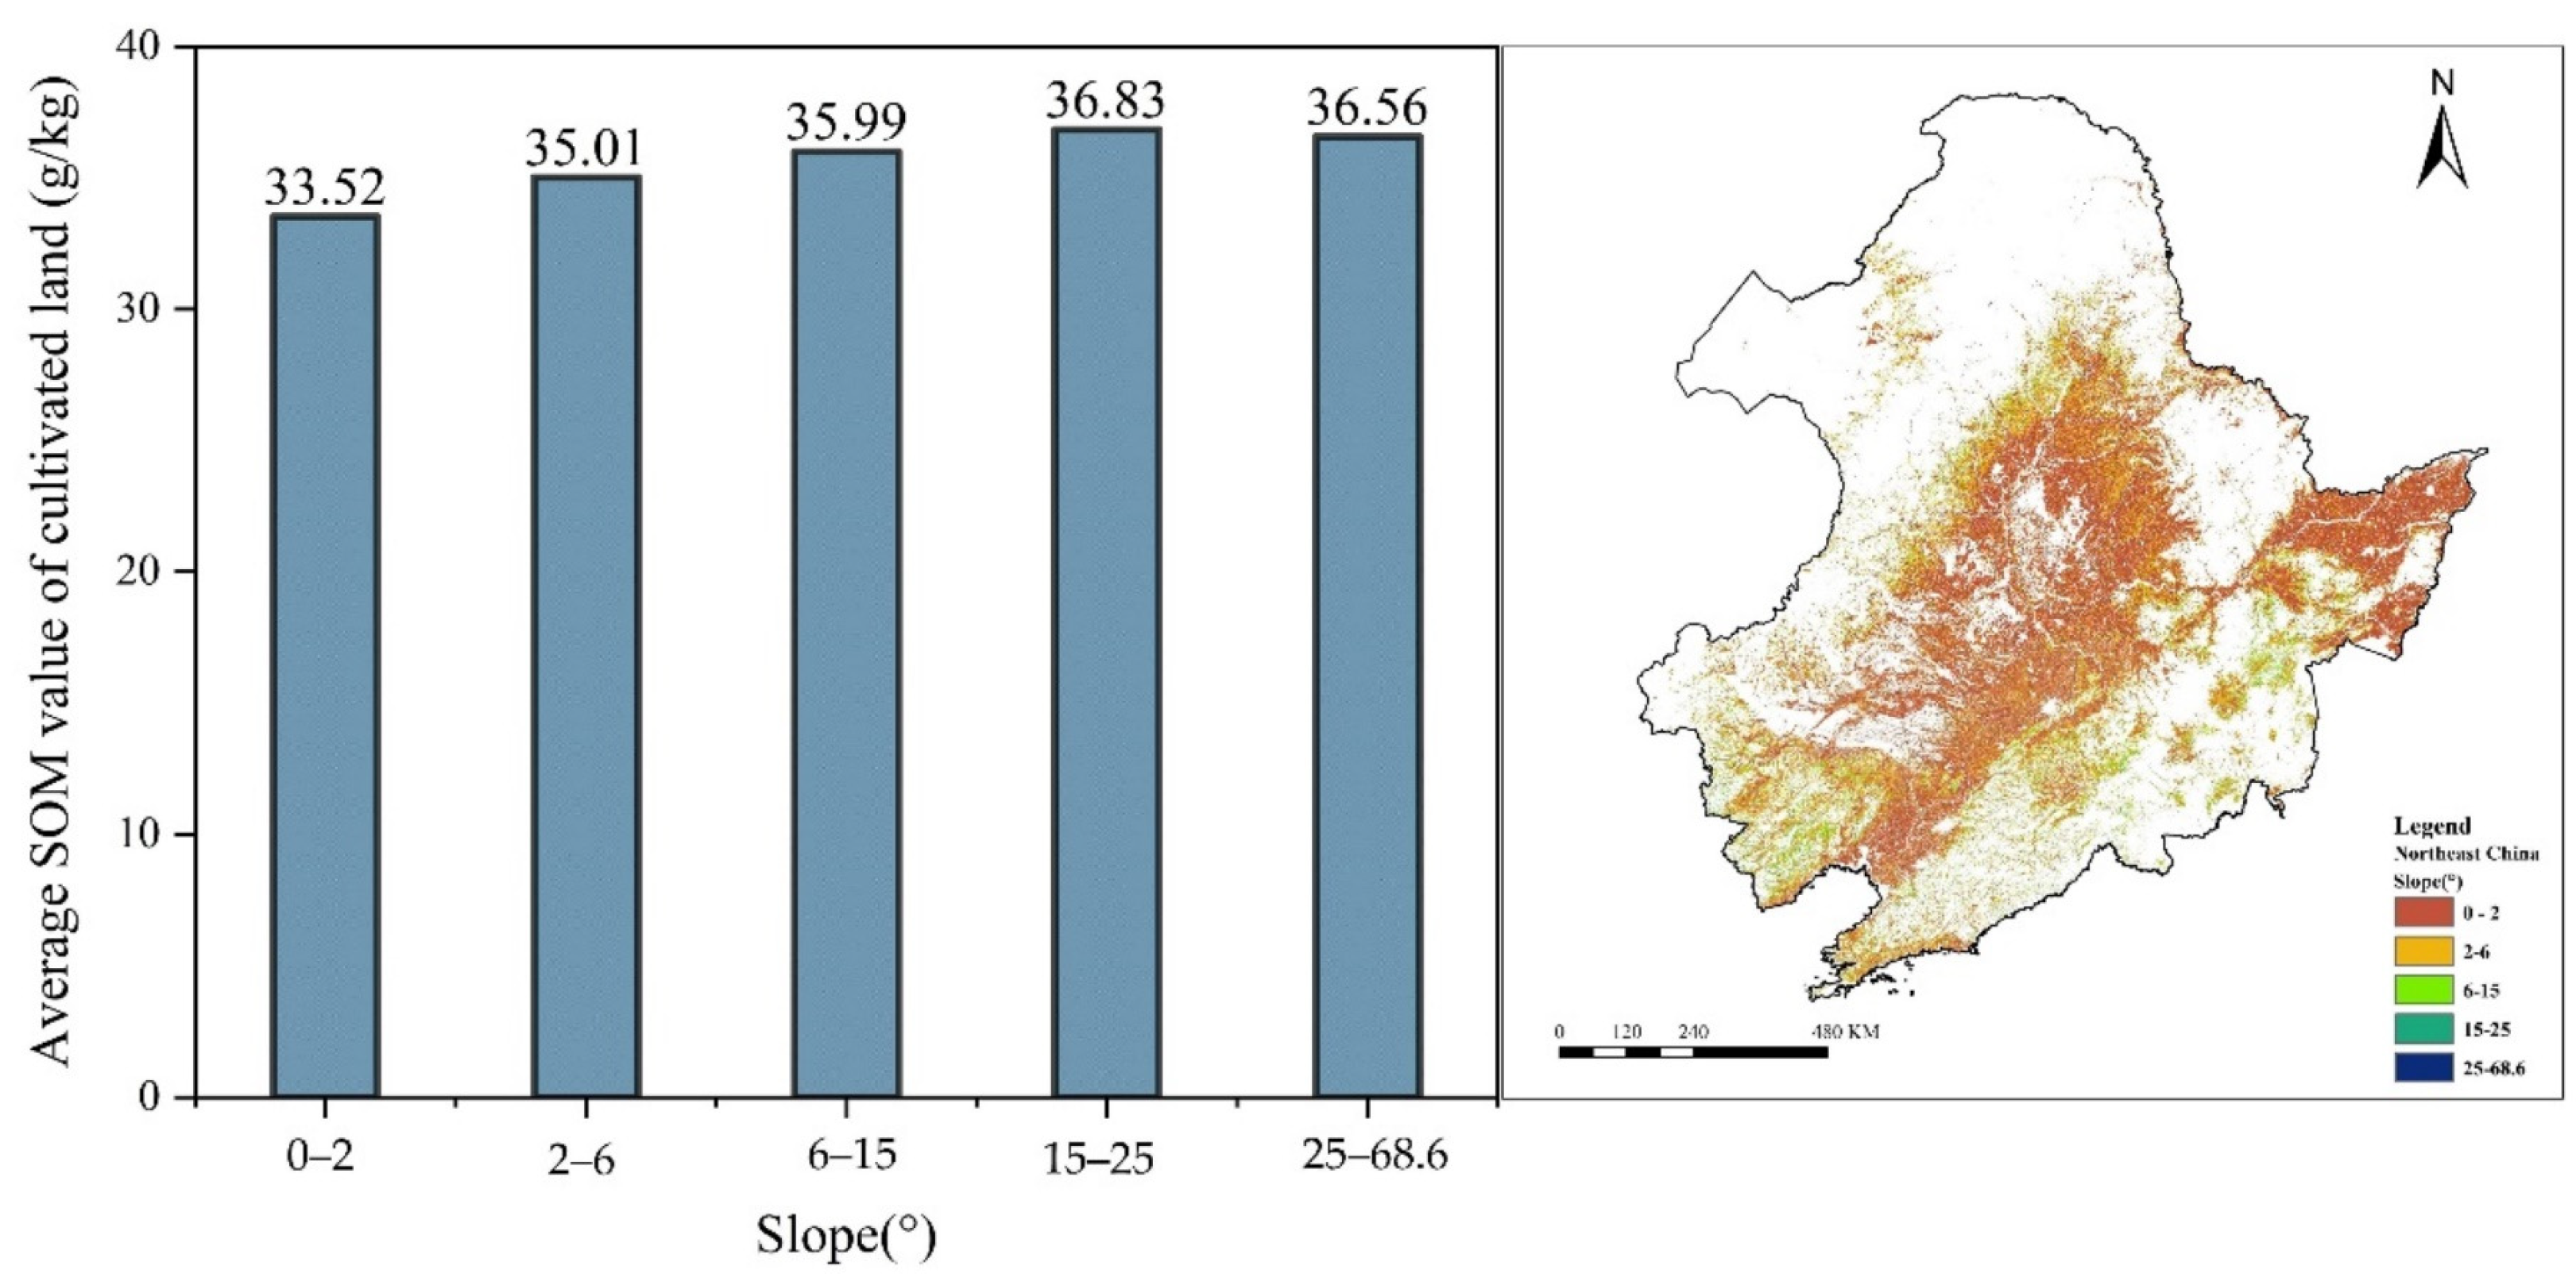
3.2.5. Characteristics of the Distribution of SOM Content over the Slope

The SOM content of cultivated land in the northeast region did not change considerably across slope classifications (Figure 8), showing only a weak inverted “U” trend. The SOM content of cultivated land in the six regions had its own trends in different slope classifications (Figure A4). Among them, the SOM content of cultivated land in the NSA, LHP, and LHPM increased with increasing slope classification, SNP showed an inverted U-shaped trend, while GLKM and SJP did not show obvious changes.

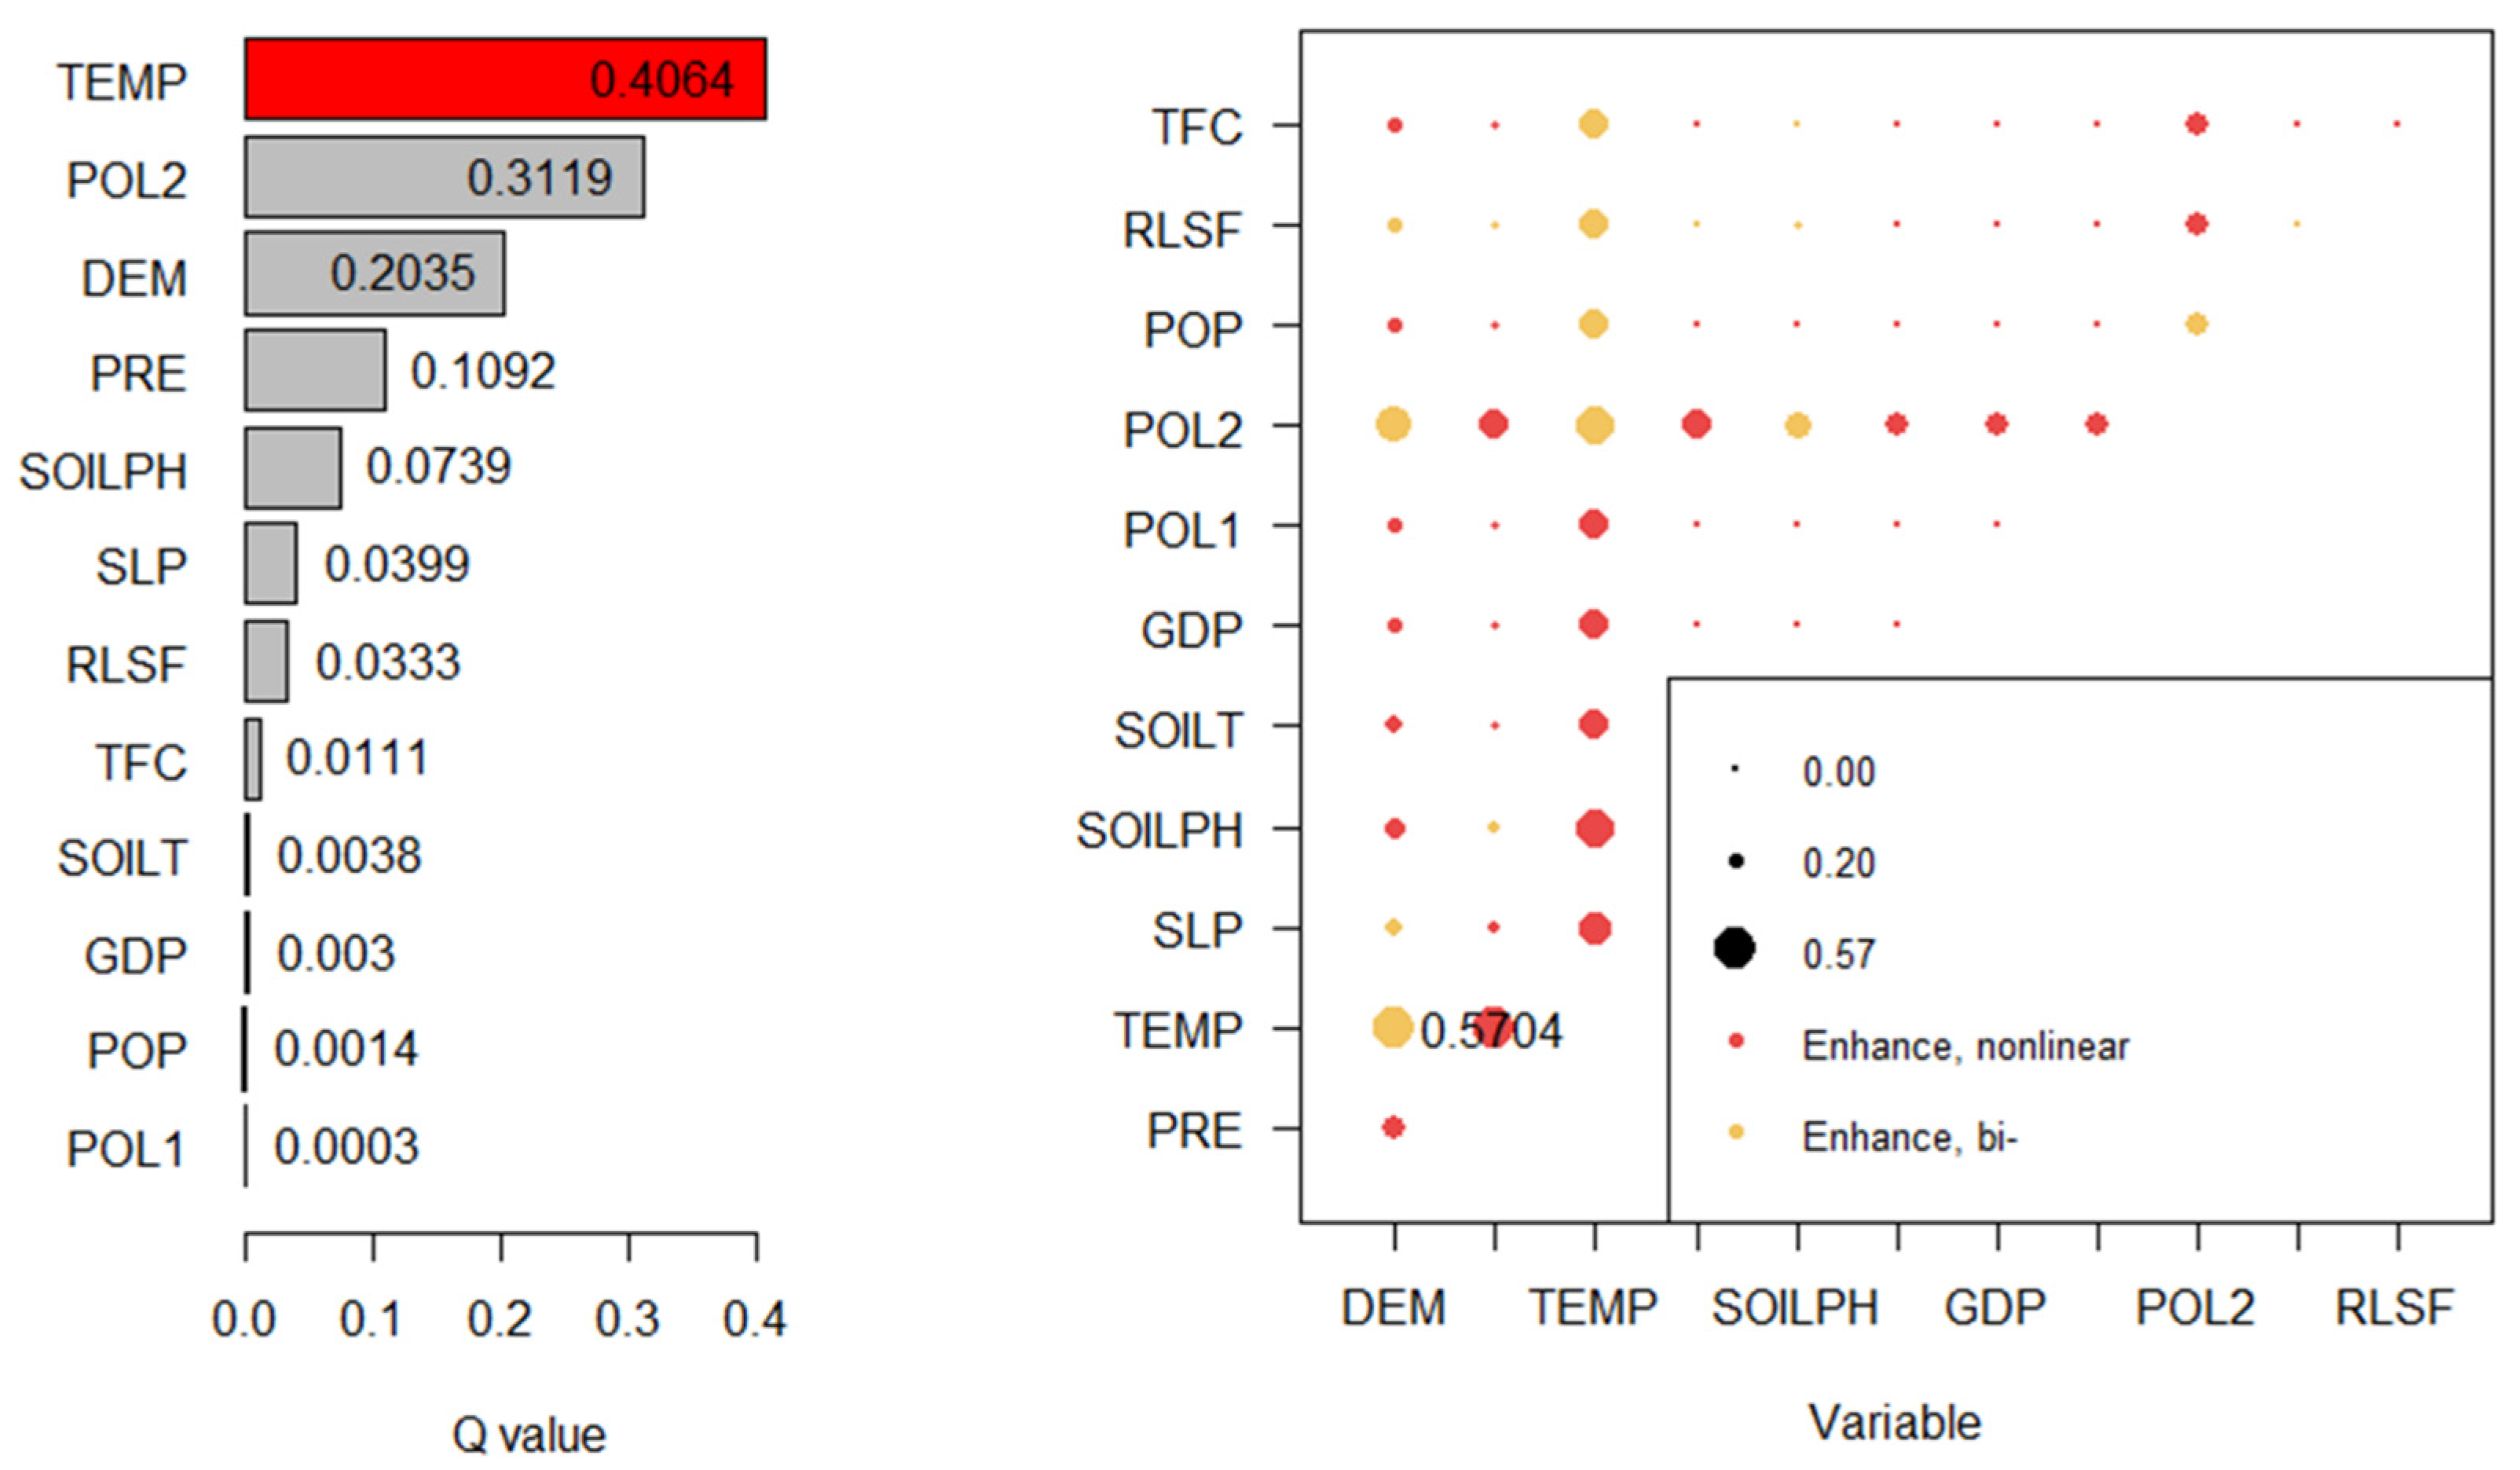
3.3. Analysis of Influencing Factors on Spatial Distribution of SOM Content

The spatial correlation between each influencing factor and the SOM content of cultivated land in Northeast China is shown in Figure 9, in which the magnitude of the q value in the factor detector (Figure 9 left) indicates the extent to which the dependent variable Y is influenced by the independent variable X. The strength of the explanatory power of the influencing factors that influence the spatial distribution of the SOM content of cultivated land in Northeast China is ranked in descending order as TEMP > POL2 > DEM > PRE, and the interaction detector (Figure 9 right) shows that the most obvious combination of factors influencing the spatial distribution of SOM content in Northeast China is TEMP ∩ PRE, indicating a nonlinear enhancement when these factors interact.
Among the six regions (Figure A5), DEM, SLP, and POL2 were the three most obvious factors affecting the spatial distribution of SOM content in cultivated lands of the six regions. The two-factor interaction combined with POL2 or DEM was the most obvious and mostly nonlinearly enhanced. The spatial distribution of SOM content in cultivated lands in the mostly mountainous GLKM, NSA, and LHPM regions was mainly affected by DEM. The differences in the spatial distribution of SOM content in SNP and LHP, which are mainly plains, were considerably affected by SLP.

4. Discussion

4.1. Advantages of Remote Sensing-Based SOM Spatial Distribution Studies

Previous studies spatially analyzed the SOM through point data obtained from geostatistical analysis, but its spatial limitations and the limitation of spatial and temporal resolution often lead to the acquisition of less accurate experimental data [26]. The surface data obtained by remote sensing inversion in this study have a wide spatial coverage and high spatial and temporal resolution, which can better represent the spatial heterogeneity of the SOM [27].
Remote sensing technology can cover a wide geographical area [28], providing multi-scale data on SOM distribution from small to global scales. Additionally, it facilitates multi-source data fusion [29], including integration with other geographic information data [30] such as topographic data [31] and meteorological data [32]. This integration enhances the comprehensiveness of SOM distribution information. In this study, we analyzed the spatial distribution characteristics of SOM content in Northeast China and its six regions using 10 m resolution data [23] and adopted a grid of 5000 m × 5000 m for Northeast China, which breaks the traditional spatial analysis based on administrative district boundaries and makes each selected study area more random and reliable. We systematically and comprehensively analyzed the spatial distribution characteristics of overall SOM content in Northeast China. Additionally, Northeast China was divided into six regions based on the regional policy of the black soil conservation area. We analyzed the differences in SOM content across these regions, considering variations in topography, annual average precipitation, annual average temperature, and other spatial characteristics, aiming to explore underlying patterns. The Geodetector model was also employed to identify the influencing factors contributing to variations in the spatial distribution of SOM across different regions.

4.2. Spatial Distribution Pattern of SOM in the Northeastern Black Soil Area

Many studies have established that climatic factors predominantly influence the spatial distribution of SOM [5,33]. It has been shown that SOM content does not consistently increase with higher precipitation alone but is also influenced by the interaction between water and temperature [34]. This is similar to the results obtained in this study, where the SOM content reaches its highest value at 400 mm to 600 mm throughout the northeast region (34.34 g/kg). This is a moderate amount of precipitation in the northeast. However, the trend of SOM content with precipitation varies from one protected area to another because the hydrothermal mix varies greatly from one protected area to another.
SOM content is considerably higher in areas with lower annual average temperatures and decreases with increasing temperature [35]. Quantitative analysis revealed that the annual average temperature is the dominant factor influencing the spatial distribution of SOM in Northeast China. Overall, the trend of SOM content was also consistent with the trend of annual average temperature (Figure A6). This is because warmer temperatures accelerate the decomposition rate of organic matter, which is favorable for microbial reproduction and activity, and warmer climates are usually accompanied by the increased evaporation of water from the soil and decreased precipitation [36]; this may lead to soil drying, which may promote the decomposition of organic matter in the soil, thus reducing SOM content [37]. On the contrary, lower annual average temperatures slow down the rate of organic matter decomposition and conversion and increase the accumulation of organic matter [38]. It has been shown that warming suppresses the soil excitation effect, which would weaken the positive feedback between soil CO2 emissions and climate warming [39]; we need to pay more attention to the effect of climate warming on SOM in future studies.
Previous studies have concluded that the lower the topographic fluctuation, the higher the SOM content of cultivated land in Northeast China [40], because the terrain is flat, precipitation is relatively low, wind and water erosion are weak, and SOM is easily retained [41]. But the findings of this study are the opposite of that. This study found that the SOM content of cultivated land in Northeast China was the lowest in areas with slopes of 0°–2° but highest in cultivated land with slopes of more than 6°. Based on the profile analysis function of ArcGIS 10.8, we selected the slope as the base map to investigate the variation in SOM along the line segment direction for a certain distance and the slope for the same distance in the same direction. We found that the SOM values in SNP and LHP increase with the slope (Figure A7 and Figure A8). The reasons for this phenomenon are, on the one hand, related to the local sequence of the cultivation of cultivated land, i.e., the cultivation of gently sloping areas first and then the gradual cultivation of steeply sloping areas [42]. On the other hand, this phenomenon may be attributed to denser vegetation cover on steeper slopes, which mitigates soil erosion and enhances SOM accumulation [43].
Many scholars have found considerably lower SOM content in areas with higher elevations [44], and the findings of this study are contrary to this. Based on the profile analysis function of ArcGIS 10.8, we investigated the geospatial variation of SOM content and DEM in six regions and found that the SOM content of cultivated land in the NSA, GLKM, and LHPM (Figure A9, Figure A10 and Figure A11) showed a very obvious increase in the SOM content of cultivated land with increasing elevation. This may be due to the fact that in mountainous areas, people usually cultivate lower-elevation areas before higher-elevation areas.

4.3. The Need for a Regional Approach in Different Black Soil Conservation Areas

Northeast China serves as a crucial food production base within China [45], and to ensure successful harvests and the sustainable development of high-yield agriculture, it is essential to tailor black soil conservation efforts to local conditions based on the main influencing factors of SOM distribution in these six conservation areas (Table 3).
In the three DEM-dominated regions, a conspicuous characteristic is the steep topography found in high-altitude areas such as GLKM and LHPM. Within these regions, terrace cultivation stands out as a recognized and effective strategy for land management [46]. This agricultural practice not only attenuates water flow, thereby mitigating the risk of soil erosion, but also serves as a preventive measure against the rapid depletion of SOM.
Conversely, in lower-altitude areas, exemplified by the saline-alkali lands in NSA, the focal point shifts towards the implementation of drainage systems. Ensuring optimal soil drainage not only effectively hinders salt accumulation but also aids in mitigating soil salinization issues, concurrently decelerating the decline in SOM [47].
Turning attention to areas characterized by obvious slopes, namely LHP and SNP, a distinctive observation in the LHP region is the gradual increase in SOM content with rising slope, albeit accompanied by an augmented susceptibility to water-induced soil erosion. To counterbalance this predicament, the adoption of terrace cultivation practices is proposed in the LHP region. Terrace cultivation, renowned for its efficacy in reducing water flow velocity and curbing soil erosion, emerges as a safeguarding mechanism for SOM [48].
Meanwhile, in the SNP region characterized by gentle slopes, it is advisable to implement Soil and Water Conservation Engineering (SWC Engineering) measures. This encompasses the construction of channels and check dams to regulate water flow, alleviate soil erosion pressures, and concomitantly support the preservation of soil structure and organic matter [49]. These comprehensive strategies aim to establish and perpetuate the stability of soil organic matter and foster the robust health of soil structure in regions characterized by obvious slopes.

4.4. Shortcomings and Prospects

In this study, we examined the spatial distribution of SOM content in cultivated land across Northeast China and its six regions from various perspectives. We used the Geodetector model to assess the explanatory power of several influencing factors on the spatial distribution of SOM content in different regions. However, this study has the following limitations.
When using the factor detector for the six regions, it was found that the most important influencing factors affecting the spatial distribution of cultivated land SOM in the six regions were not all the traditional elevation, precipitation, temperature, and slope, and even some traditional influencing factors did not have an obvious influence. This may be caused by the unique environment of the six regions, or the size of the fishing grid created in the six regions is too large to analyze the exact factors in more detail. In future studies, we will attempt to analyze the six regions individually using either a 2000 m × 2000 m or 1000 m × 1000 m grid. Alternatively, each countywide area in the northeast will be analyzed for SOM content in that location using each data grid.
In response to the shortcomings, such as the factor detector not being able to detect the spatial variability of the SJP, it may be that the impact factors selected for this study are not applicable to the region. The study map revealed that the spatial distribution of SOM content in cultivated land in the SJP was relatively uniform, leading to the weak explanatory power of other conventional influencing factors. In the future, we will analyze various aspects of the SJP and select applicable influencing factors to further investigate what affects the spatial distribution of SOM content in the SJP.
Furthermore, this study conducted spatial analysis using a single moment of SOM content data from the study area, thus we are unable to capture temporal changes and perform multi-scale analyses. Future research will involve selecting SOM content data from various time periods to facilitate in-depth investigations across the study area. In this study, we found that the influencing factors affecting the spatial distribution of SOM content in the northeast region are mainly dominated by natural factors, while the influence of human factors is not obvious, which may be due to the difficulty of the spatialization of human factors, and it is difficult to find accurate human factors, so how to obtain more accurate human data is another key issue for future research.

5. Conclusions

Our study systematically analyzed the spatial distribution patterns of SOM and its influencing factors in the cultivated lands of the black soil region in Northeast China. The key findings are as follows:
(1)
The overall northeast region and various conservation zones exhibit distinct patterns of SOM change along environmental gradients such as DEM, slope, temperature, and precipitation.
(2)
The spatial distribution of SOM varies across the northeast region and its conservation zones, with more pronounced changes in certain subzones.
(3)
The annual average temperature is the primary factor influencing SOM distribution in the entire northeast region.
(4)
In different conservation zones, DEM and slope are the dominant factors affecting SOM distribution, likely linked to the progression of cultivated land reclamation.
(5)
Tailored measures should be implemented in different areas to address the declining trend of SOM in cultivated lands, providing critical guidance for the execution of cultivated land protection projects in black soil regions.
These findings offer valuable insights for the sustainable management of cultivated lands in Northeast China’s black soil region.

Author Contributions

D.K. and C.L.: Conceptualization, Methodology, Software. D.K. and N.C.: Data curation, Writing—Original draft preparation. D.K. and N.C.: Visualization, Investigation. C.L. and H.L.: Supervision. D.K. and N.C.: Software, Validation. C.L. and H.L.: Writing—Reviewing and Editing. All authors have read and agreed to the published version of the manuscript.

Funding

This study was supported by the National Natural Science Foundation of China (42101165); Harbin Normal University Postgraduate Innovation Project (HSDSSCX2024-06); the China Postdoctoral Science Foundation Grant (2021M693817); and the National Key Research and Development Program of China (2021YFD1500100).

Data Availability Statement

The SOM data used in this study can be found at this link: https://doi.org/10.1080/17538947.2023.2192005. Other data can be found on this website: Standard Map Service (http://bzdt.ch.mnr.gov.cn/).

Acknowledgments

I express gratitude to my partner Nanchen Chu, without his effort, this research could not have been accomplished. In the process of compilation, he made great contributions to data preprocessing, analysis, and writing. Sincere thanks are given to the anonymous reviewers and members of the editorial team, for their comments and contributions.

Conflicts of Interest

The authors declare no conflicts of interest.

Appendix A

Figure A1. Spatial distribution statistics of average SOM content of cultivated land on DEM in six regions.
Land 13 01028 g0a1
Figure A2. Spatial distribution statistics of average SOM content in cultivated land over annual average precipitation in six regions.
Land 13 01028 g0a2
Figure A3. Statistics on the spatial distribution of the average SOM content of cultivated land in six regions in terms of annual average temperature.
Land 13 01028 g0a3
Figure A4. Spatial distribution statistics of average SOM content of cultivated land on slope in six regions.
Land 13 01028 g0a4
Figure A5. Influencing factors individually (top) and interactively (bottom) on the spatial distribution of SOM content in cultivated land in six regions.
Land 13 01028 g0a5
Figure A6. Trends in SOM content of cultivated land along annual average precipitation in Northeast China.
Land 13 01028 g0a6
Figure A7. Trend of SOM content of cultivated land along the slope in SNP.
Land 13 01028 g0a7
Figure A8. Trend of SOM content of cultivated land along the slope in LHP.
Land 13 01028 g0a8
Figure A9. Trends of SOM content along elevation in cultivated land in NSA.
Land 13 01028 g0a9
Figure A10. Trends of SOM content along elevation in cultivated land in GLKM.
Land 13 01028 g0a10
Figure A11. Trends of SOM content along elevation in cultivated land in LHPM.
Land 13 01028 g0a11

References

  1. Allison, F.E. Soil Organic Matter and Its Role in Crop Production; Elsevier: Amsterdam, The Netherlands, 1973. [Google Scholar]
  2. Gurmu, G. Soil organic matter and its role in soil health and crop productivity improvement. For. Ecol. Manag. 2019, 7, 475–483. [Google Scholar]
  3. Lin, Y.; Feng, Z.; Wu, W.; Yang, Y.; Zhou, Y.; Xu, C. Potential impacts of climate change and adaptation on maize in northeast China. Agron. J. 2017, 109, 1476–1490. [Google Scholar] [CrossRef]
  4. Zhang, S.; Zhang, X.; Huffman, T.; Liu, X.; Yang, J. Influence of topography and land management on soil nutrients variability in Northeast China. Nutr. Cycl. Agroecosyst. 2011, 89, 427–438. [Google Scholar] [CrossRef]
  5. Hu, B.; Zhou, Q.; He, C.; Duan, L.; Li, W.; Zhang, G.; Ji, W.; Peng, J.; Xie, H. Spatial variability and potential controls of soil organic matter in the Eastern Dongting Lake Plain in southern China. J. Soils Sediments 2021, 21, 2791–2804. [Google Scholar] [CrossRef]
  6. Tziachris, P.; Aschonitis, V.; Chatzistathis, T.; Papadopoulou, M. Assessment of spatial hybrid methods for predicting soil organic matter using DEM derivatives and soil parameters. Catena 2019, 174, 206–216. [Google Scholar] [CrossRef]
  7. Ghotbi, M.; Taghizadeh-Mehrjardi, R.; Knief, C.; Ghotbi, M.; Kent, A.D.; Horwath, W.R. The patchiness of soil 13C versus the uniformity of 15N distribution with geomorphic position provides evidence of erosion and accelerated organic matter turnover. Agric. Ecosyst. Environ. 2023, 356, 108616. [Google Scholar] [CrossRef]
  8. Musadji, N.Y.; Lemée, L.; Caner, L.; Porel, G.; Poinot, P.; Geffroy-Rodier, C. Spectral characteristics of soil dissolved organic matter: Long-term effects of exogenous organic matter on soil organic matter and spatial-temporal changes. Chemosphere 2020, 240, 124808. [Google Scholar] [CrossRef] [PubMed]
  9. Gómez, J.A.; Guzmán, G.; Vanwalleghem, T.; Vanderlinden, K. Spatial variability of soil organic carbon stock in an olive orchard at catchment scale in Southern Spain. Int. Soil Water Conserv. Res. 2023, 11, 311–326. [Google Scholar] [CrossRef]
  10. Shi, P.; Six, J.; Sila, A.; Vanlauwe, B.; Van Oost, K. Towards spatially continuous mapping of soil organic carbon in croplands using multitemporal Sentinel-2 remote sensing. ISPRS J. Photogramm. Remote Sens. 2022, 193, 187–199. [Google Scholar] [CrossRef]
  11. Wu, C.; Yang, H.; Zheng, Y.; Wu, Z.; Yang, Y. Study on zoning of livestock carrying potential based on spatial distribution of soil organic matter on the Bashang Plateau of northern China. Soil Tillage Res. 2022, 218, 105319. [Google Scholar] [CrossRef]
  12. Kohl, L.; Philben, M.; Edwards, K.A.; Podrebarac, F.A.; Warren, J.; Ziegler, S.E. The origin of soil organic matter controls its composition and bioreactivity across a mesic boreal forest latitudinal gradient. Glob. Chang. Biol. 2018, 24, e458–e473. [Google Scholar] [CrossRef]
  13. Lützow, M.v.; Kögel-Knabner, I.; Ekschmitt, K.; Matzner, E.; Guggenberger, G.; Marschner, B.; Flessa, H. Stabilization of organic matter in temperate soils: Mechanisms and their relevance under different soil conditions—A review. Eur. J. Soil Sci. 2006, 57, 426–445. [Google Scholar] [CrossRef]
  14. Jiménez-González, M.A.; Álvarez, A.M.; Carral, P.; Almendros, G. Influence of soil forming factors on the molecular structure of soil organic matter and carbon levels. Catena 2020, 189, 104501. [Google Scholar] [CrossRef]
  15. Marchetti, A.; Piccini, C.; Francaviglia, R.; Mabit, L. Spatial distribution of soil organic matter using geostatistics: A key indicator to assess soil degradation status in central Italy. Pedosphere 2012, 22, 230–242. [Google Scholar] [CrossRef]
  16. Du, Z.; Gao, B.; Ou, C.; Du, Z.; Yang, J.; Batsaikhan, B.; Dorjgotov, B.; Yun, W.; Zhu, D. A quantitative analysis of factors influencing organic matter concentration in the topsoil of black soil in northeast China based on spatial heterogeneous patterns. ISPRS Int. J. Geo-Inf. 2021, 10, 348. [Google Scholar] [CrossRef]
  17. Dad, J.M.; Shafiq, M.u. Spatial distribution of soil organic carbon in apple orchard soils of Kashmir Himalaya, India. Carbon Manag. 2021, 12, 485–498. [Google Scholar] [CrossRef]
  18. Zhang, H.; Liu, W.; Hu, Q.; Huang, X. Multi-Scale Integration and Distribution of Soil Organic Matter Spatial Variation in a Coal–Grain Compound Area. Sustainability 2023, 15, 3780. [Google Scholar] [CrossRef]
  19. Zeng, C.; Yang, L.; Zhu, A.-X.; Rossiter, D.G.; Liu, J.; Liu, J.; Qin, C.; Wang, D. Mapping soil organic matter concentration at different scales using a mixed geographically weighted regression method. Geoderma 2016, 281, 69–82. [Google Scholar] [CrossRef]
  20. Lu, M.-y.; Liu, Y.; Liu, G.-j. Precise prediction of soil organic matter in soils planted with a variety of crops through hybrid methods. Comput. Electron. Agric. 2022, 200, 107246. [Google Scholar] [CrossRef]
  21. Shrestha, A.; Luo, W. Analysis of groundwater nitrate contamination in the Central Valley: Comparison of the geodetector method, principal component analysis and geographically weighted regression. ISPRS Int. J. Geo-Inf. 2017, 6, 297. [Google Scholar] [CrossRef]
  22. Su, Y.; Li, T.; Cheng, S.; Wang, X. Spatial distribution exploration and driving factor identification for soil salinisation based on geodetector models in coastal area. Ecol. Eng. 2020, 156, 105961. [Google Scholar] [CrossRef]
  23. Luo, C.; Zhang, W.; Zhang, X.; Liu, H. Mapping soil organic matter content using Sentinel-2 synthetic images at different time intervals in Northeast China. Int. J. Digit. Earth 2023, 16, 1094–1107. [Google Scholar] [CrossRef]
  24. Zhao, X.; Zhang, Z.; Zhao, M.; Song, X.; Liu, X.; Zhang, X. The Quantified and Major Influencing Factors on Spatial Distribution of Soil Organic Matter in Provincial-Scale Farmland&mdash;A Case Study of Shandong Province in Eastern China. Appl. Sci. 2023, 13, 3738. [Google Scholar] [CrossRef]
  25. Wang, J.F.; Li, X.H.; Christakos, G.; Liao, Y.L.; Zhang, T.; Gu, X.; Zheng, X.Y. Geographical detectors-based health risk assessment and its application in the neural tube defects study of the Heshun Region, China. Int. J. Geogr. Inf. Sci. 2010, 24, 107–127. [Google Scholar] [CrossRef]
  26. Piccini, C.; Marchetti, A.; Francaviglia, R. Estimation of soil organic matter by geostatistical methods: Use of auxiliary information in agricultural and environmental assessment. Ecol. Indic. 2014, 36, 301–314. [Google Scholar] [CrossRef]
  27. Duveiller, G.; Defourny, P. A conceptual framework to define the spatial resolution requirements for agricultural monitoring using remote sensing. Remote Sens. Environ. 2010, 114, 2637–2650. [Google Scholar] [CrossRef]
  28. Somantri, L. Land Use: One of Essential Geography Concept Based on Remote Sensing Technology. In IOP Conference Series: Earth and Environmental Science; IOP Publishing: Bristol, UK, 2018. [Google Scholar]
  29. Guo, L.; Sun, X.; Fu, P.; Shi, T.; Dang, L.; Chen, Y.; Linderman, M.; Zhang, G.; Zhang, Y.; Jiang, Q. Mapping soil organic carbon stock by hyperspectral and time-series multispectral remote sensing images in low-relief agricultural areas. Geoderma 2021, 398, 115118. [Google Scholar] [CrossRef]
  30. Congalton, R.G. Remote sensing and geographic information system data integration: Error sources and research issues. Photogramm. Eng. Remote Sens. 1991, 57, 677–687. [Google Scholar]
  31. Chen, B.; Huang, B.; Xu, B. Multi-source remotely sensed data fusion for improving land cover classification. ISPRS J. Photogramm. Remote Sens. 2017, 124, 27–39. [Google Scholar] [CrossRef]
  32. Sharma, S.K.; Aryal, J.; Rajabifard, A. Remote sensing and meteorological data fusion in predicting bushfire severity: A case study from victoria, australia. Remote Sens. 2022, 14, 1645. [Google Scholar] [CrossRef]
  33. Hu, W.; Shen, Q.; Zhai, X.; Du, S.; Zhang, X. Impact of environmental factors on the spatiotemporal variability of soil organic matter: A case study in a typical small Mollisol watershed of Northeast China. J. Soils Sediments 2021, 21, 736–747. [Google Scholar] [CrossRef]
  34. von Lützow, M.; Kögel-Knabner, I. Temperature sensitivity of soil organic matter decomposition—What do we know? Biol. Fertil. Soils 2009, 46, 1–15. [Google Scholar] [CrossRef]
  35. Amelung, W.; Zech, W.; Flach, K. Climatic effects on soil organic matter composition in the Great Plains. Soil Sci. Soc. Am. J. 1997, 61, 115–123. [Google Scholar] [CrossRef]
  36. Lloyd, J.; Taylor, J. On the temperature dependence of soil respiration. Funct. Ecol. 1994, 8, 315–323. [Google Scholar] [CrossRef]
  37. Conant, R.T.; Ryan, M.G.; Ågren, G.I.; Birge, H.E.; Davidson, E.A.; Eliasson, P.E.; Evans, S.E.; Frey, S.D.; Giardina, C.P.; Hopkins, F.M. Temperature and soil organic matter decomposition rates–synthesis of current knowledge and a way forward. Glob. Chang. Biol. 2011, 17, 3392–3404. [Google Scholar] [CrossRef]
  38. Paul, E.A. The nature and dynamics of soil organic matter: Plant inputs, microbial transformations, and organic matter stabilization. Soil Biol. Biochem. 2016, 98, 109–126. [Google Scholar] [CrossRef]
  39. Bardgett, R.D.; Freeman, C.; Ostle, N.J. Microbial contributions to climate change through carbon cycle feedbacks. ISME J. 2008, 2, 805–814. [Google Scholar] [CrossRef]
  40. Navas, A.; Gaspar, L.; Quijano, L.; Lopez-Vicente, M.; Machín, J. Patterns of soil organic carbon and nitrogen in relation to soil movement under different land uses in mountain fields (South Central Pyrenees). Catena 2012, 94, 43–52. [Google Scholar] [CrossRef]
  41. Huynh, C.V.; Nguyen, P.T.; Pham, T.G.; Nguyen, H.T.; Nguyen, M.T.; Tran, P.T. Evaluation of soil organic matter content under topographic influences in agroforestry ecosystems: A study in Central Vietnam. Eurasian Soil Sci. 2022, 55, 1041–1051. [Google Scholar] [CrossRef]
  42. Demelash, M.; Stahr, K. Assessment of integrated soil and water conservation measures on key soil properties in South Gonder, North-Western Highlands of Ethiopia. J. Soil Sci. Environ. Manag. 2010, 1, 164–176. [Google Scholar]
  43. Jobbágy, E.G.; Jackson, R.B. The vertical distribution of soil organic carbon and its relation to climate and vegetation. Ecol. Appl. 2000, 10, 423–436. [Google Scholar] [CrossRef]
  44. Gutiérrez-Girón, A.; Díaz-Pinés, E.; Rubio, A.; Gavilán, R.G. Both altitude and vegetation affect temperature sensitivity of soil organic matter decomposition in Mediterranean high mountain soils. Geoderma 2015, 237, 1–8. [Google Scholar] [CrossRef]
  45. Yang, Q.; Zhang, P.; Ma, Z.; Liu, D.; Guo, Y. Agricultural Economic Resilience in the Context of International Food Price Fluctuation—An Empirical Analysis on the Main Grain–Producing Areas in Northeast China. Sustainability 2022, 14, 14102. [Google Scholar] [CrossRef]
  46. Garrity, D.P. Sustainable land-use systems for sloping uplands in Southeast Asia. Technol. Sustain. Agric. Trop. 1993, 56, 41–66. [Google Scholar]
  47. Liniger, H.P.; Mekdaschi, R.; Moll, P.; Zander, U. Making Sense of Research for Sustainable Land Management; Centre for Development and Environment (CDE), University of Bern and Helmholtz-Centre for Environmental Research GmbH–UFZ: Bern, Switzerland, 2017. [Google Scholar]
  48. Nouari, A. Assessment of Management Strategies to Control Water Erosion: A GIS Based RUSLE Approach. Master’s Thesis, PAUWES, Chetouane, Algeria, 2020. [Google Scholar]
  49. Craswell, E.; Lefroy, R. The role and function of organic matter in tropical soils. In Managing Organic Matter in Tropical Soils: Scope and Limitations: Proceedings of a Workshop Organized by the Center for Development Research at the University of Bonn (ZEF Bonn)—Germany, 7–10 June 1999; Springer: Cham, Switzerland, 1999. [Google Scholar]
Figure 1. Overview of the study area.
Land 13 01028 g001
Figure 2. Raster plot of each influencing factor.
Land 13 01028 g002
Figure 3. Framework of this study.
Land 13 01028 g003
Figure 4. Spatial distribution statistics of SOM content of cultivated land in Northeast China.
Land 13 01028 g004
Figure 5. Spatial distribution statistics of average SOM content of cultivated land on DEM in Northeast China.
Land 13 01028 g005
Figure 6. Spatial distribution statistics of average SOM content in cultivated land over annual average precipitation in Northeast China.
Land 13 01028 g006
Figure 7. Statistics on the spatial distribution of the average SOM content of cultivated land in Northeast China in terms of annual average temperature.
Land 13 01028 g007
Figure 8. Spatial distribution statistics of average SOM content of cultivated land on slope in Northeast China.
Land 13 01028 g008
Figure 9. Strength analysis of the effects of each influencing factor individually (left) and interactively (right) on the spatial distribution of SOM content in cultivated land in Northeast China.
Land 13 01028 g009
Table 1. Internal information of each impact factor.
DataData AgeVariable NameUnit
Terrain factors
DEM2021X1m
SLP2021X2°
Climate factors
PRE2001 to 2020X3mm
TEMP2001 to 2020X4°C
Soil property factors
SOILPH2020X5-
SOILT2021X6-
Policy factors
POL12019X7-
POL22023X8-
Human factors
GDP2001 to 2020X9Ten thousand CNY/km2
POP2001 to 2020X10People/km2
Other factors
RLSF2023X11type
TFC2023X12type
Table 2. Statistical characteristics of SOM content in surface layer of cultivated land in Northeast China.
Geomorphologic RegionAverage Value
(g/kg)
Minimum
Value
(g/kg)
Median
(g/kg)
Maximum Value
(g/kg)
Standard Deviation
(g/kg)
Coefficient of Variation
(%)
Northeast China37.708.6155.03104.9113.8436.71
GLKM49.328.7853.72104.7710.4021.09
LHP28.788.6251.7599.1810.3235.86
SJP44.408.8854.41104.239.3020.95
SNP43.228.6554.19104.9112.6129.18
NSA26.158.6151.60100.2911.7845.05
LHPM38.058.8131.07102.9611.5430.33
Table 3. Measures for different dominant factors.
RegionsDominant
Factors
LevelMeasures
GLKM, LHPM, NSADEMHigh-DEMTerrace-planted
Low-DEMDrainage System Construction
LHP, SNPSlopeHigh-SlopeTerrace-planted
Low-SlopeSWC Engineering
Disclaimer/Publisher’s Note: The statements, opinions and data contained in all publications are solely those of the individual author(s) and contributor(s) and not of MDPI and/or the editor(s). MDPI and/or the editor(s) disclaim responsibility for any injury to people or property resulting from any ideas, methods, instructions or products referred to in the content.

