Abstract
This study examines the non-institutional factors that affect the green building premium (GBP). Residential properties are chosen for empirical analysis since they are free from institutional factors such as corporate social responsibility (CSR). The study adopts both Mahalanobis Distance Matching (MDM) and Propensity Score Matching (PSM) to identify the treatment observations (buildings with a green building certificate) and the control observations (non-green buildings). The results are robust across the two methods. The study found that residential buildings with green certificates command a premium and that this premium does not decline over time, which suggests that consumers are willing to pay a GPB in the absence of institutional mandatory requirements. Furthermore, the GBP is higher but with a slower growth rate in higher-income areas, which is consistent with the post-materialist value theory and the prosperity or affluence hypothesis.
1. Introduction
Information asymmetry occurs when one party of a transaction possesses more information about the quality of the goods or services being transacted [1]. Building is a form of experiential good, the quality of which cannot be fully observed before consumption [2]. Sellers possess more information on certain attributes of their properties than potential buyers or tenants do [3,4,5,6]. If consumers are uncertain about the value of properties, they are less willing to pay for them. Information asymmetry deters mutually beneficial transactions in the green building market. Green building certification (GBC) is an attempt to solve the information asymmetry problem in the real estate market by signaling the greenness of a building so that buyers can make more informed decisions and thus improve the sustainability of the built environment [7]. A credible third-party GBC should also facilitate policymakers in formulating policies to promote green buildings and create a sustainable living environment in the long run.
Much previous research has already confirmed that tenants pay a rental or price premium for buildings with GBC. Most of these studies focus on assessing the magnitude of the green building premium (GBP) of office buildings [8,9,10,11]. The rental premium for office buildings in the US with an LEED label is approximately 7%, and the selling price premium is around 9.9% [9,11]. The office GBP can be partly explained by institutional factors such as the CSR policy of some companies, which prohibits them from renting non-green buildings. This CSR restriction limits these companies’ choice of offices to a subset of the total supply. As a result, they often end up paying a higher rent (GBP).
The inclusion of environmental consciousness and value in CSR has been a trend for large corporations [12,13]. Developers who have obtained GBC for their developments may also increase the marketability of their properties and improve their corporate image and reputation [14] and competitiveness [15]. In addition, some studies suggest that CSR is not purely for image building; it does have tangible financial implications. Ref. [16] suggests that companies with superior CSR performance are associated with lower capital costs. [17] further find that the relationship is not linear.
In addition to institutional factors such as CSR, non-institutional factors may have also contributed to the GBP. Previous studies show that the GBP exists in residential buildings that are free from CSR restrictions. In Singapore, a study on Green Mark-certified residential properties shows approximately 10% GBP in resale prices [18]. In Hong Kong, the GBP is approximately 3.4–6.4% for residential properties in the New Territories and Hong Kong Island [15]. Another study with more recent data shows a 4.4% GBP for residential properties in Kowloon [19]. The GBP estimate in the Hong Kong residential market is similar to that in Tokyo, which is estimated to be 4.7% [7].
Compared to the growing body of literature on measuring the magnitude of the green building premium (GBP), an even more important research question is the sources of such premium. Tangible benefits due to improved energy efficiency might be a quick answer because it is one of the defining features of green buildings. An empirical study by [20] suggests that LEED-certified facilities could achieve an average energy saving of approximately 34% compared to similar non-LEED facilities. However, the sources of the GBP are far more complex than a simple cost-saving analysis of energy efficiency. First, several studies are skeptical about the credibility of green building certification (GBC) in signaling the energy performance of a building. Refs. [21,22] found that GBC overstated the energy efficiency of buildings, with insignificant energy and running cost savings in LEED-certified office buildings in the US market. Similar findings were observed in residential properties in self-certified green buildings in China, where the GBP declined over time as buyers discovered the real performance of the properties they purchased. These studies suggested the possibility that the GBP could be a result of developers’ marketing strategy as its magnitude declined over time. Therefore, longitudinal studies of the GBP are important in determining the role of tangible benefits as a source of the GBP and whether the corresponding GBC can solve the information asymmetry problem. However, there have been very few longitudinal studies on GBP to date.
In addition to tangible factors, intangible factors may also contribute to GBP. Climate change and other environmental concerns, although long-term issues for humanity, are considered imminent issues by many environmentally conscious people. Some consumers might believe that living in green buildings is a social status and a gesture to show that they have spent money for the wellness of mankind. Since wealthier individuals are financially more capable of making financial sacrifices and are usually more highly educated and better informed about long-term environmental issues, they are likely to be more environmentally conscious. This aligns with the post-materialist theory and the prosperity [23,24,25] or prosperity/affluence hypothesis [26,27]. The implication is that financially better-off people are more willing to pay a GBP.
In this paper, the GBP is evaluated by comparing the second-hand transaction prices of similar housing units with and without GBC. This is conducted by matching green buildings (those with GBC) with similar non-green buildings (those without GBC). The researchers use both Propensity Score Matching (PSM) and Mahalanobis Distance Matching (MDM) methods [28] to select pairs of similar green (treatment group) and non-green (control group) buildings to estimate hedonic price models.
The study found that green residential buildings commanded a positive GBP, and the GBP increased over time. This result suggests that GBC in Hong Kong (i.e., HK-BEAM/HK-BEAM plus) is unlikely to be a pure marketing tool, and buyers of green buildings enjoy tangible or intangible benefits. As consumers accumulate experience with the tangible benefits of green buildings, they become more willing to pay for the GBP, which may explain the uptrend of the GBP over time. The study further found that the GBP is positively correlated with household income. The GBP is higher in higher-income areas, which is consistent with the post-materialist value theory and affluence hypothesis. This is further confirmed by a faster-growing rate of the GBP in lower-income areas due to buyers’ accumulation of experience, with tangible benefits over time. However, such a learning process does not apply to the intangible benefits (environmental awareness and social status) enjoyed by higher-income households. Therefore, the gap between GBPs in high-income and low-income areas narrows over time.
This paper has important implications. Despite the significant size of the total stock of residential buildings, there have been very few empirical studies on green residential buildings compared to those on commercial buildings. In Hong Kong, the total floor area of residential buildings constitutes approximately 80% of the total floor area of all types of buildings. The health, safety, and hygiene conditions of residential buildings in Hong Kong have attracted the attention of many researchers [29,30,31,32,33,34]. “Small improvements in the sustainability of buildings can have large effects on greenhouse gas emissions and energy efficiency in the economy” [9] due to the sheer size of the total building stock. Therefore, research about green residential buildings in the market has significant practical and policy implications. Furthermore, although there is empirical support for the affluence hypothesis at the macro level [26,27,35,36,37,38,39,40,41], whether the hypothesis applies to a lower level of aggregation is unclear. This study provides empirical support for the post-materialist value theory and affluence hypothesis at the micro level without relying on survey data.
2. Sources of Green Building Premium
Despite the large body of literature on the existence of the green building premium (GBP), only a few empirical studies have attempted to investigate its sources. These studies can be categorized according to the sources of the GBP, as shown in Figure 1.
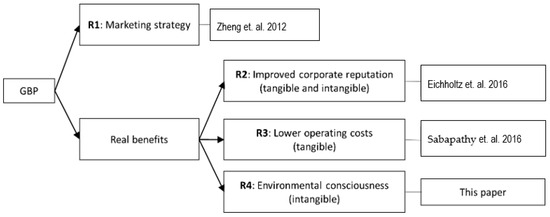
Figure 1.
Sources of green building premium [9,20,42].
GBC contributes to alleviating information asymmetry issues only when it is credible. In many developing countries, credible third-party GBCs were established only recently. Before that, many developers tried to differentiate their buildings from others by actively advertising the greenness of their buildings through self-reported “green certificates”. Ref. [42] find that these certificates help developers presell housing units at a premium, but these housing units would subsequently be resold or rented at a discount. A decreasing trend of the GBP suggests that self-reported certificates are likely to be a marketing tool, which we refer to as the first source of the GBP (R1). Once purchasers realized that GBC overstated the greenness of the building, the GBP would decline or even disappear. The empirical study of [43] on the “Chinese Green Building Label” suggested that after the introduction of official third-party GBC, the developers’ self-reported GBC had little effect on the prices of the “green buildings”.
Not only are the developers’ self-reported green building certificates (GBCs) questioned, but the credibility and reliability of third-party GBCs are also subject to scrutiny by researchers. Several studies have found a gap between the predicted and actual energy efficiency of LEED-certified commercial and industrial buildings in the US [21,44,45,46]. However, it has been reported that the lack of efficient operation and maintenance is often the main reason for this performance gap [44]. It is also possible that this gap may stem from the energy-saving systems being too advanced so that the operators may not be able to fully realize its energy-saving potential [20]. Ref. [20] found that if factors related to occupancy, operation, and maintenance were properly controlled, LEED-certified buildings could achieve approximately 34% energy savings compared to non-certified buildings. If the energy-saving potential of green features can be realized (R3 in Table 1), it is reasonable for buyers to pay a GBP.

Table 1.
Key statistics of second-hand transaction of units in green and non-green buildings.
The GBP may also arise as a result of increased resource input from developers in producing green buildings. One main motivation for developers to spend resources and time to obtain GBCs for their building is to enhance the reputation the company (R2 in Table 1) which may have long term tangible benefits for company. In the short run, there are also potential supply side motivations to develop green buildings such as access to green financing and lower capital costs [16] and government subsidies that promotes green buildings (such an increase in construction floor areas beyond that allowed by the maximum plot ratio in Hong Kong). However, whether these supply side motivations can eventually result in a GBP is unclear.
As of today, there are very few empirical studies that have investigated whether purchasers and occupants of green building units would pay a GBP due to their environmental awareness, which is an intangible benefit (R4 in Table 1). In addition to tangible benefits during the operational phase, green buildings also generate significant positive environmental externalities throughout their life cycle [47]. Buildings with GBCs are constructed using greener methods that result in lower wastage and a smaller carbon footprint, which are social goods [48,49,50]. However, it remains unclear how much consumers of green buildings value such social goods as they do not provide tangible benefits. This research paper aims to address this research question.
3. Identification Strategy and Hypotheses
We conducted a study on the performance of HK-BEAM- and HK-BEAM Plus-rated residential buildings in Hong Kong over a relatively long period. We excluded transactions in the first-hand market since they are typically forward sales based on developers’ listed prices, which involve non-price competition elements and are not considered market prices [51]. By focusing on the residential sector, we aimed to eliminate institutional factors related to corporate social responsibility (CSR). In the office market, the existence of a green building premium (GBP) could be attributed to constraints imposed by CSR. Many companies have CSR policies that prohibit them from renting non-green offices. However, CSR is not a concern for purchasers of residential housing units.
The primary GBC adopted in Hong Kong is the Hong Kong building environmental assessment method (HK-BEAM), along with its revised version, HK-BEAM Plus. The history of the HK-BEAM dates back to December 1996 when it was first launched by the Real Estate Developers Association of Hong Kong (REDA). On the other hand, BEAM Plus, a revised version of the HK-BEAM, was introduced in November 2009. The assessment scheme of the HK-BEAM is largely based on the United Kingdom’s Building Research Establishment’s BREEAM. The overall score of HK-BEAM is a compilation of greenness assessment scores for different aspects of the building, including site accessibility, construction management and materials, indoor air and acoustic quality, waste reduction, water and electricity usage, maintenance and so on. The assessment criteria indicate that HK-BEAM-rated buildings should not only have lower operating costs but also employ green construction methods.
If a positive GBP is found in the second-hand transactions of green buildings, going green is not likely to be a pure marketing tool for developers but generates real tangible benefits such as energy savings or long-term environmental benefits as a result of environmental consciousness. This leads to the first hypothesis.
H1:
Green residential units command a positive GBP, ceteris paribus.
Here, green residential units refer to the units in a residential building with an HK-BEAM or HK-BEAM plus certificate. However, confirmation of H1 cannot indicate whether the GBP is due to the developer’s marketing strategy (R1 in Table 1) or real tangible or intangible benefits to the consumer (R3 and R4 in Table 1). If the observed GBP is not due to real tangible or intangible benefits signaled by the corresponding GBC, the GBP will diminish or even disappear over time. We conjecture that the GBP is due to real tangible or intangible benefits which leads to the second hypothesis:
H2:
The GBP does not decrease over time, ceteris paribus.
If H1 and H2 are confirmed, we will further investigate whether the GBP is a result of R3 or R4 or both (Table 1). A rational buyer is willing to pay for immediate financial gain due to R3 (Table 1). However, whether the buyer is also willing to pay for the intangible benefits due to R4 (Table 1) is uncertain. We rely on the post-materialist value theory and affluence hypothesis, which suggest that higher-income individuals are more environmentally conscious and are more likely to pay a GBP even if the green building does not provide them with any tangible benefits. Therefore, we conjecture that higher-income buyers are more willing to pay for the GBP. This leads to the third hypothesis.
H3:
The GBP is larger in high-income areas, ceteris paribus.
H3 is derived from the post-materialist value theory and affluence hypothesis in the context of Hong Kong’s green residential market. If H3 is confirmed, the provision of social goods by consuming green buildings is an intangible factor that contributes to the GBP. While low-income purchasers are more concerned about the tangible benefit of energy savings, high-income purchasers also pay attention to the intangible benefits. This will lead to a differential growth rate of the GBP in low- and high-income areas. This is because the HK-BEAM is a local scheme, and no prior knowledge about its reliability was readily available when it was first introduced. Low-income purchasers may hesitate to pay a premium for green buildings in the early years. Only when a tangible benefit, such as energy savings, is confirmed over time, will they become more willing to pay the GBP. This results in an upward time trend of the GBP.
On the other hand, this temporal pattern is likely to be weaker for financially better-off purchasers for two reasons. First, based on the conspicuous conservation theory proposed by [52], wealthy people may seek status through displays of austerity amid growing concern about environmental protection, irrespective of the actual energy performance of the building. Such intangible benefits do not need to be supported by real energy-efficient performance. Second, the HK-BEAM/HK-BEAM plus also assesses the greenness of the construction of the building, which may not be related to its energy saving performance during the occupancy stage. This leads to the fourth hypothesis:
H4:
The GBPs in low-income areas grows faster than those in high-income areas, ceteris paribus.
4. Empirical Tests, Results and Discussion
4.1. Construction of Datasets
Estimating the GBP based on a direct comparison of the transaction prices of green and nearby non-green housing units may be misleading. Green and non-green residential buildings have different price-influencing attributes that are not related to greenness. These differences could also be responsible for the differences in transaction prices between HK-BEAM-rated buildings (the treatment group) and non-green buildings (the control group). Without considering these factors, the estimation of the GBP is biased. Therefore, we adopt two different methods to match green buildings with “similar” non-green buildings, ensuring that the control and treatment groups are comparable. Prior to the matching process, we exclude subsidized housing units because their transaction prices are market prices. We also exclude low-rise green housing, such as villas as there are too few similar non-green housing units that can serve as control samples.
The first method is to construct the control group by using Propensity Score Matching (PSM) procedures. Non-green buildings are weighted based on propensity scores that indicate the probability that they are identical to the buildings in the treatment group in terms of a set of covariates:
Equation (1) shows the PSM equation with four covariates, i.e., the number of units in the buildings (NUM), the average size, in term of salable floor area, of the units in the building (SIZE), the completion year of the building (COM), and whether the building occupiers have access to clubhouse facilities (CLUBHOUSE). We then match each green building with the non-green building that has the most similar propensity score, i.e., the “nearest one-to-one neighbor matching” criterion. We further improve the matching accuracy by limiting the non-green buildings (control) to be within one kilometer of the green building (treatment). In addition, non-green buildings that are completed before 1999 or after 2012 are not used as control samples so that the treatment group and the control group are built within similar periods. Based on this approach, our dataset has 99 green buildings in the treatment group (with 17,768 transactions) and 122 non-green buildings in the control group (with 18,837 transactions). Some green buildings are dropped because there are no suitable non-green buildings that meet the matching requirements. The size of the control sample is larger than that of the treatment sample because multiple non-green buildings may have the same propensity score (mainly the buildings within the same development).
The second approach is based on Mahalanobis Distance Matching (MDM). King and Nielsen (2019) [53] argue that PSM should not be used for matching since this approach increases imbalance, inefficiency, and model dependence. They suggest that MDM should be used instead. Another advantage of the MDM method is that no PSM model needs to be estimated. However, the MDM method may not be suitable for clustered data [54]. The MDM method identifies the matching observations from the control sample with the shortest Mahalanobis (1936) distance [28] from the treated observations, which is defined as a dissimilarity measure between two random vectors , from the same distribution with covariance matrix S, i.e.,
We use the same four covariables for estimating the propensity scores under the PSM to calculate the Mahalanobis distance between each green building and non-green buildings. We then match each green building with the non-green building that has the smallest Mahalanobis distance to the green building. The process is similar to PSM but the similarity indicator used here is Mahalanobis distance rather than the propensity score. Other additional matching criteria used in the PSM approach also apply. The MDM identifies 17,779 (15,346) second-hand transactions in 100 (116) green (non-green) buildings that can be used in the empirical tests.
Table 1 shows the key statistics of the second-hand transactions in the treatment and control group using the two different matching approaches.
4.2. Testing Hypothesis 1 and 2
We estimated the following hedonic price model to test Hypothesis 1.
The dependent variable denotes the natural log of the transaction price. The key variable of interest is GREEN, which is a dummy variable for HK-BEAM-certified residential buildings. X denotes an array of control variables including salable floor area (SFA), floor level (FL), building age on the transaction date (AGE), whether there is clubhouse in the development (CLUBHOUSE), whether the walking distance from the building to the nearest MTR exit is within 15 min (MTR), monthly household income (INCOME), the median of population age (MEDIAN_AGE), and the number of males per 1000 females (SEX_RATIO). Data for the Control variables INCOME, MEDIAN_AGE, and SEX_RATIO are obtained from the 2016 Population By-Census released by the Census and Statistics Department of Hong Kong. Dm and Tn are location and time dummies, subscript m denotes district m, subscript n denotes transaction time n, and is the error term.
The observed GBP should not decline over time if it is due to real tangible benefits (R3 in Table 1) and/or intangible benefits (R4 in Table 1). Thus, we also estimate the following equation to test Hypothesis 2. The interaction term between GREEN and the transaction year since 2003 (YEAR − 2003) is added:
Table 2 reports the results based on two different methods of matching green and non-green buildings. The results with the two matching methods are very similar. is positive and significant at the 1% level for both matching methods; therefore, Hypothesis 1 is confirmed.
Table 2.
Green building price premium over time.
Also, the GBP is increasing over time since is positive and significant at the 1% level using both matching methods. Therefore, Hypothesis 2 is confirmed. That is, the GBP can be sustained over a relatively long period, which suggests that purchasers of green buildings enjoy real tangible or intangible benefits. This result indicates that the HK-BEAM/HK-BEAM plus is an effective green building certificate that can signal the greenness of the housing units to buyers.
4.3. Testing of Hypothesis 3 and 4
We estimate the following hedonic price model to test Hypothesis 3:
HI is a dummy variable for the buildings located in high-income areas which are defined as areas with average household incomes that are above the territory-wide median level (HI = 1). Hypothesis 3 implies that is positive and significant.
To test Hypothesis 4, we need to examine the difference in the growth rate of the GBP in high- and low-income areas. This is achieved by interacting HI with the time trend variable, which is the number of years since 2003 (YEAR − 2003) as shown in Equation (6). Hypothesis 4 implies that is negative and significant. The results are presented in Table 3.
Table 3.
Green building price premium by income groups over time.
Consistent with Hypothesis 3, the GBP in relatively higher-income areas is larger as α2 is positive and significant. Thus, part of the GBP is likely to be a result of the buyers’ environmental consciousness. In other words, the GBP is not just a result of tangible benefits (savings in energy and running costs, etc.) only. The results also show that the GBP grows at a slower rate in high-income areas (α5 is negative and significant), which is consistent with Hypothesis 4. The empirical evidence of testing Hypotheses 3 and 4 lends support to the post-materialist value theory and affluence hypothesis.
5. Conclusions
The empirical evidence presented in this paper demonstrates that green buildings provide both tangible and intangible benefits to consumers. Building buyers are willing to pay a premium for green building features, even without institutional constraints such as corporate social responsibility (CSR). Higher-income individuals, in particular, show a greater willingness to pay for green building features due to their higher environmental awareness, as predicted by the post-materialist value theory and affluence hypothesis.
The study also found that the willingness to pay for green building features is not declining over time, indicating that the premium is justified by real tangible and/or intangible benefits. Furthermore, the growth rate of the green building premium (GBP) in high-income areas is lower than that in low-income areas, providing further support for the post-materialist value theory and affluence hypothesis.
The time trend of the GBP is important for various stakeholders, including users, developers, and policymakers. For users, a non-declining GBP over time indicates that GBC is not merely a marketing tool used by developers. For developers, understanding the spatial and temporal trend of the GBP can assist in making development and investment decisions related to green buildings. For policymakers, an increasing GBP trend suggests that GBC is reliable and worth promoting.
Author Contributions
Conceptualization, K.W.C.; methodology, K.W.C. and D.D.H.; software, D.D.H.; validation, K.W.C., D.D.H. and E.L.; formal analysis, K.W.C., D.D.H. and E.L.; investigation, K.W.C., D.D.H. and E.L.; resources, K.W.C.; data curation, K.W.C. and D.D.H.; writing—original draft preparation, K.W.C. and D.D.H.; writing—K.W.C. and E.L.; review and editing, K.W.C. and E.L.; visualization, K.W.C. and E.L.; supervision, K.W.C.; project administration, K.W.C.; funding acquisition, K.W.C. All authors have read and agreed to the published version of the manuscript.
Funding
This research was funded by the GRF of the Research Grant Council of the Hong Kong Special Administrative Region (Project Reference Number: 17625322).
Data Availability Statement
Data is contained within the article.
Acknowledgments
The authors gratefully acknowledge the financial support provided by the GRF of the Research Grant Council of the Hong Kong Special Administrative Region (Project Reference Number: 17625322). An earlier version of the paper was presented at the 2023 AsRES-GCREC Joint International Real Estate Conference, 13–16 July 2023, Hong Kong. The authors would like to thank the participants at the conference for their valuable comments.
Conflicts of Interest
The authors declare no conflict of interest.
References
- Akerlof, G.A. The Market for “Lemons”: Quality Uncertainty and the Market Mechanism. Q. J. Econ. 1970, 84, 488–500. [Google Scholar] [CrossRef]
- Matisoff, D.C.; Noonan, D.S.; Flowers, M.E. Policy Monitor—Green Buildings: Economics and Policies. Rev. Environ. Econ. Policy 2016, 10, 329–346. [Google Scholar] [CrossRef]
- Chau, K.W.; Choy, L.H.T. Let the Buyer or Seller Beware: Measuring Lemons in the Housing Market under Different Doctrines of Law Governing Transactions and Information. J. Law Econ. 2011, 54, S347–S365. [Google Scholar] [CrossRef][Green Version]
- Wong, S.K.; Yiu, C.Y.; Chau, K.W. Liquidity and information asymmetry in the real estate market. J. Real Estate Financ. Econ. 2012, 45, 49–62. [Google Scholar] [CrossRef]
- Yang, L.; Chau, K.; Chen, Y. Impacts of information asymmetry and policy shock on rental and vacancy dynamics in retail property markets. Habitat Int. 2021, 111, 102359. [Google Scholar] [CrossRef]
- Li, L.; Chau, K.W. Information Asymmetry with Heterogeneous Buyers and Sellers in the Housing Market. J. Real Estate Financ. Econ. 2024, 68, 138–159. [Google Scholar] [CrossRef]
- Shimizu, C. Sustainable Measures and Economic Value in Green Housing. Open House Int. 2013, 38, 57–63. [Google Scholar] [CrossRef]
- Brolinson, B.; Palmer, K.; Walls, M. Does Energy Star Certification Reduce Energy Use in Commercial Buildings? J. Assoc. Environ. Resour. Econ. 2023, 10, 55–93. [Google Scholar] [CrossRef]
- Eichholtz, P.; Kok, N.; Quigley, J.M. The Economics of Green Building. Rev. Econ. Stat. 2013, 95, 50–63. [Google Scholar] [CrossRef]
- Fuerst, F.; Gabrieli, T.; McAllister, P. A green winner’s curse? Investor behavior in the market for eco-certified office buildings. Econ. Model. 2017, 61, 137–146. [Google Scholar] [CrossRef][Green Version]
- Miller, N.; Spivey, J.; Florance, A. Does Green Pay Off? J. Real Estate Portf. Manag. 2008, 14, 385–400. [Google Scholar] [CrossRef]
- Gou, Z.; Prasad, D.; Lau, S.S.Y. Are green buildings more satisfactory and comfortable? Habitat Int. 2013, 39, 156–161. [Google Scholar] [CrossRef]
- Banerjee, S.; Homroy, S.; Slechten, A. Stakeholder preference and strategic corporate social responsibility. J. Corp. Finance 2022, 77, 102286. [Google Scholar] [CrossRef]
- Olubunmi, O.A.; Xia, P.B.; Skitmore, M. Green building incentives: A review. Renew. Sustain. Energy Rev. 2016, 59, 1611–1621. [Google Scholar] [CrossRef]
- Jayantha, W.M.; Man, W.S. Effect of green labelling on residential property price: A case study in Hong Kong. J. Facil. Manag. 2013, 11, 31–51. [Google Scholar] [CrossRef]
- El Ghoul, S.; Guedhami, O.; Kwok, C.C.; Mishra, D.R. Does corporate social responsibility affect the cost of capital? J. Bank. Financ. 2011, 35, 2388–2406. [Google Scholar] [CrossRef]
- Wang, H.; Lu, W.; Ye, M.; Chau, K.; Zhang, X. The curvilinear relationship between corporate social performance and corporate financial performance: Evidence from the international construction industry. J. Clean. Prod. 2016, 137, 1313–1322. [Google Scholar] [CrossRef]
- Deng, Y.; Wu, J. Economic returns to residential green building investment: The developers’ perspective. Reg. Sci. Urban Econ. 2014, 47, 35–44. [Google Scholar] [CrossRef]
- Hui, E.C.M.; Tse, C.-K.; Yu, K.-H. The effect of BEAM Plus certification on property price in Hong Kong. Int. J. Strat Prop. Manag. 2017, 21, 384–400. [Google Scholar] [CrossRef]
- Sabapathy, A.; Ragavan, S.K.; Vijendra, M.; Nataraja, A.G. Energy efficiency benchmarks and the performance of LEED rated buildings for Information Technology facilities in Bangalore, India. Energy Build. 2010, 42, 2206–2212. [Google Scholar] [CrossRef]
- Scofield, J.H. Do LEED-certified buildings save energy? Not really…. Energy Build. 2009, 41, 1386–1390. [Google Scholar] [CrossRef]
- Scofield, J.H. Efficacy of LEED-certification in reducing energy consumption and greenhouse gas emission for large New York City office buildings. Energy Build. 2013, 67, 517–524. [Google Scholar] [CrossRef]
- Inglehart, R. Public support for environmental protection: Objective problems and subjective values in 43 societies. PS Political Sci. Politics 1995, 28, 57–72. [Google Scholar] [CrossRef]
- Inglehart, R.; Baker, W.E. Modernization, cultural change, and the persistence of traditional values. Am. Socio-Log. Rev. 2000, 65, 19–51. [Google Scholar] [CrossRef]
- Wright, J.D.; Inglehart, R. Culture Shift in Advanced Industrial Society; Princeton University Press: Princeton, NJ, USA, 2018. [Google Scholar] [CrossRef]
- Diekmann, A.; Franzen, A. The Wealth of Nations and Environmental Concern. Environ. Behav. 1999, 31, 540–549. [Google Scholar] [CrossRef]
- Drori, I.; Yuchtman-Yaar, E. Environmental Vulnerability in Public Perceptions and Attitudes: The Case of Israel’s Urban Centers. Soc. Sci. Q. 2002, 83, 53–63. [Google Scholar] [CrossRef]
- Mahalanobis, P.C. On the generalized distance in statistics. Indian J. Stat. Ser. A 1936, 80, S1–S7. [Google Scholar]
- Ho, D.C.W.; Chau, K.W.; Cheung, A.K.C.; Yau, Y.; Wong, S.K.; Leung, H.F.; Lau, S.S.Y.; Wong, W.S. A survey of the health and safety conditions of apartment buildings in Hong Kong. Build. Environ. 2008, 43, 764–775. [Google Scholar] [CrossRef]
- Ho, D.; Leung, H.; Wong, S.; Cheung, A.; Lau, S.; Wong, W.; Lung, D.; Chau, K. Assessing the health and hygiene performance of apartment buildings. Facilities 2004, 22, 58–69. [Google Scholar] [CrossRef]
- Qian, Q.K.; Fan, K.; Chan, E.H.W. Regulatory incentives for green buildings: Gross floor area concessions. Build. Res. Inf. 2016, 44, 675–693. [Google Scholar] [CrossRef]
- Wong, S.K.; Lai, L.W.C.; Ho, D.C.W.; Chau, K.W.; Lam, C.L.K.; Ng, C.H.F. Sick building syndrome and perceived indoor environmental quality: A survey of apartment buildings in Hong Kong. Habitat Int. 2009, 33, 463–471. [Google Scholar] [CrossRef] [PubMed]
- Wong, S.; Cheung, A.; Yau, Y.; Ho, D.; Chau, K. Are our residential buildings healthy and safe? A survey in Hong Kong. Struct. Surv. 2006, 24, 77–86. [Google Scholar] [CrossRef]
- Yau, Y.; Ho, D.C.W.; Chau, K.W. Determinants of the Safety Performance of Private Multi-storey Residential Buildings in Hong Kong. Soc. Indic. Res. 2008, 89, 501–521. [Google Scholar] [CrossRef]
- Franzen, A.; Meyer, R. Environmental Attitudes in Cross-National Perspective: A Multilevel Analysis of the ISSP 1993 and 2000. Eur. Sociol. Rev. 2010, 26, 219–234. [Google Scholar] [CrossRef]
- Gelissen, J. Explaining Popular Support for Environmental Protection: A Multilevel Analysis of 50 Nations. Environ. Behav. 2007, 39, 392–415. [Google Scholar] [CrossRef]
- Lin, Y.C.; Chang, C.C.A. Double Standard: The Role of Environmental Consciousness in Green Product Usage. J. Mark. 2012, 76, 125–134. [Google Scholar] [CrossRef]
- Nawrotzki, R.J.; Guedes, G.; Carmo, R.L. Affluence and objective environmental conditions: Evidence of differences in environmental concern in metropolitan Brazil. J. Sustain. Dev. 2014, 7, 173–193. [Google Scholar] [CrossRef] [PubMed]
- Ritter, Á.M.; Borchardt, M.; Vaccaro, G.L.R.; Pereira, G.M.; Almeida, F. Motivations for promoting the consumption of green products in an emerging country: Exploring attitudes of Brazilian consumers. J. Clean. Prod. 2015, 106, 507–520. [Google Scholar] [CrossRef]
- Roberts, A.; Mangold, S. The inequality trap & willingness-to-pay for environmental protections: The contextual effect of income inequality on affluence & trust. Sociol. Q. 2023, 64, 91–122. [Google Scholar] [CrossRef]
- Zou, G.; Chau, K.W. Energy consumption, economic growth and environmental sustainability: Evidence from China. Energy Rep. 2023, 9, 106–116. [Google Scholar] [CrossRef]
- Zheng, S.; Wu, J.; Kahn, M.E.; Deng, Y. The nascent market for “green” real estate in Beijing. Eur. Econ. Rev. 2012, 56, 974–984. [Google Scholar] [CrossRef]
- Zhang, L.; Liu, H.; Wu, J. The price premium for green-labelled housing: Evidence from China. Urban Stud. 2017, 54, 3524–3541. [Google Scholar] [CrossRef]
- De Wilde, P. The gap between predicted and measured energy performance of buildings: A framework for investigation. Autom. Constr. 2014, 41, 40–49. [Google Scholar] [CrossRef]
- Levinson, A. How Much Energy do Building Energy Codes Save? Evidence from California Houses. Am. Econ. Rev. 2016, 106, 2867–2894. [Google Scholar] [CrossRef]
- Newsham, G.R.; Mancini, S.; Birt, B.J. Do LEED-certified buildings save energy? Yes, but… Energy Build. 2009, 41, 897–905. [Google Scholar] [CrossRef]
- Cole, R.J. Cost and value in building green. Build. Res. Inf. 2000, 28, 304–309. [Google Scholar] [CrossRef]
- Hill, W.; Jalloul, H.; Movahedi, M.; Choi, J. Sustainable management of the built environment from the life cycle perspective. J. Manag. Eng. 2023, 39, 03123001. [Google Scholar] [CrossRef]
- Jo, J.; Golden, J.; Shin, S. Incorporating built environment factors into climate change mitigation strategies for Seoul, South Korea: A sustainable urban systems framework. Habitat Int. 2009, 33, 267–275. [Google Scholar] [CrossRef]
- Yeheyis, M.; Hewage, K.; Alam, M.S.; Eskicioglu, C.; Sadiq, R. An overview of construction and demolition waste management in Canada: A lifecycle analysis approach to sustainability. Clean Technol. Environ. Policy 2012, 15, 81–91. [Google Scholar] [CrossRef]
- Chau, K.W.; Wong, S.K.; Liang, J.; McCluskey, W.; Cunningham, C. Transaction-based indices. In Routledge Companion to Real Estate Investment; Routledge: London, UK, 2018; pp. 192–212. [Google Scholar]
- Sexton, S.E.; Sexton, A.L. Conspicuous conservation: The Prius halo and willingness to pay for environmental bona fides. J. Environ. Econ. Manag. 2014, 67, 303–317. [Google Scholar] [CrossRef]
- King, G.; Nielsen, R. Why Propensity Scores Should Not Be Used for Matching. Politi-Anal. 2019, 27, 435–454. [Google Scholar] [CrossRef]
- Langworthy, B.; Wu, Y.; Wang, M. An overview of propensity score matching methods for clustered data. Stat. Methods Med. Res. 2023, 32, 641–655. [Google Scholar] [CrossRef] [PubMed]
Disclaimer/Publisher’s Note: The statements, opinions and data contained in all publications are solely those of the individual author(s) and contributor(s) and not of MDPI and/or the editor(s). MDPI and/or the editor(s) disclaim responsibility for any injury to people or property resulting from any ideas, methods, instructions or products referred to in the content. |
© 2024 by the authors. Licensee MDPI, Basel, Switzerland. This article is an open access article distributed under the terms and conditions of the Creative Commons Attribution (CC BY) license (https://creativecommons.org/licenses/by/4.0/).