
Integrated Eye-Tracking Response Surface Analysis to Optimize the Design of Garden Landscapes


Abstract
1. Introduction
2. Materials and Methods
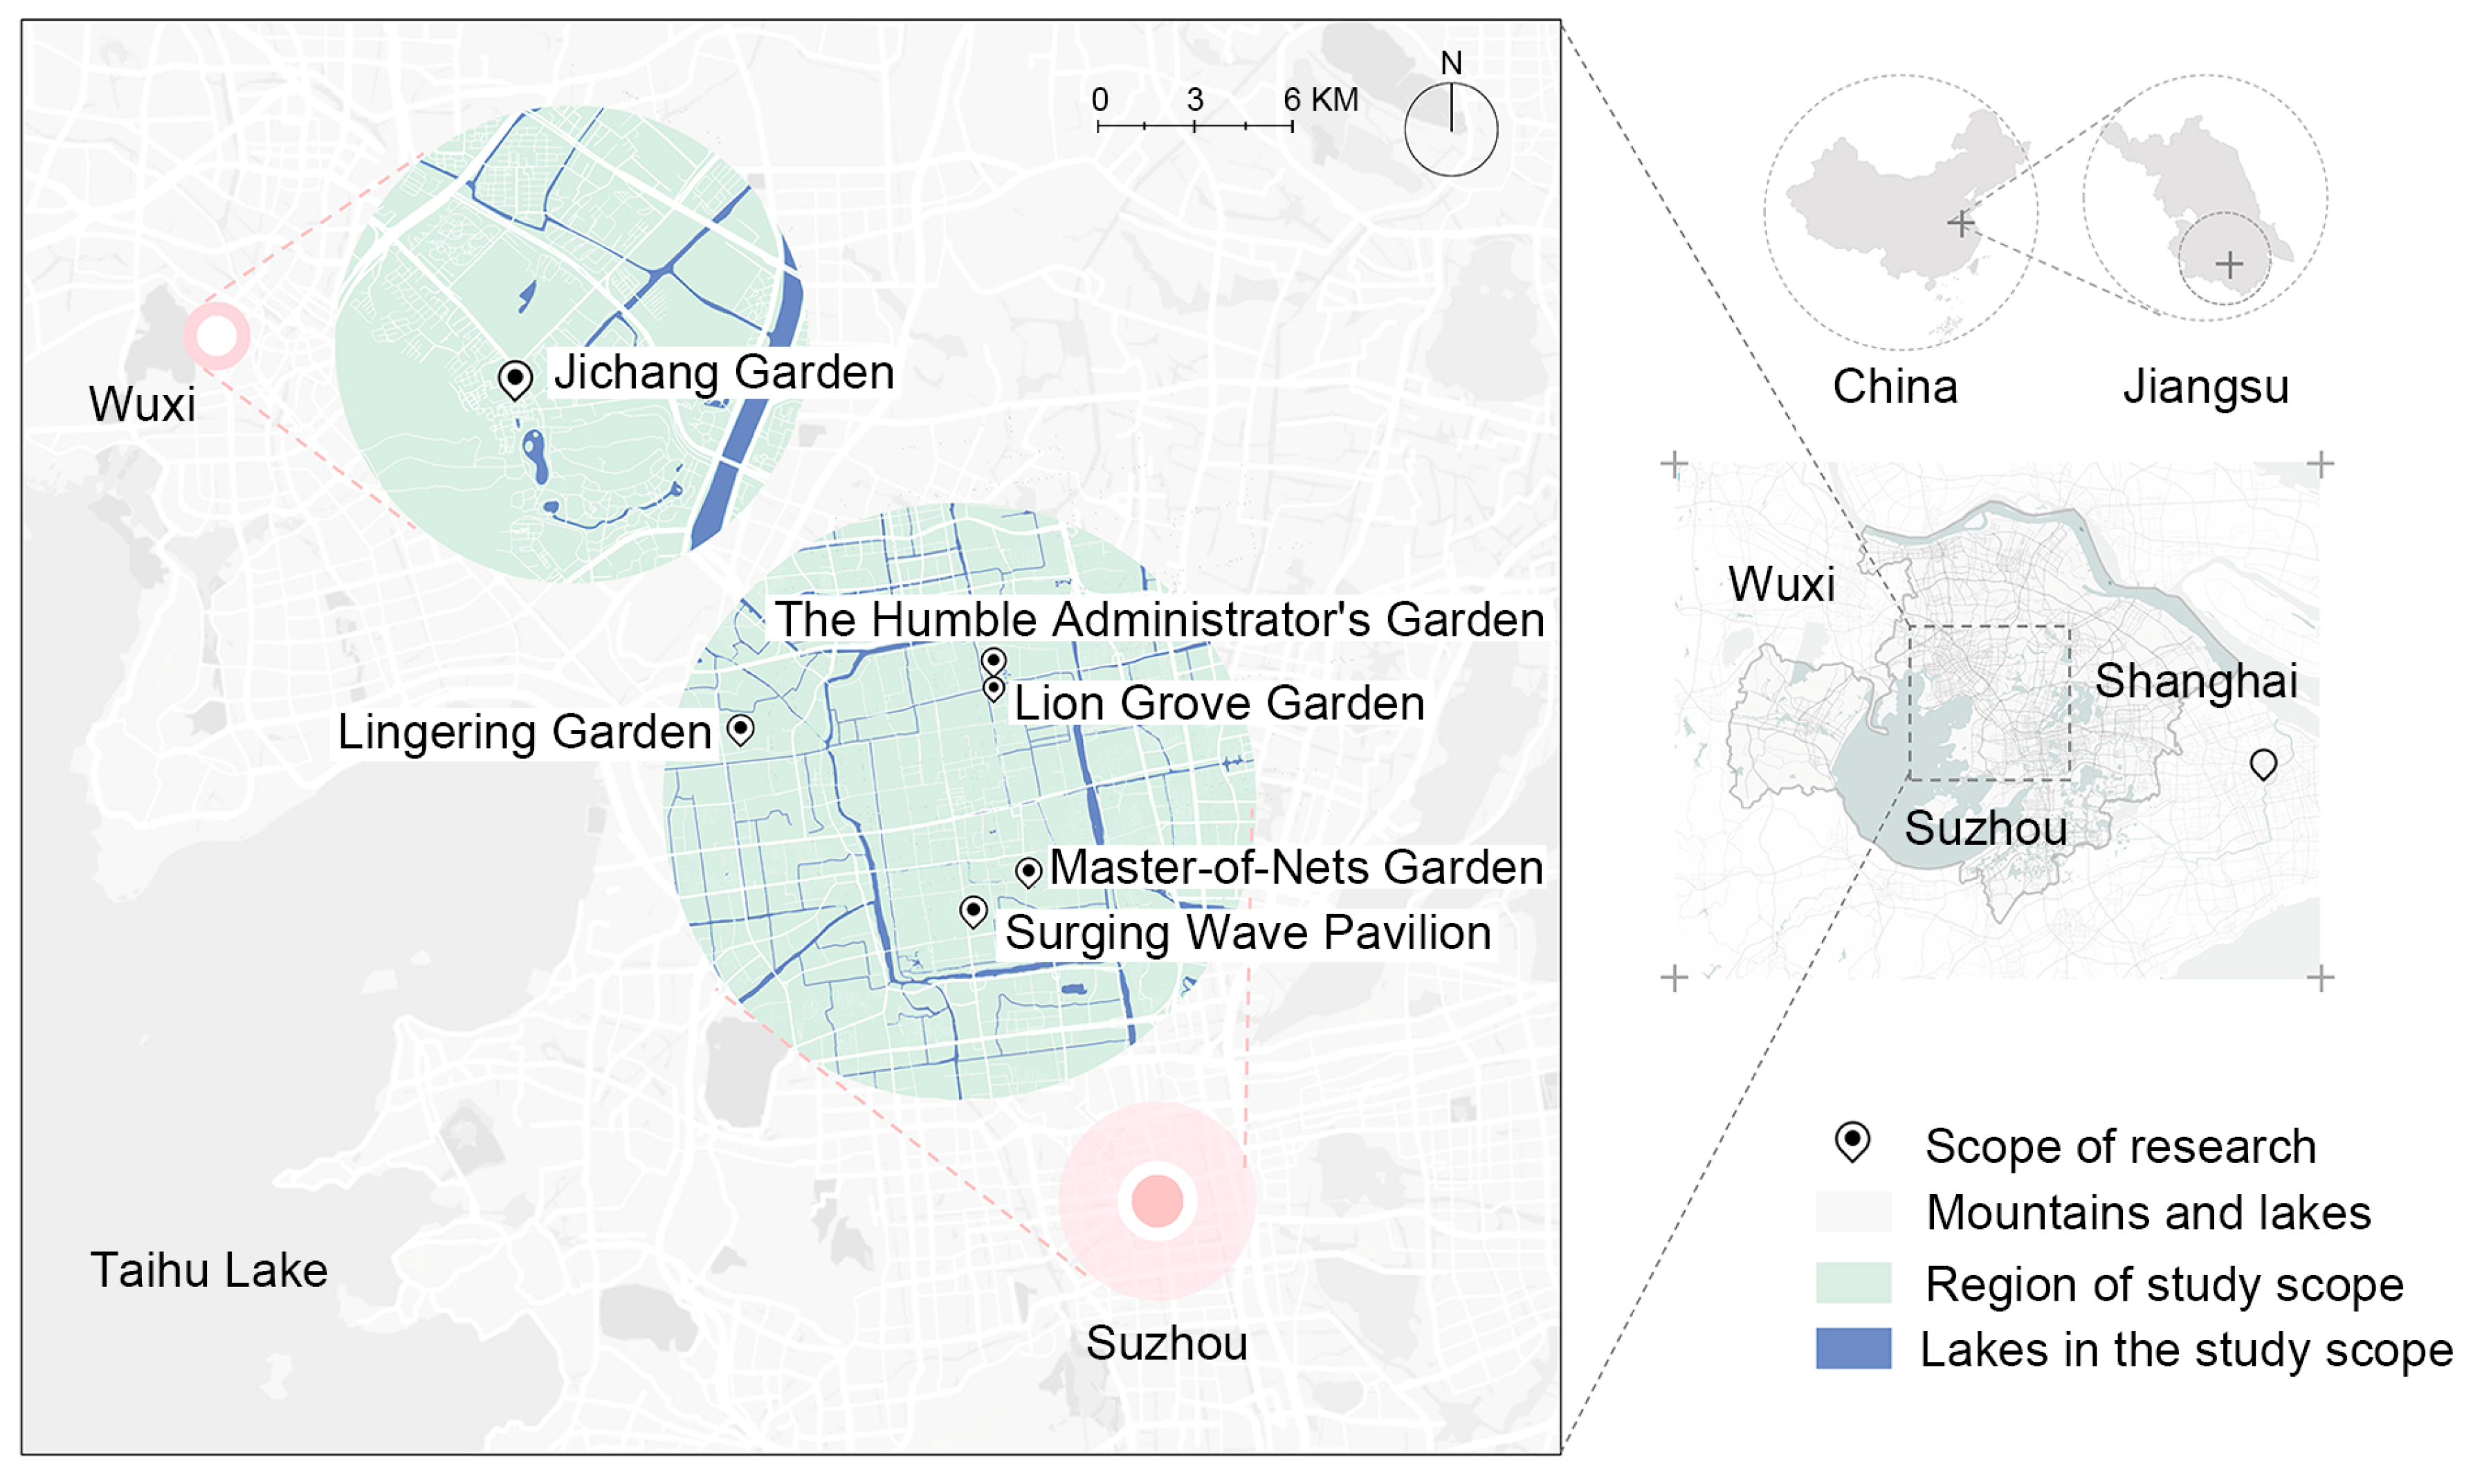
2.1. Study Area
- (1)
- Representativeness: These gardens hold significant historical and cultural value in the Jiangnan region, representing the typical style and design concepts of Jiangnan gardens. Specifically, they showcase the essence of Jiangnan gardens in terms of their layout, architecture, and plant arrangements.
- (2)
- Geographical coverage: The chosen gardens are distributed across different cities in the Jiangnan region, including Suzhou and Wuxi, reflecting their diversity and regional characteristics.
- (3)
- garden elements: The presence of pavilions, towers, small bridges, flowing water, and rock formations within these gardens fully embodies the artistic features and aesthetic pursuits of the Jiangnan garden design.
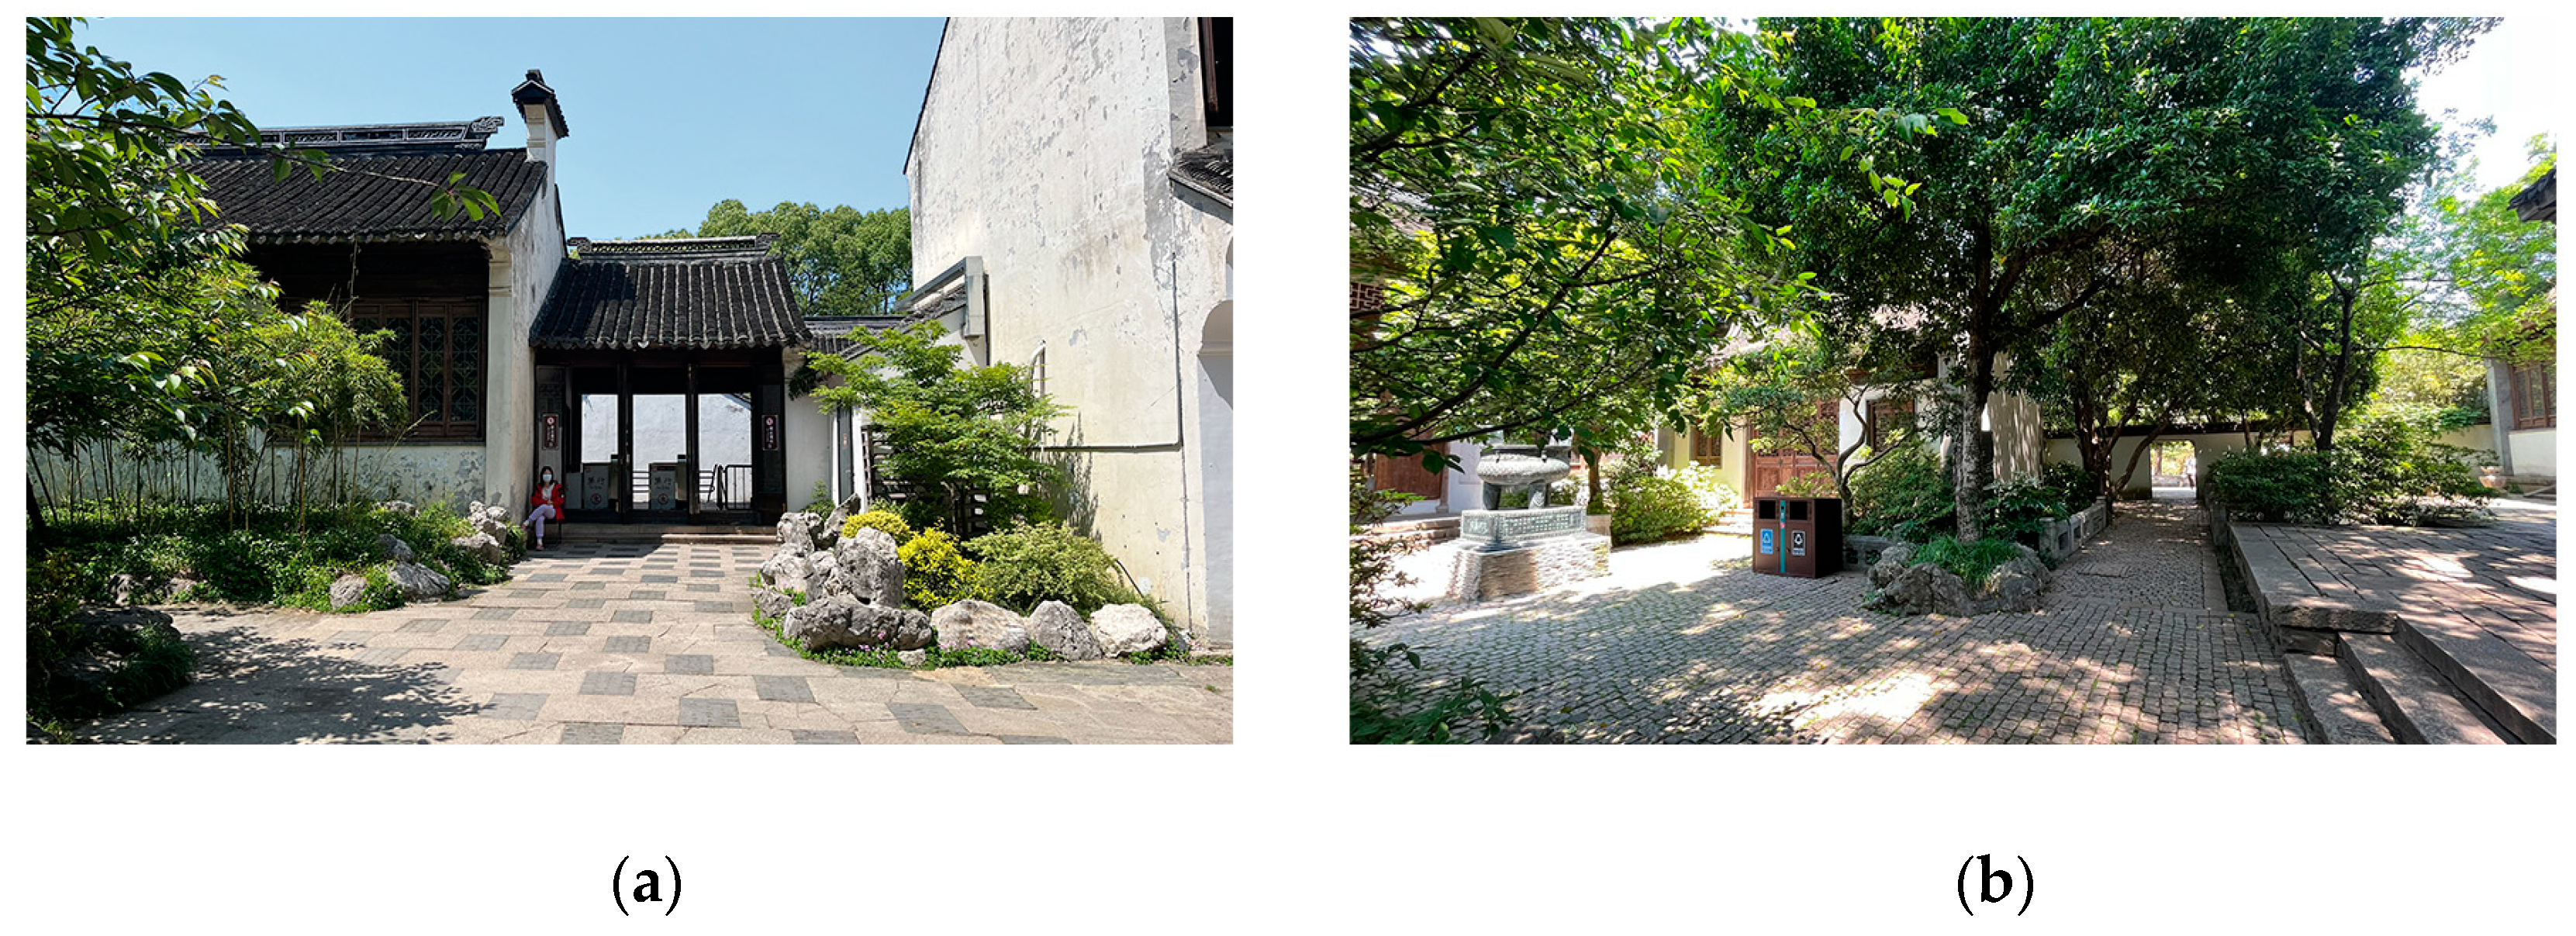
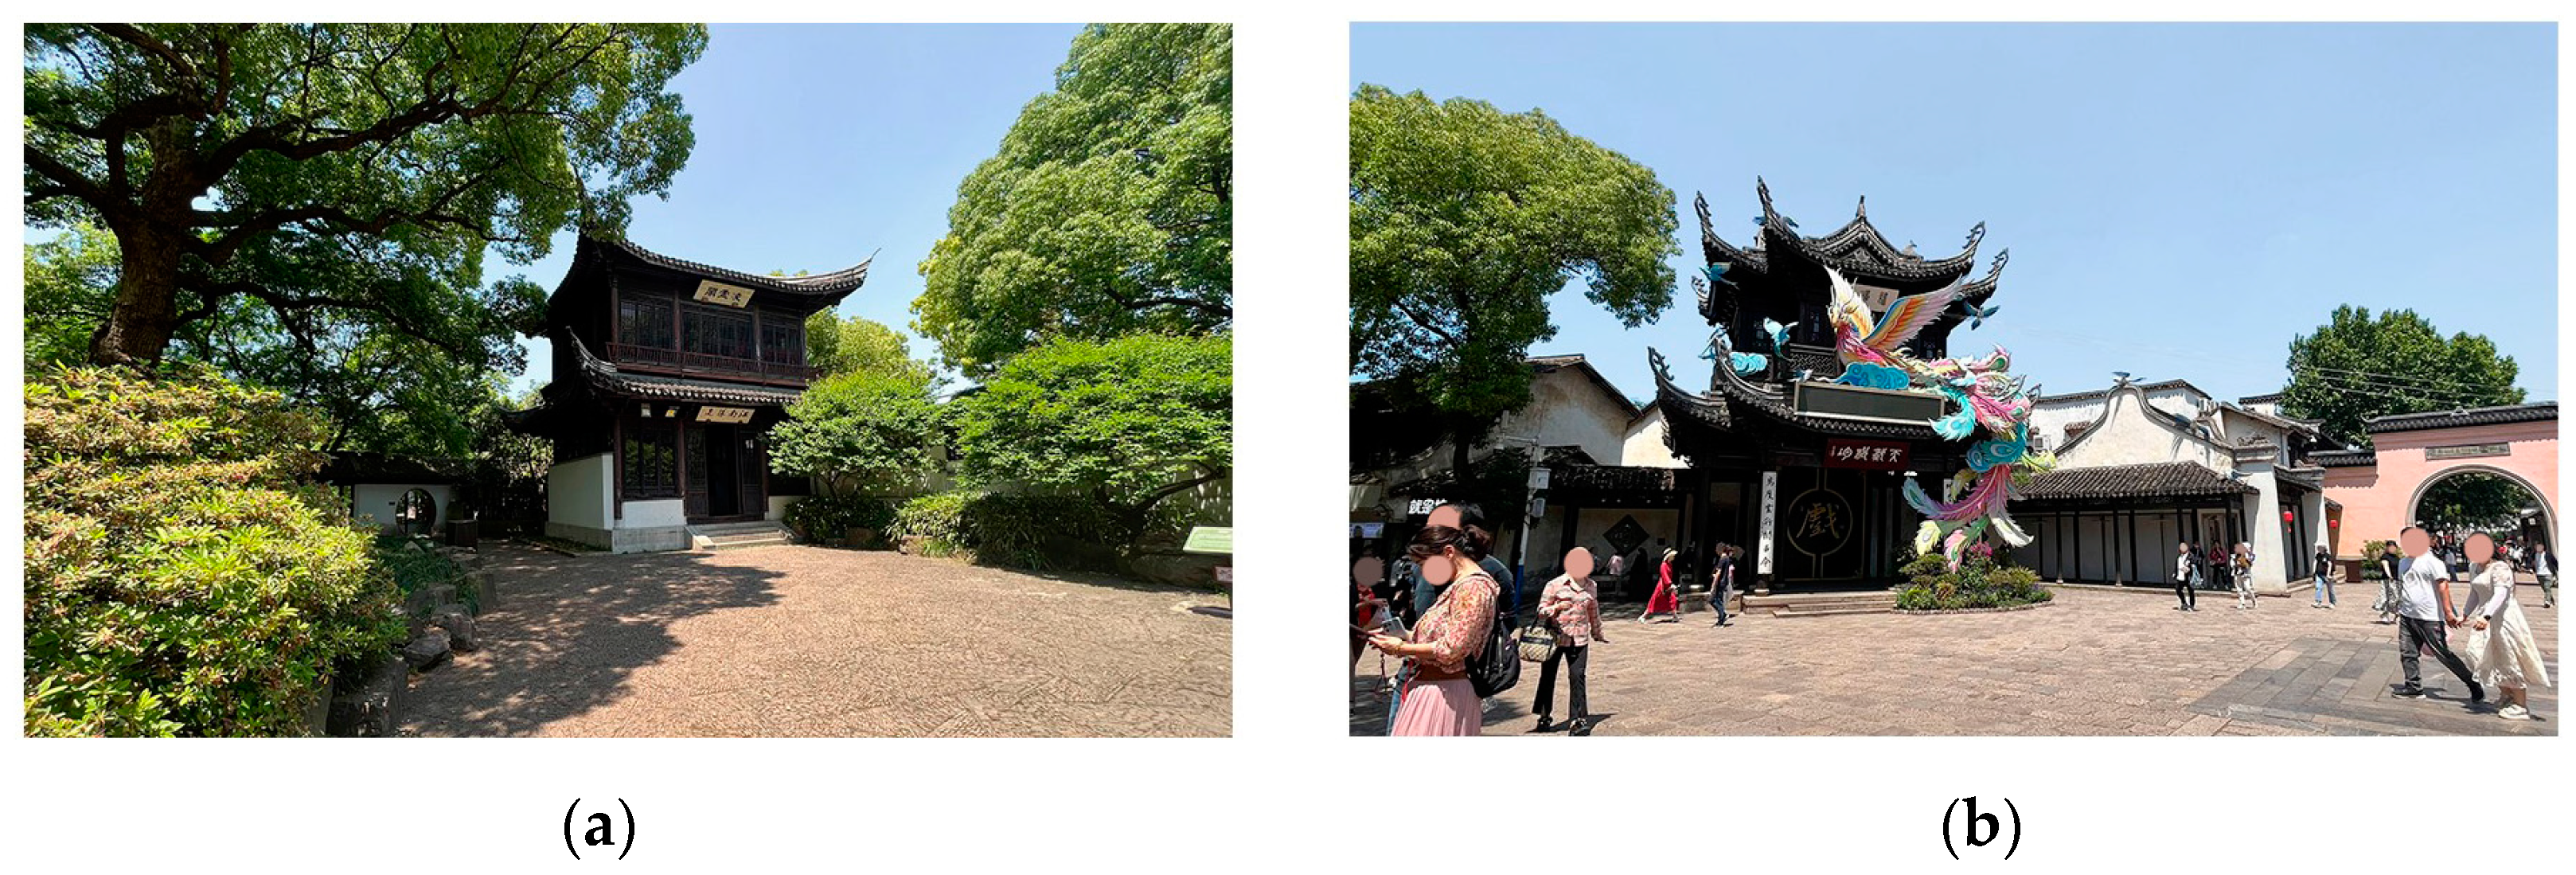
2.2. Photo Acquisition and Processing
2.3. Subject
2.4. Eye Tracking and Questionnaire Data Collection
2.5. Procedure
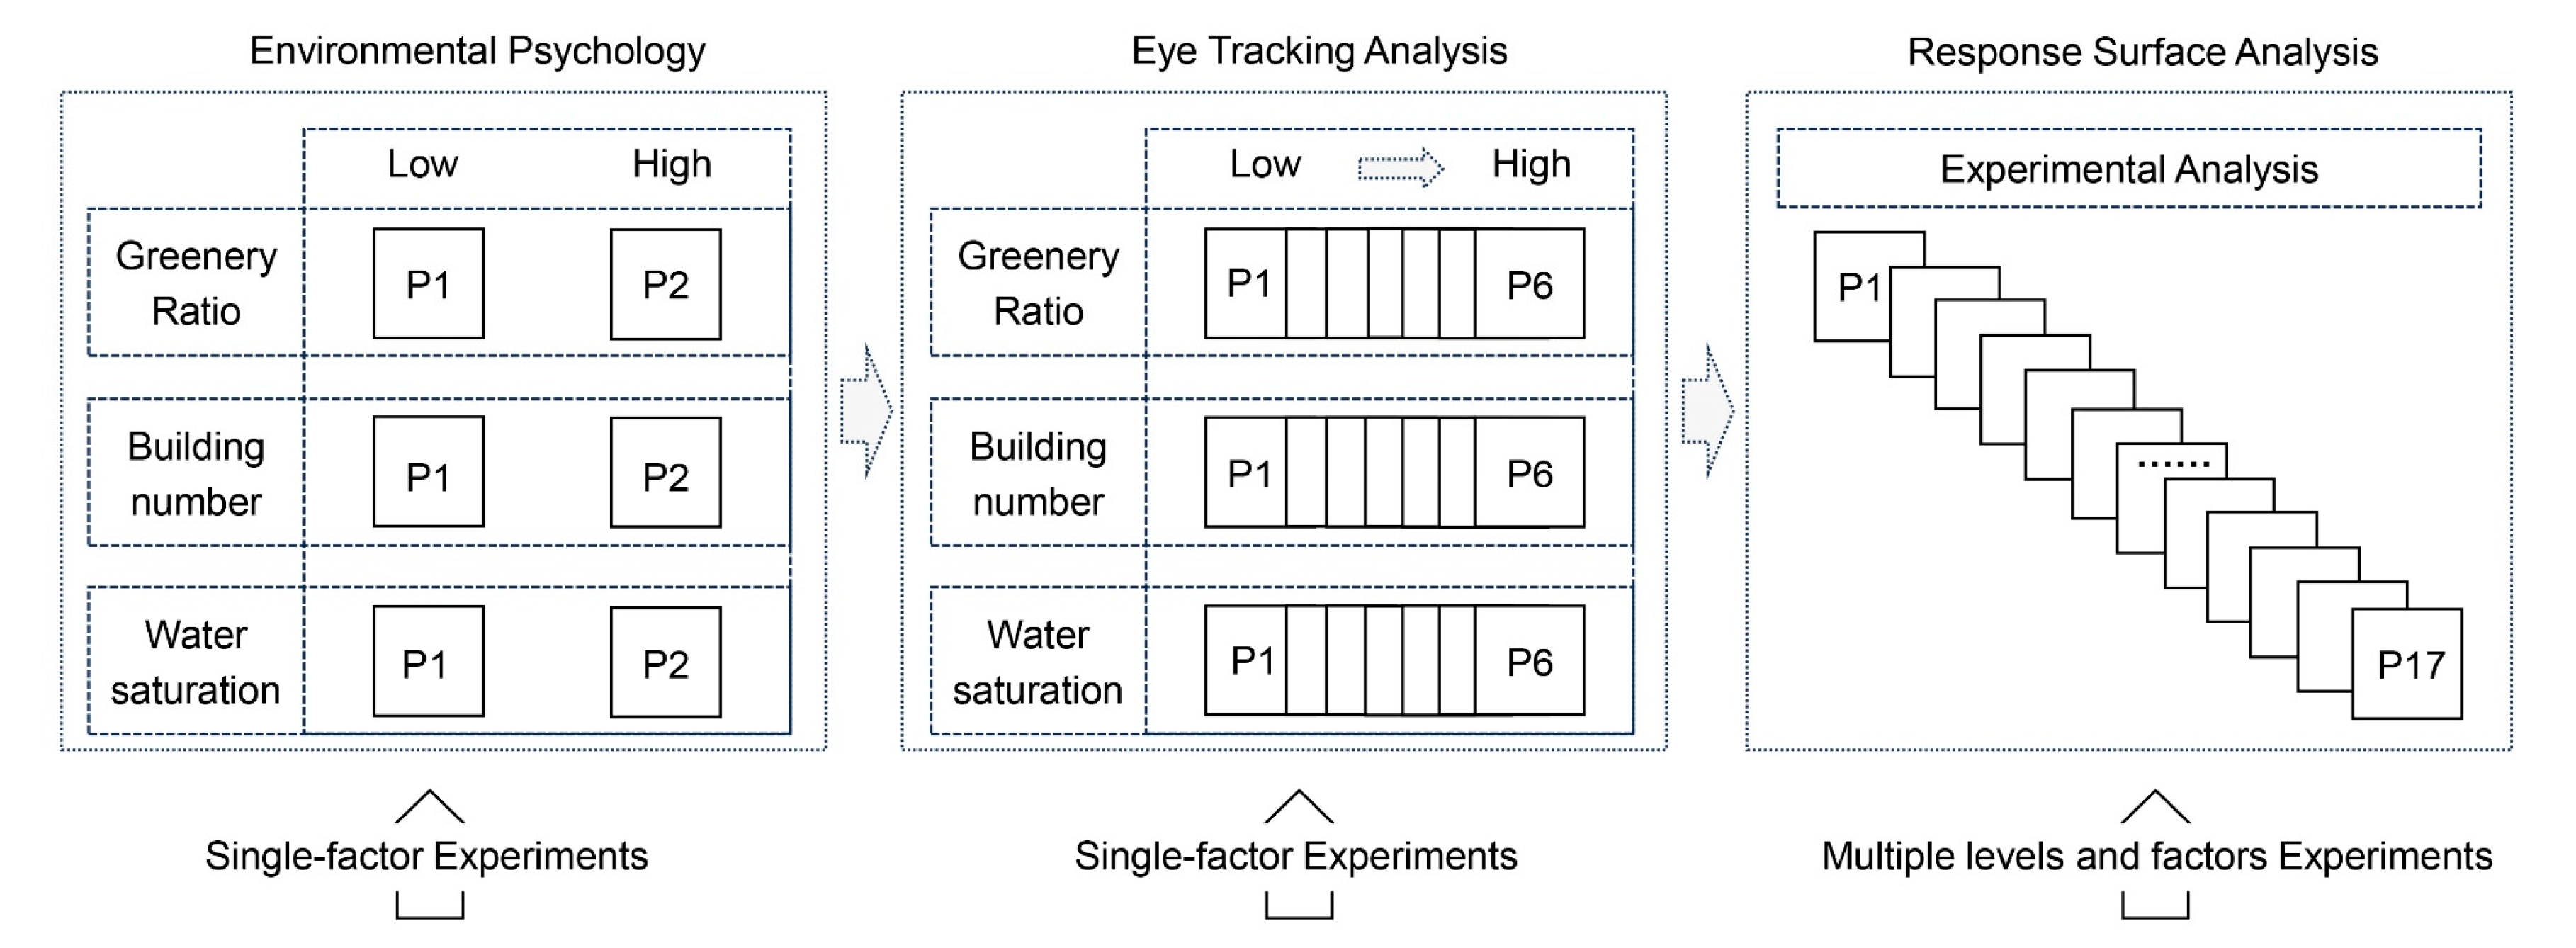
2.6. Data Analysis
3. Results
3.1. Research on Environmental Psychology of Garden Elements
3.1.1. Impact of the Greenery Ratio on Visitors’ Psychology
3.1.2. Impact of the Number of Buildings on Visitors’ Psychology
3.1.3. Impact of Water Saturation on Visitors’ Psychology
3.2. Eye-Tracking Analysis of Elements of Garden Landscapes
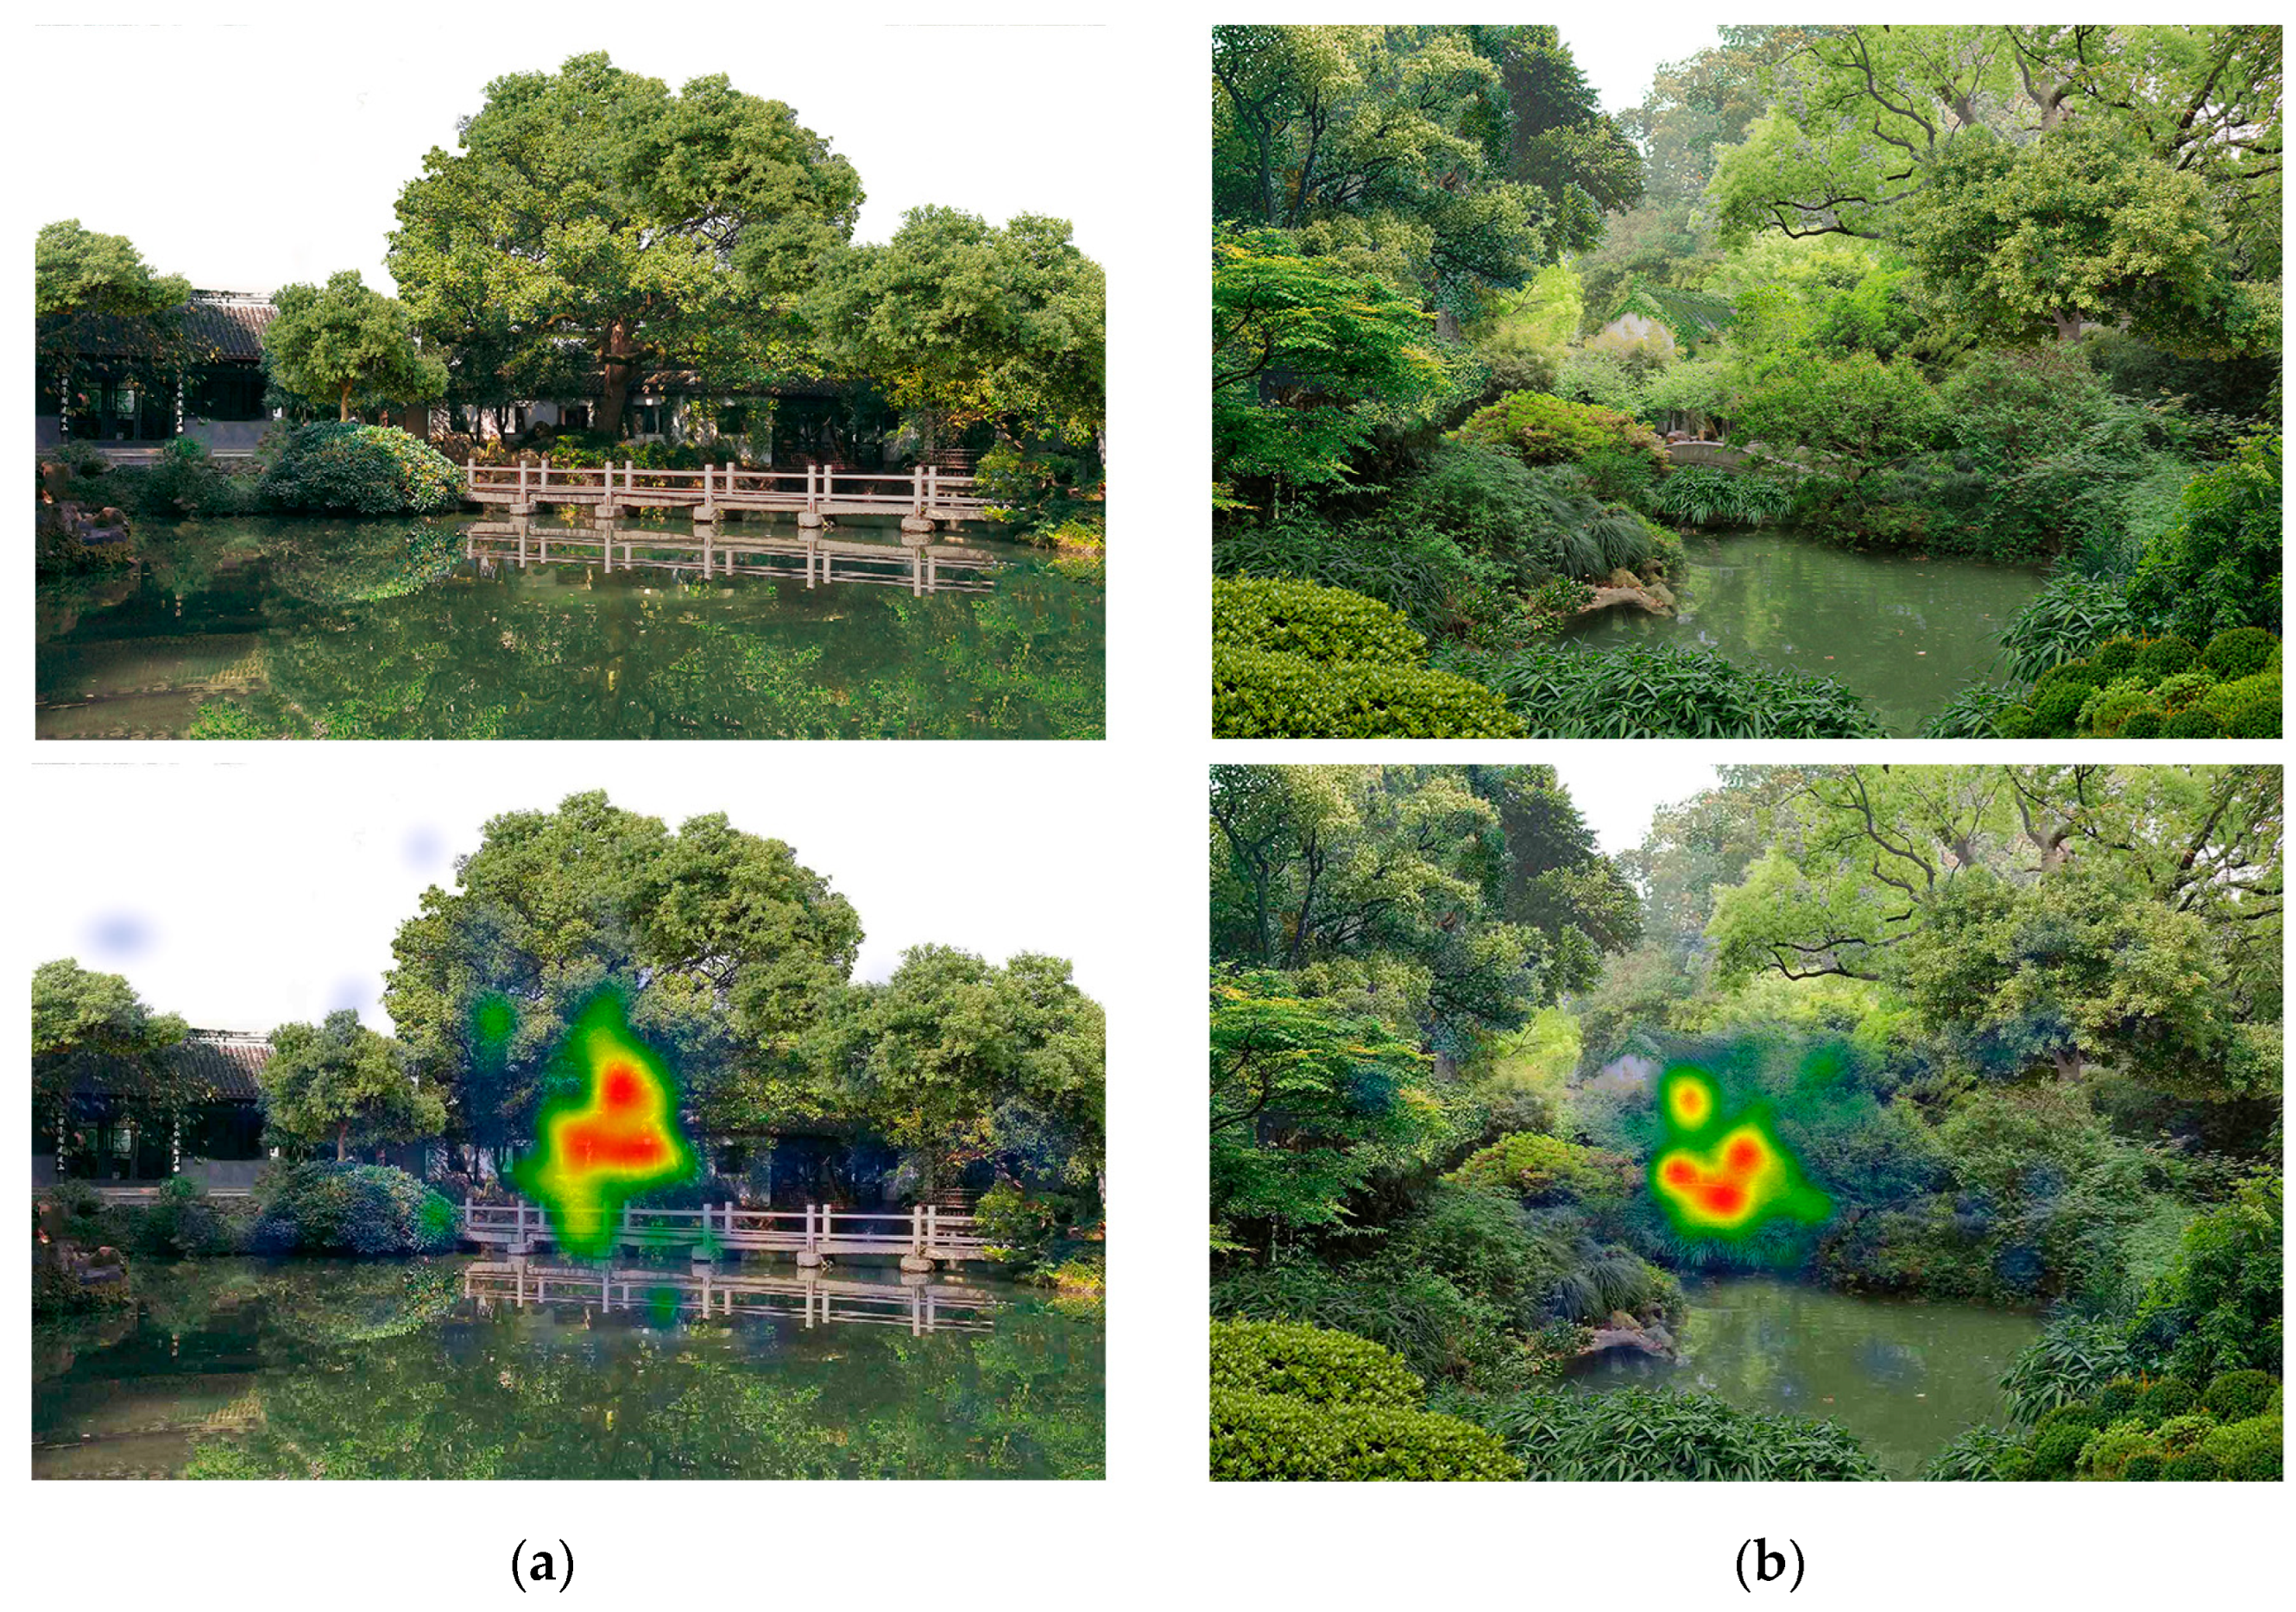
3.2.1. Eye-Tracking Analysis of Greenery Ratio
3.2.2. Eye-Tracking Analysis of The Number of Buildings
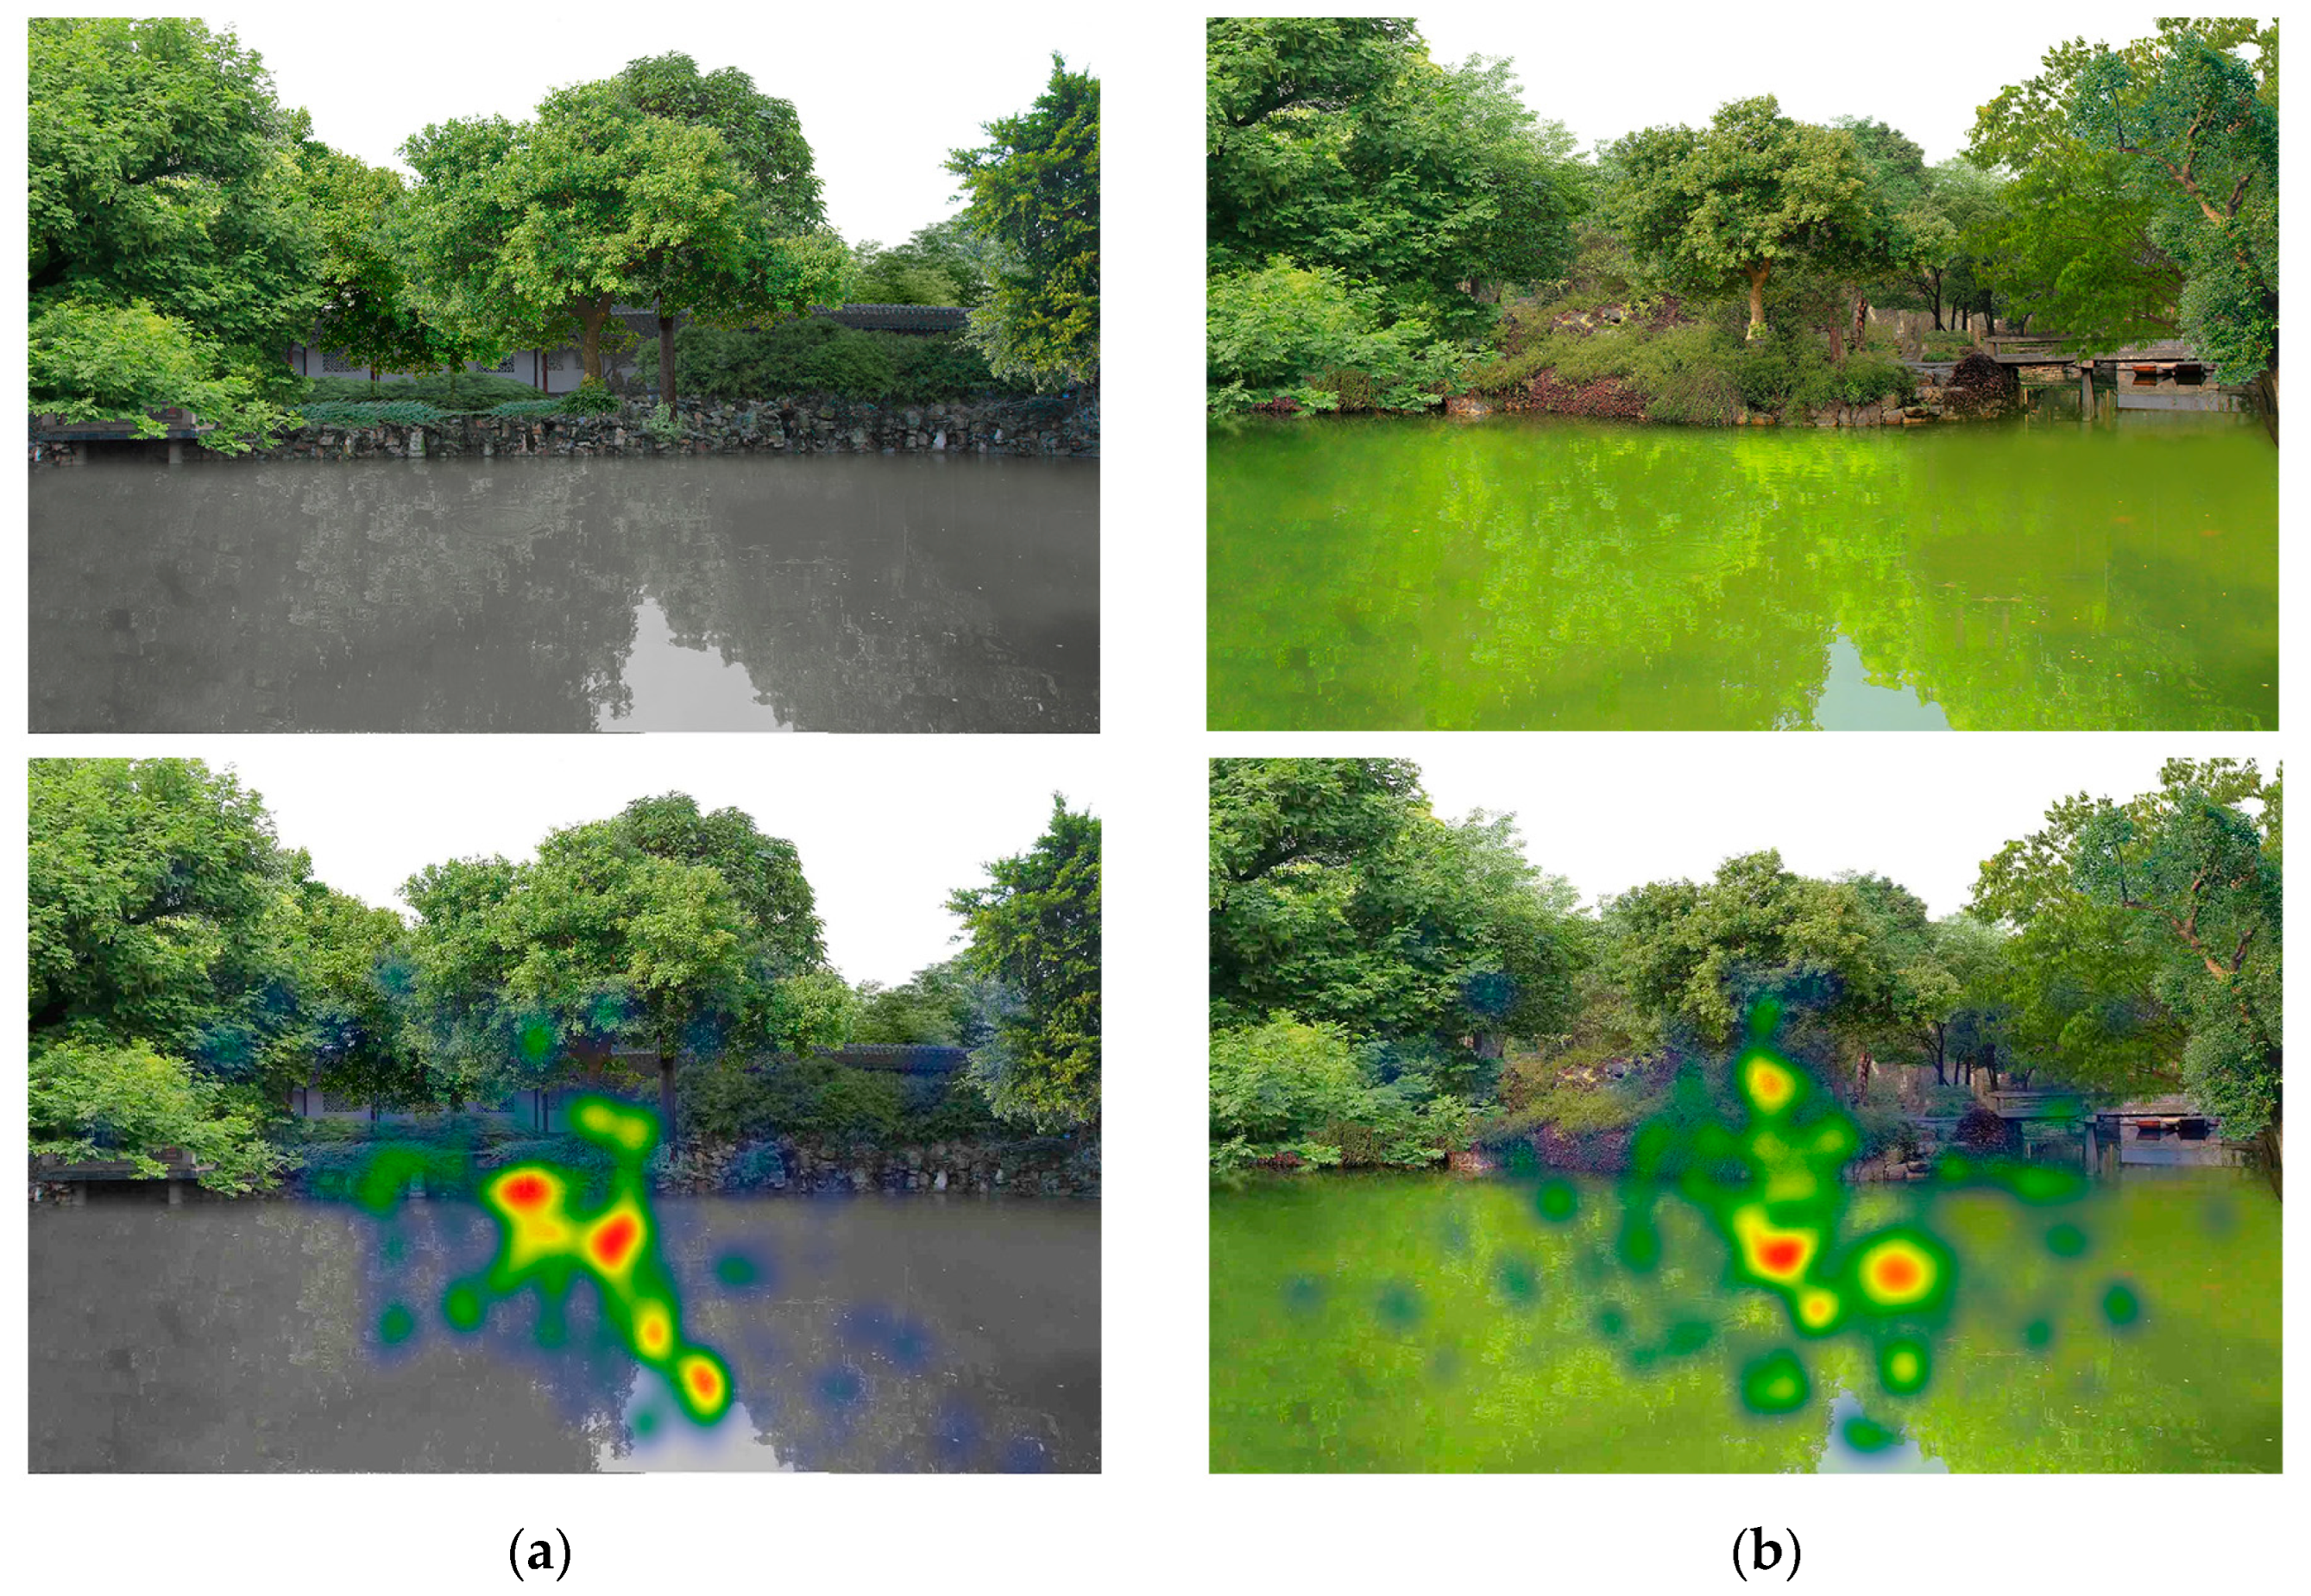
3.2.3. Eye-Tracking Analysis of Water Saturation
3.3. The Relationship between Environmental Psychology and Eye Tracking
3.4. Single-Factor Experiments
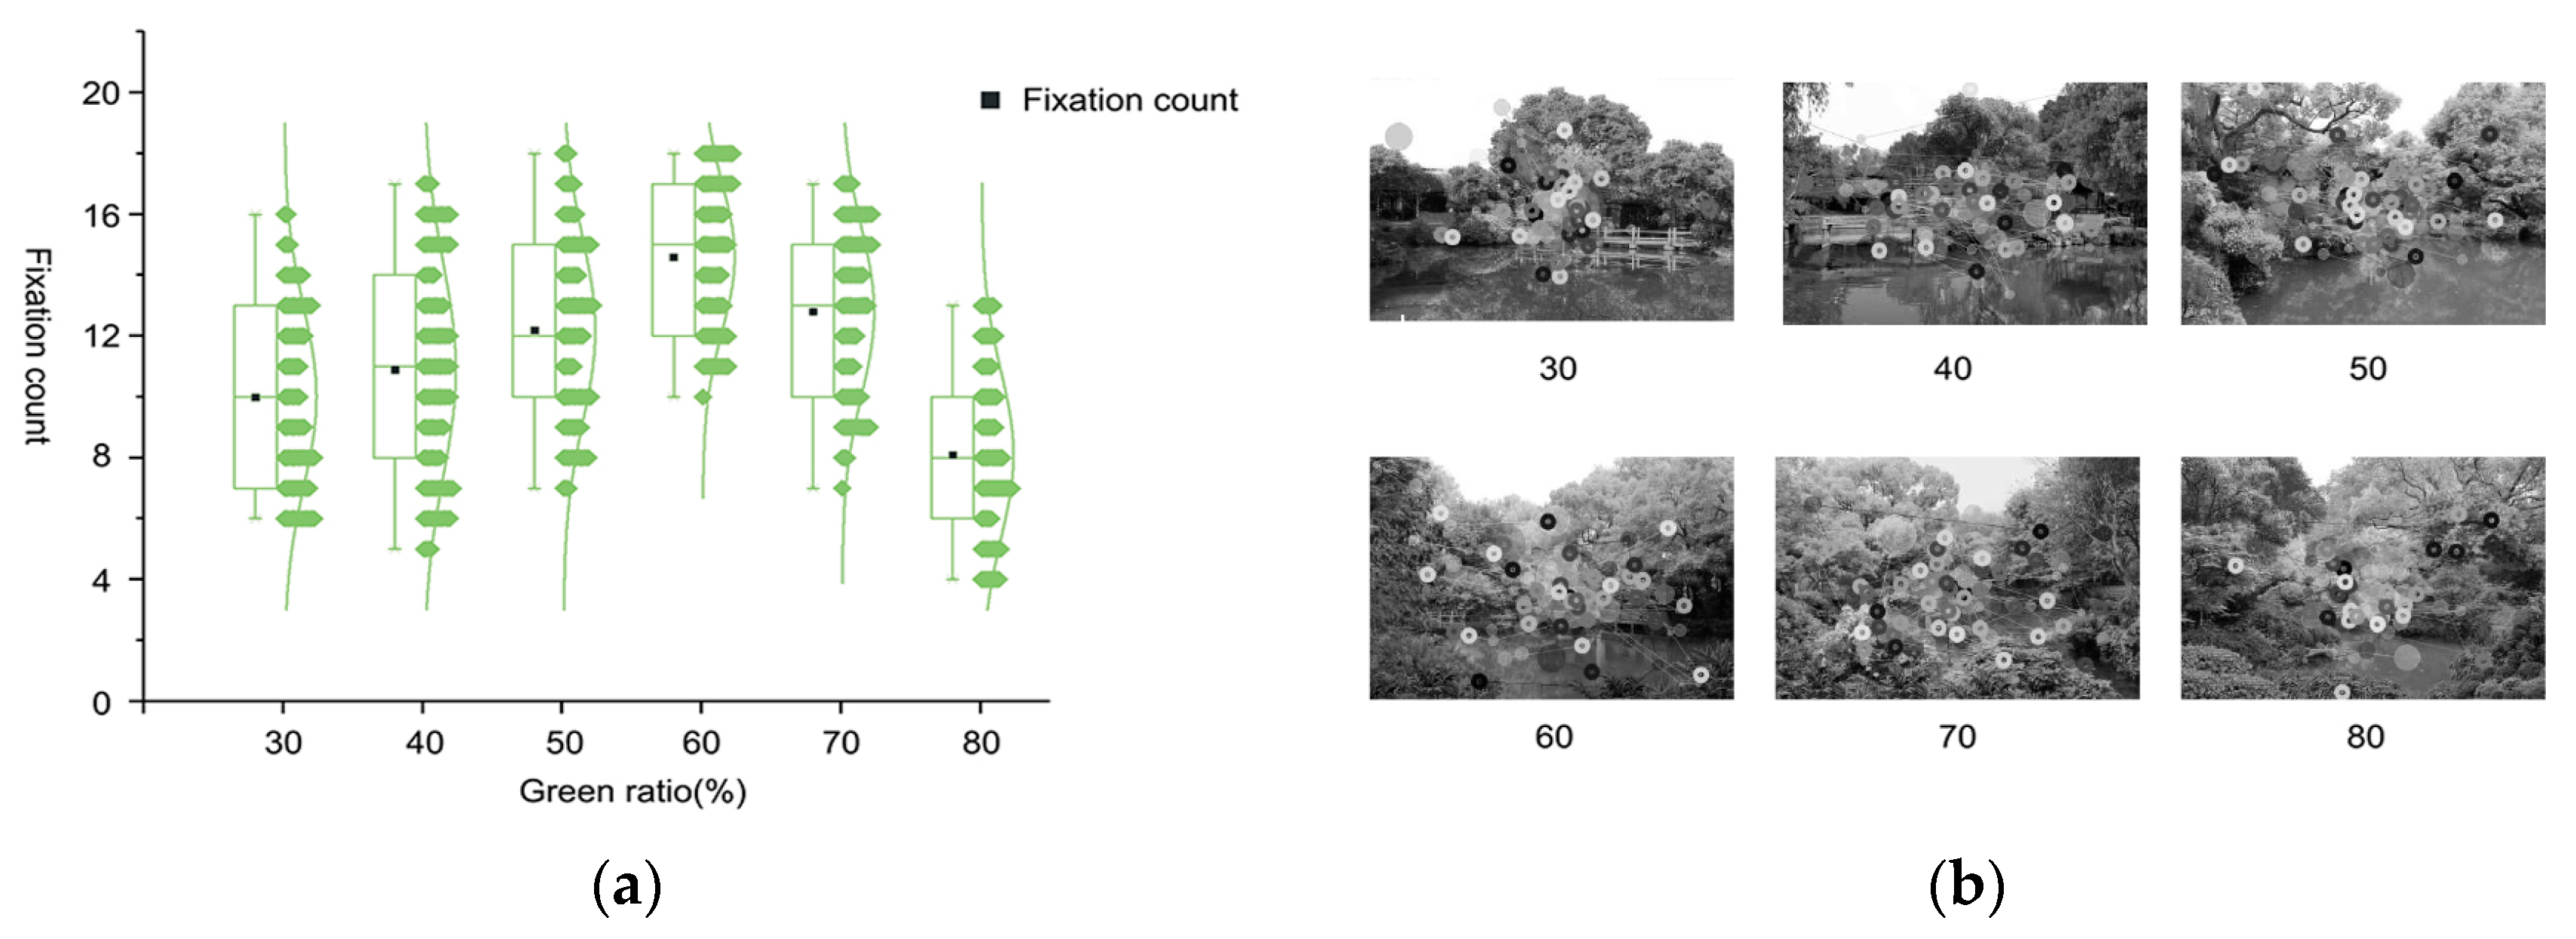
3.4.1. The Impact of the Greenery Ratio on Visitors
3.4.2. The Impact of the Numbers of Buildings on Visitors
3.4.3. The impact of water saturation on visitors
3.4.4. Validation of the Results of Single-Factor Experiments
3.4.5. Mechanisms and Principles
3.5. Response Surface Analysis of Garden Elements
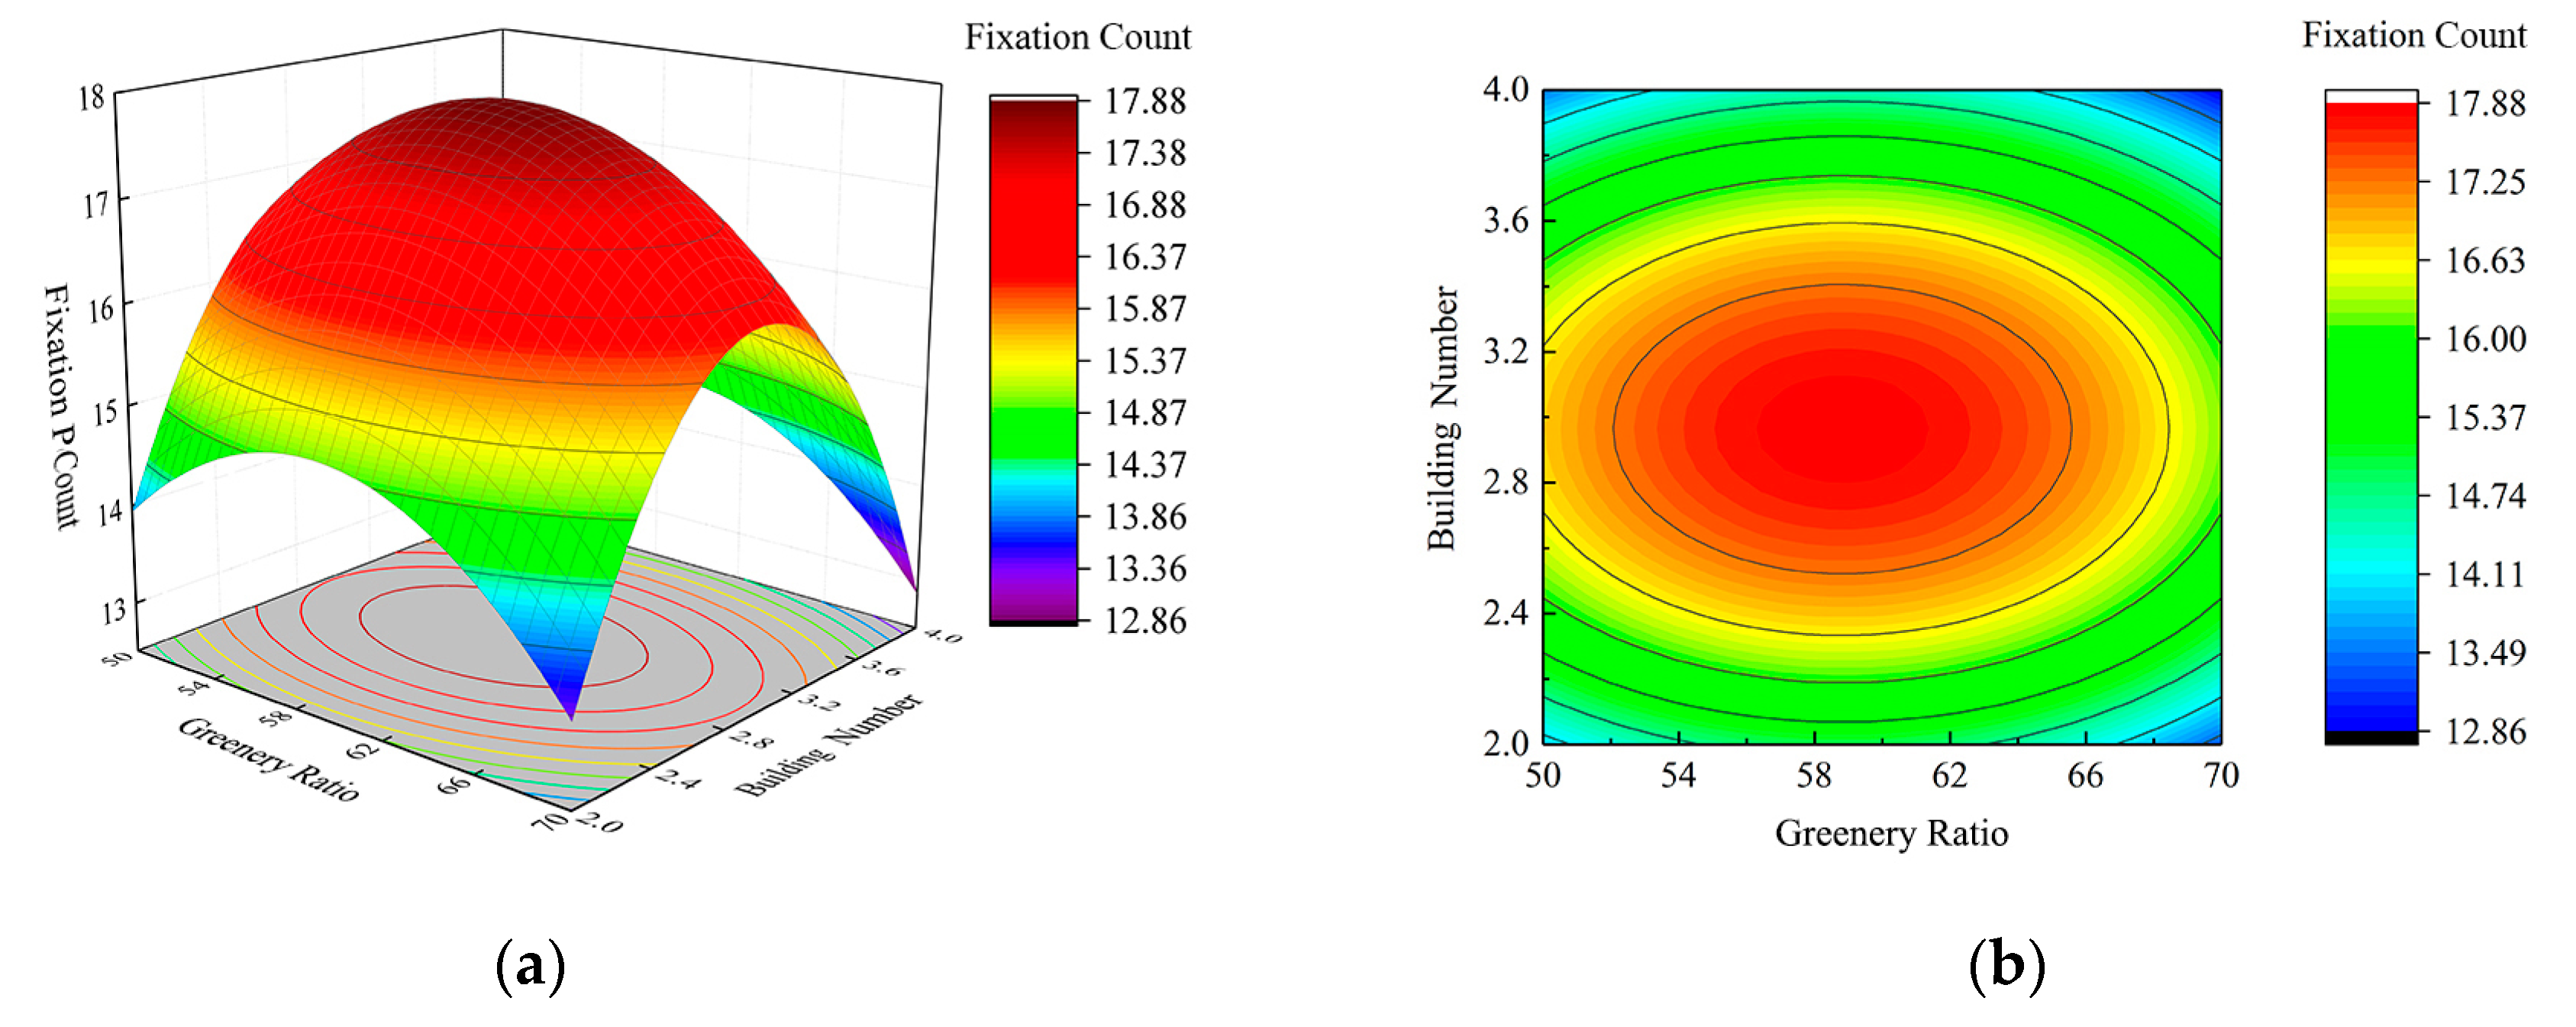
3.5.1. Response Surface Optimization Simulation
3.5.2. Analysis of the Relationships between Garden Elements
- The relationship between the greenery ratio and the number of buildings
- 2.
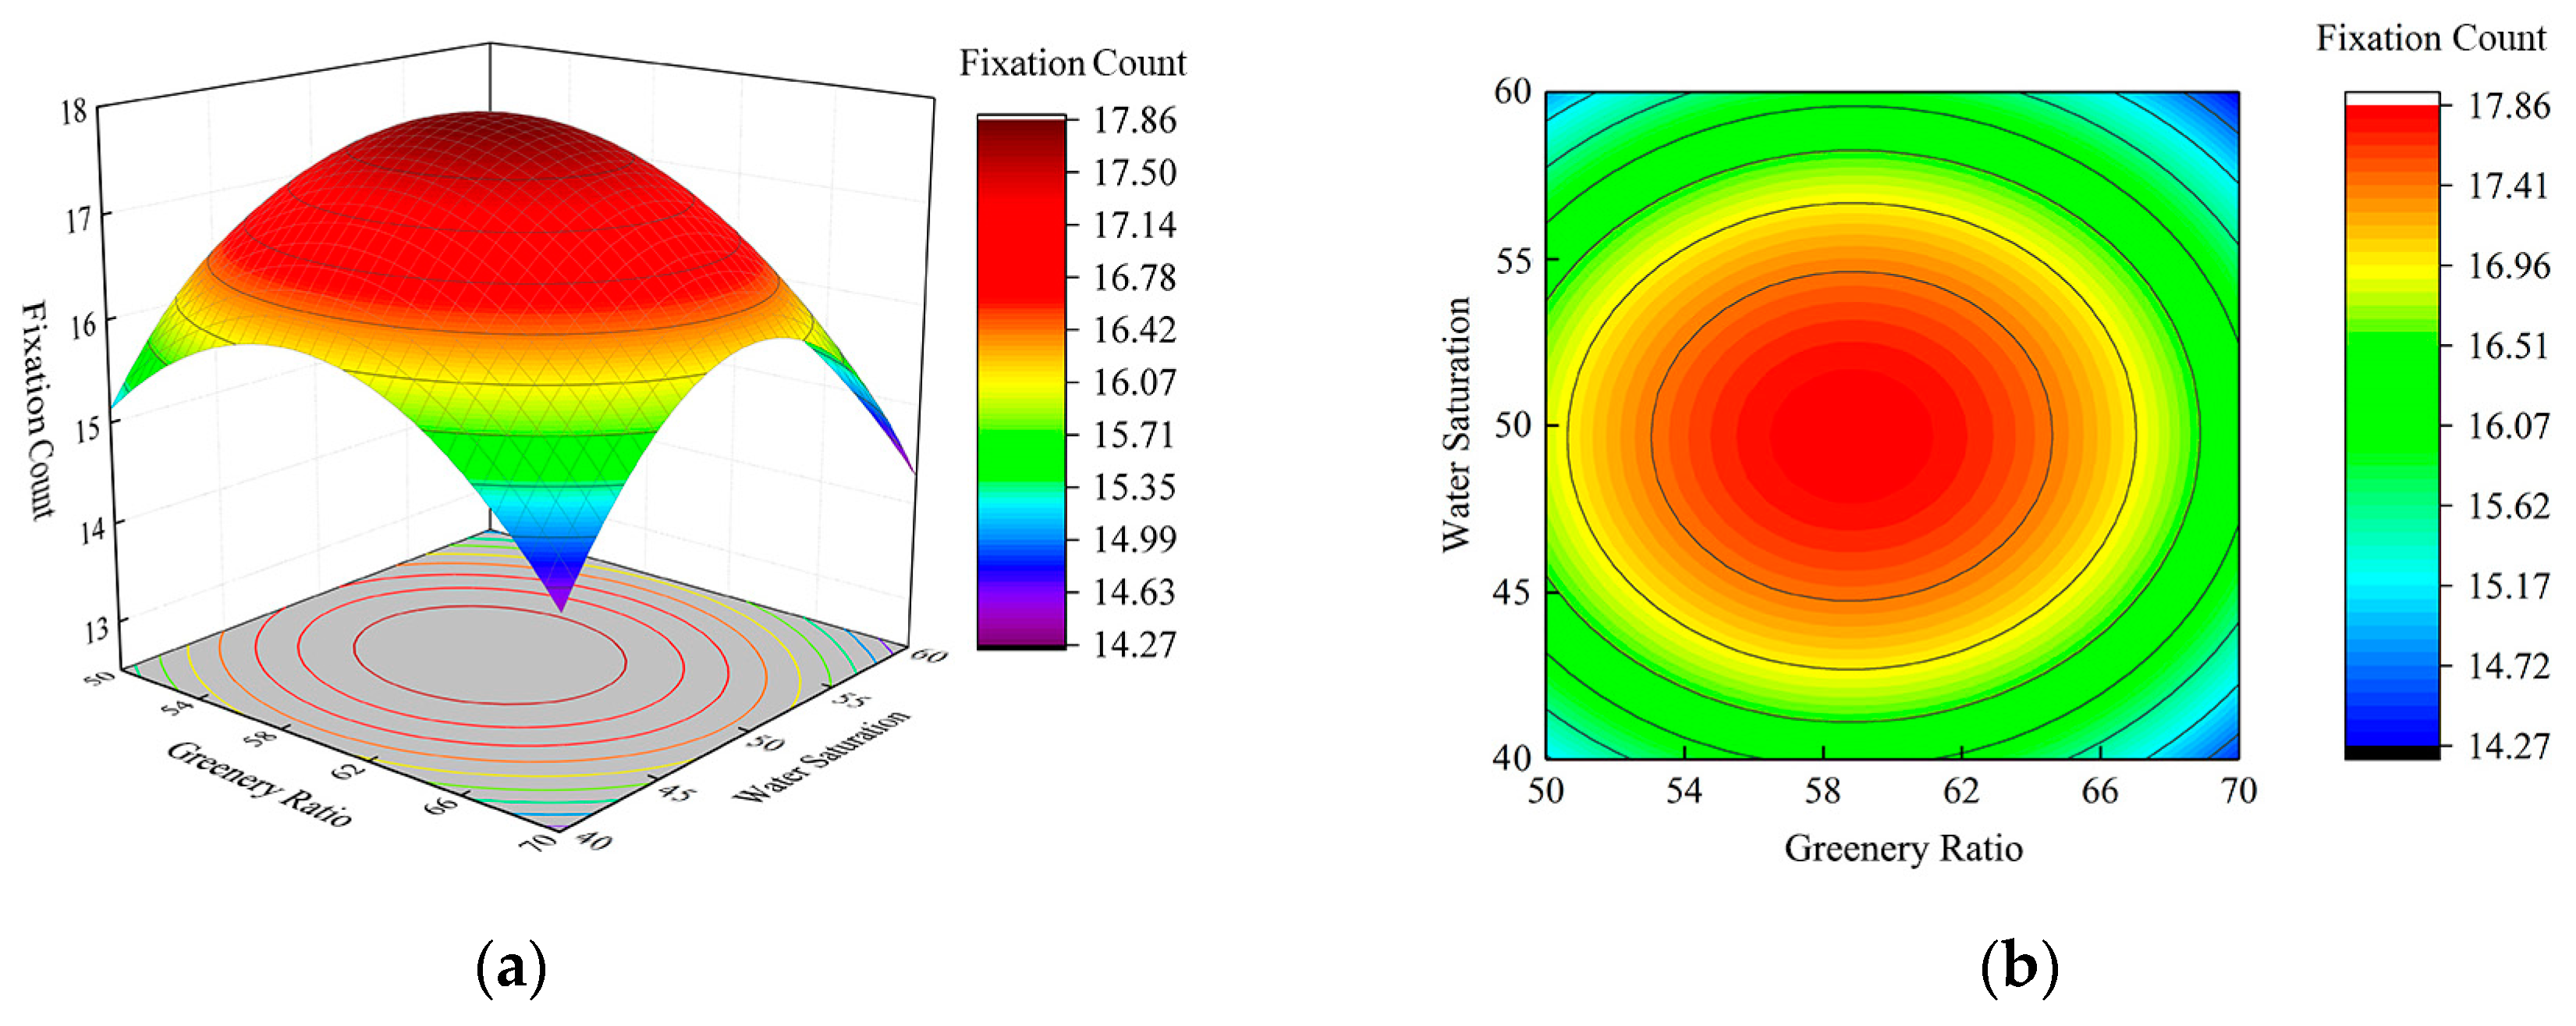
- The relationship between the greenery ratio and water saturation.
- 3.
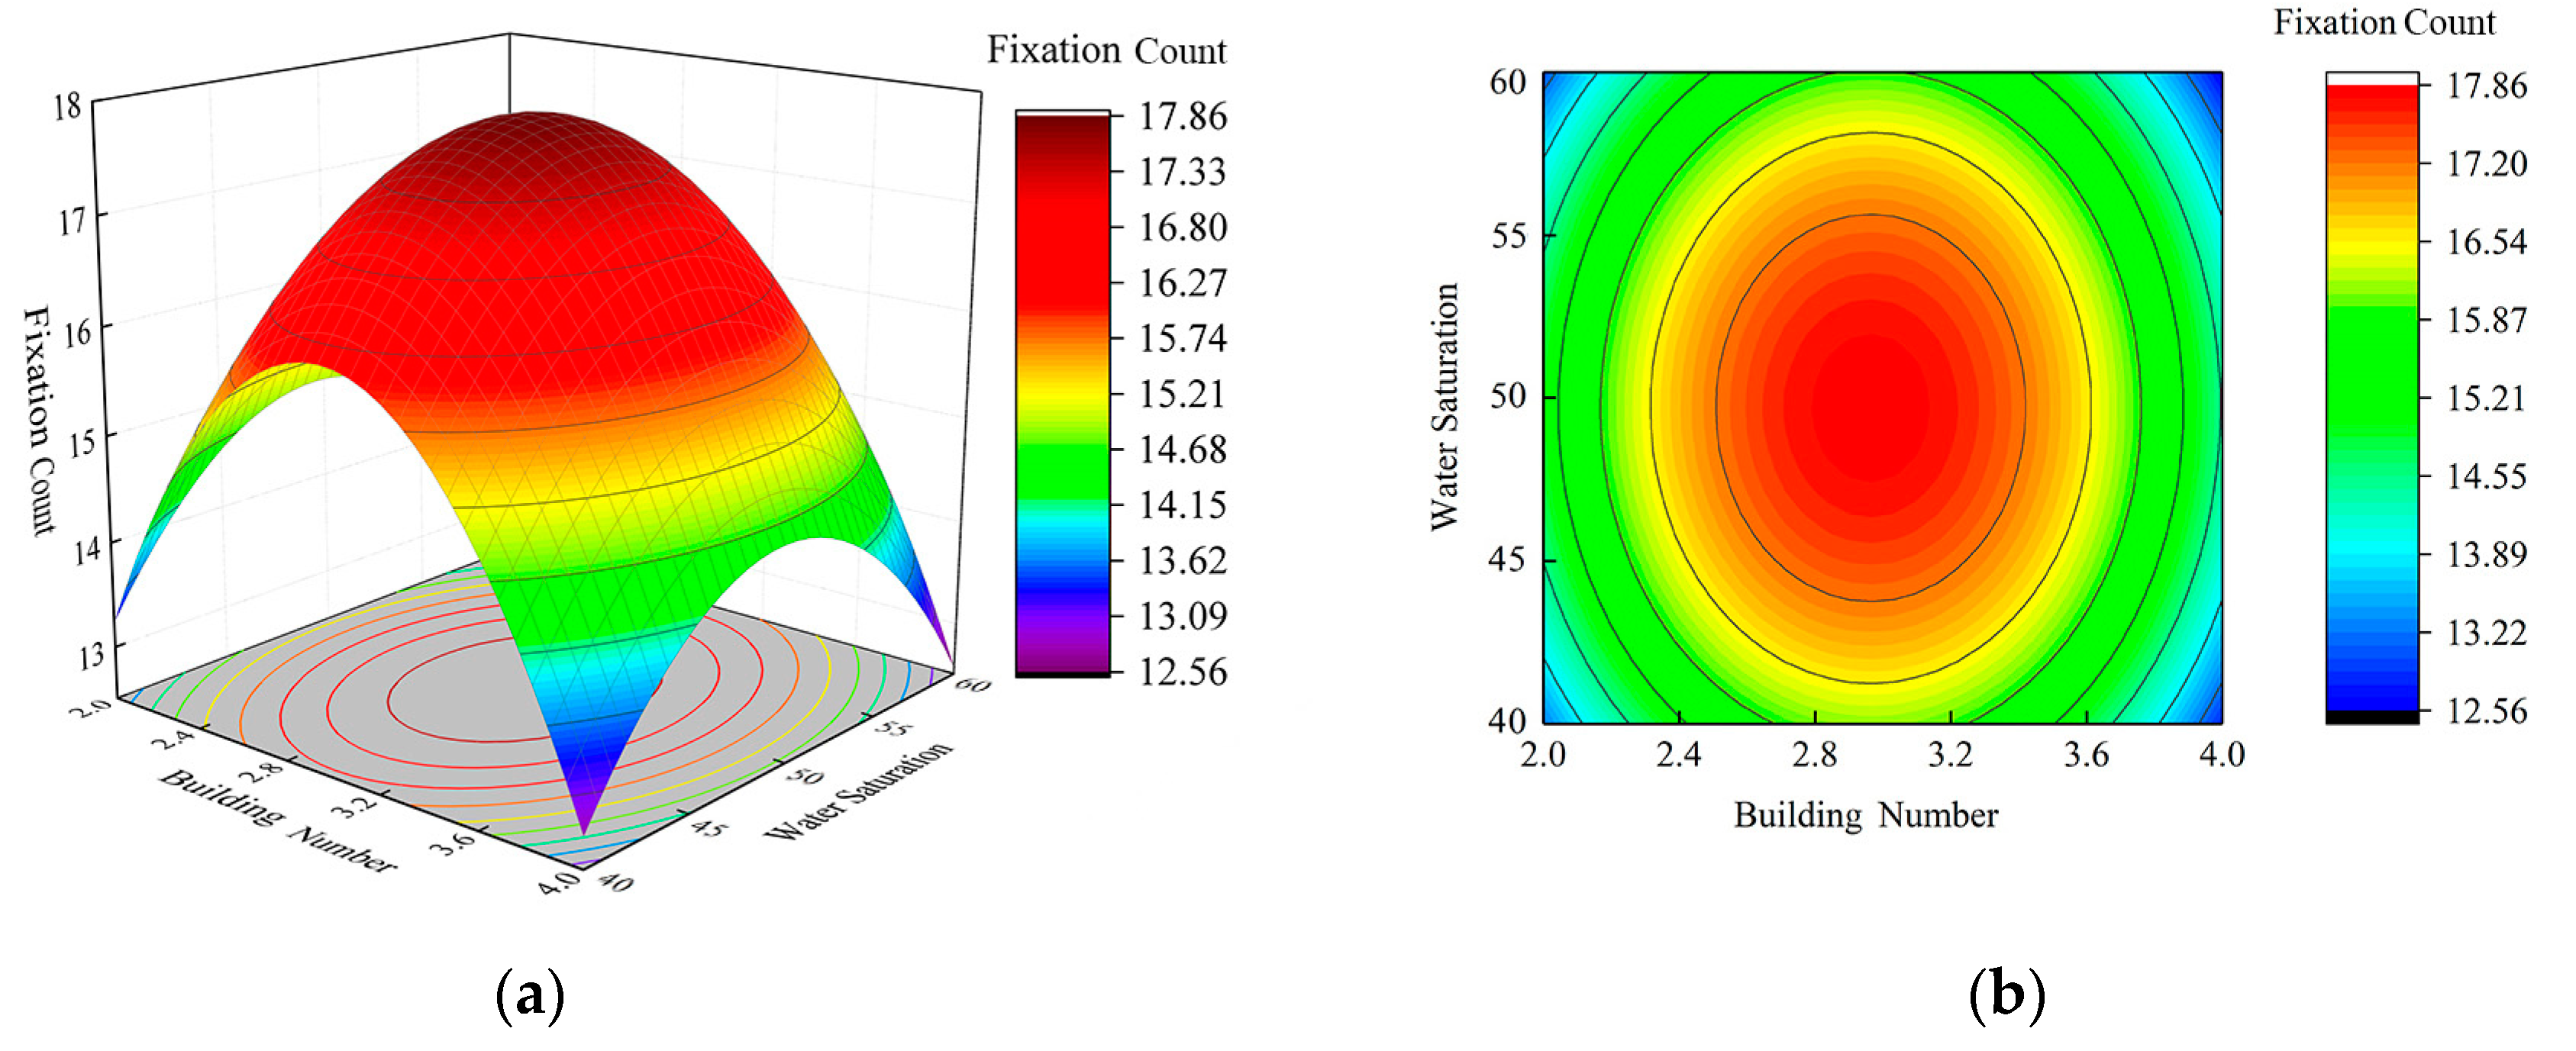
- Relationship between the number of buildings and water saturation
3.6. Optimizing the Design of Garden Elements
4. Discussion
4.1. The Integration of Landscape Psychology and Environmental Psychology
4.2. The Impact of Different Garden Elements on Visitors’ Psychology
4.3. The Impact of Different Garden Elements on Visitors’ Visual Preferences
4.4. The Advantages of Integrated Eye-Tracking Response Surface Analysis
4.5. Directions for Future Research
5. Conclusions
Supplementary Materials
Author Contributions
Funding
Data Availability Statement
Acknowledgments
Conflicts of Interest
References
- Gifford, R. Environmental psychology matters. Annu. Rev. Psychol. 2014, 65, 541–579. [Google Scholar] [CrossRef] [PubMed]
- Ramkissoon, H.; Smith, L.; Weiler, B. Testing the dimensionality of place attachment and its relationships with place satisfaction and pro-environmental behaviours: A structural equation modelling approach. Tour. Manag. 2013, 36, 552–566. [Google Scholar] [CrossRef]
- Tam, K.; Milfont, T.L. Towards cross-cultural environmental psychology: A state-of-the-art review and recommendations. J. Environ. Psychol. 2020, 71, 101474. [Google Scholar] [CrossRef]
- Pluess, M. Individual differences in environmental sensitivity. Child Dev. Perspect. 2015, 9, 138–143. [Google Scholar] [CrossRef]
- Cheng, T.M.; Wu, H.C. How do environmental knowledge, environmental sensitivity, and place attachment affect environmentally responsible behavior? An integrated approach for sustainable island tourism. J. Sustain. Tour. 2015, 23, 557–576. [Google Scholar] [CrossRef]
- Gillson, L.; Hoffman, M.; Gell, P.; Ekblom, A.; Bond, W.J. Trees, carbon, and the psychology of landscapes. Trends Ecol. Evol. 2024, 39, 359–367. [Google Scholar] [CrossRef] [PubMed]
- Klemm, W.; Heusinkveld, B.; Lenzholzer, S.; Van Hove, B. Street greenery and its physical and psychological impact on thermal comfort. Landsc. Urban Plan. 2015, 138, 87–98. [Google Scholar] [CrossRef]
- Dzhambov, A.M.; Lercher, P.; Browning, M.H.E.M.; Stoyanov, D.; Petrova, N.; Novakov, S.; Dimitrova, D.D. Does greenery experienced indoors and outdoors provide an escape and support mental health during the COVID-19 quarantine? Environ. Res. 2021, 196, 110420. [Google Scholar] [CrossRef]
- Kuliga, S.; Thrash, T.; Dalton, R.; Höelscher, C. Virtual reality as an empirical research tool—Exploring user experience in a real building and a corresponding virtual model. Comput. Environ. Urban Syst. 2015, 54, 363–375. [Google Scholar] [CrossRef]
- Liu, Y.; Hong, Z.; Zhu, J.; Yan, J.; Qi, J.; Liu, P. Promoting green residential buildings: Residents’ environmental attitude, subjective knowledge, and social trust matter. Energy Policy 2018, 112, 152–161. [Google Scholar] [CrossRef]
- Ha, J.; Kim, H.J.; With, K.A. Urban green space alone is not enough: A landscape analysis linking the spatial distribution of urban green space to mental health in the city of chicago. Landsc. Urban Plan. 2022, 218, 104309. [Google Scholar] [CrossRef]
- Li, X.; Zhang, X.; Jia, T. Humanization of nature: Testing the influences of urban park characteristics and psychological factors on collegers’ perceived restoration. Urban For. Urban Green. 2023, 79, 127806. [Google Scholar] [CrossRef]
- Ojala, A.; Korpela, K.; Tyrväinen, L.; Tiittanen, P.; Lanki, T. Restorative effects of urban green environments and the role of urban-nature orientedness and noise sensitivity: A field experiment. Health Place 2019, 55, 59–70. [Google Scholar] [CrossRef] [PubMed]
- Tyrväinen, L.; Ojala, A.; Korpela, K.; Lanki, T.; Tsunetsugu, Y.; Kagawa, T. The influence of urban green environments on stress relief measures: A field experiment. J. Environ. Psychol. 2014, 38, 1–9. [Google Scholar] [CrossRef]
- Li, S.; Walters, G.; Packer, J.; Scott, N. A comparative analysis of self-report and psychophysiological measures of emotion in the context of tourism advertising. J. Travel Res. 2018, 57, 1078–1092. [Google Scholar] [CrossRef]
- Scott, N.; Green, C.; Fairley, S. Investigation of the use of eye tracking to examine tourism advertising effectiveness. Curr. Issues Tour. 2016, 19, 634–642. [Google Scholar] [CrossRef]
- Aspinall, P.; Mavros, P.; Coyne, R.; Roe, J. The urban brain: Analysing outdoor physical activity with mobile EEG. Br. J. Sports Med. 2015, 49, 272–276. [Google Scholar] [CrossRef] [PubMed]
- Scott, N.; Zhang, R.; Le, D.; Moyle, B. A review of eye-tracking research in tourism. Curr. Issues Tour. 2019, 22, 1244–1261. [Google Scholar] [CrossRef]
- Savin, G.; Fleșeriu, C.; Batrancea, L. Eye tracking and tourism research: A systematic literature review. J. Vacat. Mark. 2022, 28, 285–302. [Google Scholar] [CrossRef]
- Alemdag, E.; Cagiltay, K. A systematic review of eye tracking research on multimedia learning. Comput. Educ. 2018, 125, 413–428. [Google Scholar] [CrossRef]
- Novák, J.Š.; Masner, J.; Benda, P.; Šimek, P.; Merunka, V. Eye Tracking, Usability, and User Experience: A Systematic Review. Int. J. Hum-Comput. Int. 2023, 39, 1–17. [Google Scholar] [CrossRef]
- Tao, Z. Research on the Degree of Coupling between the Urban Public Infrastructure System and the Urban Economic, Social, and Environmental System: A Case Study in Beijing, China. Math. Probl. Eng. 2019, 9, 8206902. [Google Scholar] [CrossRef]
- Skaramagkas, V.; Giannakakis, G.; Ktistakis, E.; Manousos, D.; Karatzanis, I.; Tachos, N.; Tripoliti, E.; Marias, K.; Fotiadis, D.I.; Tsiknakis, M. Review of eye tracking metrics involved in emotional and cognitive processes. IEEE Rev. Biomed. Eng. 2023, 16, 260–277. [Google Scholar] [CrossRef] [PubMed]
- Li, J.; Zhang, Z.; Jing, F.; Gao, J.; Ma, J.; Shao, G.; Noel, S. An evaluation of urban green space in Shanghai, China, using eye tracking. Urban For. Urban Green. 2020, 56, 126903. [Google Scholar] [CrossRef]
- Lin, W.; Zeng, C.; Bao, Z.; Jin, H. The therapeutic look up: Stress reduction and attention restoration vary according to the sky-leaf-trunk (SLT) ratio in canopy landscapes. Landsc. Urban Plan. 2023, 234, 104730. [Google Scholar] [CrossRef]
- Chen, B.; Gong, C.; Li, S. Looking at buildings or trees? association of human nature relatedness with eye movements in outdoor space. J. Environ. Psychol. 2022, 80, 101756. [Google Scholar] [CrossRef]
- Liu, L.; Qu, H.; Ma, Y.; Wang, K.; Qu, H. Restorative benefits of urban green space: Physiological, psychological restoration and eye movement analysis. J. Environ. Manag. 2022, 301, 113930. [Google Scholar] [CrossRef] [PubMed]
- Liu, F.; Kang, J.; Wu, Y.; Yang, D.; Meng, Q. What do we visually focus on in a World Heritage Site? A case study in the Historic Centre of Prague. Hum. Soc. Sci. Commun. 2022, 9, 400. [Google Scholar] [CrossRef]
- Box, G.E.P.; Wilson, K.B. On the Experimental Attainment of Optimum Conditions. J. R. Stat. Soc. B 1951, 13, 1–38. [Google Scholar] [CrossRef]
- Meloun, M.; Militký, J.; Hill, M.; Brereton, R.G. Crucial problems in regression modelling and their solutions. Analyst 2002, 127, 433–450. [Google Scholar] [CrossRef]
- Mäkelä, M. Experimental design and response surface methodology in energy applications: A tutorial review. Energ. Convers. Manag. 2017, 151, 630–640. [Google Scholar] [CrossRef]
- Ockuly, R.A.; Weese, M.L.; Smucker, B.J.; Edwards, D.J.; Chang, L. Response surface experiments: A meta-analysis. Chemometr. Intell. Lab. 2017, 164, 64–75. [Google Scholar] [CrossRef]
- Zhang, X.; Yu, S.; Gong, Y.; Li, Y. Optimization design for turbodrill blades based on response surface method. Adv. Mech. Eng. 2016, 8, 1. [Google Scholar] [CrossRef]
- Gao, C.X. Theory and applications of swarm intelligence. Neural Comput. Appl. 2012, 21, 205–206. [Google Scholar]
- Alam, M.D.; Hawas, Y.E. Multiobjective integrated signal-control system calibration in urban areas: Application of response surface methodology. Transp. Res. Interdiscip. Perspect. 2019, 1, 100011. [Google Scholar] [CrossRef]
- Meng, Y.; Li, Y.; Han, R.; Du, Z. Optimization of the process conditions for methane yield from co-digestion of mixed vegetable residues and pig manure using response surface methodology. Waste Biomass Valoriz. 2024, 15, 4117–4130. [Google Scholar] [CrossRef]
- Ji, K.F. Research on Landscape Design Strategy of Overhead Space Surroundings in Lingnan University Based on Thermal Comfort in Summer. Master’s Thesis, Guangzhou University, Guangzhou, China, 2023. [Google Scholar]
- Sun, S.B. Research on the Design Strategy of Urban Parks Based on Hot Climatic Adaptability. Ph.D. Thesis, Beijing Forestry University, Beijing, China, 2018. [Google Scholar]
- Bucher, C. Metamodels of optimal quality for stochastic structural optimization Christian Bucher. Probabilistic Eng. Mech. 2018, 54, 131–137. [Google Scholar] [CrossRef]
- Guo, M. Recognition and reconstruction of the historical development of chinese garden art system. J. Jiangnan Univ. 2015, 14, 110–114. (In Chinese) [Google Scholar]
- Wu, W.; Zhou, K.; Li, T.; Dai, X. Spatial configuration analysis of a traditional garden in yangzhou city: A comparative case study of three typical gardens. J. Asian Archit. Build. 2024, 23, 1–12. [Google Scholar] [CrossRef]
- Akpınar, A.; Barbosa-Leiker, C.; Brooks, K.R. Does green space matter? Exploring relationships between green space type and health indicators. Urban For. Urban Green. 2016, 20, 407–418. [Google Scholar] [CrossRef]
- Nausser, J.I. Framing the landscape in photographic simulation. J. Environ. Manag. 1982, 17, 1–16. [Google Scholar]
- Palmer, J.F.; Hoffman, R.E. Rating reliability and representation validity in scenic landscape assessments. Landsc. Urban Plan. 2001, 54, 149–161. [Google Scholar] [CrossRef]
- Dupont, L.; Antrop, M.; Van Eetvelde, V. Eye-tracking analysis in Landscape Perception Research: Influence of photograph properties and landscape characteristics. Landsc. Res. 2013, 39, 417–432. [Google Scholar] [CrossRef]
- Suppakittpaisarn, P.; Jiang, B.; Slavenas, M.; Sullivan, W.C. Does density of green infrastructure predict preference? Urban For. Urban Green. 2019, 40, 236–244. [Google Scholar] [CrossRef]
- Wang, X.; Rodiek, S.; Wu, C.; Chen, Y.; Li, Y. Stress recovery and restorative effects of viewing different urban park scenes in Shanghai, China. Urban For. Urban Green. 2016, 15, 112–122. [Google Scholar] [CrossRef]
- Waldheim, C.; Hansen, A.; Ackerman, J.S.; Corner, J.; Brunier, Y.; Kennard, P. Composite Landscapes: Photomontage and Landscape Architecture; Hatje Cantz: Ostfildern, Germany, 2014. [Google Scholar]
- Shi, Y.; Zhang, J.; Shen, X.; Chen, L.; Xu, Y.; Fu, R.; Su, Y.; Xia, Y. Designing Perennial Landscapes: Plant Form and Species Richness Influence the Gaze Perception Associated with Aesthetic Preference. Land 2022, 11, 1860. [Google Scholar] [CrossRef]
- Luo, H.; Deng, L.; Song, C.; Jiang, S.; Huang, Y.; Wang, W.; Liu, X.; Li, S.; Guo, B.; Peng, L.; et al. Which characteristics and integrations between characteristics in blue–green spaces influence the nature experience? J. Environ. Plan. Manag. 2022, 66, 1253–1279. [Google Scholar] [CrossRef]
- Shafer, E.L.; Hamilton, J.; Schmidt, E.A. Natural Landscape Preferences: A Predictive model. J. Leis. Res. 1969, 1, 1–19. [Google Scholar] [CrossRef]
- Maner, J.K.; Kenrick, D.T.; Becker, D.V.; Delton, A.W.; Hofer, B.; Wilbur, C.J.; Neuberg, S.L. Sexually selective cognition: Beauty captures the mind of the beholder. J. Personal. Soc. Psychol. 2003, 85, 1107–1120. [Google Scholar] [CrossRef]
- Sun, M.; Herrup, K.; Shi, B.E.; Hamano, Y.; Liu, C.; Goto, S. Changes in visual interaction: Viewing a Japanese garden directly, through glass or as a projected image. J. Environ. Psychol. 2018, 60, 116–121. [Google Scholar] [CrossRef]
- Dixson, B.J.; Grimshaw, G.M.; Ormsby, D.K.; Dixson, A.F. Eye-tracking women’s preferences for men’s somatotypes. Evol. Hum. Behav. 2014, 35, 73–79. [Google Scholar] [CrossRef]
- Leder, H.; Mitrovic, A.; Goller, J. How Beauty determines gaze! Facial attractiveness and gaze duration in images of real world scenes. I-Perception 2016, 7, 204166951666435. [Google Scholar] [CrossRef] [PubMed]
- Chamberlain, L. Eye tracking methodology_theory and practice. Qual. Mark. Res. 2007, 10, 217–220. [Google Scholar]
- Poole, A.; Ball, L.J. Eye Tracking in Human-Computer Interaction and Usability Research: Current Status and Future Prospects. In Encyclopedia of Human-Computer Interaction; Ghaoui, C., Ed.; Idea Group, Inc. Press: Hershey, PA, USA, 2006. [Google Scholar]
- Wang, P.; Yang, W.; Wang, D.; He, Y. Insights into Public Visual Behaviors through Eye-Tracking Tests: A Study Based on National Park System Pilot Area Landscapes. Land 2021, 10, 497. [Google Scholar] [CrossRef]
- Mohamed, A.A.; Kronenberg, J.; Łaszkiewicz, E.; Ali, F.A.; Mahmoud, S.; Abdelhameed, R. Parental perceived safety using PPGIS and photo survey across urban parks in cairo, egypt. Leis. Sci. 2023, 45, 1–24. [Google Scholar] [CrossRef]
- Ode, Å.; Fry, G.; Tveit, M.S.; Messager, P.; Miller, D. Indicators of perceived naturalness as drivers of landscape preference. J. Environ. Manag. 2009, 90, 375–383. [Google Scholar] [CrossRef] [PubMed]
- Dee, C. Form and Fabric in Landscape Architecture: A Visual Introduction; Spon Press: New York, NY, USA, 2003. [Google Scholar]
- Zarghami, E.; Karimimoshaver, M.; Ghanbaran, A.; SaadatiVaghar, P. Assessing the oppressive impact of the form of tall buildings on citizens: Height, width, and height-to-width ratio. Environ. Impact Assess. Rev. 2019, 79, 106287. [Google Scholar] [CrossRef]
- Hwang, T.; Yoshizawa, N.; Munakata, J.; Hirate, K. A study on the oppressive feeling caused by the buildings in urban space. J. Environ. Eng. (Trans. AIJ) 2007, 616, 25–30. (In Japanese) [Google Scholar] [CrossRef] [PubMed]
- Alexander, C.; Ishikawa, S.; Silverstein, M.; Jacobson, M.; Fiksdahl-King, I.; Shlomo, A. A Pattern Language; Oxford University Press: Oxford, UK, 1977. [Google Scholar]
- Tallar, R.Y.; Suen, J.P. Measuring the aesthetic value of multifunctional lakes using an enhanced visual quality method. Water 2017, 9, 233. [Google Scholar] [CrossRef]
- Smith, D.G.; Davies-Colley, R.J. Perception of water clarity and colour in terms of suitability for recreational use. J. Environ. Manag. 1992, 36, 225–235. [Google Scholar] [CrossRef]
- Palmer, S.E.; Schloss, K.B. An ecological valence theory of human color preference. Proc. Natl. Acad. Sci. USA 2010, 107, 8877–8882. [Google Scholar] [CrossRef]
- Nordh, H.; Hartig, T.; Hagerhall, C.M.; Fry, G. Components of small urban parks that predict the possibility for restoration. Urban For. Urban Green. 2009, 8, 225–235. [Google Scholar] [CrossRef]
- Jiang, B.; Chang, C.; Sullivan, W. A dose of nature: Tree cover, stress reduction, and gender differences. Landsc. Urban Plan. 2014, 132, 26–36. [Google Scholar] [CrossRef]
- De la Fuente Suárez, L.A. Subjective experience and visual attention to a historic building: A real-world eye-tracking study. Front. Archit. Res. 2020, 9, 744–804. [Google Scholar] [CrossRef]
- Luo, J.; Zhao, T.; Cao, L.; Biljecki, F. Water View Imagery: Perception and evaluation of urban waterscapes worldwide. Ecol. Indic. 2022, 145, 109615. [Google Scholar] [CrossRef]
- Ode, A.; Hagerhall, C.M.; Sang, N. Sang Analysing visual landscape complexity: Theory and application. Landsc. Res. 2010, 35, 111–131. [Google Scholar] [CrossRef]
- Ode, A.; Miller, D. Analysing the relationship between indicators of landscape complexity and preference. Environ. Plan. B 2011, 38, 24–40. [Google Scholar] [CrossRef]
- Xu, W.; Zhao, J.; Huang, Y.; Hu, B. Design intensities in relation to visual aesthetic preference. Urban For. Urban Green. 2018, 34, 305–310. [Google Scholar] [CrossRef]
- Deng, L.; Luo, H.; Ma, J.; Huang, Z.; Sun, L.; Jiang, M.; Zhu, C.; Li, X. Effects of integration between visual stimuli and auditory stimuli on restorative potential and aesthetic preference in urban green spaces. Urban For. Urban Green. 2020, 53, 126702. [Google Scholar] [CrossRef]
- Gao, C.; Iqbal, J. An empirical study of Thailand cities’ color landscapes. Heliyon 2023, 9, 17558. [Google Scholar] [CrossRef]
- Lin, W.; Mu, Y.; Zhang, Z.; Wang, J.; Diao, X.; Lu, Z.; Guo, W.; Wang, Y.; Xu, B. Research on cognitive evaluation of forest color based on visual behavior experiments and landscape preference. PLoS ONE 2022, 17, 0276677. [Google Scholar] [CrossRef] [PubMed]
- Zhang, R. Integrating ergonomics data and emotional scale to analyze people’s emotional attachment to different landscape features in the Wudaokou Urban Park. Front. Archit. Res. 2023, 12, 175–187. [Google Scholar] [CrossRef]
- Li, H.; Browning, M.; Rigolon, A.; Larson, L.; Taff, D.; Labib, S.; Benfield, J.; Yuan, S.; McAnirlin, O.; Hatami, N.; et al. Beyond “bluespace” and “greenspace”: A narrative review of possible health benefits from exposure to other natural landscapes. Sci. Total Environ. 2023, 856, 159292. [Google Scholar] [CrossRef] [PubMed]
- Ottosson, J.; Grahn, P. Nature archetypes—Concepts related to objects and phenomena in natural environments. A swedish case. Front. Psychol. 2021, 11, 612672. [Google Scholar] [CrossRef] [PubMed]
- Marselle, M.; Hartig, T.; Cox, D.; de Bell, S.; Knapp, S.; Lindley, S.; Triguero-Mas, M.; Böhning-Gaese, K.; Braubach, M.; Cook, P.; et al. Pathways linking biodiversity to human health: A conceptual framework. Environ. Int. 2021, 150, 106420. [Google Scholar] [CrossRef] [PubMed]
- Asgarzadeh, M.; Koga, T.; Yoshizawa, N.; Munakata, J.; Hirate, K. Investigating green urbanism; building oppressiveness. J. Asian Archit. Build. 2010, 9, 555–562. [Google Scholar] [CrossRef]
- Wang, Y.; Wang, S.; Xu, M. The Function of Color and Structure Based on EEG Features in Landscape Recognition. Int. J. Environ. Res. Public Health 2021, 18, 4866. [Google Scholar] [CrossRef]
- Duan, J.; Wang, Y.; Fan, C.; Xia, B.; De Groot, R. Perception of urban environmental risks and the effects of urban green infrastructures (UGIs) on human well-being in four public green spaces of Guangzhou, China. Environ. Manag. 2018, 62, 500–517. [Google Scholar] [CrossRef]
- Wu, L.; Kim, S.K. Health outcomes of urban green space in China: Evidence from Beijing. Sustain. Cities Soc. 2021, 65, 102604. [Google Scholar] [CrossRef]
- Berto, R.; Massaccesi, S.; Pasini, M. Do eye movements measured across high and low fascination photographs differ? Addressing Kaplan’s fascination hypothesis. J. Environ. Psychol. 2008, 28, 185–191. [Google Scholar] [CrossRef]
- Gungor, S.; Polat, A.T. Relationship between visual quality and landscape characteristics in urban parks. J. Environ. Prot. Ecol. 2018, 19, 939–948. [Google Scholar]
- Qin, B.; Zhu, W.; Wang, J.; Peng, Y. Understanding the relationship between neighbourhood green space and mental wellbeing: A case study of Beijing, China. Cities 2021, 109, 103039. [Google Scholar] [CrossRef]


| Number | Greenery Ratio (%) | B Number of Buildings | C Water Saturation (%) |
|---|---|---|---|
| −1 | 50 | 2 | 40 |
| 0 | 60 | 3 | 50 |
| 1 | 70 | 4 | 60 |
| Number | A Greenery Ratio (%) | B Number of Buildings | C Water Saturation (%) | Combination (Fixation Count) |
|---|---|---|---|---|
| 1 | −1 (50%) | −1 (2) | 0 (50%) | 14 |
| 2 | 1 (70%) | −1 (2) | 0 (50%) | 13.3 |
| 3 | −1 (50%) | 1 (4) | 0 (50%) | 13.5 |
| 4 | 1 (70%) | 1 (4) | 0 (50%) | 12.8 |
| 5 | −1 (50%) | 0 (3) | −1 (40%) | 15.1 |
| 6 | 1 (70%) | 0 (3) | −1 (40%) | 14.5 |
| 7 | −1 (50%) | 0 (3) | 1 (60%) | 14.8 |
| 8 | 1 (70%) | 0 (3) | 1 (60%) | 14.3 |
| 9 | 0 (60%) | −1 (2) | −1 (40%) | 13.2 |
| 10 | 0 (60%) | 1 (4) | −1 (40%) | 12.8 |
| 11 | 0 (60%) | −1 (2) | 1 (60%) | 13 |
| 12 | 0 (60%) | 1 (4) | 1 (60%) | 12.6 |
| 13 | 0 (60%) | 0 (3) | 0 (50%) | 17.9 |
| 14 | 0 (60%) | 0 (3) | 0 (50%) | 17.8 |
| 15 | 0 (60%) | 0 (3) | 0 (50%) | 17.7 |
| 16 | 0 (60%) | 0 (3) | 0 (50%) | 17.9 |
| 17 | 0 (60%) | 0 (3) | 0 (50%) | 17.9 |
| Sources of Variance | Sum of Squares | Degrees of Freedom | Mean Square | F-Value | p-Value |
|---|---|---|---|---|---|
| Model | 69.71 | 9 | 7.75 | 1095.30 | <0.0001 ** |
| A | 0.78 | 1 | 0.78 | 110.48 | <0.0001 ** |
| B | 0.41 | 1 | 0.41 | 57.27 | <0.0001 ** |
| C | 0.10 | 1 | 0.10 | 14.32 | 0.0069 |
| AB | 0.000 | 1 | 0.000 | 0.000 | 1.0000 |
| AC | 2.500 × 10⁻³ | 1 | 2.500 × 10⁻³ | 0.35 | 0.5708 |
| BC | 0.000 | 1 | 0.000 | 0.000 | 1.0000 |
| A2 | 7.48 | 1 | 7.48 | 1057.22 | <0.0001 ** |
| B2 | 40.66 | 1 | 40.66 | 5749.78 | <0.0001 ** |
| C2 | 14.14 | 1 | 14.14 | 1999.48 | <0.0001 ** |
| Residuals | 0.049 | 7 | 7.071 × 10⁻³ | ||
| Lack-of-fit terms | 0.017 | 3 | 5.833 × 10⁻³ | 0.73 | 0.5860 |
| Pure error | 0.032 | 4 | 8.000 × 10⁻³ | ||
| Total variation | 69.76 | 16 |
Disclaimer/Publisher’s Note: The statements, opinions and data contained in all publications are solely those of the individual author(s) and contributor(s) and not of MDPI and/or the editor(s). MDPI and/or the editor(s) disclaim responsibility for any injury to people or property resulting from any ideas, methods, instructions or products referred to in the content. |
© 2024 by the authors. Licensee MDPI, Basel, Switzerland. This article is an open access article distributed under the terms and conditions of the Creative Commons Attribution (CC BY) license (https://creativecommons.org/licenses/by/4.0/).
Share and Cite
Wang, X.; Che, B.; Lou, Q.; Zhu, R. Integrated Eye-Tracking Response Surface Analysis to Optimize the Design of Garden Landscapes. Land 2024, 13, 1045. https://doi.org/10.3390/land13071045
Wang X, Che B, Lou Q, Zhu R. Integrated Eye-Tracking Response Surface Analysis to Optimize the Design of Garden Landscapes. Land. 2024; 13(7):1045. https://doi.org/10.3390/land13071045
Chicago/Turabian StyleWang, Xinman, Baoqi Che, Qi Lou, and Rong Zhu. 2024. "Integrated Eye-Tracking Response Surface Analysis to Optimize the Design of Garden Landscapes" Land 13, no. 7: 1045. https://doi.org/10.3390/land13071045
APA StyleWang, X., Che, B., Lou, Q., & Zhu, R. (2024). Integrated Eye-Tracking Response Surface Analysis to Optimize the Design of Garden Landscapes. Land, 13(7), 1045. https://doi.org/10.3390/land13071045