Article

Dynamic Replacement of Soil Inorganic Carbon under Water Erosion

1
Kunming General Survey of Natural Resources Center China Geological Survey, Kunming 650100, China
2
Technology Innovation Center for Natural Ecosystem Carbon Sink, Ministry of Natural Resources, Kunming 650100, China
*
Author to whom correspondence should be addressed.
Land 2024, 13(7), 1053; https://doi.org/10.3390/land13071053
Submission received: 23 May 2024 / Revised: 27 June 2024 / Accepted: 11 July 2024 / Published: 14 July 2024

Abstract

:
The dynamic replacement of soil organic carbon represents a pivotal mechanism through which water erosion modulates soil–atmosphere CO2 fluxes. However, the extent of this dynamic replacement of soil inorganic carbon within this process remains unclear. In our study, we focused on Yuanmou County, China, a prototypical region afflicted by water erosion, as our study area. We leveraged the WaTEM/SEDEM model to quantify the dynamic replacement of soil carbon, accounted for the average annual net change in soil carbon pools, and used isotope tracer techniques to track and measure the process of the coupled carbon–water cycling. This comprehensive approach enabled us to scrutinize the dynamic replacement of soil carbon under water erosion and delineate its ramifications for the carbon cycle. Our findings unveiled that the surface soil carbon reservoir in the Yuanmou area receives an annual replacement of 47,600 ± 12,600 tons following water erosion events. A substantial portion, amounting to 39,700 ± 10,500 tons, stems from the dynamic replacement of soil inorganic carbon facilitated by atmospheric carbon. These results underscore the critical role of the dynamic replacement of soil inorganic carbon in altering the soil–atmosphere CO2 fluxes under water erosion, thereby influencing the carbon cycle dynamics. Consequently, we advocate for the integration of water erosion processes into regional carbon sink assessments to attain a more comprehensive understanding of regional carbon dynamics.

1. Introduction

Terrestrial ecosystem carbon is significantly mobilized into rivers [1,2,3,4,5,6,7,8,9], and its flux (3.16 Pg C yr−1) [1] surpasses even the global terrestrial carbon sink (3.1 ± 0.6 Pg C yr−1) [10]. Water erosion and karst dissolution are the two primary contributors to riverine carbon [2,3]. Atmospheric carbon sequestered via carbonate rock weathering is transported via rivers to the ocean [11,12], exerting a significant carbon sink influence on 10–100-year timescales [13]. Karstic carbon sinks are explicitly acknowledged in the IPCC-AR5 report [14,15]. In contrast, the net carbon status of water erosion remains contentious [16,17,18,19,20].
The water erosion process significantly influences soil–atmosphere CO2 fluxes [21], with profound implications for the global carbon cycle. During water erosion, eroded soil organic carbon undergoes replenishment via plant inputs and the decomposition of apoplastic materials, representing a dynamic replacement of soil organic carbon [22,23]. The eroded soils are transported to new sites for deposition. Transportation exacerbates soil carbon emissions [22,23,24,25,26], while deposition constrain soil carbon emissions [27]. Drawing on the theory of dynamic soil organic carbon turnover under water erosion, Van Oost et al. [16] evaluated that global soil erosion yields a net carbon sink of 0.12 Pg C yr−1. Meanwhile, Yue et al. [17] estimated that soil erosion in China over the past three decades has resulted in a net carbon sink of 45 ± 25 Tg C yr−1. Conversely, soil inorganic carbon constitutes a significant component of the soil carbon pool, particularly in arid and semi-arid regions (41% of the Earth’s land surface area) [28,29] and carbonate-rich regions [30,31], where substantial amounts of soil inorganic carbon are lost via water erosion into rivers. While soil organic carbon has traditionally been regarded as slow turnover and difficult to dynamically replenish, minimally contributing to the contemporary carbon cycle [32,33], mounting evidence suggests that soil inorganic carbon constitutes a dynamic carbon pool [34]. The extent to which soil inorganic carbon undergoes dynamic replacement under water erosion remains uncertain yet holds significance for assessing the net carbon sink impact of water erosion.
Established studies have labeled erosion rates primarily by 137Cs and have used models to indirectly calculate the dynamic replacement of soil carbon—under the implicit assumption that soils do not lead to changes in carbon during transport and deposition—and have ignored the dynamics of soil inorganic carbon [16,17]. In this study, we selected Yuanmou County, a typical dry and hot river valley area in China. First, we estimated the average annual net change in soil carbon pools based on the latest field survey data and used the spatially distributed sediment transport model WaTEM/SEDEM to simulate the net soil carbon erosion due to water erosion, which directly quantified the dynamic replacement of soil carbon. Second, we used isotope-tracing techniques to track and measure the coupled hydrocarbon cycling process, and then especially explored the dynamic replacement of soil inorganic carbon under water erosion and its significance to the carbon cycle.

2. Materials and Methods

2.1. Study Area

A detailed case study was undertaken in Yuanmou County, located within Yunnan Province, positioned in the middle and lower segments of the Longchuan River Basin. This basin represents a primary tributary of the Jinsha River in China, spanning geospatial coordinates ranging from 25°23′ to 26°06′ N and from 101°25′ to 102°06′ E, with a total area of approximately 2025.58 square kilometers (Figure 1A,B). Characterized by a dry and warm river valley climate, the region exhibits an average annual temperature of 22 °C, marked by pronounced disparities between precipitation and evaporation rates. The ecological landscape is fragile, typified by sparse vegetation cover and severe soil erosion. Geologically, the area features partially exposed stratigraphy, primarily comprising fluvial and lacustrine sediments that progressively accumulated within the basin amid tectonic fractures and subsidence events. This basin is characterized as non-karstic. The study locale encompassed diverse soil types, including red, yellow-brown, paddy, purple, brown, and dry red soils (Figure 1C).

2.2. Methods

Soil erosion results in aggregate carbon sequestration via the reformation of organic–inorganic complexes in depositional areas and plant reserves [2,10,27,28]. It is widely recognized that soil erosion results in a significant loss of soil carbon. The dynamic replacement of soil carbon reduces this loss, and this negative emission is regarded as a carbon sink. Considering that the study area has been in a phase of ecological revegetation in recent decades, no anthropogenic damage has led to large-scale soil disturbance. We delineate the dynamic replenishment of soil carbon ensuing from water erosion by discerning the discrepancy between the net soil carbon erosion and the aggregate loss of soil carbon pools, as expounded in Equation (1):
Cdr = Closs − ΔC
where Cdr is the dynamic replacement of the soil carbon, Closs is the net soil carbon erosion, and ΔC is the net loss of soil carbon pools.
In the study area, a positive Cdr value indicated a negative emission, i.e., the dynamic replacement of soil carbon; a Cdr of zero indicated no dynamic replacement of soil carbon; and a negative Cdr value indicated other mechanisms causing a significant loss of soil carbon. We utilized the WaTEM/SEDEM model to quantify the net soil carbon erosion (Closs) ([35]; Supplementary File 1). WaTEM/SEDEM is a spatial distribution model that can simulate soil loss and deposition rates and thus estimate the net flux of sediment across the landscape [36,37,38,39,40,41,42]. Its integration of the revised universal soil loss equation (RUSLE) parameters enables the incorporation of soil and cover effects into the computation of net erosion and deposition, thereby mitigating the uncertainties associated with predicting carbon fluxes by modeling net soil erosion values and employing data-driven assumptions to evaluate carbon transport. We leveraged the carbon content data derived from soil samples procured for laboratory analysis in 2022 and 2020 in Yuanmou County to separately assess the carbon stocks in distinct soil types ([43,44,45,46]; Supplementary File 2) and subsequently computed alterations in the average annual soil carbon pool (ΔC).
The transport and conversion processes of soil carbon erosion are highly coupled with the water cycle. Although river water carbon primarily originates from soil erosion inputs, stable carbon isotopes denote it as a blend of atmospheric carbon and plant carbon fractionated via photosynthesis. Organic carbon is considered plant-derived carbon, despite mineralization and remobilization processes potentially contributing to its conversion into inorganic carbon [47,48]. Additionally, river water may contain particulate inorganic carbon (PIC) that does not actively participate in the modern carbon cycle [49]. We distinguished and quantified the dynamic replacement of soil organic and inorganic carbon in the study area based on observed values of carbon in field streams using isotope tracer techniques and the hybrid end-element method [50], as expounded in Equation (2):
δ C Water 13 = a δ C In 13 + b δ C Or 13 a + b = 1
where δ13Cwater is the river water or soil δ13C value, δ13CIn is the atmospheric source inorganic carbon δ13C value, a is the proportion of atmospheric source inorganic carbon in the water body, δ13COr is the average plant organic carbon δ13C value, and b is the proportion of plant organic carbon in the water body.

2.3. Data Sources and Processing

2.3.1. WaTEM/SEDEM Model Use Data

Various model input data were assembled when evaluating net soil carbon erosion within the study area: Land use data were acquired from the global 30 m surface cover dataset (http://www.globallandcover.com/, accessed on 17 October 2022); digital elevation model (DEM) data were procured from the geospatial data cloud (http://www.gscloud.cn/, accessed on 17 October 2022) at a resolution of 30 m × 30 m. The management factor C-value, indicative of the vegetation cover, was computed utilizing vegetation cover data [51]. The soil erodibility factor K-value (t·h/(MJ·mm)) was determined following the methodology proposed by Williams et al. [52], incorporating soil organic carbon content and soil texture data [53]. Additionally, data on the flow production process from 24 standard monitoring plots within the Jinlei Soil and Water Conservation Science and Technology Demonstration Park, spanning the years 2020 and 2021, were collated. These data were instrumental in calculating K-values for the plots and refining the outcomes of model computations. The computed erodibility K-values corresponding to different soil types within the study area were integrated into the attribute table of the soil type map of Yunnan Province to generate a spatially resolved soil K-value distribution map. The rainfall erosivity factor (R-value) was derived by aggregating day-by-day precipitation data from the meteorological station in Yuanmou County [54]. Subsequently, spatially localized interpolation (Kriging) techniques were employed to produce a distribution map of the R-factor. Furthermore, P-values associated with soil and water conservation measures were assigned based on land-type classifications drawn from previous research findings [55,56]. Data concerning soil bulk weight and the distribution of soil species, pivotal for quantifying the net loss of soil carbon pools, were sourced from the Soil Science Data Center at the Institute of Soil Science, the Chinese Academy of Sciences (http://data.issas.ac.cn/, accessed on 17 September 2022).

2.3.2. Observed Data

Soil Samples

A five-point method was employed for soil sampling from the 0–20 cm layer, involving collection from the four corners and center points of a 10 m × 10 m sample plot, with the five samples amalgamated into a composite sample. In 2020, mechanical grid points were spaced at 1 km intervals. In 2022, sampling points were strategically positioned, considering factors such as elevation, vegetation cover, soil type, and the natural geographic environment within the study area. A total of 512 soil samples were collected in 2020, while 203 soil samples were gathered in 2022 (Figure 1C). After air-drying, sieving, and the removal of extraneous matter such as plant roots and residues, the samples underwent laboratory analysis to determine soil organic carbon (SOC) and total carbon (TC) contents using an elemental analyzer (Thermo Fisher Scientific, Waltham, MA, USA).

Carbon Isotope Determination in Water Samples

Forty-five water samples for carbon isotope determination were collected monthly along the main channel and reservoirs from May to October 2022 (Figure 1D). The water samples were filtered using a 0.45 μm acetate membrane and sealed in clean 500 mL polyvinyl fluoride bottles, pre-washed three times with raw water. The water sample 13C isotope was used as the V-PDB standard. A MAT253 Plus gas isotope mass spectrometer (Finnigan, Munich, Germany) was utilized, with an analytical error of <0.15‰(1σ). Dissolved organic carbon (DOC) and dissolved inorganic carbon (DIC) contents were assessed using a total organic carbon analyzer (TOC-VCPH/CPN, Shimadzu, Kyoto, Japan), with the detection limit for both DOC and DIC at 0.4 μg L−1 and relative deviations of 0.5–3.0%. The particulate organic carbon content was determined using a combined C-N analyzer (high-temperature TOC/TNb analyzer; Vario MAX CN, Langenselbold, Germany). The particulate inorganic carbon (PIC) content was determined using a multi-purpose online gas preparation coupled with a stable isotope mass spectrometer (Gas Bench II-IRMS, IRMS model Delta V Advantage; Thermo Fisher Scientific, USA).

Carbon Isotope Determination in Soil Samples and Vegetation Cover Survey

The soil sampling points for carbon isotope determination were chosen based on the varying ground vegetation cover (Figure 1E) from July through September 2022. The same methodology described in the “Soil Samples” section for soil sampling was used, and 57 samples were taken in total. Carbon isotope analysis was conducted using a Delta XP Plus gas-stable isotope mass spectrometer (Thermoelectric Corporation, Chicago, IL, USA), connected to a Flash 1200 Elemental Analyzer/Conflo-III (Thermo Fisher Scientific, USA).
The vegetation cover where soil carbon isotopes were collected was also investigated. A 10 × 10 m survey quadrat was established to document all tree species, measure their diameter at breast height (DBH), and record the species cover for plants with a DBH of ≥3 cm. Additionally, two diagonal 1 × 1 m subplots were established within each tree sample quadrat to record the species, basal diameter, height, and species cover for each shrub. Two 1 × 1 m herbaceous sample squares were set up within each shrub sample plot to record the herbaceous species, trees, height, and species cover.

2.4. Statistical Analysis

The soil erosion simulations conducted using the WaTEM/SEDEM model were classified based on the Soil Erosion Classification and Grading Standard (SL190-2007) [57]. Subsequently, the variability and interrelation between distinct erosion intensities and the soil carbon content were scrutinized via statistical analysis. These analytical procedures were executed utilizing SPSS 24 (IBM SPSS Corp., Chicago, IL, USA), ArcGIS 10.8, and the R programming language. Analysis of variance (ANOVA) was employed to ascertain significant disparities within the dataset. In addition, we used linear analysis to statistically relate soil carbon isotopes to vegetation cover.

3. Results

3.1. Dynamic Replacement of Soil Carbon under Water Erosion

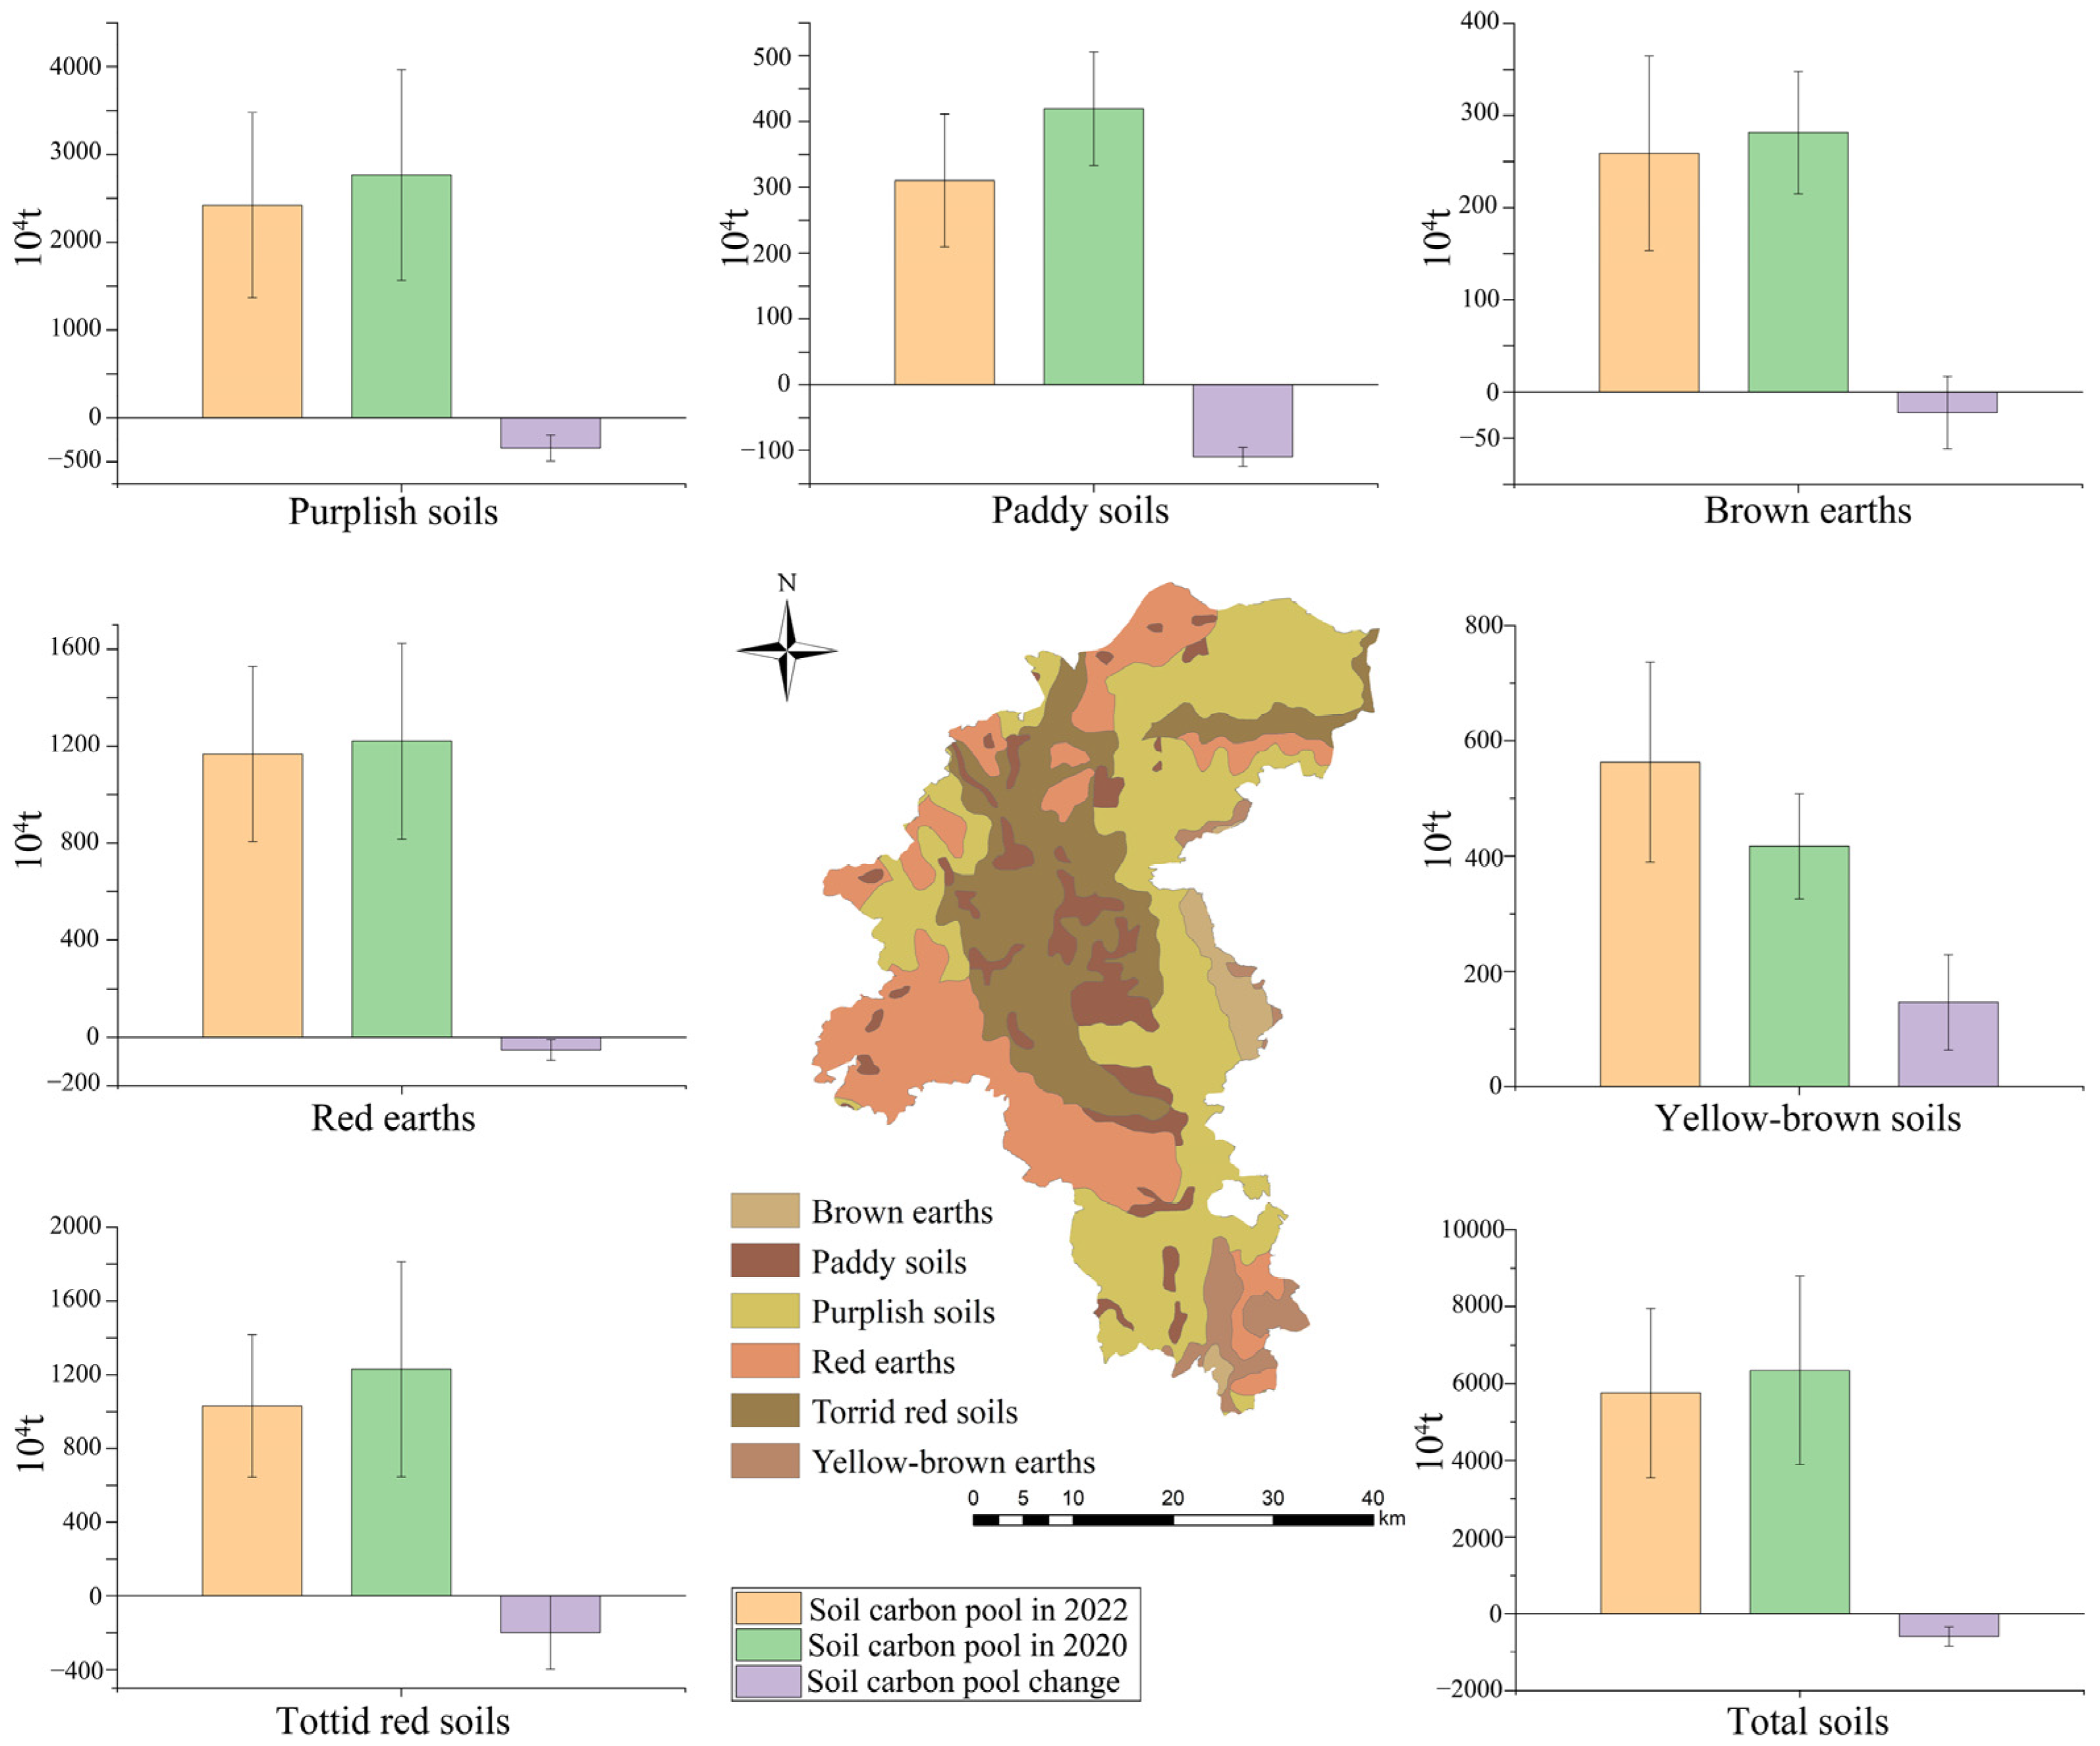
Firstly, the net loss of soil carbon pools (ΔC) was analyzed using soil carbon content data collected from the study area in 2020 and 2022 to assess the dynamic replacement of soil carbon (Figure S1). The findings demonstrate a total decrease of 58,200 ± 25,200 tons in the surface soil carbon pool within Yuanmou County between these two years, indicating an average annual net carbon loss of 29,100 ± 12,600 tons (Figure 2).
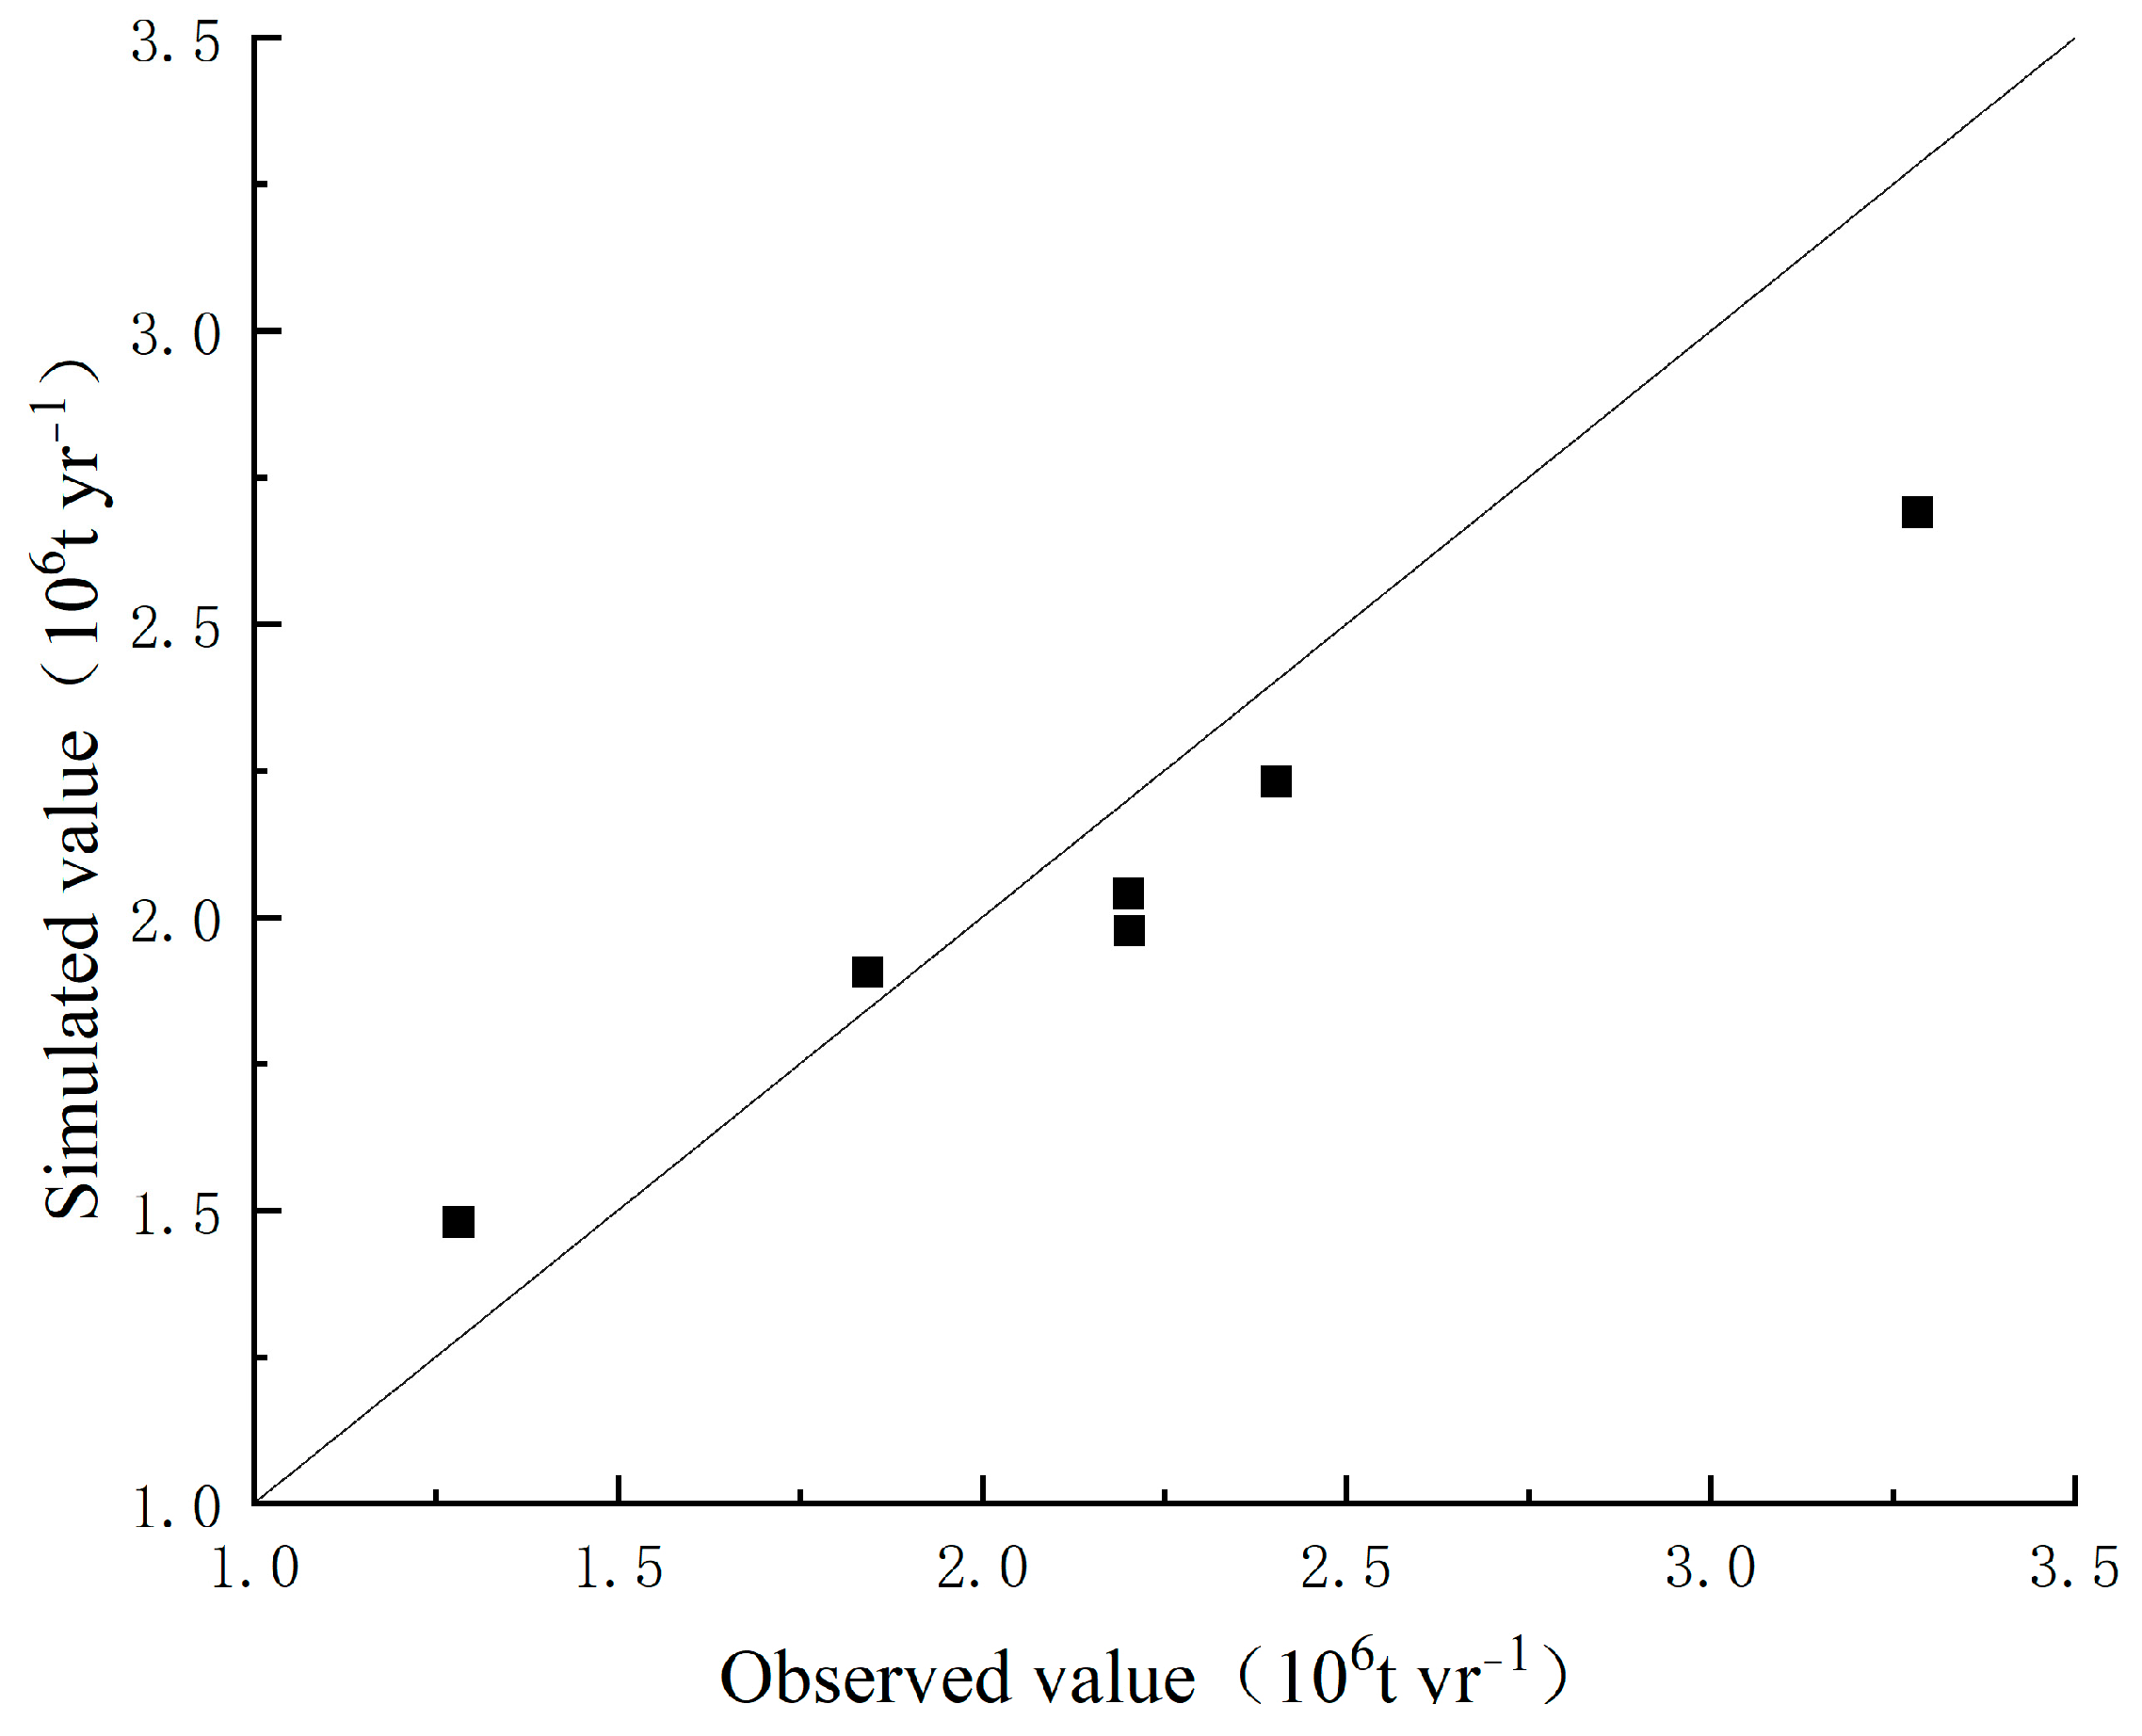
Secondly, the WaTEM/SEDEM model underwent rigorous calibration and validation processes in the quantification of the net carbon erosion of soil using the sediment transport data obtained from the hydrological station situated at the Longchuan River outlet, Xiaohuangguayuan. The sand transport capacity coefficients Ktclow and Ktchigh represent critical parameters within the model and were adjusted within an anticipated range using a trial-and-error approach. Predicted sand transport values were derived via the simulation of the soil erosion dynamics within the Longchuan River Basin spanning 2003, 2004, and 2005. A comparative analysis between these predictions and observed measurements facilitated the computation of the Nash efficiency coefficient (NS) and root mean square error (RMSE) indices. The model accuracy was further validated by simulating soil erosion in the Longchuan River Basin, Yuanmou County, for the years 2006, 2007, and 2008 using both 70 m and 200 m resolutions, followed by comparison with observed values (Figure 3; Table 1). An optimal model performance was achieved when setting the Ktclow value at 70 m and the Ktchigh value at 200 m, yielding a maximum NS coefficient of 0.79 and an RMSE value of 0.20, indicative of superior simulation accuracy.
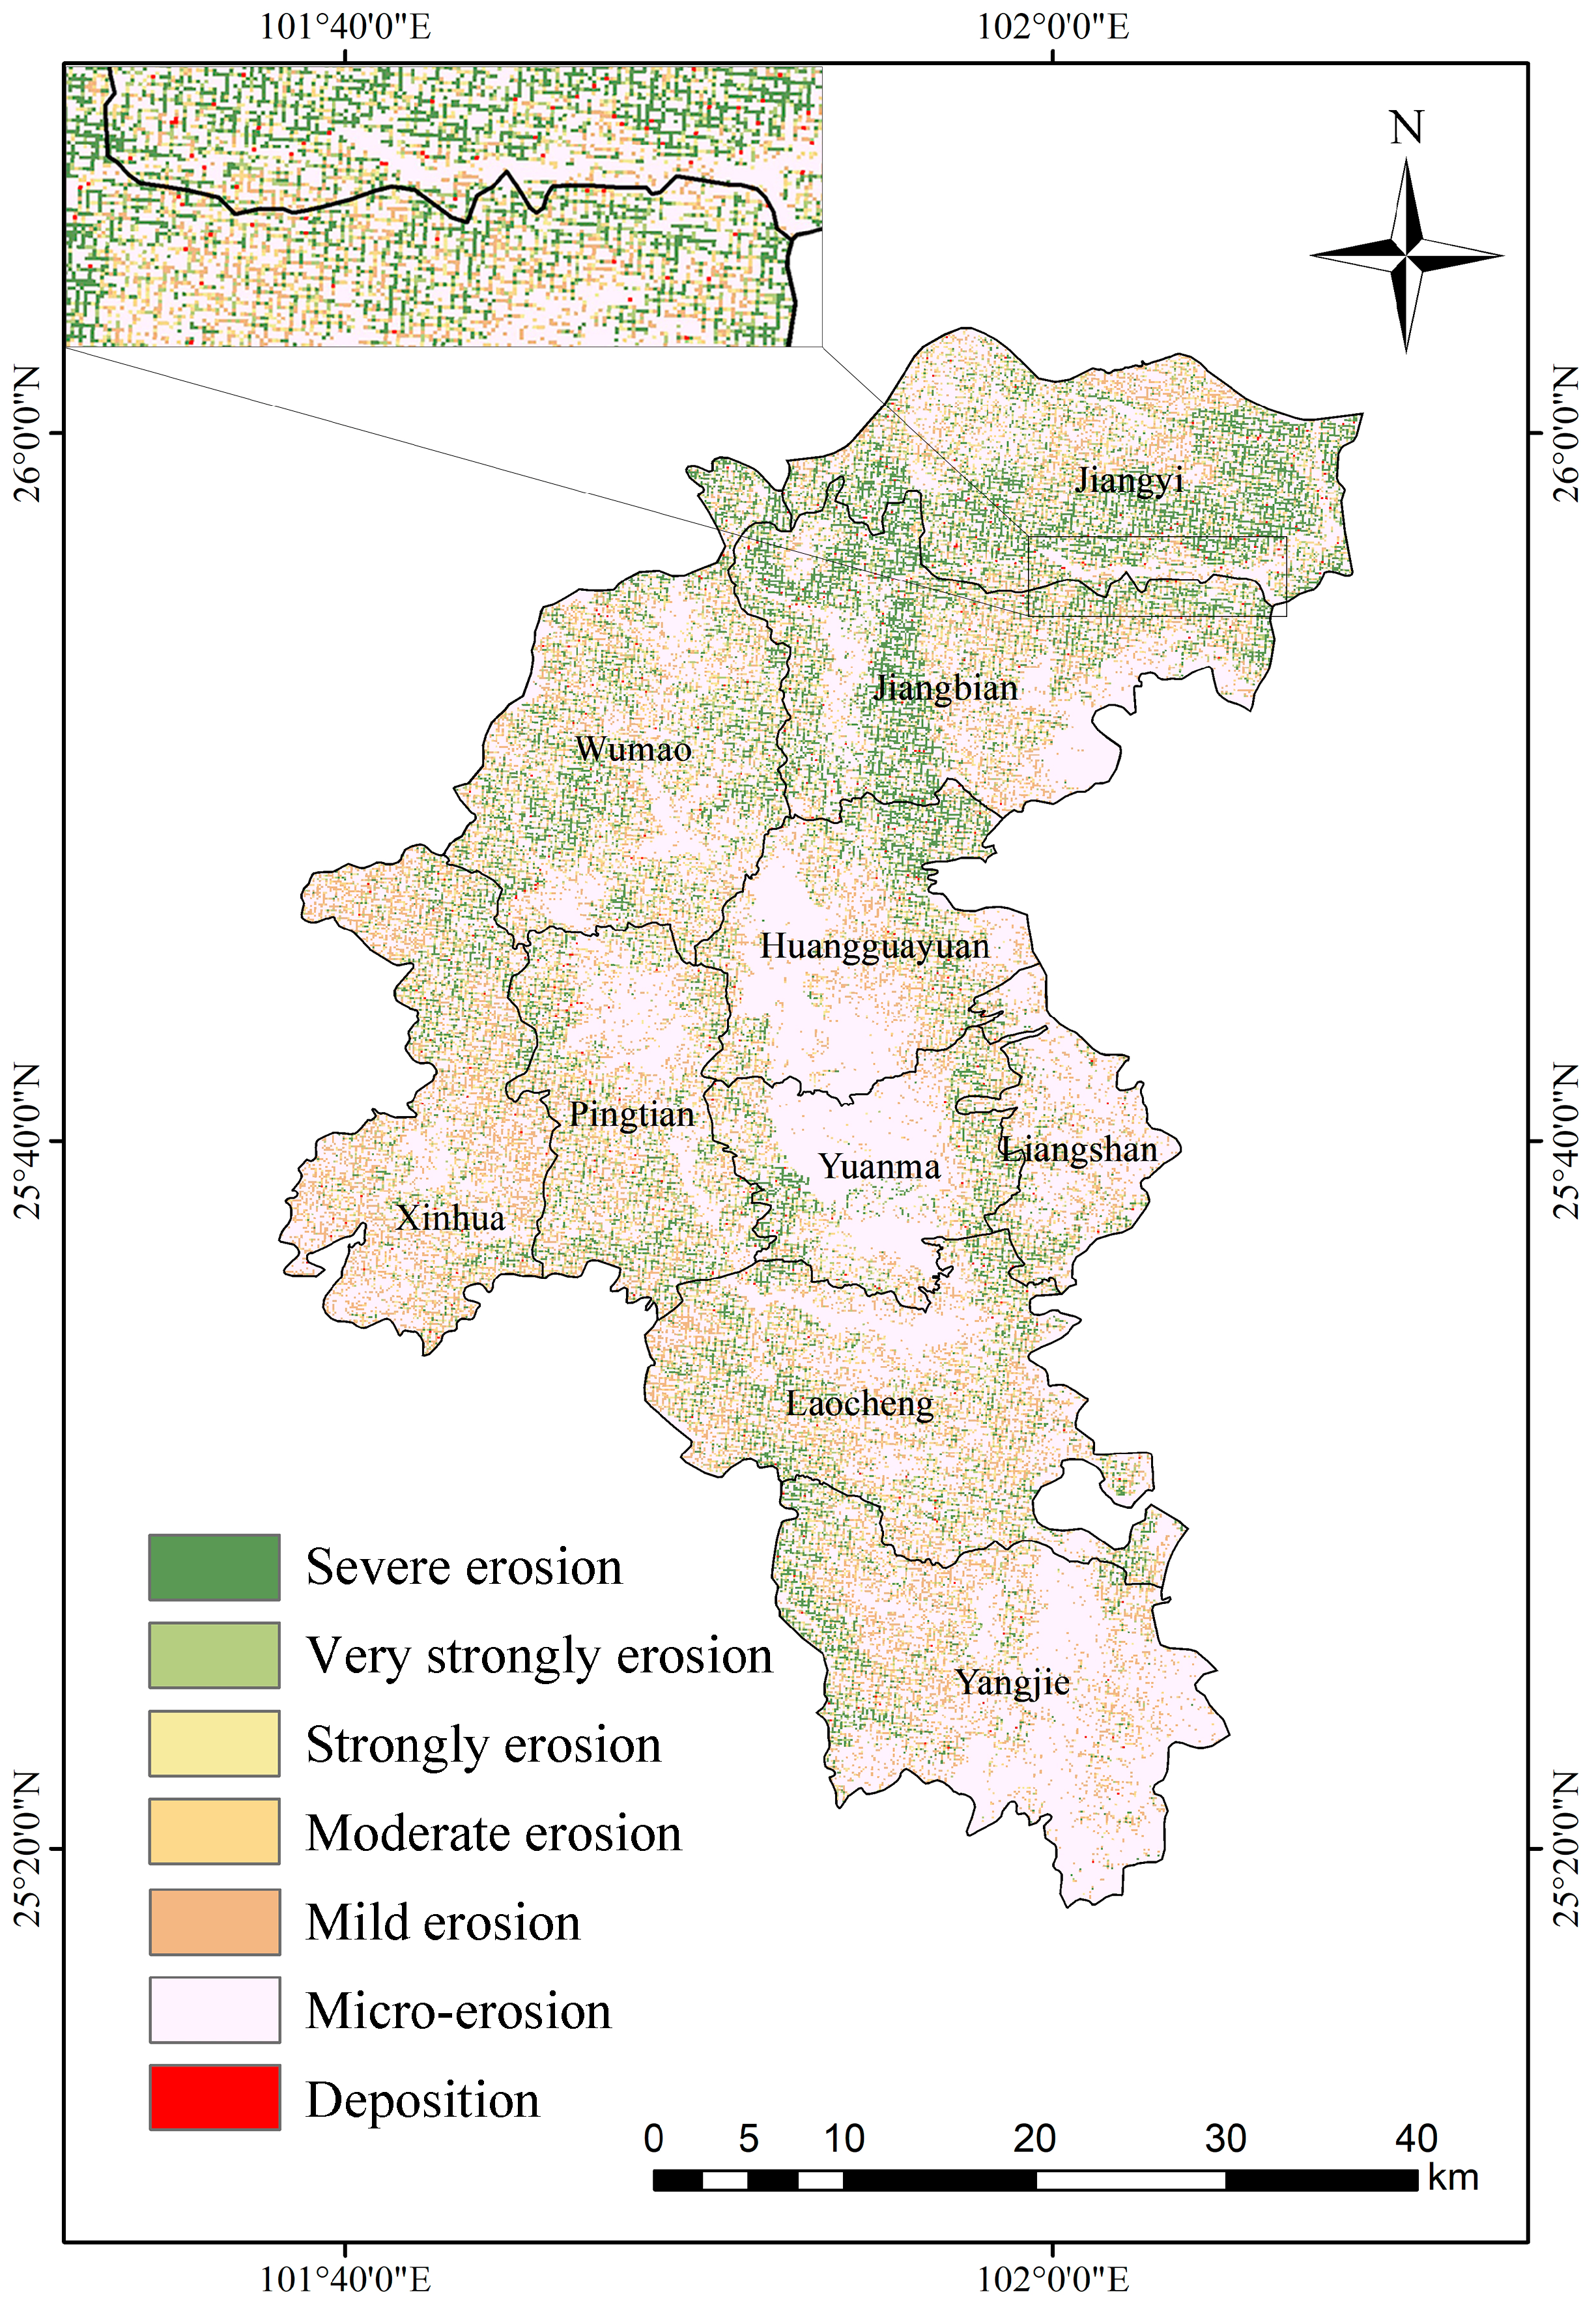
The model estimated an annual soil sand production of 16.65 million tons in Yuanmou County, with 9.76 million tons deposited and 6.89 million tons net lost. The geographic delineation of water erosion intensity zones, as per the SL190-2007 [57] classification standard, indicated low-intensity erosion in most areas, with areas of intense erosion concentrated on both sides of the rivers in the territory (Figure 4). Specifically, water erosion led to a net carbon erosion of 76,700 tons/year from the surface soil, exhibiting a positive correlation between the soil carbon erosion intensity and soil erosion intensity.
Finally, calculations using public Equation (1) determined the dynamic replacement of soil carbon as 47,600 ± 12,600 tons of carbon/year.

3.2. Soil Erosion and Soil Carbon Relationship

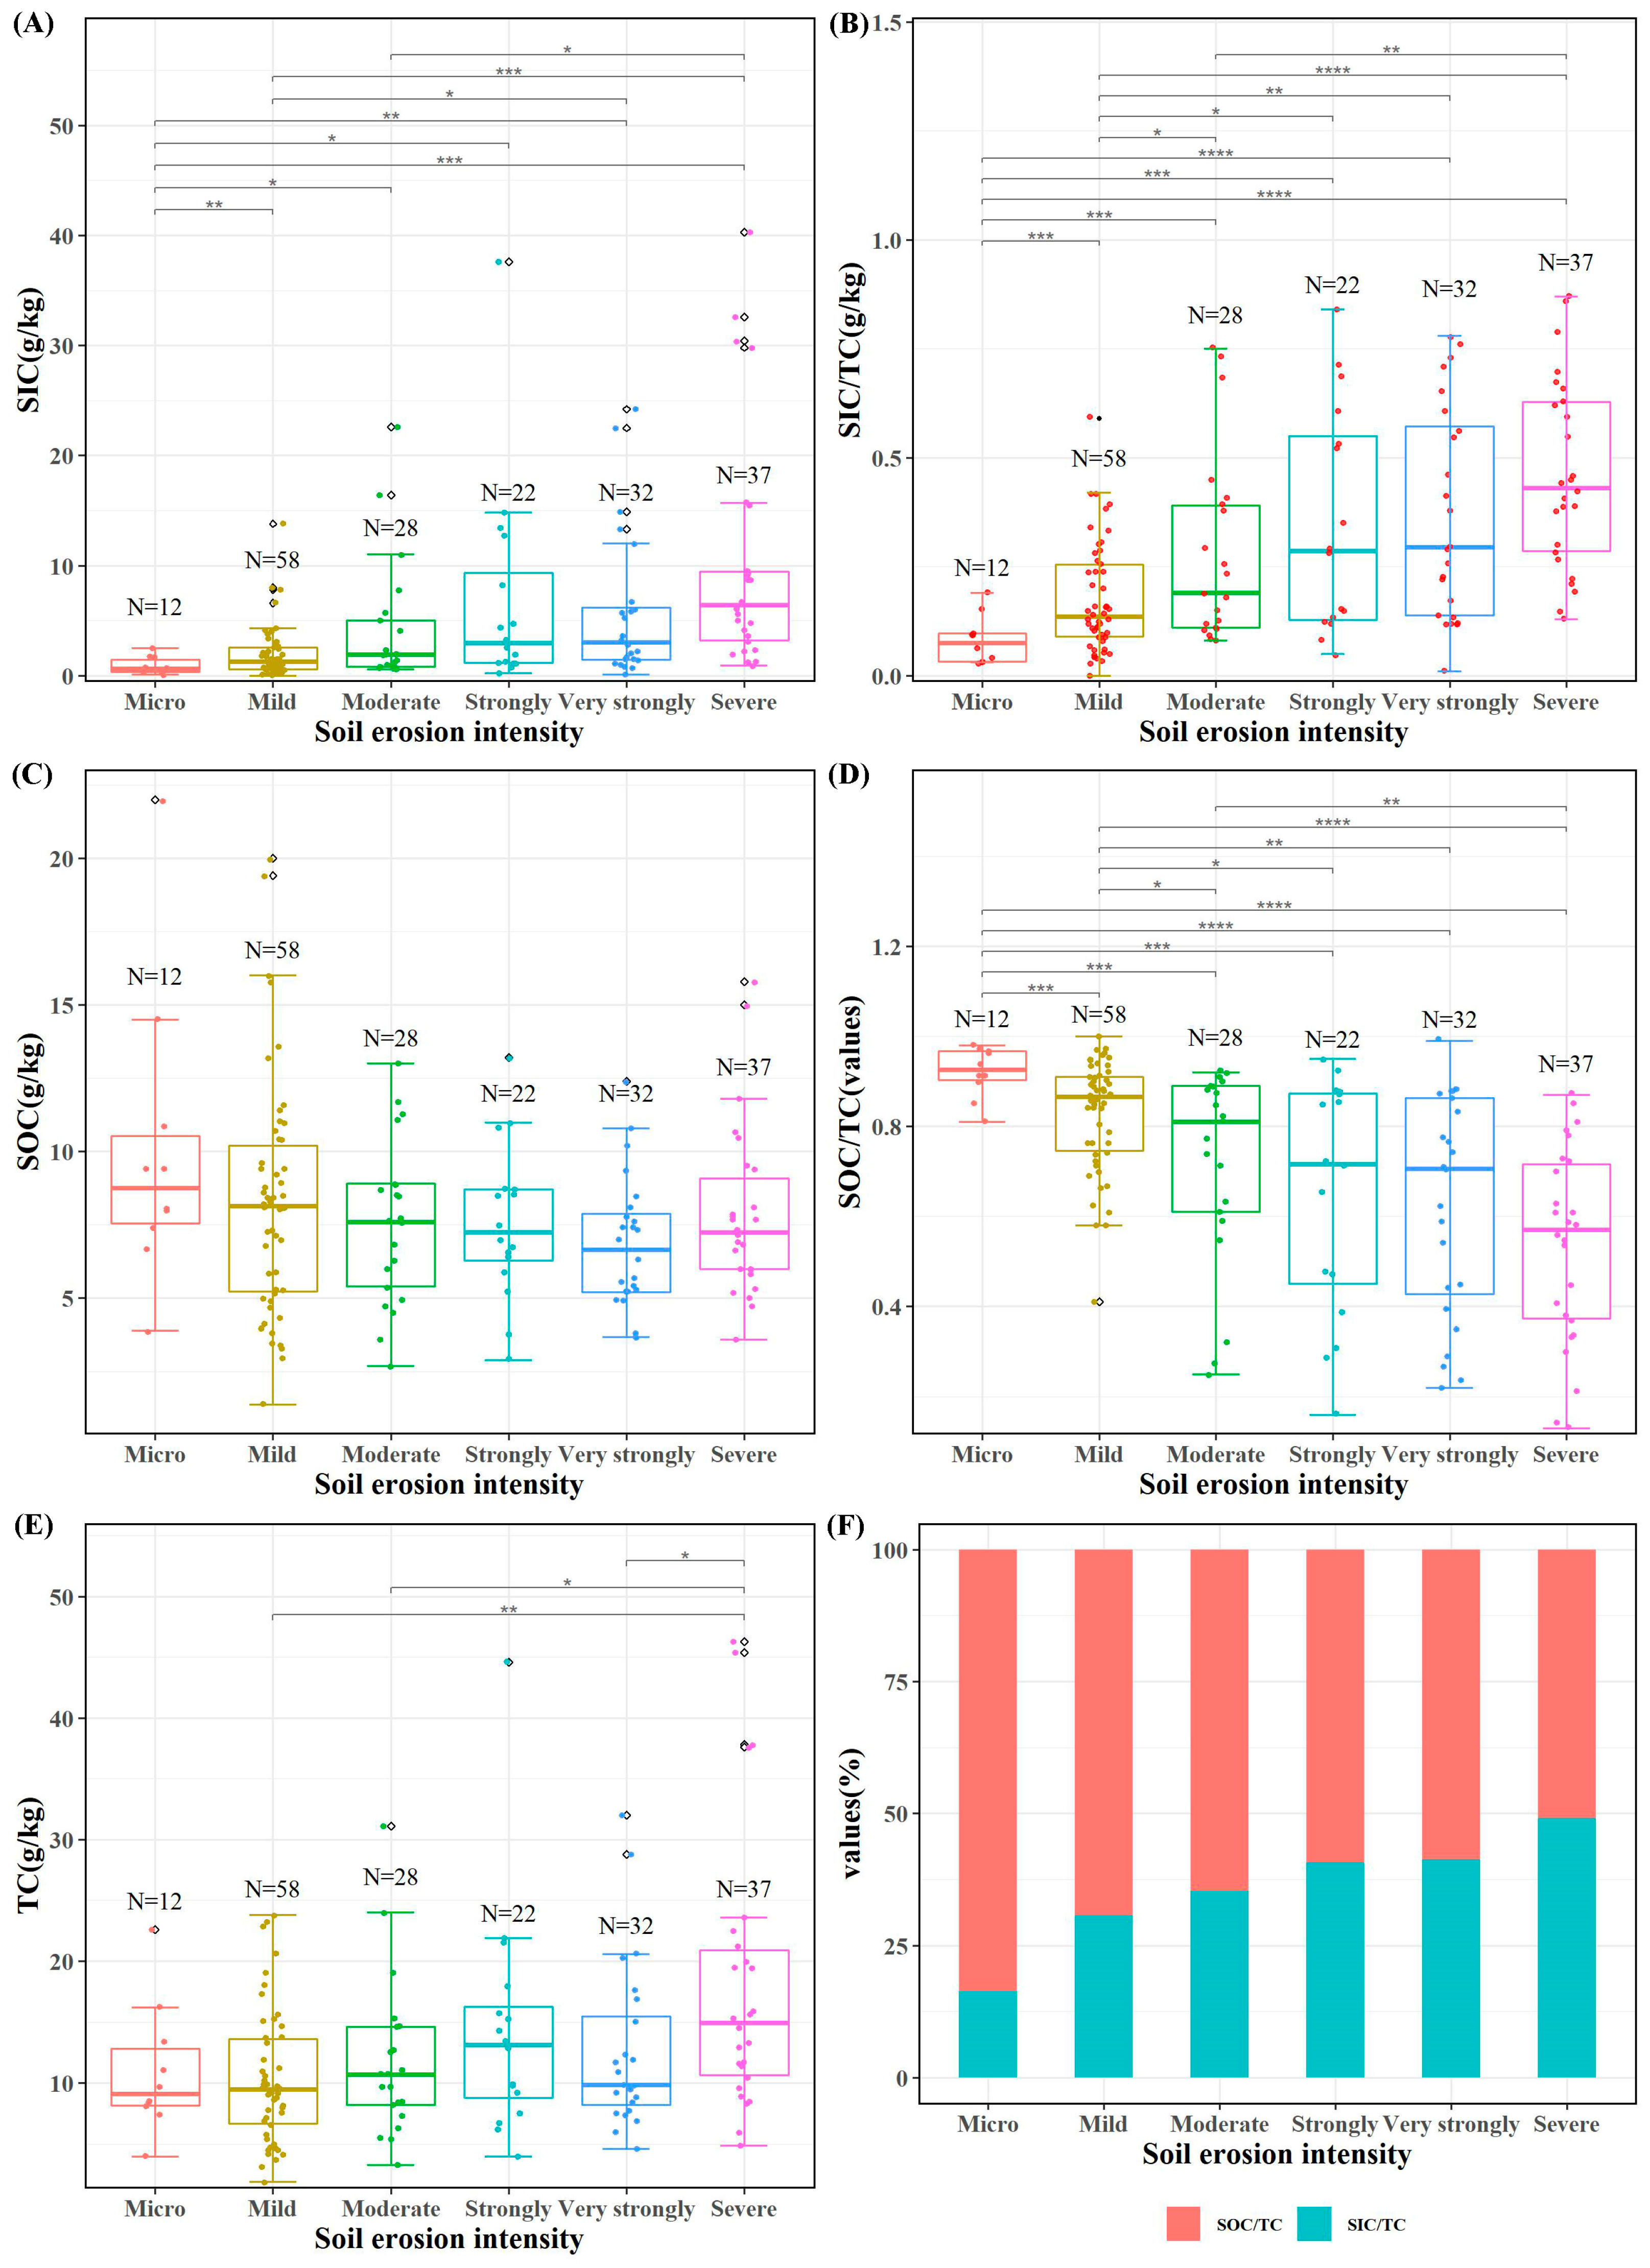
Utilizing the spatial distribution of the soil erosion intensity simulated using WaTEM/SEDEM, we conducted a statistical analysis to explore the relationship between various erosion intensity classes and the soil inorganic carbon (SIC), soil organic carbon (SOC), and total soil carbon (TC) contents. Our findings revealed a positive correlation between the soil inorganic carbon content and its proportion with the soil erosion intensity (Figure 5A,B). Conversely, no significant correlation was observed between the soil organic carbon content and the soil erosion intensity (Figure 5C), while a significant negative correlation emerged between the soil organic carbon content proportion and the soil erosion intensity (Figure 5D,F). There was no discernible correlation between the total soil carbon content and the soil erosion intensity (Figure 5E).

3.3. Soil and River Carbon Fraction Characterization

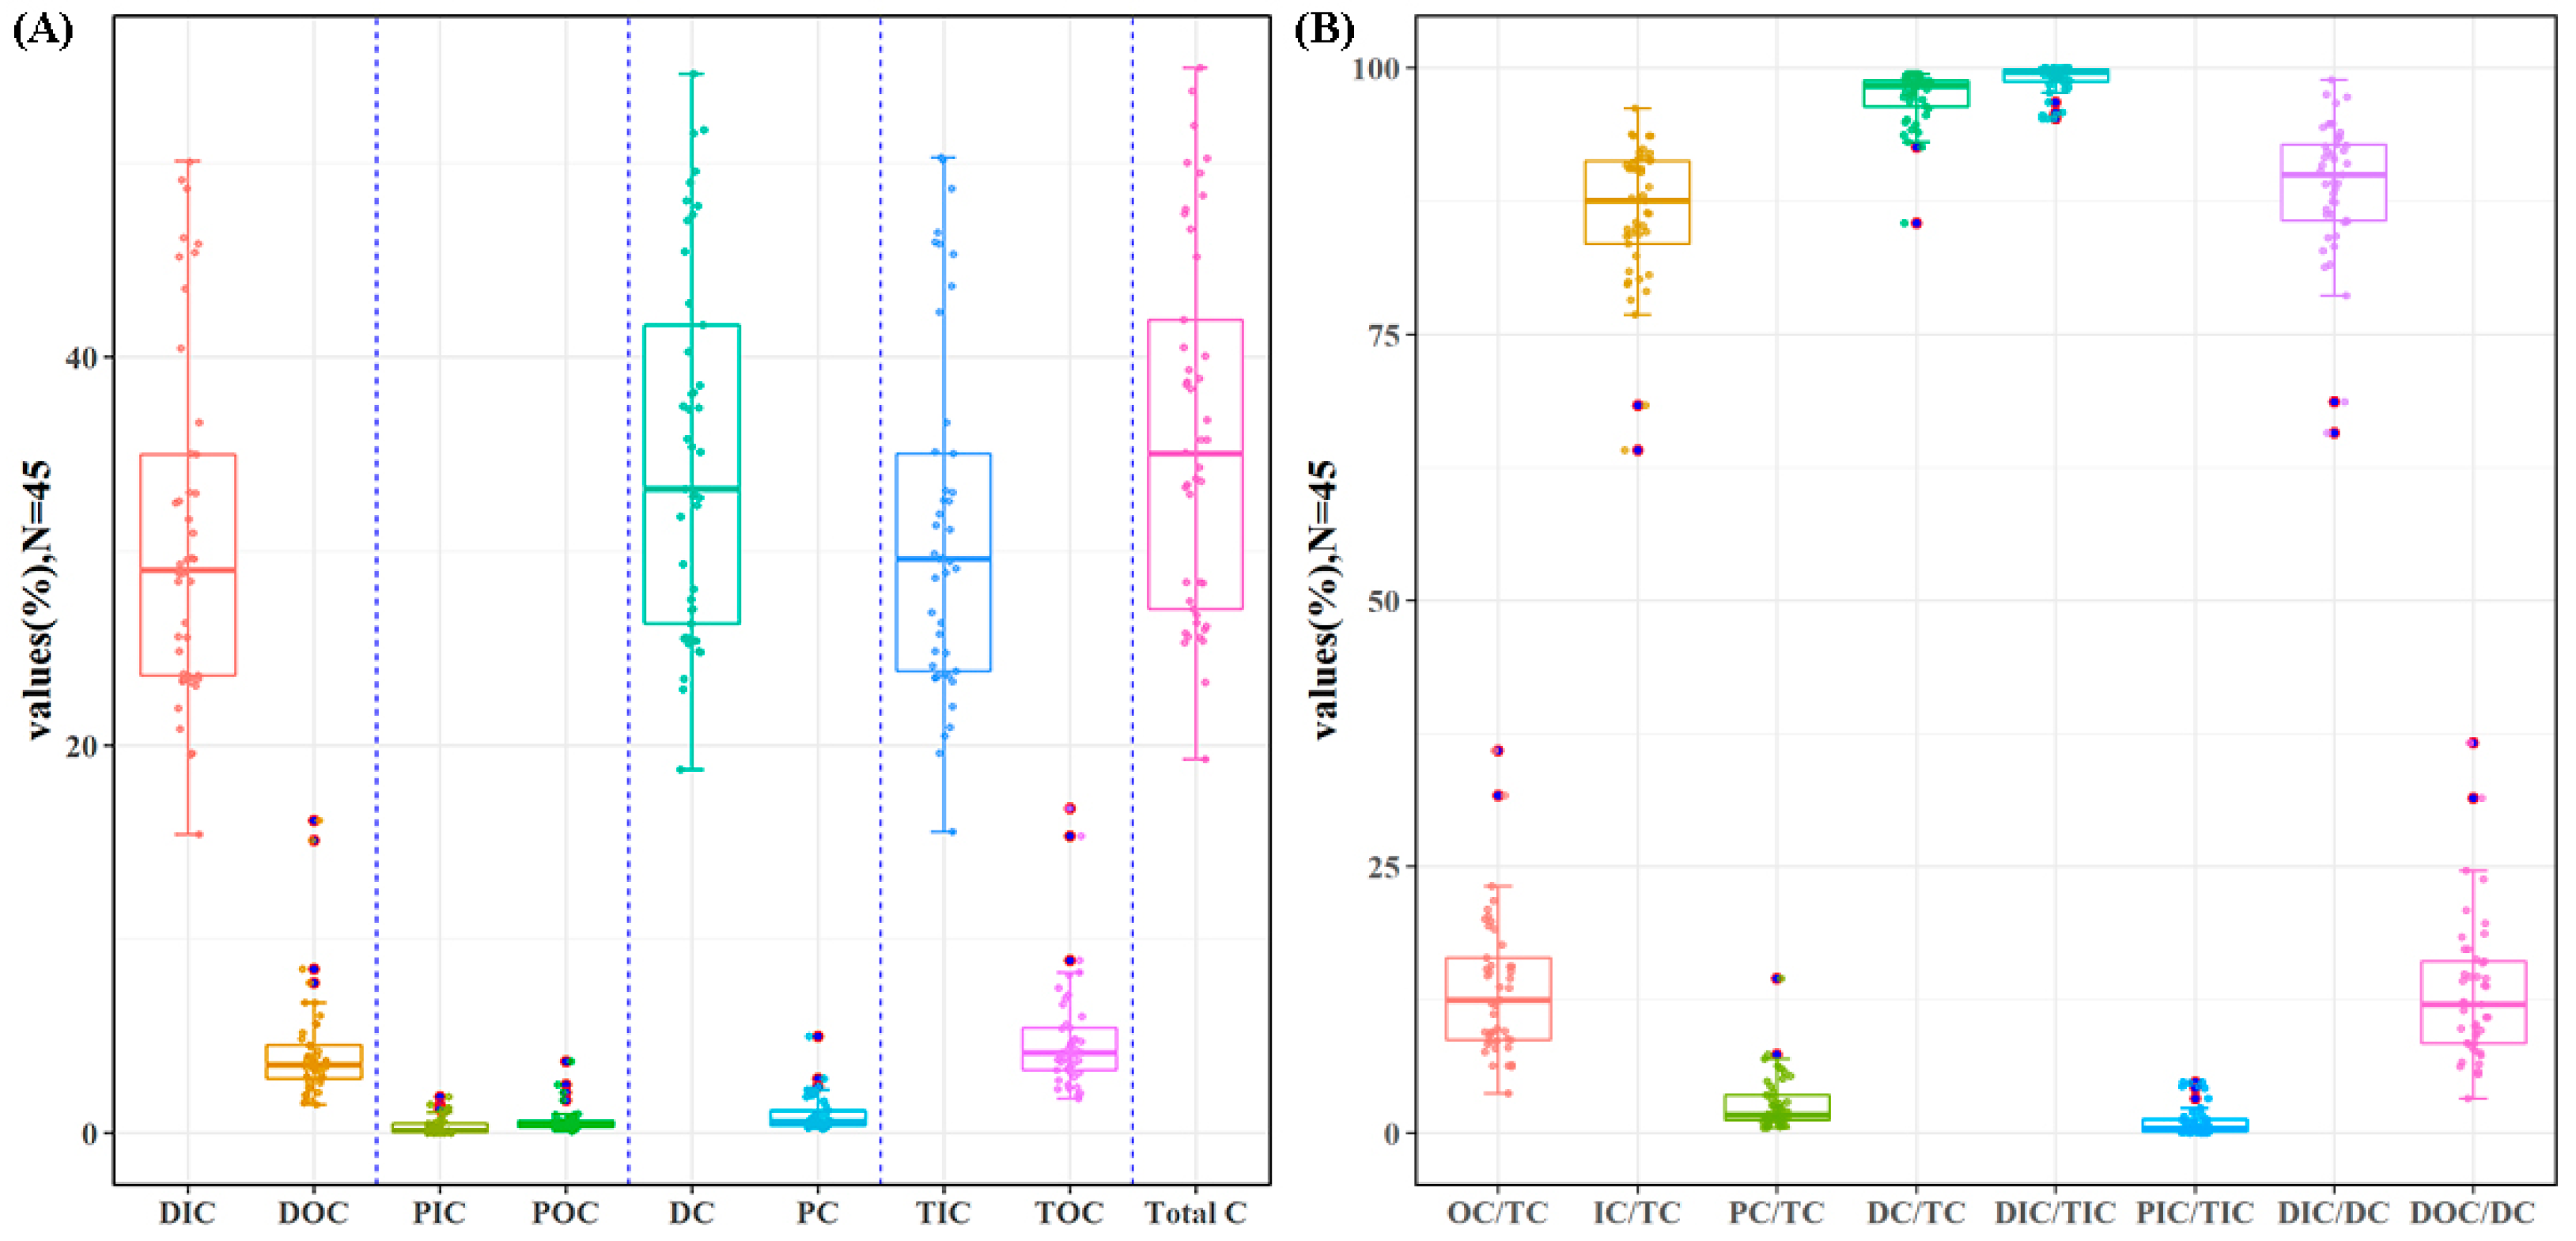
The analytical data showed that dissolved inorganic carbon (DIC) dominated the water carbon in the river, accounting for 85.37% of the total carbon, while particulate inorganic carbon (PIC) accounted for 0.95%. Furthermore, inorganic carbon (IC) and organic carbon (OC) accounted for 86.32% and 13.68% of the total carbon, respectively (Figure 6A). Dissolved carbon (DC) and particulate carbon (PC) accounted for 97.24% and 2.76% of the total carbon, respectively. It is worth noting that 98.87% of total inorganic carbon was dissolved inorganic carbon, and 87.78% of dissolved carbon was dissolved inorganic carbon (Figure 6B).
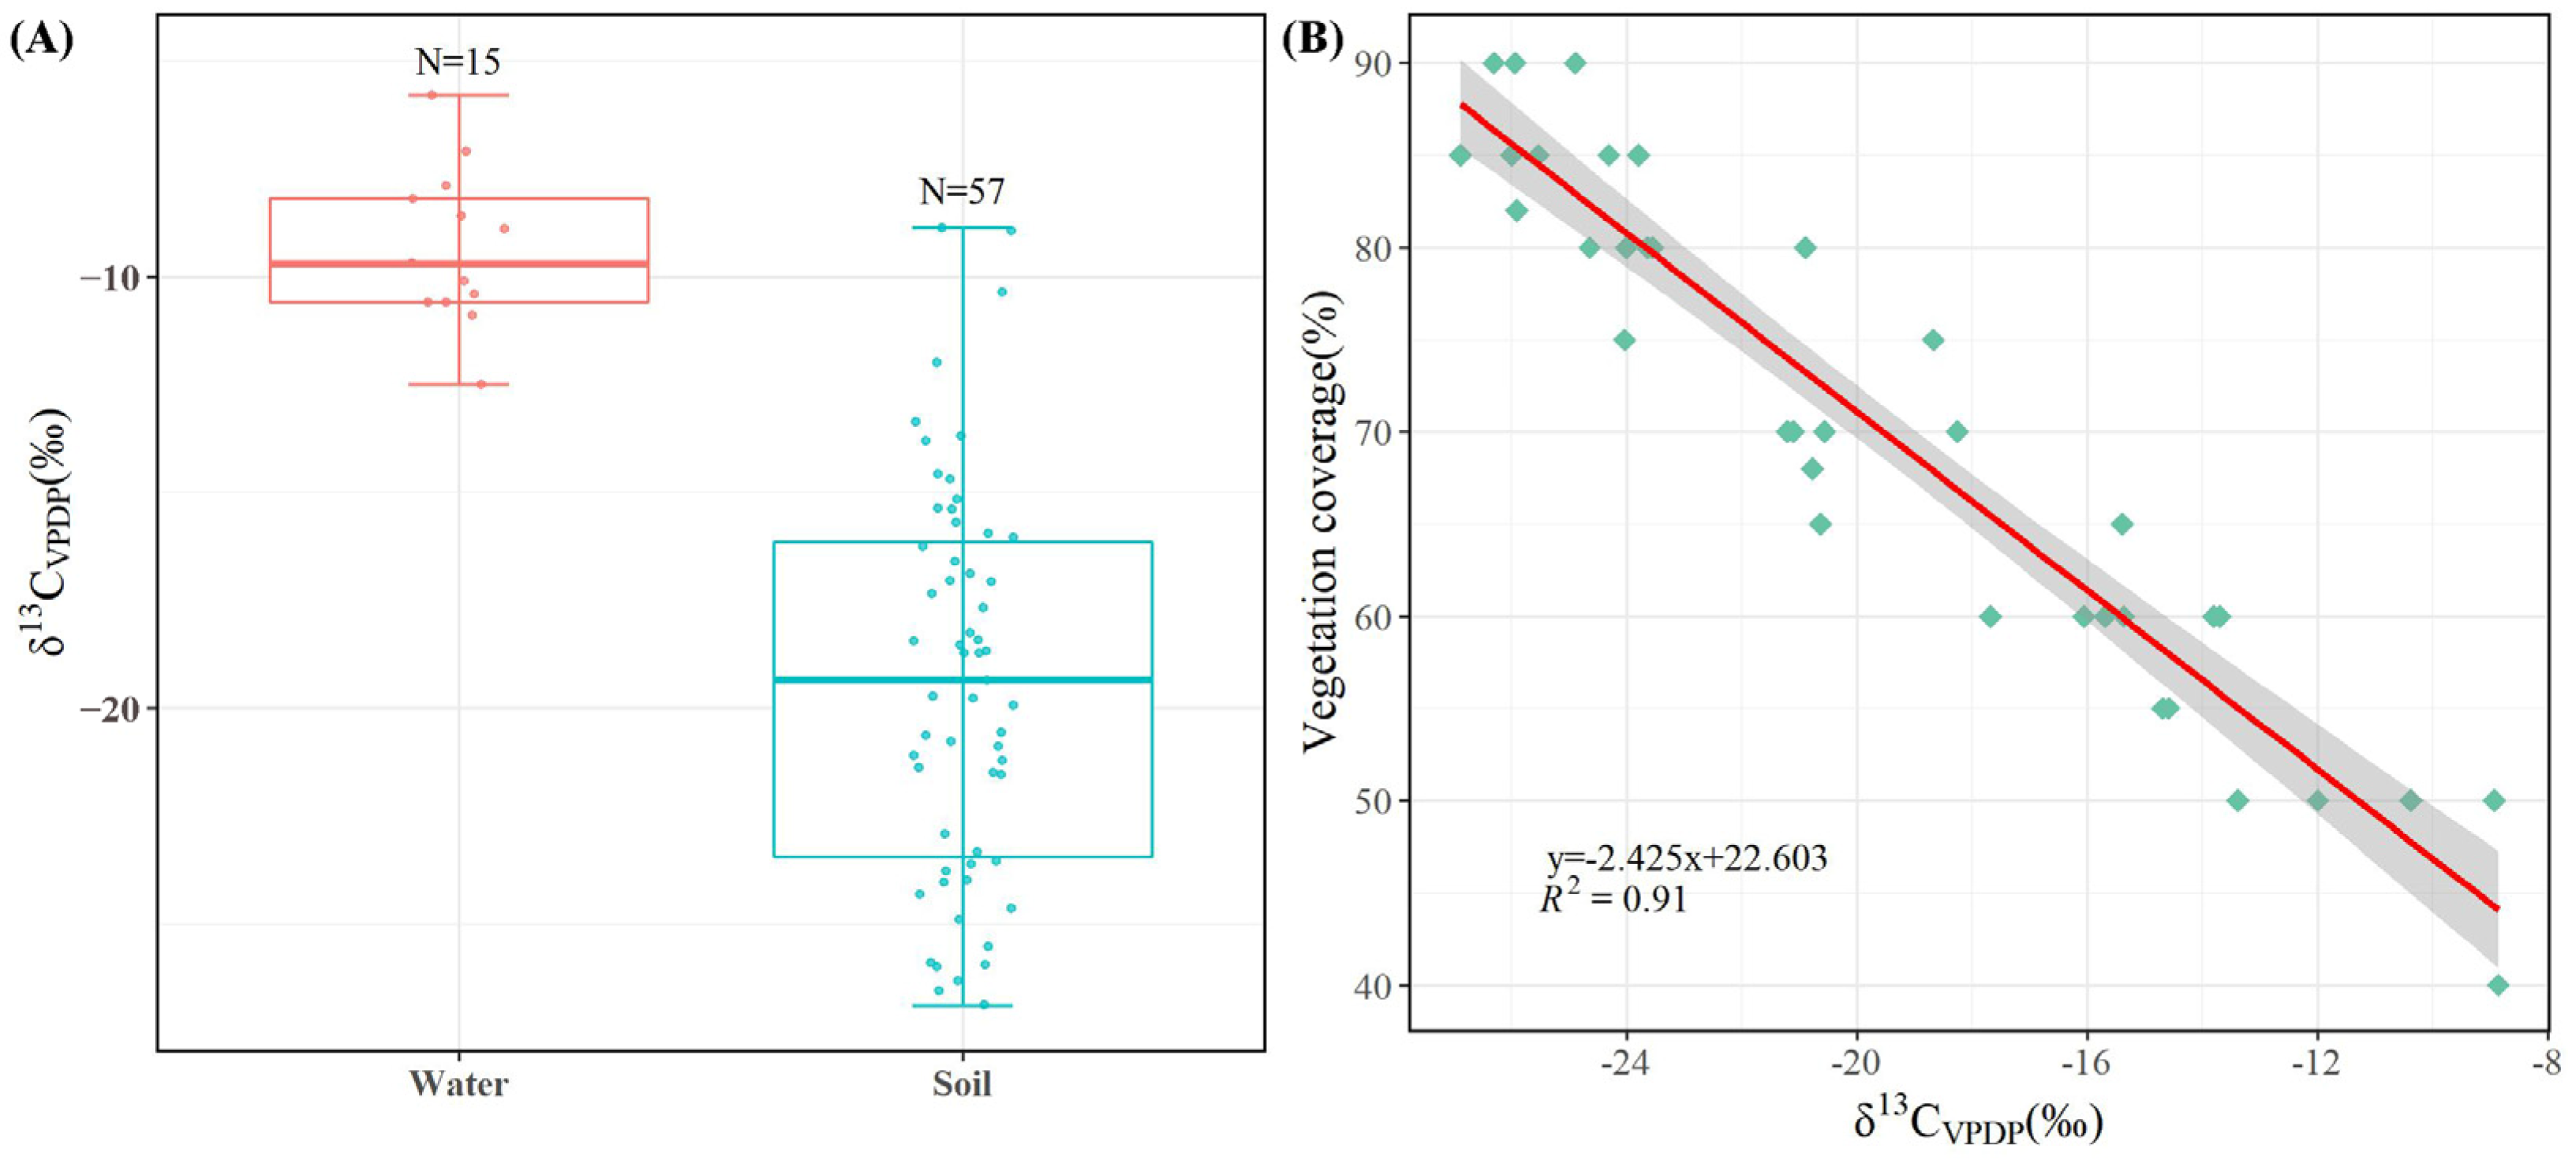
As our study area is a typical arid area, the selection of the δ13Cplant value at −27.1‰ was informed by the stable carbon isotope characteristics of plants documented in arid and semi-arid zones of Northwest China [47,48]. The δ13Catm value was established at −7‰ based on prior research [49]. Our stable carbon isotope analysis revealed an average δ13Cwater of −9.3‰ and an average δ13Csoil of −19.4‰ (Figure 7A), with the latter demonstrating a significant negative correlation with the surface vegetation cover (Figure 7B). By utilizing Equation (2) for calculations, it was determined that approximately 83.47% of the carbon in the water body originated from the atmosphere.

4. Discussion

4.1. Dynamic Replacement Mechanisms of Soil Inorganic Carbon

The WaTEM/SEDEM model has emerged as a robust tool for predicting sediment transport dynamics within stream channels, achieved through its adept simulation of soil deposition and transport processes across watersheds [23,40,41,42,58]. Building upon the precedent set by Borrelli et al. [35] in Europe, we extended the WaTEM/SEDEM model’s utility to quantify soil carbon loss attributable to water erosion within our study domain. We conducted rigorous calibration exercises to enhance the model’s predictive accuracy, leveraging the sand transport data gleaned from hydrological stations. Furthermore, a wealth of soil carbon observations (Figure 1B,C) was integrated to account for soil carbon loss and variations, thereby bolstering the precision and reliability of our findings. While acknowledging that model simulations inherently entail certain uncertainties, we suggest that they hold promise for mitigating such uncertainties in future iterations with longer-term observation datasets.
Moreover, the model has defects, such as assuming that all the sediment entering the river channel can be exported to the watershed and not considering factors such as channel erosion and gravity erosion. It therefore needs to be studied more deeply in future applications [35,40]. Our results are generally reliable because the amount of soil carbon pool change was calculated by analyzing and testing soil carbon content data from many soil samples collected in the field. Given that the study area is under continuous ecological vegetation protection and restoration, it is reasonable to assume that soil erosion is the only factor responsible for the large loss of soil carbon in the study area. This study’s results showed that the net loss of soil carbon pools (ΔC) was smaller than the net carbon erosion of soils (Closs) by 47,600 ± 12,600 tons of carbon/year, yielding a direct quantification of the results, which revealed a negative emission effect of the dynamic replacement of soil carbon. The intermediate process of quantifying the erosion, deposition, and lateral transfer of carbon was reduced compared with previous research methods [16,17], which reduced the transmission of errors and the generation of uncertainty to a certain extent.
Scholarly investigations have revealed the leaching of dissolved inorganic carbon from the soil into adjacent water bodies [59,60]. In our study, the carbon content observed in river water predominantly comprised dissolved inorganic carbon (Figure 6) dynamically sourced from the soil via water erosion mechanisms [2,3,61,62]. This carbon fraction exhibited a pronounced atmospheric source signature (Figure 6 and Figure 7A), consistent with prior knowledge elucidating the derivation of dissolved inorganic carbon in soils from soil air or atmospheric sources [60]. Consequently, we propose that water erosion facilitates the transportation of dissolved inorganic carbon from soil to river systems, which is subsequently replenished by atmospheric carbon, thereby fostering the reformation of soil inorganic carbon. This process operates dynamically, delineating the dynamic replacement mechanism governing soil inorganic carbon within water erosion dynamics, an essential process influencing soil–atmosphere CO2 fluxes. Our investigation was delimited to a representative arid region, thus bearing inherent limitations. Further research endeavors are warranted to ascertain the prevalence of the dynamic replacement mechanism of soil inorganic carbon across diverse non-arid contexts.

4.2. Implications of Dynamic Replacement of Soil Inorganic Carbon under Water Erosion for the Modern Carbon Cycle

Previous studies have generally concluded that soil inorganic carbon turnover is slow [28,32,33]. However, it has also been shown that the dynamic process of inorganic carbon is prevalent in soils in broad arid zones and can even dominate the formation of carbon exchanges and carbon sinks at the land–gas interface [34,63,64,65]. Liu et al. quantified soil inorganic carbon fluxes on an annual scale using soil 13C isotope tracer techniques and soil CO2 flux observations (28 g C m−2 a−1; [58]), comparable to the average annual inorganic carbon fluxes in soils on a millennial scale determined by Li et al. [66] using 14C decay techniques (21.4 g C m−2 a−1). In our study, 83.47% of water body carbon originated from the atmosphere due to the dynamic replacement of soil inorganic carbon by atmospheric carbon under water erosion. Since soil erosion was the only source of water body carbon in the study area, further calculations yielded a soil inorganic carbon flux of approximately 3.97 ± 10.5 million tons/year, agreeing with the studies by Liu [58] and Li et al. [66] (19.60 ± 5.18 g C m−2 a−1), proving that soil inorganic carbon is involved in the modern carbon cycle. However, our identification and quantification of the dynamic replacement of soil inorganic carbon was achieved using carbon isotope tracer techniques, which is indirect evidence. More direct evidence is, therefore, needed for future applications. Moreover, the soils in the study area exhibited higher inorganic carbon contents with increasing erosion intensity (Figure 5A and Figure 7B), suggesting that more inorganic 13C was exported from the more eroded areas (Figure 7B; [56,67,68]). The dynamic replacement of soil inorganic carbon shows a positive correlation with the intensity of water erosion and represents an important link in the modern carbon cycle.

4.3. Assessment of Water Erosion and Regional Carbon Sinks

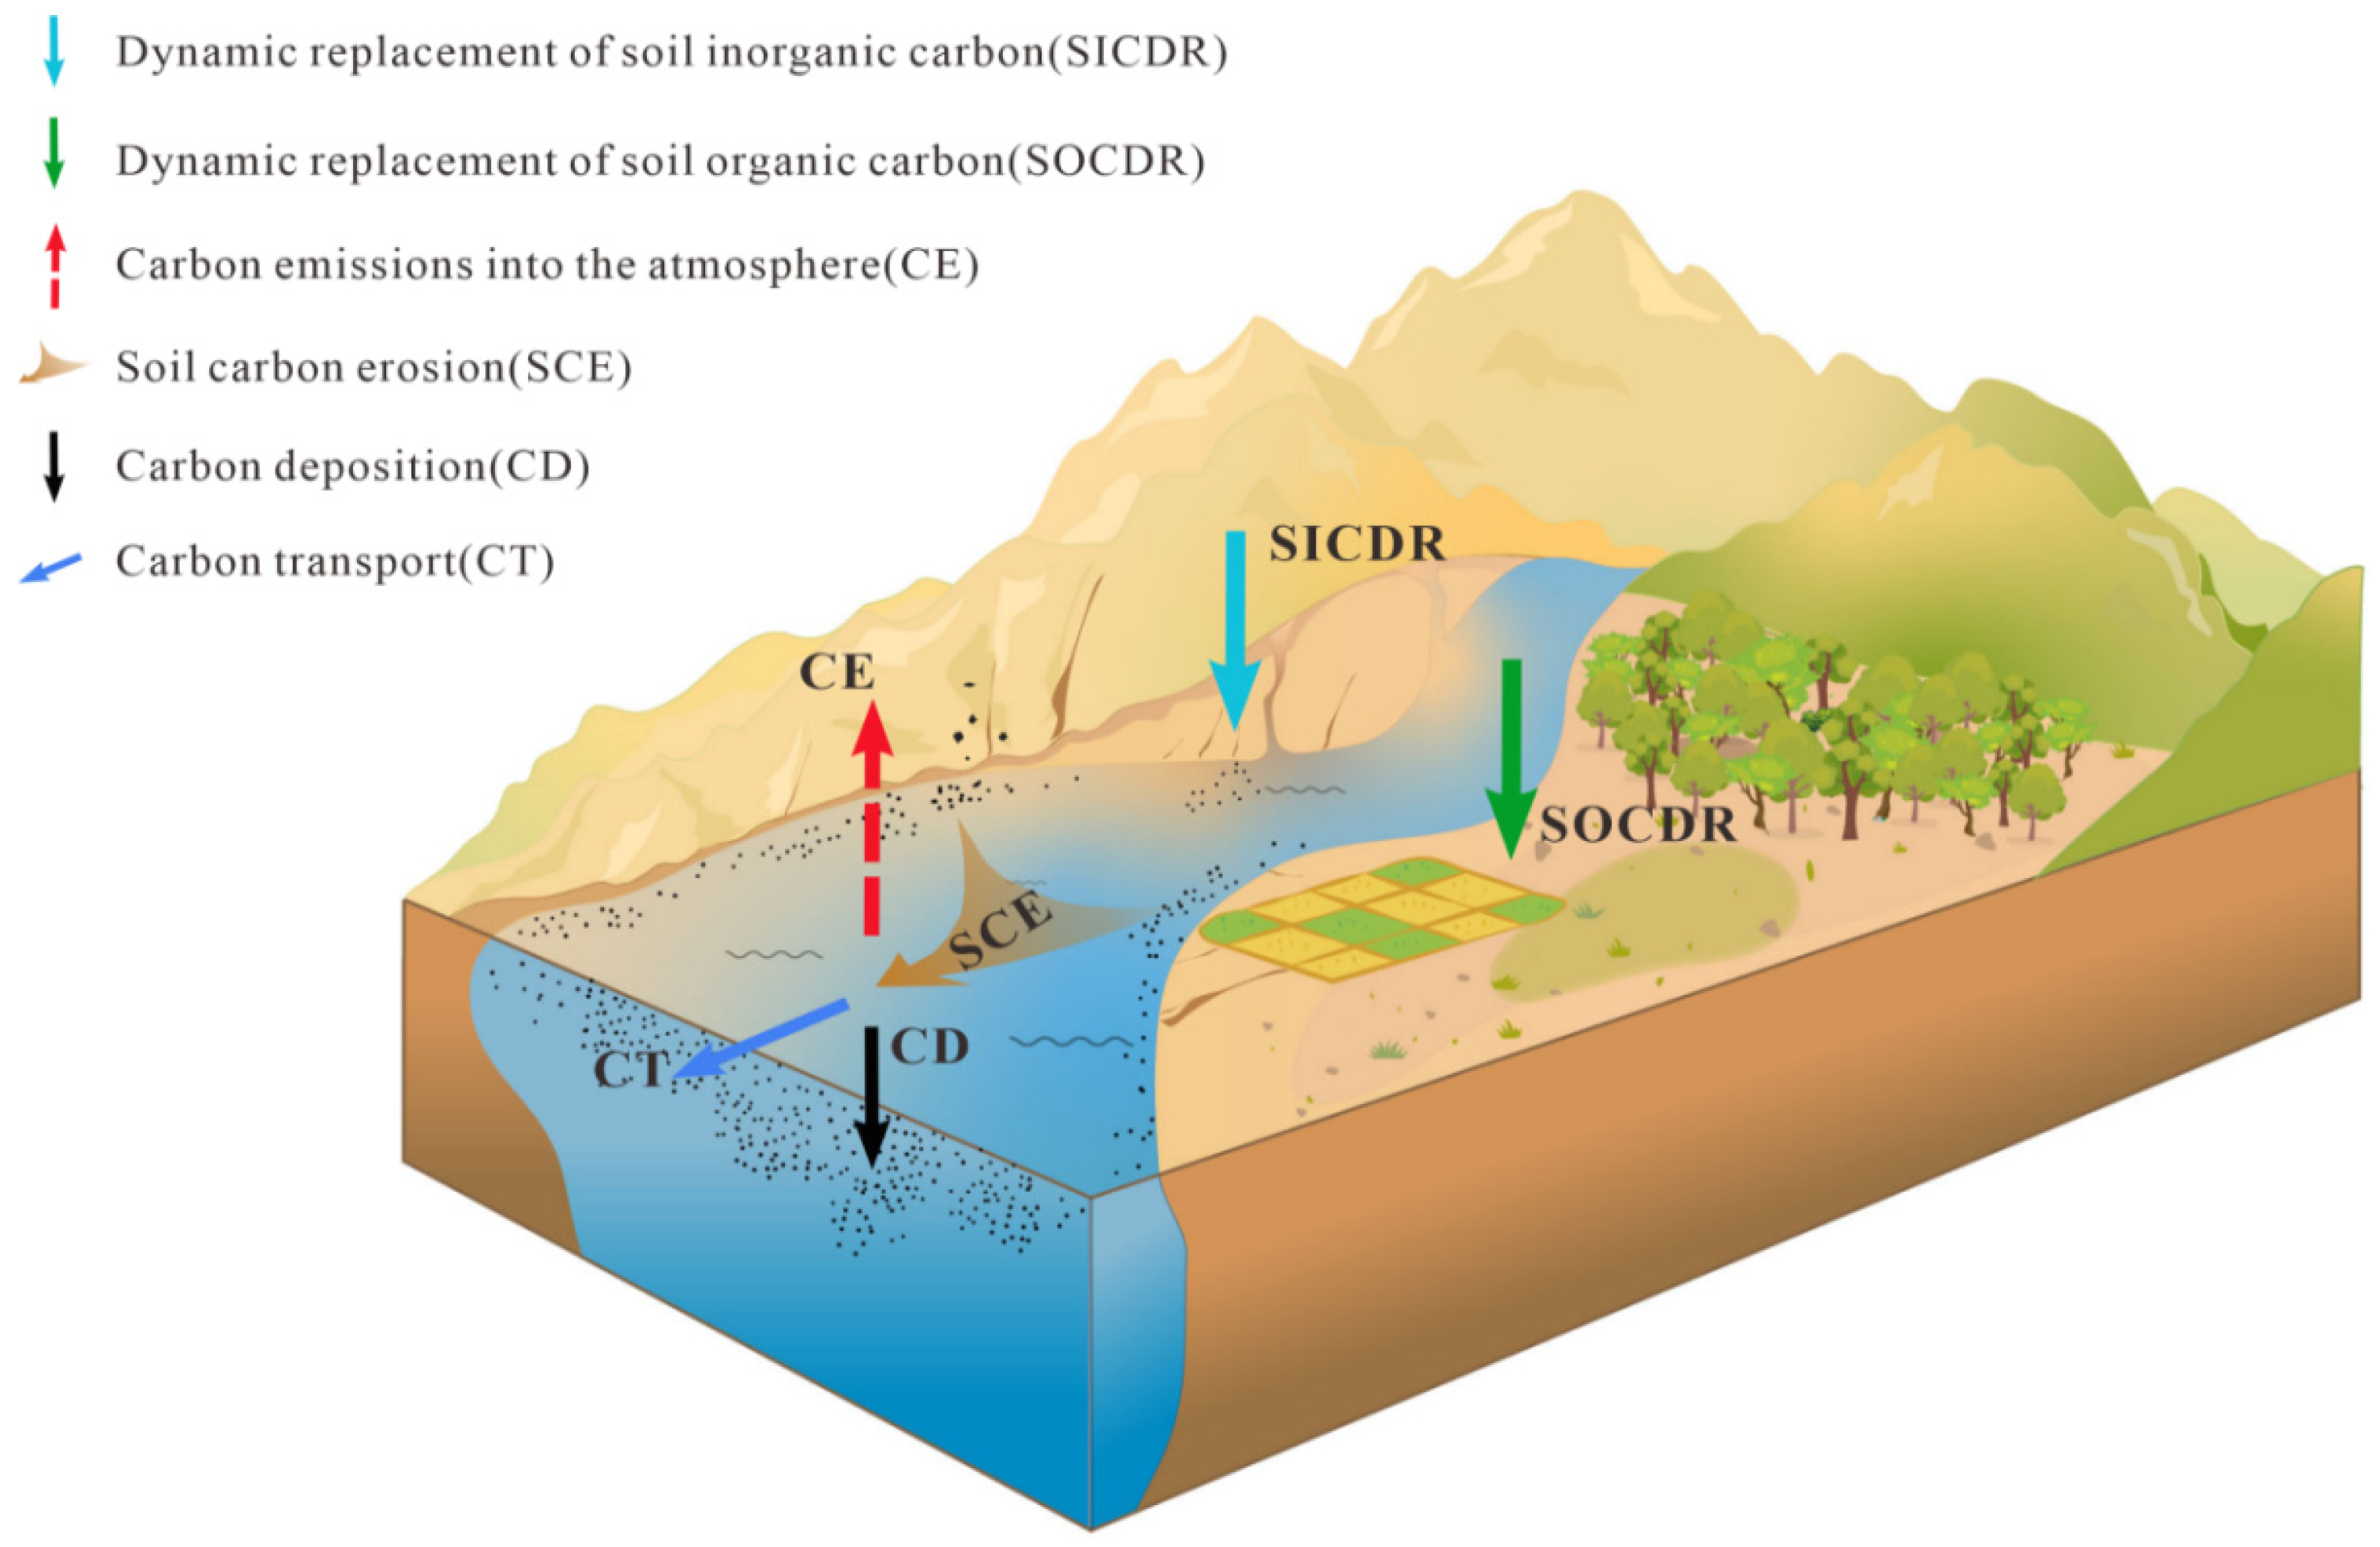
Alongside the substantial alterations in soil carbon fluxes triggered by water erosion at the point of origin [16,17], lateral transport is a significant mechanism of redistributing carbon. This process entails the utilization of a portion of carbon by aquatic flora [1,69], the deposition of some carbon in aquatic environments, the release of another fraction back into the atmosphere, and the discharge of the remaining carbon into the oceans ([1,2,3,7]; Figure 8). The fraction utilized by aquatic plants and deposited in the aquatic environment remains within the terrestrial system, accruing and constituting a carbon sink [1,69]. Furthermore, prior studies employing model simulations have demonstrated that soil water erosion engenders substantial CO2 fluxes at the soil–atmosphere interface over expansive spatial and temporal scales, potentially forming a net CO2 sink over decadal–millennial timescales [16,17,70,71]. Our investigation underscores the significant impact of intense water erosion on regional carbon cycling at an interannual scale.
In summary, neglecting the process of water erosion when assessing regional carbon sinks overlooks the dynamic replacement of soil carbon at the point of origin, as well as the deposition and bioavailability of carbon during transport (Figure 8), consequently leading to underestimating regional carbon sinks. Disregarding water erosion further exacerbates uncertainty in carbon cycle assessments, particularly in the context of global change, including in arid zones, rocky desertification areas, and coastal regions, where extreme droughts and precipitation events are frequent and soil carbon erosion is pronounced [72,73].

5. Conclusions

Our findings reveal that the surface soil carbon pool in the Yuanmou area experiences a replacement influx of 47,600 ± 12,600 tons annually following water erosion, with 39,700 ± 10,500 tons attributed to the dynamic replacement of soil inorganic carbon with atmospheric carbon. This mechanism significantly alters the soil–atmosphere CO2 flux, thus enhancing our understanding of ecosystem carbon sequestration theory. However, further research is imperative to elucidate the underlying mechanisms and generalizability of these findings. Additionally, our study underscores the profound impact of the water erosion process on the regional carbon cycle. Integrating water erosion into regional carbon sink assessments enhances the accuracy of such evaluations and underscores the importance of mitigating and managing water erosion to minimize uncertainties in terrestrial carbon cycle assessments. We advocate for the inclusion of water erosion processes in regional carbon sink assessments.

Supplementary Materials

The following supporting information can be downloaded at https://www.mdpi.com/article/10.3390/land13071053/s1. Figure S1: Detection results of the soil total carbon (TC), soil organic carbon (SOC), and soil inorganic carbon (SIC) contents.

Author Contributions

Conceptualization, C.X.; data curation, T.H.; funding acquisition, L.Z. and G.C.; investigation, T.H., X.X., F.Z., Z.L. and Z.W.; supervision, L.Z. and J.Y.; writing—original draft, C.Z. and C.X.; writing—review and editing, C.Z. All authors have read and agreed to the published version of the manuscript.

Funding

This research was funded by the China Geological Survey Project, the Ministry of Natural Resources (grant Nos. DD20220877, DD20208070, DD20220873, DD20220888, and DD20230532), and the Science and Technology Department of Yunnan Province Technology Innovation Talent Training Object Project (202405AD350076).

Data Availability Statement

The raw data are not publicly available due to the privacy and continuity of this research.

Acknowledgments

We thank the ecology geological survey group and the hydrogeologic survey group of the Kunming General Survey of Natural Resources Center for providing the carbon data. We are also grateful to the Soil Science Data Center, Institute of Soil Science, Chinese Academy of Sciences, for providing data on soil types and bulk density.

Conflicts of Interest

The authors declare no conflicts of interest.

References

  1. Battin, T.J.; Lauerwald, R.; Bernhardt, E.S.; Bertuzzo, E.; Gener, L.G.; Hall, R.O.; Hotchkiss, E.R.; Maavara, T.; Pavelsky, T.M.; Ran, L.; et al. River ecosystem metabolism and carbon biogeochemistry in a changing world. Nature 2023, 613, 449–459. [Google Scholar] [CrossRef]
  2. Quinton, J.N.; Govers, G.; Van Oost, K.; Bardgett, R.D. The impact of agricultural soil erosion on biogeochemical cycling. Nat. Geosci. 2010, 3, 311–314. [Google Scholar] [CrossRef]
  3. Regnier, P.; Friedlingstein, P.; Ciais, P.; Mackenzie, F.T.; Gruber, N.; Janssens, I.A.; Laruelle, G.G.; Lauerwald, R.; Luyssaert, S.; Andersson, A.J.; et al. Anthropogenic perturbation of the carbon fluxes from land to ocean. Nat. Geosci. 2013, 6, 597–607. [Google Scholar] [CrossRef]
  4. Cole, J.J.; Prairie, Y.T.; Caraco, N.F.; McDowell, W.H.; Tranvik, L.J.; Striegl, R.G.; Duarte, C.M.; Kortelainen, P.; Downing, J.A.; Middelburg, J.J.; et al. Plumbing the global carbon cycle: Integrating inland waters into the terrestrial carbon budget. Ecosystems 2007, 10, 172–185. [Google Scholar] [CrossRef]
  5. Battin, T.J.; Luyssaert, S.; Kaplan, L.A.; Aufdenkampe, A.K.; Richter, A.; Tranvik, L.J. The boundless carbon cycle. Nat. Geosci. 2009, 2, 598–600. [Google Scholar] [CrossRef]
  6. Tranvik, L.J.; Downing, J.A.; Cotner, J.B.; Loiselle, S.A.; Striegl, R.G.; Ballatore, T.J.; Dillon, P.; Finlay, K.; Fortino, K.; Knoll, L.B.; et al. Lakes and reservoirs as regulators of carbon cycling and climate. Limnol. Oceanogr. 2009, 54, 2298–2314. [Google Scholar] [CrossRef]
  7. Bastviken, D.; Tranvik, L.J.; Downing, J.A.; Crill, P.M.; Enrich-Prast, A. Freshwater methane emissions offset the continental carbon sink. Science 2011, 331, 50. [Google Scholar] [CrossRef] [PubMed]
  8. Raymond, P.A.; Hartmann, J.; Lauerwald, R.; Sobek, S.; McDonald, C.; Hoover, M.; Butman, D.; Striegl, R.; Mayorga, E.; Humborg, C.; et al. Global carbon dioxide emissions from inland waters. Nature 2013, 503, 355–359. [Google Scholar] [CrossRef] [PubMed]
  9. Borges, A.V.; Morana, C.; Bouillon, S.; Servais, P.; Descy, J.P.; Darchambeau, F. Carbon cycling of Lake Kivu (East Africa): Net autotrophy in the epilimnion and emission of CO2 to the atmosphere sustained by geogenic inputs. PLoS ONE 2014, 9, e109500. [Google Scholar] [CrossRef] [PubMed]
  10. Friedlingstein, P.; O’sullivan, M.; Jones, M.W.; Andrew, R.M.; Gregor, L.; Hauck, J.; Quéré, C.L.; Luijkx, I.T.; Olsen, A.; Peters, G.P.; et al. Global carbon budget 2022. Earth Syst. Sci. Data 2022, 14, 4811–4900. [Google Scholar] [CrossRef]
  11. Berner, R. A combined model for Phanerozoic atmospheric O2 and CO2. Geochim. Cosmochim. Acta 2006, 70, 5653–5664. [Google Scholar] [CrossRef]
  12. Walker, J.; Hays, P.; Kasting, J. A Negative feedback mechanism for the long-term stabilization of Earths surface-temperature. J. Geophys. Res. Atmos. 1981, 86, 9776–9782. [Google Scholar] [CrossRef]
  13. Beaulieu, E.; Goddéris, Y.; Donnadieu, Y.; Labat, D.; Roelandt, C. High sensitivity of the continental-weathering carbon dioxide sink to future climate change. Nat. Clim. Chang. 2012, 2, 346–349. [Google Scholar] [CrossRef]
  14. Ciais, P.; Sabine, C.; Bala, G.; Bopp, L.; Brovkin, V.; Canadell, J.; Chhabra, A.; DeFries, R.; Galloway, J.; Heimann, M.; et al. Carbon and Other Biogeochemical Cycles, 3rd ed.; Cambridge University Press: Cambridge, UK, 2013; pp. 465–570. [Google Scholar]
  15. Pu, J.B.; Jiang, Z.C.; Yuan, D.X.; Zhang, C. Some opinions on rock-weathering-related carbon sink from the IPCC Fifth assessment Report. Adv. Earth Sci. 2015, 30, 1081–1090. [Google Scholar]
  16. Van Oost, K.; Quine, T.A.; Govers, G.; De Gryze, S.; Six, J.; Harden, J.W.; Ritchie, J.C.; McCarty, G.W.; Heckrath, G.; Kosmas, C.; et al. The impact of agricultural soil erosion on the global carbon cycle. Science 2007, 318, 626–629. [Google Scholar] [CrossRef] [PubMed]
  17. Yue, Y.; Ni, J.; Ciais, P.; Piao, S.; Wang, T.; Huang, M.; Borthwick, A.G.L.; Li, T.; Wang, Y.; Chappell, A. Lateral transport of soil carbon and land−atmosphere CO2 flux induced by water erosion in China. Proc. Natl. Acad. Sci. USA 2016, 113, 6617–6622. [Google Scholar] [CrossRef] [PubMed]
  18. Lal, R. Soil degradation by erosion. Land Degrad. Dev. 2001, 12, 519–539. [Google Scholar] [CrossRef]
  19. Lal, R.; Griffin, M.; Apt, J.; Lave, L.; Morgan, M.G. Managing soil carbon. Science 2004, 304, 393. [Google Scholar] [CrossRef] [PubMed]
  20. Lugato, E.; Paustian, K.; Panagos, P.; Jones, A.; Borrelli, P. Quantifying the erosion effect on current carbon budget of European agricultural soils at high spatial resolution. Glob. Chang. Biol. 2016, 22, 1976–1984. [Google Scholar] [CrossRef]
  21. Berhe, A.A.; Harte, J.; Harden, J.W.; Torn, M.S. The significance of the erosion-induced terrestrial carbon sink. Bioscience 2007, 57, 337–346. [Google Scholar] [CrossRef]
  22. Stallard, R. Terrestrial sedimentation and the carbon cycle: Coupling weathering and erosion to carbon burial. Glob. Biogeochem. Cycles 1998, 12, 231–257. [Google Scholar] [CrossRef]
  23. Haregeweyn, N.; Poesen, J.; Verstraeten, G.; Govers, G.; Moeyersons, J. Assessing the performance of a spatially distributed soil erosion and sediment delivery model (watem/sedem) in northern ethiopia. Land Degrad. Dev. 2013, 24, 188–204. [Google Scholar] [CrossRef]
  24. Yoo, K.; Amundson, R.; Heimsath, A.M.; Dietrich, W.E. Erosion of upland hillslope soil organic carbon: Coupling field measurements with a sediment transport model. Glob. Biogeochem. Cycles 2005, 19, 1–17. [Google Scholar] [CrossRef]
  25. Smith, S.; Sleezer, R.O.; Renwick, W.H.; Buddemeier, R.W. Fates of eroded soil organic carbon: Mississippi basin case study. Ecol. Appl. 2005, 15, 1929–1940. [Google Scholar] [CrossRef]
  26. Smith, S.V.; Renwick, W.H.; Buddenmeier, R.W.; Crossland, C.J. Budgets of soil erosion and deposition for sediments and sedimentary organic carbon across the conterminous United States. Glob. Biogeochem. Cycles 2001, 15, 697–707. [Google Scholar] [CrossRef]
  27. Lal, R. Soil erosion and the global carbon budget. Environ. Int. 2003, 29, 437–450. [Google Scholar] [CrossRef] [PubMed]
  28. Schlesinger, W.H.; Belnap, J.; Marion, G. On carbon sequestration in desert ecosystems. Glob. Chang. Biol. 2009, 15, 1488–1490. [Google Scholar] [CrossRef]
  29. Wang, C.; Wang, X.; Liu, D.; Wu, H.; Lü, X.; Fang, Y.; Cheng, W.; Luo, W.; Jiang, P.; Shi, J.; et al. Aridity threshold in controlling ecosystem nitrogen cycling in arid and semi-arid grasslands. Nat. Commun. 2014, 5, 4799. [Google Scholar] [CrossRef] [PubMed]
  30. An, H.; Wu, X.; Zhang, Y.; Tang, Z. Effects of land-use change on soil inorganic carbon: A meta-analysis. Geoderma 2019, 353, 273–282. [Google Scholar] [CrossRef]
  31. Suarez, D.L. Inorganic carbon: Land use impacts. In Encyclopedia of Soil Science, 2nd ed.; Lal, R., Ed.; CRC Press: Boca Raton, FL, USA, 2005; pp. 895–897. [Google Scholar]
  32. Monger, H.C.; Gallegos, R.A. Biotic and abiotic processes and rates of pedogenic carbonate accumulation in the Southwestern United States–relationship to atmospheric CO2 sequestration. In Global Climate Change and Pedogenic Carbonates; Lal, R., Kimble, J.M., Eswaran, H., Stewart, B.A., Eds.; Lewis Publishers: Boca Raton, FL, USA, 2000; pp. 273–289. [Google Scholar]
  33. Zamanian, K.; Pustovoytov, K.; Kuzyakov, Y. Pedogenic carbonates: Forms and formation processes. Earth-Sci. Rev. 2016, 157, 1–17. [Google Scholar] [CrossRef]
  34. Wang, Y.; Wang, Z.; Li, Y. Storage/turnover rate of inorganic carbon and its dissolvable part in the profile of saline/alkaline soils. PLoS ONE 2013, 8, e82029. [Google Scholar] [CrossRef] [PubMed]
  35. Borrelli, P.; Oost, K.V.; Meusburger, K.; Alewell, C.; Lugato, E.; Panagos, P. A step towards a holistic assessment of soil degradation in europe: Coupling on-site erosion with sediment transfer and carbon fluxes. Environ. Res. 2018, 161, 291–298. [Google Scholar] [CrossRef] [PubMed]
  36. Van Rompaey, A.J.J.; Verstraeten, G.; Van Oost, K.; Govers, G.; Poesen, J. Modelling mean annual sediment yield using a distributed approach. Earth Surf. Process. Landforms 2001, 26, 1221–1236. [Google Scholar] [CrossRef]
  37. Verstraeten, G.; Van Oost, K.; Van Rompaey, A.; Poesen, J.; Govers, G. Evaluating an integrated approach to catchment management to reduce soil loss and sediment pollution through modelling. Soil Use Manag. 2002, 19, 386–394. [Google Scholar] [CrossRef]
  38. Verstraeten, G.; Prosser, I.P.; Fogarty, P. Predicting the spatial patterns of hillslope sediment delivery to river channels in the Murrumbidgee catchment. Aust. J. Hydrol. 2007, 334, 440–454. [Google Scholar] [CrossRef]
  39. Alatorre, L.C.; Beguería, S.; García-Ruiz, J.M. Regional scale modeling of hillslope sediment delivery: A case study in the barasona reservoir watershed (spain) using watem/sedem. J. Hydrol. 2010, 391, 109–123. [Google Scholar] [CrossRef]
  40. Fang, H. Impact of land use change and dam construction on soil erosion and sediment yield in the black soil region, northeastern china. Land Degrad. Dev. 2017, 28, 1482–1492. [Google Scholar] [CrossRef]
  41. Krasa, J.; Dostal, T.; Jachymova, B.; Bauer, M.; Devaty, J. Soil erosion as a source of sediment and phosphorus in rivers and reservoirs—Watershed analyses using watem/sedem. Environ. Res. 2019, 171, 470–483. [Google Scholar] [CrossRef] [PubMed]
  42. Villuendas, I.L.; Latorre, B.; Gaspar, L.; Navas, A. Effect of historical land-use change on soil erosion in a mediterranean catchment by integrating 137Cs measurements and watem/sedem model. Hydrol. Process. 2022, 36, e14577. [Google Scholar] [CrossRef]
  43. Tang, X.; Zhao, X.; Bai, Y.; Tang, Z.; Wang, W.; Zhao, Y.; Zhou, G. Carbon pools in China’s terrestrial ecosystems: New estimates based on an intensive field survey. Proc. Natl. Acad. Sci. USA 2018, 115, 4021–4026. [Google Scholar] [CrossRef]
  44. Wang, S.Q.; Zhou, C.H.; Li, K.R.; Zhu, S.L.; Huang, F.H. Analysis on Spatial Distribution Characteristics of Soil Organic Carbon Reservoir in China. Acta Geogr. Sin. 2000, 67, 533–544. [Google Scholar]
  45. Deng, L.; Liu, G.B.; Shangguan, Z.P. Land-use conversion and changing soil carbon stocks in China’s ‘grain-for-Green’Program: A synthesis. Glob. Chang. Biol. 2014, 20, 3544–3556. [Google Scholar] [CrossRef] [PubMed]
  46. Yang, Y.; Liu, L.; Zhang, P.; Wu, F.; Wang, Y.; Xu, C.; Kuzyakov, Y. Large-scale ecosystem carbon stocks and their driving factors across Loess Plateau. Carbon Neutrality 2023, 2, 5. [Google Scholar] [CrossRef]
  47. Zheng, S.X.; Shangguan, Z. Variation in the δ13C value of typical plants of loess plateau over the last 70 years. Chin. J. Plant Ecol. 2005, 29, 289–295. [Google Scholar] [CrossRef]
  48. Zheng, S.; Shangguan, Z. Spatial patterns of foliar stable carbon isotope compositions of C3 plant species in the Loess Plateau of China. Ecol. Res. 2007, 22, 342–353. [Google Scholar] [CrossRef]
  49. Mackensen, A.; Schmiedl, G. Stable carbon isotopes in paleoceanography: Atmosphere, oceans, and sediments. Earth-Sci. Rev. 2019, 197, 102893. [Google Scholar] [CrossRef]
  50. Sun, J.; Takahashi, Y.; Strosnider, W.H.J.; Kogure, T.; Wu, P.; Cao, X. Tracing and quantifying contributions of end members to karst water at a coalfield in southwest China. Chemosphere 2019, 234, 777–788. [Google Scholar] [CrossRef] [PubMed]
  51. Cai, C.F.; Ding, S.W.; Shi, Z.H.; Huang, L. Study of applying USLE and geographical information system IDRISI to predict soil erosion in small watershed. Sci. Soil Water Conserv. 2000, 14, 19–24. [Google Scholar]
  52. Williams, H.R.; Renard, K.G.; Dyke, P.T. EPIC: A new method for assessing erosion’s effect on soil productivity. J. Soll Water Conserv. 1983, 38, 381–383. [Google Scholar]
  53. Xie, X.L.; Sun, B.; Zhou, H.Z.; Li, Z.P.; Li, A.B. Organic carbon density and storage in soils of China and spatial analysis. Acta Pedol. Sin. 2004, 41, 35–43. [Google Scholar]
  54. Zhang, W.B.; Zhao, Y.; Liu, B.Y. Rainfall erosivity estimation using daily rainfall amounts. Sci. Geogr. Sin. 2002, 22, 705–711. [Google Scholar]
  55. Yang, Z.S. Study on soil loss equation in Jinsha River Basin of Yunnan Province. J. Mt. Sci. 2002, 20, 1–9. [Google Scholar]
  56. Chen, J.; Li, Z.; Xiao, H.; Ning, K.; Tang, C. Effects of land use and land cover on soil erosion control in southern China: Implications from a systematic quantitative review. J. Environ. Manag. 2021, 282, 111924. [Google Scholar] [CrossRef]
  57. SL190-2007; Standards for Classification and Gradation of Soil Erosion. Ministry of Water Resources of the People’s Republic of China: Beijing, China, 2008.
  58. Liu, J.; Fa, K.; Zhang, Y.; Wu, B.; Qin, S.; Jia, X. Abiotic CO2 uptake from the atmosphereby semiarid desert soil and its partitioning into soil phases. Geophys. Res. Lett. 2015, 42, 5779–5785. [Google Scholar] [CrossRef]
  59. Ma, J.; Liu, R.; Tang, L.S.; Lan, Z.D.; Li, Y. A downward CO2 flux seems to have nowhere to go. Biogeosciences 2014, 11, 6251–6262. [Google Scholar] [CrossRef]
  60. Li, Y.; Wang, Y.; Tang, L. The Effort to Re-Activate the Inorganic Carbon in Soil. Acta Pedol. Sin. 2016, 53, 845–849. [Google Scholar]
  61. Marx, A.; Dusek, J.; Jankovec, J.; Sanda, M.; Vogel, T.; van Geldern, R.; Hartmann, J.; Barth, J.A.C. A review of CO2 and associated carbon dynamics in headwater streams: A global perspective. Rev. Geophys. 2017, 55, 560–585. [Google Scholar] [CrossRef]
  62. Sobek, S.; Tranvik, L.J.; Prairie, Y.T.; Kortelainen, P.; Cole, J.J. Patterns and regulation of dissolved organic carbon: An analysis of 7,500 widely distributed lakes. Limnol. Oceanogr. 2007, 52, 1208–1219. [Google Scholar] [CrossRef]
  63. Stone, R. Have desert researchers discovered a hidden loop in the carbon cycle? Science 2008, 320, 1409–1410. [Google Scholar] [CrossRef]
  64. Ma, J.; Wang, Z.Y.; Stevenson, B.A.; Zheng, X.J.; Li, Y. An inorganic CO2 diffusion and dissolution process explains negative CO2 fluxes in saline/alkaline soils. Sci. Rep. 2013, 3, 2025. [Google Scholar] [CrossRef]
  65. Hamerlynck, E.P.; Scott, R.L.; Sánchez-Cañete, E.P.; Barron-Gafford, G.A. Nocturnal soil CO2 uptake and its relationship to subsurface soil and ecosystem carbon fluxes in a Chihuahuan Desert shrubland. J. Geophys. Res. Biogeosci. 2013, 118, 1593–1603. [Google Scholar] [CrossRef]
  66. Li, Y.; Wang, Y.G.; Houghton, R.A.; Tang, L.-S. Hidden carbon sink beneath desert. Geophys. Res. Lett. 2015, 42, 5880–5887. [Google Scholar] [CrossRef]
  67. Kateb, H.E.; Zhang, H.; Zhang, P.; Mosandl, R. Soil erosion and surface runoff on different vegetation covers and slope gradients: A field experiment in Southern Shaanxi Province, China. Catena 2013, 105, 1–10. [Google Scholar] [CrossRef]
  68. Ruiz-Colmenero, M.; Bienes, R.; Eldridge, D.J.; Marques, M. Vegetation cover reduces erosion and enhances soil organic carbon in a vineyard in the central Spain. Catena 2013, 104, 153–160. [Google Scholar] [CrossRef]
  69. Liu, Z.; Dreybrodt, W.; Wang, H. A new direction in effective accounting for the atmospheric CO2 budget: Considering the combined action of carbonate dissolution, the global water cycle and photosynthetic uptake of DIC by aquatic organisms. Earth-Sci. Rev. 2010, 99, 162–172. [Google Scholar] [CrossRef]
  70. Wang, Z.; Hoffmann, T.; Six, J.; Kaplan, J.O.; Govers, G.; Doetterl, S.; Van Oost, K. Human-induced erosion has offset one-third ofcarbon emissions from land cover change. Nat. Clim. Chang. 2017, 7, 345–350. [Google Scholar] [CrossRef]
  71. Zhang, H.; Lauerwald, R.; Regnier, P.; Ciais, P.; Yuan, W.; Naipal, V.; Guenet, B.; Van Oost, K.; Camino-Serrano, M. Simulating erosion-induced soil and carbon delivery from uplands to rivers in a global land surface model. J. Adv. Model. Earth Syst. 2020, 12, e2020MS002121. [Google Scholar] [CrossRef]
  72. Liu, Y.; Wang, X.; Wang, Y.; Tong, C.; Yuan, W. Increased lateral transfer of soil organic carbon induced by climate and vegetation changes over the southeast coastal region of China. J. Geophys. Res. Biogeosci. 2019, 124, 3902–3915. [Google Scholar] [CrossRef]
  73. Li, X.; Wang, J.; Lin, J.; Yin, W.; Shi, Y.; Wang, L.; Xiao, H.; Zhong, Z.; Jiang, H.; Shi, Z. Hysteresis analysis reveals dissolved carbon concentration–discharge relationships during and between storm events. Water Res. 2022, 226, 119220. [Google Scholar] [CrossRef]
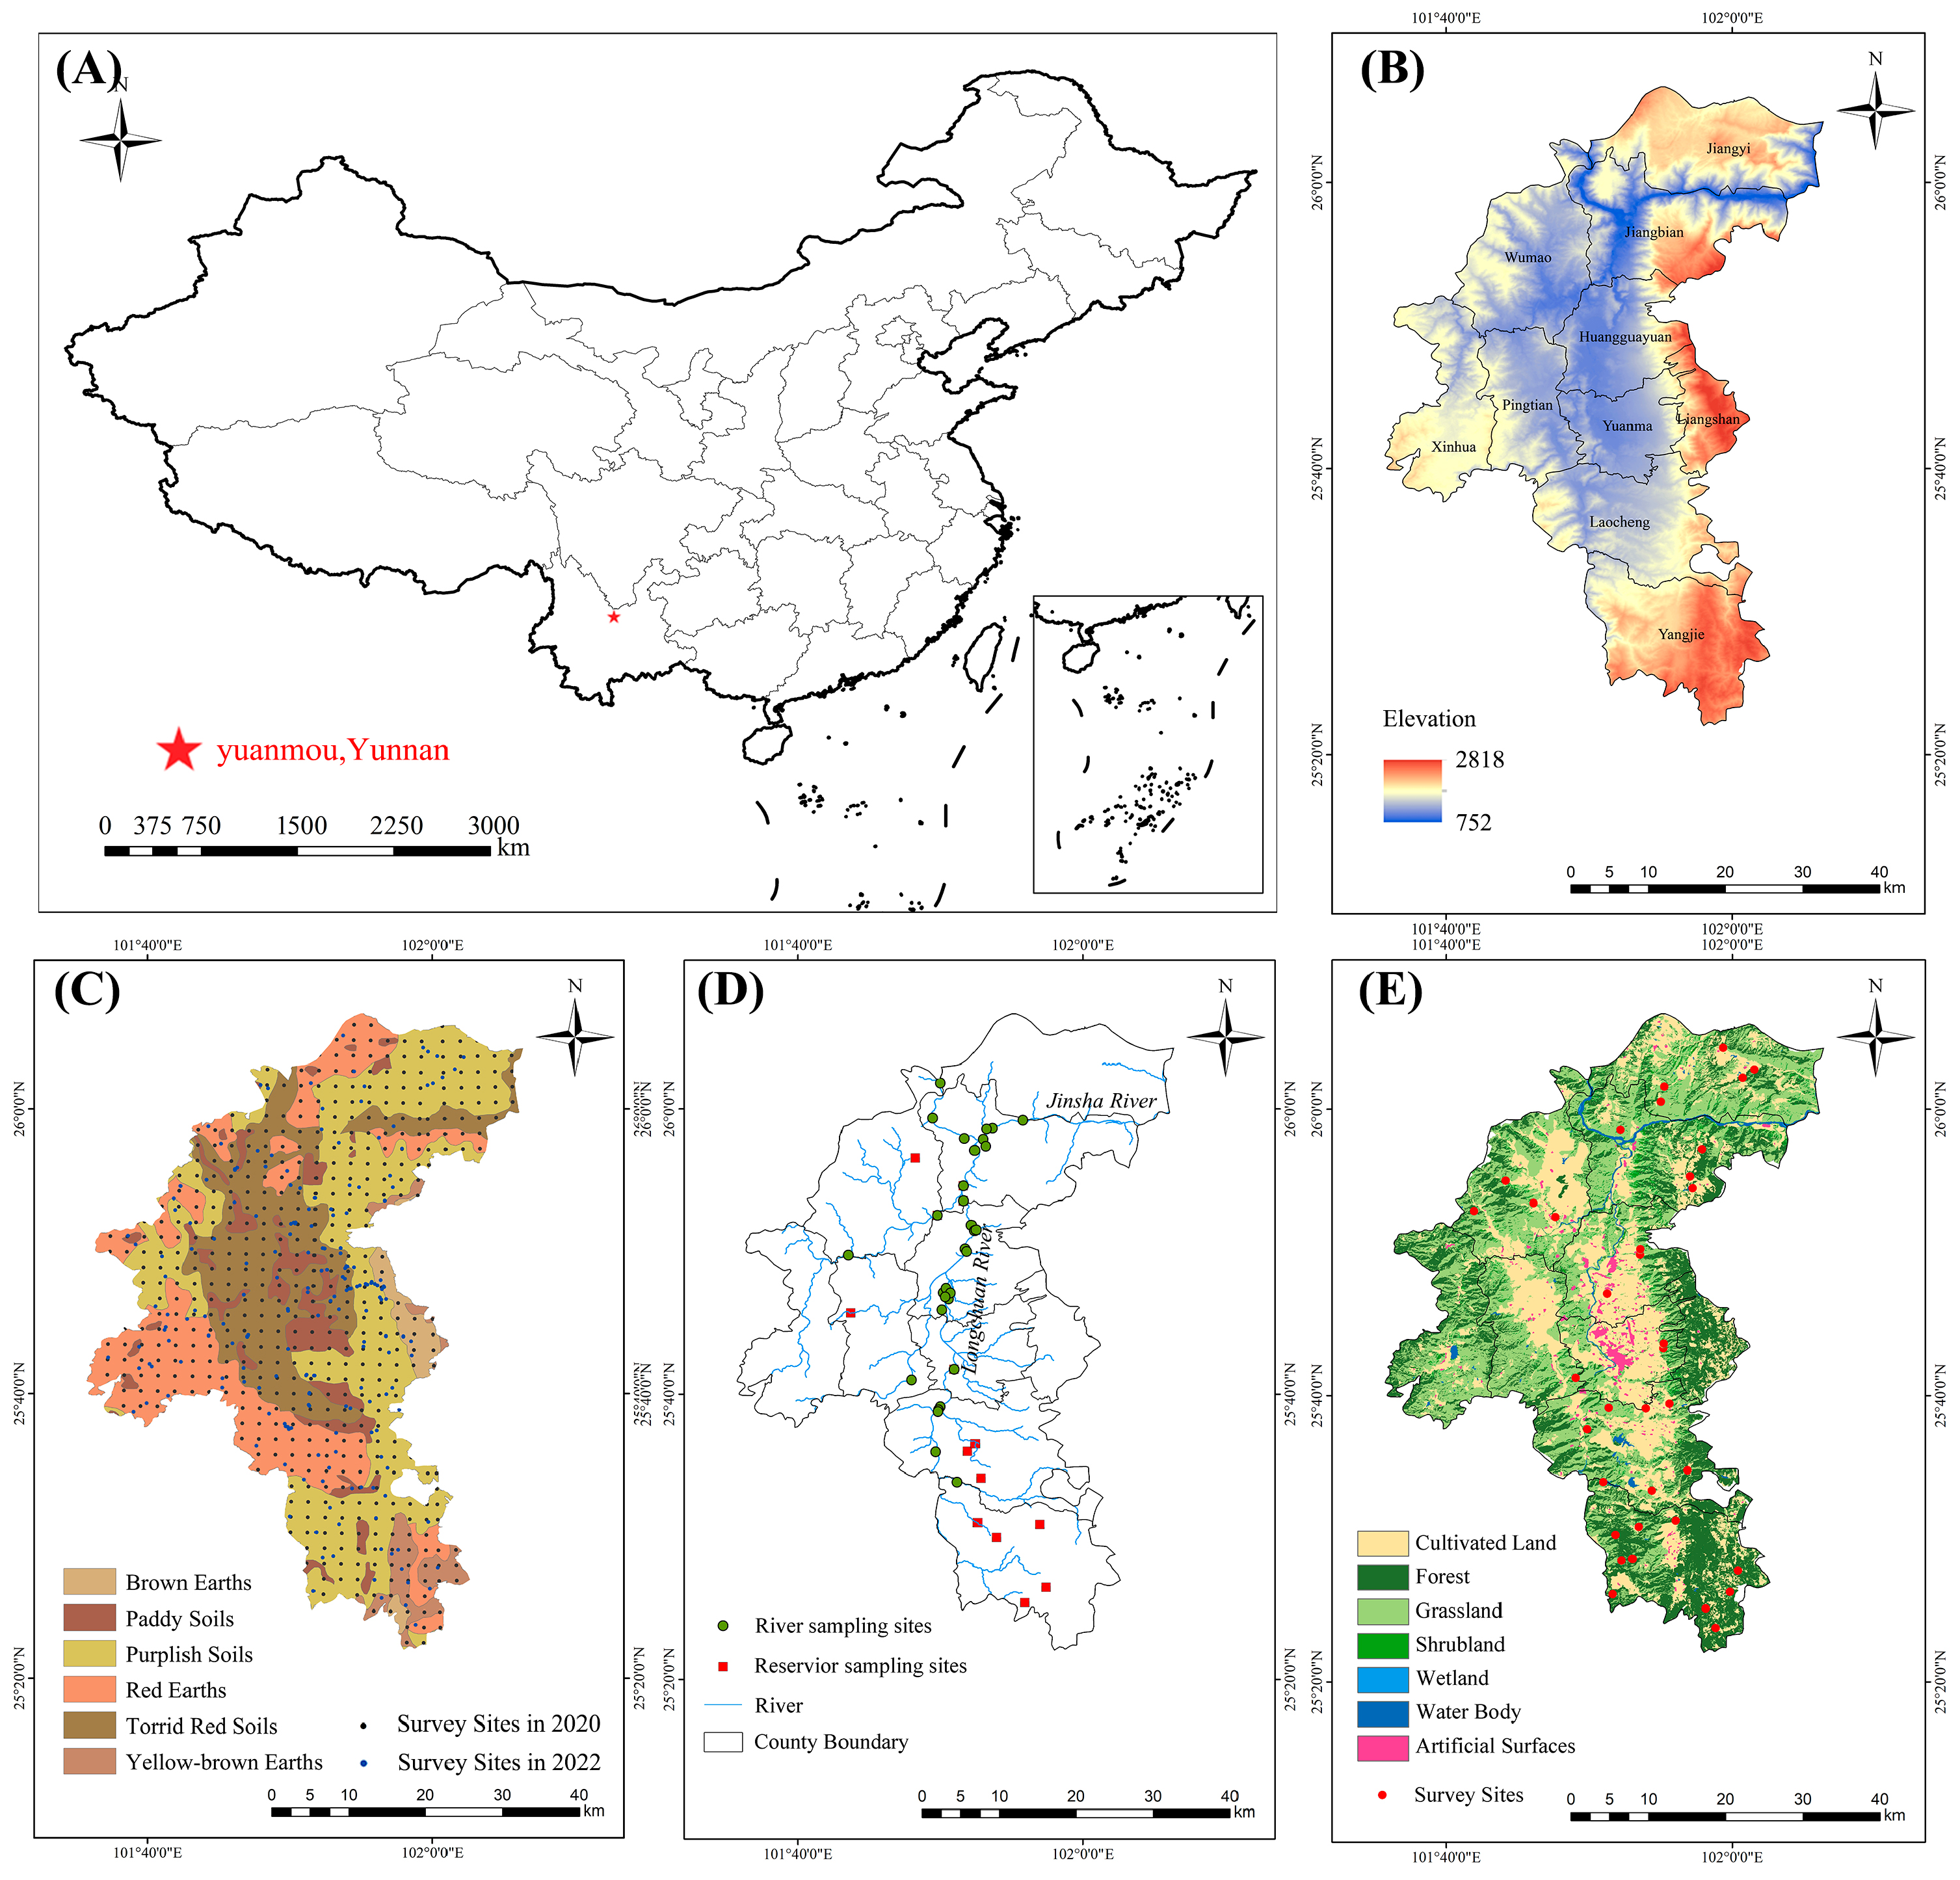
Figure 1. Study area and survey sites. (A) The location of Yuanmou County, Yunnan Province; (B) the topography map of Yuanmou County; (C) soil sampling sites; (D) water sampling sites; and (E) soil and vegetation carbon isotope survey sites.
Land 13 01053 g001
Figure 2. Soil carbon pool changes.
Land 13 01053 g002
Figure 3. WaTEM/SEDEM model verification.
Land 13 01053 g003
Figure 4. Estimated annual average soil loss and deposition rate for Yuanmou County based on WaTEM/SEDEM.
Land 13 01053 g004
Figure 5. Content and correlation of SIC, SOC and TC in different erosion intensity grades. *, **, ***, and **** represent significance levels of 0.05, 0.01, 0.001, and 0.0001. (A) content and correlation of SIC in different erosion intensity grades; (B) the proportion of SIC contents to TC contents in different soil erosion intensity grades; (C) content and correlation of SOC in different erosion intensity grades; (D) the proportion of SOC contents to TC contents in different soil erosion intensity grades; (E) content and correlation of TC in different erosion intensity grades; (F) SOC and SIC contents in different soil erosion intensity grades.
Land 13 01053 g005
Figure 6. The content of different forms of carbon in water. (A) Carbon content of different forms; (B) the proportion of carbon content in different forms.
Land 13 01053 g006
Figure 7. Carbon isotope characterization of soil and water. (A) δ13C of water and soil; (B) the relationship between soil δ13C and vegetation coverage.
Land 13 01053 g007
Figure 8. Water erosion and its carbon flux of lateral transfer.
Land 13 01053 g008
Table 1. Comparison of the WaTEM/SEDEM model validation effect.
YearObserved Value (106t yr−1)Simulated Value (106t yr−1)
20033.282.69
20042.402.23
20051.841.91
NS0.63
RMSE0.36
20062.201.98
20071.281.48
20082.202.04
NS0.79
RMSE0.2
Disclaimer/Publisher’s Note: The statements, opinions and data contained in all publications are solely those of the individual author(s) and contributor(s) and not of MDPI and/or the editor(s). MDPI and/or the editor(s) disclaim responsibility for any injury to people or property resulting from any ideas, methods, instructions or products referred to in the content.