Article

The Relationship between Urbanization and the Water Environment in the Chengdu-Chongqing Urban Agglomeration

1
College of Architecture and Urban-Rural Planning, Sichuan Agricultural University, Ya’an 625014, China
2
Chengdu Urban Planning and Design Institute Co., Ltd., Chengdu 610031, China
3
College of Water Conservancy and Hydro-Power Engineering, Sichuan Agricultural University, Ya’an 625014, China
*
Author to whom correspondence should be addressed.
Land 2024, 13(7), 1054; https://doi.org/10.3390/land13071054
Submission received: 4 May 2024 / Revised: 28 June 2024 / Accepted: 12 July 2024 / Published: 14 July 2024
(This article belongs to the Section Landscape Ecology)

Abstract

:
Ensuring the harmonization between urbanization and water environment systems is imperative for fostering sustainable regional development in the future. With urban agglomerations and metropolitan areas increasingly dominating urbanization trends in China, it is crucial to explore the interdependent relationship between urbanization and the water environment. Such exploration holds significant implications for water resource management and the formulation of urbanization policies. This study utilizes a comprehensive index system encompassing urbanization and the water environment. It examines the coupled and coordinated spatial and temporal dynamics of these systems within the Chengdu-Chongqing Urban Agglomeration from 2011 to 2019. This analysis employs the Coupled Coordination Degree model alongside the spatial autocorrelation model. The results show that there is still much room for improving the urbanization development level and the water environment quality. During the study period, a nonlinear and nearly U-shaped evolutionary trajectory was observed between the two systems. The results suggest that there is a progression from basic to more advanced coordination between urbanization and water environment at the city cluster scale. Urbanization appears to generally lag behind the water environment in terms of coordination. At the municipal scale, there is a gradient in which some cities show better coordination compared to others. Spatially, the coupling and coordination of this region exhibited dual-core development characteristics centered around Chengdu and Chongqing. The region is in the transition stage towards a core-type networked and decentralized development mode, which has not yet formed an integrated pattern. This offers a theoretical and technical framework for harmonizing water environments and urbanization in similar regions globally.

1. Introduction

Urbanization is one of the most important manifestations of the evolution of human society, while the ecological environment is the natural environment and support system on which human beings rely for survival and prosperity. As two complex systems, the study of the relationship between urbanization and the ecological environment is a hot spot in the field of earth system science and sustainable development [1,2]. The water environment is an important part of the ecological environment and an important resource for the continuous evolution of the urban system to a higher level [3], and its rational and efficient utilization will affect the sustainable development of cities [4,5]. In recent years, global urbanization has been progressing at a remarkably rapid pace. It is projected that the proportion of the global urban population will rise from 55% in 2018 to 68% by 2050, with an overall increase of 2.5 billion in the urban population [6]. India, China, and Nigeria are countries with an especially high concentration of new urban populations. According to the data published by the National Bureau of Statistics of China, in 2019, the urbanization rate of China’s resident population exceeded 60% for the first time, marking China’s entry into the urbanization stage 2.0: Urbanization from rural populations to large/medium/small cities has transformed into large urbanization from rural or medium/small cities to central cities, with urban agglomerations and metropolitan areas being the main forms of urban development [7,8]. The urban scale was constantly expanding as the population gathered in urban agglomerations and metropolitan areas, which brought a lot of social and economic benefits while also leading to increasing pressure on urban water resources [9,10]. According to the Ministry of Water Resources of China, more than 400 cities had substandard water resources in 2019, accounting for about 60% of the cities in the country. The interactive coercion between urbanization and water conservation, water shortages, water deterioration, and low water efficiency have become prominent environmental problems in some regions [11,12]. Therefore, in the context of urban agglomerations, studying the harmonious relationship between the two is not only the basis for effective water resource management, but also the focus for achieving sustainable urban or regional development.
Research on this topic has focused on three main areas: one is the stress of urbanization on the aquatic environment. In terms of urban population aggregation, some scholars have identified the current urban population and surface water quality on a national or regional scale to analyze the main drivers of water environmental stress [13,14]. In terms of spatial expansion, many scholars have carried out correlation analysis or spatial information simulation by using multi-year continuous land cover data and surface water runoff, water quality monitoring, and groundwater supply data from urban and surrounding suburban and watershed areas [15,16,17]. These studies confirmed that urban expansion leads to water scarcity, increased flood risk, and aggravated water pollution, with the most significant deterioration in highly urbanized areas. These pressures were more pronounced in the less developed regions. Hydrological simulations and analyses were mainly conducted using the SWAT model (Soil and Water Assessment Tool), the STORM model (Stor-85 Age Treatment, Overflow Runoff Model), and the neural network model [18,19,20,21].
Another area is the study of water environment constraints on the urbanization process. For economically developed regions or regions where urban growth was leveling off, water resources presented an insignificant or weakening constraint effect on urbanization [22,23,24,25,26], which has been confirmed at different scales such as global, continental, national, and regional; for less-developed or fast-growing cities, urban development often adopts unsustainable land and water resource practices due to inadequate infrastructure, leading to water shortages and reduced environmental carrying capacity, thereby hindering urbanization. In short, the water environment issue is one of the major constraint’s factors to the urbanization process [25].
The last area is the coupling degree and response relationship between urbanization and the water environment. To achieve sustainable urban development, a balance between urbanization rate and water environment carrying capacity is essential. The research focuses on measuring the coupling relationship between urbanization and water systems using methods like the extended environmental load model and the Coupled Coordination Degree (CCD) model, based on system dynamics, urban metabolism, and ecological footprint theories [1]. For example, the dynamic coupling model was used to investigate the dynamic relationship between water resource utilization and urbanization [27]. Some scholars constructed a coupled analysis model of urbanization development rate and water resource conflict risk, determined the corresponding water resource conflict level according to the coupling coordination degree, and obtained the trigger threshold of water resource conflict by taking the Haihe River basin as an example [28]. The system dynamics model and a CCD model were used to simulate a Business-As-Usual (BAU) scenario and five alternative regulation scenarios in a study of Kunming from 2016 to 2025 to derive the effects of various socioeconomic development patterns and water conservation efforts in improving CCD [29]. Using remote sensing and GIS, urban development patterns were predicted with techniques like gray correlation to study the relationship between urban expansion and water resources. Continuous expansion can harm nature, so scholars have conducted quantitative analyses to control urbanization’s negative impacts. The cellular automata-based Coupled Social-Ecological System (CSES) model was used to reveal the effects of urbanization on hydrology, water resources, and the feedback on social and ecological systems [30]. The urban growth model and hydrological mode were used to measure the coupled relationship between urban growth and municipal water supply in the Baltimore metropolitan area, United States, and simulated an urban growth scenario for 2030 [31].
The results of these studies showed that urbanization and the water environment were closely linked and showed the typical characteristics of nonlinearity, fluctuation, hierarchy, and feedback of complex systems [32,33,34]. The existing studies have been conducted from two points, first, from the perspective of water resources, typical watersheds [30] or arid and semi-arid areas with water scarcity [25] were selected where urbanization development was often slow; second, from the perspective of urbanization, the Baltimore metropolitan area in the United States, the London metropolitan area, and the Beijing-Tianjin-Hebei region of China [28,31] were examined, where development is generally at a more mature stage. Urbanization requires long-term development, especially in transitioning regions. The Chengdu-Chongqing Urban Agglomeration (CCUA), with its dense population and industry, faces huge challenges. Research on this cluster can deepen understanding of urbanization and water environment interactions, supporting sustainable development and water management. This provides a theoretical and technical basis for the coordination of water environments and urbanization in other similar regions around the world.

2. Materials and Methods
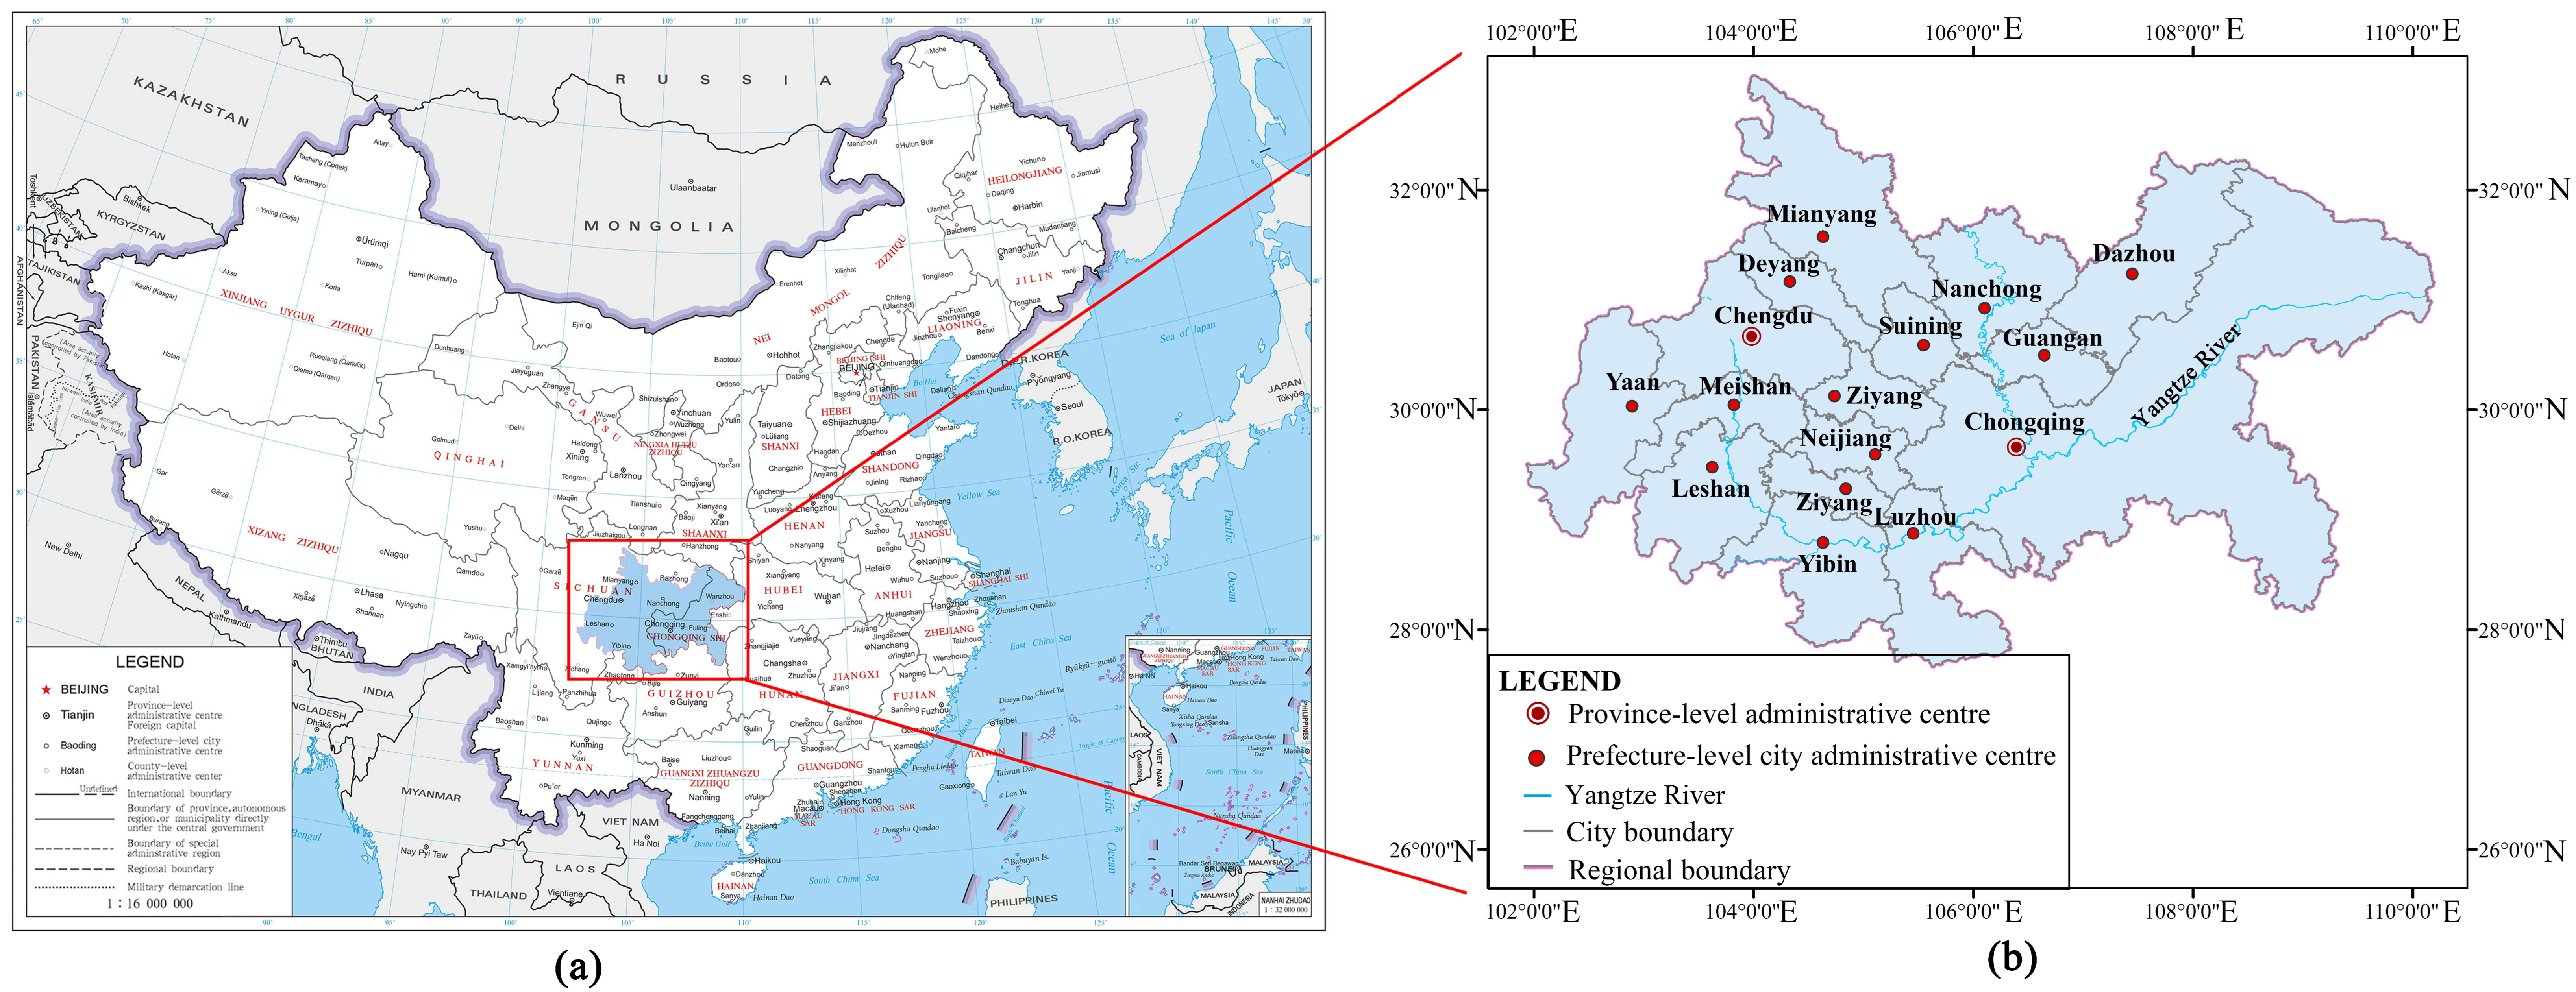
2.1. Study Area

Located in southwest China, CCUA is one of the five megacity clusters in China, alongside Beijing-Tianjin-Hebei, the Yangtze River Delta, the Pearl River Delta, and the Yangtze River Middle River City Cluster; it is an important growth pole, driving high-quality development in the west. The city cluster includes 15 cities, including Chengdu, Deyang, and Mianyang in Sichuan Province, and 27 districts (counties), including Wanzhou, Fuling, and Yuzhong in Chongqing (Figure 1), with a regional area of 185,000 km2, accounting for 1.93% of the national land area. This study took municipal administrative divisions as the study unit for research consistency, including 16 municipal administrative units such as Chengdu, Chongqing, Mianyang, and so on.
Under national strategic deployment and policy guidance, after years of development, the urbanization of this region has made remarkable achievements, making it an important fulcrum and power source to promote the new round of western development at present [35]. The permanent population in this region was about 102.7086 million, accounting for 7.12% of the national population by the end of 2020. There are two super megacities, numerous large and medium-sized cities, and several small towns, with a 53.9% urbanization rate. Although it is lower than the national average level, it is still the most densely distributed and densely populated area in western China. For the economy, the regional GDP in 2020 was about USD 0.95 trillion, accounting for 5.90% of the national total, 133% higher than that in 2011, and the GDP per capita reached USD 9247, making it the city group with the strongest comprehensive economic strength in the western region of China and the upper reaches of the Yangtze River Economic Belt.
The CCUA is located in the upper reaches of the Yangtze River (Figure 1), with the main stream of the Yangtze River and the tributaries of the Jialing River, the Min River, and the Tuo River flowing through its territory. Being rich in total water resources but poor per capita is one of the main challenges facing the region. In 2020, for example, the per capita comprehensive water consumption of urban agglomeration was 295.32 cubic meters, lower than the national average of 412 cubic meters. Meanwhile, the demand for water resources increased as urbanization developed rapidly, and the low water efficiency caused by extensive utilization and development of water resources was another challenge faced by some cities.

2.2. Research Framework

The objective of this study is to analyze the interaction between urbanization and the water environment in order to provide insights for better management and coordination. The research framework (Figure 2) proceeds as follows:
Creates a connotation mode. This allows for a more complete and accurate assessment of urbanization and water environment levels.
Preprocess the data from the study area for the period 2011–2018 and determine the weight of each index layer using the entropy value method. This helps to accurately show how important each factor is in the overall analysis.
Establish a comprehensive index system for urbanization and the water environment. Ensure that all relevant factors are considered to provide a holistic assessment.
Develop a CCD model and a spatial autocorrelation model. This is essential to quantifying the relationship between urbanization and the water environment and to understanding the spatial patterns of these interactions.
Calculate the value of CCD and global and local spatial autocorrelation. This helps to understand the trends and spatial characteristics of their interaction, providing a clear picture of their coupled dynamics.

2.3. Methods

2.3.1. Data Source

The data for this study were provided by the China Urban Statistical Yearbook (2012–2019), Sichuan Statistical Yearbook (2012–2020), Chongqing Statistical Yearbook (2012–2020), Sichuan Provincial Water Resources Bulletin (2011–2019), Chongqing Municipal Water Resources Bulletin (2011–2019), and relevant national economic and social development statistical bulletins from various regions [36,37,38].

2.3.2. Indicator System and Weights

For the urbanization system index system, the study followed the multidimensional connotation of urbanization [39,40,41,42], combined with the socio-economic characteristics of CCUA to determine the urbanization system index system covering population urbanization, economic urbanization, spatial urbanization, and social urbanization subsystems. The research selects 16 representative basic indicators of urbanization as secondary indicators, including urbanization rate of resident population, population density, share of employment in the third sector, urban registered unemployment rate, built-up area as a proportion of the city area, road network density, road area per capita, annual land acquisition area, GDP per capita, production weight, fixed asset investment per capita, disposable income per urban resident, number of doctors per 10,000 people, number of students in primary and secondary schools per 10,000 people, year-end cell phone subscribers, and culture center (station) (Table 1).
For the water environment, a system of indicators was constructed following the pressure-state-response framework [43,44,45], which is widely used in sustainable development research. The research selects 15 representative basic indicators of the water environment as secondary indicators, including total water resources, per capita water resources, water resource development and utilization rate, water supply (use) penetration rate, greening coverage of built-up areas, million Yuan GDP water consumption, water consumption for secondary production, per capita daily domestic water consumption in urban areas, urban sewage discharge, industrial wastewater discharge, total water supply, density of drainage pipes in built-up areas, water conservation reuse rate, centralized sewage treatment rate, and effective irrigation rate of cultivated land (Table 2).
The indicator system includes positive and negative indicators. According to the characteristics of indicators, the higher the value of positive indicators, the better the performance will be; on the contrary, the higher the value of negative indicators, the lower the performance. Considering the differences in the order of magnitude and units of the original data of each indicator, the study selected a more desirable extreme value processing method for the evaluation indicators in linear dimensionless optimization [46]. The indicators are expressed as follows:
f i j = X i j m j M j m j   f i j   w i t h   p o s i t i v e   e f f e c t s
f i j = M j X i j M j m j   f i j   w i t h   n e g a t i v e   e f f e c t s
where X i j is the initial data, M j = max i X i j ; m j = min i X i j , f i j is the normalized value of X i j taking values in the range [0,1]. j is the index serial number and i represents the number of years.
Most of the existing research results use the analytic hierarchy process (AHP) and the Delphi method to determine the weight of indicators. These methods are relatively subjective weight determination methods, which will have a certain impact on the accuracy of research results. The study used the relatively objective entropy method to calculate indicator weights ( w j ) [47].
First, calculate the share of indicator j in year i ( r i j )
r i j = f i j i = 1 n f i j
Second, calculate the entropy value of the indicator j   ( e j )
e j = K i = 1 n r i j ln r i j ,     K = ln n 1
Third, calculate the information entropy redundancy ( d j )
d j = 1 e j
Finally, find the weights of the indicator j ( w j )
w j = d j i = 1 n d j
where n is the total number of samples. Utilizing the aforementioned formula, calculate the weight values for each indicator (Table 3 and Table 4).

2.3.3. Coupling Coordination Model

The concept of coupling originates from the field of physics and refers to the phenomenon of interaction and mutual influence between two or more systems or modes of motion influenced by various internal and external factors [48]. The coupling degree is a dimension used to portray the coupling relationship between systems or elements, which reflects the degree of mutual influence between systems. However, the coupling coordination degree presents a tendency for the system to evolve from order to order, and it is a measurement of the coordinated development degree between the systems [49].
The performance level index of urbanization and the water ecological environment subsystems are calculated by the weighted calculation method.
(1)
Calculation of comprehensive index
U i = i = 1 n w j × f i j , ( i = 1,2 , , 9 )
W i = i = 1 n w j × f i j , ( i = 1,2 , , 9 )
where U i is the comprehensive index of urbanization, W i is the water environment comprehensive index, n is the total number of samples, w j is the index weight, and f i j is the standardized value of the indicator X i j in the urbanization and water environment systems.
(2)
Calculation of coupling degree and coupling coordination degree
C i = U i × W i [ ( U i + W i ) 2 ] 2 1 / 2
where C i is the coupling degree, C i 0 ,   1 , when C i tends to 1, it means that the coupling between the systems is better and the systems reach benign resonance and tends to an orderly structure; when C i tends to 0, it means that the coupling between the systems is worse and the conflict between the systems is greater and tends to a disorderly structure.
T i = α U + β W
D i = C i × T i
where D i is the coupling coordination degree, T i is the comprehensive reconciliation index of urbanization and water environment, α and β are undetermined coefficients, representing contribution shares of the two subsystems, α + β = 1 . In previous studies, α and β are usually determined by using a subjective allocation of fixed values ( α = β = 0.5 ) [42], which reflects the subjective judgment of the researcher. Therefore, to avoid subjective judgments, the entropy method is used to objectively calculate the weight of the urbanization and the water environment system performance levels [47]. The calculation results show that the weight of urbanization system is 0.496, and the weight of water environment system is 0.504, so taking α = 0.496 and β = 0.504 .
According to the research on the state classification of coupling degree and coupling coordination degree, the coupling degree C i was divided into five stages (Table 5), and the coupling coordination degree D i was divided into five stages (Table 6). Where f U is the performance level of the urbanization system and f W is the performance level of the water environment system [48].

2.3.4. Spatial Autocorrelation Model

In global correlation analysis, the most commonly used statistic is the “Global Moran Index”, which mainly describes the average degree of correlation between all spatial units and surrounding areas in the whole region. To test the spatial autocorrelation of urbanization and the water environment and to test whether the coupling development has broken through the barrier of administrative divisions and has formed the spatial interaction between cities [50].
S 2 = 1 K · a = 1 K ( X a x ¯ ) 2
I = a = 1 K b = 1 K X a x ¯ X b x ¯ S 2 a = 1 K b = 1 K W a b
where I is Moran’s I value representing the global spatial autocorrelation, I 1 ,   1 . For I > 0 , the variables are positively correlated with each other, and the larger the value is, the higher the correlation will be; for I = 0 , it indicates that the variables are mutually independent and randomly distributed, and there is no spatial correlation; for I < 0 , the spatial correlation between the variables is negative, and the smaller the value is, the greater the variability will be.   X a and   X b represent the observation value of a and b units, respectively; x ¯ is the mean value of units; K is the total number of cities; and   W a b is the spatial weight matrix.
The Local Indicator of Spatial Association (LISA) was used to calculate and analyze the local correlation degree of the coupling coordination between urbanization and water environment at each stage, and to further determine the spatial autocorrelation degree of local spatial units and adjacent units in the evolution of the two systems [51]. The formula is as follows:
S 2 = 1 K · a = 1 K ( X a x ¯ ) 2
I a = X a x ¯ S 2 a = 1 K W a b X b x ¯
where I a is the local spatial autocorrelation. When I a is positive and large, there is a strong positive spatial autocorrelation between the observed attributes of regional unit a and adjacent units, showing local spatial aggregation (high-value or low-value aggregation); conversely, there is a strong negative spatial autocorrelation, which means that the attribute values of regional unit a are higher than adjacent units (high-low aggregation).

3. Results

3.1. Progress of Urbanization and Water Environment Progress

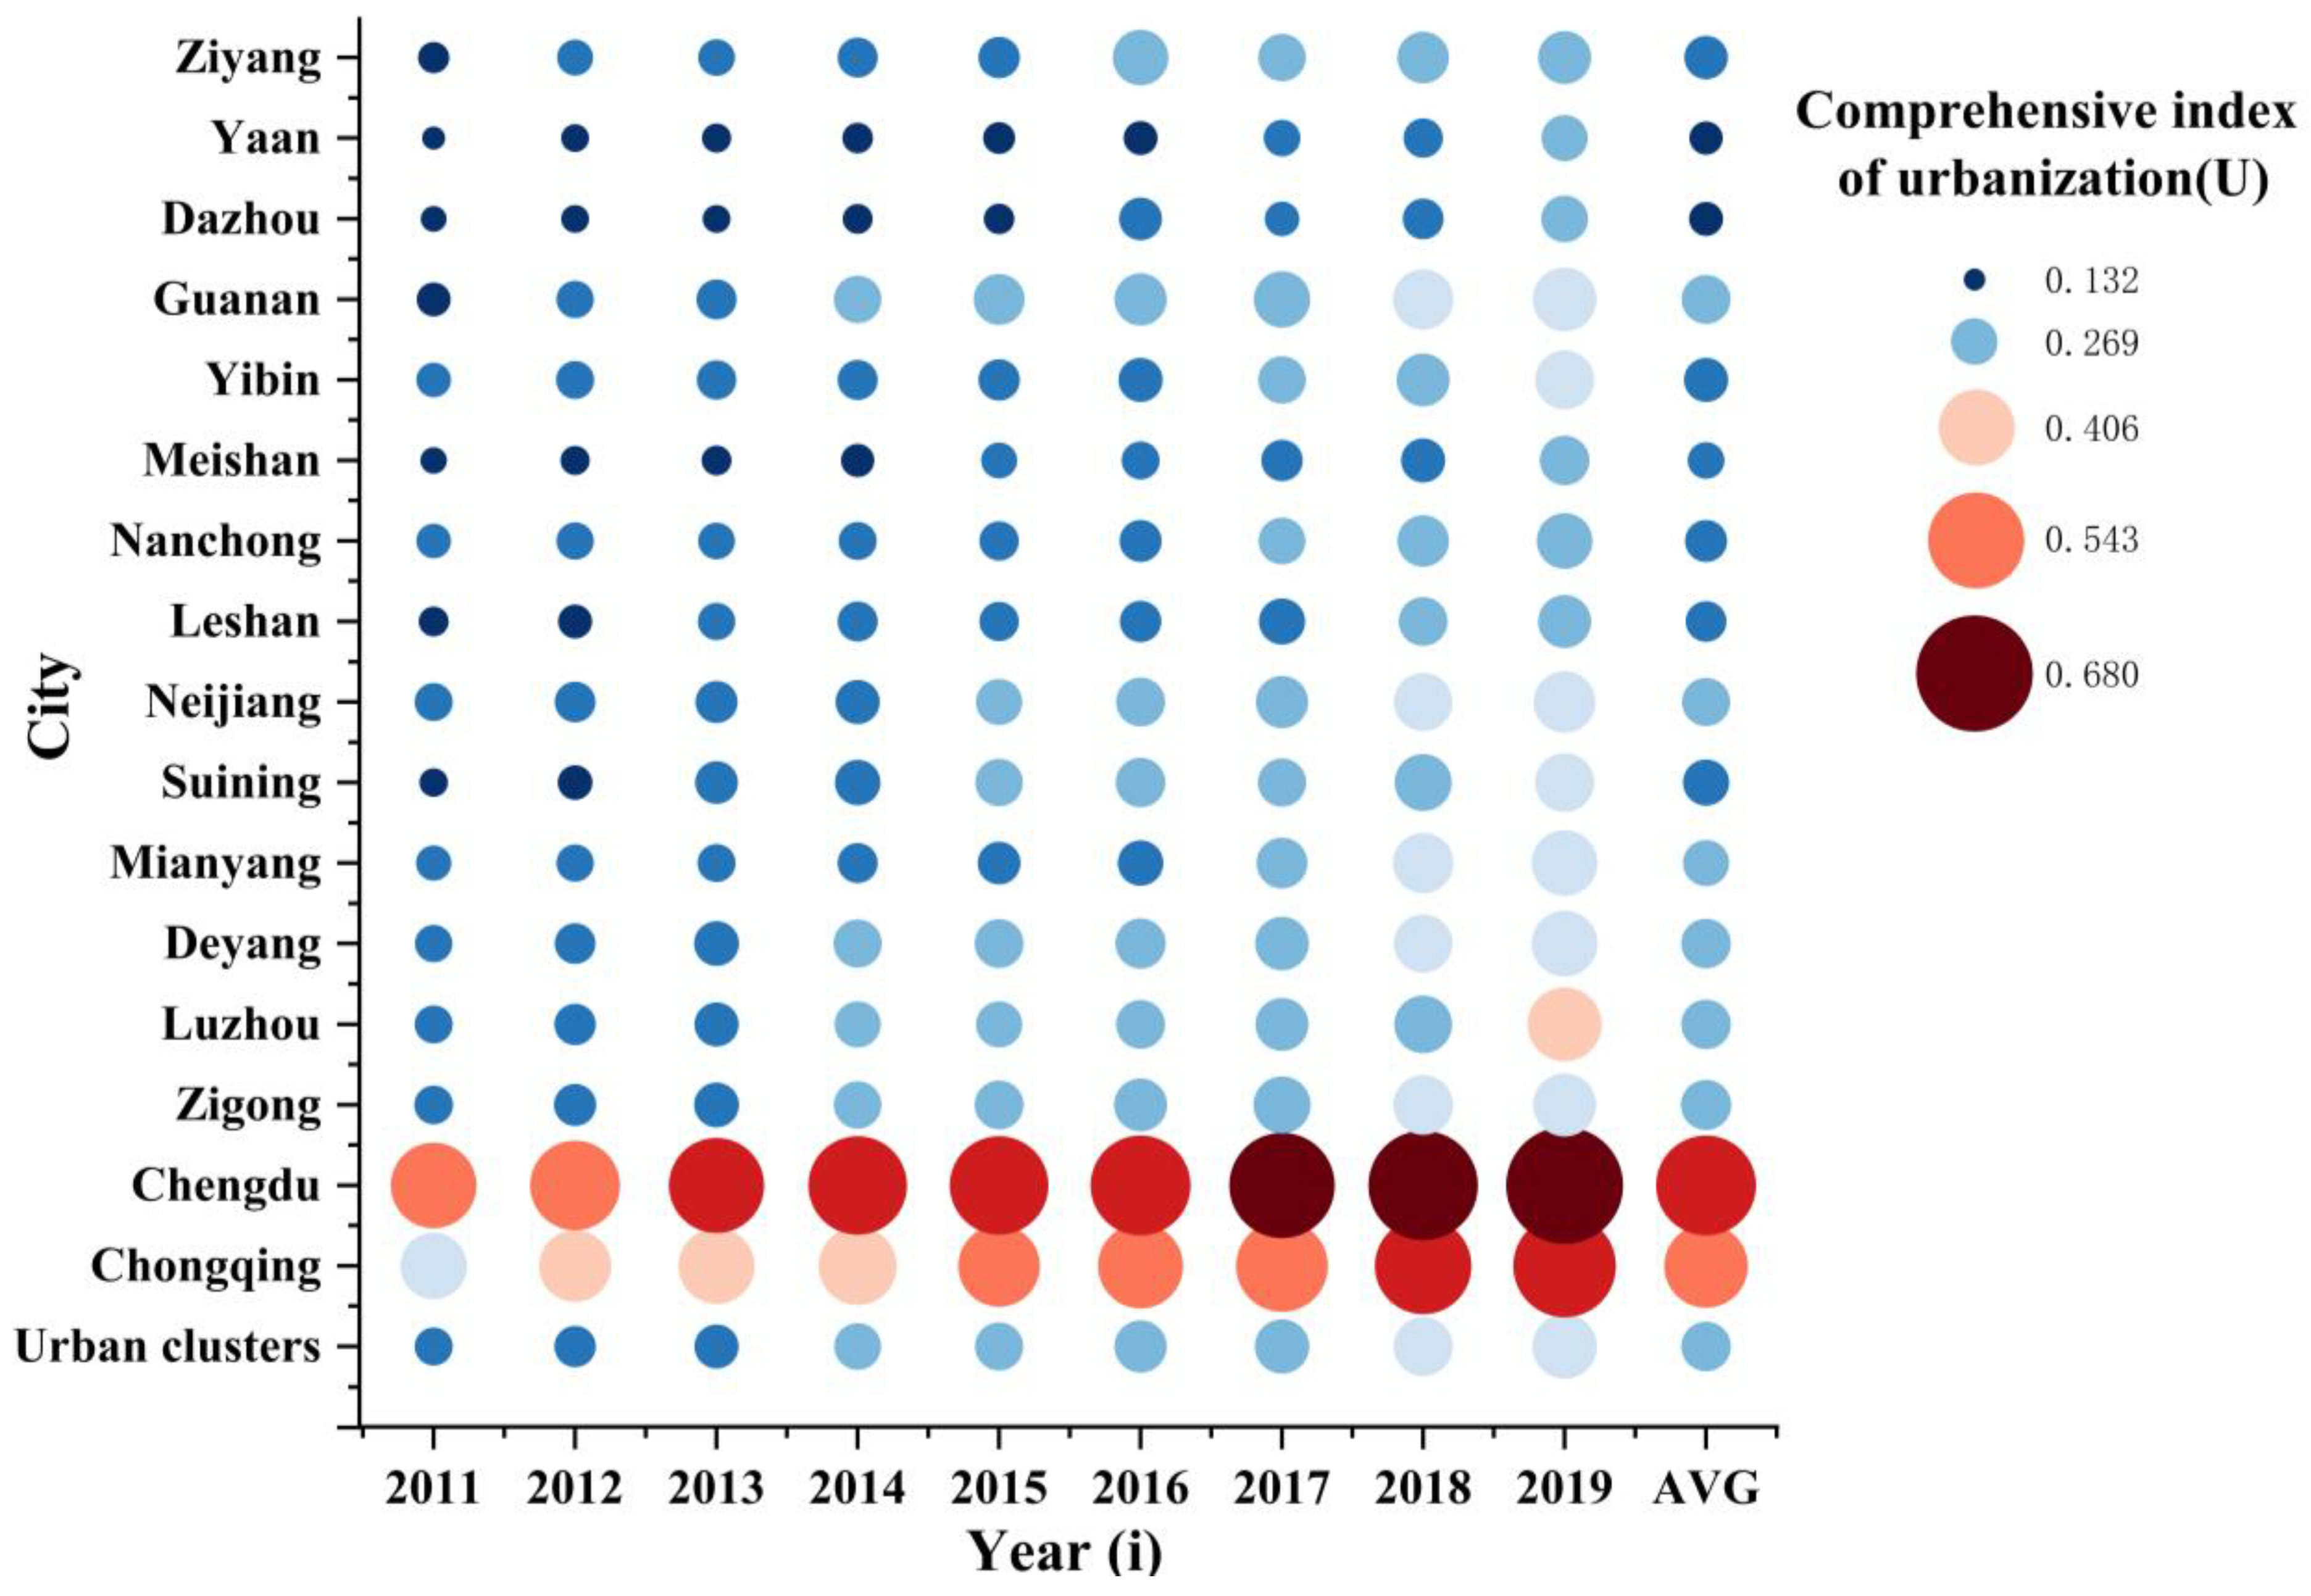
3.1.1. Urbanization Level Evaluation

The comprehensive index of urbanization (U) and its component indices showed an upward trend from 2011 to 2019, increased from 0.221 to 0.377, with an average annual growth rate of about 6.92% (Figure 3). However, the overall index was at the lower-middle level, and there was still much room for improvement. Since 2015, the growth rate of the urbanization composite index has increased significantly, which is mainly due to the rapid growth of population urbanization and economic urbanization. According to relevant data, during this period, a series of CCUA development plans and integrated cooperation schemes were successively issued and implemented at the national, provincial, and municipal levels, which injected new vitality into the development after 2015 and greatly promoted the economic growth of CCUA and the inflow of urban population. In terms of the driving force of urban agglomerations, the dominant factors driving urbanization development at different stages were different. According to each sub-index, the population urbanization weight score of 0.2669 is the highest in the subsystem, and the index score was also the highest in the subsystem, which was the most important driving factor for the urbanization development of urban agglomerations. Economic urbanization, on the other hand, has developed rapidly overall, increased nearly twofold from 0.033 in 2011 to 0.098 in 2019, surpassed spatial urbanization as the second driver since 2016, with an expanding influence. The spatial and social levels were relatively low and urgently needed to be improved.
The overall urbanization index (Figure 4) of most cities in the CCUA maintained a continuous upward trend with obvious gradient differences. As the central cities, Chengdu and Chongqing had performance levels ranging from 0.35–0.70, which were 1–2.5 times that of other cities in the same period, belonging to the first echelon; the average performance level of the remaining 14 cities and urban agglomerations was concentrated at a low level in the range of 0.20–0.40, which is significantly lower than that, belonging to the second echelon.
This analysis indicates that Chengdu and Chongqing serve as clear growth poles within the regional development of the CCUA, consistent with their roles as twin central cities possessing significant development advantages. However, the gradient differences also suggest that these central cities are not yet sufficiently effective in radiating and driving the development of neighboring cities. This implies that the overall regional development needs strengthening, and the potential for further urbanization remains to be fully explored. Additionally, various developmental shortcomings impact the urbanization of second-tier cities. Therefore, besides guidance at the national and provincial levels, local governments should formulate and implement relevant policies on population, space, economy, and social services tailored to local conditions to address the development gaps influenced by the central cities.

3.1.2. Water Environment Quality Evaluation

The comprehensive index of the water environment for the CCUA and its component indices were calculated using Equation (8). At the regional level, the comprehensive index of water environment (W) improved from 0.582 to 0.646 between 2011 and 2019, showing an overall fluctuating increase with an average annual growth rate of 1.36%, generally maintaining a medium level. One of the more pronounced declines was from 2012–2015, which decreased from 0.616 to 0.579, with an average annual decline rate of 1.54% (Figure 5. Comprehensive index of water environment (W) and component evaluation, 2011 to 2019). From the subsystem analysis, along with urban development during this period, the water resources development and utilization rate increased significantly on the one hand, and the pressure on urban water use increased; on the other hand, the related supporting facilities failed to improve in time, which led to a decline in the water supply (use) penetration rate, the centralized sewage treatment rate, and the repeated utilization rate of water conservation, thus showing a decline in the index of the states (W1) and response (W3) subsystems, with the average annual decline rate of the state subsystem index being 2.73% and the response subsystem index being 3.56%, resulting in a significant increase in the water environment risk faced by urban clusters. The improvement from 2017 to 2019 stemmed from the improvement of the state and response indices. The information showed that during this period, Chengdu and Chongqing carried out cooperation and improved the linkage mechanism to prevent and control pollution, including initiatives such as “joint control of transboundary pollution” and strengthening the prevention and control of water pollution in key river basins, which have improved the status and responsiveness of water resources to some extent. Thus, it can be seen that in the water environment system, the two subsystems of state and response were the main factors causing the overall level of fluctuations. From the water environment sub-indicators, the weight score of the response subsystem was the lowest, and the score has also been the lowest among the three subsystems, which indicated that the response subsystem was the shortcomings of the water environment system.
At the municipal level, the water environment performance level (Figure 6) of 16 cities had significant fluctuations during 2011–2019, with a slight overall increase. The localities have made certain achievements in water resources protection, but there was also a significant decrease in the performance level of several cities, such as Meishan City, Neijiang City, and Yibin City from 2016–2017. According to the Water Resources Bulletin of Sichuan Province, affected by natural factors, the precipitation in Sichuan in the past two years has decreased significantly compared with previous years. In 2016, the total water resources of Sichuan Province decreased by 10.50% compared with the average of many years. In 2017, the total water resources of Sichuan Province decreased by 5.67% compared with the average of many years, which puts greater pressure on the use and production of water resources in the whole region. On the other hand, with the rapid expansion of the city, the response subsystem regarding water resources supporting construction has not been followed up simultaneously, which is another important reason for the decline in the level of water environment performance. In Meishan City, for example, the urban land acquisition area in 2017 was twice as large as that in 2015, but the density of drainage pipes dropped from 11.89 to 9.78 km per square kilometer from 2016 to 2017, and the repetition rate of water conservation dropped to 22.12%. This showed that the combined effect of fluctuations in natural factors and the effective follow-up of water resources protection and management measures can cause significant disturbances in the level of the water environment.

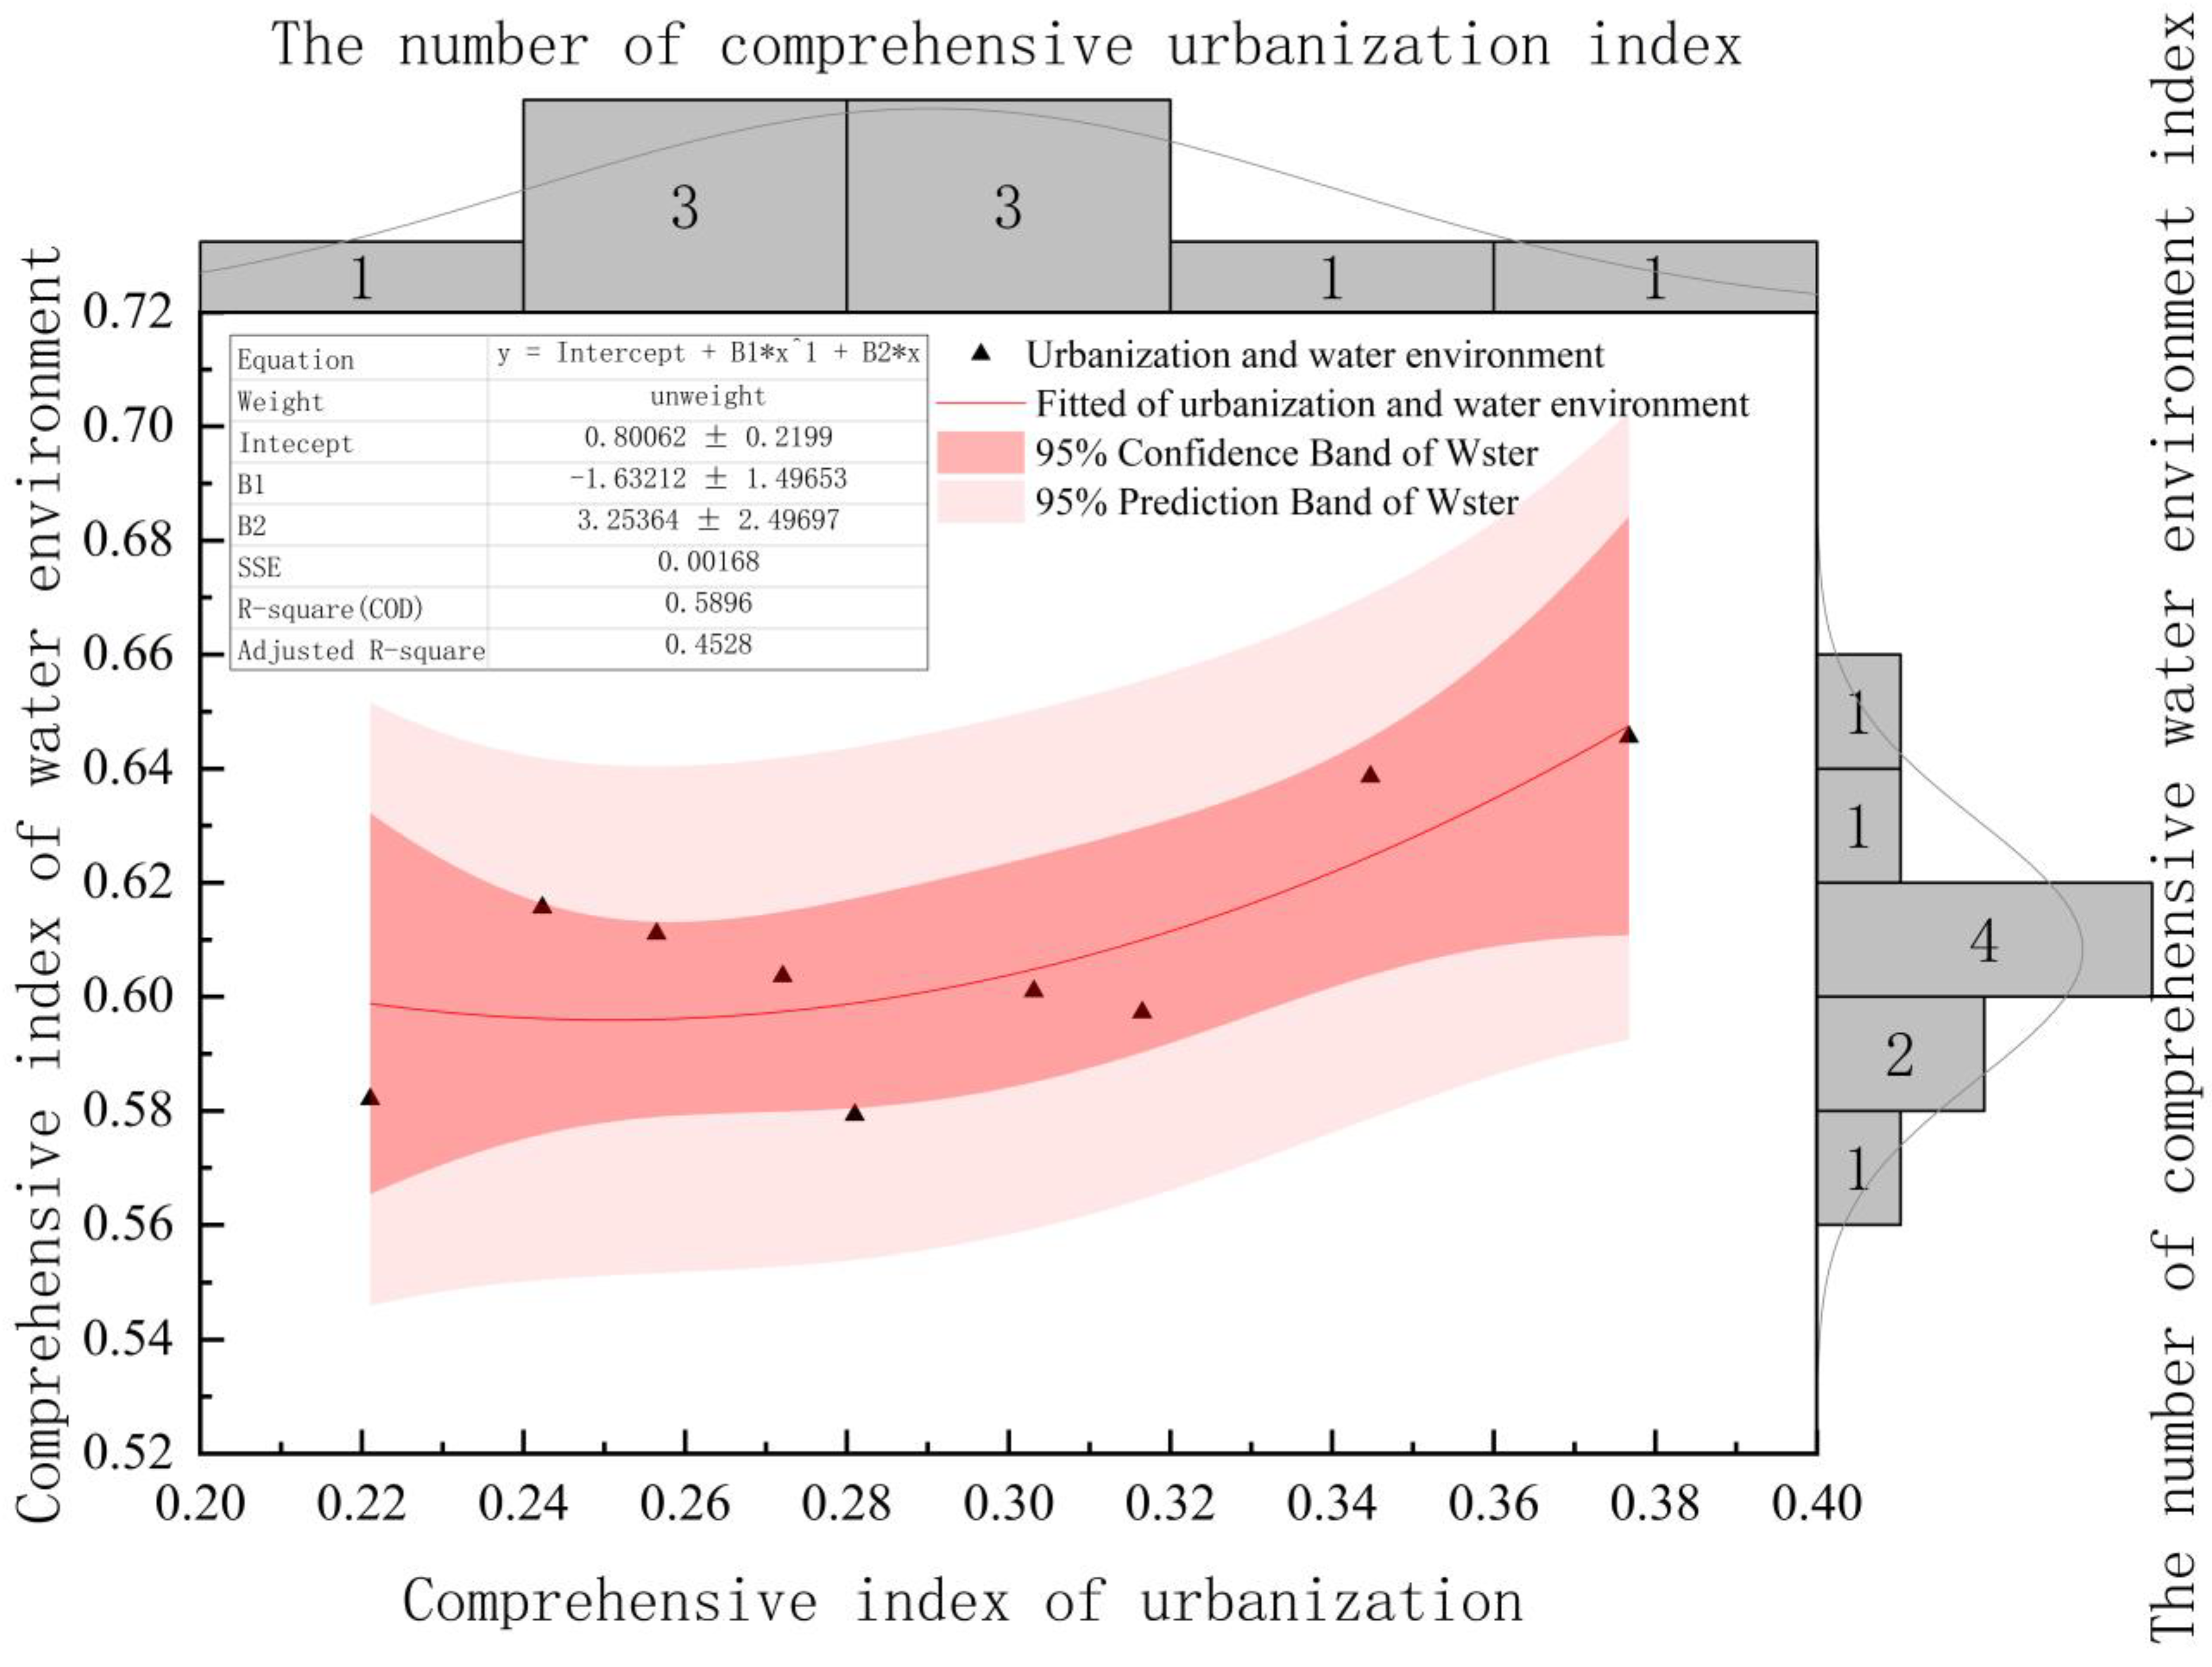
3.1.3. Analysis of the Interaction between Urbanization and Water Environment

The degree of fit (R2) was calculated to measure whether the urbanization level fits the water environment level during 2011–2019. The formula is as follows:
R 2 = 1 i n W i ^ W i 2 i n W i W ¯ 2  
where R 2 is the fit degree between urbanization and the water environment level, R 2 0 ,   1 , and the larger the value is, the higher the fit degree will be; Wi is the comprehensive water environment index; W i ^ is the comprehensive water environment index; w ¯ is the average of all water environment composite indices; and i is the year.
According to the calculation result of the above formula, R2 = 0.5896 and the residual sum of squares was 0.00168, indicating that the curve can well reflect the evolution between the two systems among urban agglomerations from 2011–2019. It can be found in Figure 7 that there was a nonlinear and approximate U-shaped evolutionary trajectory between the two systems. Before the lowest inflection point, the level of the water environment decreased with the increase of urbanization level, which may be due to some constraining influence on the water environment at the early stage of urbanization development, leading to some degradation of the water environment ecosystem. After the lowest inflection point, the level of the water environment rises with the increase of urbanization level, which indicates that with the urbanization progression of the urban agglomeration, the protection and management capacity of the water environment is enhanced and the improvement of the water environment ecosystem is promoted. Thus, it can be seen that urbanization and the water environment dynamics showed different characteristics at different stages of economic development.

3.2. Coupling Coordination Analysis of Urbanization and Water Environment

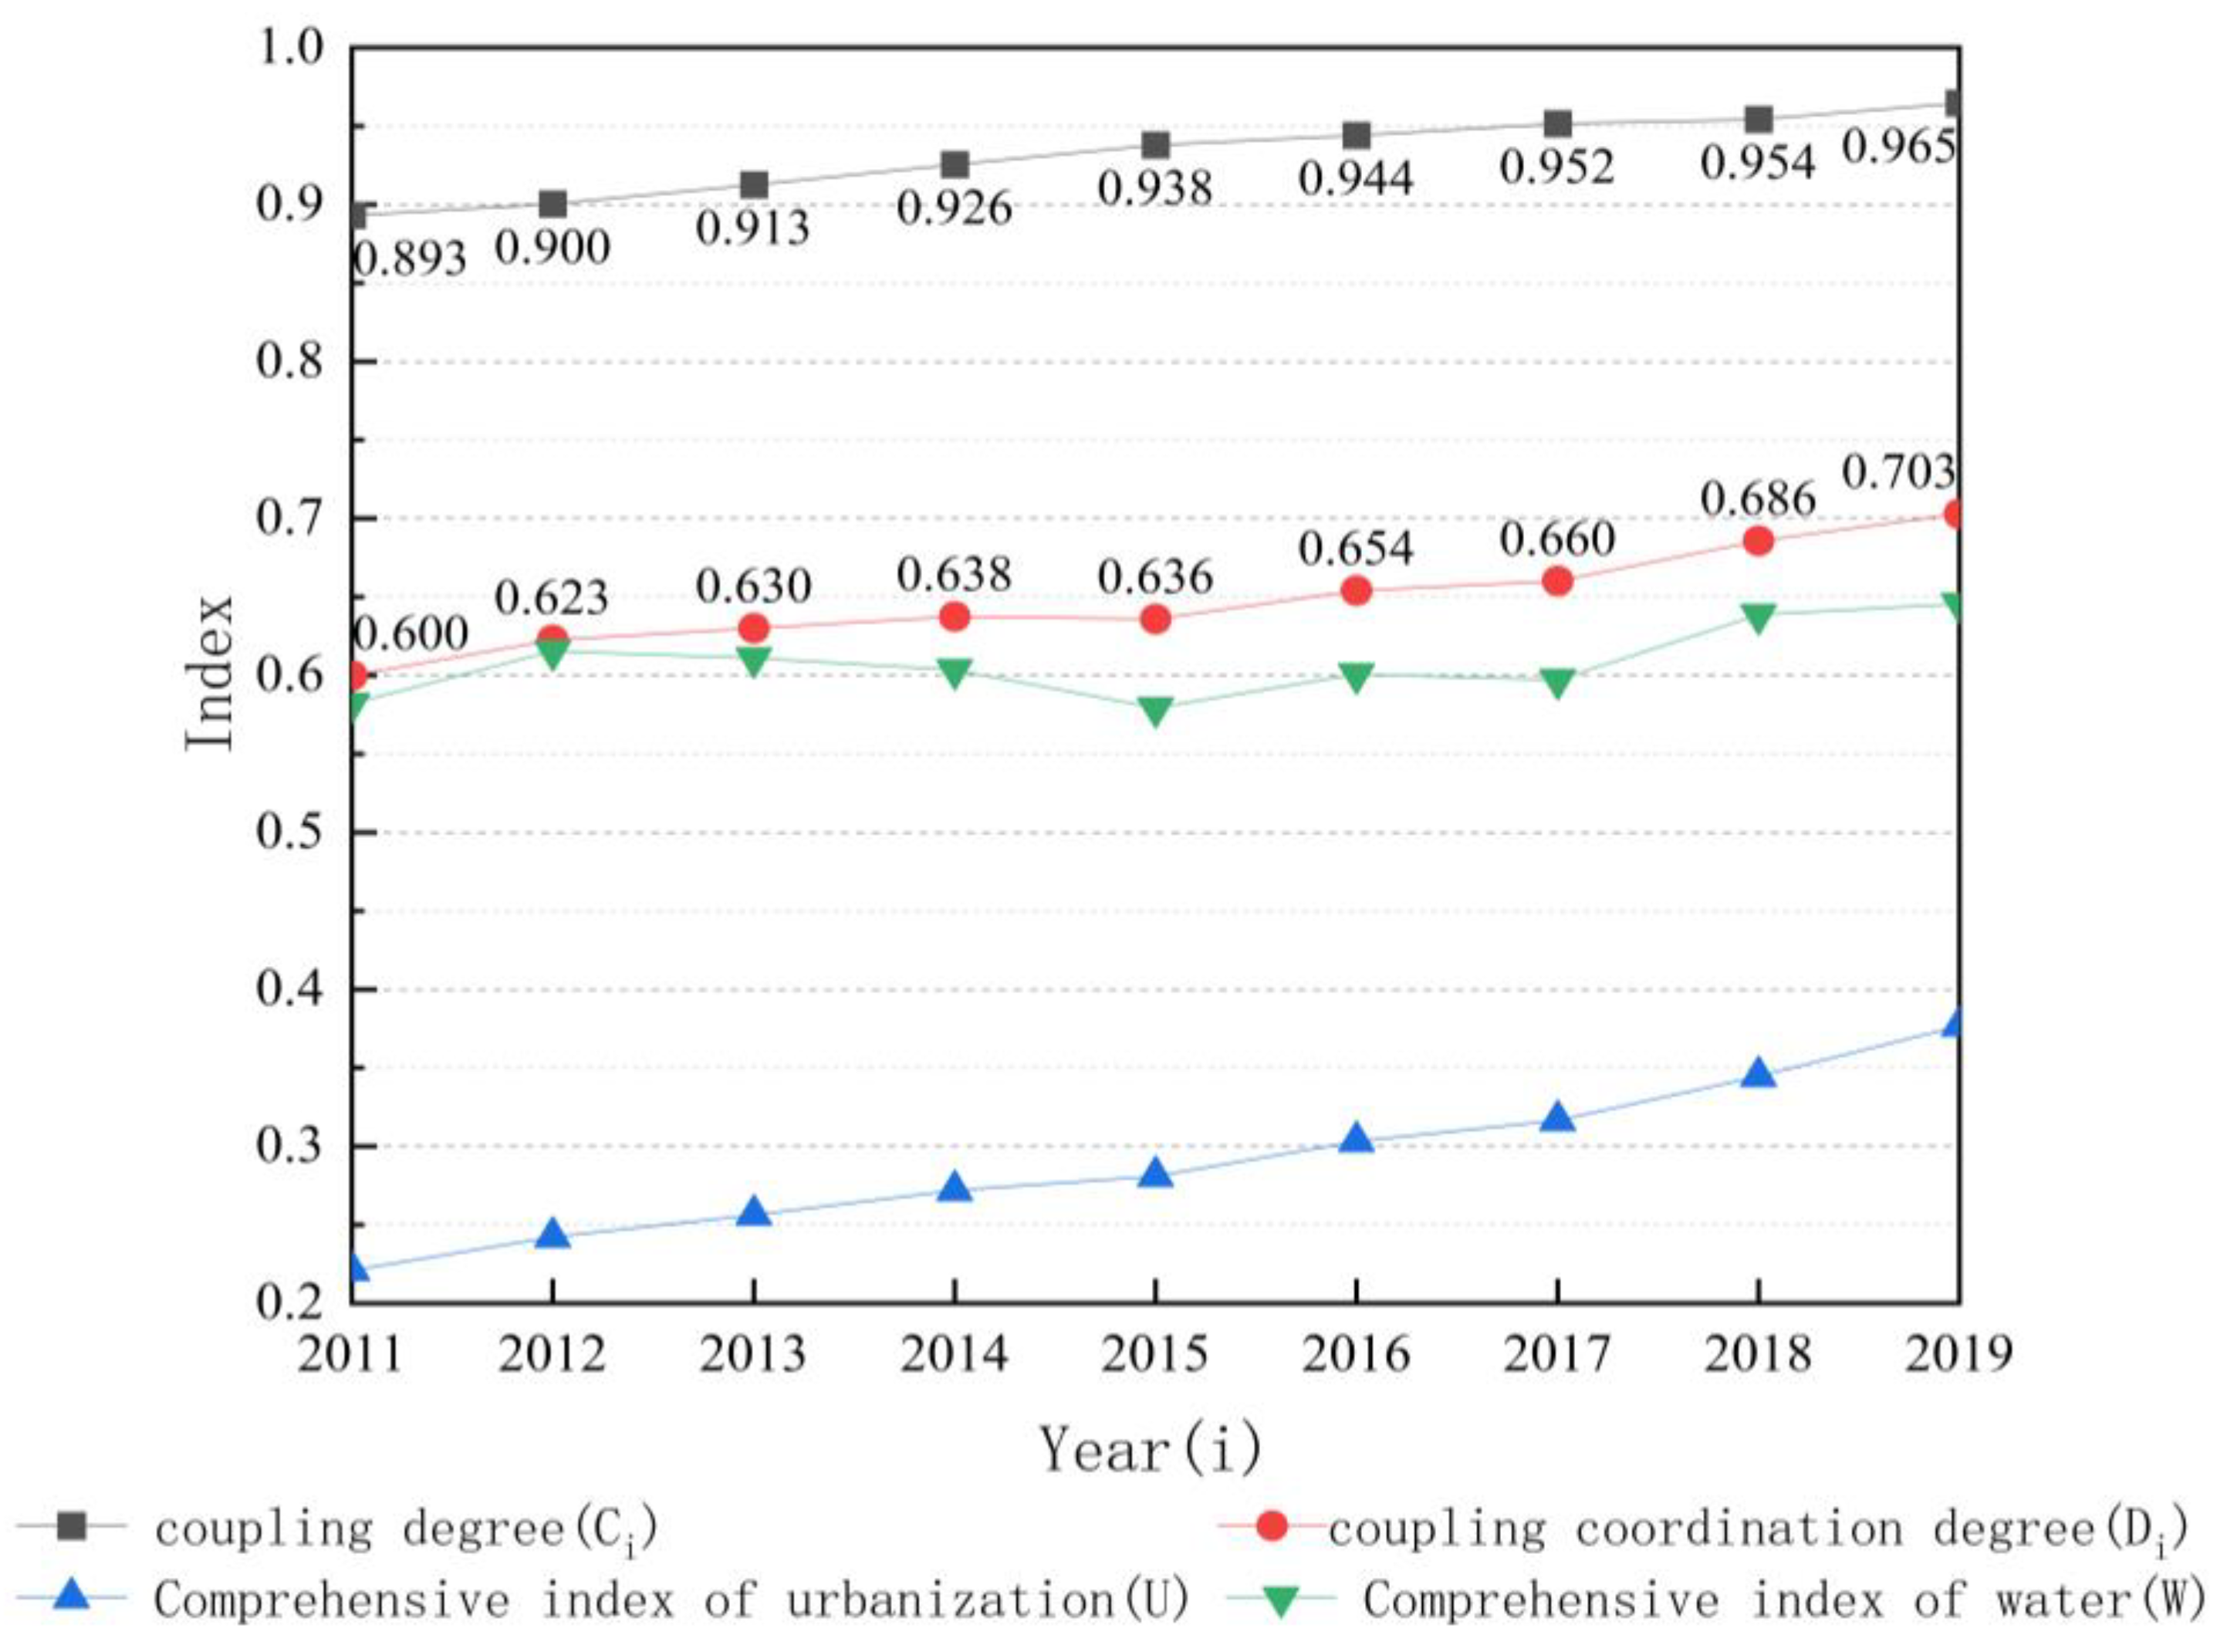
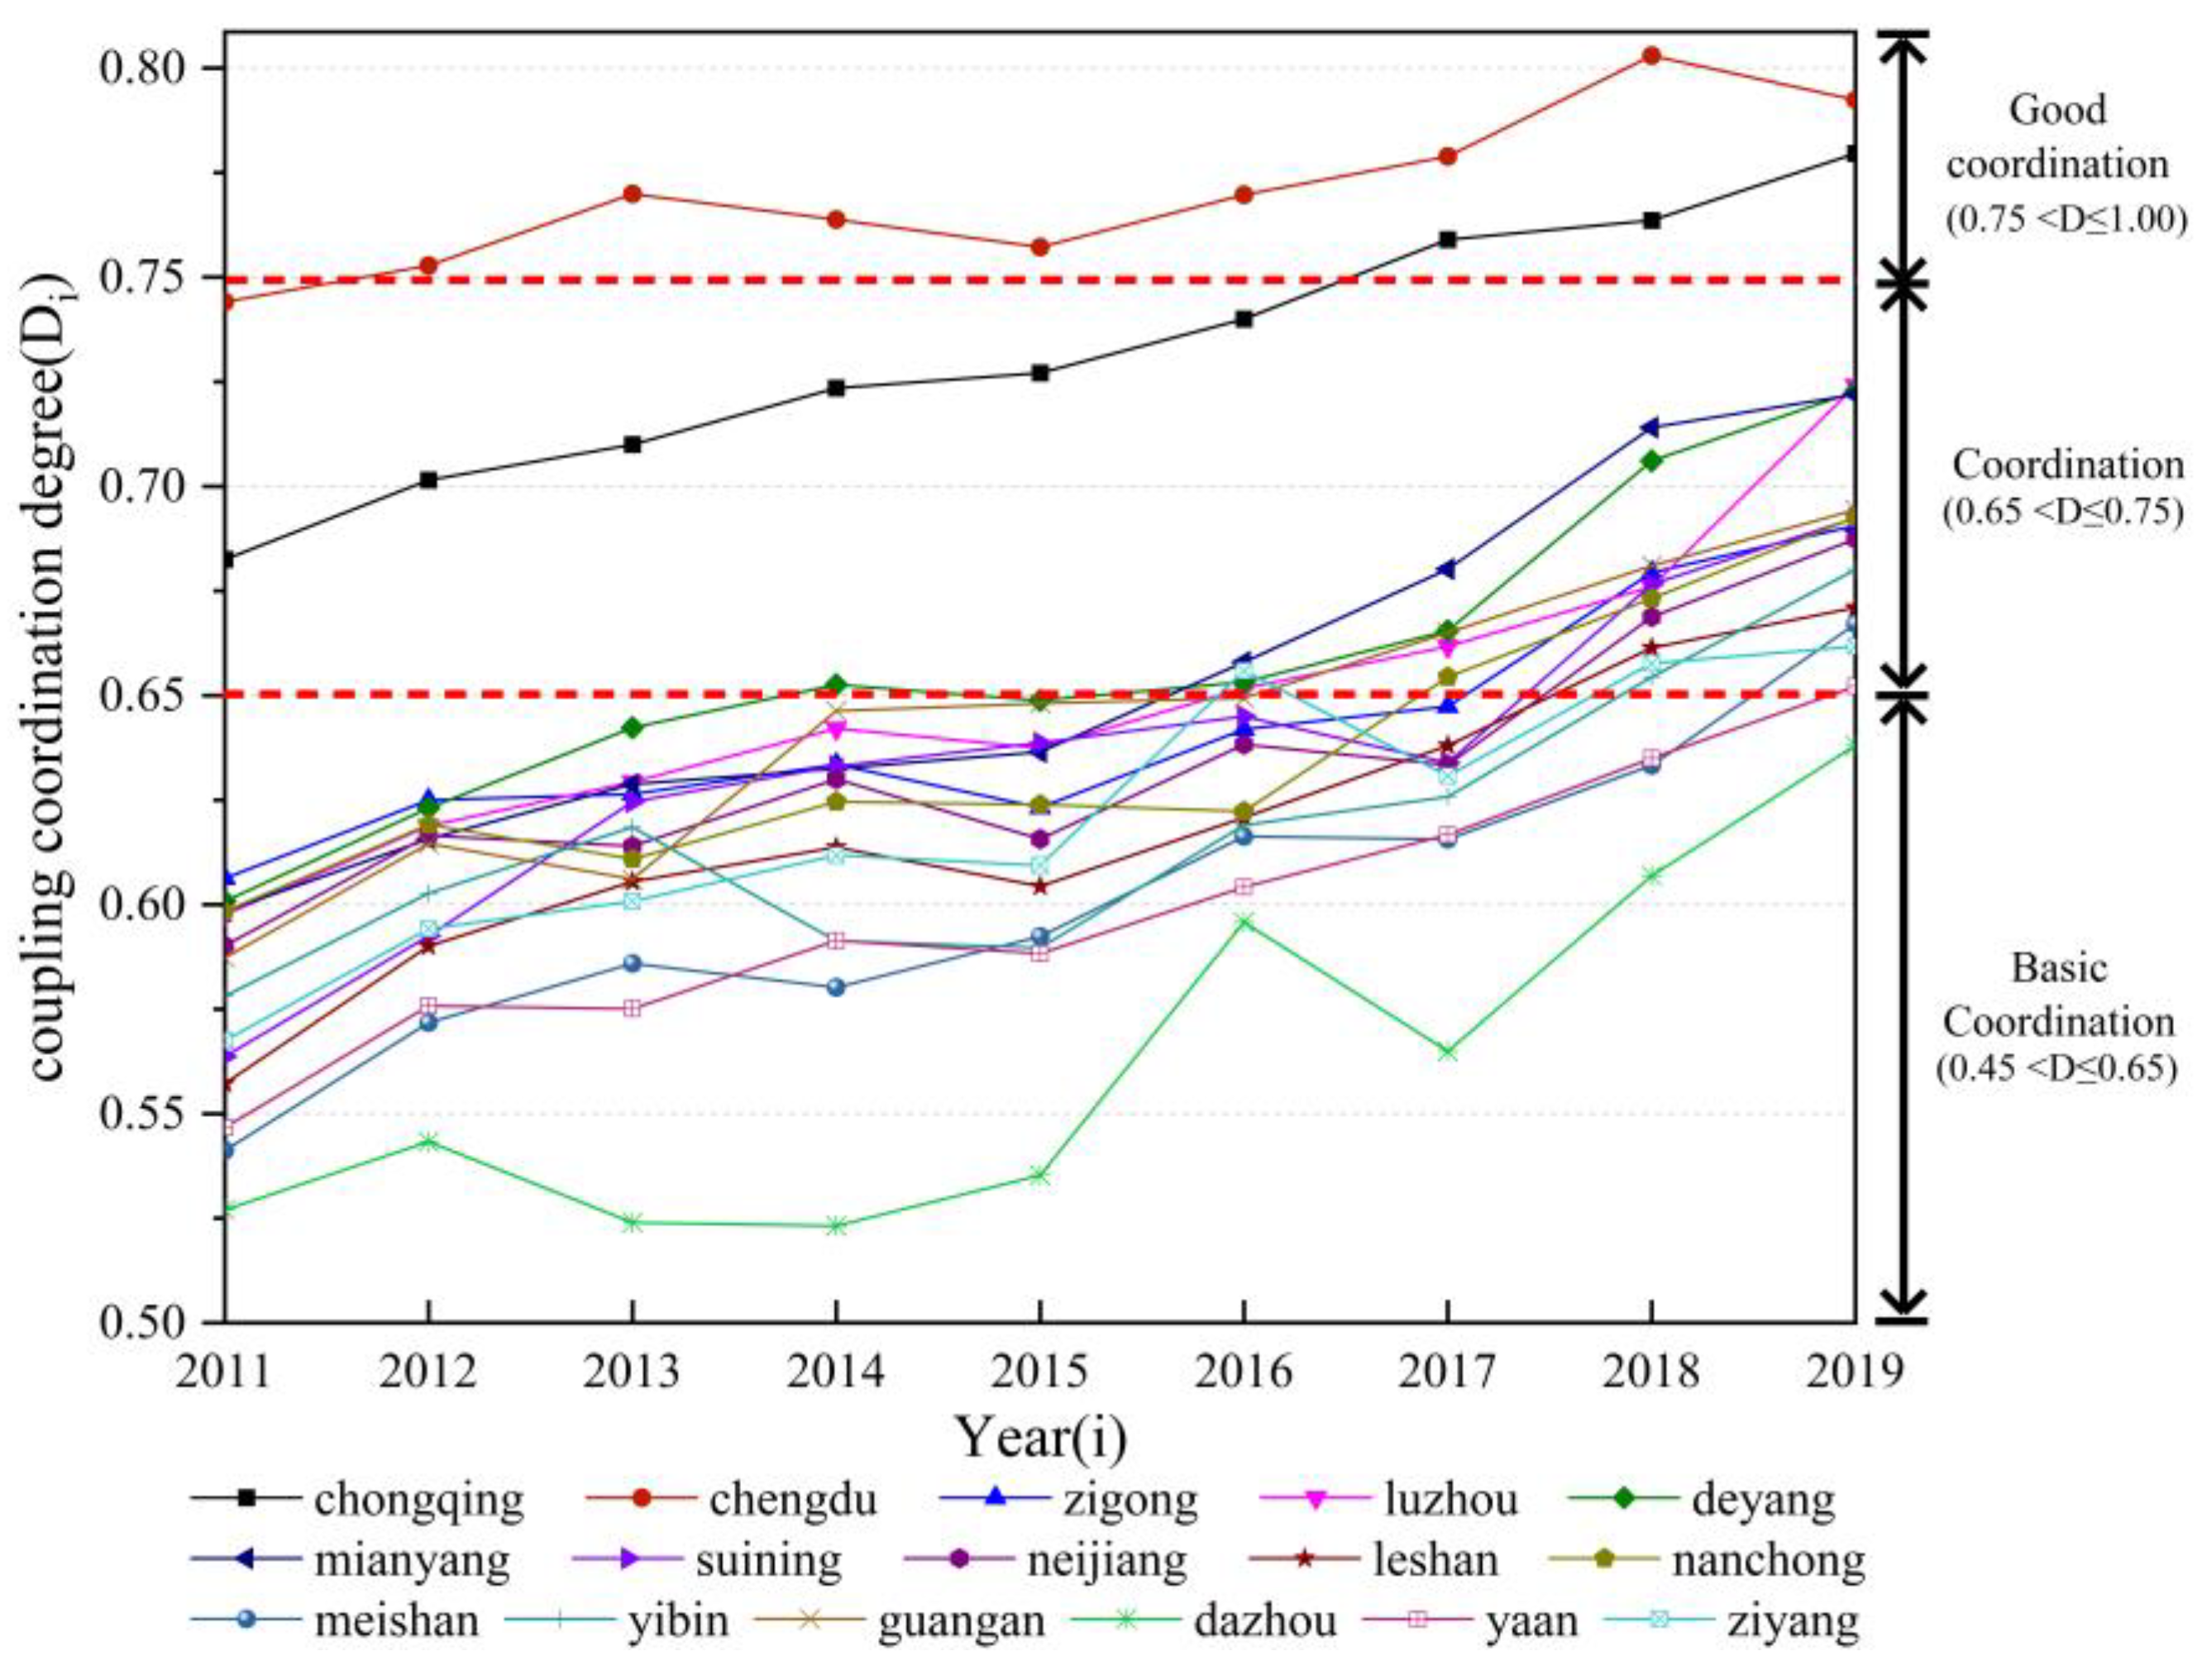
3.2.1. Time-Series Variation Characteristics of the Coupling Coordination Degree

The coupling degree from 2011 to 2019 has maintained an increasing trend, with an average annual growth rate of 0.97% and an average coupling degree of 0.932, which was at a high level of coupling. This indicates that urbanization and the water environment system tend to be in order and have reached resonance coupling. From the change in coupling coordination degree, the overall coupling coordination degree of the urban agglomeration showed a good upward trend from 2011 to 2019, with an average annual growth rate of 2.01% (Figure 8).
On the one hand, the integrated index of water environment of urban agglomerations was much higher than the integrated index of urbanization during the study period, which belonged to the urbanization lagging type. The trend of the coordination degree and the integrated index of the water environment showed synchronization since 2014.
At the municipal level, the coupling and coordination degree of urbanization and water environment in each city (Figure 9) showed a fluctuating upward trend.
The CCD of Chengdu and Chongqing was significantly higher than that of the other 14 cities, ranging from 0.65 to 0.80, which indicated that the central cities had a better foundation in the interaction process between urbanization development and the water environment system, and the two systems were more coordinated. The degree of Zigong, Deyang, and the other 13 cities was at a middle level, but the curve basically showed a fluctuating upward trend, which indicated that the coordination between the two systems has improved in these cities. The degree of Dazhou was significantly lower than other cities, and it was the lowest among all cities in all years. From the analysis of the two systems, it can be found that the combined urbanization and the water environment indices of Dazhou were consistently at the bottom of the city group on average for many years, and the difference between them was more than 0.30, which led to the lowest coordination in Dazhou City. In future development, Dazhou City needs to increase urbanization construction and improve the water environment management capacity in an orderly manner to achieve coordination and sustainable development between urbanization and the water environment.
The coordination status of urbanization and the water environment system in each city is shown in Figure 10. The state of coupling coordination of urbanization and water environment system by cities, 2011–2019. There is a clear gradient and stage of coordination between the two systems.
Comparing cities horizontally, Chengdu and Chongqing had significantly better coordination status than other cities during the same period, with a multi-year “coordinated-good coordination” status at the first tier. The other 14 cities were in the second tier of “basically coordinated—coordinated” status for many years. From the analysis of sub-indicators, the urbanization and water environment levels of Chengdu City have remained at a medium level for many years, with a small gap of 0.122 that rapidly decreased to less than 0.1 in 2011, and the gap was less than 0.02 after 2015. For many years, the urbanization level of Chongqing city maintained a steady rising trend from 0.387 to 0.596, changing from low level to medium level, and the water environment level stayed at a medium level of about 0.6; the gap between the two systems was gradually reduced from 0.173 to 0.022, and gradually converged to synchronous type from urbanization lagging type. Such a change made the coordination of the two systems continue to improve, changing from coordination to good coordination. In the remaining 14 cities, the urbanization level was at a low level, and the water environment was maintained at an intermediate level. Although the gap between the two systems had been reduced, there was no significant improvement, so their status, although improved, was still worse than that of Chengdu and Chongqing. It can be seen that the synchronization of urbanization and water environment levels of the two systems was the key to maintaining a high level of coordination.
The vertical comparison time has gone through two phases (2011–2015 and 2016–2019), with a gradual transition from basic coordination-oriented in 2011 to coordination-oriented in 2019. The development of coupling coordination in these two periods was specified as follows.
(1)
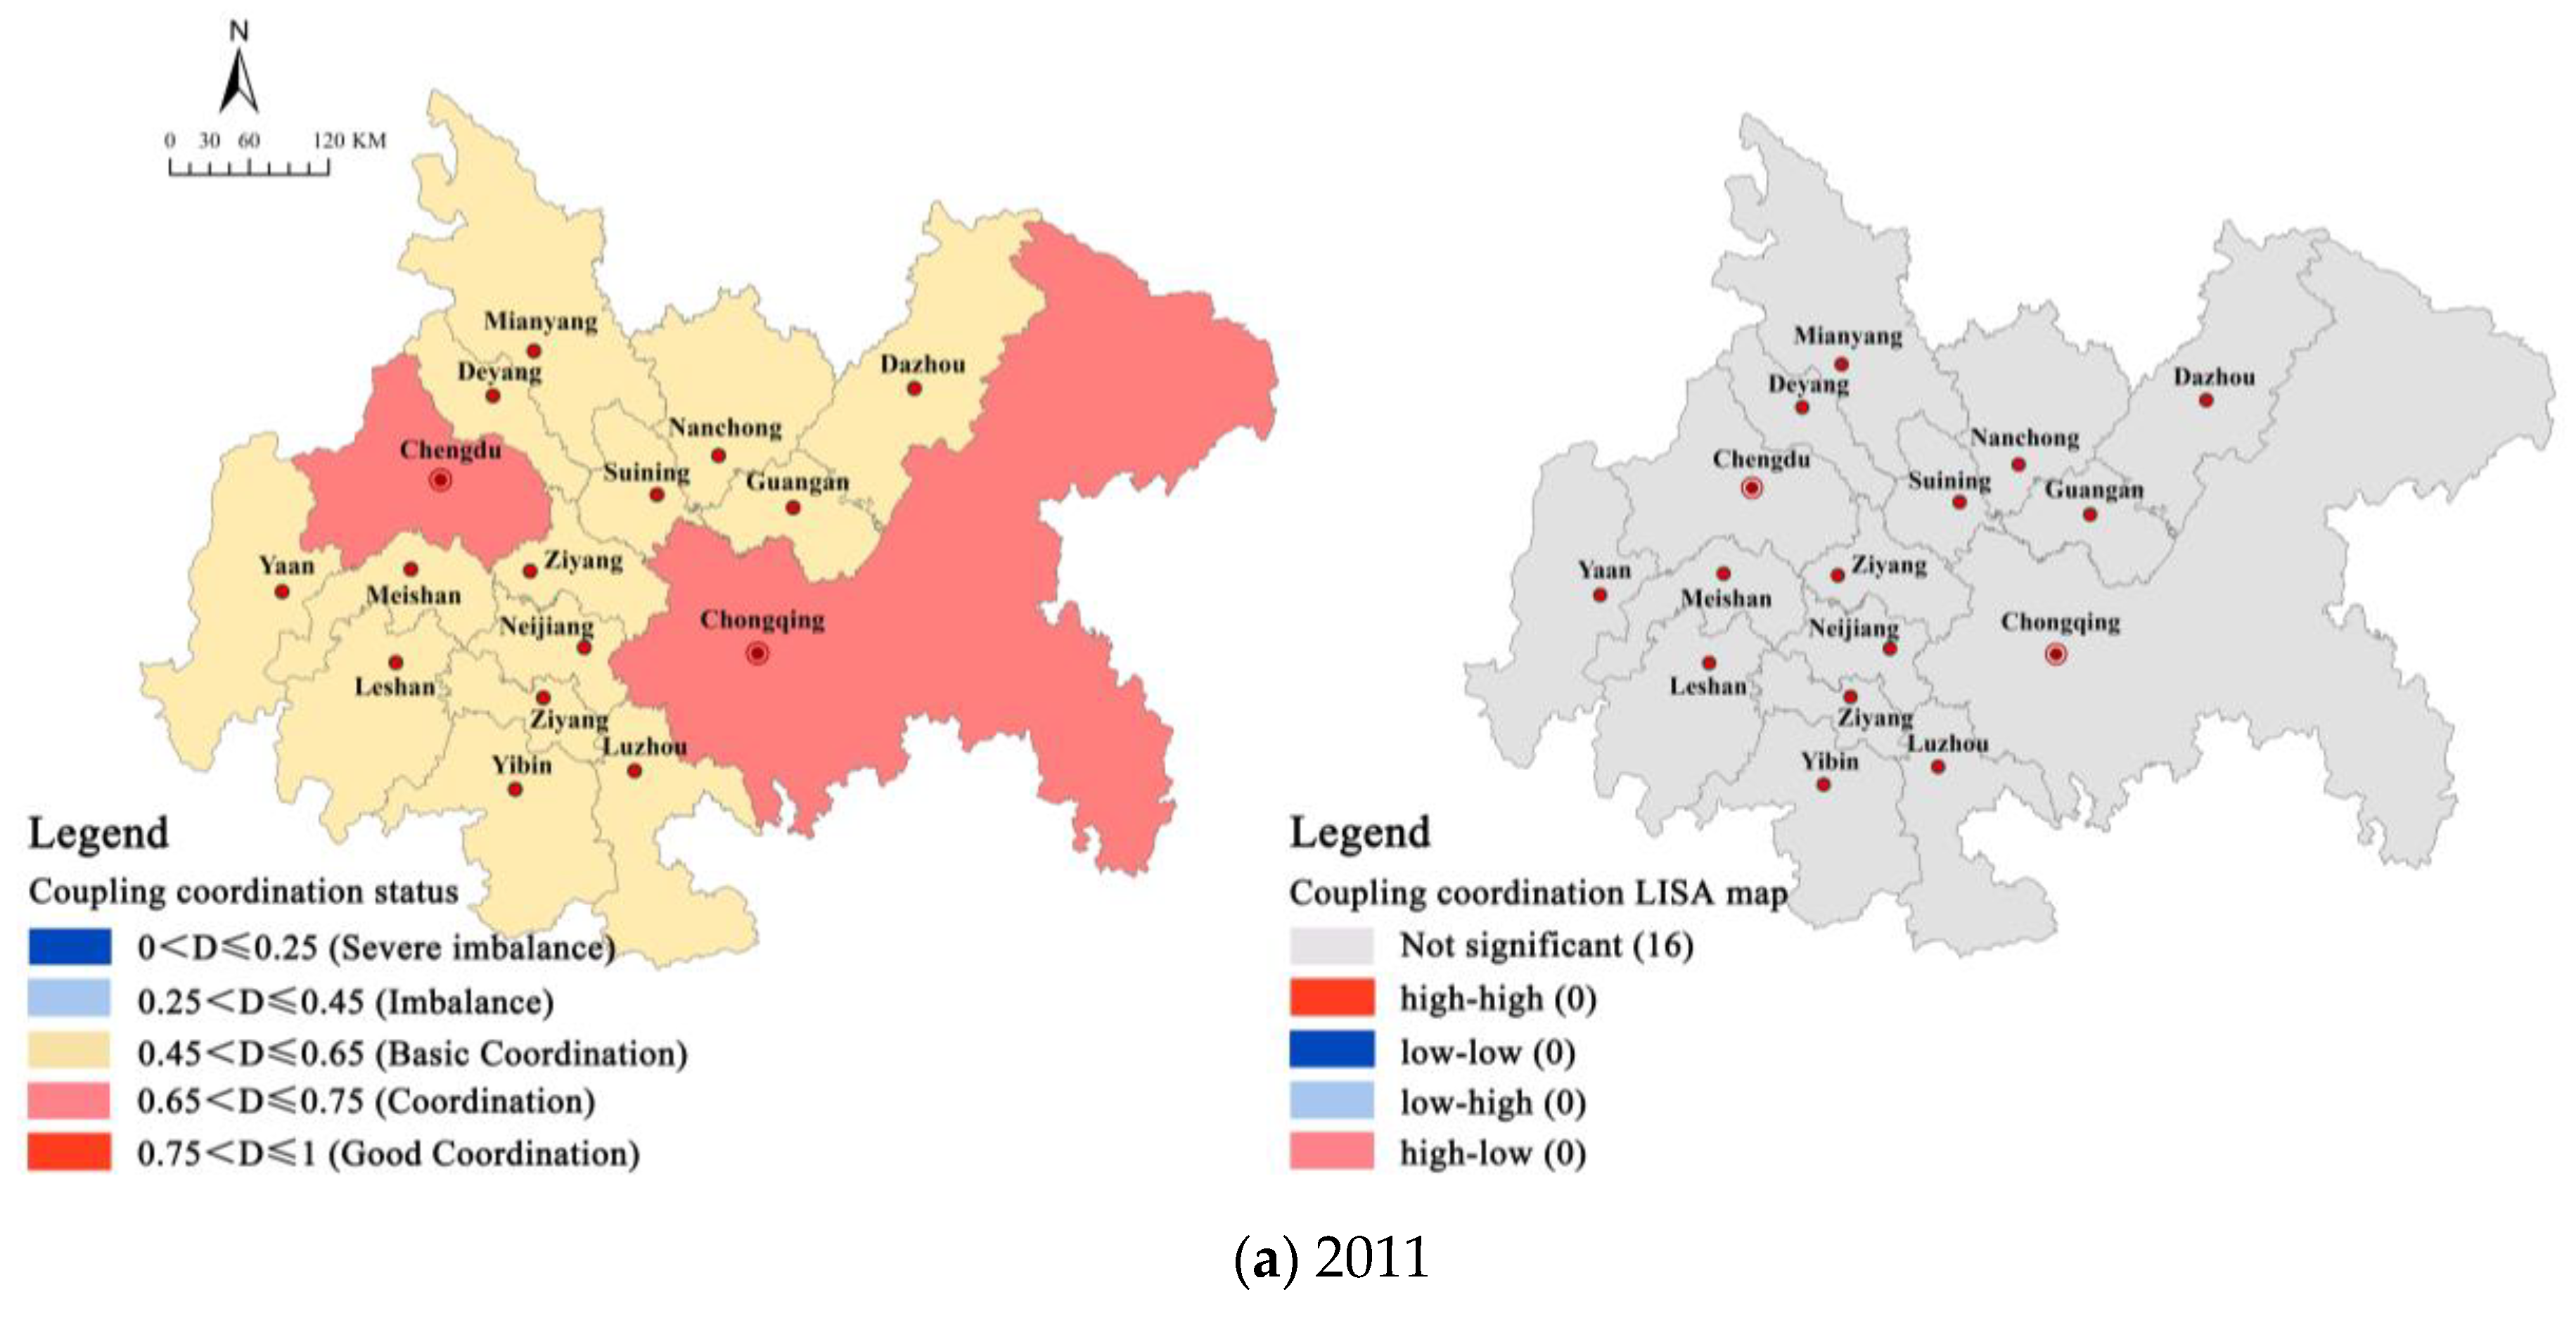
2011–2015: the coordination status between the two systems was initially at a medium level. In 2011, except for the two central cities, all other cities were in a basic coordination status. During the period of 2012–2015, Chengdu developed well, and the adjustment of the industrial structure brought a continuous increase in the resident population and an increase in the proportion of employment in the tertiary industry, driving population urbanization. At the same time, the economic benefits were also reflected in the rapid growth of per capita fixed asset investment and per capita disposable income of urban residents, which was reflected in the rapid increase of the economic urbanization index. These two subsystems drove the urbanization level to improve, slightly less than the water environment level, and Chengdu City entered a good coordination state. The simultaneous improvement of the four subsystems of population, space, economy, and society in Chongqing made the urbanization level converge to the level of the water environment and enter a coordinated state. Driven by Chengdu and Chongqing, the economic and demographic urbanization subsystems of other cities rapidly improved, thus driving the rapid growth of urbanization performance; the performance of the water environment system slightly improved, the gap between the two systems decreased and the connection began to strengthen, and the coordination state began to improve. Taken together, the steady increase in urbanization during this period effectively drove the growth of coordination and the linkages between the two systems began to strengthen.
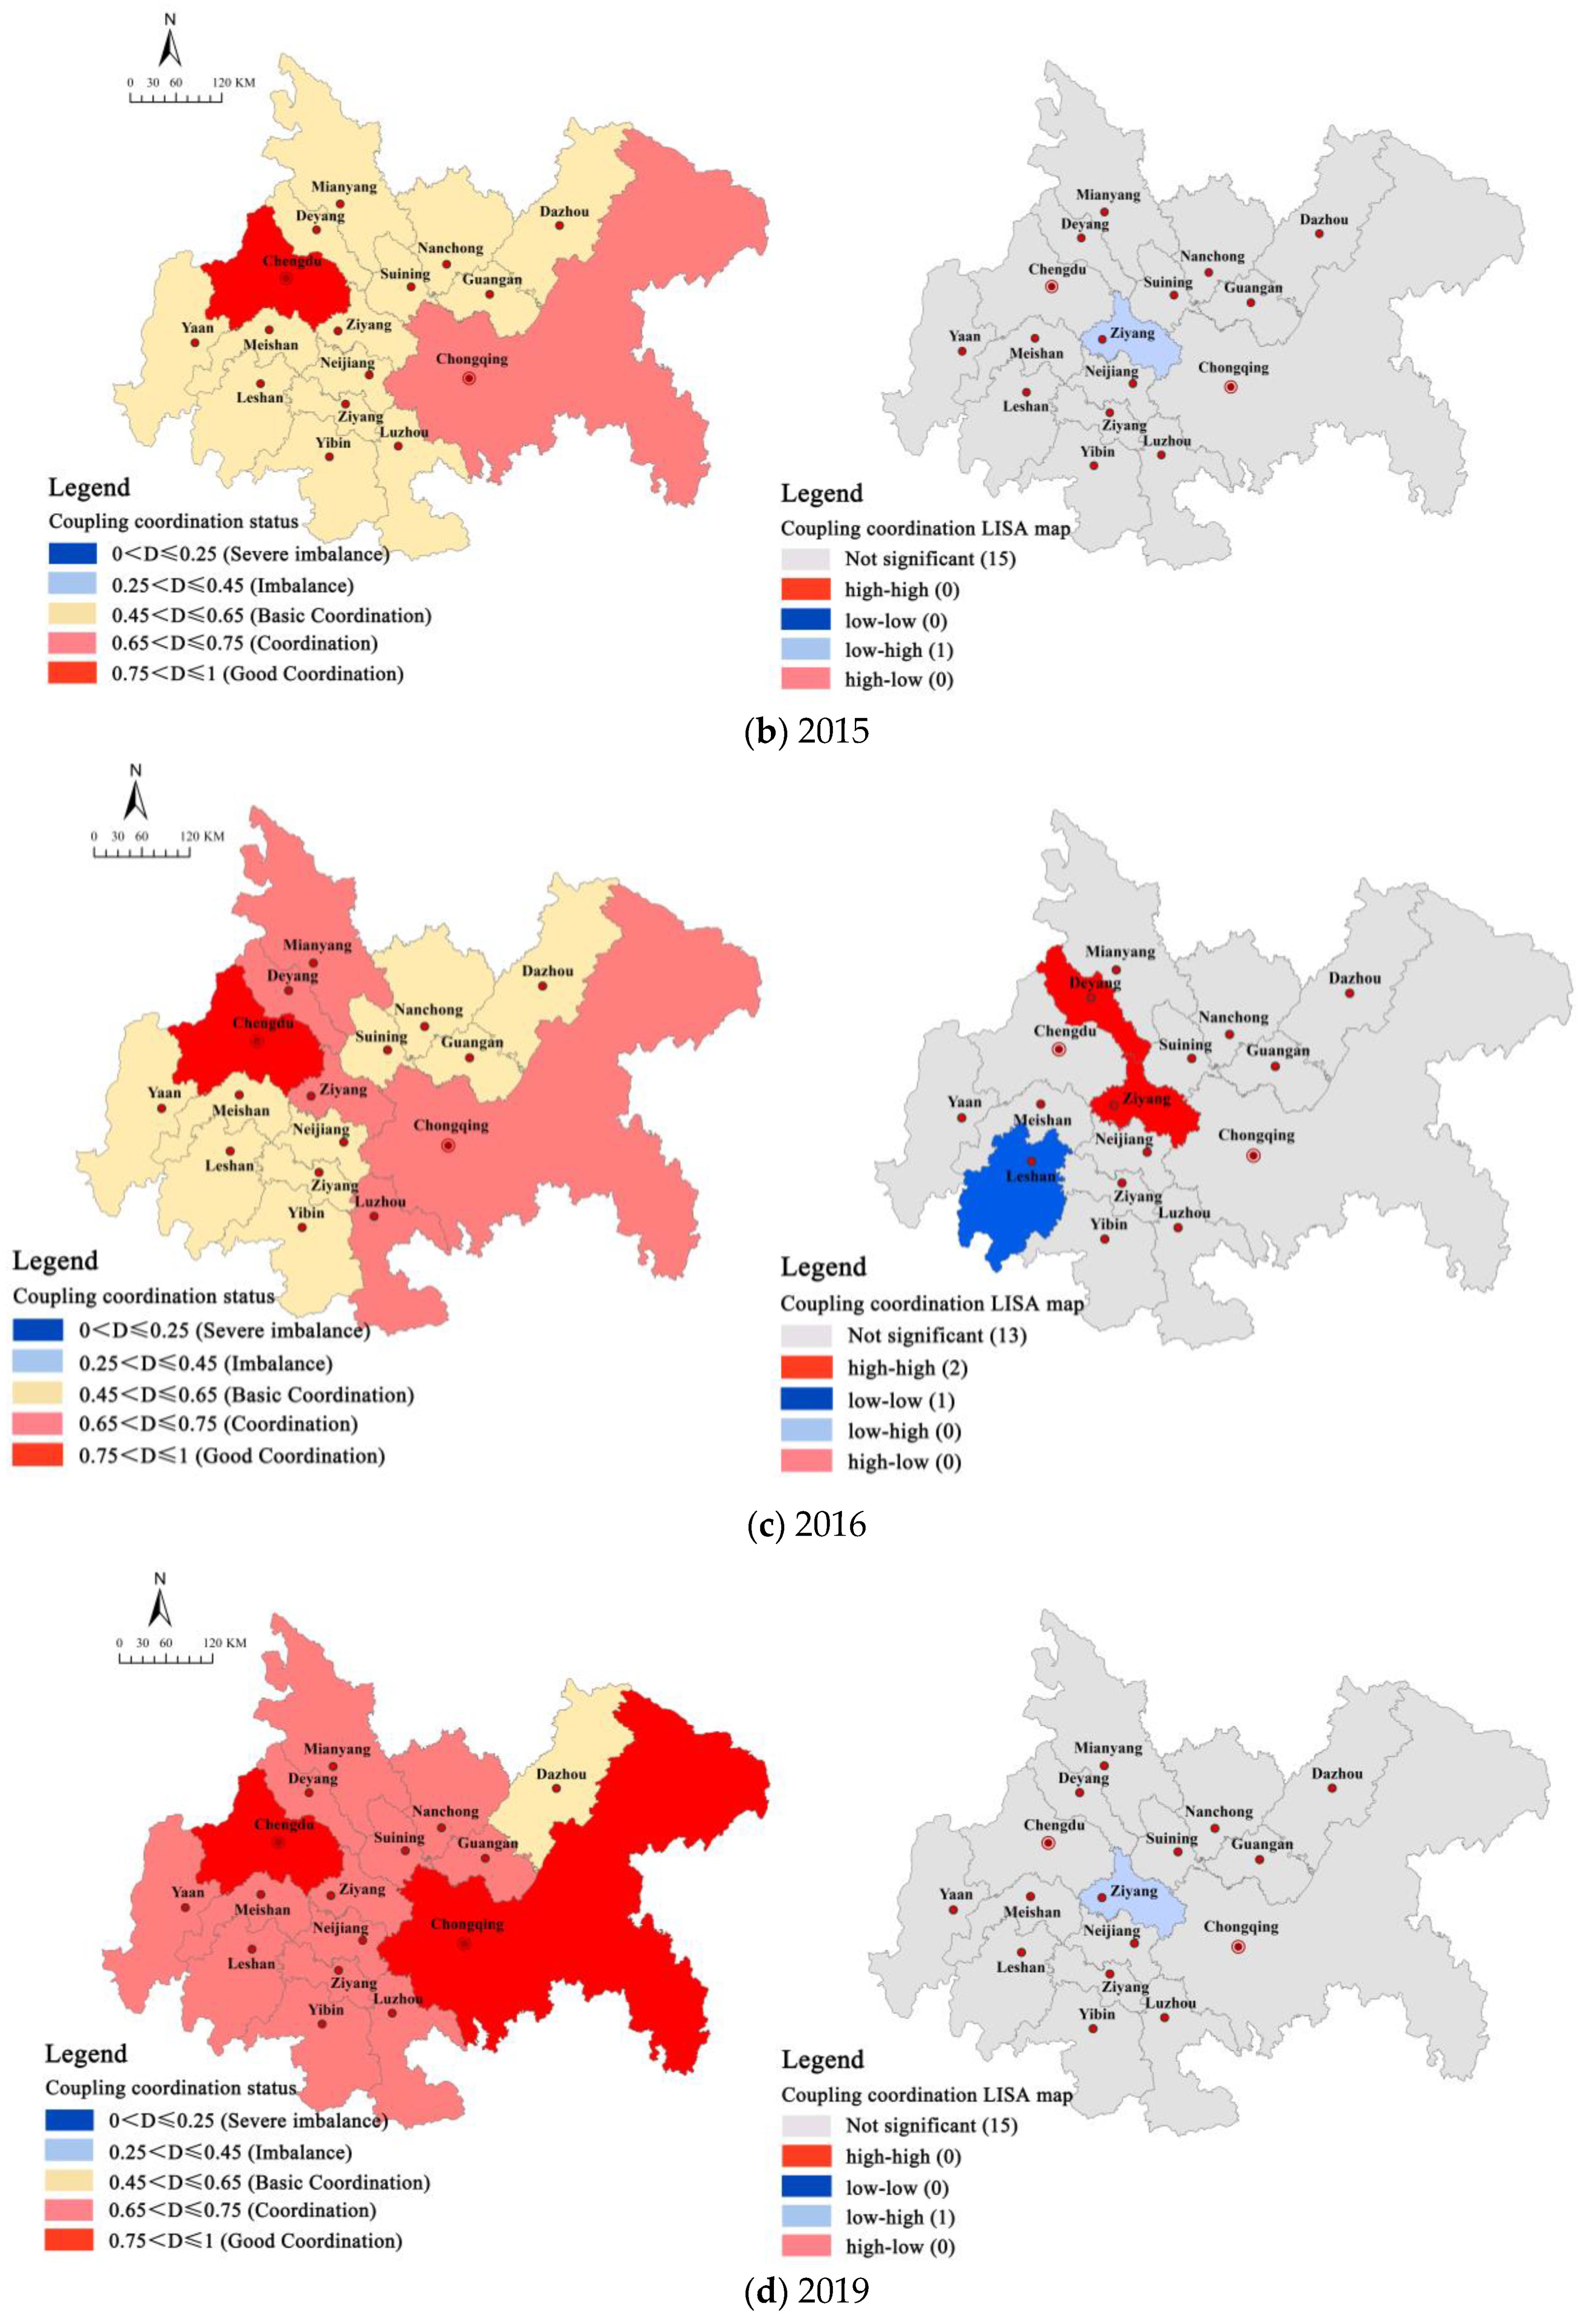
(2)
2016–2019: The state between urbanization and the water environment system in CCUA gradually transitioned to the coordination stage. Basic coordination, coordination, and good coordination accounted for 62.50%, 31.26%, and 6.25% in 2016, respectively. Basic coordination, coordination, and good coordination accounted for 6.25%, 81.25%, and 12.50% in 2019, respectively. Only one city, Dazhou, did not reach the coordination status. From this comparison, it is obvious that the percentage of cities in a coordinated state has increased significantly. During this period, with the deepening cooperation of regional integration, the water environment performance was relatively stable, while the urbanization of each city grew one after another under the continuous promotion of economic and population subsystems, which effectively pushed the two systems to begin to change to a coordinated state. However, the mismatch between the two systems in these cities has not changed significantly, and the development of urbanization still lags behind the water environment, so it is clear that these cities still need to continuously improve the level of urbanization.
In this period, Chongqing’s medium urbanization level of 0.55 was barely within the water environment carrying capacity threshold of 0.60, which helped the two systems to enter a higher state of good coordination. It can be seen that the urbanization level of Chongqing is still unbalanced with the development of the water environment, and the urbanization development is lagging behind. It is necessary to continue to build the spatial pattern of integration of urbanization and water environment, narrow the polarization within urban agglomerations, and continue to maintain the water resource environment. Besides, it is worth noting that in this period, Chengdu city has started to overtake the urbanization level, beyond the water environment carrying capacity, despite Chengdu still maintaining good coordination. From the analysis of specific indicators, industrial wastewater discharge reached the highest value of all cities in the urban agglomeration in recent years, the per capita daily domestic water consumption in the urban area also dropped significantly, and the pressure on the water environment increased significantly, indicating that the environmental condition of water resources in Chengdu, which was at the middle to upper level of urbanization and still maintains a fast development rate, was deteriorating and a duress on water resources is emerging. Strengthening water resource protection and improving municipal water supply and wastewater treatment capacity are urgent countermeasures for Chengdu city at present.
Thus, it can be seen that the cities in the CCUA were not synchronized in the course of coordinated development of urbanization and water environment, but there was an improvement in the overall inter-system coordination.

3.2.2. Change Characteristics of Coupling Coordination in Spatial Dimension

Moran’s I values for the coupled coordination of urbanization and water environment in CCUA from 2011–2019 were listed (Table 7). The P-values during the study period were all greater than 0.05, and the distribution of coupling coordination showed the characteristics of random distribution and did not show obvious spatial dependence. The Moran’s I values were all negative, which means the cities with higher coupling coordination between urbanization and the water environment within the urban agglomeration were often surrounded by cities with lower coordination. Meanwhile, there was a slight upward trend of Moran’s I value from 2011 to 2016, which indicated that the spatial differences between neighboring cities had been reduced. It can be seen that the interaction between urbanization and the water environment system has not yet formed an integrated spatial pattern, and the imbalance of inter-city coupling and coordination is an urgent problem to be solved for the subsequent urban agglomeration to achieve coordinated regional development.
To further analyze the spatial difference characteristics of coupling coordination development of 2011–2015 and 2016–2019, years 2011, 2015, 2016, and 2019 were selected as representatives to make the corresponding spatial distribution of coupling coordination states and spatial LISA diagrams at 5% position level, respectively. On the whole, the coupling coordination degree state of 16 cities in the urban agglomeration during 2011–2019 showed an evolutionary process in which the dual-center structure with Chengdu and Chongqing as the core gradually radiated outward to the central and northern cities, formed a contiguous pattern, and then gradually expanded and stabilized, with some changes in the spatial agglomeration of local areas.
According to Figure 11a, it is found that the coupling coordination degree of Chengdu and Chongqing was higher than other regions in 2011. All cities were not significantly correlated, indicating that the urban agglomerations were significantly heterogeneous at this time. There was a strong negative spatial correlation between Chengdu and Chongqing and the surrounding regions, and a polarization effect with the surrounding cities. Figure 11b showed that the coupling coordination degree of Chengdu and Chongqing was still higher than other regions in 2015, and there was a low-high type in Ziyang city, which had become a depression in the geographic center of the urban agglomeration, and the coordinated development of the urban agglomeration showed the characteristics of high periphery and low middle. Figure 11c illustrated that under the radiation of the twin central cities, Ziyang City in the central part of the urban agglomeration, Deyang City and Mianyang City in the north, and Luzhou City in the south formed contiguous coordination, while the local correlation showed that Ziyang City and Deyang City presented a high-high type, reflecting that the good development of Chengdu City had formed a diffusion and radiation effect in the periphery, and the coordination of the surrounding cities were steadily improved. However, the development of the southern part of the urban agglomeration is relatively weak, and Leshan City appears as a low-low type. The good development of the Chengdu-Chongqing development spine, northern Chengdu-Mianle city belt, and double core in the spatial structure of “one axis, two belts, double core, and three districts” in the city cluster development plan was confirmed by the comparison of the local results in 2015 and 2016. It can be seen from Figure 11d that under the continuous promotion of the integrated development of CCUA, the urban agglomeration has formed a well-coordinated structure, with Chengdu and Chongqing as the core. The surrounding areas are stable and coordinated, and the interaction between cities has been strengthened. However, at the same time, with the rapid development of the coupling and coordination of the two cities, the difference with the surrounding areas expanded again, and Ziyang City once again showed a high-low type.
Compared with the Pearl River Delta and the Yangtze River Delta urban agglomerations, which have a higher degree of urbanization development [52,53], CCUA exhibits a dual-core development model that is in a transition stage to a multi-core networked and decentralized development model. The Chengdu-Chongqing region still needs to strengthen the interconnection within the urban agglomerations, work together to promote cross-border water environment treatment, cultivate large and medium-sized cities, and reduce polarization to achieve a more stable and optimized polycentric and networked development model.

4. Conclusions and Discussion

This study focuses on the CCUA to investigate the fundamental relationship and operational mechanisms linking urbanization development and water environment conditions. It achieves this by establishing an evaluation index system for both urbanization and the water environment and employing the coupled coordination degree model along with the spatial autocorrelation model. The primary findings are summarized as follows.
CCUA shows potential for improving both its urbanization development level and water environment quality. Urbanization, driven primarily by population growth and increasingly by economic factors, exhibits stratification among cities, with mega-cities standing out. The water environment has improved moderately but shows fluctuating trends influenced by various subsystems. The study identifies a complex, non-linear relationship between urbanization and the water environment, diverging from conventional models like the environmental Kuznets curve.
In terms of coordination, the region has progressed from basic to more synchronized efforts between urbanization and water resources, albeit still categorized by a lagging urbanization type. Regional coupling has strengthened, yet municipal disparities indicate a need for more balanced development strategies. Chengdu and Chongqing lead in coordination, underscoring their central roles, while other cities lag behind.
Spatially, the agglomeration exhibits a dual-core development pattern, yet integration remains incomplete compared to other major urban clusters. Future research should extend monitoring periods to capture long-term trends and refine understanding. Policy-wise, enhancing the developmental influence of central cities and addressing disparities among municipalities is crucial for achieving sustainable and balanced urbanization.
It is necessary to acknowledge the limitations of this work. A large number of studies are used to determine the weight of each index, and the entropy method is more objective. However, when the entropy method is used to determine the weight, different indicators are regarded as independent, and the correlation between indicators is not considered. This may lead to an unreasonable weight distribution, and there are certain deviations between the calculated urbanization level and the water environment level and the actual level, which makes the results of this study have certain uncertainties. In addition, due to the difficulty in obtaining some index data in recent years, the evaluation time of this study is relatively delayed, and the analysis of the coupling coordination degree between urbanization and water environment of CCUA in recent years is lacking. In future work, we will continue to optimize the weight allocation method, obtain updated data, analyze the situation in recent years, and increase the real-time performance of the research.
Based on the findings, this paper made the following recommendations and outlook: Considering the disparity in urbanization levels and water environment quality within the CCUA, developing strategies for urbanization and ecological protection requires addressing these imbalances. It is crucial to enhance the comprehensive capabilities of the central cities while also implementing tailored policies in smaller cities to address their specific shortcomings. This approach aims to foster growth in large and medium-sized cities, ensuring sustainable development across the region. At the same time, enhancing connectivity within urban agglomerations is crucial. Initiatives such as transboundary co-management of water environments, improved allocation of water sources, and water rights allocation across regions are essential. These efforts aim to mitigate polarization within urban agglomerations and promote coordinated development of urbanization levels, water resources, and environmental quality. This transition aims to evolve urban agglomerations from a dual-core development model to a more stable and optimized polycentric, networked development model.
According to existing studies of more mature urban clusters or regions, the social, spatial urbanization, and water stress subsystems will be the key to harmonizing the two systems in the next phase of urbanization [29,54]. Therefore, in the future, we must prioritize the smart allocation of water resources and enhance the quality of healthcare, education, and infrastructure. Additionally, we should work on decreasing sewage output, investing more in treatment facilities, and effectively reducing the strain on our water supplies.
In the context of current urbanization efforts in China, urban agglomerations represent the primary mode of urban development. Coordinating urbanization with water resource management is a complex task. This study only focuses on CCUA in China. Future research could involve comparative analyses with other Chinese urban agglomerations such as Beijing-Tianjin-Hebei, the Yangtze River Delta, and the Pearl River Delta. These comparisons would investigate the coupling and coordination dynamics between urbanization and water systems across agglomerations with varying urbanization levels. Such studies aim to identify diverse strategies and directions tailored to achieve sustainable development in different urban agglomerations.

Author Contributions

Conceptualization, Y.C. (Yu Chen), S.Z. and Y.C. (Ying Cao); Methodology, S.Z.; Software, Y.L.; Validation, J.C.; Formal analysis, Y.L.; Data curation, J.C.; Writing—original draft preparation, S.Z.; Writing—review and editing, X.L., J.C. and Y.C. (Ying Cao); Supervision, Y.C. (Ying Cao). All authors have read and agreed to the published version of the manuscript.

Funding

Ya’an Science and Technology Bureau: 23CGZH0002.

Data Availability Statement

The datasets presented in this article are not readily available because time limitations.

Conflicts of Interest

Author Sisi Zhong was employed by the company Chengdu Urban Planning and Design Institute Co., Ltd. The remaining authors declare that the research was conducted in the absence of any commercial or financial relationships that could be construed as a potential conflict of interest.

References

  1. Wang, M.; Liu, X.; Liu, Z.; Wang, F.; Li, X.; Hou, G.; Zhao, S. Evaluation and Driving Force Analysis of Cultivated Land Quality in Black Soil Region of Northeast China. Chin. Geogr. Sci. 2023, 33, 601–615. [Google Scholar] [CrossRef]
  2. Ma, H.; Shi, C.; Chou, N.-T. China’s Water Utilization Efficiency: An Analysis with Environmental Considerations. Sustainability 2016, 8, 516. [Google Scholar] [CrossRef]
  3. Dong, G.; Shen, J.; Jia, Y.; Sun, F. Comprehensive Evaluation of Water Resource Security: Case Study from Luoyang City, China. Water 2018, 10, 1106. [Google Scholar] [CrossRef]
  4. Bogardi, J.J.; Dudgeon, D.; Lawford, R.; Flinkerbusch, E.; Meyn, A.; Pahl-Wostl, C.; Vielhauer, K.; Vörösmarty, C. Water security for a planet under Water security for a planet under pressure: Interconnected challenges of a changing world call for sustainable solutions. Curr. Opin. Environ. Sustain. 2012, 4, 35–43. [Google Scholar] [CrossRef]
  5. Reid, W.V.; Chen, D.; Goldfarb, L.; Hackmann, H.; Lee, Y.T.; Mokhele, K.; Ostrom, E.; Raivio, K.; Rockström, J.; Schellnhuber, H.J.; et al. Earth System Science for Global Sustainability: Grand Challenges. Global Sustainability: Grand Challenges. Science 2010, 330, 916–917. [Google Scholar] [CrossRef] [PubMed]
  6. Haase, D.; Güneralp, B.; Dahiya, B.; Bai, X.; Elmqvist, T. Global urbanization. J. Urban Planet Knowl. Sustain. Cities 2018, 19, 326–339. [Google Scholar]
  7. Pan, T.; Kuang, W.; Shao, H.; Zhang, C.; Wang, X.; Wang, X. Urban expansion and intra-urban land evolution as well as their natural environmental constraints in arid/semiarid regions of China from 2000–2018. J. Geogr. Sci. 2023, 33, 1419–1441. [Google Scholar] [CrossRef]
  8. Fang, C.; Yu, D. Urban agglomeration: An evolving concept of an emerging phenomenon. Landsc. Urban Plan. 2017, 162, 126–136. [Google Scholar] [CrossRef]
  9. Jiang, Y. China’s water scarcity. J. Environ. Manag. 2009, 90, 3185–3196. [Google Scholar] [CrossRef] [PubMed]
  10. Liu, M.; Wei, J.; Wang, G.; Wang, F. Water resources stress assessment and risk early warning-a case of Hebei Province China. Ecol. Indic. 2017, 73, 358–368. [Google Scholar] [CrossRef]
  11. Bao, C.; Fang, C.-L. Water Resources Flows Related to Urbanization in China: Challenges and Perspectives for Water Management and Urban. Water Resour. Manag. 2011, 26, 531–552. [Google Scholar] [CrossRef]
  12. Feng, L.; Chen, B.; Hayat, T.; Alsaedi, A.; Ahmad, B. The driving force of water footprint under the rapid urbanization process: A structural decomposition analysis for Zhangye city in China. J. Clean. Prod. 2017, 163, S322–S328. [Google Scholar] [CrossRef]
  13. Zhang, L.Y.; Zhang, Z.; Chen, Y.; Tao, F.L. Spatial pattern of surface water quality in China and its driving factors-implication for the environmental sustainability. Hum. Ecol. Risk Assess. 2019, 25, 1789–1801. [Google Scholar] [CrossRef]
  14. Falkenmark, M.; Lundqvist, J.; Widstrand, C. Macro-scale water scarcity requires micro-scale approaches. Nat. Resour. Forum 1989, 13, 258–267. [Google Scholar] [CrossRef] [PubMed]
  15. Gossweiler, B.; Wesstrom, I.; Messing, I.; Romero, A.M.; Joel, A. Spatial and Temporal Variations in Water Quality and Land Use in a Semi-Arid Catchment in Bolivia. Water 2019, 11, 2227. [Google Scholar] [CrossRef]
  16. Graniel, C.; Morris, L.; Carrillo-Rivera, J. Effects of urbanization on groundwater resources of Merida, Yucatan, Mexico. Environ. Geol. 1999, 37, 303–312. [Google Scholar] [CrossRef]
  17. Zhou, F.; Xu, Y.P.; Chen, Y.; Xu, C.Y.; Gao, Y.Q.; Du, J.K. Hydrological response to urbanization at different spatio-temporal scales simulated by coupling of CLUE-S and the SWAT model in the Yangtze River Delta region. J. Hydrol. 2013, 485, 113–125. [Google Scholar] [CrossRef]
  18. Kim, Y.; Newman, G.; Güneralp, B. A review of driving factors, scenarios, and topics in urban land change models. Land 2020, 9, 246. [Google Scholar] [CrossRef]
  19. Meierdiercks, K.L.; Smith, J.A.; Baeck, M.L.; Miller, A.J. Heterogeneity of Hydrologic Response in Urban Watersheds. JAWRA J. Am. Water Resour. Assoc. 2010, 46, 1221–1237. [Google Scholar] [CrossRef]
  20. Sun, X.; Zhang, H.; Hua, D.; Wei, B. The Influence of Urbanization on Storm Runoff. Front. Environ. Prot. 2021, 11, 654–659. [Google Scholar] [CrossRef]
  21. Bao, C.; He, D.M. Scenario Modeling of Urbanization Development and Water Scarcity Based on System Dynamics: A Case Study of Beijing-Tianjin-Hebei Urban Agglomeration, China. Int. J. Environ. Res. Public Health 2019, 16, 3834. [Google Scholar] [CrossRef] [PubMed]
  22. Meinzen-Dick, R.; Appasamy, P. Urbanization and Intersectoral Competition for Water. In Finding the Source: The Linkages between Population and Water; ESCP: Paris, France, 2002; pp. 27–51. [Google Scholar]
  23. Orubu, C.O.; Omotor, D.G. Environmental quality and economic growth: Searching for environmental Kuznets curves for air and water pollutants in Africa. Energy Policy 2011, 39, 4178–4188. [Google Scholar] [CrossRef]
  24. Carroll, B.A. Strategic water planning for south east England: Preparing for proposed development. Water Sci. Technol. J. Int. Assoc. Water Pollut. Res. 2003, 48, 9–16. [Google Scholar] [CrossRef]
  25. Bao, C.; Fang, C.-L. Analysis of spatial and temporal variation of water resources on the intensity of urbanization constraints in arid regions. J. Geogr. 2008, 63, 1140–1150. [Google Scholar]
  26. Zhang, Z.; Shi, M.; Chen, K.Z.; Yang, H.; Wang, S. Water scarcity will constrain the formation of a world-class megalopolis in North China. NPJ Urban Sustain. 2021, 1, 13. [Google Scholar] [CrossRef]
  27. Ma, H.L.; Chou, N.T.; Wang, L. Dynamic Coupling Analysis of Urbanization and Water Resource Utilization Systems in China. Sustainability 2016, 8, 1176. [Google Scholar] [CrossRef]
  28. Wu, X.Y.; Xu, C.X.; Pang, Q.H. Analysis on Driving Effect of the Urbanization Development Speed on Water Resources Conflict. Math. Probl. Eng. 2017, 2017, 6810120. [Google Scholar] [CrossRef]
  29. Cui, D.; Chen, X.; Xue, Y.L.; Li, R.; Zeng, W.H. An integrated approach to investigate the relationship of coupling coordination between social economy and water environment on urban scale—A case study of Kunming. J. Environ. Manag. 2019, 234, 189–199. [Google Scholar] [CrossRef] [PubMed]
  30. Kalantari, Z.; Ferreira, C.S.S.; Page, J.; Goldenberg, R.; Olsson, J.; Destouni, G. Meeting sustainable development challenges in growing cities: Coupled social-ecological systems modeling of land use and water changes. J. Environ. Manag. 2019, 245, 471–480. [Google Scholar] [CrossRef]
  31. Bhaskar, A.S.; Jantz, C.; Welty, C.; Drzyzga, S.A.; Miller, A.J. Coupling of the Water Cycle with Patterns of Urban Growth in the Baltimore Metropolitan Region, United States. JAWRA J. Am. Water Resour. Assoc. 2016, 52, 1509–1523. [Google Scholar] [CrossRef]
  32. Zhang, H.; Lai, H.L. Analysis of the interactive coupling mechanism between the development of Kunming main city and Dianchi water environment from 1998 to 2008. China Soil Water Conserv. 2012, 000, 64–66. [Google Scholar]
  33. Anwar, A.; Sinha, A.; Sharif, A.; Siddique, M.; Irshad, S.; Anwar, W.; Malik, S. The nexus between urbanization, renewable energy consumption, financial development, and CO2 emissions: Evidence from selected Asian countries. Environ. Dev. Sustain. 2022, 24, 6556–6576. [Google Scholar] [CrossRef]
  34. Expósito, A.; Pablo-Romero, M.; Sánchez-Braza, A. Testing EKC for Urban Water Use: Empirical Evidence at River Basin Scale from the Guadalquivir River, Spain. J. Water Resour. Plan. Manag. 2019, 145, 04019005. [Google Scholar] [CrossRef]
  35. Chen, A.; Gao, J. Urbanization in China and the Coordinated Development Model-The case of Chengdu. Soc. Sci. J. 2011, 48, 500–513. [Google Scholar] [CrossRef]
  36. Chen, X. China Urban Statistical Yearbook: 2019; China Statistics Press: Beijing, China, 2020. [Google Scholar]
  37. Xiong, J.; Zeng, J. Sichuan Statistical Yearbook 2020 (38th Issue in Total); China Statistical Publishing House Co., Ltd.: Beijing, China, 2020. [Google Scholar]
  38. Yang, H.; Li, T. Chongqing Statistical Yearbook 2020; China Statistical Publishing House: Beijing, China, 2020. [Google Scholar]
  39. Liao, S.; Wu, Y.; Wong, S.W.; Shen, L. Provincial perspective analysis on the coordination between urbanization growth and resource environment carrying capacity (RECC) in China. Sci. Total Environ. 2020, 730, 138964. [Google Scholar] [CrossRef] [PubMed]
  40. Ding, L.; Zhao, W.T.; Huang, Y.L.; Cheng, S.G.; Liu, C. Research on the Coupling Coordination Relationship between Urbanization and the Air Environment: A Case Study of the Area of Wuhan. Atmosphere 2015, 6, 1539–1558. [Google Scholar] [CrossRef]
  41. Wang, Z.B.; Liang, L.W.; Sun, Z.; Wang, X.M. Spatiotemporal differentiation and the factors influencing urbanization and ecological environment synergistic effects within the Beijing-Tianjin-Hebei urban agglomeration. J. Environ. Manag. 2019, 243, 227–239. [Google Scholar] [CrossRef]
  42. Lin, X.; Lu, C.; Song, K.; Su, Y.; Lei, Y.; Zhong, L.; Gao, Y. Analysis of Coupling Coordination Variance between Urbanization Quality and Eco-Environment Pressure: A Case Study of the West Taiwan Strait Urban Agglomeration, China. Sustainability 2020, 12, 2643. [Google Scholar] [CrossRef]
  43. Whitall, D.; Bricker, S.; Ferreira, J.; Nobre, A.M.; Simas, T.; Silva, M. Assessment of Eutrophication in Estuaries: Pressure-State -Response and Nitrogen Source Apportionment. Environ. Manag. 2007, 40, 678–690. [Google Scholar] [CrossRef]
  44. Liu, D.; Hao, S. Ecosystem Health Assessment at County-Scale Using the Pressure- State-Response Framework on the Loess Plateau, China. Int. J. Environ. Res. Public Health 2017, 14, 2. [Google Scholar] [CrossRef]
  45. Neri, A.C.; Dupin, P.; Sánchez, L.E. A pressure-state-response approach to cumulative impact assessment. J. Technol. Sci. 2016, 126, 288–298. [Google Scholar] [CrossRef]
  46. Zhu, X.A.; Wei, G.D. Exploration of the criteria of goodness of dimensionless method in entropy method. Stat. Decis. 2015, 31, 12–15. [Google Scholar]
  47. Li, T.; Liao, H.; Yang, W.; Zhuang, W.; Shi, W. Spatio-temporal variation and coupling coordination of “land, population and industry” urbanization quality in Chongqing. Econ. Geogr. 2015, 35, 65–71. [Google Scholar]
  48. Liu, Y.B.; Song, X.F. Study on the coupling degree of urbanization and ecological environment and its prediction model. J. China Univ. Min. Technol. 2005, 34, 6. [Google Scholar]
  49. Wu, D.J.; Cao, L.; Chen, L.H. Principles and Applications of Covariance; Huazhong University of Technology Press: Wuhan, China, 1990; pp. 9–17. [Google Scholar]
  50. Moran, P.A. The Interpretation of Statistical Maps. J. R. Stat. Soc. Ser. B Methodol. 1948, 10, 243–251. [Google Scholar] [CrossRef]
  51. Anselin, L. Local Indicators of Spatial Association-LISA. Geogr. Anal. 1995, 27, 93–115. [Google Scholar] [CrossRef]
  52. Mei, C.X.; Xu, S.J.; Ouyang, J.; Shi, C. Spatial and temporal evolution of urban spatial interactions in the Pearl River Delta urban agglomeration in the last 20 years. Geoscience 2012, 32, 694–701. [Google Scholar]
  53. Li, J.; Zhang, Y. Study on the coordination of new urbanization and eco-efficiency coupling in the Yangtze River Delta urban agglomeration and the driving factors. Ecol. Econ. 2022, 38, 109–114+141. [Google Scholar]
  54. Han, H.; Li, H.; Zhang, K. Spatial-Temporal Coupling Analysis of the Coordination between Urbanization and Water Ecosystem in the Yangtze River Economic Belt. Int. J. Environ. Res. Public Health 2019, 16, 3757. [Google Scholar] [CrossRef]
Figure 1. The location of the study area in China (a); Study area (b).
Land 13 01054 g001
Figure 2. Research framework.
Land 13 01054 g002
Figure 3. Comprehensive index of urbanization (U)and Component Evaluation, 2011–2019.
Land 13 01054 g003
Figure 4. Comprehensive index of urbanization (U) by city, 2011–2019.
Land 13 01054 g004
Figure 5. Comprehensive index of water environment (W) and component evaluation, 2011 to 2019.
Land 13 01054 g005
Figure 6. Comprehensive water environment index (W) by city, 2011–2019.
Land 13 01054 g006
Figure 7. Urbanization and water environment fitting curve on Regional-scale, 2011–2019.
Land 13 01054 g007
Figure 8. Coupling degree and coupling coordination degree, 2011–2019.
Land 13 01054 g008
Figure 9. Trend of Coupling coordination degree of urbanization and water environment system by cities, 2011–2019.
Land 13 01054 g009
Figure 10. The state of coupling coordination of urbanization and water environment system by cities, 2011–2019.
Land 13 01054 g010
Figure 11. Spatial distribution of coupling coordination degree of urban clusters and LISA map.
Land 13 01054 g011aLand 13 01054 g011b
Table 1. Indicator system of urbanization.
SystemSubsystemsIndicator Level
Urbanization
(U)
Population urbanization
(U1)
Urbanization rate of resident population (U11)
population density (U12)
Share of employment in the third sector (U13)
Urban registered unemployment rate (U14)
Space urbanization
(U2)
built-up area as a proportion of the city area (U21)
road network density (U22)
road area per capita (U23)
annual land acquisition area (U24)
Economic urbanization
(U3)
GDP per capita (U31)
I production weight (U32)
Fixed asset investment per capita (U33)
Disposable income per urban resident (U34)
Social urbanization
(U4)
Number of doctors per 10,000 people (U41)
Number of students in primary and secondary schools per 10,000 people (U42)
Year-end cell phone subscribers (U43)
Culture Center (Station) (U44)
Table 2. Indicator’s system of water environment.
SystemSubsystemsIndicator Layer
Water Environment
(W)
Status (W1)Total Water Resources (W11)
water resources per capita (W12)
Water Resources Development and Utilization Rate (W13)
Water supply (use) penetration rate (W14)
Greening coverage of built-up areas (W15)
Pressure (W2)million Yuan GDP water consumption (W21)
Water consumption for secondary production (W22)
per capita daily domestic water consumption in urban areas (W23)
Urban sewage discharge (W24)
Industrial wastewater discharge (W25)
Response (W3)Total water supply (W31)
Density of drainage pipes in built-up areas (W32)
Water Conservation Reuse Rate (W33)
Centralized sewage treatment rate (W34)
Effective irrigation rate of cultivated land (W35)
Table 3. Weights of urbanization system.
SubsystemsWeightsIndicator LevelWeights
U10.2669U110.0682
U120.0661
U130.0651
U140.0675
U20.2391U210.0600
U220.0689
U230.0693
U240.0409
U30.2528U310.0628
U320.0678
U330.0544
U340.0678
U40.2412U410.0666
U420.0664
U430.0457
U440.0625
Table 4. Weights of water system.
SubsystemsWeightsIndicator LayerWeights
W10.3215W110.0527
W120.0541
W130.0713
W140.0717
W150.0717
W20.3637W210.0725
W220.0724
W230.0727
W240.0727
W250.0734
W30.3148W310.0503
W320.0697
W330.0563
W340.0725
W350.0660
Table 5. Classification of the urbanization and water environment coupling degree.
Coupling PhaseC-ValueFeatures
Irrelevant stageC = 0The elements within the system are in an unrelated state and independent of each other
Low-level coupling stage0 < C ≤ 0.3Low level of urbanization development, water resources system can basically support
Antagonistic stage0.3 <C ≤ 0.5Rapid urbanization, water resources support capacity decreases and cannot fully support the impact of urbanization development
Breaking-in stage0.5 < C ≤ 0.8Water security restoration in a benign coupling phase
High level coupling stage0.8 < C ≤ 1.0Inter-system convergence to a new orderly development of resonant coupling
Table 6. Classification of the urbanization and water environment coupling coordination degree.
Coordination StatusD-ValueCoordination Types and Characteristics f U   and   f W the Relationship Between
Severe imbalance0 ≤ D ≤ 0.25Poor connection between the two systems f U > f W Urbanization development ahead of the type
Imbalance0.25 < D ≤ 0.45The weak interaction between the two systems
Basic Coordination0.45 < D ≤ 0.65The connection between the two systems begins to strengthen f U f W < 0.1Synchronization of urbanized water environment
Coordination0.65 < D ≤ 0.75Mutual reinforcement between the two systems f U < f W Lagging urbanization type
Good coordination0.75 < D ≤ 1.00Good coordination between the two systems
Table 7. Moran’s I values for coupling urbanization and water environment coordination, 2011–2019.
Parameters201120122013201420152016201720182019
Moran’s I−0.228−0.236−0.186−0.191−0.171−0.109−0.239−0.175−0.167
Variance0.1270.1270.1260.1350.1360.1360.1350.1380.145
Z Score−1.298−1.353−0.962−0.933−0.865−0.408−1.311−0.897−0.762
P-value0.0720.0690.1840.1870.1980.3990.0760.1940.232
RelevanceRandomRandomRandomRandomRandomRandomRandomRandomRandom
Disclaimer/Publisher’s Note: The statements, opinions and data contained in all publications are solely those of the individual author(s) and contributor(s) and not of MDPI and/or the editor(s). MDPI and/or the editor(s) disclaim responsibility for any injury to people or property resulting from any ideas, methods, instructions or products referred to in the content.

