Article

The Temporal and Spatial Dynamics of Succession in a Glacial Foreland in Southern Iceland: The Effects of Landscape Heterogeneity

by
Lawrence Tanner
*,
Genevieve Kikukawa
and
Kaylyn Weits
Department of Biological & Environmental Sciences, Le Moyne College, Syracuse, NY 13214, USA
*
Author to whom correspondence should be addressed.
Land 2024, 13(7), 1055; https://doi.org/10.3390/land13071055
Submission received: 24 May 2024 / Revised: 6 July 2024 / Accepted: 12 July 2024 / Published: 15 July 2024
(This article belongs to the Section Landscape Ecology)

Abstract

:
One of the more visible consequences of anthropogenic climate change is the ongoing retreat of glaciers worldwide. Rates of primary succession in the resulting glacial forelands are commonly calculated from a single measurement set using a single set of measurements across a landscape of varying age, but repeated measurements over decadal scales may be a more effective means of examining the rates and trends of colonization and community development. Repeated measurements of vegetation groups in a glacial foreland in southern Iceland demonstrate that successional changes are measurable, as shown by the calculation of the dissimilarity index at sites over a 15 year interval. Inter-site dissimilarity validates the essential paradigm of primary succession, where vegetative coverage increases in the glacial foreland as a function of time and supports earlier interpretations saying that species richness decreases on older surfaces, even as the total vegetation cover increases. However, successional processes are subject to major abiotic factors, such as aspect, which is controlled by landscape topography, and the substrate composition. The glacial moraines and outwash plain are underlain by different substrates which produce separate successional trajectories. Succession on the moraines ultimately produces a birch-shrub-heath community, while the outwash deposits promote development of a moss-heath community.

1. Introduction

The retreat of glaciers from their Little Ice Age (LIA) maxima in the 19th century was initiated and controlled by the natural cessation or decline of the LIA’s forcing mechanisms, while the radiative forcing effects of anthropogenic carbon emissions (i.e., “greenhouse” warming) were still minimal [1]. Through the 20th century, however, the increased loading of the atmosphere with greenhouse gases led to amplified radiative forcing and overwhelmed the natural controls for the mass balance of glaciers, causing an accelerating rate of glacial retreat globally [2,3,4,5,6].
Regardless of latitude or altitude, the exposure of a foreland in front of retreating ice triggers a host of abiotic processes, including both chemical weathering and pedogenic modifications (soil-related, which is thoroughly reviewed in [7]), as well as biotic colonization on scales ranging from the microbial to the macroscopic (see [8,9]). The consequence of these complex and intricately linked processes is the formation of new ecosystems in terrain previously occupied by ice [10]. The landscapes of these forelands have a maximum age corresponding to the local maximum advance during the Little Ice Age, although they may be bordered by much older landscapes which were not glaciated during the LIA and which potentially serve as sources of micro- and macrobiotic colonizers. In a general sense, the age of the surface of a foreland increases with the distance from the ice front, thereby constituting a chronosequence in which the rates of various ecological processes can be measured [11]. More precisely, historically dated recessional moraines, in addition to well-dated push moraines which formed during glacial readvances, allow for accurately dated chronologies of biotic colonization, thereby providing important data on the rates of primary succession.
Despite the vast number of successional studies conducted on the forelands of temperate-latitude glaciers (see [7,12]), a smaller number of studies on primary succession or pedogenesis have been conducted in high-latitude (Arctic or subarctic) settings, some of the most notable of which have been those conducted on Svalbard [13,14,15,16,17,18,19,20]. Significantly, the differences which have been found in succession between lower- and higher-latitude forelands were mainly in the rates and the species involved, rather than the successional mechanisms themselves [21].
The geography of Iceland is dominated by highland ice caps, the largest of which, the Vatnajökull (circa 7900 km2) in southeastern Iceland, produces approximately 25 outlet glaciers. Nearly all of these outlet glaciers are currently in recession, with many having retreated over one kilometer in the last century [22], leaving exposed forelands. These forelands comprise fresh surfaces of ice-contact (till) and outwash deposits now subject to floral colonization and pedogenesis in chronosequences with maximum durations of 130 years or more. Due to its protection within the boundaries of Vatnajökull National Park and the exclusion of grazing animals, combined with a well-established temporal record of glacial retreat, the foreland of the Skaftafellsjökull is an ideal natural laboratory for the study of successional processes in a glacial setting.
Previous studies on the Skaftafellsjökull foreland have documented that vegetative cover and soil development both increase dramatically with the distance from the current ice front, which is an approximate proxy for exposure time since deglaciation [12,22,23]. This study examines the dynamics of community structure by quantifying the spread of functional groups in a foreland chronosequence. By comparing data from sample sites at different locations on the moraines, we also are able study the importance of aspect in floral succession in this setting. Furthermore, by comparing successional communities in the moraines with those from outwash deposits, we examine the importance of substrate in plant succession. Finally, by comparing these new data with those collected from the same sample sites 15 years earlier [12], we are able to examine the temporal dynamics of the various functional groups.

2. Methods

2.1. Location and Setting

The study site was the foreland of the Skaftafellsjökull in southeastern Iceland (Figure 1). Long-term monitoring of the positions of the terminus of the Skaftafellsjökull has resulted in a record of the ice retreats and readvances since the glacier reached its maximum modern extent at the close of the LIA in 1890. Data on the movements of the Skaftafellsjökull have been and continue to be collected by a combination of scientists and local residents under the auspices of the Hydrologic Service of the National Energy Authority in Reykjavik. The data are periodically published by the journal Jökull (http://jokull.jorfi.is; accessed on 9 September 2023) and are also accessible from the database of the Icelandic Glaciological Society (http://spordakost.jorfi.is; accessed on 12 January 2024). The ice front of the Skaftafellsjökull has retreated approximately 3 km since the LIA’s maximum, although not uniformly. For the most part, this glacier was in retreat through the 1930s and into the 1950s as the climate warmed. However, the warming trend was interrupted by episodes of cooling in the latter half of the 20th century. As a consequence, recession rates slowed through the 1960s and 1970s, and the Skaftafellsjökull experienced readvances in the late 1970s through 1980s, resulting in the formation of nested push moraines [24,25]. Since the mid-1980s, warming has been more consistent, leading to a resumption of retreat in recent decades [25].
The overall recession of the Skaftafellsjökull over more than a dozen decades has exposed a proglacial landscape with a varied topography, comprising more subdued older recessional moraines, steeper, younger push moraines, outwash terraces, and the distal outwash plain. The recessional moraines left by the non-surging glacier are reasonably well dated. The most distal moraine of the Skaftafellsjökull (in Vatnajökull National Park), for example, has been dated to the position of the ice front from 1890 to 1904. A much more pronounced topography is formed by a set of nested moraines which date from the position of the glacial front in 1945 (Figure 1). The more proximal moraines date to the positions of the glacial front in 1954, 1960, 1982, and 2002 [22,24,26,27]. Between some moraines are flatter areas formed by alluvial outwash terraces and incised channels. These outwash surfaces differ from the moraines in both their topography—the outwash deposits generally have nearly horizontal surfaces in contrast to the slopes of the moraines—and in composition, as the moraines consist of rather poorly sorted glacial diamict with protruding boulders, while the outwash consists mainly of moderately sorted, gravel-sized clasts. The ages of these outwash surfaces generally are not well constrained, other than by the moraines which form their boundaries, due to the possibility of continued reactivation of the outwash channels over the course of many years. Consequently, the surfaces at Skaftafell can best be characterized as pre-1890, 1890–1904, 1904–1945, 1945–1960, 1960–1982, 1982–2002 and post-2002. Nonetheless, the foreland of the Skaftafellsjökull forms an approximate chronosequence [11,28] in which the distance from the ice front equates (quite approximately) to the time of exposure and soil formation of the surface.
The site of this study is located at latitude N 64°1.0′ and has a mean elevation of roughly 100 m asl. The southeastern coast of Iceland is subject to a cool maritime climate, with mean annual precipitation of approximately 1800 mm and a mean annual temperature from 4 °C to 6 °C, where the winter (January) mean is near 0 °C and the summer (July) mean is 10 °C [29]. Notably, air temperatures in proximity to the glacier are greatly variable and often significantly cooler. In proximity to the Skaftafellsjökull ice front, the air temperature close to ground level (at 5 cm) has been found to decrease by as much as 9 °C compared with those in distal locations [30]. The land surface closest to the glacier is also subject to glacial winds of variable strength. Such winds are a common phenomenon formed by the high temperature gradient immediately above the glacial ice [31,32], although no data specific to the Skaftafellsjökull foreland are available. Prior to 1967, the study area was farmland (for sheep farming). This area was largely abandoned for grazing after the national park was established in 1967 and formally fenced off in 1987 [23].

2.2. Previous Work

The first recorded survey of species richness at various distances from the Skaftafellsjökull ice front was conducted in 1962 [26], although as was noted later [12], many of the sample locations in this early study were subject to microclimate bias from their sheltered positions near a steep rock ridge which borders the western side of the foreland. Other studies have examined soil nutrients and total vegetative cover at different distances from the ice front [23,33], while only one focused solely on the floral community structure and successional processes operating in the foreland chronosequence [12]. Specifically, this study measured species richness in transects established in moraines at different distances from the current glacier terminus, representing different landscape ages, in addition to a glacial outwash channel terrace between moraines and locations on the outwash plain distal to the oldest moraine. The most common components of the successional communities are mosses, primarily Racomitrium lanuginosum (Hoary-fringe moss), followed by a low shrub community comprising Empetrum nigrum (black crowberry), Calluna vulgaris (Scotch heather), Arctostaphylos uva-ursi (bearberry), and Saxifraga oppositofolia (purple saxifrage). Minor components include the dwarf trees Betula pubescens (downy birch), Salix lanata (wooly willow), Salix phylicifolia (tea-leaved willow), and various graminoids and forbs. One earlier work [12] suggested that following the pioneer stage, species richness and vegetation coverage both increased in the foreland from the early through mid-successional stages, but species richness decreased in the oldest portions of the landscape, even as the total vegetation cover increased. A subsequent study [34] on the dynamics of colonization of the foreland moraines by woody-stemmed species found that S. lanata is the earliest woody pioneer species, but B. pubescens spread more effectively during the later successional stages.

2.3. Field Techniques

This study reexamined the sites of the measurement locations of a study published in 2019 [12] using the coordinates recorded by hand-held Global Positioning System devices manufactured by Garmin Ltd. (Olathe, KS, USA) in 2007 for the starting points of the transects (Figure 1). Transect 1 is the most proximal to the ice front, located on the glacier-facing slope (equal to the proximal aspect) of the most recent moraine, which is dated to the position of the ice front in 2002 [27] (Figure 2a). Transect 2 is located southwest of Transect 1 on a surface gently sloping away from the glacier (distal aspect) near the top of a moraine associated with the ice position in 1982 (Figure 2b). Transect 3 is situated on the northeast-facing slope (proximal aspect) of a moraine ridge which marks the position of the ice front circa 1954 [26]. Transect 4 is situated in a slight hollow on the southwest-facing slope (distal aspect) of the moraine ridge from 1954, overlooking a kettle pond in the 1945 moraine (Figure 2c). Transect 5 is on a broad slope with its distal aspect near the top of the 1945 moraine. The date of deglaciation of the site was estimated to be 1938 (based on data from [22] (Figure 2d)). Transect 6 is located on the terrace of a stream channel in a broad swale immediately east (toward the glacier) of the moraine associated with the ice position in 1904 [22] (Figure 2e). However, this swale was occupied by an outwash channel actively draining the glacier as recently as 1962 [26]. Transect 7 is situated on the outwash plain adjacent to the margin of the oldest boulder moraine, associated with the position of the ice margin between 1904 and 1890. Transects 8 and 9 are located on the outwash plain distal (west) of the 1890 ice front. The topography here is not entirely flat but consists of rather subdued ridges and swales which are relicts of the period when the outwash channels in the plain were occupied. Transect 10, which was not studied in the earlier work [12], is located to the south of the other transects on the distal side of the 1890 moraine (Figure 2f).
At each site, a transect line was established parallel to the trend of the moraines, with five measurement stations set 10 m apart without regard for the microtopography (i.e., there was no bias for favorable or unfavorable locations in station selection, although each transect was oriented to try to maintain a consistent aspect (proximal, neutral, or distal) from station to station). Starting points for the stations were chosen without bias for the substrate (e.g., some individual stations included non-vegetated boulders or bare ground). At each station, measurements were made using a 0.5 m × 0.5 m (0.25 m2) quadrat which was rotated spatially to provide 1.0 m2 of continuous coverage per station. Within each quadrat, the percentage of cover for each of the major vegetation functional groups (mosses, shrubs, dwarf trees, graminoids, forbs, lichens, and biological soil crust) plus the non-vegetated area were estimated for comparison with the data collected in 2007. Where groups overlapped spatially (e.g., birch overlapping moss when viewed from above), both groups were counted (but the maximum vegetation coverage was limited to 100%).
The community structure was represented by assigning all species to the functional groups listed above. All bryophytes were grouped as mosses; as noted above, R. lanuginosum was dominant. All nongraminoid herbaceous species were designated as forbs. The low shrub group comprised E. nigrum, generally the most abundant member of the group, but other common representatives of the group were A. uva-ursi, saxifrages, primarily S. oppositifolia, Thymus praecox (wild thyme), and C. vulgaris. The willows and birches have thicker, woodier stems than the other shrubs, and therefore, they were treated as separate groups. The willows consisted of the species S. lanata and S. phylicifolia. Previous work [34] has found that birches and willows exhibit differing dynamics in the Skaftafell foreland, and therefore, they were treated as separate groups in this study. Graminoids include all grasses, fescues, and rushes, of which Festuca rubra (red fescue) and Poa alpina (alpine meadow grass) are the most common. The birches consisted of the single species B. pubescens. Lichens, including the foliose and fruticose varieties but excluding crustose lichens, formed a group not measured in the earlier study [12]. Similarly, biological soil crusts (BSCs) were not measured in the earlier study.

2.4. Data Treatment

The results of the functional group counts for each transect were compared to the counts for temporally adjacent transects (e.g., Transect 1 versus Transect 2, Transect 2 versus Transect 3, etc.) by adapting the Bray-Curtis index of dissimilarity (BCI). The BCI is used most commonly to quantify the difference between two sites in terms of the species occurring at those sites. Here, we used the percentages of each of the functional groups rather than individual species counts. The total vegetated cover was not included in this calculation as the cover was the sum of the functional groups. The BCI was calculated as follows:
BCIij = 1 − [(2 × Cij) / (Si + Sj)]
where Cij is the sum of the lesser values for the percentage of the functional group means found in each transect; Si is the sum of the functional group percentage (not including rock and soil) measured at transect i; and Sj is the sum of the functional group percentage measured at transect j. The BCI values could range from 0, indicating that the two transects shared the same proportions of all functional groups, to 1, where the two transects shared none of the same functional groups. We also used the BCI to compare the proportions of the functional groups for each transect as measured in 2022 (this study) to the proportions measured at the same locations in 2007 from the data of an earlier study [12].
The significance of the differences between the 2007 and 2022 functional group proportions was evaluated statistically using a paired t-test, in which the two years of measurement represented paired treatments of each station within each transect. The paired t-test was used here to examine the significance of the differences between individual transects (e.g., Transect 1 (2007) versus Transect 1 (2022)). It was also used to examine the differences in the individual functional groups between the two measurement years across all stations and transects simultaneously (e.g., low shrubs at all stations in 2007 versus 2022) and also for the functional groups at each individual transect. Statistical significance was assumed to be at the level of p ≤ 0.05. All statistical tests were calculated using the statistical software package SigmaStat version 4.0, manufactured by Systat Software Inc. (San Jose, CA, USA).

3. Results

The complete results of the measurements for each station in the 10 transects are presented in Table 1. At the scale of measurement (1 m2 per station), the distribution of most vegetation types was spatially uneven or patchy, resulting in high standard deviations for the mean transect values. Nevertheless, we are confident that the mean values of each functional group calculated for each transect are representative of the distribution of the vegetation for the transects.

3.1. Field Observations

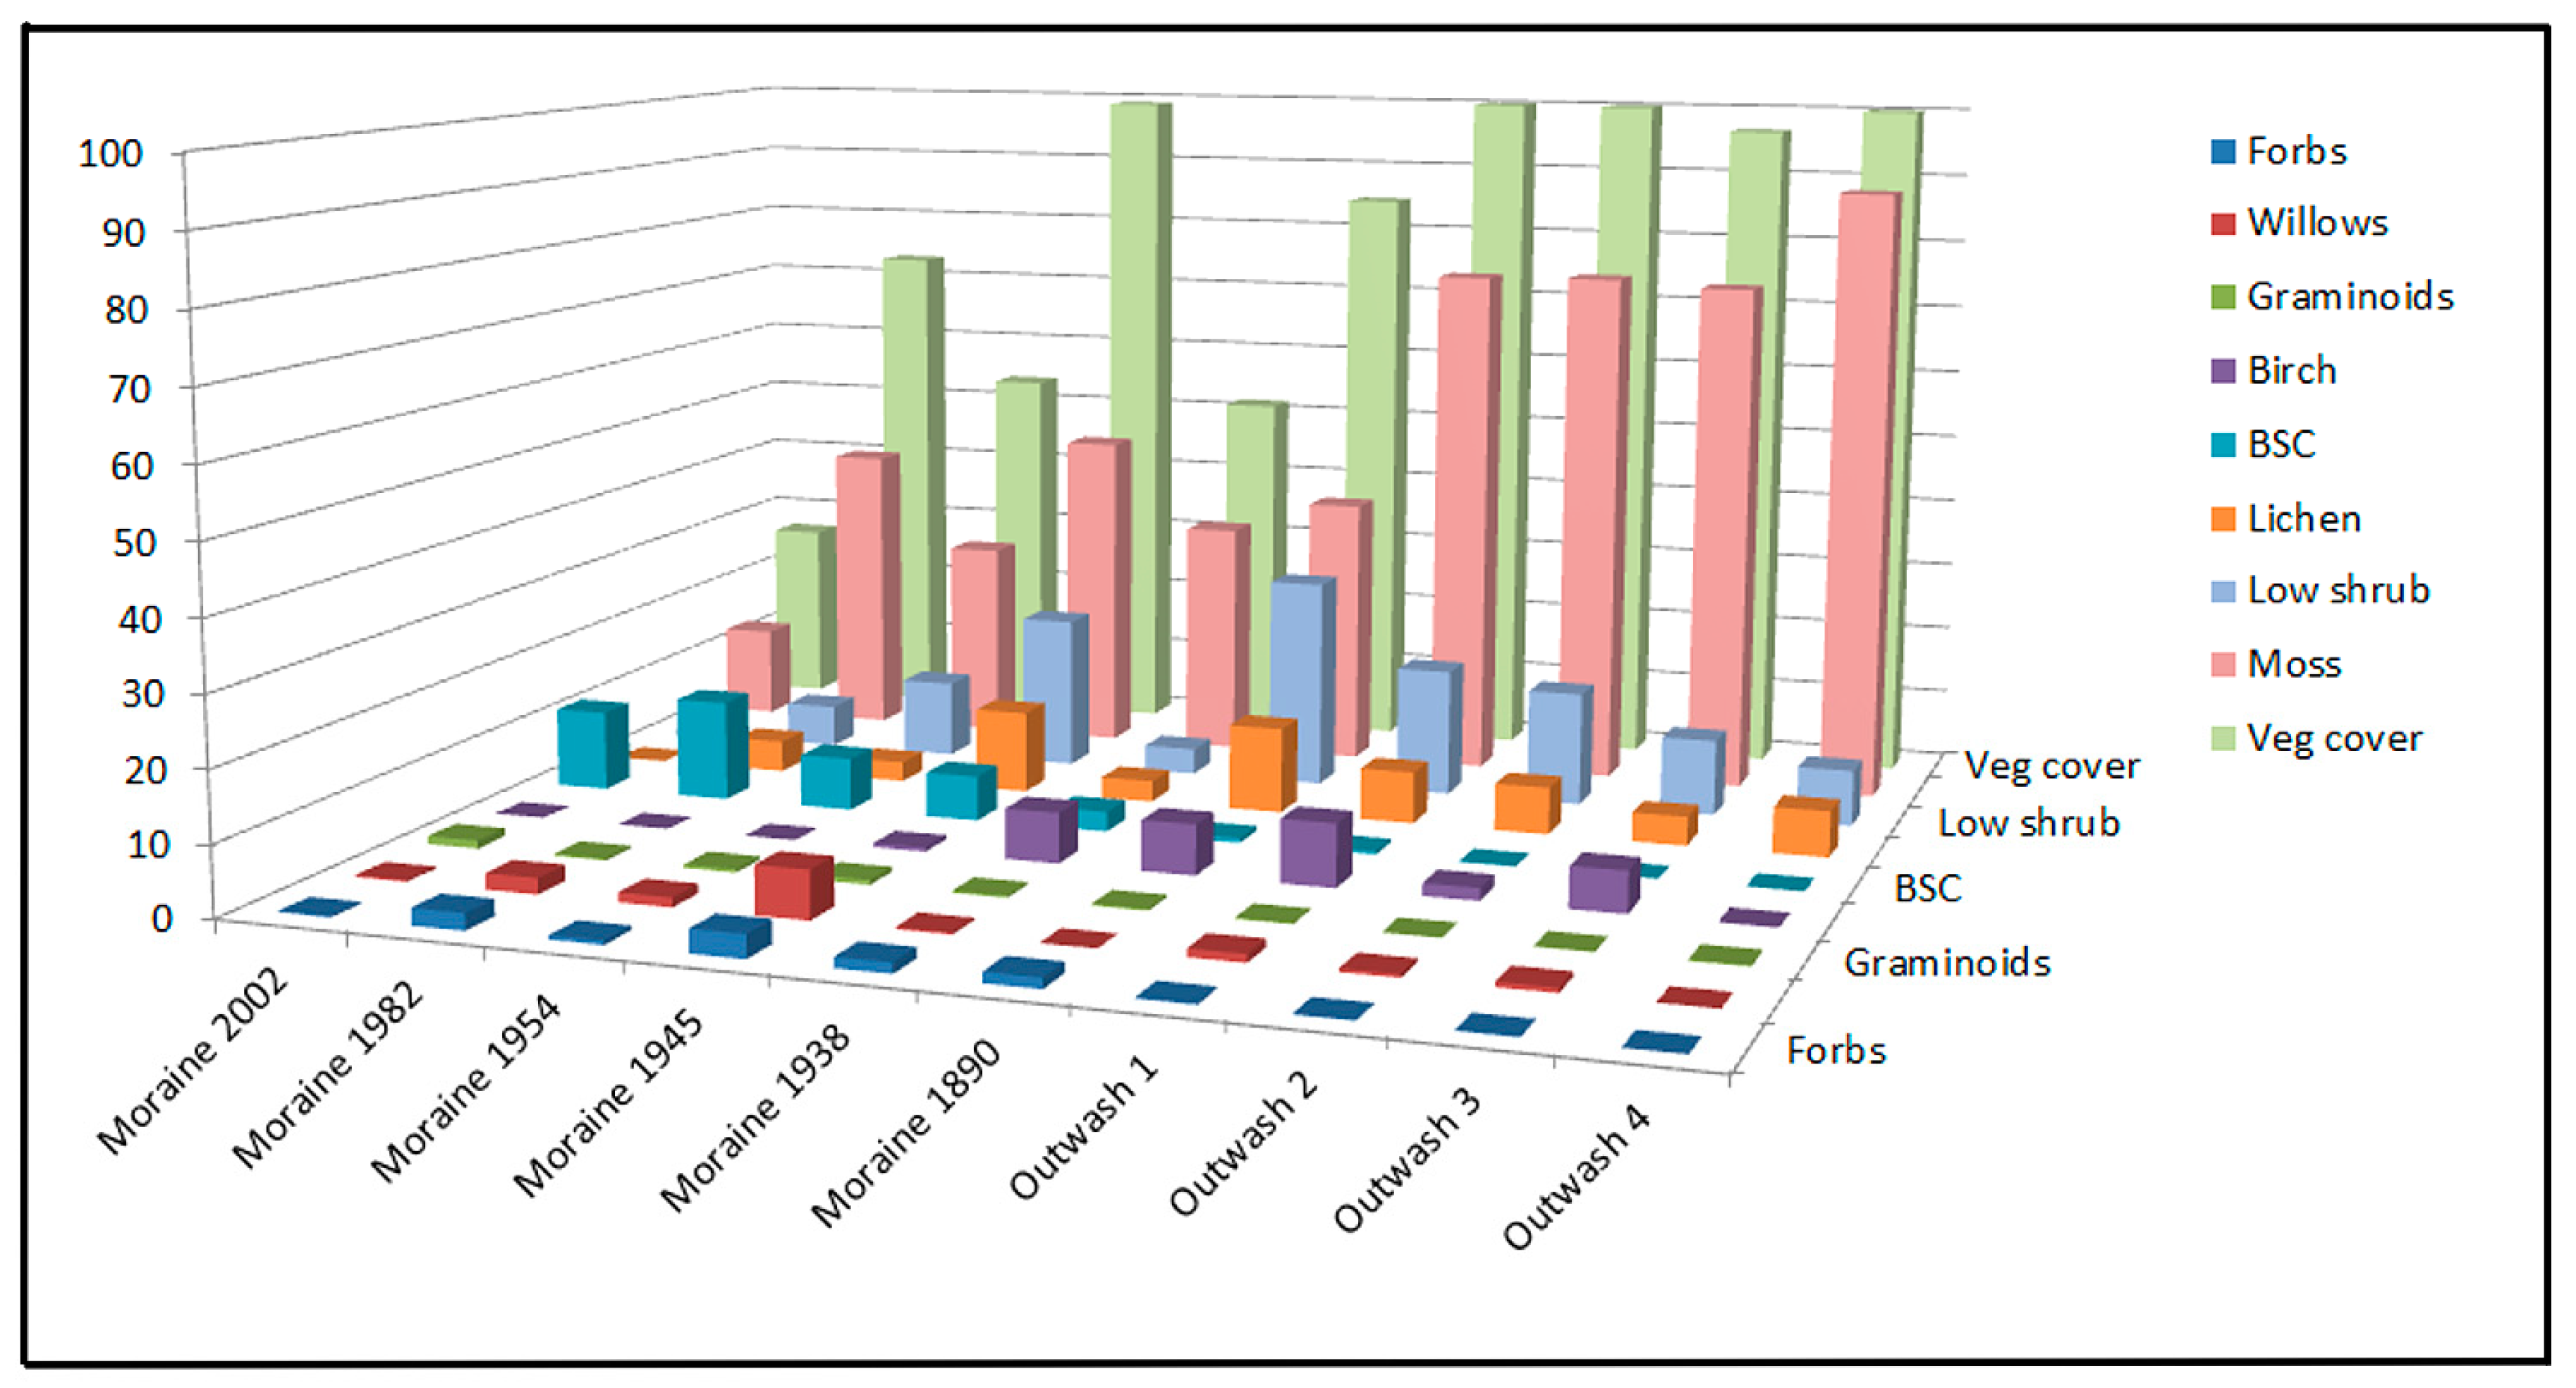
  • Transect 1: The youngest land surface examined was the ice-ward-oriented slope of a push moraine which is proximal to the present lagoon in front of the Skaftafellsjökull (Figure 2a). The slope varied in direction from east to north-northwest, with the average facing north, and in angle from 6° to 12° (mean = 10°). This surface was estimated to have been ice free since circa 2002. This surface varies from poorly sorted gravel to (rare) boulder-sized clasts. The surface of this transect was dominated by rocks greater than 1 cm in diameter, although rock coverage varied from station to station, namely from 41.3% to 92.5% (mean = 72.1%; SD = 20.8; Table 1). Vegetative cover, including mosses, lichens, and BSCs, was also greatly variable, being from 7.8% to 58.5% and averaging 24.5% across the five stations (SD = 20.9). The vegetative component was dominated by mosses (13.3%) and BSCs (11.8%). Graminoids averaged 1.2% cover, while forbs, willows, and lichens all averaged less than 1.0% cover. Low shrub vegetation and birches were not observed in this transect.
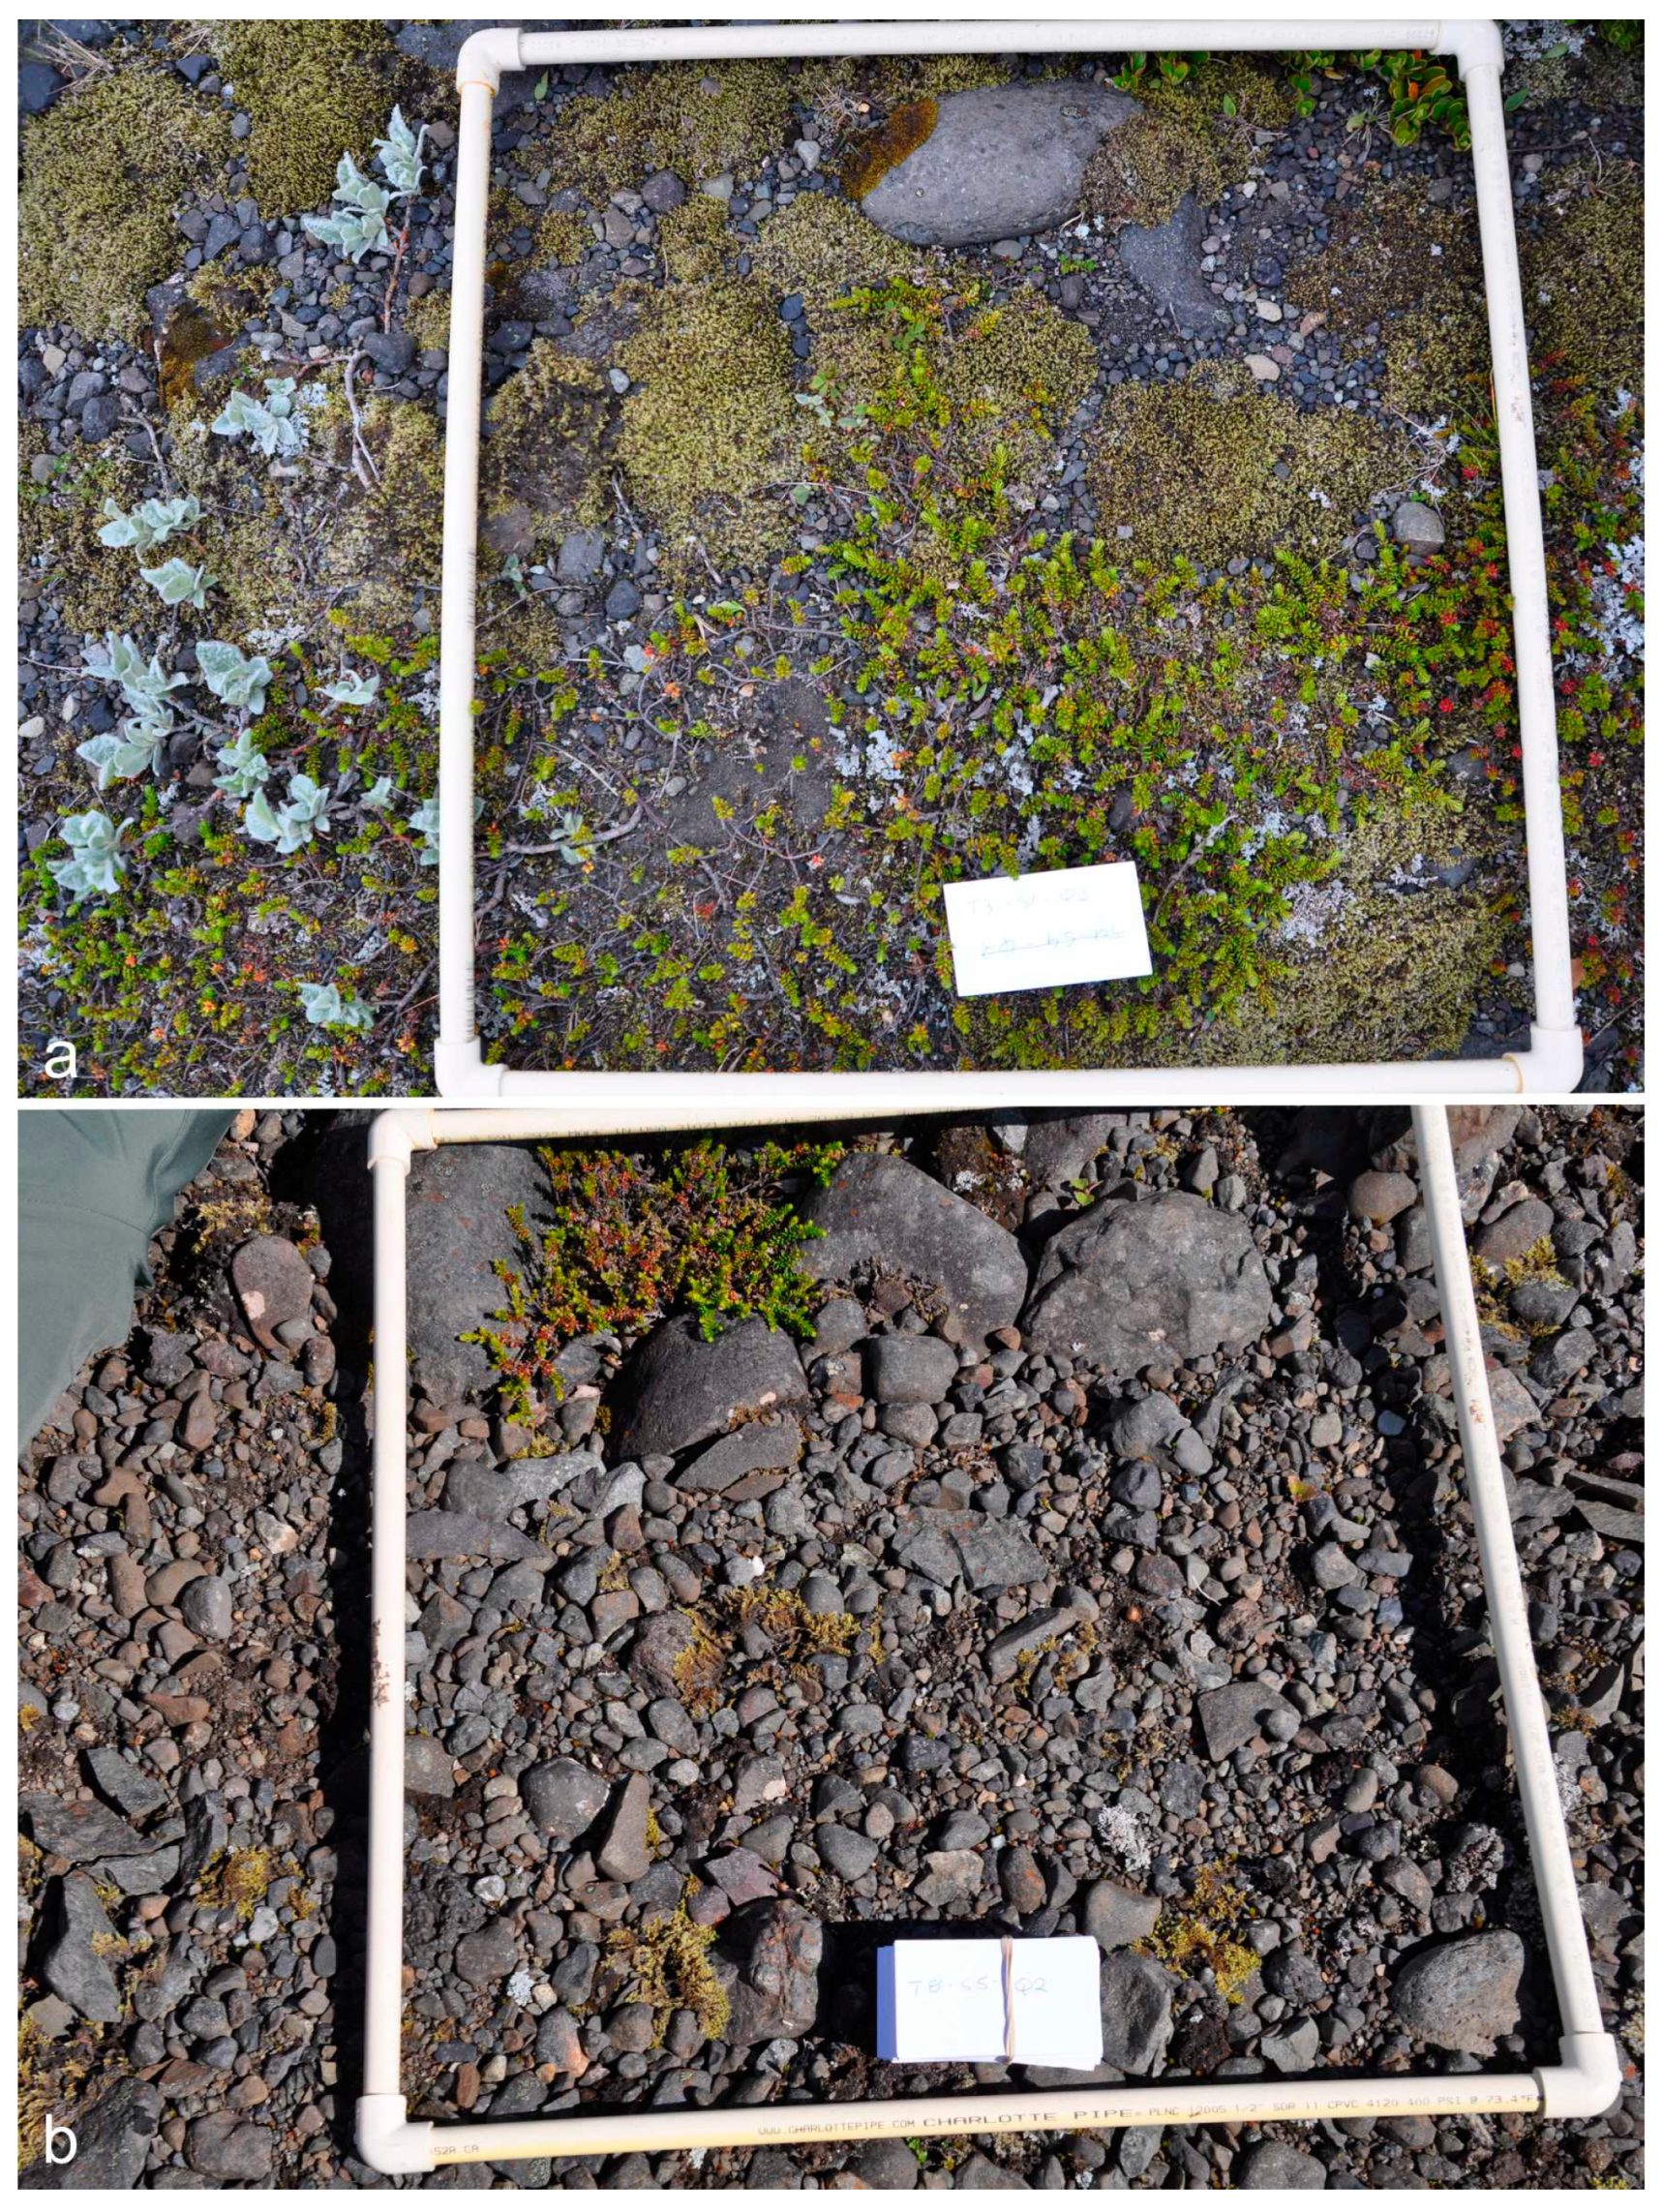
  • Transect 2: The transect line was established on the west-facing slope (away from the glacier) of the second prominent push moraine ridge away from the current lagoon (Figure 2b). The land surface at the transect stations has a general westward slope from 2° to 10° (mean = 5.6°). This surface was estimated to have been ice free since 1982. Vegetative cover dominated the surface on this transect, averaging 65.5% across all stations (SD = 17.9; Table 1). The vegetation was dominated by mosses (mean = 42.8%), which varied from 4.5% to 80.0% (SD = 33.9), and BSCs (mean = 14.5%), which also varied from a low of 1.0% to a maximum of 36.3% (SD = 17.7). Other vegetative components, specifically forbs, willows, low shrubs, and lichens were all present at levels between 1% and 10%. Graminoids were present but sparse (0.3%), and birches were absent.
  • Transect 3: This transect line was located near the crest of an older push moraine located between the glacial lagoon and several prominent kettles. The location is estimated to have been ice free since circa 1954. The surface is horizontal and slopes north at a maximum angle of 15° toward the ridge which borders the foreland to the northwest. The total vegetative cover was slightly higher (mean = 51.8%) than the exposed rock and soil surface but highly variable (SD = 31.7%; Table 1). Mosses accounted for most of the vegetation, ranging from absent (at station 4) to 62.5% (mean = 29%; SD = 23.3). Low shrubs were the next most abundant group at 11.2% cover. BSCs, lichens, and willows, in decreasing order, all occurred in abundances averaging between 1% and 10%. Forbs and graminoids were present in low abundances of 0.6% and 0.1%, respectively. The non-vegetated surface comprised gravel-to-boulder-sized rocks (37.3%) and bare soil (12.2%).
  • Transect 4: Transect 4 was located proximal to a prominent kettle pond on the slope facing away from the glacier of the most distal push moraine (Figure 2c). The date of exposure of this surface is estimated to be 1945. The surface at the measurement stations slopes mainly to the west at angles from 6° to 12° (mean = 9.2°). All stations in this transect were well vegetated, ranging from 70.5% to 99% (mean = 91.8%; SD = 12.2; Table 1). Mosses dominated the vegetation, ranging from 20% to 75% (mean = 47%; SD = 21.6), followed by low shrubs (mean = 22.2%; SD = 6.4%) and lichens (mean = 11.9%; SD = 4.9). Willows, BSCs, and forbs, in decreasing order, were common components of the vegetative cover (6.9%, 6.5%, and 3.3%, respectively). Birch and graminoids were minor components at less than 1% cover each.
  • Transect 5: This transect was situated near the crest of a broad overridden moraine distal to the younger push moraines and intervening kettles (Figure 2d). The date of glacial retreat from this location is estimated to be 1938. The surface where the measurement stations were situated ranges from flat to sloping southeast away from the glacier at a maximum angle of 6° (mean = 3.8°). Vegetative cover was inconsistent between stations, ranging from 7.8% to 100% (mean = 51.2%; SD = 39.4; Table 1). The cover was dominated by mosses, which varied from 3% to 77% cover (mean = 34.4%; SD = 31.6). Of the remaining vegetation groups, birch was most abundant (mean = 7.2%; SD = 11.9%), followed by low shrubs (mean = 3.8%; SD = 2.2), lichens (mean = 3.1%; SD = 2.1), BSCs (mean = 2.9%; SD = 3.1), and forbs (mean = 1.5%; SD = 2.6). Graminoids and willows were minor components (each less than 1%). The nonvegetated surface was predominantly rock (mean = 53%), consisting of gravel and boulders.
  • Transect 6: Transect 6 was located on the fluvial terrace of a glacial outwash channel between the broad overridden moraine (of Transect 5) and an older arcuate moraine dated to 1904 (Figure 2e). Historical imagery suggests that the area between the moraines was occupied by a glacial outwash stream in 1962 [26] and potentially more recently. At individual station locations, the surface is generally horizontal but slopes to the west a maximum of 12° at the distal margin of the terrace. The surface of the terrace was well vegetated (mean = 96.7%; SD = 5.4; Table 1) and dominated by hummocky mosses (mean = 75.1%; SD = 16.8), followed by low shrubs (mean = 18.5%; SD = 11.6). Birch was a major component (mean = 9%) but concentrated in troughs incised in the terrace and sparse to absent on the terrace flat (SD = 8.1). Lichens were common (mean = 7.5%; SD = 3.3), but willows were sparse (mean = 1.2%). BSCs, forbs, and graminoids were minor components (each less than 1%).
  • Transect 7: This transect was located on fluvial outwash proximal and to the west of the oldest of the Skaftafellsjökull arcuate moraines, which dates to the most distal position of the glacier in 1890. Although the age of the moraine is well established, there are no means for dating various locations on the outwash plain in the distal foreland directly. Presumably, the age of exposure equates to the date of deposition of the outwash, which in theory could predate or postdate the formation of the terminal moraine. The surface consists of alternating broad (10–18 m wide), flat-topped bars and shallow swales (5–12 m wide), both featuring scattered protruding boulders. The surface at the stations in this transect was consistently heavily vegetated (mean = 92.3%; SD = 8.5; Table 1). Mosses dominated the vegetative cover (mean = 75.5%; SD = 21.3), with a major contribution from low shrubs (mean = 16.5%; SD = 15.3). Lichens were common although not abundant (mean = 6.8), and birch had a low abundance (mean = 1.8%). All other vegetation groups were sparse (less than 1%).
  • Transect 8: This transect, located approximately 125 m to the north-northwest of Transect 7, was also situated on the outwash plain of the Skaftafellsjökull and shared a similar subdued bar and swale topography. As with Transect 7, the age of exposure of the land surface is ambiguous. The surface here was mostly vegetated, although the total vegetative cover was variable, ranging from 23.8% to 99.8% (mean = 81.8%; SD = 32.2; Table 1). Mosses again dominated the vegetation, ranging from 9.8% to 99.3% coverage (mean = 74.7%; SD = 36.7). Low shrubs were a major vegetation component (mean = 11%; SD = 9.2). Birch was common (mean = 5.9%) but primarily limited to the swales on the landscape. Lichens were common (mean = 4.2%) but not abundant. No other vegetation groups occurred at levels of 1% or above. Exposure of bare rock was variable, ranging from 0% to 75% (mean = 17.8%; SD = 32.1).
  • Transect 9: This was the most distal transect of the earlier study, located on the outwash plain approximately 120 m west-northwest from Transect 8. The age of exposure of the surface is also unknown, although hypothetically, it may be older than that in the transects located closer to the oldest moraine. As for transects 7 and 8, the surface here is a series of broad, flat-topped bars and shallow swales. The surfaces at all stations in this transect were nearly fully vegetated (mean = 99.5%; SD = 0.7). The vegetative cover was predominantly moss (mean = 89.2%; SD = 15.9%; Table 1), with smaller components of low shrubs (mean = 8.1%; SD = 13.9) and lichens (mean = 6.6%; SD = 11.7). All other vegetative groups occurred at levels below 1%.
  • Transect 10: This transect was the only study location which was not included in the measurements made in 2007 [12]. The transect was located on the distal side of the oldest arcuate moraine of the Skaftafellsjökull, dated to the maximum Little Ice Age glacial extent in 1890 (Figure 2f). The surface at individual stations is irregular with protruding boulders, but in general, the surface slopes from south to west at angles ranging from 10° to 18° (mean = 13°). Vegetation covered most of the surface at all stations in the transect, ranging from 54% to 95.8% (mean = 84.7%; SD = 10.9; Table 1). Mosses were common but did not dominate the surface, ranging from 11.3% to 73.8% (mean = 39.3%; SD = 22.9). Low shrubs were nearly as abundant (mean = 30.4%; SD = 15.2). Lichens were also common (mean = 12.3%; SD = 5.2). Birch and forbs were minor vegetative components (means = 3.1% and 1.5%, respectively). Other vegetative groups were insignificant.

3.2. Inter-Transect Differences

The 10 transects in this study were numbered sequentially by distance from the ice front (Figure 1), but the comparisons here (Figure 3) emphasize the differences among the moraines (transects 1–5 and 10) and between the outwash locations (transects 6–9). The differences in vegetation distribution between the pair of transects 1 and 2 were the most distinctive of any chronologically consecutive pair in the study. From the 2002 moraine (Transect 1) to the 1982 moraine sites (Transect 2), the total vegetation increased from 24.5% to 65.5% (Figure 3). Most of this change was accounted for by the increase in moss (from 13.3% to 42.8%), with contributions from low shrubs, lichens, BSCs, forbs, and willows. Graminoids were the only group which exhibited a decrease. The BCI for this pair of transects was 0.48, the highest BCI value obtained in this study (Table 2).
Between transects 2 and 3, with presumed exposure dates of 1982 and 1954, respectively, vegetative cover decreased (from 65.5% to 51.8%), driven mainly by a decline in moss cover (from 42.8% to 29%), accompanied by decreases in forbs, willows, lichens, and BSCs (Figure 3). Graminoids alone showed a slight increase. The BCI value for the comparison of transects 2 and 3 (0.24) was half of that calculated for transects 1 and 2 (Table 2). From Transect 3, dated 1954, to Transect 4, dated 1945, the trend observed between transects 2 and 3 was reversed as most vegetation groups increased in coverage. The total vegetation coverage was almost complete at 91.8% due primarily to a substantial increase in moss (from 29% to 47%), as well low shrubs, lichens, willows, and forbs. Smaller increases were seen for graminoids and birch, while BSCs exhibited a small decrease. For Transect 3 versus Transect 4, the BCI value was 0.31 (Table 2).
The difference between transects 4 and 5 was marked by a decrease in total vegetation (91.8% to 51.2%), most of which was the result of substantial decreases in mosses, low shrubs, and lichens. Forbs and BSCs also decreased, while birches increased substantially. The BCI when comparing transects 4 and 5 was 0.38 (Table 2). Because Transect 6 was an outwash terrace, we compared Transect 5 to Transect 10, the oldest moraine of the Skaftafellsjökull foreland, with an exposure date estimated to be 1890 (48 years older than the location of Transect 5). The BCI of 0.38 (Table 2) for this transect pair reflects a substantial increase in total vegetation (from 51.2% to 84.7%) driven primarily by major increases in low shrubs and lichens and a smaller increase in mosses, while birches and willows both decreased slightly.
Transect 6 was measured on the terrace of an outwash stream between two moraines, and thus the comparison of Transect 5 and Transect 6 examined the differing responses of landscape elements with dissimilar aspects and substrates to successional processes rather than temporal changes. The BCI of 0.39 (Table 2) for this transect pair reflects substantial differences in total vegetation (51.2% vs. 96.7%), mosses (34.4% vs. 75.1%), and low shrubs (3.8% vs. 18.5%). Transects 7, 8, and 9 were located on the outwash plain distal to the oldest moraine. Hypothetically, deposition of the outwash could predate the retreat of the ice front from its 1890 maximum, but in practical terms, it is unknown when specific areas of the outwash plain were last active. The vegetation coverage and distribution of functional groups for these transects were similar to those of the outwash terrace at Transect 6. Consequently, the BCIs for transects 6 versus 7 (0.15), 7 versus 8 (0.06), and 8 versus 9 (0.13) were low (Table 2). However, the comparison of Transect 9 to Transect 10 was again a comparison of the vegetation development on the contrasting landscape elements of outwash and a moraine. The BCI of 0.47 (Table 2) reflects the preponderance of low shrubs and lichens and lesser abundance of moss on the moraine compared with the outwash.

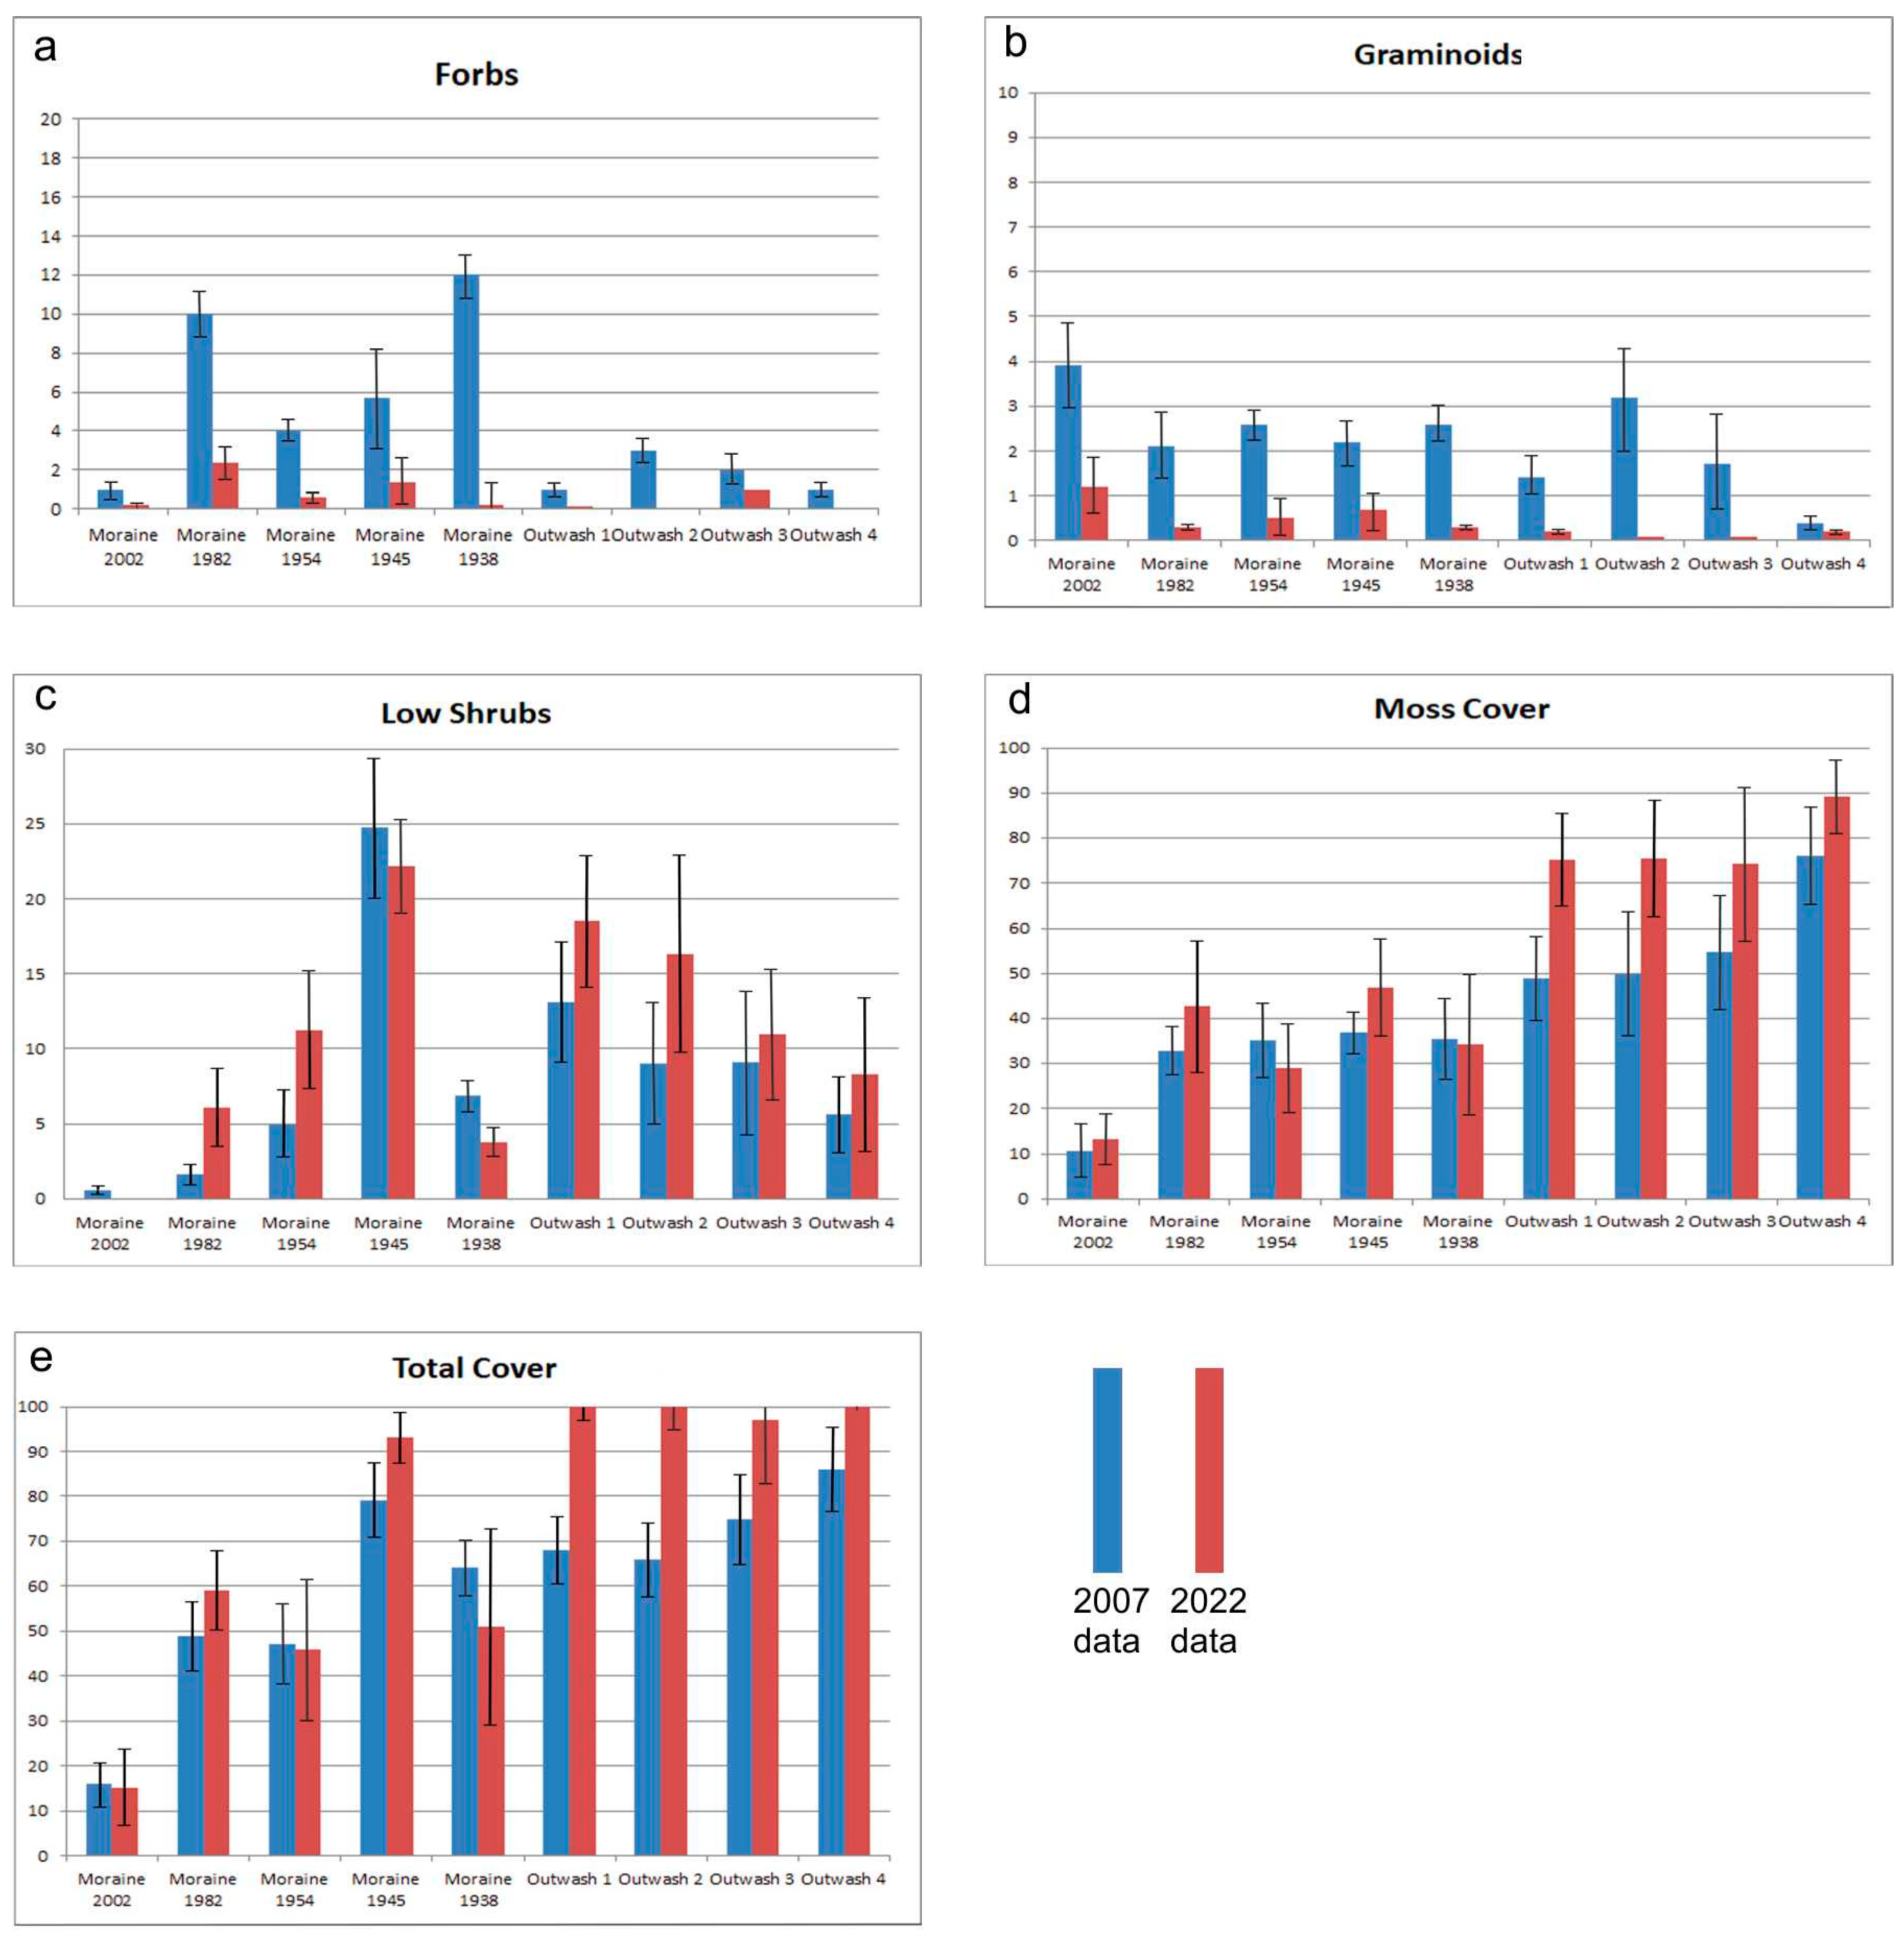
3.3. Changes from 2007 to 2022

To assess the role of aging on the successional landscape, we compared the functional group data collected in this study to that collected in 2007 [12], with species in the earlier study grouped into the same functional groups employed in the 2022 data collection (Table 3). The BCI was calculated for each transect pair (i.e., Transect 1 (2007) versus Transect 1 (2022)) for transects 1–9 (Transect 10 was not evaluated in the 2007 study). However, as the BCI by itself does not measure the significance of the calculated differences, the transect pairs were also evaluated by paired t-tests using the means of each of the functional groups in each transect (Table 4). We present the difference observed between the two sets of data below.
The significance of the temporal differences of individual functional groups across the entire foreland (including moraines and outwash) was tested by comparing the means of each of the vegetation groups for all nine transects combined from the 2007 dataset with the corresponding values from 2022 by a paired t-test (Table 5). The results demonstrate that the total vegetation cover, forbs, and mosses differed significantly (p = 0.015, 0.016, and 0.018, respectively), with willows and shrubs falling outside of the range of significance (p = 0.091 and 0.096, respectively). Lastly, to determine on which transects the most significant changes in each individual group occurred, we compared the changes from 2007 to 2022 for the individual stations comprising each of the transects (Table 6).

3.3.1. Moraines

Although no statistically significant changes were observed if all vegetation groups were considered simultaneously (i.e., paired t-test p > 0.05 for all moraines (Table 4)), specific functional groups did exhibit significant changes from 2007 to 2022. Across all five transects on the moraines (transects 1–5), the most consistent change was the decrease in forbs and graminoids (Figure 4a,b), with increases in willows and birches on some transects. Notably, graminoids displayed the most significant difference over time across the entire landscape (p = 0.001; Table 5), specifically at transects 1, 3, and 5, and nearly at the level of significance (p ≤ 0.05) at Transect 2 (Table 6). The forbs changed significantly at most locations (transects 1–7). No other individual functional groups (or total vegetation cover) changed at a level of statistical significance on any transect (Table 6).
On Transect 1, the BCI of 0.37 reflects significant decreases in both graminoids and forbs (Figure 4a,b and Table 6) offset by non-significant increases in mosses (Figure 4d) and willows from 2007 to 2022 (Table 1 and Table 3). Changes in vegetation from 2007 to 2022 were relatively minor at both transects 2 and 3, as indicated by BCIs of 0.24 and 0.22, respectively (Table 4). Forbs and graminoids decreased over the interval at both transects, while low shrubs increased. Mosses increased at Transect 2 but decreased slightly at Transect 3. These changes were not statistically significant for either transect (p = 0.6 and 0.7, respectively). The changes at Transect 4 were marked by small decreases from 2007 to 2022 for willows, graminoids, and forbs, with minor increases in birches and mosses. The BCI of 0.30 reflects the minor nature of the changes, as does the lack of statistical significance (p = 0.9). Transect 5 displayed small decreases in willows, graminoids, and shrubs and a larger decrease in forbs synchronous with a small increase in birches. The relatively minor degree of change is reflected by the BCI of 0.36 and low statistical significance (p = 0.34).

3.3.2. Outwash

The four transects measured on the outwash deposits (transects 6–9) displayed similar trends in functional group changes across the 2007–2022 interval (Figure 4). Small decreases in both forbs and graminoids were common to all four transects (Figure 4a,b), with the change in forbs reaching statistical significance (p < 0.05) and graminoids nearly reaching this level at transects 6 and 7. Low shrubs and mosses increased across all four transects (Figure 4c,d), while birches increased on transects 6 and 7 only. Transect 6 displayed the largest dissimilarity with a BCI of 0.43 and exhibited the only statistically significant difference across the combined groups (p = 0.045). Transects 7, 8, and 9 had much lower BCIs of 0.25, 0.16, and 0.11, respectively, with lower levels of significance (p = 0.22, 0.19, and 0.43, respectively).

4. Discussion

4.1. General Trends

The earlier succession study [12] noted a general trend of forbs and graminoids declining as moss and low shrubs increased at the older sites of the foreland. The study also found that species richness increased through the middle successional stages and decreased in later successional stages. Species richness, which was primarily a function of the diversity of forbs, decreased on the older transects and in the outwash deposits, a trend the authors attributed to competition for seeding sites between the vascular plants and bryophytes. A similar trend was observed for graminoids, which collectively are successful pioneer species but also declined in later stages due to competition with the low shrubs and mosses which occupied most available seeding sites. The results of the 2022 data collection display trends similar to those noted in 2007. Furthermore, the general decline in both forbs and graminoids from 2007 to 2022, as noted above, provides additional support to the earlier finding that species richness declined in later successional stages.

4.2. Role of Substrate

The earlier study [12] also noted the differences in vegetative cover between moraines and the outwash plain, most specifically the dominance of mosses over the latter, but it attributed this difference mainly to the (presumed) greater age of the outwash deposits. The authors noted that competition for seeding sites has been cited for the more mature portions of glacial forelands [9,21,35,36] and suggested that this process favors bryophytes over vascular plants. We note here the fundamental difference in the nature of the substrates of these sites and propose that they impose the primary control on successional patterns. The moraines consisted of glacial diamict, comprising the entire range of grain sizes from boulder- to sub-silt-sized particles (Figure 5a). The outwash deposits, in contrast, comprised a narrower range of particle sizes, primarily from granule to cobble sizes (Figure 5b). We suggest that the outwash deposits and moraines follow fundamentally different successional trajectories due to the contrasting substrates. The outwash surfaces are more effectively armored by coarse particles that resist penetration by the root systems of vascular plants, thereby inhibiting their colonization. However, bryophytes (i.e., mosses) spread easily across the gravelly surfaces of the outwash deposits and thus are able to dominate the vegetative cover by effectively monopolizing available seeding sites. Birches, a typical component of the mature foreland successional community, are largely limited to the narrow channels incised into the outwash plains. Consequently, succession on the outwash produces a low-diversity moss-heath community.
Conversely, the wider range of grain sizes on the moraines provides more seeding sites for vascular plants (i.e., the fine-grained material between the boulders is more conducive to root penetration by vascular plant species). Succession on this substrate ultimately results in the development of a birch-heath-shrub community. Nevertheless, during later successional stages, the increased spread of mosses and the heath-shrub community occurs at the expense of early and mid-successional stage graminoids and forbs, as concluded earlier [12]. Because most of the vascular plant species in the foreland are darker in color than the mosses, the differences between these two contrasting communities are clearly visible from satellite imagery and as measurable differences in albedo [35].

4.3. Significance of Aspect

The largest BCI calculated in this study was between transects 1 and 2 (BCI = 0.48). This value likely reflects in part the difference in age between the two transects (20 years), but more importantly, it reflects the differences in aspect, as noted earlier [12]. Transect 1 was both closer to the ice and also located on an ice-facing slope (proximal aspect), and thus it was fully exposed to katabatic winds from the glacier. Transect 2, in contrast, was located on a westward-facing slope (distal aspect) on the lee side of a push moraine and thus was sheltered well from the winds, accounting for the increase in vegetative cover. The importance of aspect in colonization has long been recognized as a control on both vegetation density and species richness [36,37,38], and it is particularly notable in glacial foreland settings [39,40,41,42,43,44,45], where it may cause local deviations from the successional trajectory. In this study, the overall decrease in vegetation from Transect 2 to Transect 3 would seem counterintuitive if only the ages of the surfaces at these transects were considered. However, the difference in aspect again accounts for the difference; the location of Transect 3 is from largely horizontal (neutral aspect) to northeast-sloping (proximal aspect) near the top of a ridge, lacking the shelter afforded by the favorable distal aspect at Transect 2. Hence, at the local scale, aspect is more important than time in controlling the growth of successional vegetation.
The importance of aspect is also apparent in the comparison of transects 3 and 4. The exposure age of Transect 4 was less than 10 years older than that of Transect 3, but the west-facing (distal) aspect of the surface at Transect 4 provided shelter from the glacier-derived winds from the northeast. The comparison of Transect 2 to Transect 4 is also instructive for this point, as both had similar aspect. The BCI for this comparison was 0.20, reflecting the greater similarities of moss and total vegetation at transects 2 and 4 than between either and Transect 3. The decrease in vegetation from Transect 4 to Transect 5 also reflects the lack of shelter at the older location, where aspect ranges from neutral to slightly distal. From Transect 5 to Transect 10, vegetative cover nearly doubled. Here, the comparison was between one location with distal aspect (Transect 10) and one with neutral to slightly distal aspect (Transect 5). In this instance, the difference in age between these two transects (almost 50 years) is likely to be the most significant factor in the difference in vegetation development at these locations. Unlike the moraines, aspect varies rather little between the transects on outwash deposits because these form low relief terraces and bars with mostly neutral aspect. Consequently, the patterns of vegetation group distribution are more consistent between locations.

5. Conclusions

Reexamination in 2022 of the transect stations on the Skaftafellsjökull foreland initially measured in 2007 [12] has supported some of the findings of the earlier study and clarified others. The new data support the original interpretation of species richness and density declining in later successional stages, primarily due to the decrease in forbs and graminoids concomitant with the spread of low shrubs and mosses. The overall successional trend on the moraines is subject to the effects of aspect, which limits vegetation development in proximal areas (toward the ice) and promotes successional growth in distal areas (away from the ice). The impact of aspect is stronger with proximity to the glacier and decreases with increasing distance. Finally, these results highlight the importance of substrate variations across the foreland landscape and their role in successional trajectories. The glacial moraines, which consist of diamict, provide seeding sites for vascular plants which allow development of a birch-shrub-heath community in later successional stages. Outwash deposits, including channel terraces and the distal outwash plain, have a coarse, gravelly substrate which provides few seeding sites for vascular plants but permits the spread of mosses. Succession on the outwash deposits results in the development of a moss-heath community.

Author Contributions

Conceptualization and design, L.T.; data collection, G.K. and K.W.; data analysis, L.T., G.K. and K.W.; manuscript preparation, L.T.; review and editing, G.K. and K.W. All authors have read and agreed to the published version of the manuscript.

Funding

The first author acknowledges the financial assistance provided by the Joseph C. Georg Endowed Professorship of Le Moyne College to all authors for field expenses.

Data Availability Statement

The original contributions presented in the study are included in the article, further inquiries can be directed to the corresponding author.

Conflicts of Interest

The authors declare no conflicts of interest.

References

  1. Merzeion, B.; Cogley, J.G.; Richter, K.; Parkes, D. Attribution of global glacier mass loss to anthropogenic and natural causes. Science 2014, 345, 919–921. [Google Scholar] [CrossRef] [PubMed]
  2. Smiraglia, C.; Diolaiuti, G.A. (Eds.) The New Italian Glacier Inventory; Ev-K2-CNR Publ.: Bergamo, Italy, 2015. [Google Scholar]
  3. Hock, R.; Bliss, B.; Marzeion, B.; Giesen, R.H.; Hirabayashi, Y.; Huss, M.; Radic, V.; Slangen, A.B.A. GlacierMIP—A model intercomparison of global-scale glacier mass-balance models and projections. J. Glaciol. 2019, 65, 453–467. [Google Scholar] [CrossRef]
  4. Zemp, M.; Huss, M.; Thibert, E.; Eckert, N.; McNabb, R.; Huber, J.; Barandun, M.; Machguth, H.; Nussbaumer, S.U.; Gärtner-Roer, I.; et al. Global glacier mass changes and their contributions to sea-level rise from 1961 to 2016. Nature 2019, 568, 382–386. [Google Scholar] [CrossRef] [PubMed]
  5. Sommer, C.; Malz, P.; Seehaus, T.C.; Lippl, S.; Zemp, M.; Braun, M.H. Rapid glacier retreat and downwasting throughout the European Apls in the early 21st century. Nat. Commun. 2020, 11, 3209. [Google Scholar] [CrossRef] [PubMed]
  6. Ficetola, G.F.; Marta, S.; Gurrieri, A.; Gobbi, M.; Ambrosini, R.; Fontaneto, D.; Zerboni, A.; Poulenard, J.; Caccianiga, M.; Thuiller, W. Dynamics of ecological communities following current retreat of glaciers. Annu. Rev. Ecol. Evol. Syst. 2021, 52, 405–426. [Google Scholar] [CrossRef]
  7. Matthews, J.A. The Ecology of Recently Deglaciated Terrain: A Geoecological Approach to Glacier Forelands and Primary Succession; Cambridge University Press: New York, NY, USA, 1992. [Google Scholar]
  8. Fickert, T.; Grüninger, F.; Damm, B. Klebelsberg revisited: Did primary succession of plants in glacier forelands a century ago differ from today? Alp. Bot. 2017, 127, 17–29. [Google Scholar] [CrossRef]
  9. Fickert, T. Common patterns and diverging trajectories in primary succession of plants in eastern alpine glacier forelands. Diversity 2020, 12, 191. [Google Scholar] [CrossRef]
  10. Bosson, J.B.; Huss, M.; Cauvy-Fraunié, S.; Clément, J.C.; Costes, G.; Fischer, M.; Poulenard, J.; Arthaud, F. Future emergence of new ecosystems caused by glacial retreat. Nature 2023, 620, 562–569. [Google Scholar] [CrossRef] [PubMed]
  11. Vreeken, W.J. Principle kinds of chronosequences and their significance in soil history. J. Soil Sci. 1975, 26, 378–394. [Google Scholar] [CrossRef]
  12. Glausen, T.G.; Tanner, L.H. Successional trends and processes on a glacial foreland in Southern Iceland studied by repeated species counts. Ecolog. Proc. 2019, 8, 11. [Google Scholar] [CrossRef]
  13. Liestøl, O. The glaciers in the Kongsfjorden area, Spitsbergen. Nor. Geogr. Tidsskr. 1988, 42, 231–238. [Google Scholar] [CrossRef]
  14. Dowdeswell, J.A. Glaciers in the high Arctic and recent environmental change. Phil. Trans. Royal Soc. London Ser. A 1995, 352, 321–334. [Google Scholar]
  15. Liengen, T.; Olsen, R.A. Seasonal and site-specific variations in nitrogen fixation in a high arctic area, Ny-Ålesund, Spitsbergen. Can. J. Microbiol. 1997, 43, 759–769. [Google Scholar] [CrossRef]
  16. Lefauconnier, B.; Hagen, J.O.; Orbaeck, J.B.; Melvold, K.; Isaksson, E. Glacier balance trends in the Kongsfjorden area, western Spitsbergen, Svalbard, in relation to the climate. Polar Res. 1999, 18, 307–313. [Google Scholar] [CrossRef]
  17. Liengen, T. Environmental factors influencing the nitrogen fixation activity of free-living cyanobacteria from a high arctic area, Spitsbergen. Can. J. Microbiol. 1999, 45, 573–581. [Google Scholar] [CrossRef]
  18. Hodkinson, I.D.; Coulson, S.J.; Webb, N.R. Community assembly along proglacial chronosequences in the high Arctic: Vegetation and soil development in north-West Svalbard. J. Ecol. 2003, 91, 651–663. [Google Scholar] [CrossRef]
  19. Szymanski, W.; Maciejowski, W.; Ostafin, K.; Ziaja, W.; Sobucki, M. Impact of parent material, vegetation cover, and site wetness on variability of soil properties in proglacial areas of small glaciers along the northeastern coast of Sørkappland (SE Spitsbergen). Catena 2019, 183, 104209. [Google Scholar] [CrossRef]
  20. Wietrzyk-Pełka, P.; Rola, K.; Szymański, W.; Węgrzyn, M.H. Organic carbon accumulation in the glacier forelands with regard to variability of environmental conditions in different ecogenesis stages of High Arctic ecosystems. Sci. Total Environ. 2020, 717, 135151. [Google Scholar] [CrossRef]
  21. Jones, G.A.; Henry, G.H.R. Primary plant succession on recently deglaciated terrain in the Canadian high Arctic. J. Biogeogr. 2003, 30, 277–296. [Google Scholar] [CrossRef]
  22. Sigurðsson, O. Glacier variations in Iceland 1930–1960, 1960–1990 og 2003–2004. Jökull 2005, 55, 163–170. [Google Scholar] [CrossRef]
  23. Vilmundardóttir, O.K.; Gísladóttir, G.; Lal, R. Soil carbon accretion along an age chronosequence formed by the retreat of the Skaftafellsjökull glacier, SE-Iceland. Geomorphology 2015, 228, 124–133. [Google Scholar] [CrossRef]
  24. Evans, D.J.A.; Ewertowski, M.; Orton, C. Skaftafellsjöokull, Iceland: Glacial geomorphology recording glacier recession since the Little Ice Age. J. Maps 2017, 13, 358–368. [Google Scholar] [CrossRef]
  25. Chandler, B.M.P.; Evans, D.J.A.; Roberts, D.H. Recent retreat at a temperate Icelandic glacier in the context of the last ~80 years of climate change in the North Atlantic region. Arktos 2016, 2, 24. [Google Scholar] [CrossRef]
  26. Perrson, Å. The vegetation at the margin of the receding glacier Skaftafellsjökull, south eastern Iceland. Bot. Not. 1964, 117, 323–354. [Google Scholar]
  27. Hannesdóttir, H.; Björnsson, H.; Pálsson, F.; Aðalgeirsdóttir, G.; Guðmundsson, S. Area, volume and mass changes of southeast Vatnajökull ice cap, Iceland, from the Little Ice Age maximum in the late 19th century to 2010. Cryosph. Discuss. 2014, 8, 4681–4735. [Google Scholar]
  28. Huggett, R.J. Soil chronosequences, soil development, and soil evolution: A critical review. Catena 1998, 32, 155–172. [Google Scholar] [CrossRef]
  29. Vilmundardóttir, O.; Gísladóttir, G.; Lal, R. Early stage development of selected soil properties along the proglacial moraines of Skaftafellsjökull glacier, SE-Iceland. Catena 2014, 121, 142–150. [Google Scholar] [CrossRef]
  30. Lindröth, C.H. Skaftafell, Iceland: A living glacial refugium. Oikos Suppl. 1965, 6, 1–142. [Google Scholar]
  31. Hoinkes, H. Beitrígezurkennte des gletscherwindes. Arch. Fur Meteorol. Geophys. Und Bioklimatol. Ser. B 1954, 6, 36–53. [Google Scholar] [CrossRef]
  32. Geiger, R. The Climate Near the Ground; Harvard University Press: Cambridge, MA, USA, 1971. [Google Scholar]
  33. Tanner, L.H.; Walker, A.E.; Nivison, M.; Smith, D.L. Changes in soil composition and floral coverage on a glacial foreland chronosequence in southern Iceland. Open J. Soil Sci. 2013, 3, 191–198. [Google Scholar] [CrossRef]
  34. Synan, H.E.; Melfi, M.A.; Tanner, L.H. Spatial and temporal dynamics of growth of woody plant species (birch and willows) on the foreland of a retreating glacier in southern Iceland. Ecol. Proc. 2021, 10, 13. [Google Scholar] [CrossRef]
  35. Elven, R.; Ryvarden, L. Dispersal and primary establishment of vegetation. In Fennoscandian Tundra Ecosystems, Part 1: Plants and Microorganisms; Wielgolaski, F.E., Ed.; Springer: Berlin/Heidelberg, Germany, 1975; pp. 82–85. [Google Scholar]
  36. Tichit, P.; Brickle, P.; Newton, R.J.; Convey, P.; Dawson, W. Introduced species infiltrate recent stages of succession after glacial retreat on sub-Antarctic South Georgia. NeoBiota 2024, 92, 85–110. [Google Scholar] [CrossRef]
  37. Kjær, U.; Olsen, S.L.; Klanderud, K. Shift from facilitative to neutral interactions by the cushion plant Silene acaulis along a primary succession gradient. J. Veg. Sci. 2018, 29, 42–51. [Google Scholar] [CrossRef]
  38. Tanner, L.H.; Kikukawa, G.; Weits, K. Albedo on a glacial foreland at ground level and landscape scale driven by vegetation-substrate patterns. Eur. J. Environ. Sci. 2023, 13, 71. [Google Scholar] [CrossRef]
  39. Armesto, J.J.; Martínez, J.A. Relations between vegetation structure and slope aspect in the Mediterranean region of Chile. J. Ecol. 1978, 66, 881–889. [Google Scholar] [CrossRef]
  40. Walker, L.R.; Shiels, A.B.; Bellingham, P.J.; Sparrow, A.D.; Fetcher, N.; Landau, F.H.; Lodge, D.J. Changes in abiotic influences on seed plants and ferns during 18 years of primary succession on Puerto Rican landslides. J. Ecol. 2013, 101, 650–661. [Google Scholar] [CrossRef]
  41. Marler, T.E.; del Moral, R. Increasing topographic influence on vegetation structure during primary succession. Plant Ecol. 2018, 219, 1009–1020. [Google Scholar] [CrossRef]
  42. Aström, M.; Dynesius, M.; Hylander, K.; Nilsson, C. Slope aspect modifies community responses to clear-cutting in Boreal forests. Ecology 2007, 88, 749–758. [Google Scholar] [CrossRef]
  43. Matthews, J.A.; Whittaker, R.J. Vegetation succession on the Storbreen glacier foreland, Jotunheimen, Norway: A review. Arct. Alp. Res. 1987, 19, 385–395. [Google Scholar] [CrossRef]
  44. Foskett, J.I.J. The Nature and Significance of Microtopographic Effects on Vegetation Succession in Selected Glacier Forelands, Jotenheimen and Jostedalen, Norway. Ph.D. Thesis, University of Greenwich, London, UK, 1998. [Google Scholar]
  45. Garobotti, I.A.; Pissolito, C.I.; Villalba, R. Spatiotemporal pattern of primary succession in relation to meso-topographic gradients on recently deglaciated terrains in the Patagonian Andes. Arct. Antarc. Alp. Res. 2011, 43, 555–567. [Google Scholar] [CrossRef]
Figure 1. Satellite image of Skaftafellsjökull foreland (adapted from Google Earth© imagery dated April 2017). Historic moraine positions dated as described in the text. Positions of transects (T1–T10) are as shown.
Land 13 01055 g001
Figure 2. Transect locations on the Skaftafellsjökull foreland, where vegetation cover measurements were recorded within a 0.25 m2 quadrat. (a) Transect 1 on proximal side of 2002 moraine. (b) Transect 2 on distal side near crest of 1982 moraine. (c) Transect 4 on distal side of 1945 moraine. (d) Transect 5 on distal side near crest of 1938 moraine. (e) Transect 6 on alluvial outwash terrace between 1938 and 1904 moraines. (f) Transect 10 on distal side of 1890 moraine.
Land 13 01055 g002
Figure 3. Graphic representation of the abundance of functional vegetation groups and total vegetation across the foreland. Moraine 2002 = Transect 1, Moraine 1982 = Transect 2, Moraine 1954 = Transect 3, Moraine 1945 = Transect 4, Moraine 1938 = Transect 5, Moraine 1890 = Transect 10, Outwash 1 = Transect 6, Outwash 2 = Transect 7, Outwash 3 = Transect 8, and Outwash 4 = Transect 9.
Land 13 01055 g003
Figure 4. Comparison of functional vegetation groups and total vegetation between 2007 and 2022 for each transect. Transect 1 = Moraine 2002; Transect 2 = Moraine 1982; Transect 3 = Moraine 1954; Transect 4 = Moraine 1945; Transect 5 = Moraine 1938; Transect 6 = Outwash 1; Transect 7 = Outwash 2, Transect 8 = Outwash 3; and Transect 9 = Outwash 4. Blue = 2007 data, while red = 2022 data. Bars are shown for standard error.
Land 13 01055 g004
Figure 5. Examples of differences in substrate in the foreland. (a) Transect 3 on moraine (1954) exposes patches of fine-grained material between pebble- to cobble-sized clasts. (b) Exposed patch of outwash at Transect 7 consisting almost entirely of pebble-sized and larger clasts.
Land 13 01055 g005
Table 1. Complete results for 2022 measurements. Transect locations are as shown in Figure 1. Mean and standard deviation were calculated for all stations in each transect. Aspect for each transect shown as − for proximal (slope toward ice), + for distal (away from ice), or 0 for neutral. BSC = biological soil crust; SD = standard deviation.
Transect 1 (−)Station 1Station 2Station 3Station 4Station 5MeanSD
Forbs0.60.10.10.10.10.20.2
Willows1.30.00.00.10.00.30.6
Moss36.37.82.116.34.013.314.0
Lichen0.00.00.10.10.10.10.1
Low shrub0.00.00.00.00.00.00.0
BSC23.83.813.815.01.811.69.0
Graminoids4.00.10.11.00.61.21.6
Birch0.00.00.00.00.00.00.0
Soil0.30.015.51.50.33.56.7
Rock cover41.390.368.867.592.572.120.8
Veg. cover58.59.816.330.37.824.520.9
Transect 2 (+)Station 1Station 2Station 3Station 4Station 5MeanSD
Forbs2.80.81.86.00.82.42.2
Willows0.81.84.03.81.32.31.5
Moss4.516.837.580.075.042.833.9
Lichen0.12.313.04.83.04.65.3
Low shrub0.13.012.01.014.36.16.6
BSC31.336.32.51.31.014.517.7
Graminoids0.80.10.30.10.10.30.3
Birch0.00.00.00.00.00.00.0
Soil0.00.00.00.00.00.00.0
Rock cover60.040.027.511.812.030.320.4
Veg. cover40.558.575.065.388.065.517.9
Transect 3 (−)Station 1Station 2Station 3Station 4Station 5MeanSD
Forbs0.61.01.10.00.10.60.5
Willows1.30.13.00.02.51.41.4
Moss27.517.537.50.062.529.023.3
Lichen4.30.54.00.15.82.92.5
Low shrub20.013.84.50.017.511.28.6
BSC2.322.56.50.06.87.68.8
Graminoids0.12.00.10.10.10.50.8
Birch0.00.00.00.00.00.00.0
Soil7.83.81.347.50.512.220.0
Rock cover38.840.042.552.512.537.314.9
Veg. cover55.059.557.30.387.051.831.7
Transect 4 (+)Station 1Station 2Station 3Station 4Station 5MeanSD
Forbs2.30.11.86.06.33.32.7
Willows5.013.00.19.37.06.94.8
Moss48.858.820.032.575.047.021.6
Lichen16.315.08.05.315.011.94.9
Low shrub29.316.328.816.820.022.26.4
BSC0.00.05.523.83.36.59.9
Graminoids0.10.60.62.00.10.70.8
Birch0.00.00.02.80.00.61.2
Soil1.00.120.01.30.04.58.7
Rock cover1.30.19.56.31.03.64.1
Veg. cover97.599.570.592.599.091.812.2
Transect 5 (+)Station 1Station 2Station 3Station 4Station 5MeanSD
Forbs6.00.10.11.00.11.52.6
Willows0.80.10.00.00.80.30.4
Moss57.523.077.03.011.334.431.6
Lichen5.33.04.51.11.83.12.1
Low shrub6.83.83.30.84.33.82.2
BSC2.82.80.10.88.02.93.1
Graminoids0.50.10.10.60.30.30.2
Birch3.31.328.30.13.07.211.9
Soil11.30.00.06.50.03.65.2
Rock cover9.572.517.390.875.053.036.9
Veg. cover84.837.0100.07.826.351.239.4
Transect 6 (0)Station 1Station 2Station 3Station 4Station 5MeanSD
Forbs0.10.30.30.30.10.20.1
Willows2.50.00.13.30.11.21.6
Moss73.382.548.377.593.875.116.8
Lichen10.88.86.09.32.57.53.3
Low shrub16.522.535.015.03.318.511.6
BSC0.00.00.10.02.30.51.0
Graminoids0.10.10.60.30.10.20.2
Birch0.63.80.014.317.57.28.1
Soil0.30.112.80.00.82.85.6
Rock cover0.00.00.30.31.80.50.7
Veg. cover99.399.887.399.897.396.75.4
Transect 7 (0)Station 1Station 2Station 3Station 4Station 5MeanSD
Forbs0.10.10.10.00.10.10.0
Willows0.00.00.12.50.00.51.1
Moss79.893.087.038.878.875.521.3
Lichen1.03.32.321.36.06.88.2
Low shrub0.38.815.841.316.316.515.3
BSC0.00.00.00.00.30.10.1
Graminoids0.10.10.00.00.10.10.1
Birch0.00.04.01.33.51.81.9
Soil0.00.00.30.30.30.20.1
Rock cover20.34.02.00.013.88.08.6
Veg. cover79.097.397.899.887.592.38.5
Transect 8 (0)Station 1Station 2Station 3Station 4Station 5MeanSD
Forbs0.10.00.10.10.00.10.1
Willows3.30.10.00.30.00.71.4
Moss99.393.084.087.39.874.736.7
Lichen2.80.14.82.810.54.24.7
Low shrub0.018.321.012.53.311.09.2
BSC0.00.00.00.00.00.00.0
Graminoids0.10.10.10.10.00.10.0
Birch0.012.513.03.80.15.96.5
Soil0.30.00.30.00.00.10.1
Rock cover0.04.07.03.075.017.832.1
Veg. cover99.895.592.897.023.881.832.2
Transect 9 (0)Station 1Station 2Station 3Station 4Station 5MeanSD
Forbs0.10.00.10.00.00.00.1
Willows0.00.00.00.00.00.00.0
Moss96.391.898.561.398.389.215.9
Lichen3.01.60.827.50.16.611.7
Low shrub1.56.30.032.50.08.113.9
BSC0.00.00.00.00.00.00.0
Graminoids0.10.80.10.10.10.20.3
Birch0.00.00.30.00.00.10.1
Soil0.00.00.01.30.00.30.6
Rock cover0.00.00.00.01.30.30.6
Veg. cover100.0100.0100.098.898.899.50.7
Transect 10 (+)Station 1Station 2Station 3Station 4Station 5MeanSD
Forbs6.30.00.00.11.01.52.7
Willows0.00.00.00.00.00.00.0
Moss35.045.011.331.373.839.322.9
Lichen15.515.89.412.68.412.35.2
Low shrub35.531.352.517.515.030.415.2
BSC0.00.30.01.02.30.71.0
Graminoids0.30.30.30.30.10.30.1
Birch0.00.315.00.30.13.16.7
Soil1.82.313.30.60.53.75.4
Rock cover7.32.50.058.815.016.724.2
Veg. cover95.095.891.854.087.084.717.5
Table 2. Comparison of Bray-Curtis dissimilarity index of distribution values of vegetation functional groups between individual transects (from 2022 data).
TransectsBCIij
1 vs. 20.485
2 vs. 30.239
3 vs. 40.314
4 vs. 50.383
5 vs. 100.383
5 vs. 60.389
6 vs. 70.149
7 vs. 80.064
8 vs. 90.128
9 vs. 100.467
Table 3. The 2007 data set for the Skaftafell (previously unpublished) used for comparison with BCI and t-test comparisons to 2022 data.
Transect 1Station 1Station 2Station 3Station 4Station 5
Moss1.01.01.022.526.9
Graminoids3.53.54.86.91.0
Willows0.00.00.00.00.0
Low shrubs2.00.01.00.00.0
Forbs1.01.01.01.01.0
Birch0.00.00.00.00.0
Veg. cover7.55.57.830.428.9
Transect 2Station 1Station 2Station 3Station 4Station 5
Moss37.551.019.023.033.0
Graminoids3.50.01.04.42.5
Willows3.31.01.05.61.3
Low shrubs0.00.00.00.03.0
Forbs4.54.84.514.34.2
Birch0.01.00.00.00.0
Veg. cover65.658.826.548.346.0
Transect 3Station 1Station 2Station 3Station 4Station 5
Moss21.312.046.030.066.0
Graminoids2.32.51.92.33.8
Willows1.00.03.10.00.0
Low shrubs11.91.33.10.00.0
Forbs2.94.58.92.34.0
Birch0.00.00.00.00.0
Veg. cover40.322.861.936.675.5
Transect 4Station 1Station 2Station 3Station 4Station 5
Moss42.541.041.044.016.0
Graminoids2.51.91.41.44.0
Willows23.87.56.46.93.0
Low shrubs36.36.113.036.325.1
Forbs1.04.510.914.611.8
Birch0.00.00.00.00.0
Veg. cover100.061.072.795.361.9
Transect 5Station 1Station 2Station 3Station 4Station 5
Moss18.841.060.040.016.0
Graminoids2.02.54.42.21.7
Willows6.30.50.01.09.4
Low shrubs9.84.82.86.011.3
Forbs12.38.07.112.310.3
Birch0.019.00.00.00.0
Veg. cover58.875.874.361.548.7
Transect 6Station 1Station 2Station 3Station 4Station 5
Moss35.061.051.029.068.0
Graminoids1.02.61.41.90.0
Willows0.06.31.91.90.0
Low shrubs26.92.92.28.528.4
Forbs3.03.10.065.674.4
Birch0.00.00.00.00.0
Veg. cover37.378.515.661.086.3
Transect 7Station 1Station 2Station 3Station 4Station 5
Moss32.551.068.093.03.8
Graminoids0.58.32.03.12.0
Willows0.00.01.00.00.0
Low shrubs0.03.32.41.032.0
Forbs3.02.61.05.74.3
Birch1.01.00.01.90.0
Veg. cover37.068.275.4100.043.1
Transect 8Station 1Station 2Station 3Station 4Station 5
Moss87.560.068.045.013.0
Graminoids6.90.01.00.50.0
Willows1.30.00.01.00.0
Low shrubs0.51.90.628.011.0
Forbs2.01.06.81.01.0
Birch0.05.619.011.00.0
Veg. cover98.171.095.288.525.0
Transect 9Station 1Station 2Station 3Station 4Station 5
Moss90.081.072.093.044.0
Graminoids0.00.01.00.01.0
Willows1.00.00.00.07.5
Low shrubs2.518.00.03.81.9
Forbs0.00.01.00.01.0
Birch6.31.00.00.50.0
Veg. cover100.0100.074.097.356.4
Table 4. Comparisons of BCI dissimilarity of transects from 2007 data to 2022 data. p = probability of null hypothesis calculated by paired t-test of functional group means (N = 6) for individual transect pairs (2007 vs. 2022).
TransectsBCIijp (t-Test)
10.370.906
20.240.607
30.220.668
40.30.991
50.340.340
60.430.045
70.250.218
80.160.189
90.110.430
Table 5. Comparisons of functional groups and total vegetation from 2007 data to 2022 data. p = probability of null hypothesis calculated by paired t-test of the functional group means for all transects (N = 9).
Groups p (t-Test)
Forbs0.016
Graminoids0.001
Birch0.286
Willows0.091
Low shrubs0.096
Moss0.018
Veg. cover0.015
Table 6. Comparisons of functional groups and total vegetation from 2007 data to 2022 data. p = probability of null hypothesis calculated by paired t-test of data for individual stations within each transect (N = 5). NA = insufficient data for test.
GroupForbsGraminoidBirchWillowsShrubsMosses Veg. Cover
Transect 10.0010.033NA0.3350.2080.7820.884
Transect 20.0240.061NA0.9540.0990.6220.587
Transect 30.0190.015NA0.3160.0750.410.057
Transect 40.0480.1090.3740.5910.8680.5090.838
Transect 5<0.0010.0150.6670.0530.0820.9550.994
Transect 60.0490.0580.1170.6240.6740.0390.504
Transect 70.0160.080.4330.6060.3960.3040.064
Transect 80.1030.290.6530.570.7210.670.37
Transect 90.2110.6510.2860.310.70.3990.263
Disclaimer/Publisher’s Note: The statements, opinions and data contained in all publications are solely those of the individual author(s) and contributor(s) and not of MDPI and/or the editor(s). MDPI and/or the editor(s) disclaim responsibility for any injury to people or property resulting from any ideas, methods, instructions or products referred to in the content.

