Article

Comprehensive Evaluation of the Development Level of China’s Characteristic Towns under the Perspective of an Urban–Rural Integration Development Strategy

1
College of Civil Engineering and Architecture, Xinjiang University, Urumqi 830047, China
2
School of Business, Xinjiang University, Urumqi 830091, China
*
Author to whom correspondence should be addressed.
Land 2024, 13(7), 1069; https://doi.org/10.3390/land13071069
Submission received: 17 June 2024 / Revised: 14 July 2024 / Accepted: 15 July 2024 / Published: 16 July 2024

Abstract

:
With the advancement of urbanization and the continuous deepening of reforms in urban–rural systems, China’s urbanization process has entered a new era of integrated urban–rural integration. Currently, as a global “new green revolution” gains momentum, numerous countries are deeply integrating the concept of sustainable development into new urban planning. Against this backdrop, urban planners worldwide are committed to building green, livable, and smart cities that can meet the needs of the present generation without compromising the ability of future generations to meet their needs, thus achieving the vision of harmonious coexistence between humanity and nature. Characteristic towns, leveraging their resource advantages, play a significant role in achieving sustainable regional economic development. They serve as valuable references for China’s urban transformation and upgrading, as well as for promoting rural urbanization, and are crucial avenues for advancing China’s urban–rural integration development strategy. The evaluation of the development level of characteristic towns is a necessary step in their progress and a strong guarantee for promoting their construction and development. Therefore, effectively evaluating the social benefits of characteristic towns is paramount. This study constructs an evaluation model based on the grey rough set theory and Technique for Order Preference by Similarity to Ideal Solution of TOPSIS. Firstly, an evaluation index system for the development level of characteristic towns is established. Then, the grey relational analysis method and rough set theory are used to reduce the index attributes, while the conditional information entropy theory is introduced to determine the weights of the reduced indicators. Finally, the TOPSIS model is applied to evaluate the development level of characteristic towns. Through empirical research, eight characteristic towns in Zhejiang Province, China, were assessed and ranked, verifying the effectiveness and feasibility of the proposed model.

1. Introduction

1.1. Literature Review

Since the reform and opening up, China’s urbanization development has made a qualitative leap. In this magnificent process, China’s urbanization rate has risen from 17.9% in 1978 to 66.16% in 2023, and the resident population of cities and towns has also grown rapidly, from 170 million in 1978 to more than 930 million in 2023, highlighting the strong vitality and achievements of China’s urbanization development. However, along with this wave of rapid development, some problems have gradually surfaced. The development of some towns and cities has overly pursued quantity at the expense of quality, and energy consumption and emissions remain high, posing serious challenges to the ecological environment and agricultural development. In order to meet these challenges, the concept of new urbanization has emerged as a necessary path for China’s development.
In contemporary China, sustainable development is not only an important part of the national strategy but also a key path to promote rural revitalization, the coordinated development of urban and rural areas, and the realization of national modernization goals [1,2]. Especially, with the acceleration of urbanization and the rapid development of the Internet, high-speed rail, and other technologies, the traditional urban–rural boundaries are becoming increasingly blurred, and urban industries and populations are transferring to rural areas, which makes the rise and development of featured towns an important socio-economic phenomenon at present [3,4,5]. These characteristic towns, as an important carrier of the national sustainable development strategy, rural revitalization strategy, and new urbanization strategy not only help to alleviate the pressure of big cities and promote the sustainable development of big cities but also bring new development opportunities for rural areas, and have an irreplaceable role in promoting the integration of urban and rural areas and upgrading the overall development of rural areas [6,7,8].
How to evaluate the development level of characteristic towns scientifically, reasonably, comprehensively, and effectively has become an important topic in front of us. This topic is not only related to the sustainable development of characteristic towns themselves, but also has a far-reaching impact on the construction of China’s future characteristic towns and the implementation of the new urbanization strategy [9,10,11]. On the one hand, a scientific and reasonable evaluation can accurately reflect the development status and potential of characteristic towns and provide a decision-making basis for the government to formulate relevant policies; on the other hand, the evaluation results can also motivate the characteristic towns to continuously improve their own construction and development level, so as to better serve the implementation of a sustainable development strategy. The current research on the evaluation of the development level of characteristic towns is still insufficient. The existing evaluation system focuses on economic indicators, ignoring the consideration of social benefits, the ecological environment, and other aspects, which is difficult to comprehensively reflect the comprehensive development level of characteristic towns [12,13,14]. Moreover, some evaluation methods are subjective and complicated to operate, which makes them difficult to be widely applied in practice [15,16]. Therefore, it is of great significance to construct a comprehensive, objective, and operable evaluation system to promote the healthy development of characteristic towns and realize the strategy of rural revitalization. This study is carried out based on this background. By introducing the grey rough set and TOPSIS method, a set of comprehensive, objective, and operable evaluation models of the development level of Chinese characteristic towns is constructed. The grey correlation analysis method can analyze the factors of indicators and obtain the correlation degree between indicators, so as to screen the indicators. Rough set theory, as a mathematical tool for dealing with ambiguity and uncertainty, can effectively deal with the redundancy and dependence between evaluation indicators and realize the approximation of indicator attributes, while the TOPSIS method is a multi-attribute decision analysis method, which is able to objectively evaluate the development level of the featured towns according to the weights of each indicator and the sample data. This study not only makes up for the shortcomings of existing studies, but also is more feasible and effective in practical applications.
Based on the results of empirical research, this study introduces a novel approach to evaluate the multifaceted development of specialty towns, overcoming the limitations of the traditional evaluation system that relies heavily on economic indicators. The results show as follows: (1) the performance of characteristic towns is regularly assessed using an evaluation model, thereby monitoring progress, identifying areas for improvement, and adjusting urban and rural development strategies accordingly to improve the effectiveness and responsiveness of policy interventions. (2) The use of an evaluation model identifies towns with high development potential so that funds can be invested in projects likely to generate positive social and economic returns. (3) Evaluation results can facilitate democratic discussions and encourage feedback, thus making the planning process more inclusive and responsive. The evaluation model proposed in this study takes into account various aspects of town development, including the social benefits, ecology, public infrastructure, cultural resources, and talent management, providing a holistic view of town vitality and sustainability.

1.2. Current Status of Research

1.2.1. Sustainable Development Strategies and New Urbanization

Sustainable development is not just an environmental concept [17] but a comprehensive social development theory and strategy that emphasizes harmony and balance among nature, the economy, and society. This concept holds that true development should not be achieved at the expense of environmental or social resources, but rather to ensure that all three can harmonize and prosper together in the long term. New urbanization, on the other hand, represents a new direction in China’s urbanization process. This process is not mere urban expansion but a comprehensive and multidimensional development process. It incorporates the ideas of urban–rural integration and urban–rural integration, aiming to break the urban–rural dichotomy and achieve the equalization of resources, opportunities, and services [18]. At the same time, new urbanization also advocates for the interaction between industry and city, i.e., industrial development and city construction promote each other to form a virtuous cycle. In addition, it also emphasizes the economical and intensive use of resources and is committed to creating an ecologically livable environment and realizing the harmonious coexistence of man and nature [19]. It is worth mentioning that new urbanization not only focuses on the development of large cities but also on the coordinated development of large, medium, and small cities, small towns, and new rural communities. This development model aims to build a multi-level, complementary town system, so that different regions can enjoy the dividends of urbanization.
At the current stage, new urbanization has become an important strategy for China. Exploring and practicing this strategy will not only help to promote sustained economic growth but also foster social harmony and overall progress. In this advancement process, always keep in mind that “economic development cannot be achieved at the expense of the environment,” to develop at the same time, pay more attention to the environment as a link, to achieve the beautiful scenery of harmonious coexistence between people and the environment [20]. Especially for the key link of urban–rural integrated development, in-depth research and targeted practice, for the realization of the goal of sustainable development, is of inestimable importance.

1.2.2. Rural Rejuvenation

Rural revitalization, as an important strategy for China’s current social and economic development, has attracted widespread attention and research. From the national level to the local level, governments at all levels are actively promoting the implementation of rural revitalization. Scholars, such as J. Sun, X. Xu, N. Wang, and others, have proposed a path for tourism to promote rural revitalization by means of expert interviews [21]. Scholars, such as T. Zhou, G. Jiang, W. Ma, and others, have proposed an effective path to promote rural revitalization by revitalizing the homestead through the establishment of a framework for identifying the revitalization potentials of homesteads [22]. Q. Xu, M. Zhong, and Y. Dong suggested that digital finance has a positive impact on rural revitalization in eastern and central China by using provincial data from 2011 to 2020 [23]. Z. Xiong, Y. Huang, and L. Yang analyzed the indicator system of 2011–2021 using the entropy method and pointed out the positive impact of digital finance on rural revitalization in eastern and central China. The 2021 indicator system pointed out the polarization of China’s rural revitalization [24]. Scholars Y. Tao and Y. Wu constructed the Chongqing rural revitalization evaluation index system of rural revitalization using the Field method, pointing out that there are obvious regional differences in the effectiveness of Chongqing’s rural revitalization [25]. Scholars C. Zhou, J. Liu, S. Wan, and others utilized the 2011–2020 panel data in China to point out the positive impacts of agricultural revitalization in the eastern and central parts of China. Provinces panel data pointed out the impact of agricultural insurance on rural revitalization [26].

1.2.3. Characteristic Town

Characteristic towns, as an important carrier of a sustainable development strategy, rural revitalization strategy, and new urbanization strategy, have been developed rapidly in recent years. Scholars, such as B. Li, X. Li, and X. Chen, studied the development mechanism of tourism towns from the perspective of industrial integration and landscape reconstruction [27]. Scholars, such as D. Li, L. Zheng, and S. Lin, studied the construction of agricultural characteristic towns from the perspective of population ecology [28]. Scholars, such as S. Zhan and X. Song, studied the development mode and spatial layout of characteristic towns in Shaanxi Province using empirical methods [29]. Scholars, such as C. Chen and S. Qian, optimized the construction path of characteristic towns through an empirical analysis of relic restoration in the construction of recreational characteristic towns in Tangshan, Nanjing [30]. Scholars, such as Y. Liu, H.-B. Hou, and M. Zhou, studied the development mechanism of tourism towns through the perspective of landscape restructuring [31]. Scholars, such as D. Li, L. Zheng, and S. Lin, investigated the construction of agricultural characteristic towns from the angle of population ecology [32]. Hou and M. Zhou proposed that the long-term development of featured towns needs to consider the issue of the ecological carrying capacity through an empirical analysis [31]. Z. Liao and L. Zhang studied the nature of the network by constructing a complex network of 142 featured towns in Guangdong Province using the method of network analysis and proposed that different types of featured towns show different clustering [32]. Ling D Z, Bin H C, and Juan X J proposed that the development of featured towns nowadays is characterized by an insufficient resource-allocation rate and lack of environmental protection awareness using the method of a DEA three-stage analysis [33]. S. Lin, P. Tian, and D. Li and other scholars divided the competitiveness of 30 featured towns of Sichuan Province by constructing a competitiveness model for a competitiveness evaluation [34].
The research on characteristic towns mainly focuses on single-factor research and lacks a multifaceted assessment and analysis. This study evaluates the development level of characteristic towns by establishing an evaluation index system that covers economic benefits, social benefits, the ecological environment, and other aspects. It uses grey rough set theory to approximate the index attributes, reducing the redundancy and dependence of the evaluation indexes. By introducing the conditional information entropy theory, it determines the weights of the indexes after approximation, ensuring the objectivity and accuracy of the evaluation results. The study uses the TOPSIS model to evaluate the development level of characteristic towns and verifies the validity and feasibility of the model through empirical research. This study not only provides new ideas and methods for the evaluation of the development level of characteristic towns but also provides strong support for the formulation and implementation of related policies.

2. Materials and Methods

2.1. Construction of the Evaluation Indicator System for the Development Level of Characteristic Towns

In selecting evaluation methods, we fully considered the characteristics of the data and the specific requirements of the research. Specifically, the reasons for choosing grey rough set theory and the TOPSIS method are as follows: (1) uncertainty and complexity of data: the grey rough set theory can effectively handle uncertainty and fuzziness in data, which is particularly crucial when evaluating the development level of characteristic small towns, as relevant data may be incomplete or noisy. The TOPSIS method, on the other hand, excels at addressing multi-criteria decision-making problems, capable of comprehensively analyzing multiple evaluation indicators in complex situations and deriving reasonable ranking results. (2) Comparison with other methods: compared to other multi-criteria decision-making methods (such as the Analytic Hierarchy Process (AHP), Fuzzy Comprehensive Evaluation, etc.), the TOPSIS method focuses more on utilizing the objective information inherent in the data, thereby reducing the influence of subjective judgments. Compared to traditional rough set theory, grey rough set theory demonstrates stronger capabilities in handling uncertain data, making it more suitable for the uncertain and fuzzy data environment involved in this study.

2.1.1. Principles for the Selection of Evaluation Indicators

The evaluation indicators should accurately reflect the core development direction and long-term goals of the special town, ensuring that its unique industrial characteristics and innovation potential can be highlighted in the evaluation process. The setting of these indicators should be able to guide the featured towns to achieve comprehensive and high-quality development in industrial transformation and upgrading, cultural inheritance and innovation, ecological environmental protection, and community construction.
(1) Scientific nature of evaluation indexes: when selecting evaluation indexes of characteristic towns, we must adhere to the principle of scientific rigor to ensure that each index has a solid theoretical basis and can accurately and objectively map out the real development status of characteristic towns. The weighting of evaluation indicators should be based on an in-depth scientific analysis and reasonable comprehensive assessment to ensure that no subjective assumptions and personal bias are mixed, so as to guarantee the objectivity and fairness of the evaluation results, thus providing accurate guidance and reference for the development of the featured town.
(2) Systemic nature of evaluation indexes: the complexity of the development of characteristic towns requires us to comprehensively consider multiple dimensions, such as the economy, society, culture, and ecology when selecting evaluation indexes. These indicators do not exist in isolation but are related to each other and promote each other, building a complete and mutually supportive indicator system. Such a system not only helps to examine the comprehensive development level of the special town in an all-round way but also provides solid support and scientific guidance for the sustainable development of the special town.
(3) Operability of evaluation indicators: to ensure the practicality and effectiveness of the evaluation indicators of characteristic towns, we must ensure that these indicators are both quantifiable and comparable. This means that the evaluation indicators we design need to be able to easily collect, collate, and analyze relevant data for a horizontal comparison and assessment among different characteristic towns. In addition, the presentation of the evaluation indicators should be simple and clear to ensure that the evaluators can easily understand and accurately apply the indicators, so as to more accurately assess the comprehensive development level of the special towns.
(4) Dynamic nature of evaluation indicators: the development of characteristic towns is an ever-changing and dynamic process; therefore, when selecting evaluation indicators, we must fully consider the importance of the time factor. These indicators should be able to keenly capture the unique characteristics and dynamic changes of the characteristic town in different development stages, to help us gain timely insight and adjust the development strategy to ensure that it advances with the times. At the same time, the evaluation indicators should be set with a certain degree of flexibility to adapt to the various actual situations and changing needs that may arise in the development process of the special town, to ensure the practicality and foresight of the evaluation system.
(5) Sustainability of evaluation indicators: in the development journey of special towns, we must put sustainability at the center and ensure that the selection of evaluation indicators can deeply reflect this core concept. This means that the focus of the evaluation is not only on economic prosperity but also on the efficient use of resources, the careful protection of the environment, and the inheritance and promotion of culture. Through these well-designed evaluation indicators, we aim to ensure that character towns can maintain social harmony, promote cultural prosperity, and safeguard the health and balance of the ecological environment while promoting economic development, to achieve truly sustainable development.
In specific practice, the selection of evaluation indicators for the development of characteristic towns must be closely combined with their unique actual situation and established development goals and be analyzed and designed in depth and in detail. In this process, it is necessary to ensure the scientific, rationality, and effectiveness of the evaluation indicators, so that they can truly reflect the development situation and potential of the characteristic town. In addition, with the emergence of new situations and new requirements for the development of characteristic towns, these evaluation indicators should be reviewed and revised regularly to ensure that they are always up to date and provide strong support and accurate guidance for the sustainable development of characteristic towns.

2.1.2. Construction of the Evaluation Indicator System

Sustainable development indicators are an all-encompassing indicator system that comprehensively evaluates the state of sustainable development in the environmental, economic, and social spheres, the pressures faced, and the effectiveness of policy responses. The evaluation index system of the development level of rural revitalization strategy proposes to evaluate the implementation effect in five dimensions: industrial prosperity, ecological livability, civilized rural culture, effective governance, and affluent life, and since the index system of the sustainable development strategy is highly compatible with this, the above dimensions will be discussed to construct an index system applicable to the evaluation of the social benefits of featured towns.
Industrial prosperity refers to the characteristic town to take the leading industry as the core, make full use of all kinds of resources, create brand industry, constantly upgrade and innovate, and promote the development of core industry, so as to ensure the integration of characteristic industry and local resources in order to maintain the advantageous competitiveness; ecological livability means that not only should the basic living conditions of local residents be met, but more efforts should be made in terms of environmental protection, resource conservation, and pollution control in order to create a livable town with special features; the civilized township style refers to not only examining the operation effect of the featured town from the material aspect, but also constructing a good civilized township style from the spiritual aspect, focusing on the excavation and inheritance of the local culture and the improvement and enhancement of the quality of the residents and other aspects to start to consider; effective governance means that the construction of the characteristic town cannot be separated from the management and governance of people, things, and materials, and it is necessary to strengthen the construction of the system and improve the system of introducing talents and the system of public services; wealthy life refers to the intuitive benefits brought by the special town to local residents, which are mainly reflected in the improvement of local residents’ income and living standards.
The indicators summarized in Table 1 are summarized, integrated, and classified, combined with the current performance indicators for the development of characteristic towns in China, and the relevant policy documents on characteristic towns, and based on the unique characteristics of China’s characteristic towns and according to the indicators of the town’s resource advantages, industrial superposition, and cultural characteristics, the evaluation system is established through the principles of comprehensiveness and feasibility, universality and specificity, and the combination of qualitative and quantitative methods. Based on the indicators of resource advantages, industrial superposition, and cultural characteristics of small towns and following the principles of comprehensiveness and feasibility, universality, and specificity and the combination of qualitative and quantitative, the evaluation index system is established through questionnaire surveys and visits to experts and urban residents using the Delphi method, expert interviews, and other research methods. Finally, from the perspective of rural revitalization strategy, an evaluation index system including 5 aspects and 22 indicators was established (see Table 2), aiming at assessing the development and sustainability of China’s characteristic towns, so as to provide a reference basis for the formulation of relevant policies and development plans.

2.2. Assessment Model for the Development Level of Characteristic Towns

Against the backdrop of the integrated urban–rural integration strategy, evaluating the development level of specialty towns poses a complex and multidimensional decision-making challenge. As these projects span multiple domains and involve diverse stakeholders, each group holds different evaluation criteria and concerns, making the evaluation process particularly intricate. These domains include but are not limited to economic, social, ecological, and cultural benefits, which together constitute the multifaceted attributes of the development level of specialty towns. When measuring these attributes, the selection of appropriate indicators is crucial, but the subsequent issue is how to quantify and assign weights to these indicators. Due to the uniqueness and diversity of specialty town projects in China, it is difficult to establish a universal evaluation standard to uniformly measure the development level of all projects. Therefore, the construction of evaluation standards and indicator systems must be tailored to the specific characteristics of each project.
In order to cope with this challenge, when constructing the evaluation model, the grey correlation analysis method can first be used to carry out the preliminary screening of the indicators. As the grey correlation analysis method is easily affected by subjective factors, it is often necessary to carry out some subjective judgments and assumptions when using it, thus lacking a certain objective basis, which may have an impact on the results of the screening and increase the uncertainty of the results. Therefore, when using the grey correlation analysis method, we need to maintain a prudent attitude and make a comprehensive consideration in combination with other assessment methods and the actual situation to ensure the accuracy and reliability of the screening results. Therefore, on the basis of the preliminary screening using the grey correlation analysis method, we then draw on the attribute approximation idea in the rough set theory to carry out a refined optimization of the preliminary screening indexes. This step aims to eliminate redundant information and retain the core indicators to ensure the simplicity and effectiveness of the evaluation system. Subsequently, the conditional information entropy is utilized in the rough set environment to determine the weights of each indicator to reflect their importance and influence in the evaluation process.
Finally, the TOPSIS method is used to evaluate the development level of each characteristic town. Firstly, the weight of each index is calculated by using conditional information entropy. Then, the TOPSIS method is used to calculate the degree of proximity of each evaluation object to the idealized target for ranking, which can intuitively show the difference between the advantages and disadvantages of each featured town in the level of development and provide powerful decision-making support for the construction of featured towns under the strategy of rural revitalization.

2.2.1. Rough Set and Conditional Information Entropy Theory

(1) Grey correlation analysis method
The grey correlation analysis method is a research method based on the grey system theory, which measures the degree of correlation between factors in a system by analyzing the degree of similarity or dissimilarity in the developmental dynamics between these factors. The basic idea of the method is to rank systems based on the calculated grey correlation, with evaluation objects with higher correlations usually considered to perform or be more effective in the system.
(2) Rough set theory
Rough set theory can process incomplete data by means of analysis and inference and is an innovative data-mining technique proposed by Professor Z. Pawlak. The theory is based on categorization, i.e., equivalence relationships over a particular space, which are capable of delineating that space and, at its core, attribute parsimony, i.e., the judicious elimination of redundant attributes from a decision table while ensuring that they do not affect the ability to categorize or make decisions.
(3) Attributes of approximate simplicity
The idea of attribute approximation in rough set theory focuses on simplifying the decision-making or classification process by reducing redundant or unnecessary attributes in the dataset without losing the classification capability. The core of this idea lies in extracting the most critical and valuable attributes for decision making or classification through attribute approximation, so as to improve the efficiency and accuracy of data processing.
(4) Conditional information entropy theory.
From the perspective of probability theory, S = U , A , V , f is regarded as a random system. Let X be a random variable defined on the domain U, and this variable has the characteristic of attribute partition, represented as X = { C 1 , C 2 , C n } . Then, the probability measure distribution is as follows:
[ X : P ] = C 1 p ( C 1 )     C 2 p ( C 2 )         C n p ( C n )
In Formula (1), p C i = X 1 U , i = 1,2 , , n .
From the perspective of information theory, S = U , A , V , f is regarded as an incomplete information system, where C is the information source. The entropy function from information entropy theory can be introduced to measure the information source C.
H C = H p X 1 , p X 2 , , p X n = k i = 1 n p X i log p X i
Conditional information entropy is a measure of the information entropy of a known random variable X over a random variable Y in information theory, denoted as H ( D | C ) . From the classification criterion in rough set theory, we can obtain U / D = { D 1 , D 2 , , D k } . As the information system S = U , A , V , f , where the universe of discourse U is divided into k classification subsets according to attribute D, and U / C = { C 1 , C 2 , , C m } is the m classification subsets of the universe of discourse U according to attribute C, U / C and U / D are conditional equivalence relations on the universe of discourse U based on conditional attributes, then the conditional entropy of decision D relative to the indicator set C is calculated as follows:
H D | C = i = 1 m C i 2 U 2 j = 1 k D i C i C i 1 D i C i C i
(5) Determination of indicator weights based on conditional information entropy
Traditional rough set theory gives only the importance of the conditional attribute c i , as follows:
W ( c i ) = γ c ( D ) γ c { c i } ( D )
In Formula (4), γ C ( D ) is the dependency degree of the attribute decision set D on the attribute indicator set C.
Based on the importance of the conditional attribute c i , the weights of conditional attribute c i can be calculated.
ω ( c i ) = W ( c i ) c i C W ( c i )
In the application of the traditional rough set theory to determine weights as described above, when the importance of conditional attribute c i is 0, the weight is also 0. Considering the irrationality of the above method, the conditional entropy is integrated into the rough set theory to calculate attribute weights. Firstly, the importance of the conditional attribute c i in the decision set is calculated, denoted as I D | C ,which is as follows:
I D | C = i = 1 m C i 2 U 2 j = 1 k D j C i C i 1 D j C i C i
c i C , the importance of the conditional attribute c i is as follows:
S i g c = I D | C c I D | C
c i C , the weight of the conditional attribute c i is as follows:
ω k = S i g c + I D | c a C S i g c + I D | c
The composite evaluation value S c for each indicator is as follows:
S k = i = 1 m ω k v i k
where v i k is the score assigned to the kth indicator by the ith object.
In the above definition,   I D | c indicates the importance of conditional attributes within the decision set itself; S i g c indicates the importance of conditional attributes in C. This dual consideration not only reveals the overall value of the conditional attributes more fully, but also digs deeper into their individual weights. It is worth noting that this evaluation mechanism skillfully avoids the extreme case of 0 weights that may occur in the weight calculation of traditional rough set theory, thus ensuring the accuracy and fairness of the evaluation. By combining the overall importance of conditional attributes and their own importance, we can more accurately grasp the importance of each indicator in the evaluation of the development level of characteristic towns and provide a more scientific and reasonable basis for decision-making.

2.2.2. TOPSIS Modeling Steps

(1) TOPSIS synthesis method
The TOPSIS method is a commonly used multi-attribute decision-making approach that can help decision-makers select the optimal solution from numerous alternatives. It evaluates and compares the merits of various options through a comprehensive assessment, ultimately determining the best course of action. This method is distance-based, assessing the quality of options by calculating their distance from the ideal solution. Its core principle is that solutions closer to the ideal one are considered better.
(2) The specific modeling steps for TOPSIS are as follows
(1) A group of experts from universities, government, and enterprises will form an expert panel to score the characteristic towns to be evaluated. Based on the scoring sample data, a rough set information system is constructed, and a set of evaluation indicators covering multiple dimensions is formed. To ensure the accuracy and efficiency of the assessment, the raw data were meticulously discretized using rough set theory, and the most representative and influential indicators were screened out through attribute approximation techniques, thus constructing a streamlined and efficient set of approximated indicators.
(2) A new decision matrix of evaluation criteria is created based on the reduced set of indicators, which is designed to comprehensively cover and reflect the core elements of the reduced set of indicators, ensuring that each indicator is appropriately represented in the evaluation process.
(3) Divide the indicator set into subsets according to attributes, obtaining corresponding subsets. Calculate the reduced importance and indicator weights of the divided subsets using Equations (5) and (7), respectively. Finally, substitute the results from Equations (5) and (7) into Equation (8) to obtain the final weights.
(4) Normalize the reduced indicators and construct a weighted normalized decision matrix, denoted as = ( f i j ) m × n = ( w j y i j ) m × n , y i j = a i j / i = 1 n a i j 2 , ( i = 1,2 , , m ; = 1,2 , , n ). This matrix not only takes into account the raw data of each evaluation indicator but also incorporates the weights of each indicator, thus reflecting more comprehensively the actual performance of the special town in various aspects.
(5) Determining positive and negative ideal solutions
F i * = max i   f i j | j ϵ I , min i   f i j | j ϵ O
F i = max i   f i j | j ϵ O , min i   f i j | j ϵ I
In the formula, I is the set of effectiveness indicators and O is the set of cost-based indicators.
(6) Calculate the Euclidean distance between the feature town to be evaluated and the positive and negative ideal solutions. In the process of evaluating the development level of characteristic towns, it is necessary to calculate the Euclidean distance between the characteristic town to be evaluated and the positive ideal solution (i.e., the optimal solution) and the negative ideal solution (i.e., the worst solution). These two-distance metrics reflect the degree of similarity between the featured town and the ideal state. The larger the calculated Euclidean distance, the smaller the similarity between the featured town and the corresponding ideal solution, and vice versa.
d i * = j = n n ( f i j f i * ) 2 , i = 1,2 , , m
d i = j = n n ( f i j f i ) 2 , i = 1,2 , , m
(7) Based on the calculated Euclidean distance results, determine the relative proximity of the characteristic town under evaluation.
ζ i = d i / ( d i * + d i ) , i = 1,2 , , m
In Equation (13), the value range of ζ i is from 0 to 1. The larger the relative proximity ζ, the better the social benefit.
(8) Rank the characteristic towns under evaluation based on the results above. In this evaluation process, the indicator of relative proximity directly reflects the performance of the special town in terms of social benefits. According to the ranking results, the greater the relative closeness ζ, the better the performance of the special towns in terms of social benefits.

3. Results

3.1. Constructing a Scoring Matrix

A group of experts (y1~y25) consisting of 25 people, including staff engaged in the construction and operation of characteristic towns, government personnel, university researchers, etc., evaluated and scored (with a value of 100) from five aspects and 22 indicators (represented by X i , i = 1,2 , , 22 ), respectively, such as industrial prosperity, ecological livability, civilized township, effective governance, and rich life, and the final scores from all experts were used as the sample data. The average value of all experts’ scores is used as the sample data (see Table 3).

3.2. Data Pre-Processing

Since the data of different factors or indicators may have different scales and orders of magnitude, in order to eliminate such differences, it is necessary to pre-process the data with standardization, for which standardization is calculated using the following formula:
v i j = x i j m i n i x i j m a x i x i j m i n i x i j
where m i n i denotes the minimum value of line i and m a x i denotes the maximum value of line i . For space reasons, the results of the expert scored dimensionless data are presented in Appendix A.

3.3. Calculate the Correlation Matrix

The correlation coefficient is a measure of the degree of similarity between a reference sequence and a comparison sequence. By calculating the correlation coefficient between each comparison sequence and the reference sequence at each moment or position, a correlation coefficient matrix can be obtained. The resolution coefficient ρ takes a value in the range of [ 0 1 ] , and the smaller the resolution coefficient is, the greater the difference between its correlation coefficients and the stronger the distinguishing ability. After analyzing previous literature, ρ was chosen to be 0.5.
ε i k j = m i n i m i n j x k i x i j + ρ m i n i m i n j x k j x i j x k j x i j + ρ m i n i m i n j x k j x i j
ε i k = 1 n j = 1 n ε i k j
where X = { x 1 1 , x 2 2 , , x m n } represents the column of characteristic data for the change in index scores, and ε i k j represents the correlation coefficient of the evaluation object x i to x k under the j index ( i , k = 1,2 , , m ; j = 1,2 , , n ). The resulting gray correlation coefficient matrix is as follows:
A = 1   0.563   0.720   0.652   0.776   0.566   0.730   0.714   0.670   0.798   0.759   0.675   0.736   0.804   0.735   0.790   0.735   0.773   0.742   0.697   0.783   0.690   0.721   0.678   0.709 1   0.536   0.657   0.609   0.655   0.538   0.611   0.638   0.605   0.562   0.699   0.615   0.700   0.646   0.617   0.567   0.679   0.554   0.535   0.547   0.566   0.568   0.579   0.540 1   0.712   0.729   0.519   0.663   0.687   0.687   0.749   0.743   0.808   0.665   0.761   0.479   0.707   0.739   0.807   0.790   0.717   0.731   0.634   0.694   0.762   0.766 1   0.750   0.555   0.705   0.714   0.614   0.729   0.733   0.707   0.670   0.729   0.518   0.690   0.669   0.703   0.818   0.721   0.737   0.641   0.725   0.652   0.691 1   0.513   0.708   0.703   0.661   0.809   0.757   0.767   0.684   0.846   0.489   0.786   0.712   0.799   0.695   0.819   0.679   0.676   0.732   0.671   0.704 1   0.580   0.542   0.571   0.564   0.641   0.676   0.588   0.501   0.914   0.603   0.641   0.643   0.596   0.501   0.679   0.651   0.524   0.531   0.655 1   0.650   0.610   0.705   0.735   0.662   0.627   0.693   0.537   0.647   0.724   0.686   0.624   0.646   0.691   0.767   0.667   0.643   0.679 1   0.640   0.764   0.663   0.678   0.607   0.720   0.525   0.744   0.655   0.683   0.670   0.643   0.693   0.632   0.773   0.608   0.699 1   0.602   0.653   0.673   0.684   0.683   0.554   0.661   0.665   0.729   0.713   0.695   0.730   0.661   0.719   0.769   0.678 1   0.748   0.670   0.723   0.822   0.540   0.830   0.681   0.756   0.767   0.759   0.621   0.623   0.790   0.685   0.754 1   0.725   0.710   0.777   0.593   0.720   0.863   0.733   0.711   0.719   0.732   0.723   0.712   0.704   0.766 1   0.709   0.725   0.668   0.718   0.749   0.897   0.797   0.740   0.702   0.610   0.693   0.744   0.689 1   0.672   0.568   0.722   0.749   0.647   0.713   0.778   0.679   0.636   0.684   0.637   0.694 1   0.460   0.758   0.739   0.788   0.732   0.826   0.747   0.704   0.637   0.697   0.750 1   0.561   0.547   0.500   0.548   0.476   0.777   0.611   0.492   0.521   0.677 1   0.716   0.746   0.751   0.771   0.687   0.607   0.733   0.660   0.780 1   0.776   0.788   0.758   0.752   0.725   0.684   0.707   0.747 1   0.825   0.785   0.745   0.701   0.699   0.766   0.815 1   0.731   0.736   0.681   0.709   0.746   0.780 1   0.752   0.697   0.699   0.663   0.696 1   0.670   0.698   0.744   0.698 1   0.689   0.634   0.642 1   0.635   0.741 1   0.679 1

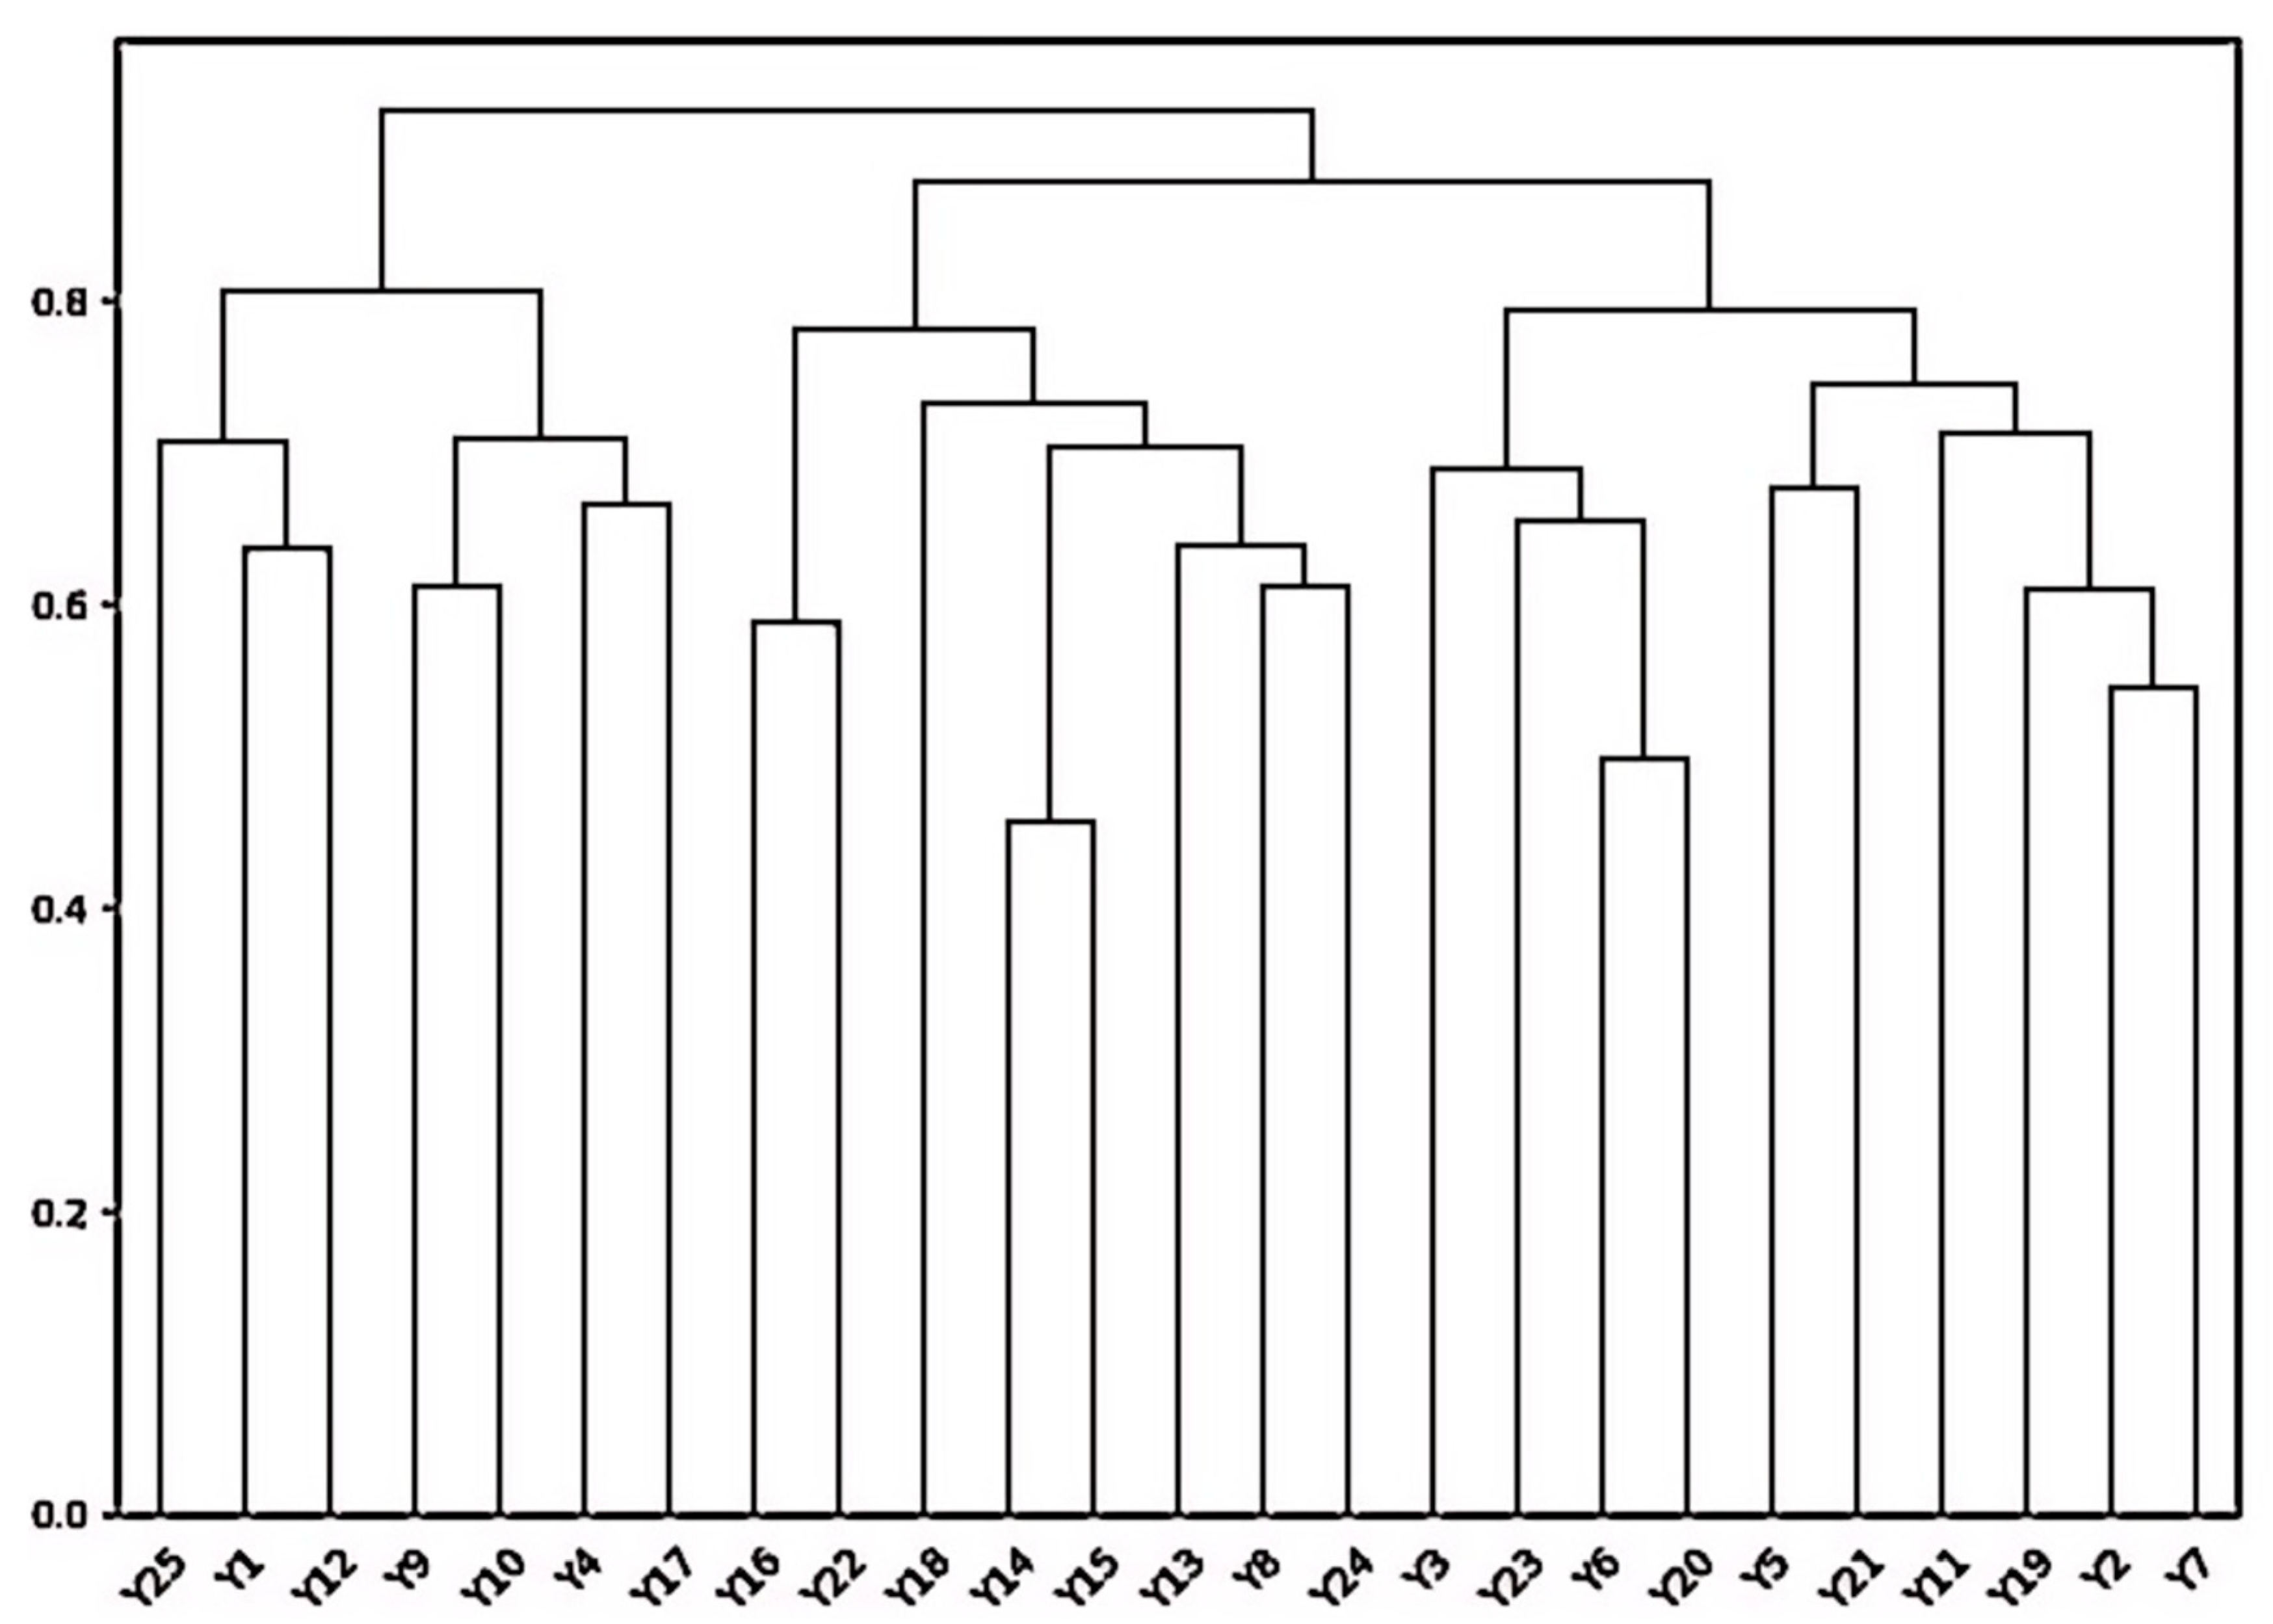
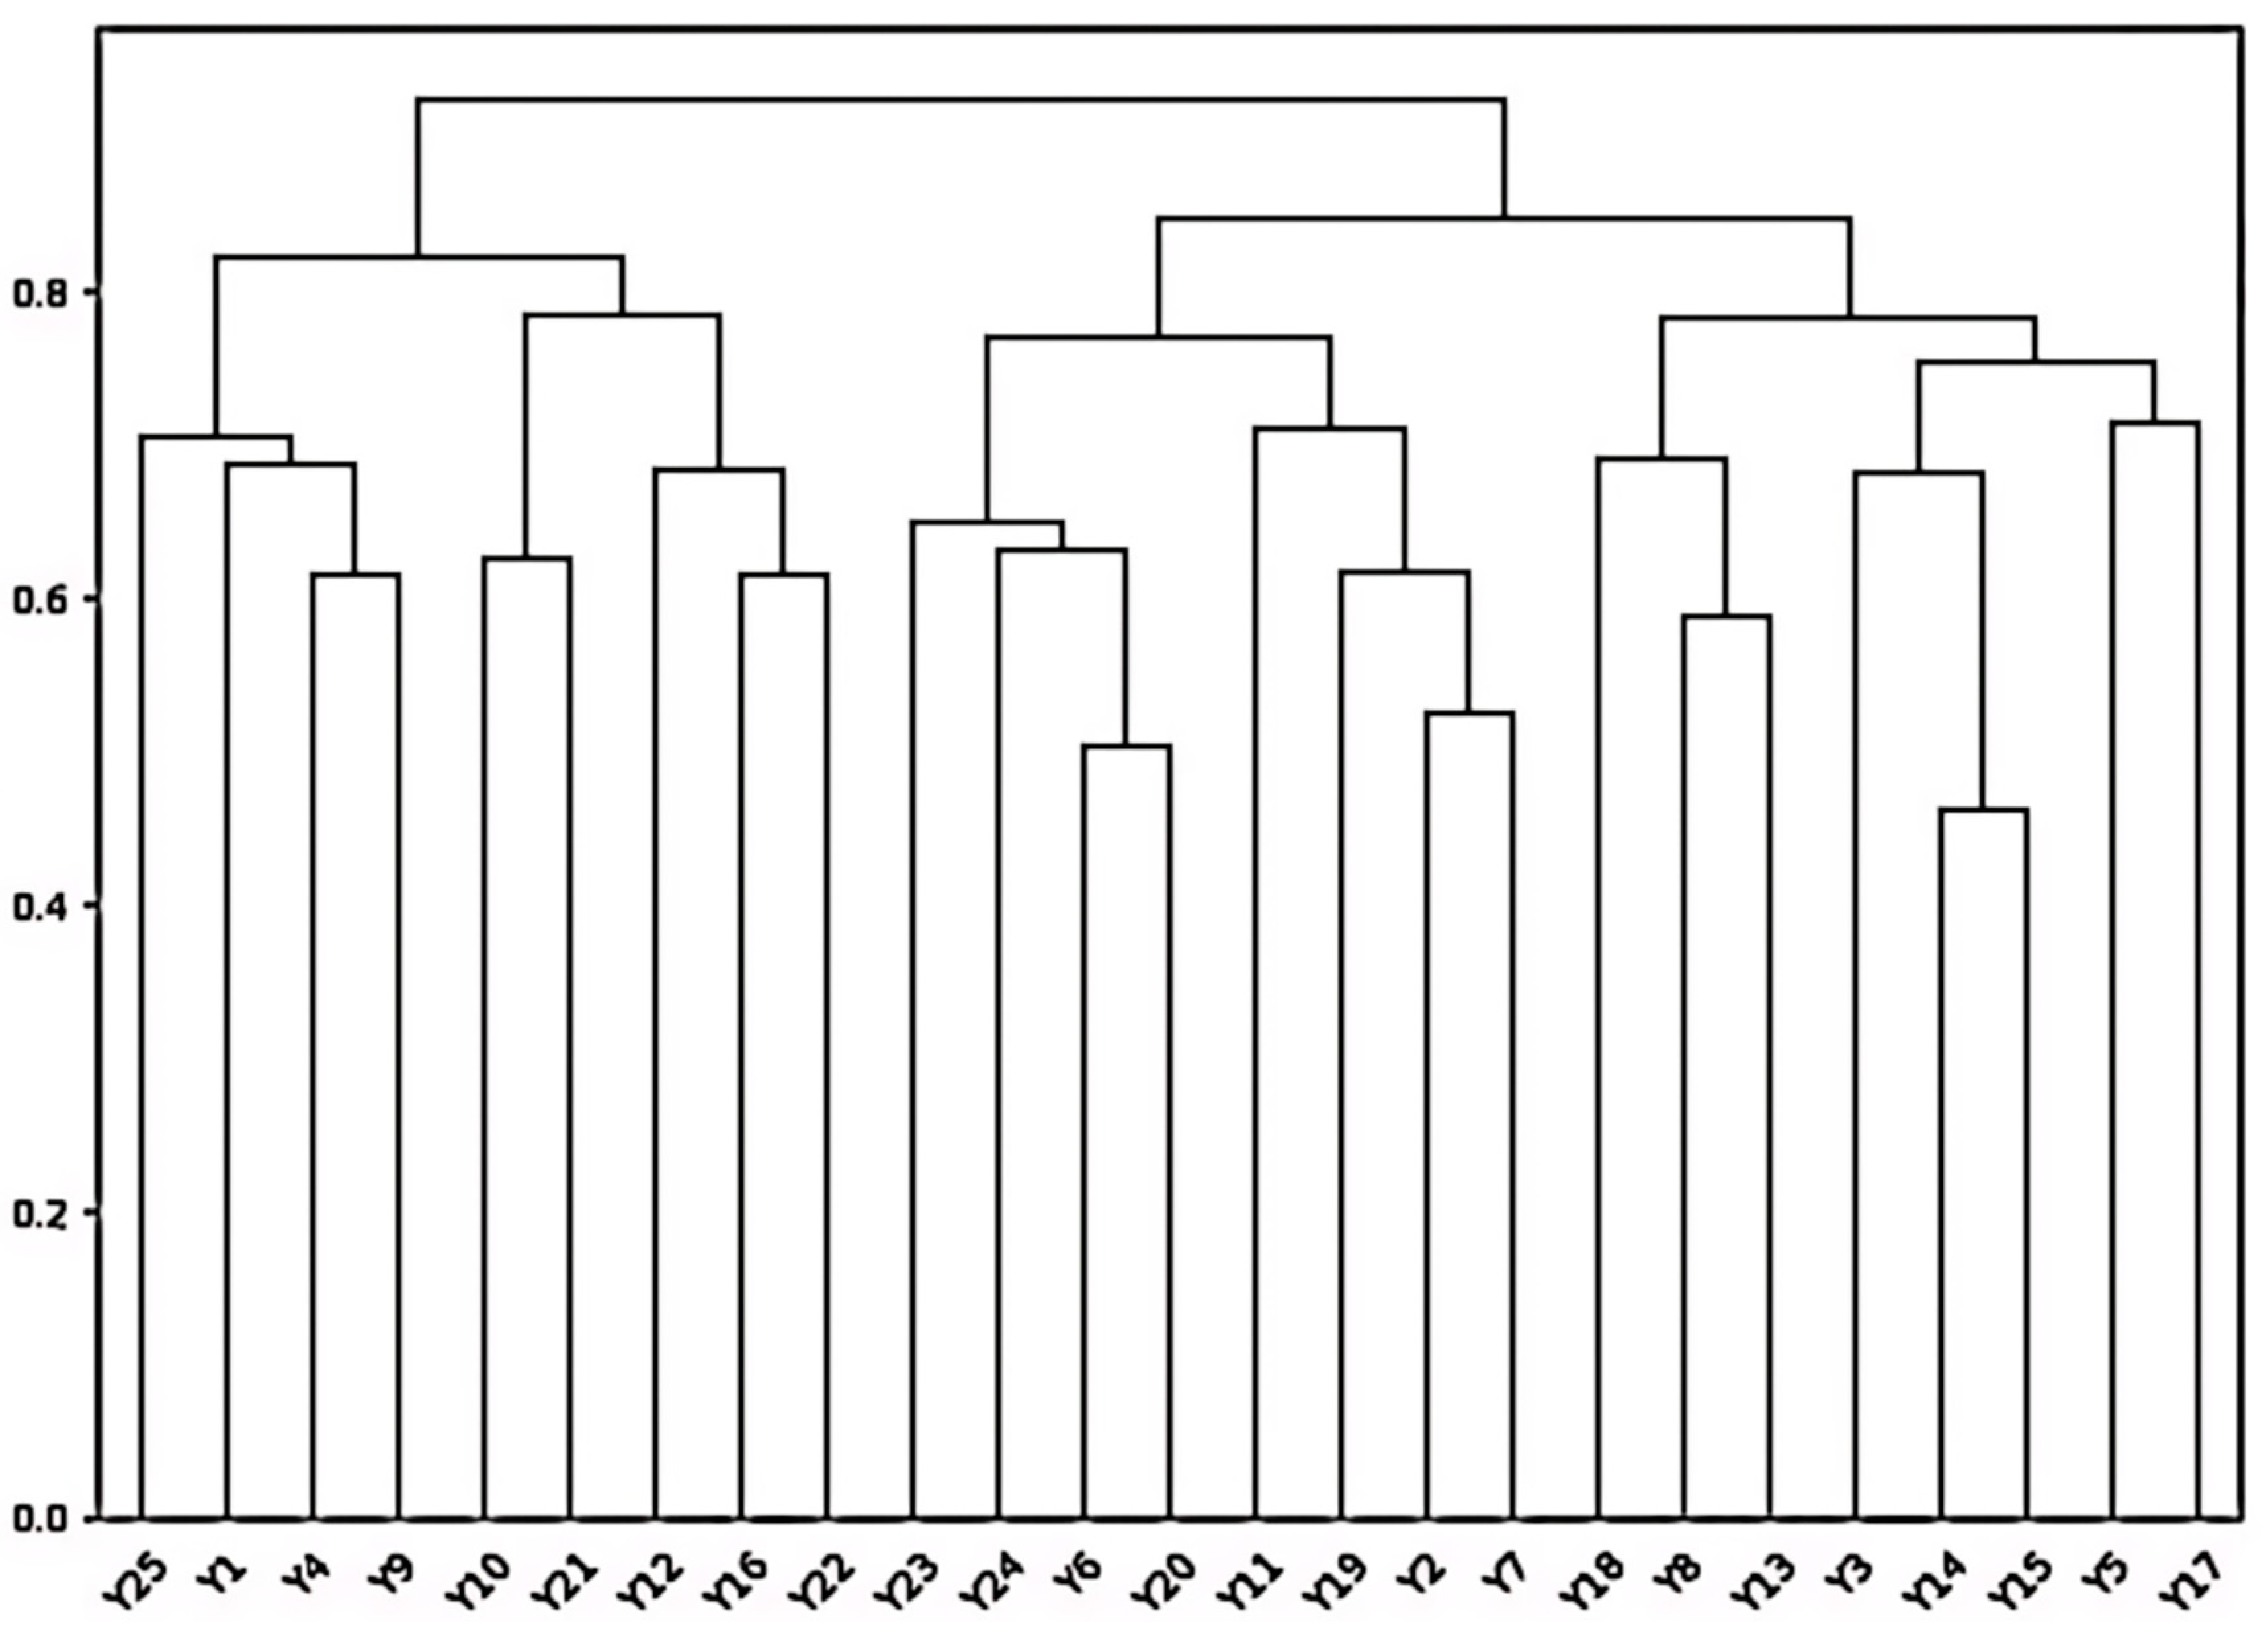
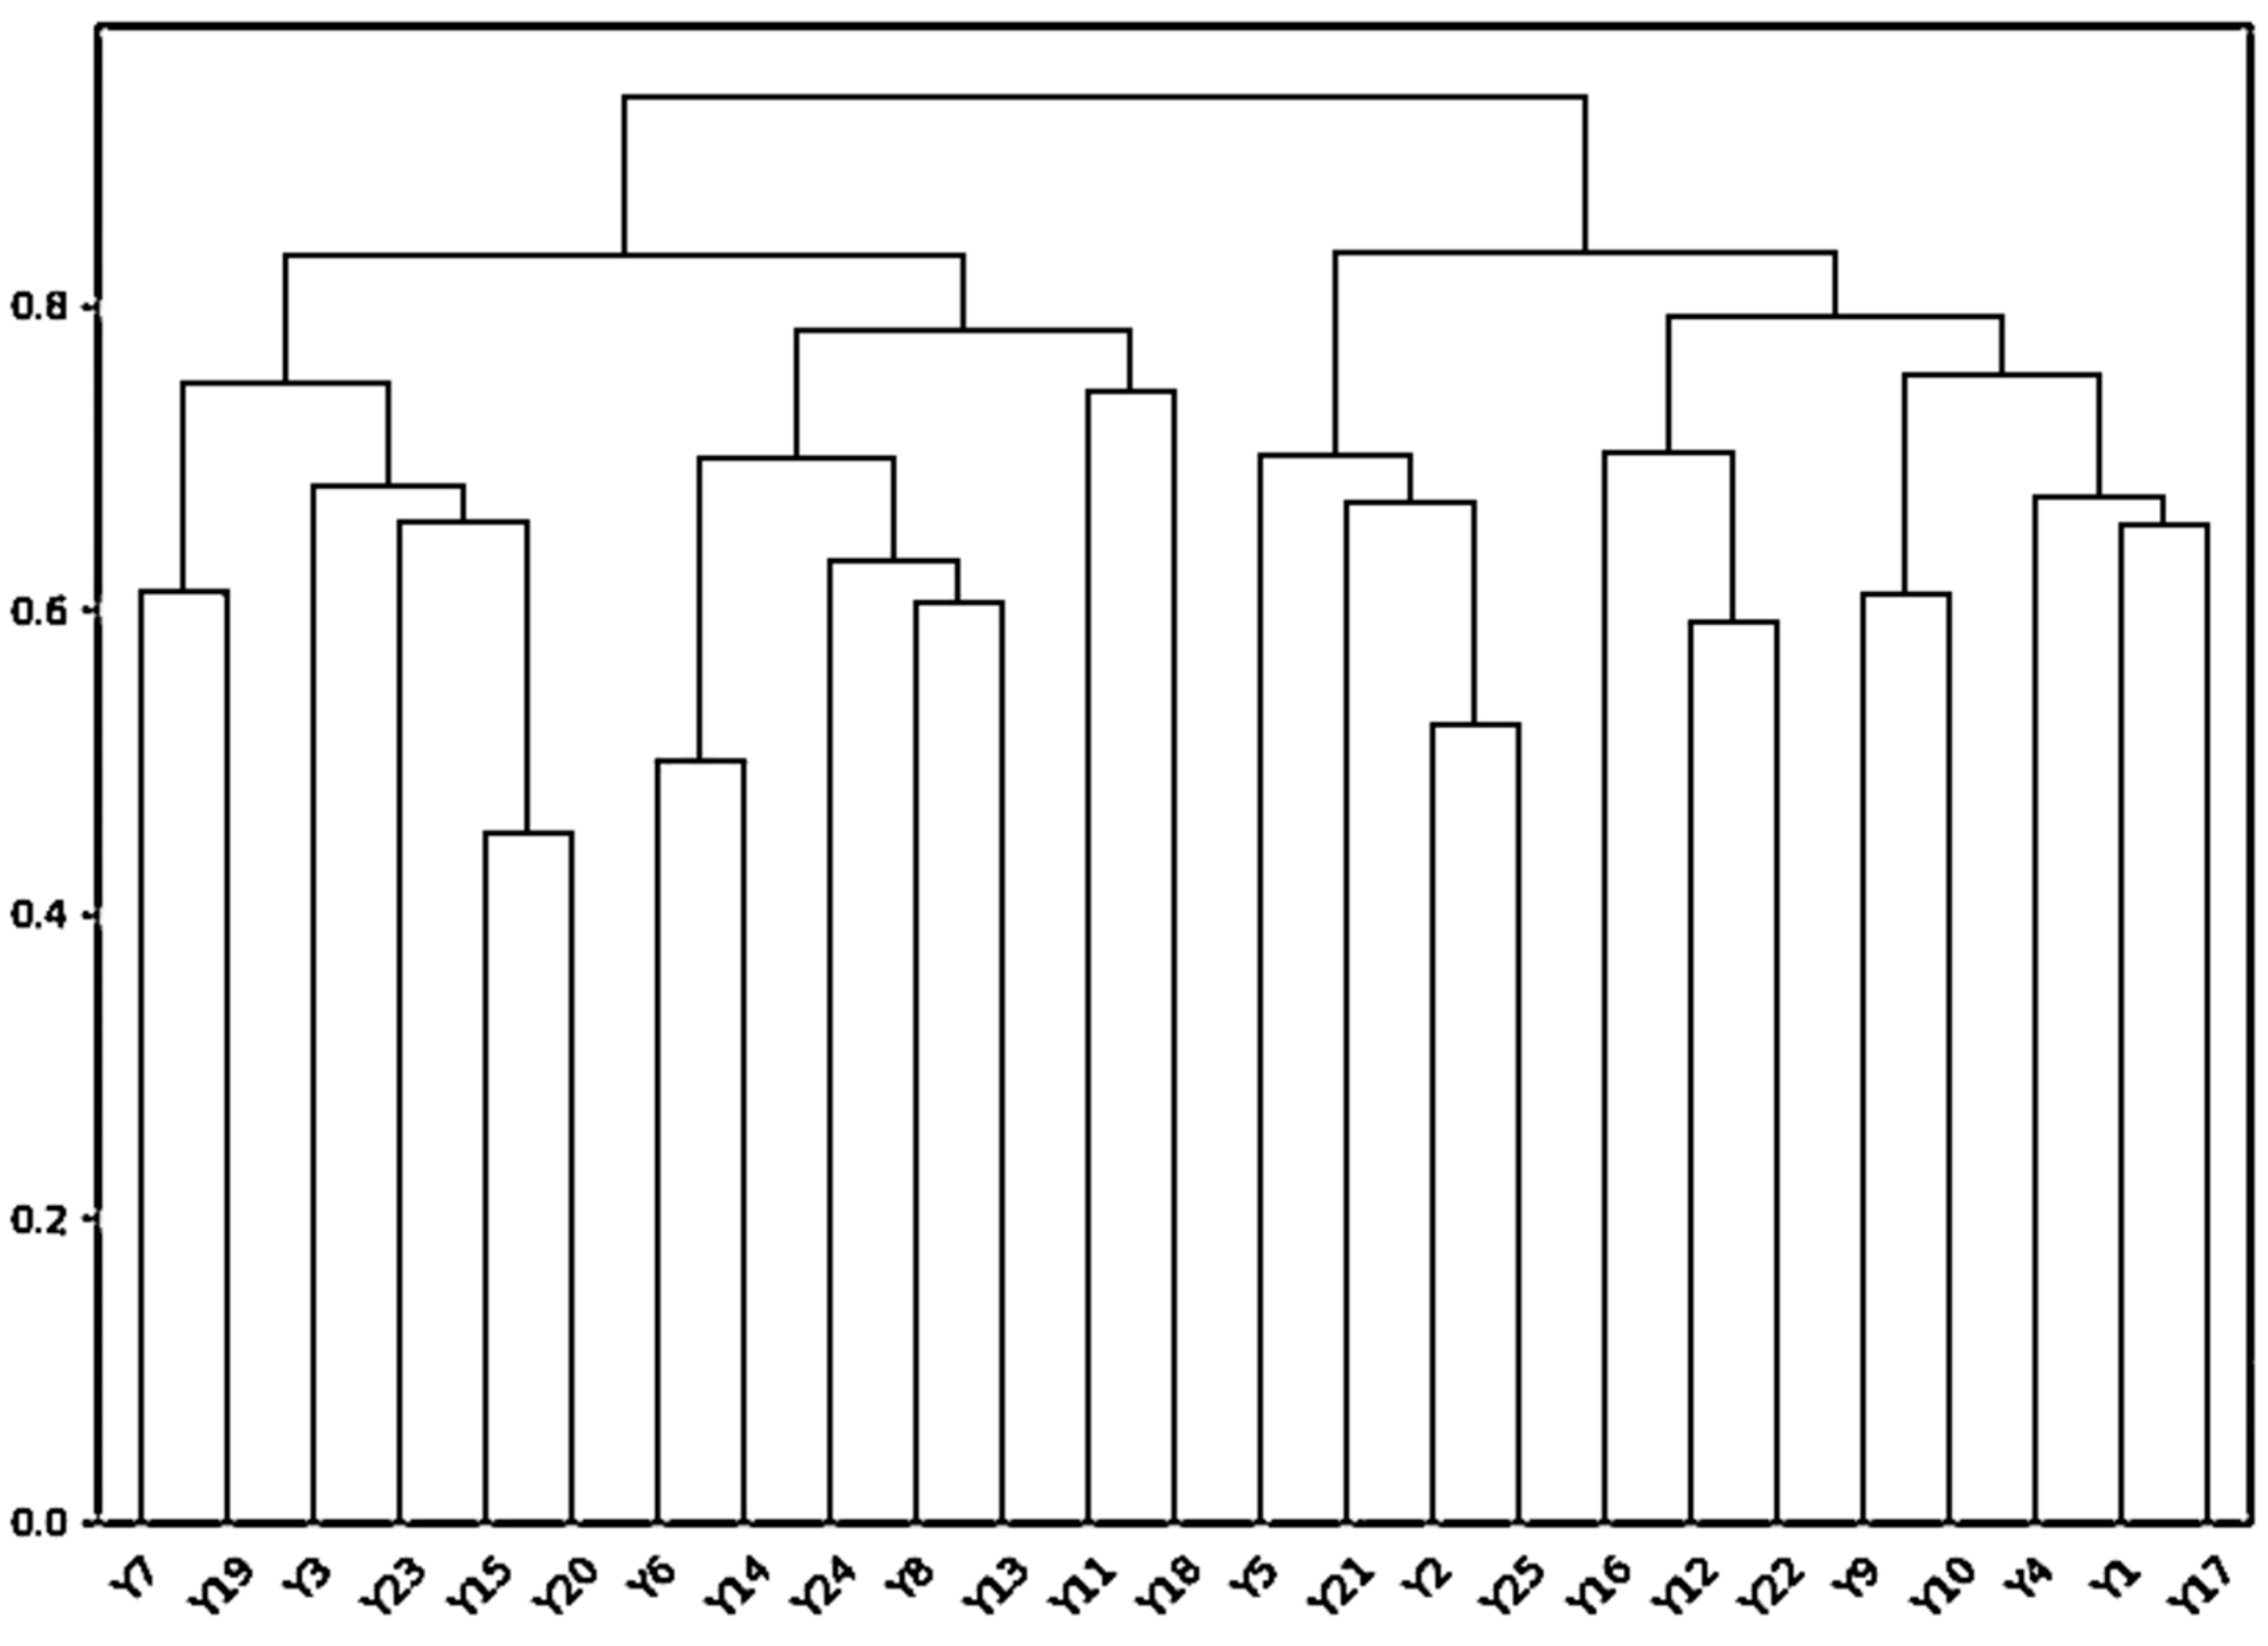
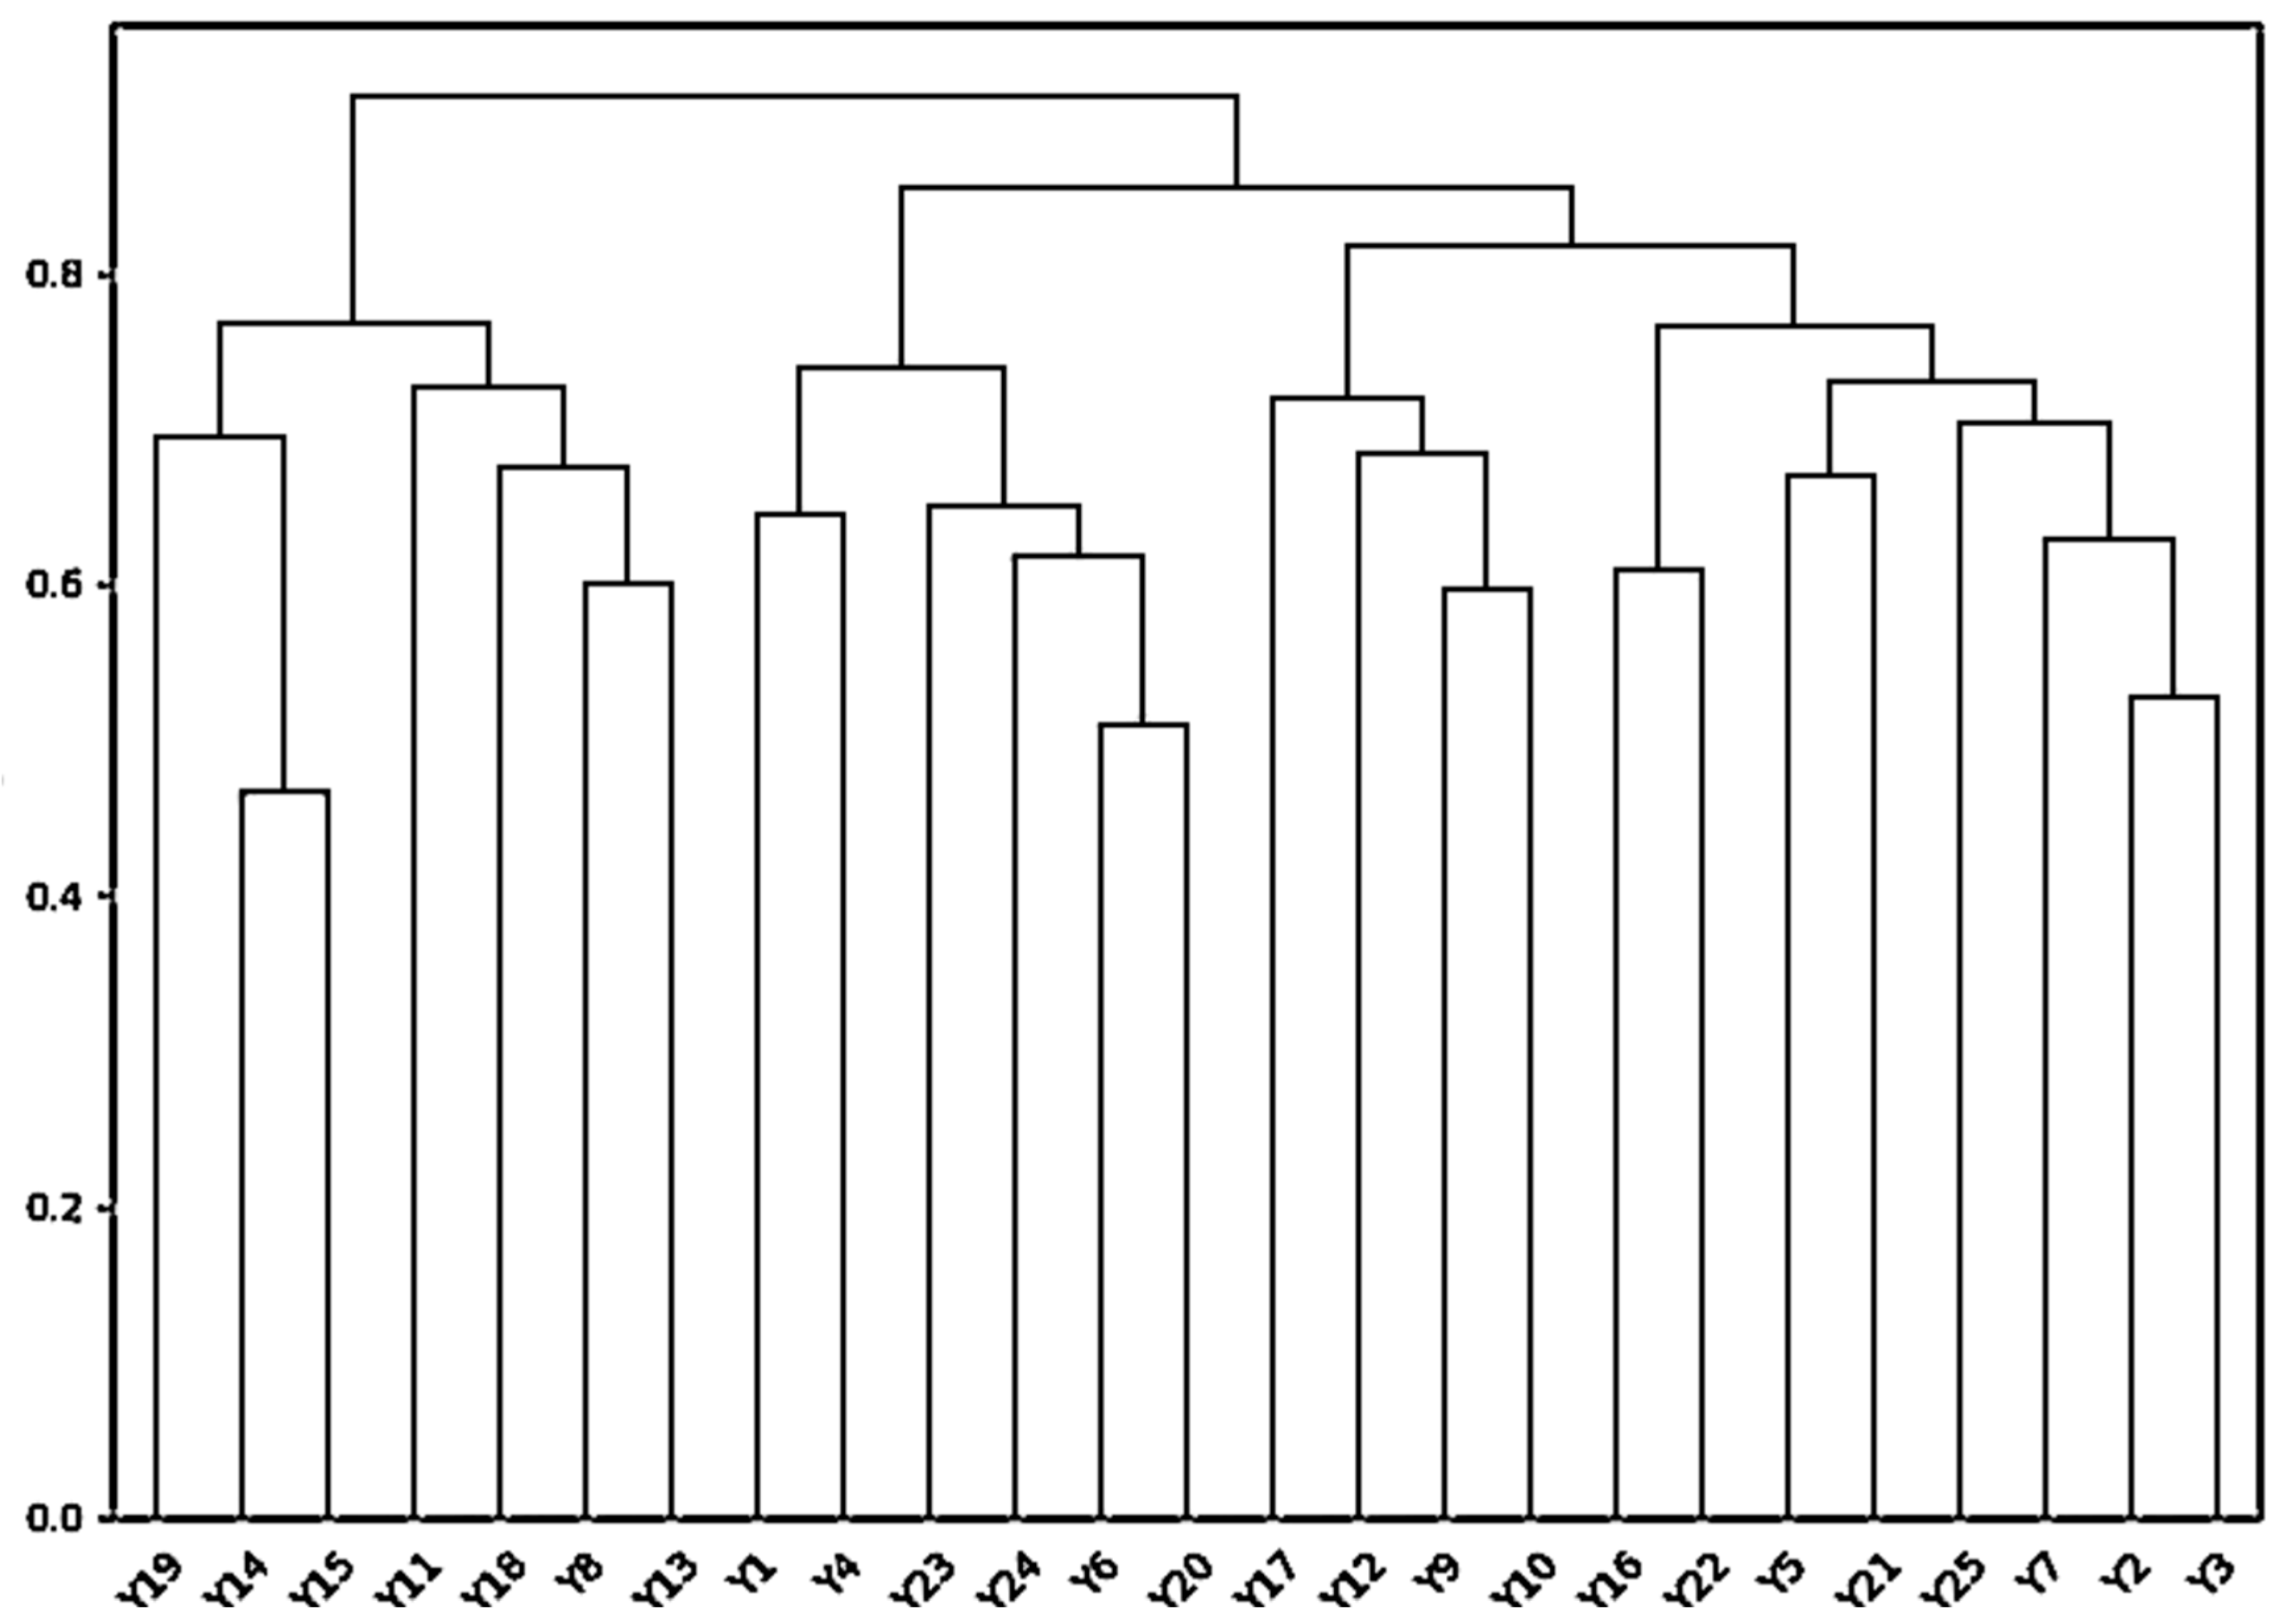
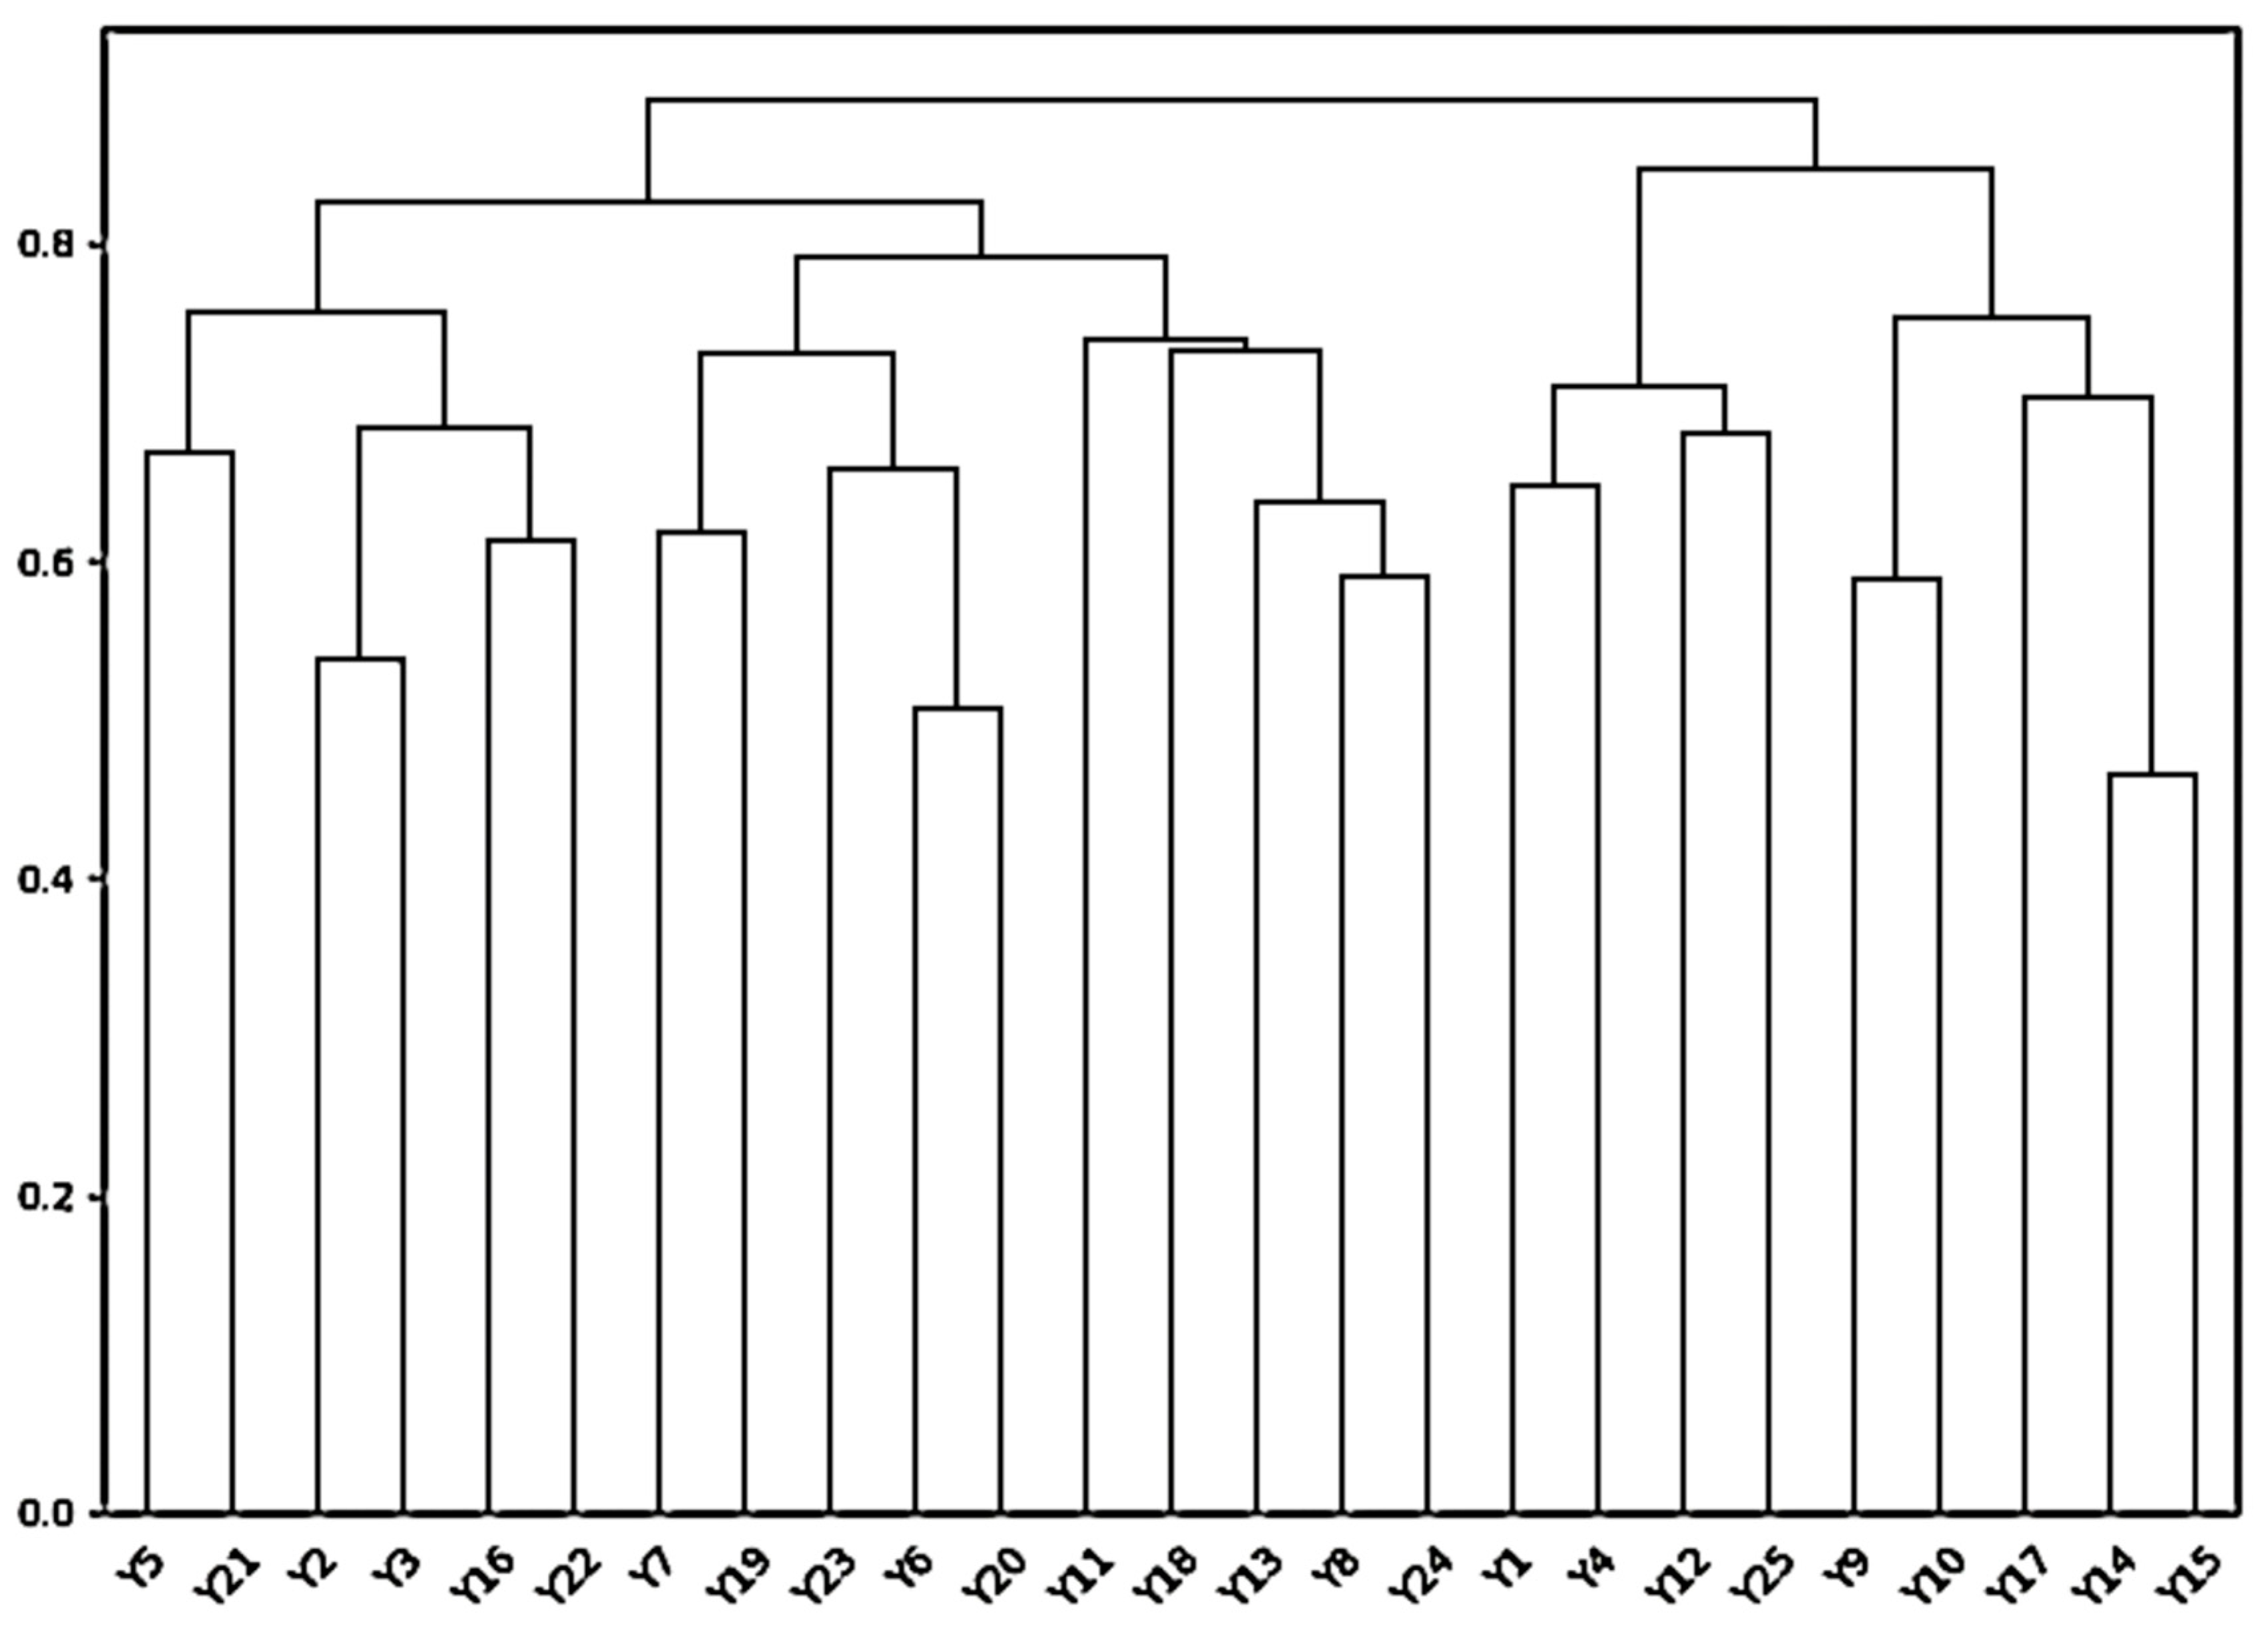
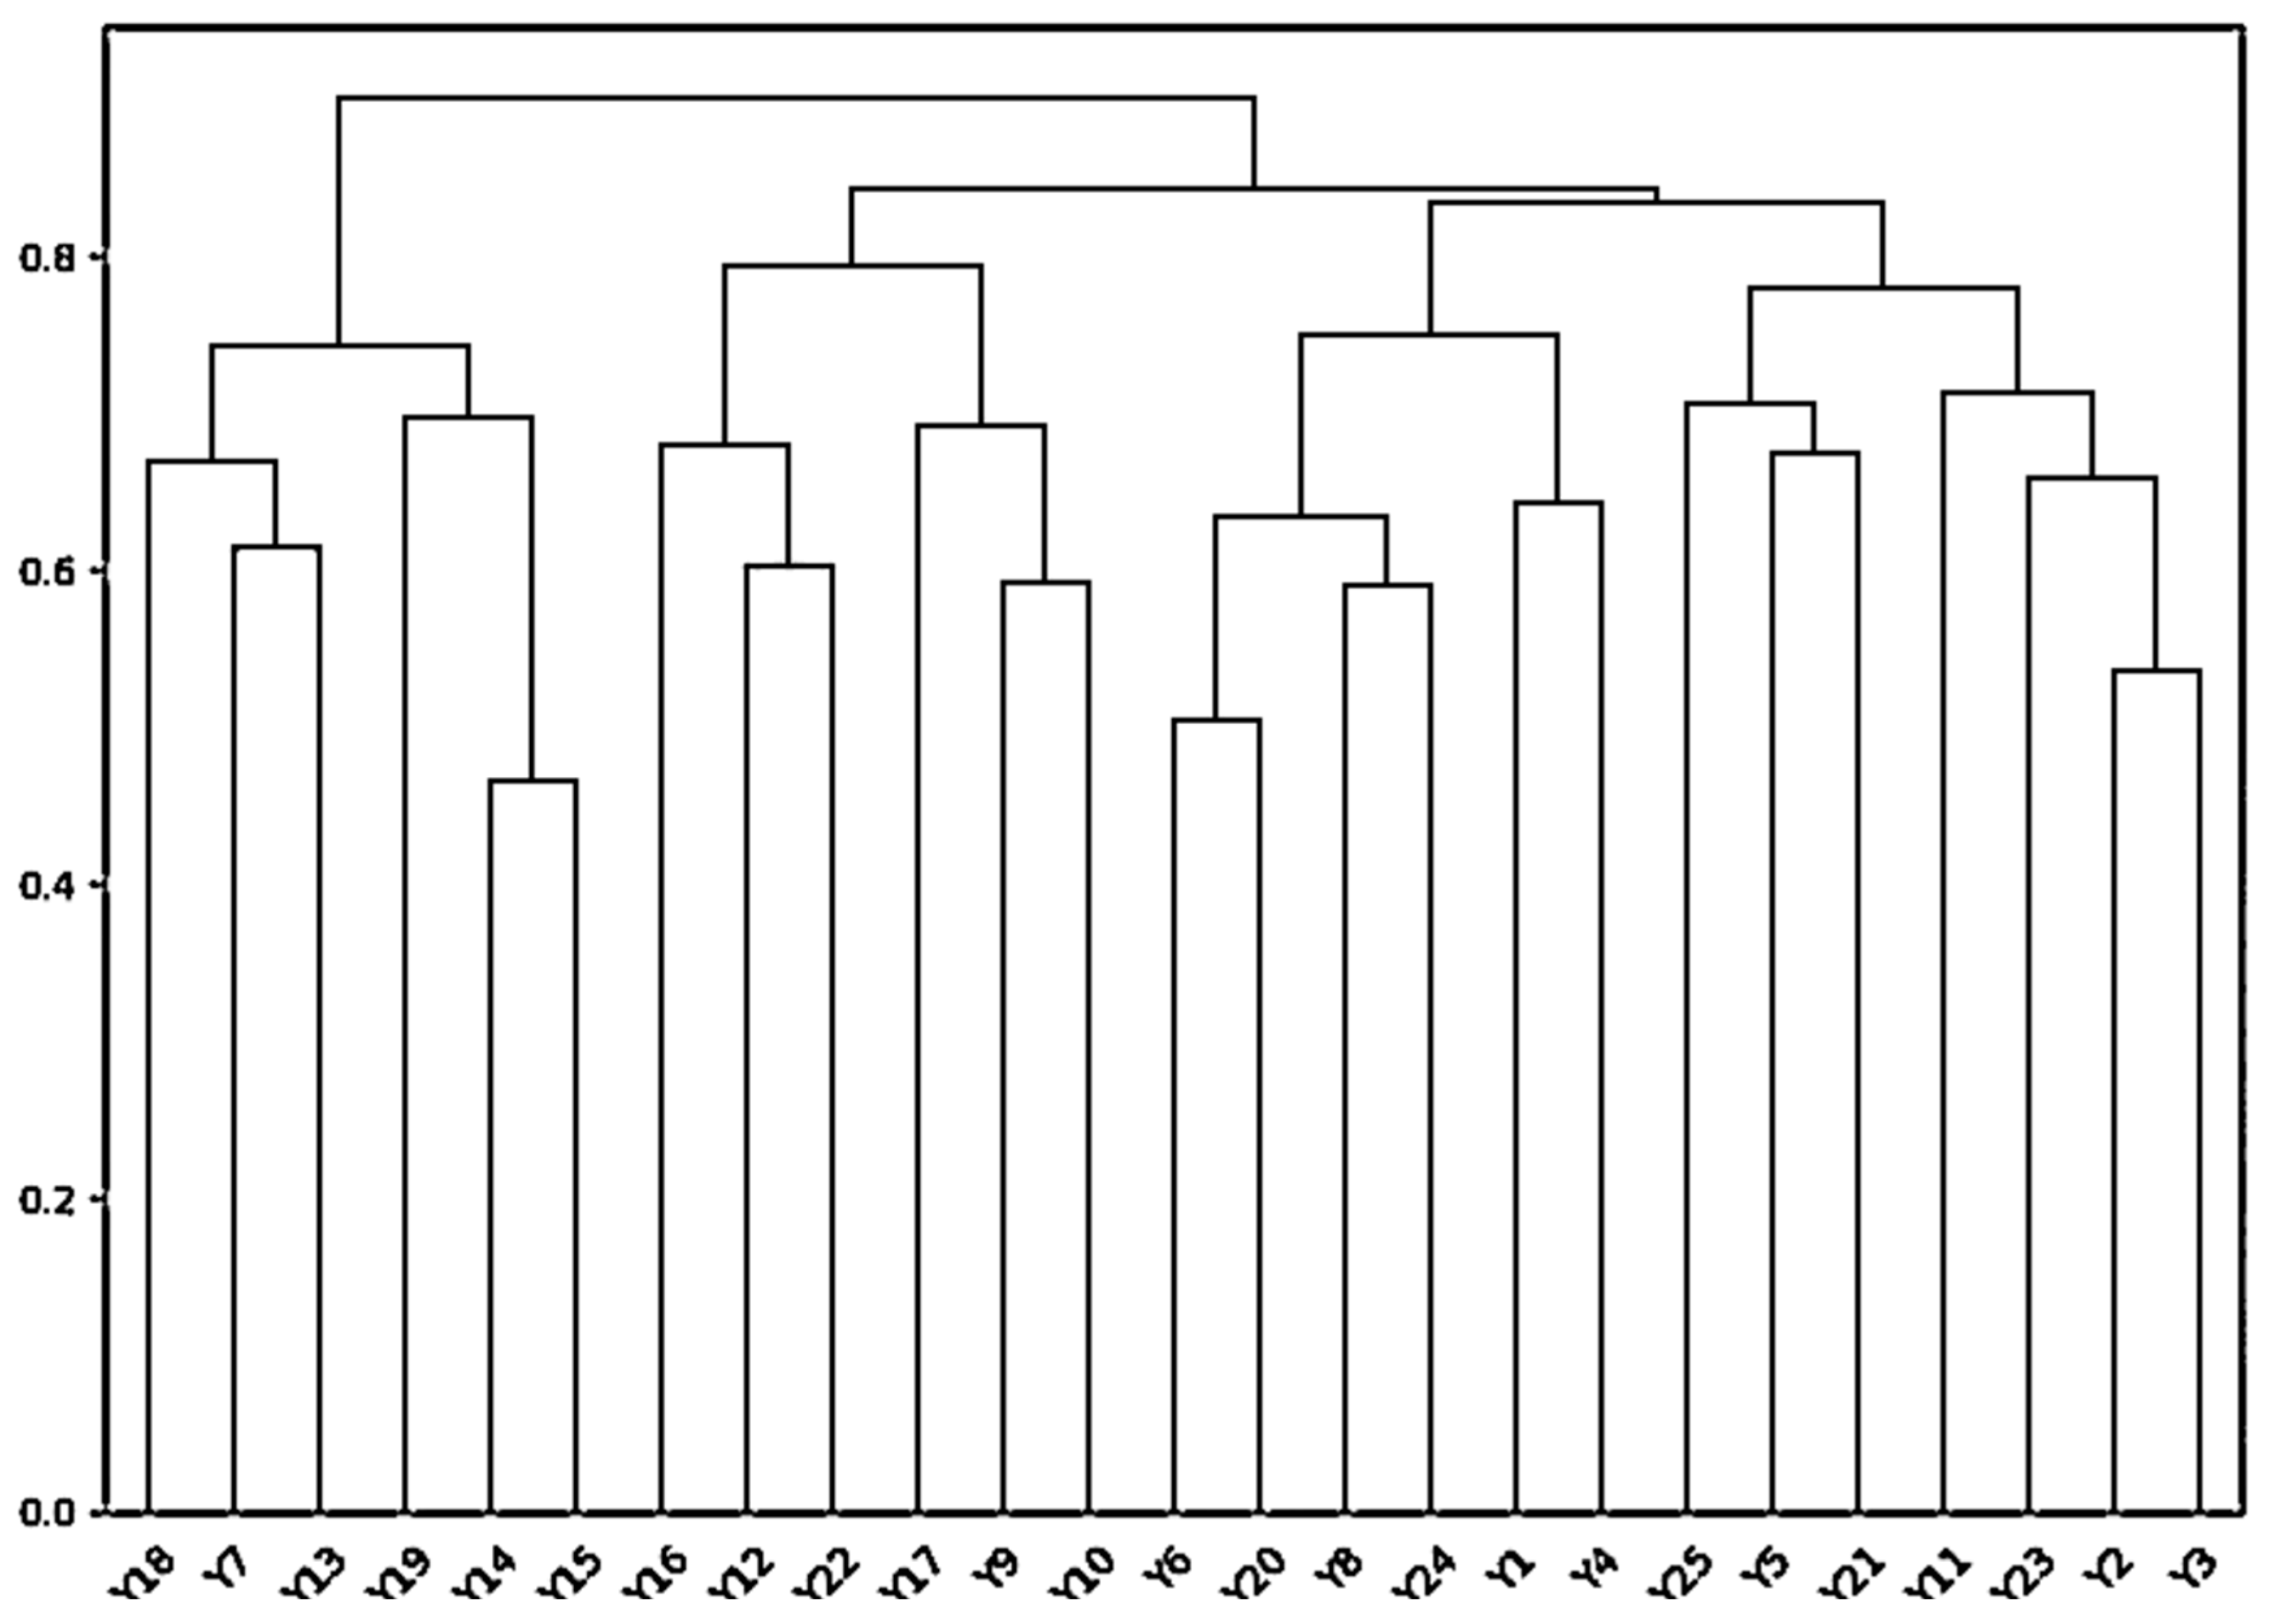
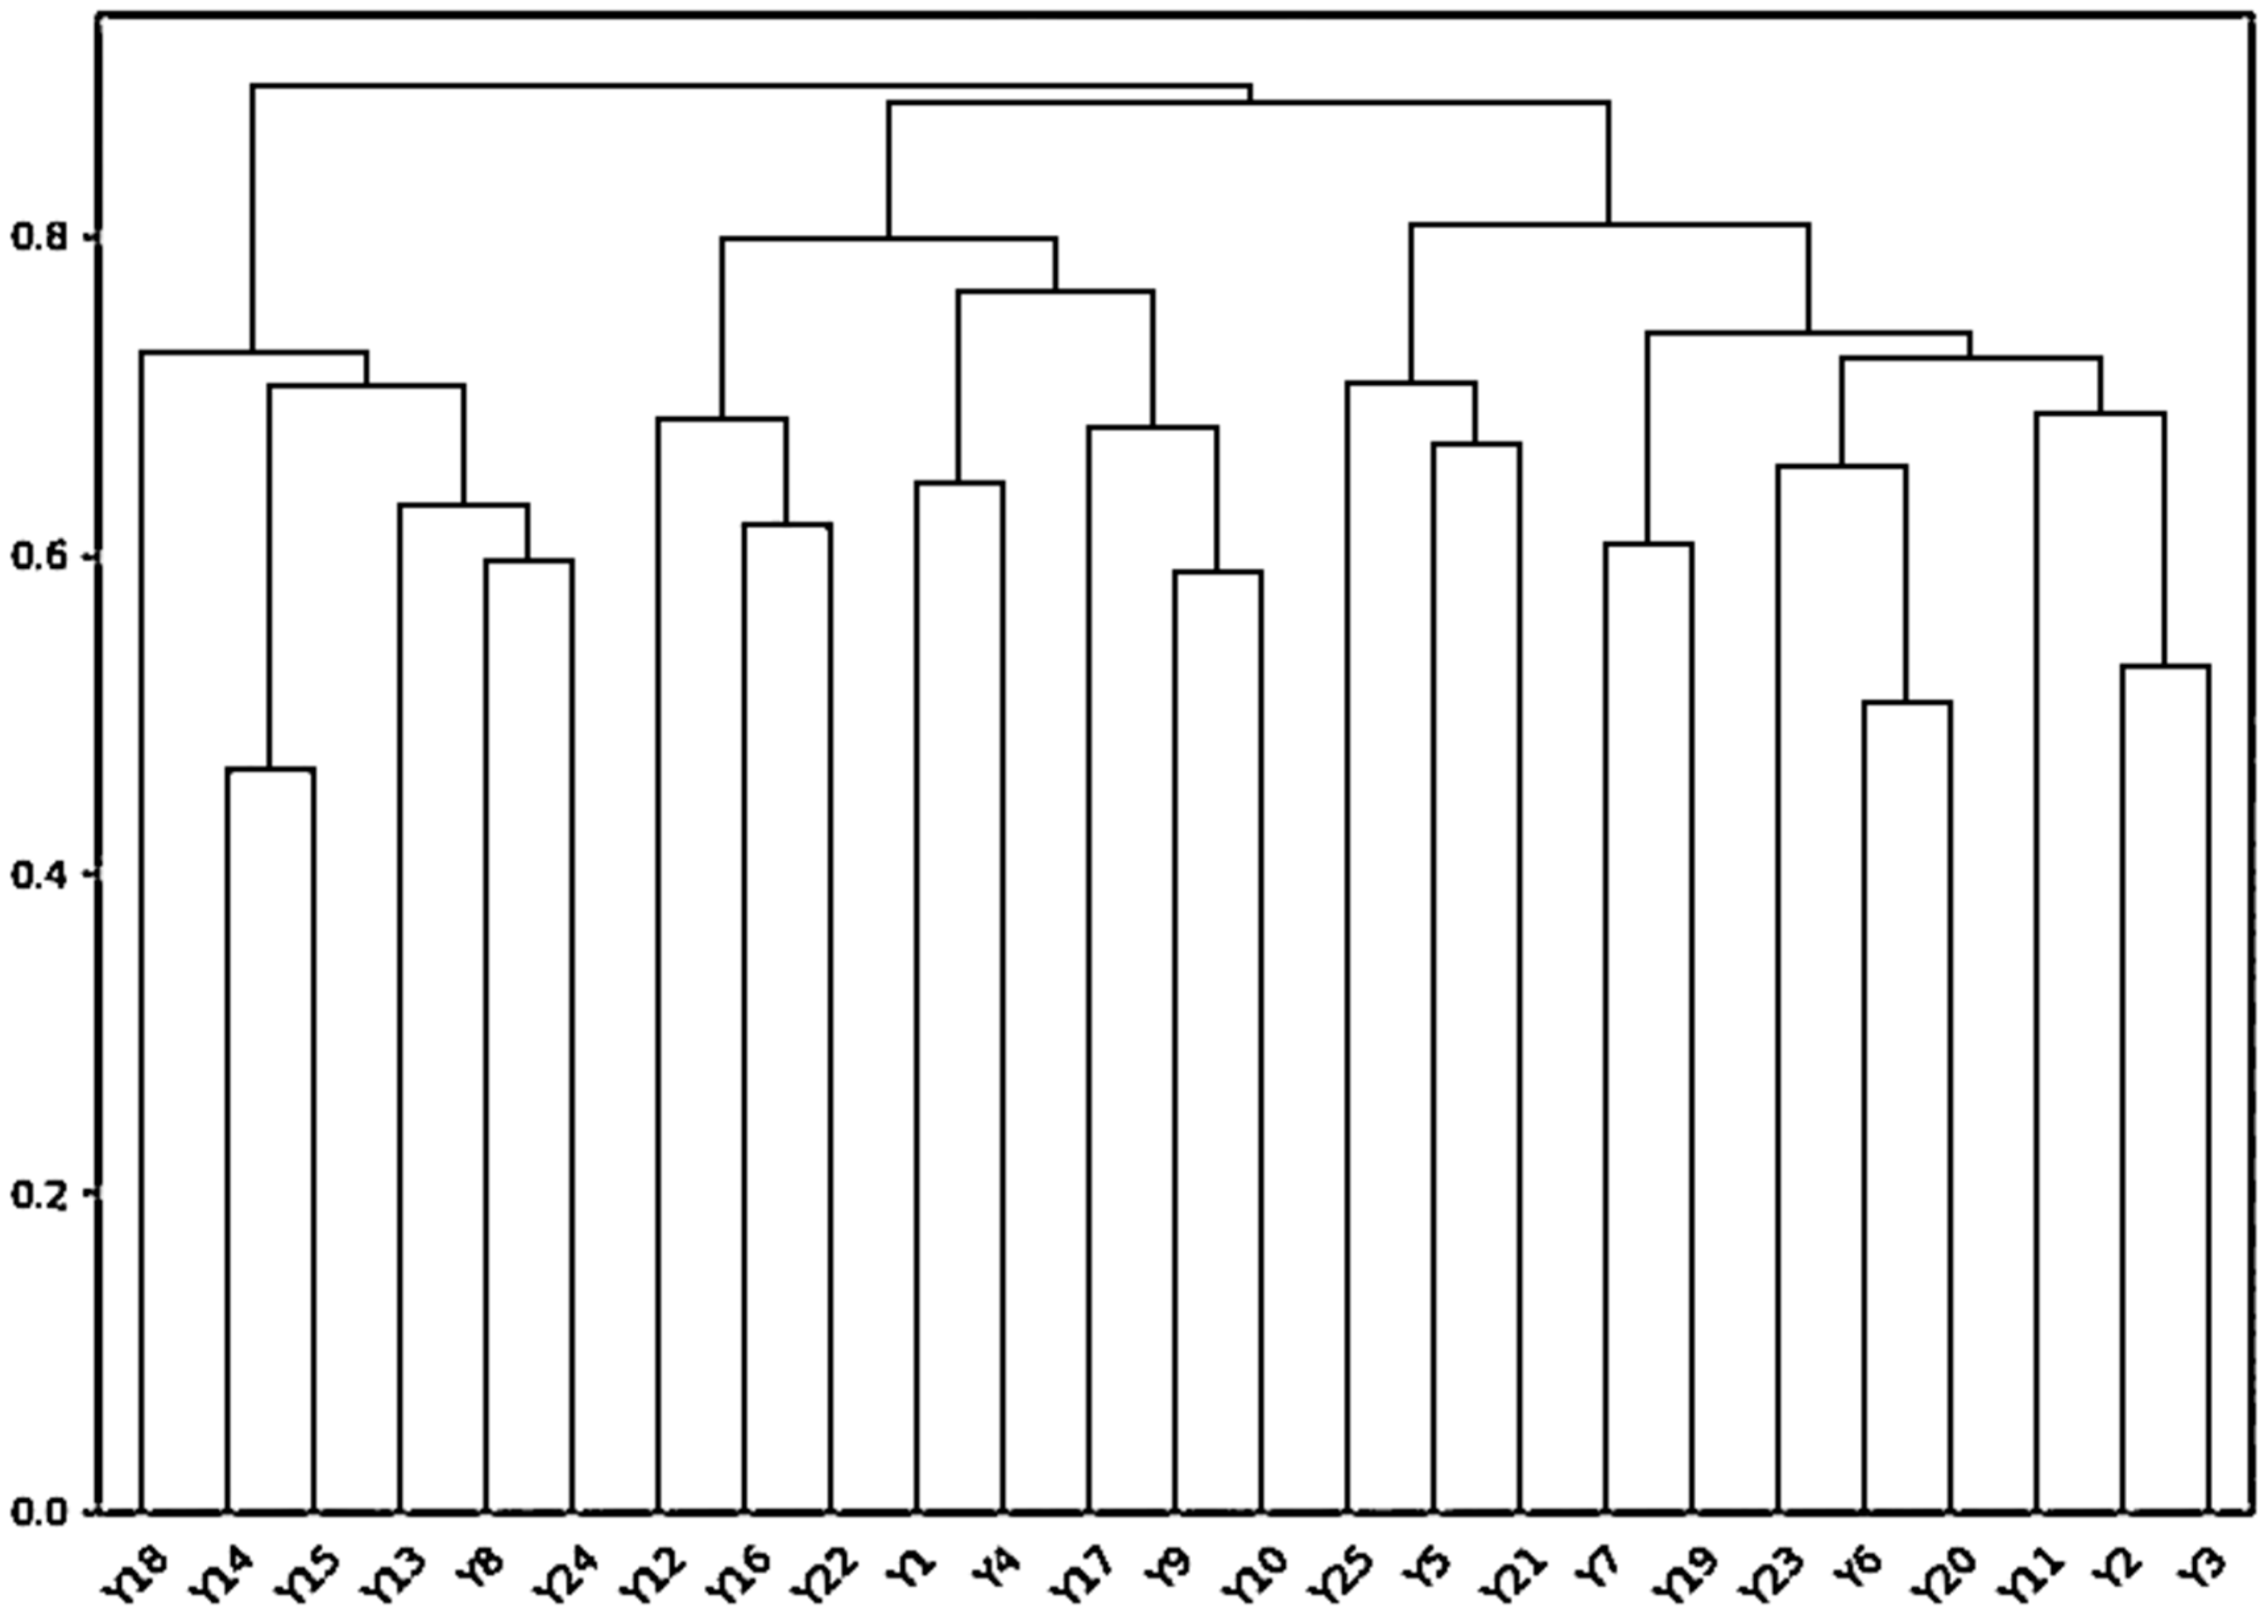
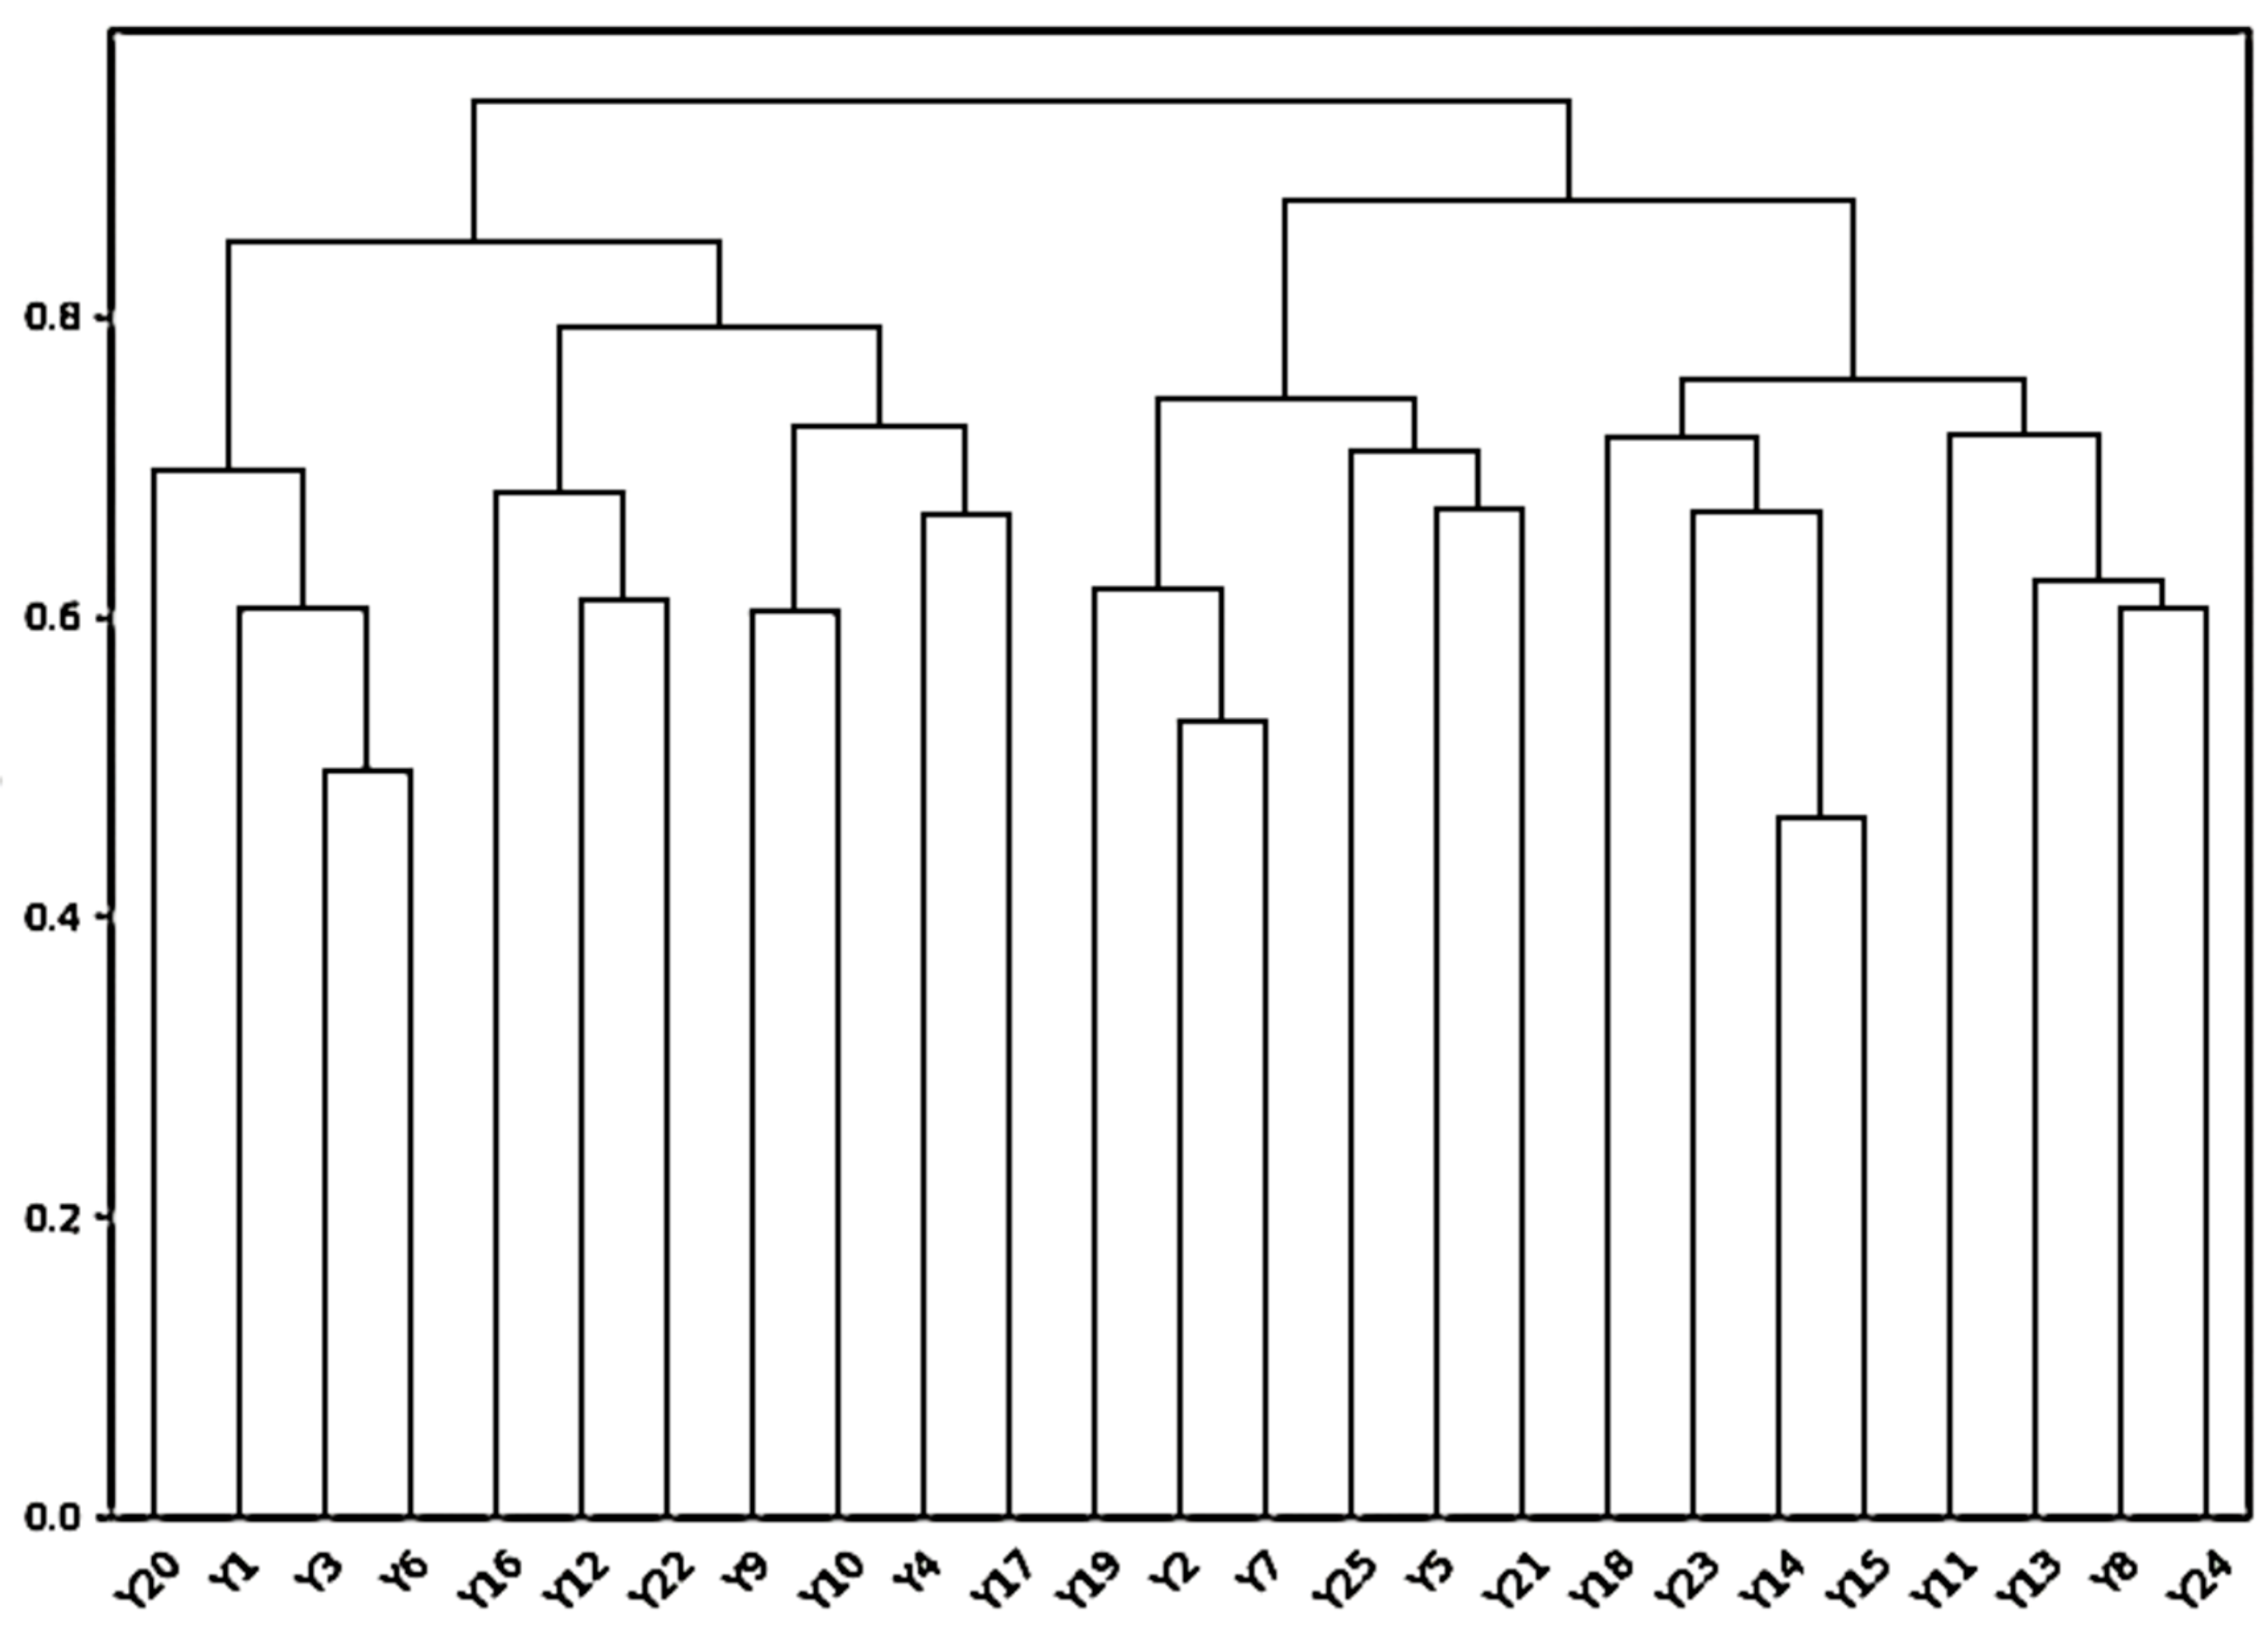
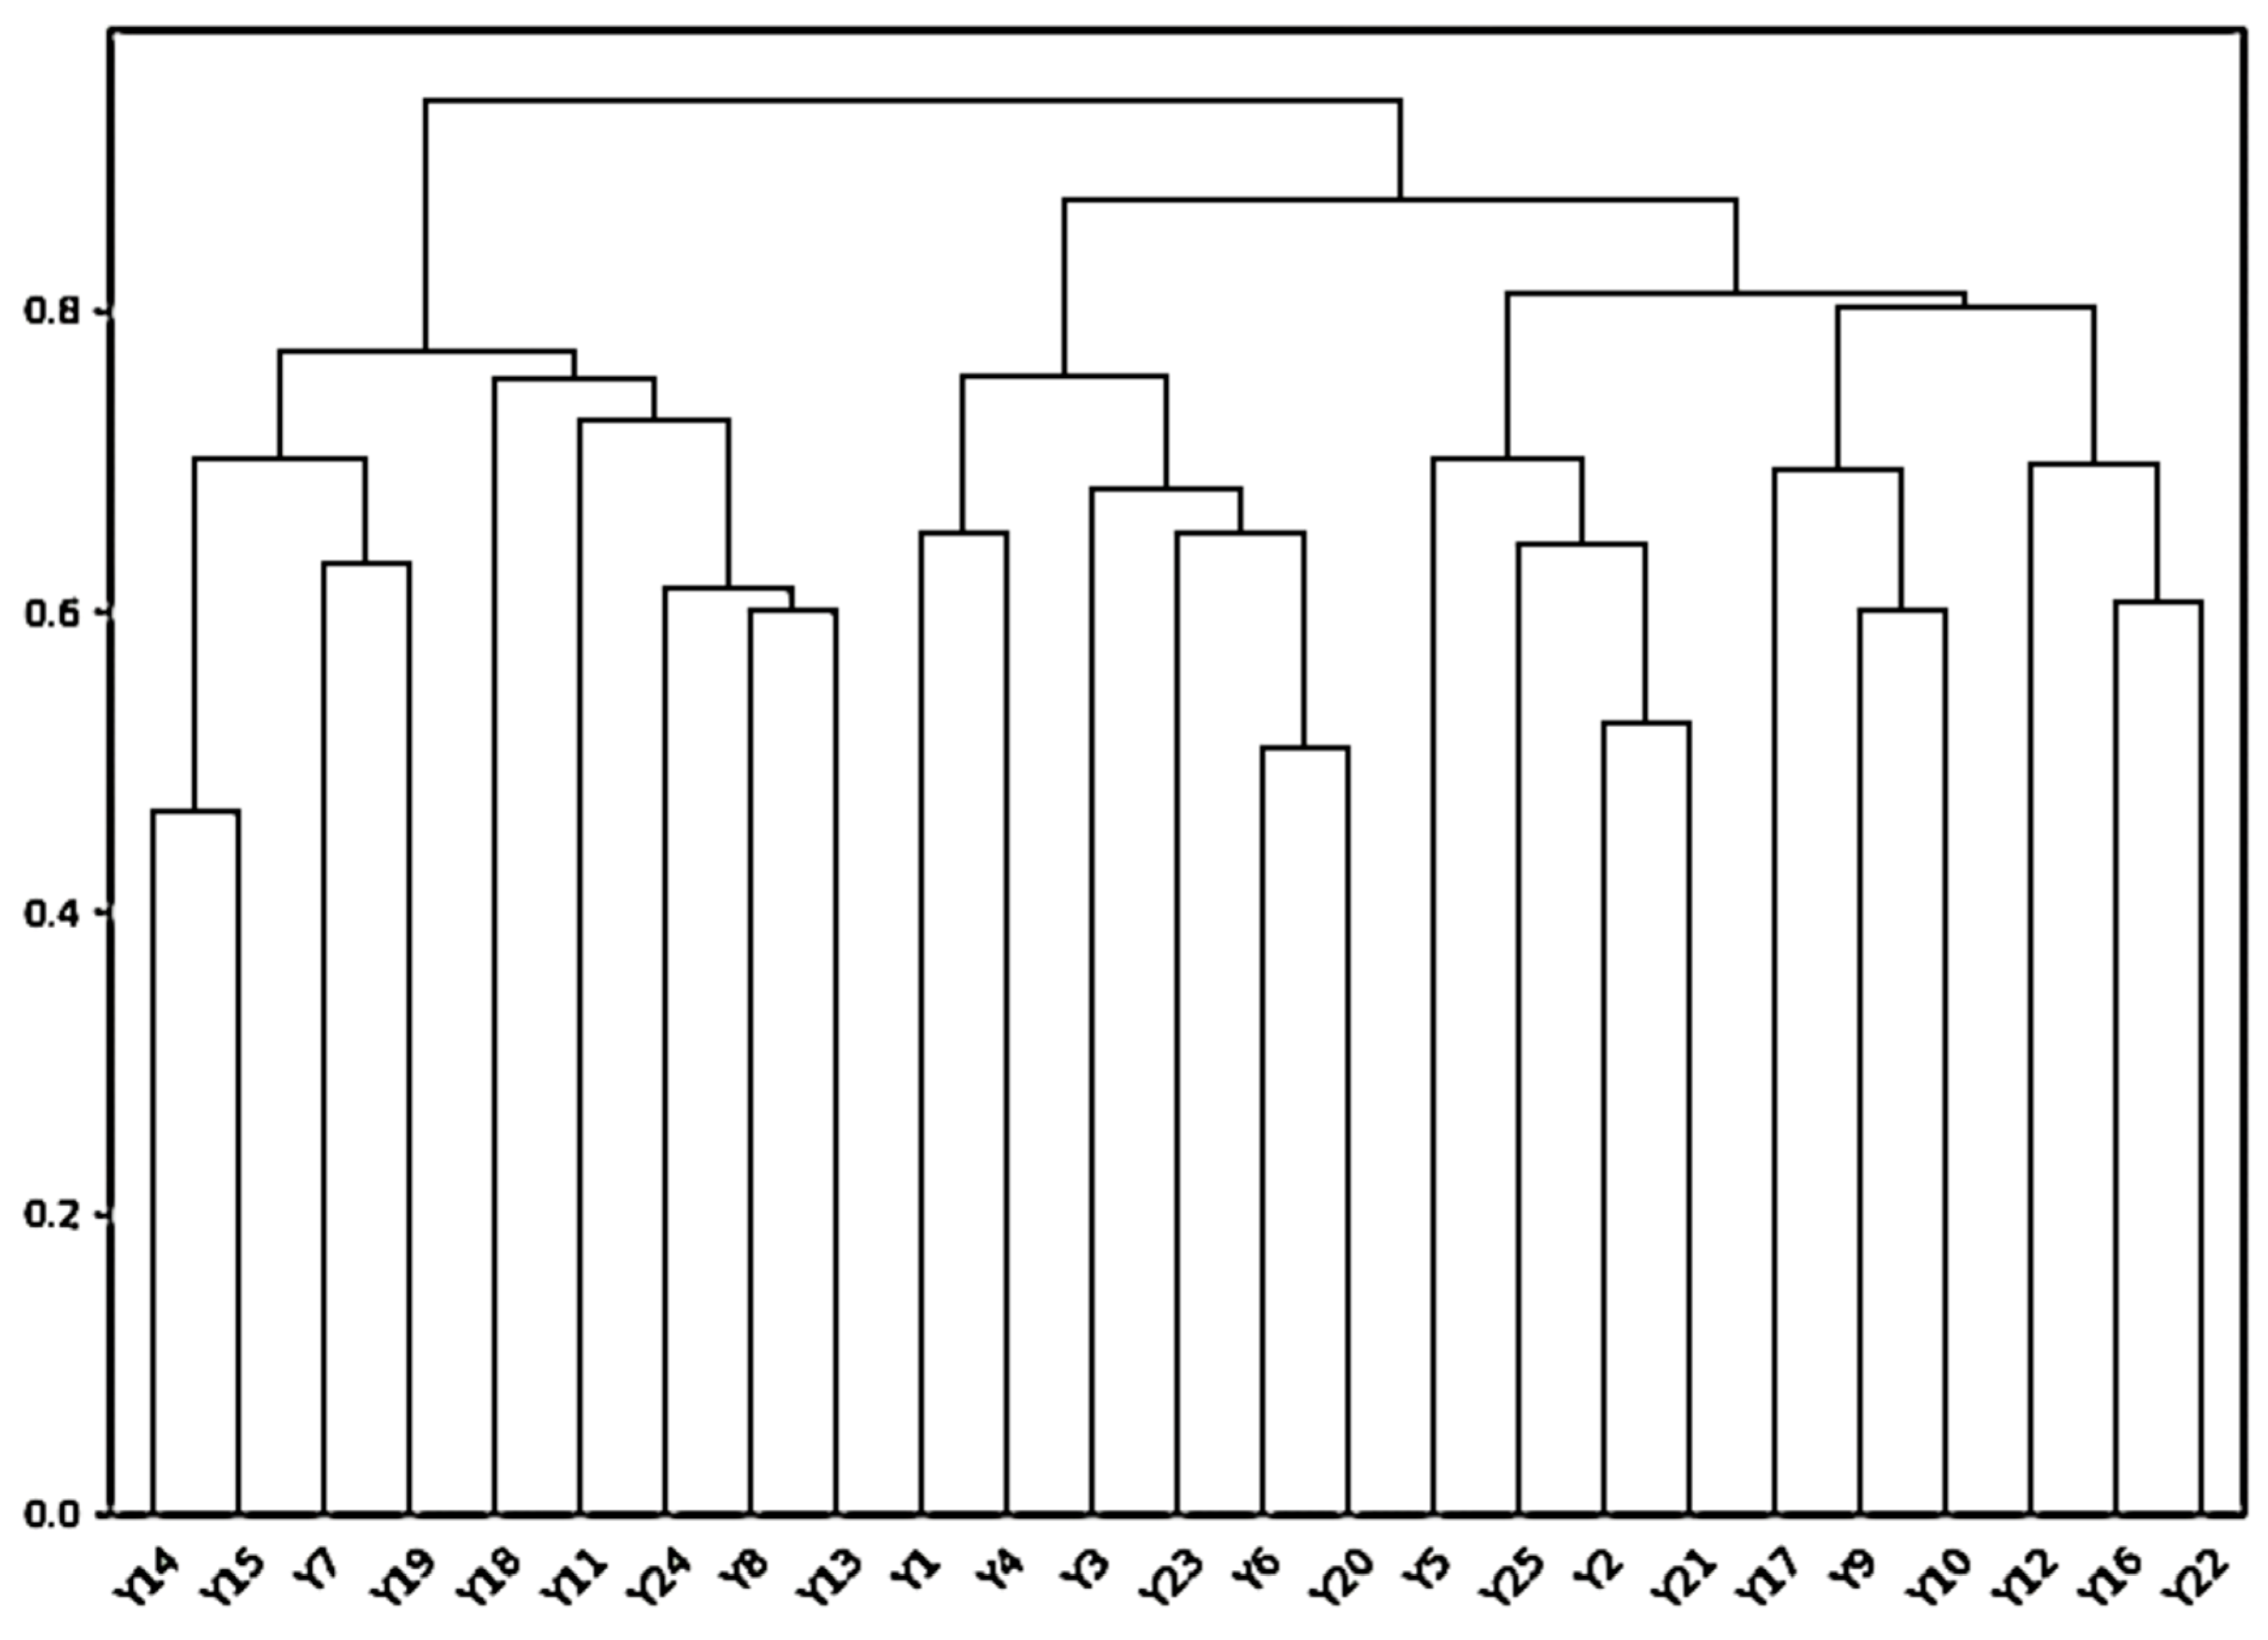
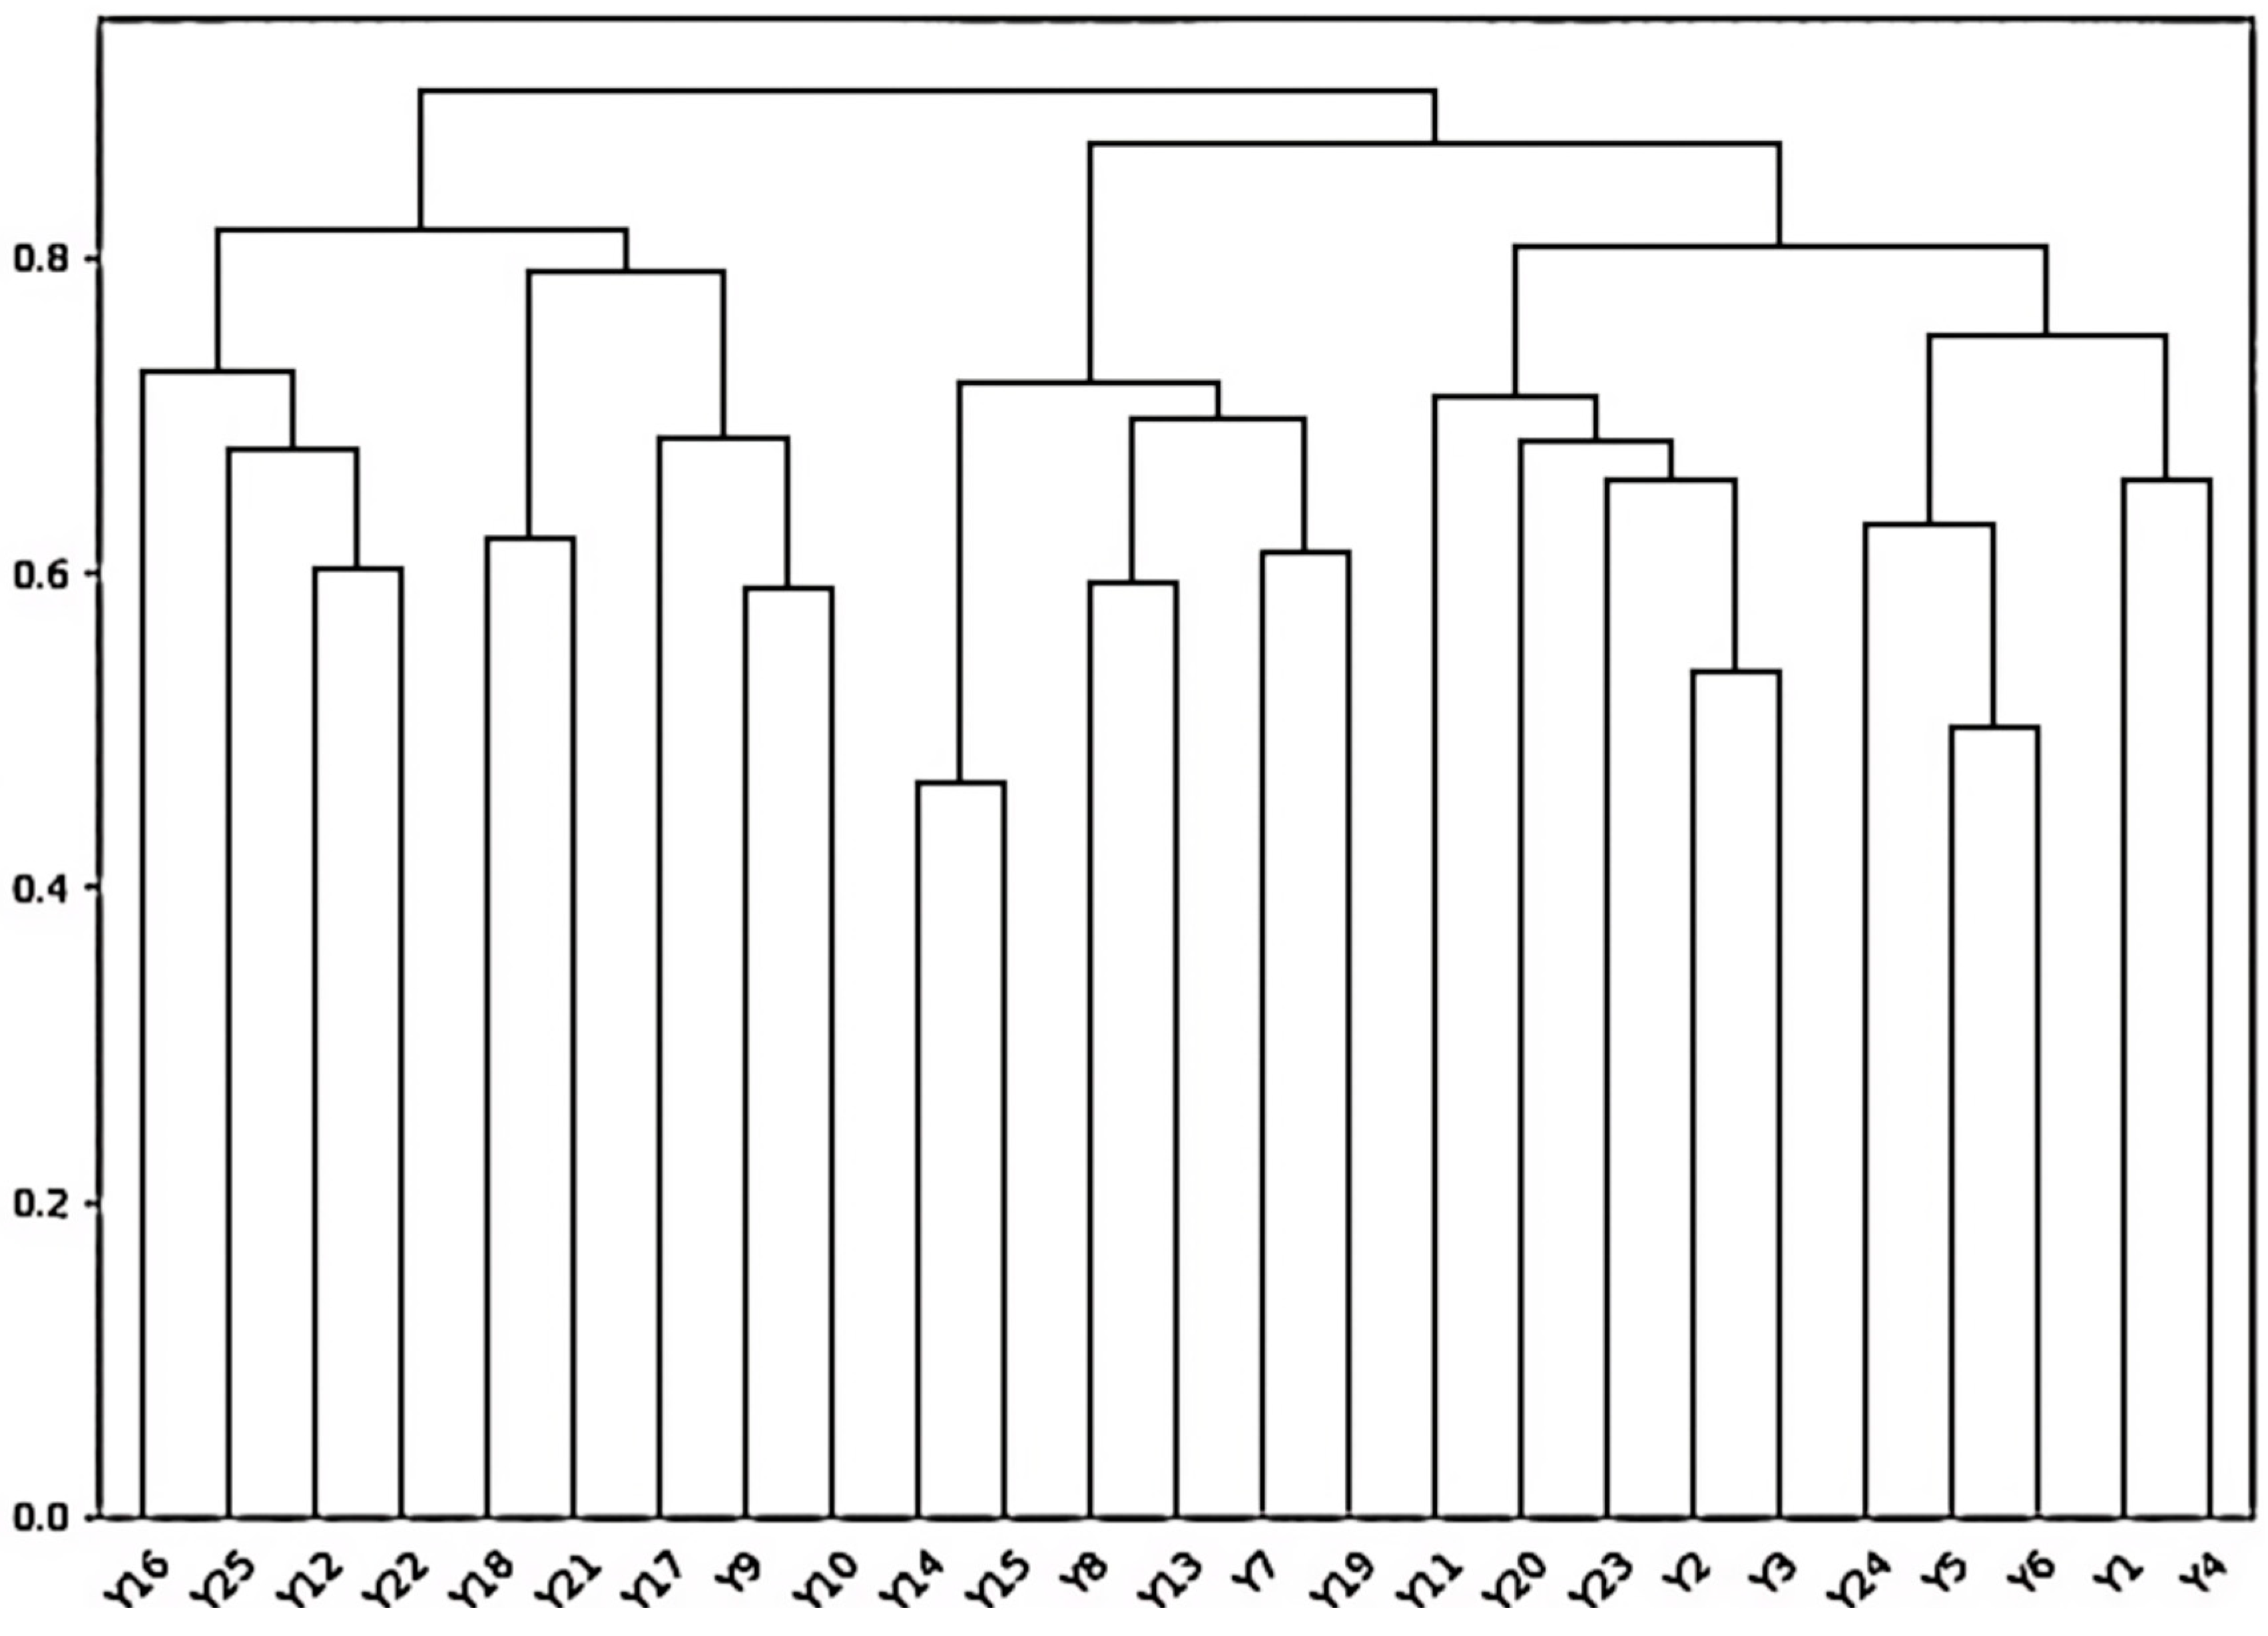
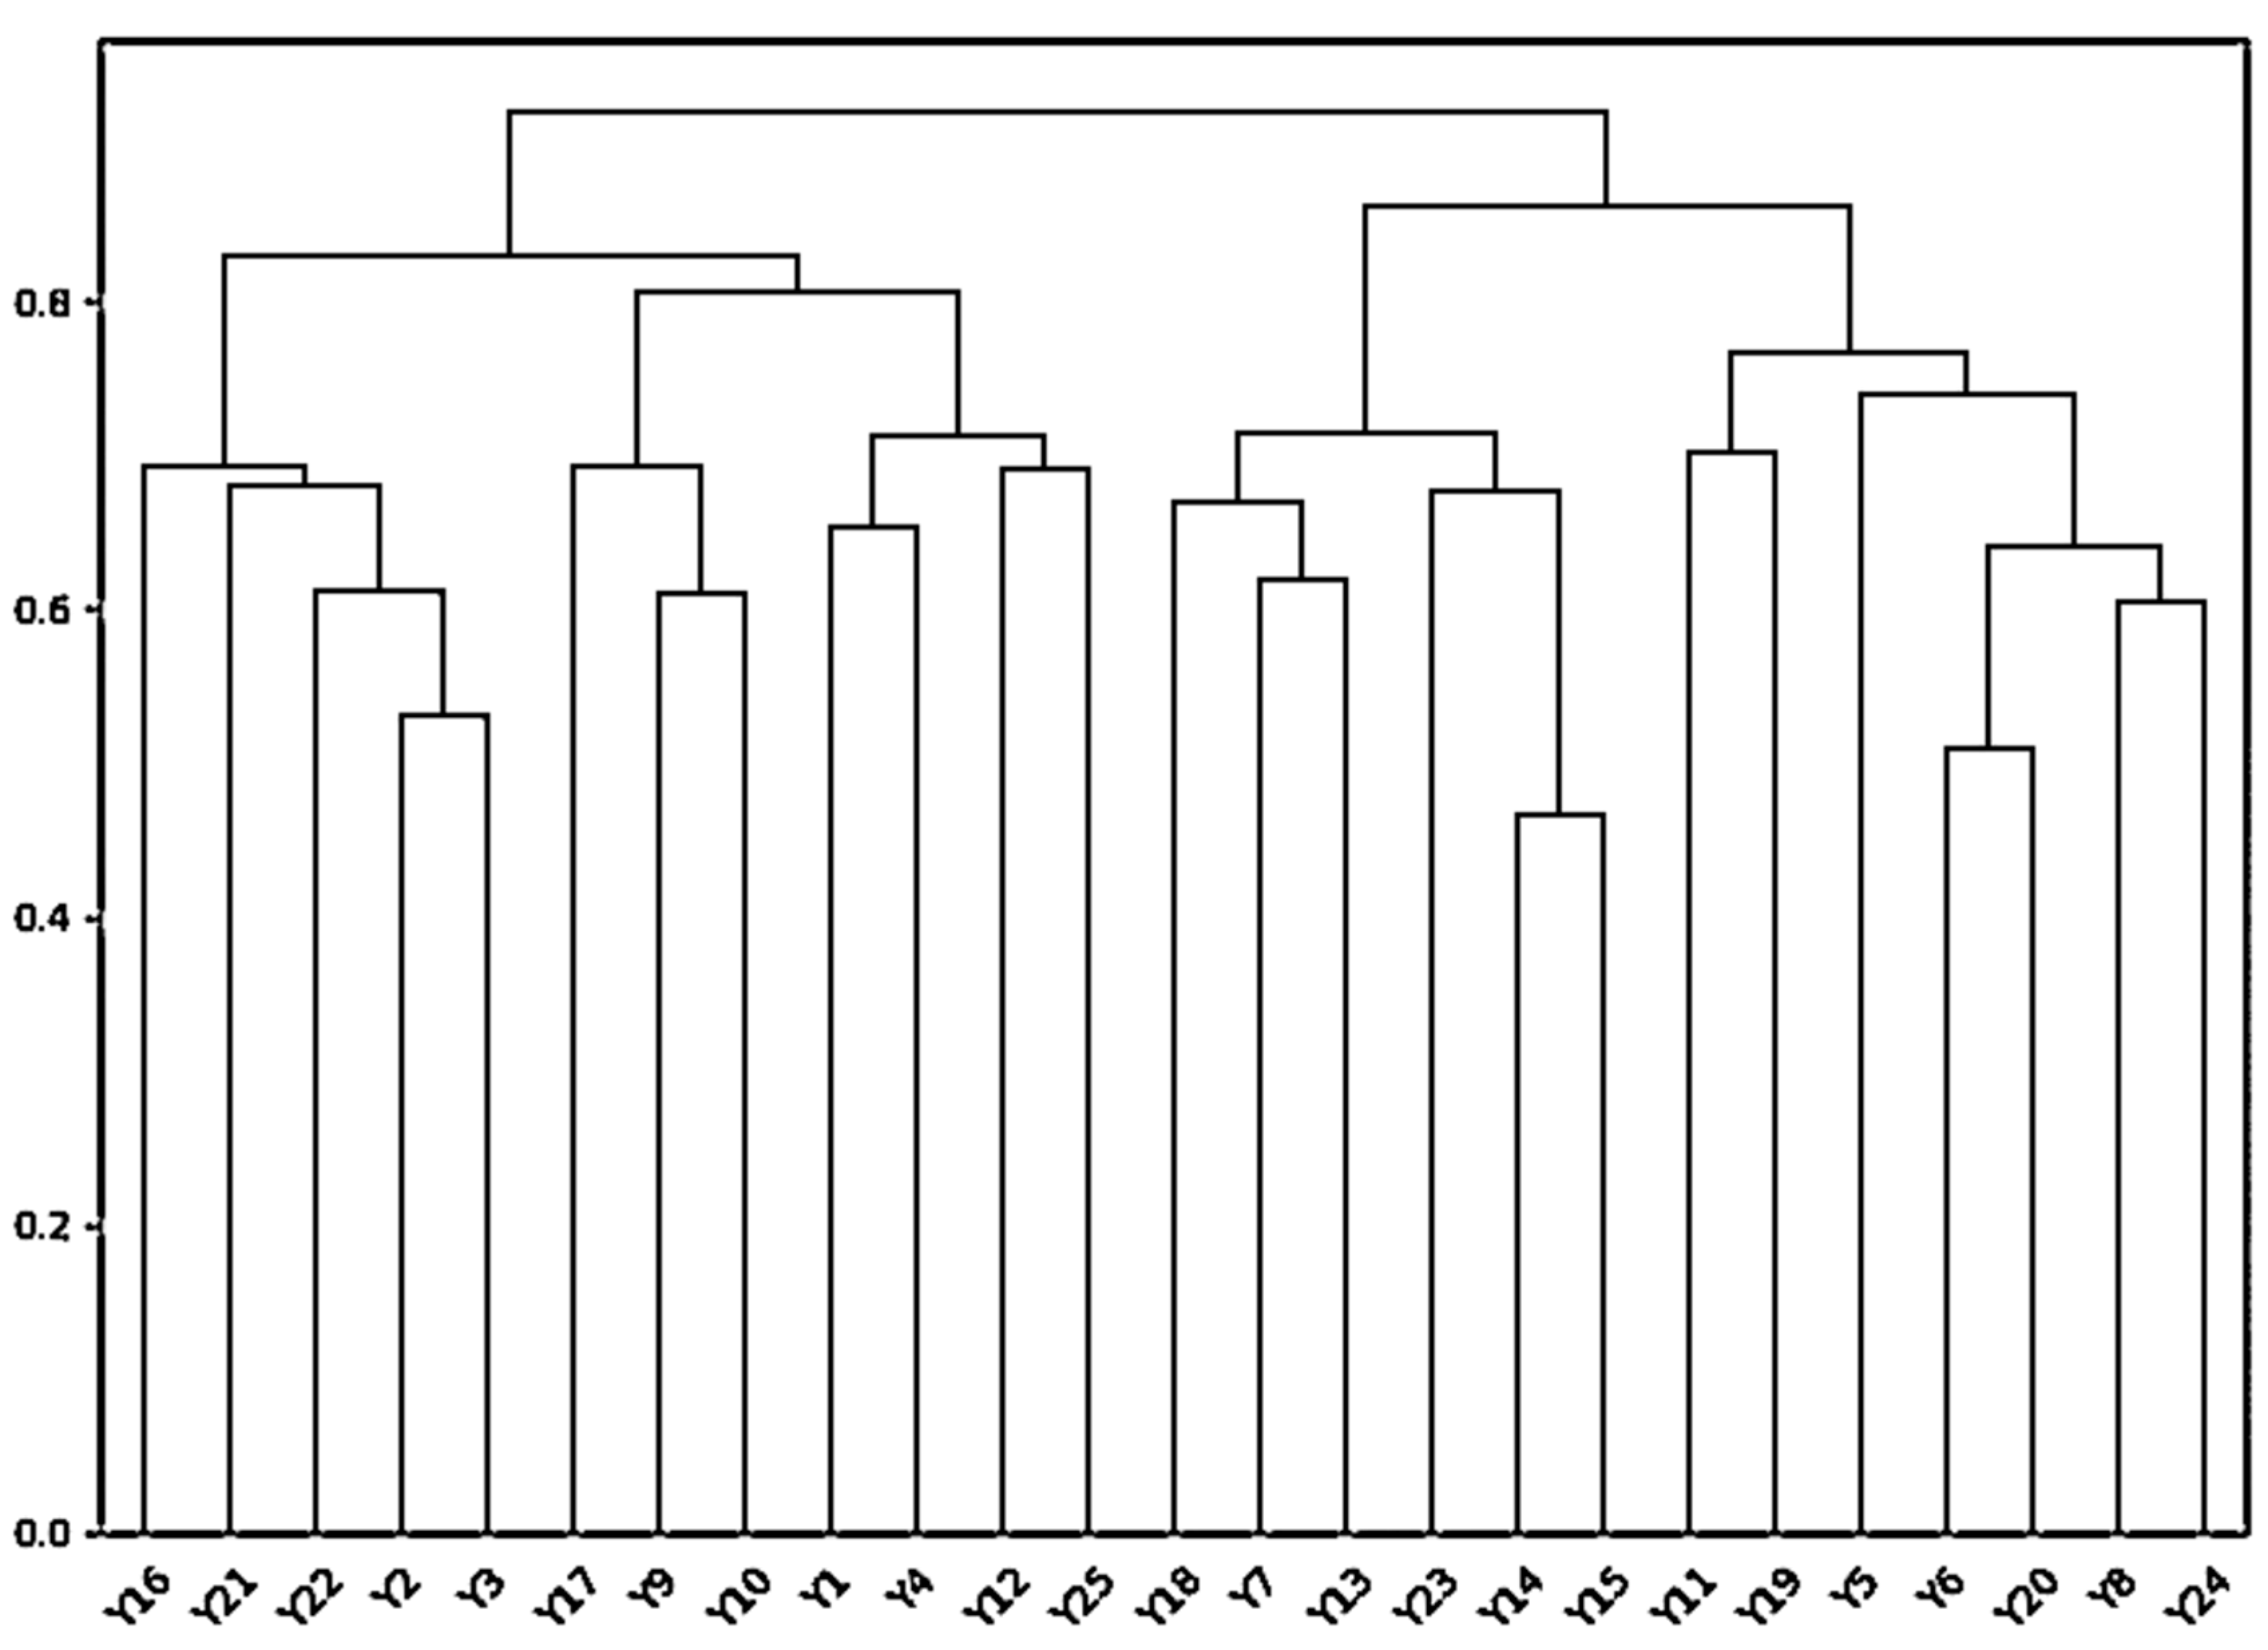
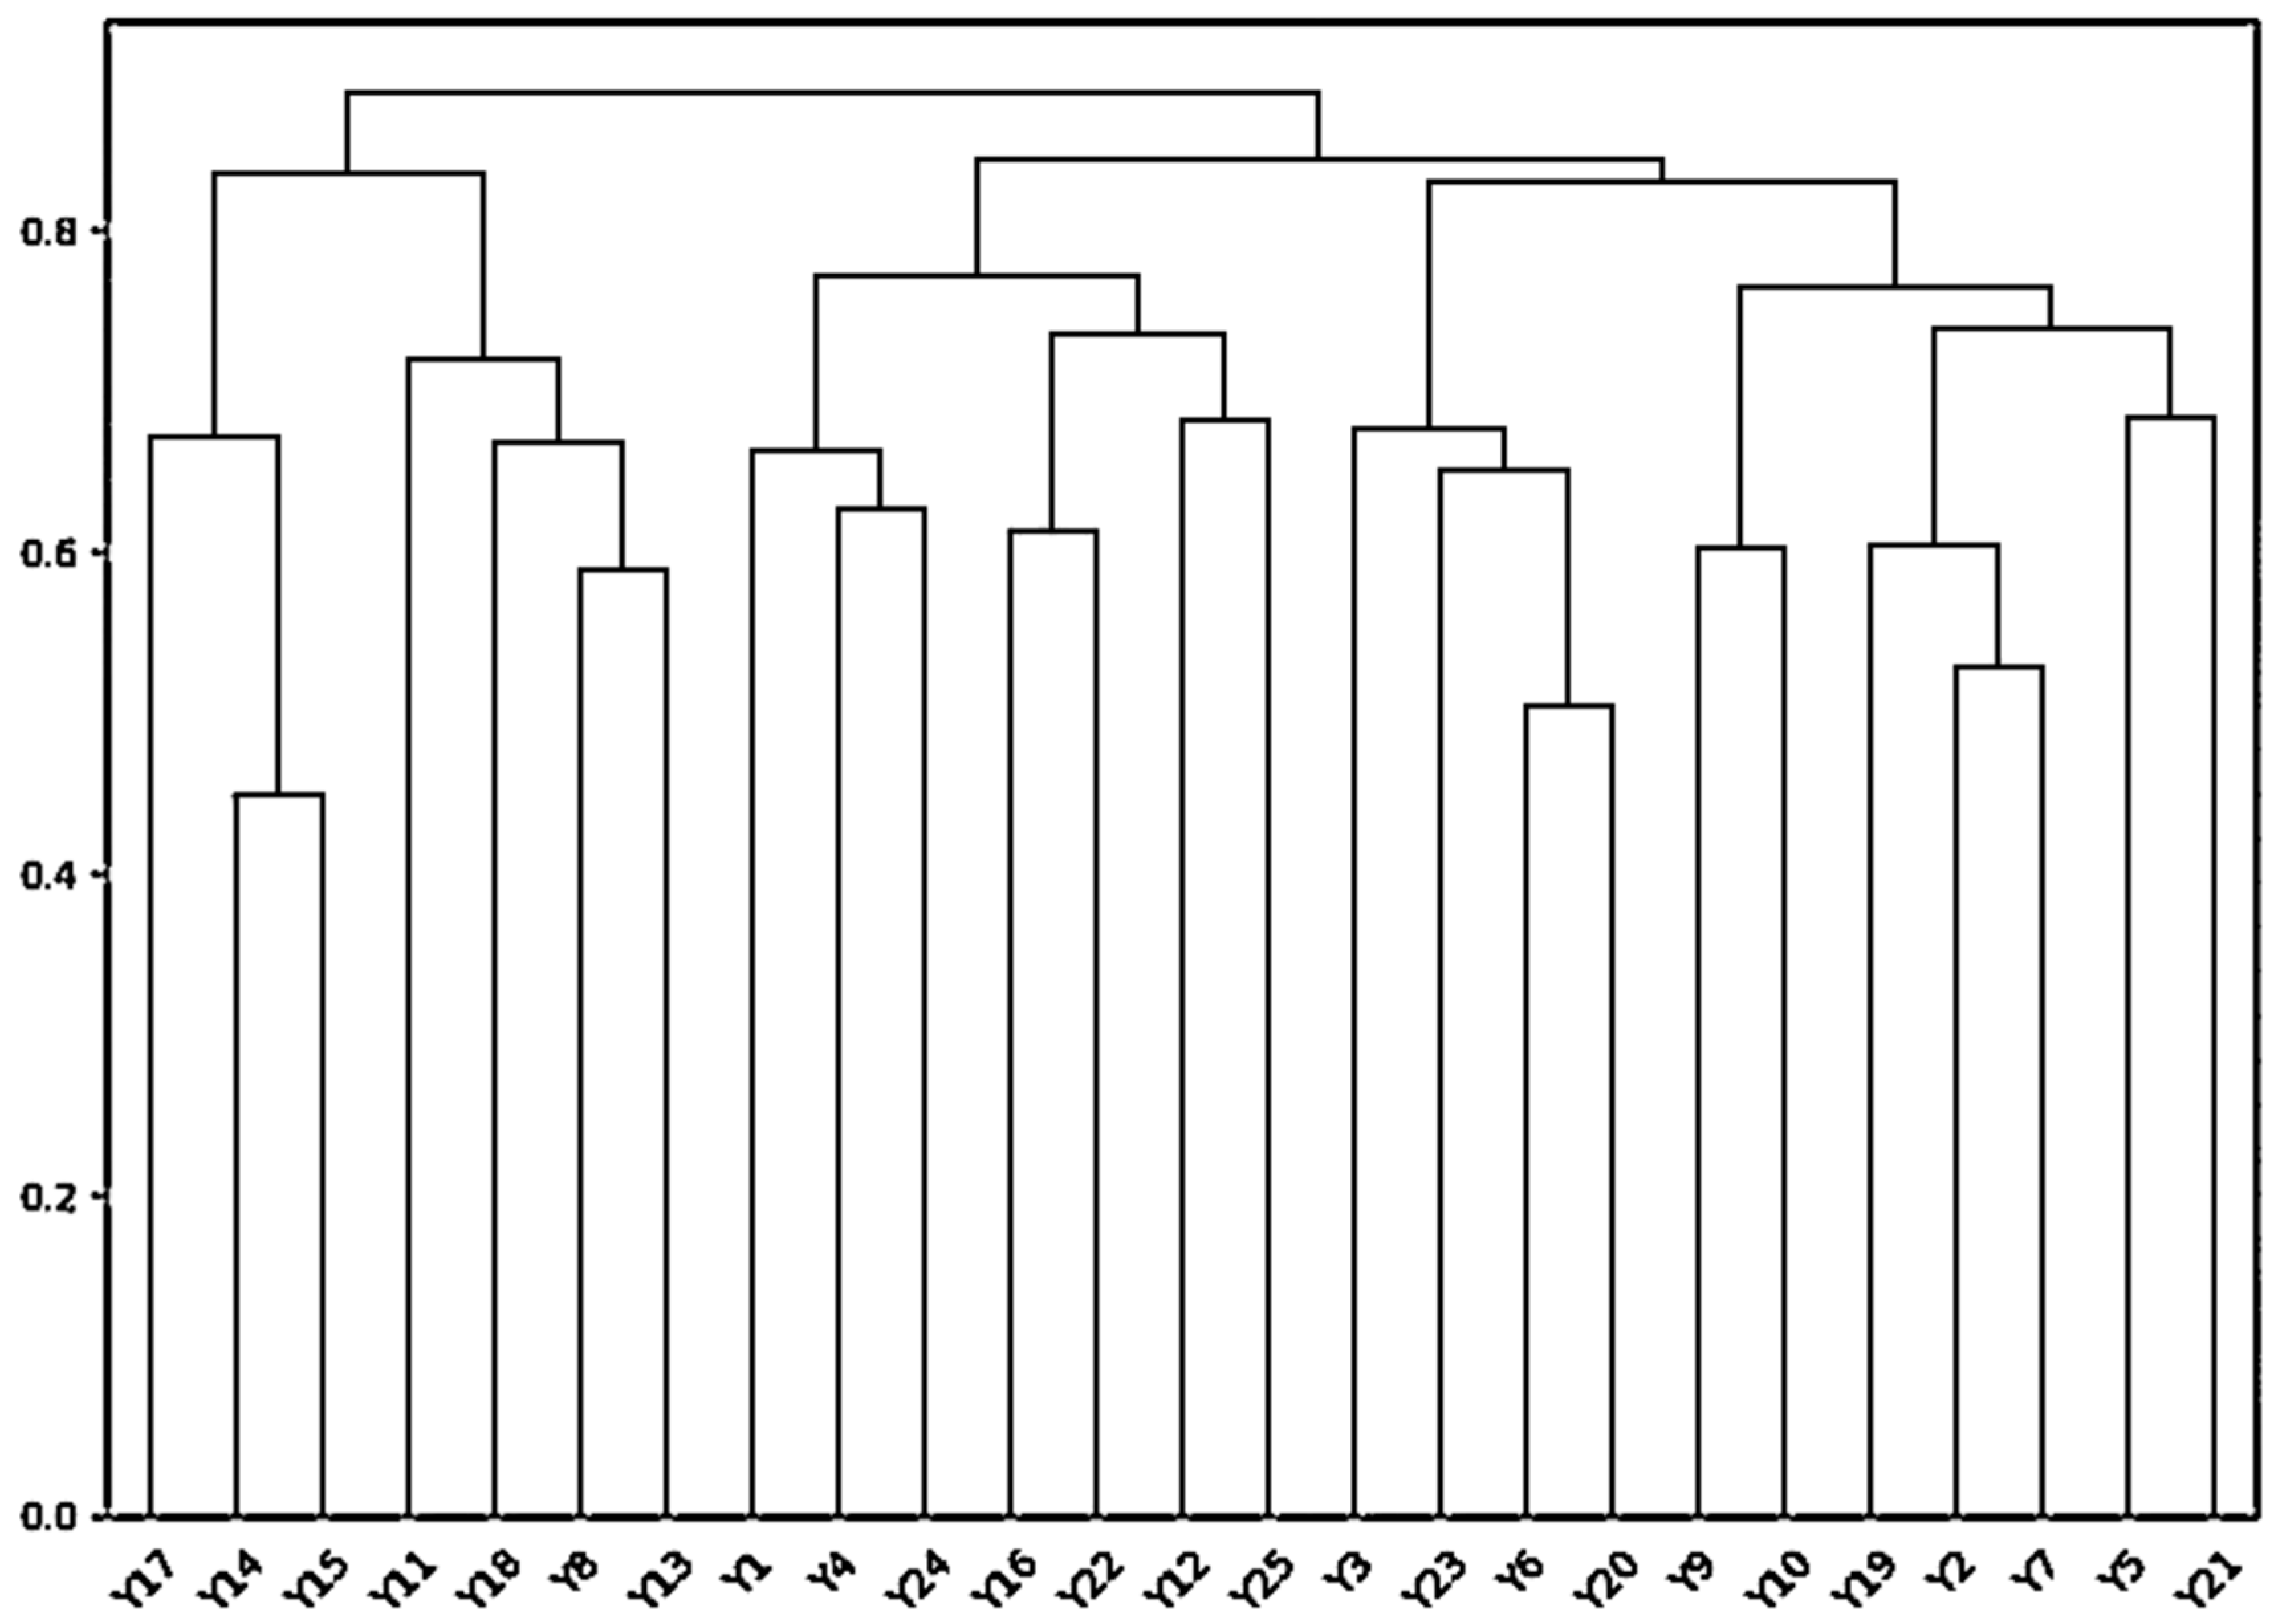
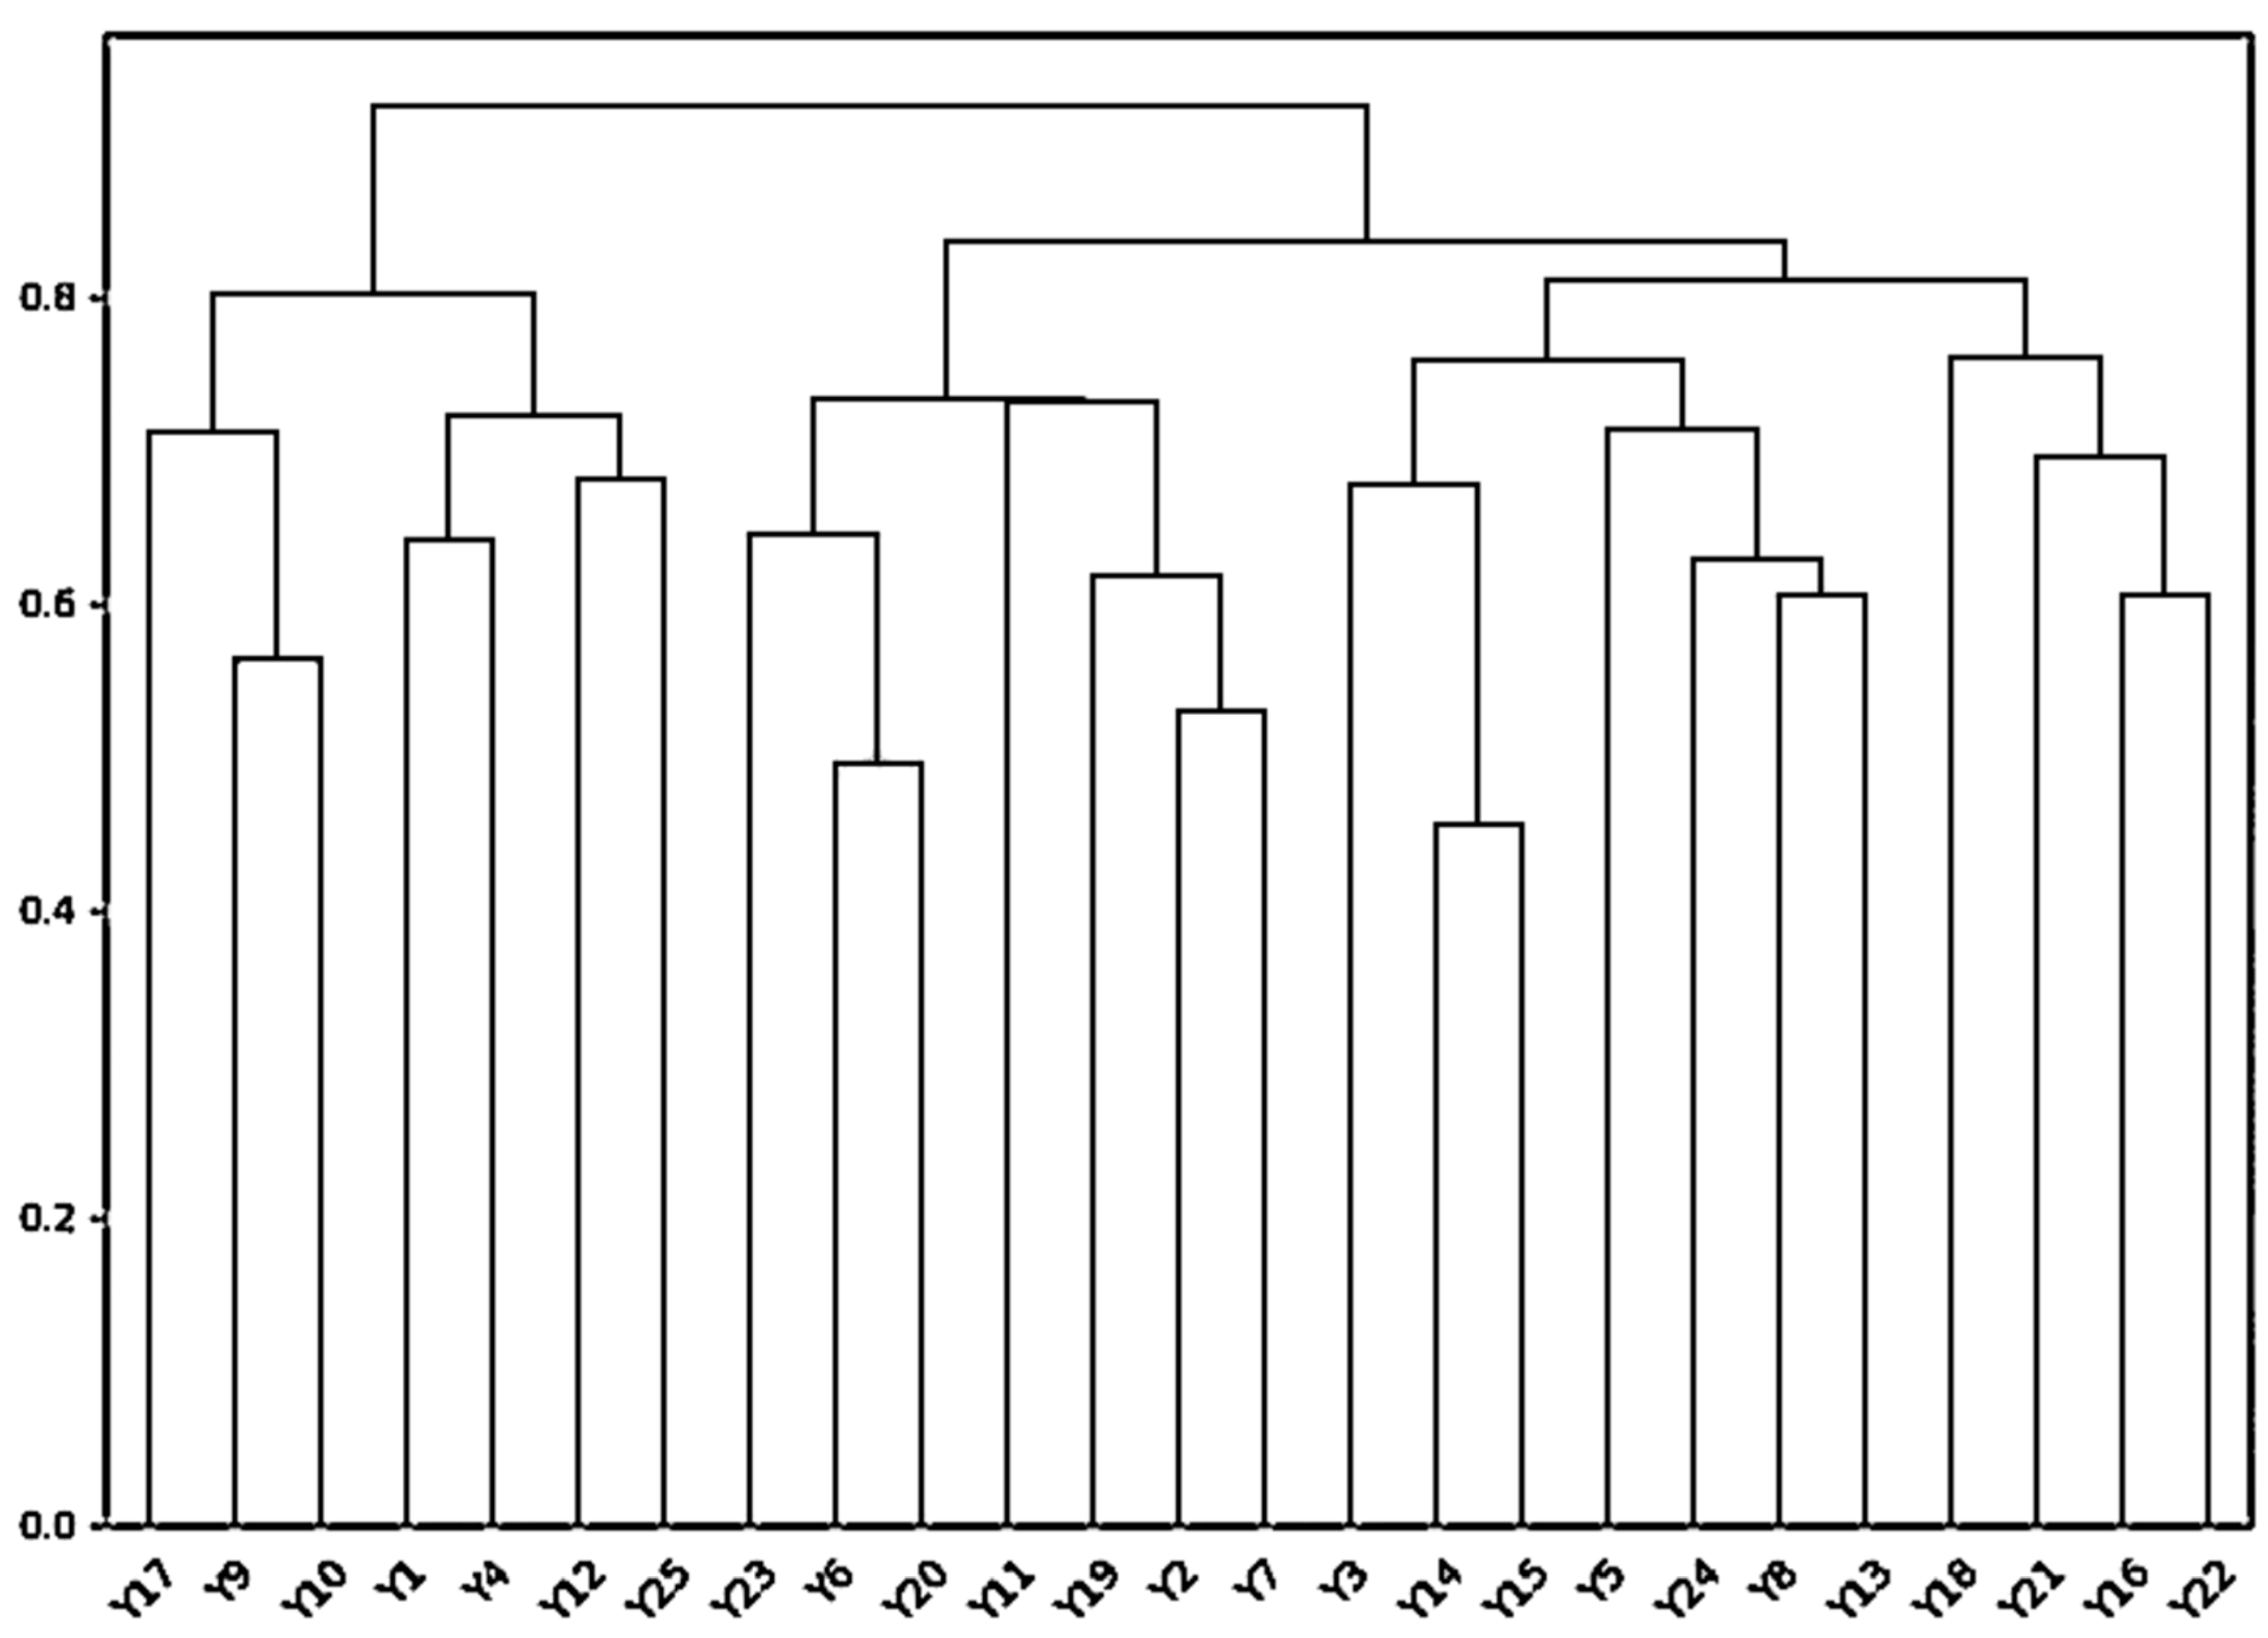
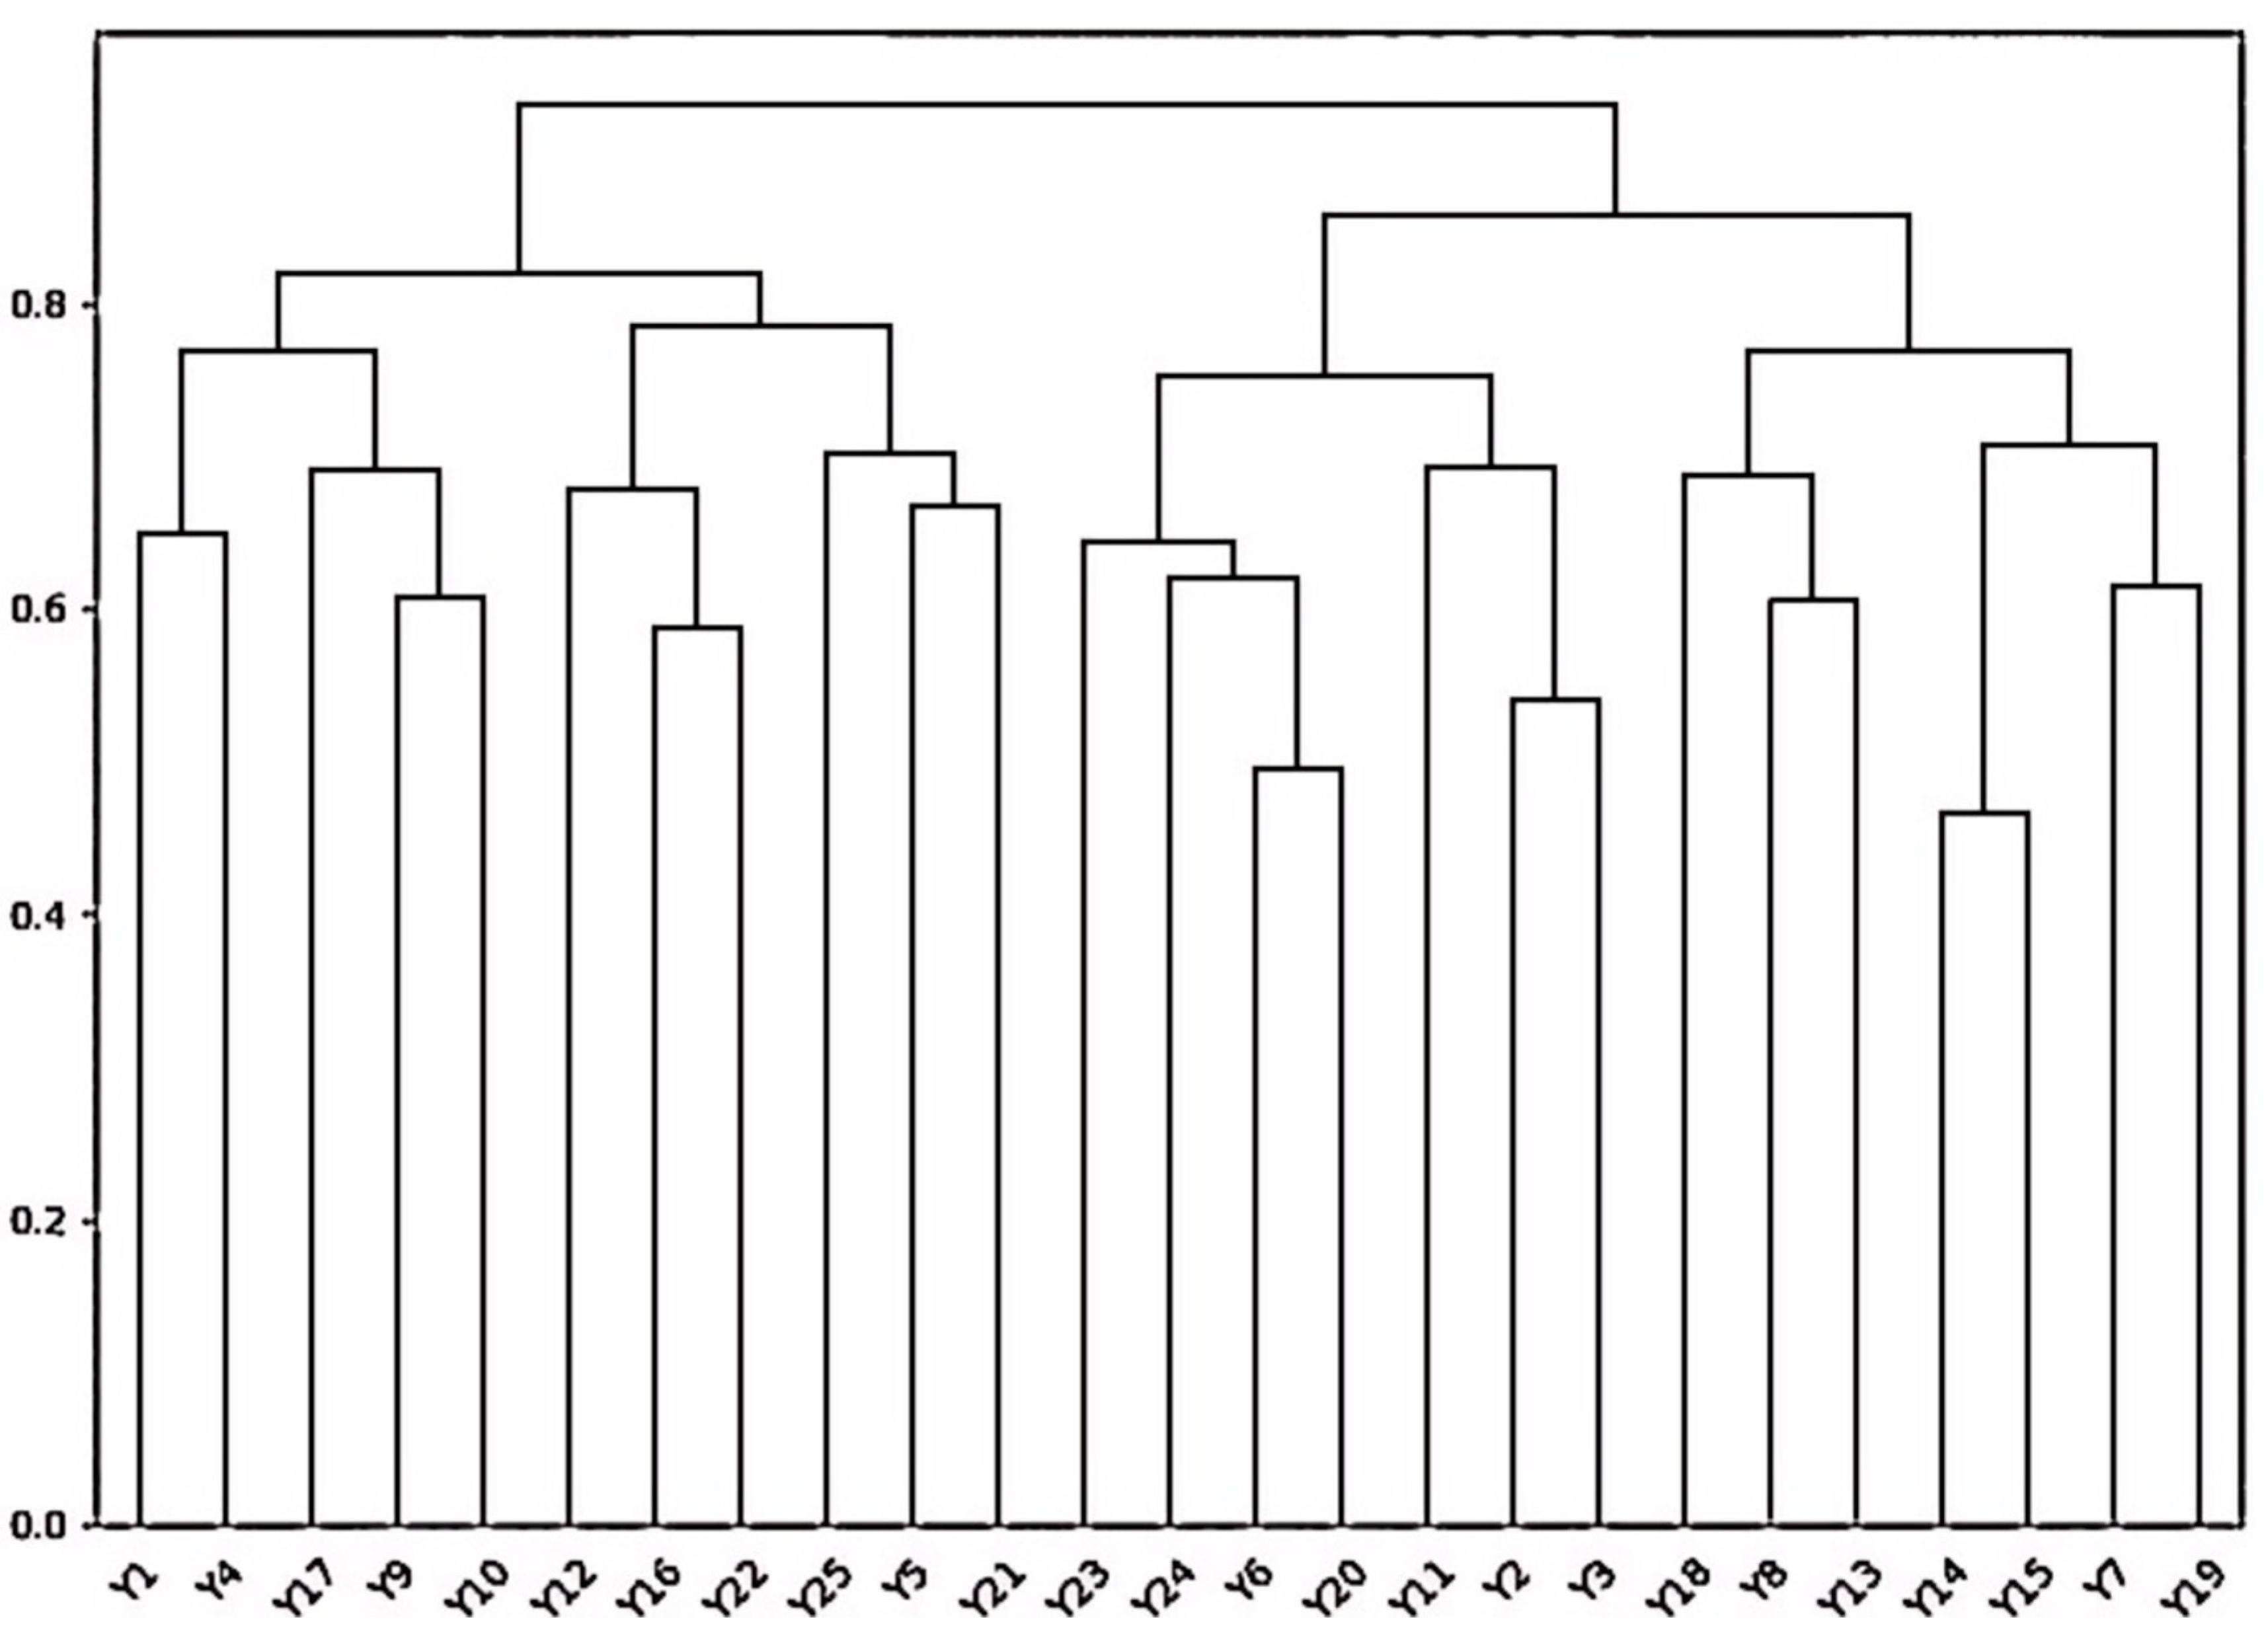
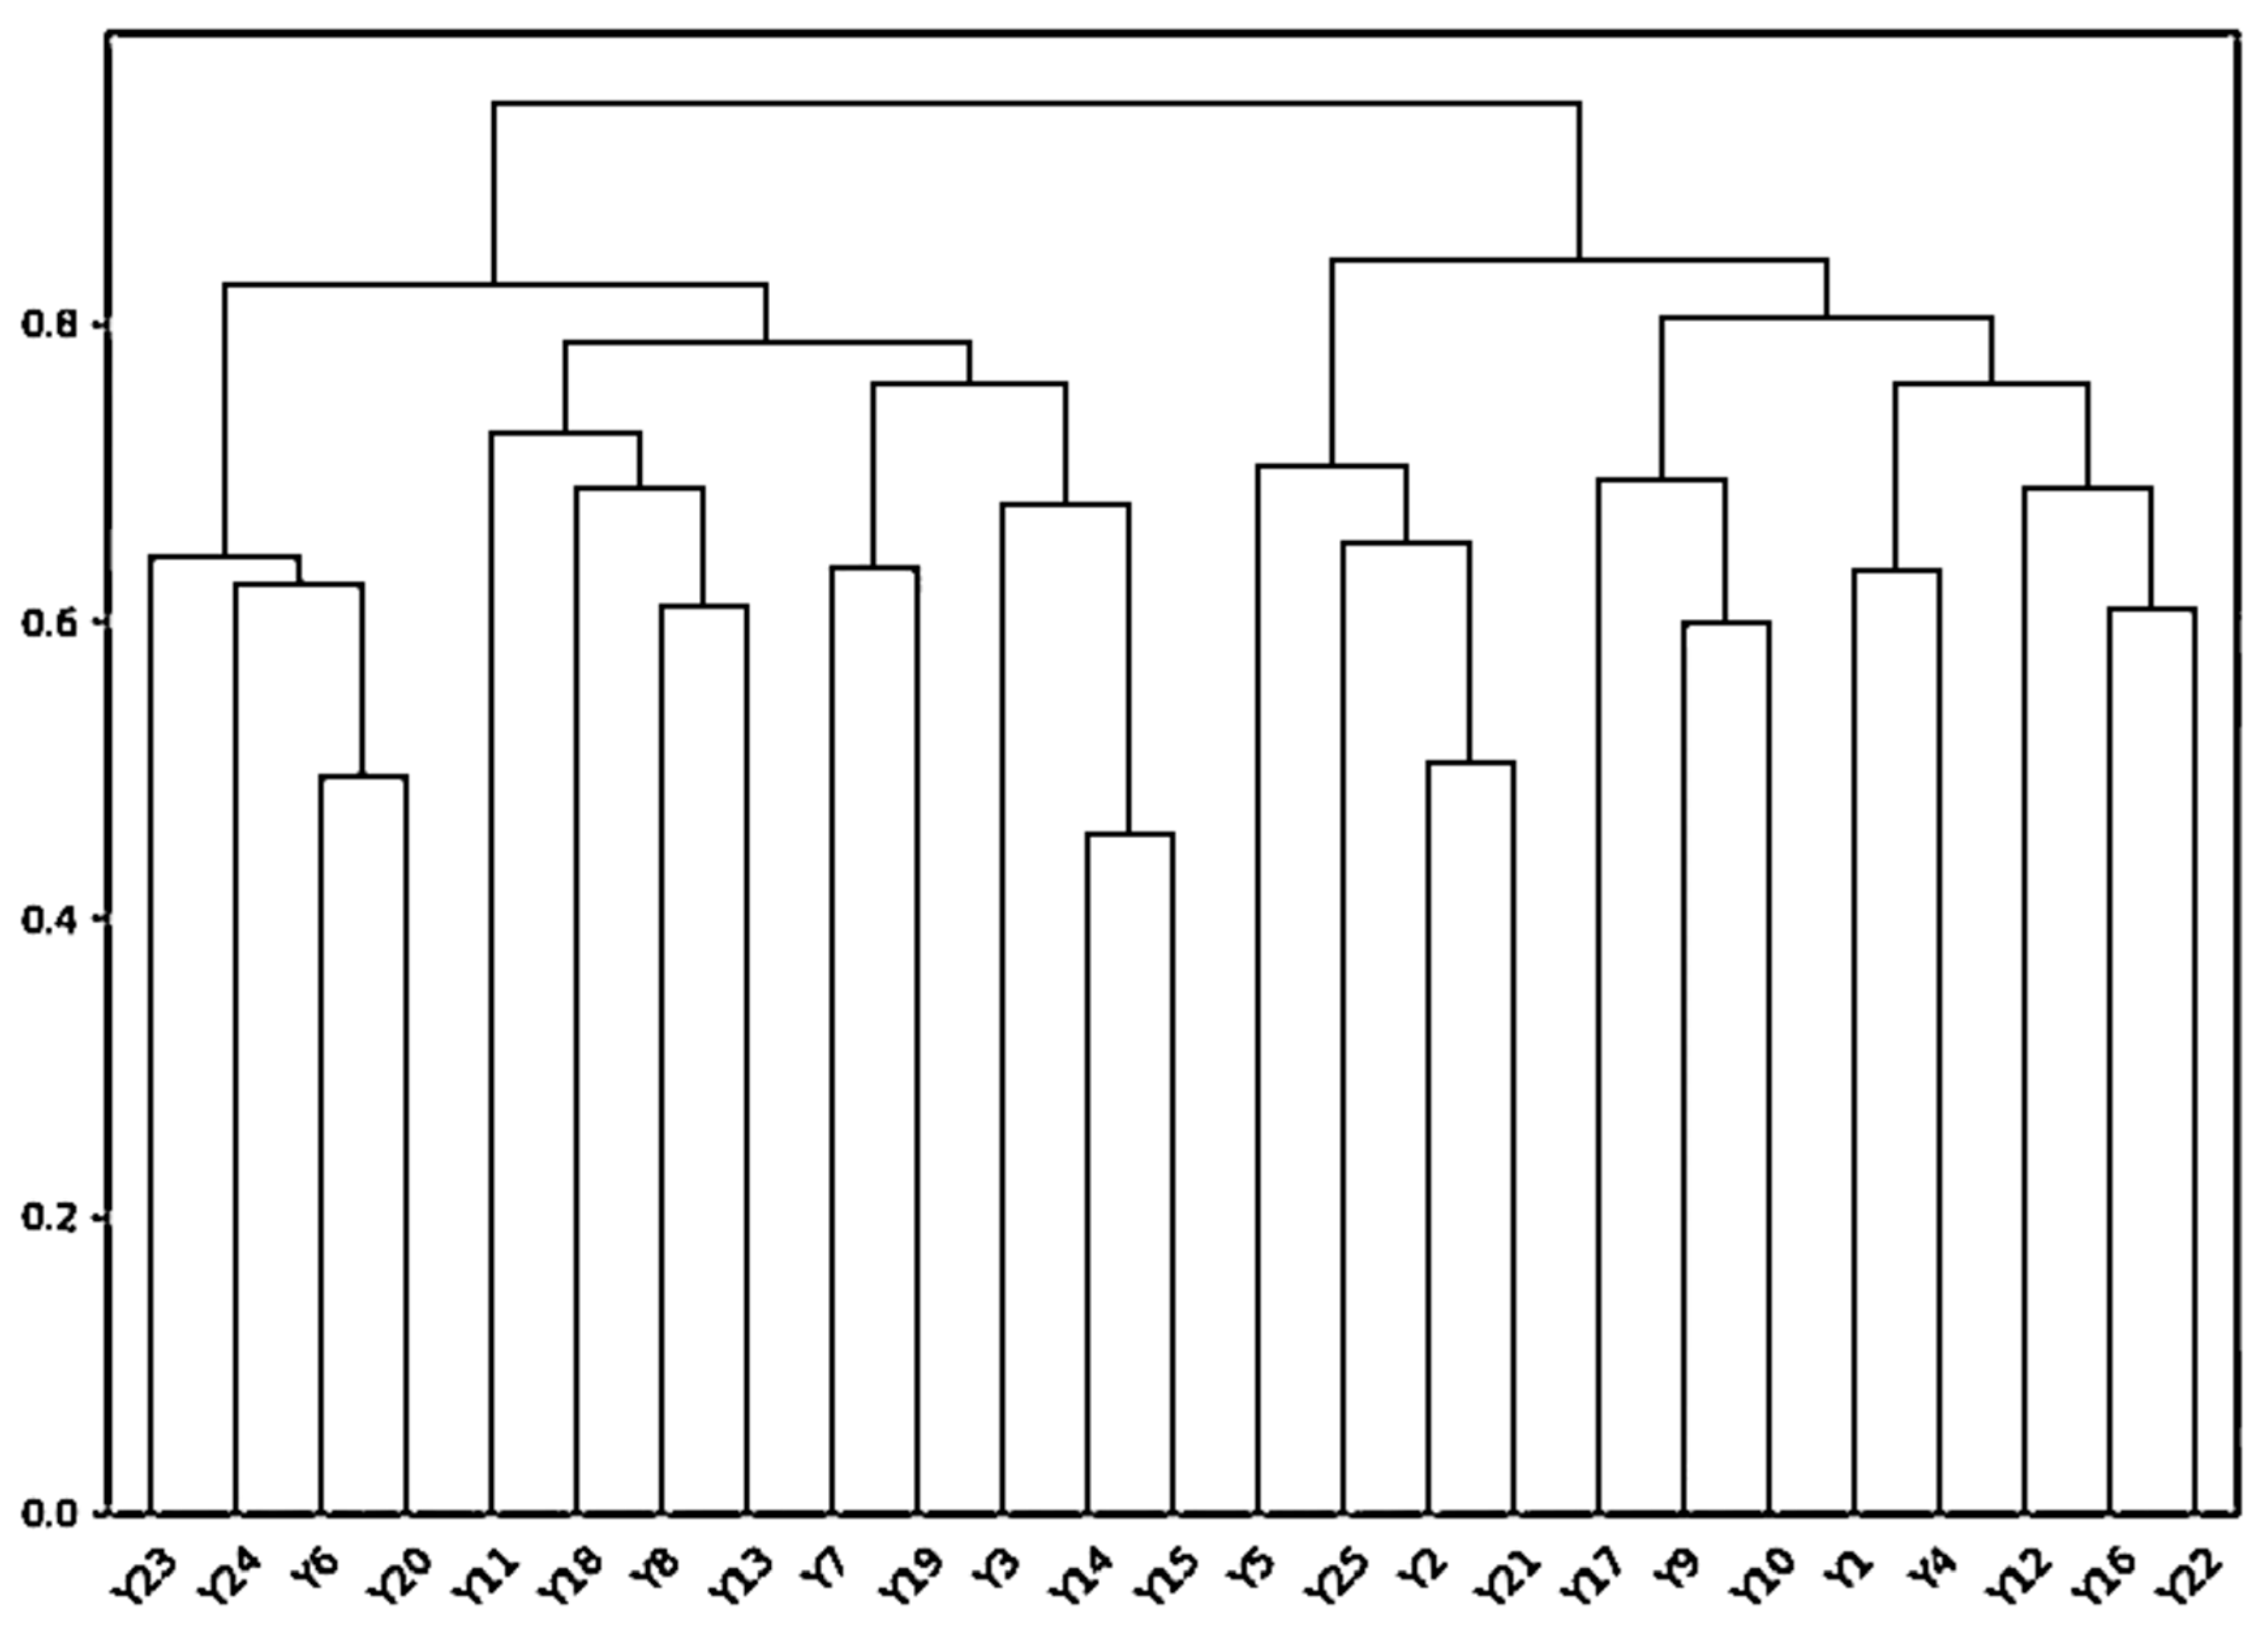
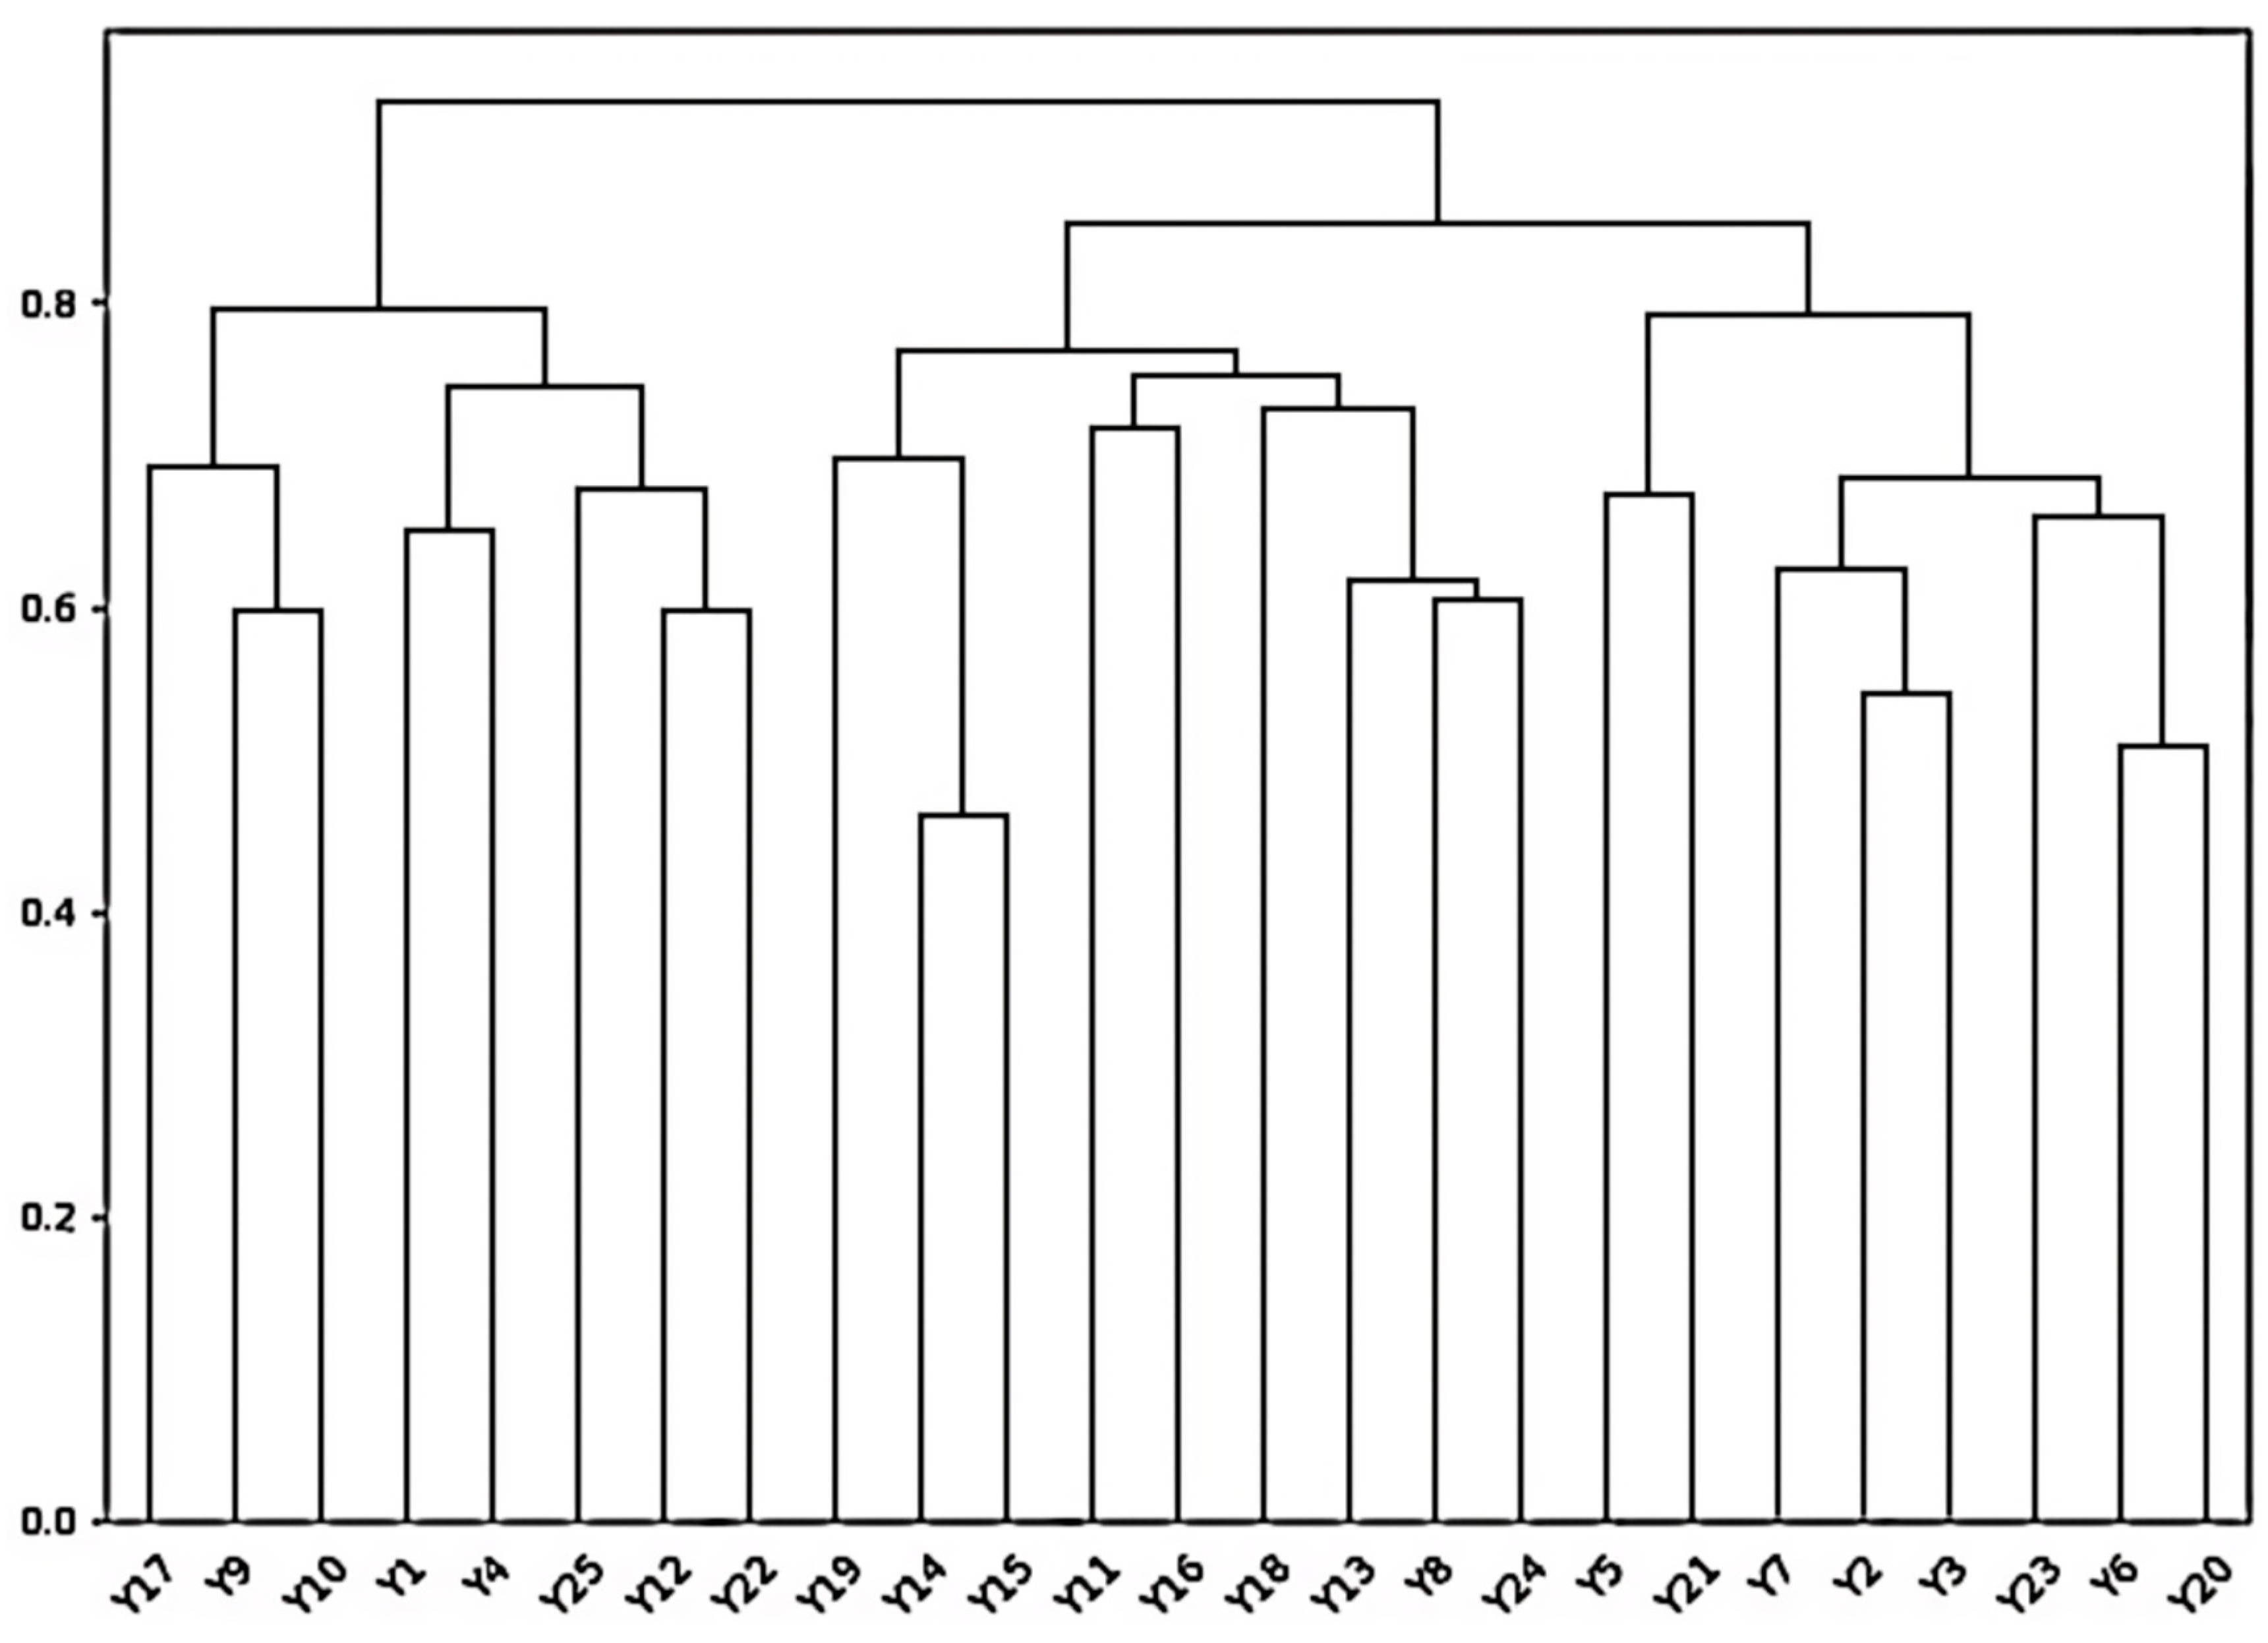
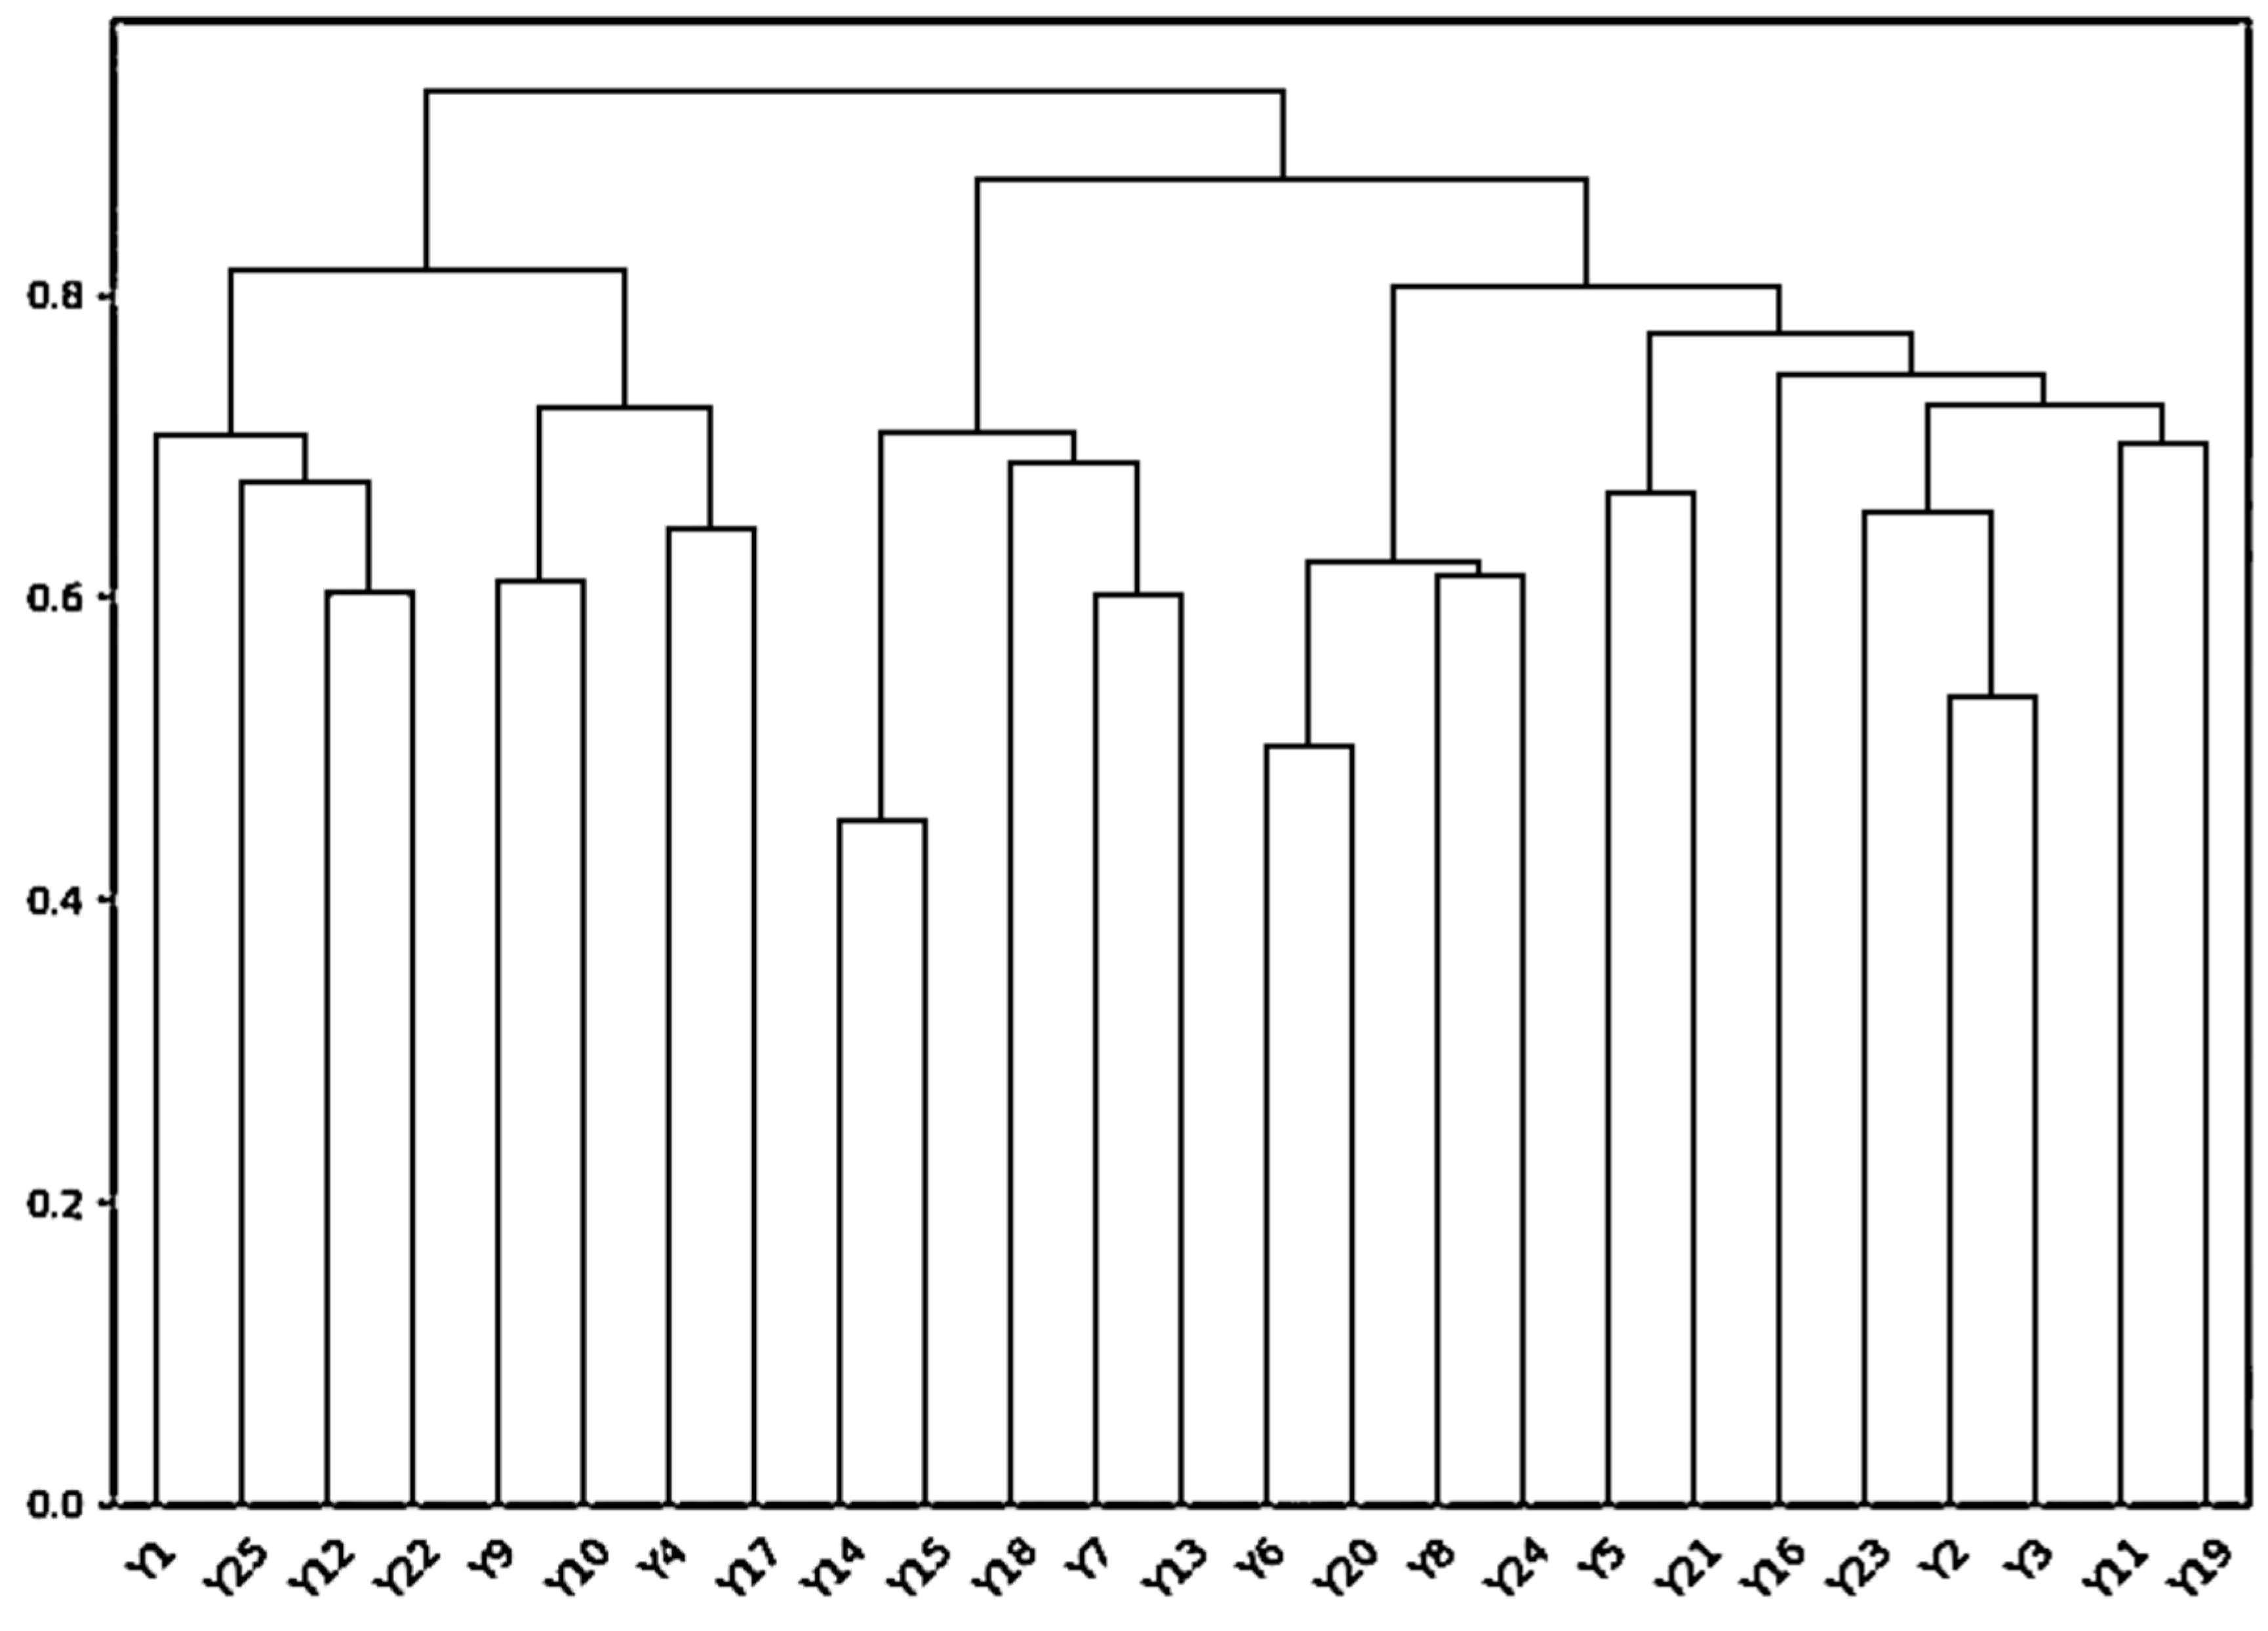
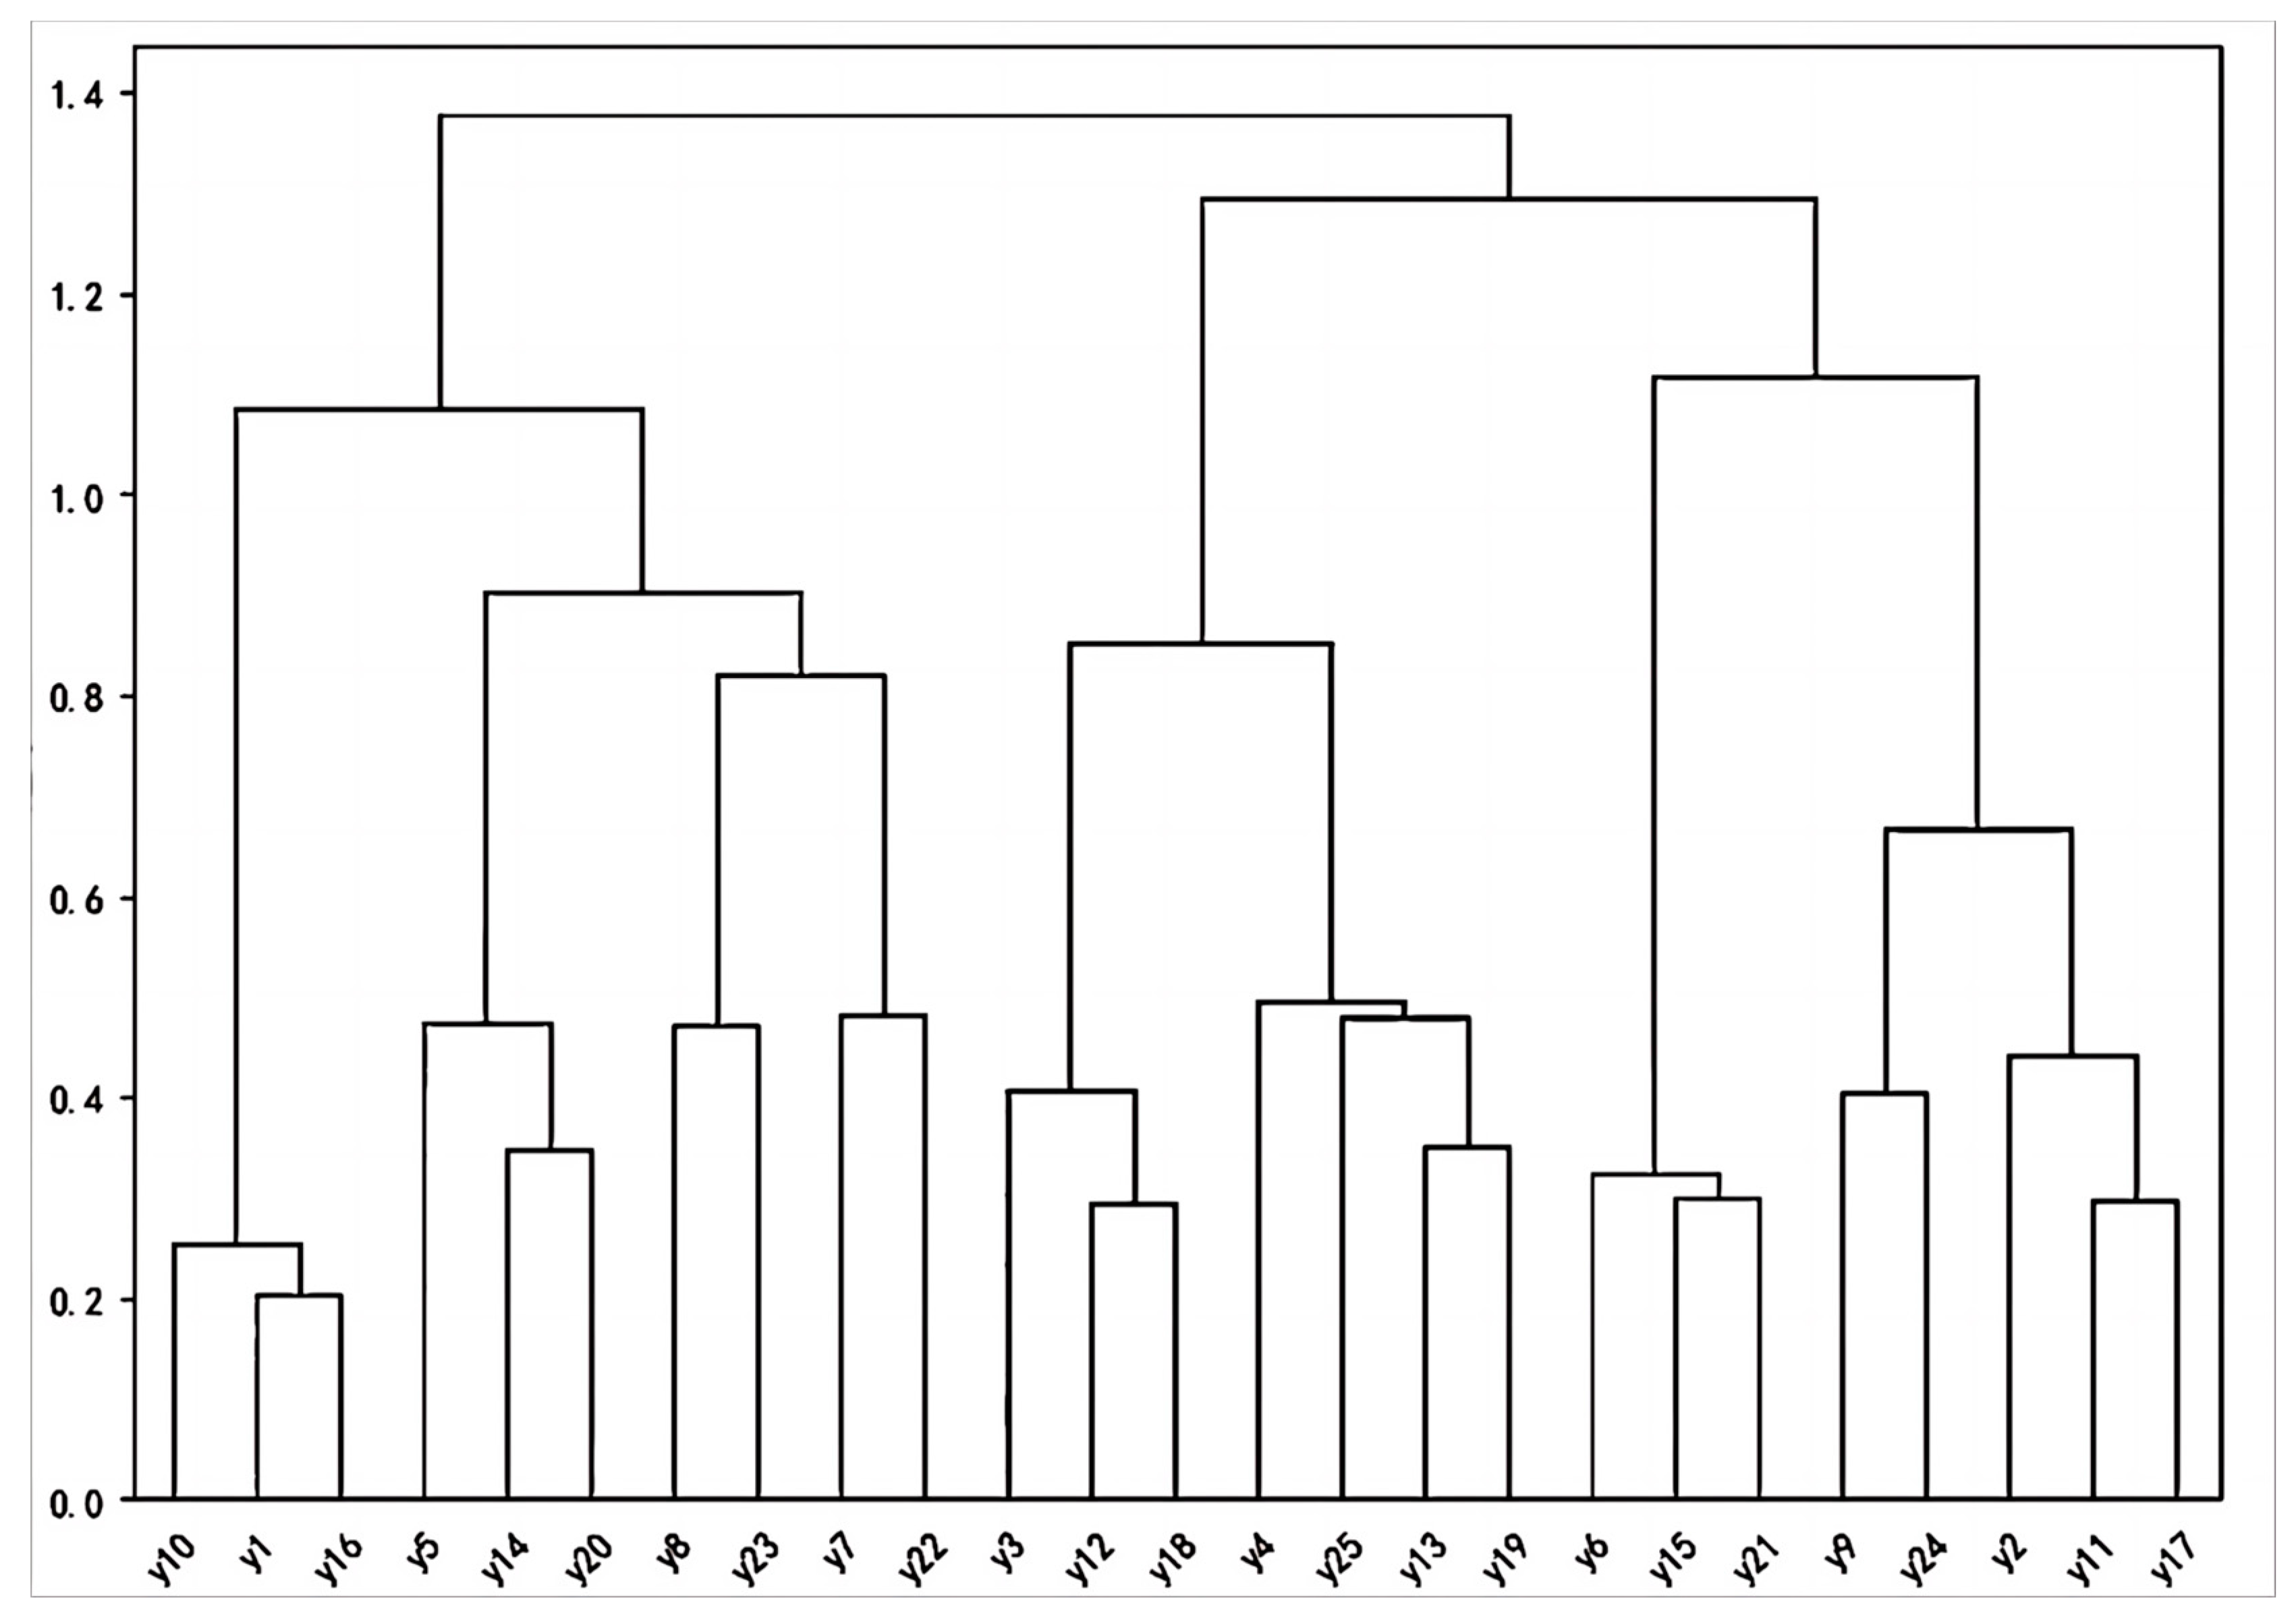
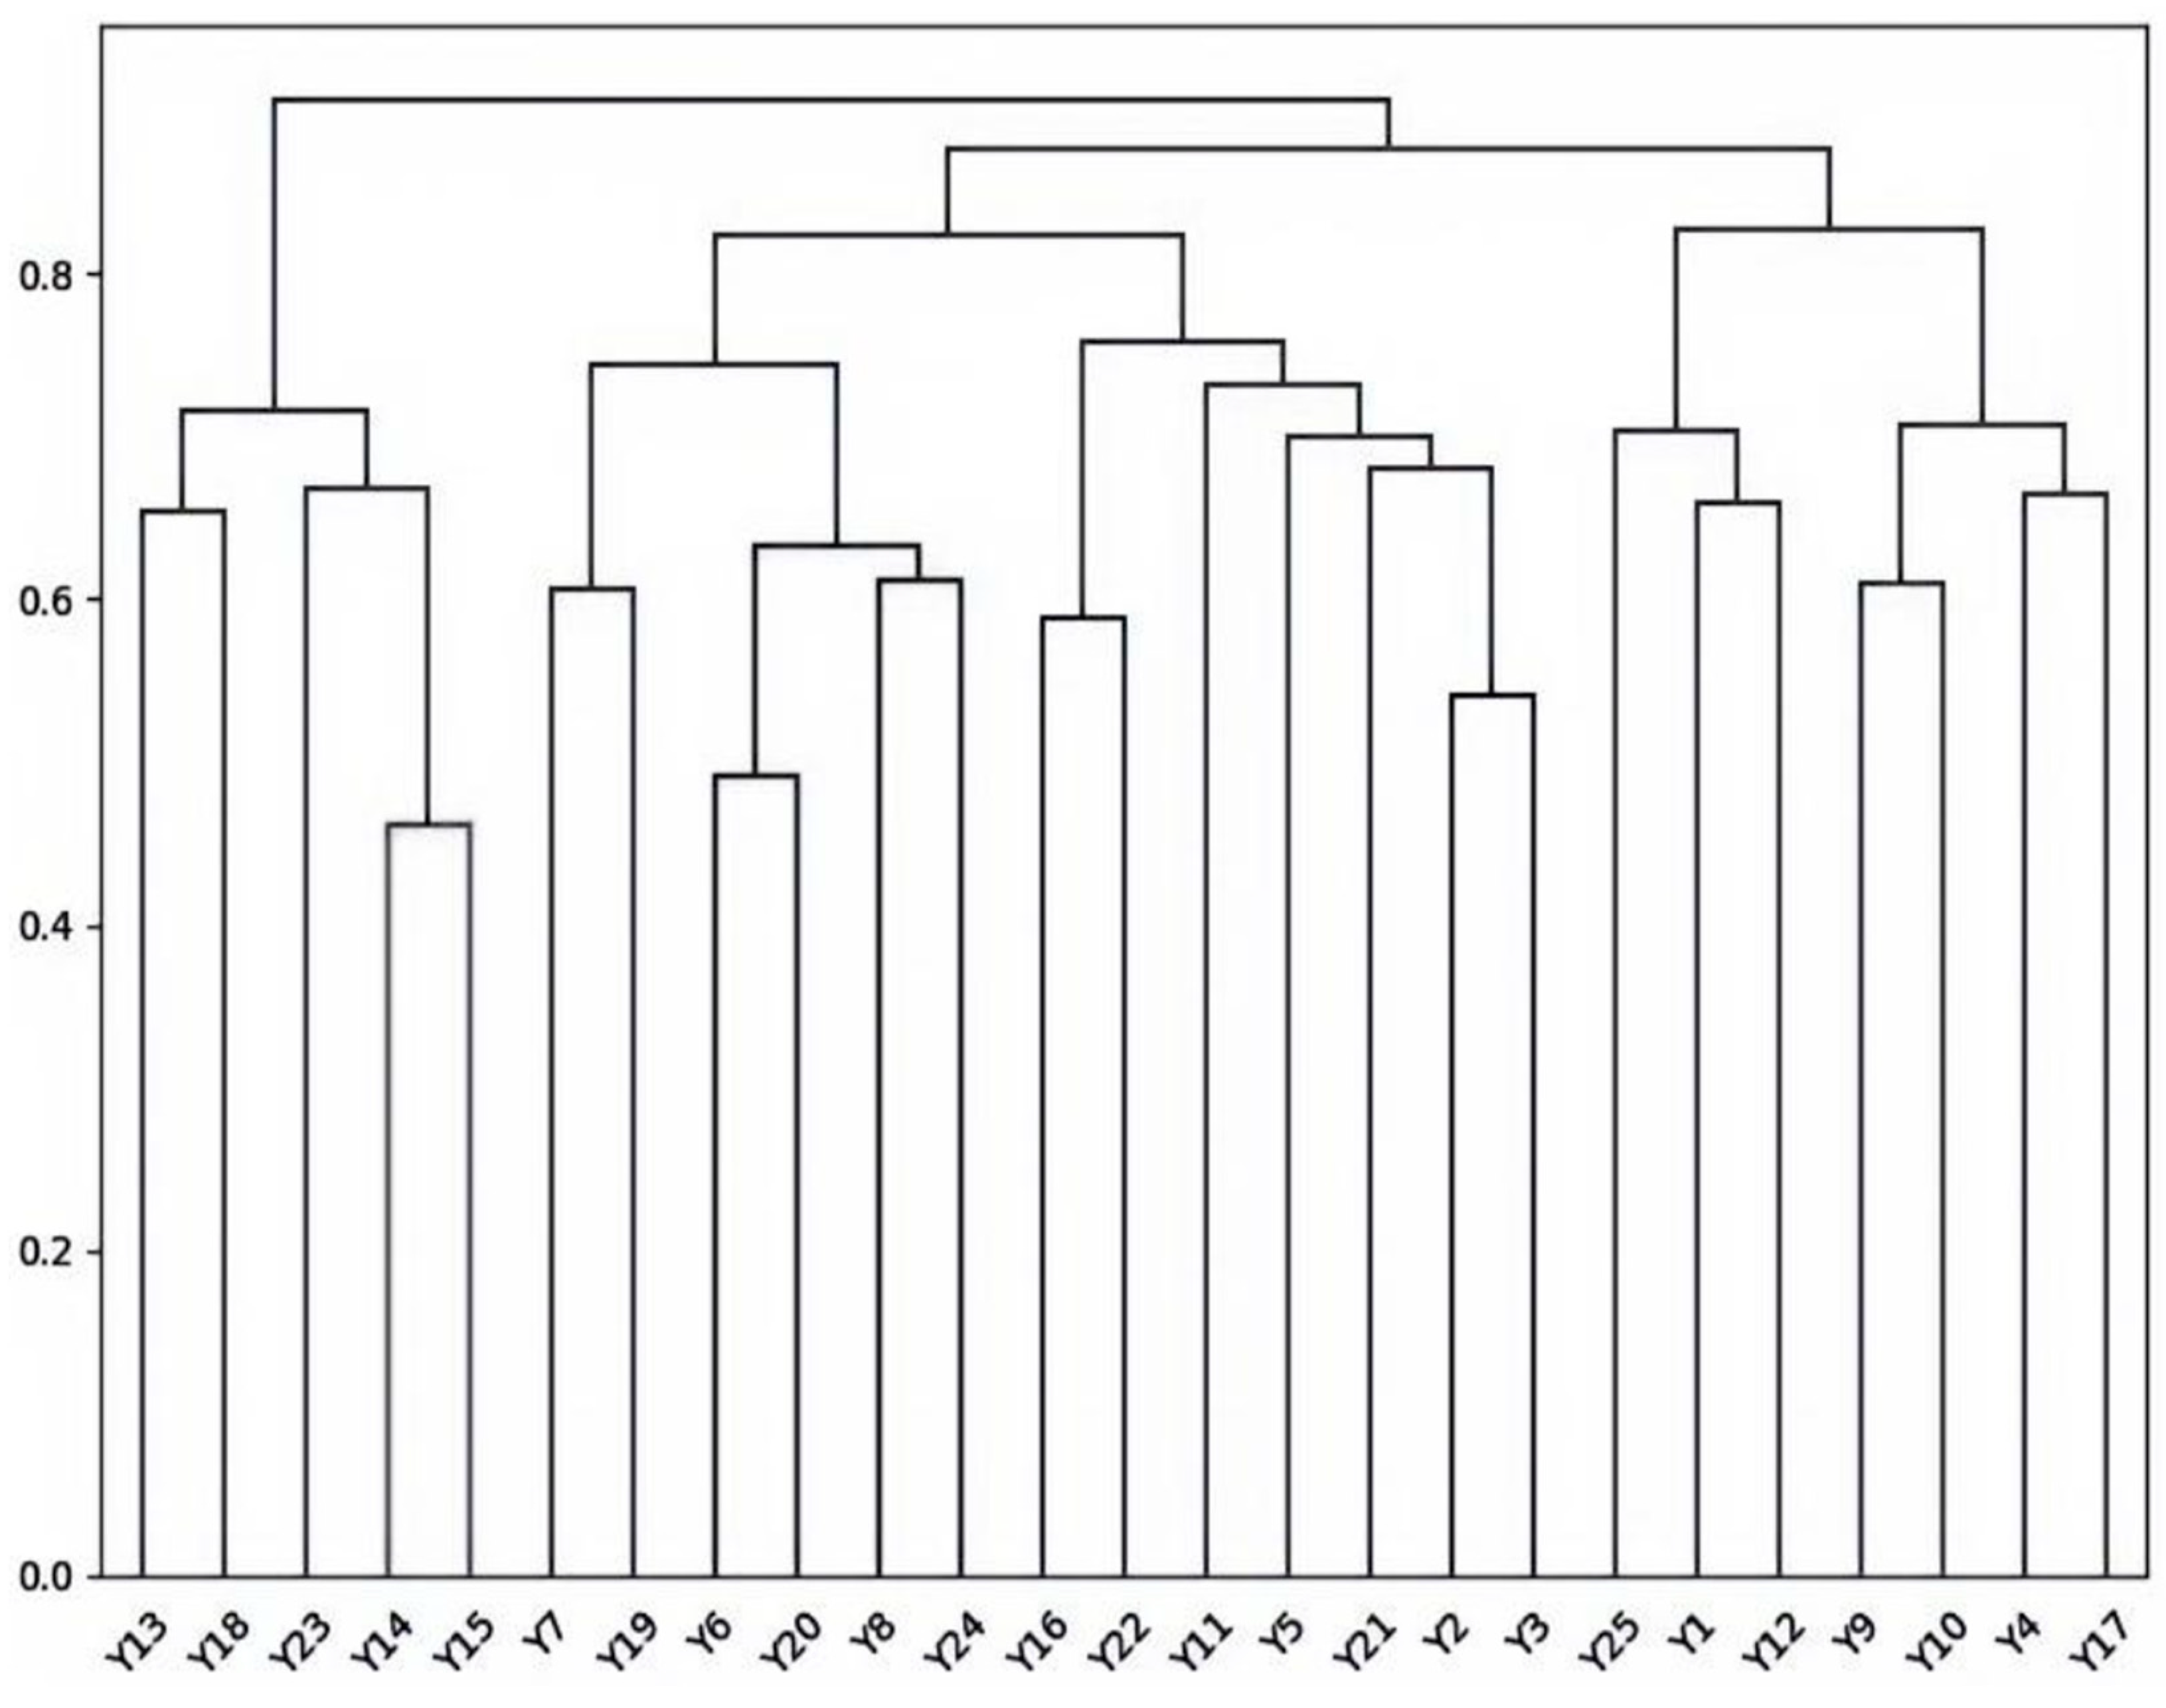
3.4. Gray Association Clustering

The fuzzy maximum support tree clustering method is used to cluster the indicators, from which the clustering results under the full indicators can be obtained (see Figure 1); in Figure 2, the values on the vertical axis indicate the distance between different clusters. The clustering distance reflects the similarity or difference between the samples, and the larger the distance, the greater the difference between the samples (The images were drawn by Pycharm 3.12.).
In this study, a threshold value λ is introduced, which is limited to a range of values between [ 0,1 ] . When the gray correlation ε i k between two objects x i and x j reaches or exceeds this threshold λ , we identify them as belonging to the same class of features. This clustering method based on the threshold λ is called λ gray correlation clustering, where the selection of the threshold λ has a significant impact on the final clustering result. In order to determine the optimal threshold λ , the F-statistic method is used in this study. In this method, the score of expert i on the kth indicator is first processed, and the processed score is denoted as y i k , where i represents different experts ( i = 1,2 , , m ) and k represents different indicators ( k = 1,2 , , n ). Under the selected threshold λ , the objects are categorized into r classes, where the jth class contains n j evaluation objects ( j = 1,2 , , r ). Here, r represents the number of categories under a given threshold λ , while n j represents the number of evaluation objects in each category. Using this method, the influence of different thresholds λ on the clustering results can be systematically evaluated, and the optimal value of λ can be determined based on the F-statistic method, thus ensuring the accuracy and reliability of the clustering results. Its calculation formula is as follows:
y j k ¯ = 1 n j i = 1 n j y i k
This is the average of the scores on indicator k for category j respondents.
y j k ¯ = 1 m i = 1 m y i k
is the average of all evaluation subjects scored on the kth indicator, where in Equations (17) and (18), k = 1,2 , , n . Then, there is an F statistic:
F = j = 1 r n j k = 1 n y j k ¯ y k ¯ 2 / r 1 j = 1 r n j i = 1 n j k = 1 n y j k y j k ¯ 2 / m r 2
In Equation (19), the denominator represents intra-class distances and the numerator represents inter-class distances, resulting in Table 4.
As the F-value increases, the distance between different categories becomes more significant, which makes the classification results more reasonable. Therefore, the size of the F -value can be regarded as an effective indicator of the classification effect. If the F-value satisfies F > F a ( r 1 , m r ) (where α = 0.05), it indicates that the difference between categories is statistically significant, and the current classification method should be adopted at this time. In the case where multiple F values satisfy the above inequality, in order to select the optimal classification threshold λ , there is a general tendency to select the λ corresponding to those F values that make the ( F F a ) / F a ratio larger, and such a selection can further ensure the accuracy and effectiveness of the classification. The resulting value of λ is 0.8024, which corresponds to an optimal number of classifications of 5.

3.5. Simplicity of Indicators

According to rough set theory, the indicators X1~X22 are deleted in turn, and the same method is used to calculate the correlation matrix in different cases and carry out gray clustering, and the clustering results of deleting the indicator X1 are shown in Figure 2 (due to the space limitation, under the premise that the calculation method of each indicator is the same, this paper only shows the clustering results of deleting the indicator X1 here. The remaining results are shown in Appendix B).
The best clustering results after deleting different indicators are shown in Table 5.
According to the best clustering situation under different indicator approximations, it can be seen that deleting the indicator (X3) is the same as the sample clustering result under all the indicators, and from the rough set attribute approximation theory, (X3) is a redundant indicator, so it can be approximated, and the rest of the indicators are retained. By analogy, (X3), (X5), (X7), (X8), (X9), (X10), (X12), (X13), (X14), (X15), (X19), (X20), (X21), and (X22) are all redundant indicators. Therefore, this indicator is deleted and industrial contribution rate (X1), industrial characteristics and innovativeness (X2), industrial bandwidth (X4), visual appearance effect of the town (X6), cultural inheritance and change of ideology (X11), construction of town-related systems (X16), introduction of talents (X17), and reasonable sharing of public resources (X18) are retained.

3.6. Synthesized Assessment

From Formulas (5)–(9), the weights, importance, comprehensive evaluation value, and ranking of the indicators obtained after approximation are shown in Table 6.
When the weight of an indicator is given a higher value, it can clearly reflect the central position of the indicator in the entire evaluation system, that is, the importance of the indicator is more significant. In determining these weights, the introduction of comprehensive evaluation values not only ensures the scientific and rational nature of the evaluation system but also effectively integrates the a priori knowledge and professional insights of the rating experts. Such an approach not only respects the experience of the experts but also further enhances the objectivity and authority of the evaluation results. Therefore, through the scientific setting of indicator weights and the introduction of comprehensive evaluation values, the true value of each indicator in the evaluation system can be more comprehensively and accurately reflected, providing strong support for decision-making.

4. Discussion

Characteristic town construction is a key way to promote the development of a rural revitalization strategy, and a good evaluation of the development level of characteristic towns is a necessary part in the development of characteristic towns and a powerful guarantee to promote the construction and development of characteristic towns. In order to verify the feasibility and rationality of the development level evaluation model of featured towns in this paper, eight featured towns in Zhejiang Province of China are selected for empirical analysis, which are represented by Z j j = 1,2 , , 8 , i.e., Redwood Town ( Z 1 ), Chocolate Sweet Town ( Z 2 ), Leather Fashion Town ( Z 3 ), Intelligent Automobile Town ( Z 4 ), Silk Town ( Z 5 ), Artistic Town ( Z 6 ), Internet Town ( Z 7 ), and Monchu Town ( Z 8 ). Below is a brief introduction of each specialty town, including the industrial structure, scale, and development objectives.

4.1. Data Collection

An expert group composed of 10 people, including staff engaged in the construction and operation of the characteristic town, government personnel, university researchers, etc., evaluates and scores, respectively, from the contribution rate of industry (X1), industrial characteristics and innovativeness (X2), industrial bandwidth (X4), the effect of the visual appearance of the town (X6), the cultural inheritance and ideological conceptual change (X11), the construction of the relevant system of the town (X16), the introduction of talent (X17), and the reasonable sharing degree of public resources (X18) are evaluated and scored, and finally the average value of all experts’ scores is used as the sample data.

4.2. Evaluation Using the TOPSlS Method

(1)
Normalize the raw scoring data to obtain the matrix F:
F = 0.121 0.127 0.123 0.124 0.127 0.121 0.127 0.127 0.124 0.124 0.122 0.126 0.118 0.130 0.126 0.126 0.126 0.120 0.125 0.123 0.125 0.127 0.123 0.123 0.128 0.127 0.119 0.122 0.121 0.121 0.124 0.119 0.122 0.126 0.129 0.126 0.127 0.124 0.119 0.124 0.125 0.127 0.126 0.127 0.125 0.127 0.129 0.129 0.128 0.126 0.129 0.129 0.131 0.128 0.127 0.133 0.126 0.124 0.127 0.123 0.125 0.121 0.124 0.120
(2)
Calculate the positive and negative ideal solutions from the determined matrix F.
F i * = ( 0.128 ,   0.127 ,   0.129 ,   0.129 ,   0.131 ,   0.130 ,   0.129 ,   0.133 ) F i = ( 0.121 ,   0.120 ,   0.119 ,   0.122 ,   0.118 ,   0.121 ,   0.119 ,   0.119 )
(3)
A brief introduction of the evaluated featured towns (see Table 7), with the average of the experts’ scores as the initial data (see Table 8). Combining the weights of the indicators and the comprehensive evaluation value, determine the Euclidean distance of each featured town from the positive and negative ideal solutions, as well as the relative closeness ζ, and rank each featured town (see Table 9).
The larger the relative posting progress ζ, the better the social benefits. From there, the eight featured towns are ranked according to the relative posting progress, and the following results are obtained:
Internet Town ( Z 7 ) > Artistic Town ( Z 6 ) > Chocolate Sweet Town ( Z 2 ) > Leather Fashion Town ( Z 3 ) > Silk Town ( Z 5 ) > Mahogany Town ( Z 1 ) > Monchu Town ( Z 8 ) > Intelligent Automobile Town ( Z 4 ).
In China Zhejiang province 2023 published 2022 annual assessment results show the following: Internet town, Artistic town assessment grade is excellent; Chocolate Sweet town, Leather Fashion town, Silk town and Mahogany town assessment results for good; dream perch town assessment results for qualified; the appraisal result of the Monchu town is qualified; and the appraisal results of the Intelligent Automobile town is downgraded. It can be seen that the ranking of the evaluation model is 100% accurate with the actual assessment results, thus proving that the model is effective. Specifically, various stakeholders can utilize research findings to provide a basis for decision-making. For instance, government planning departments can employ evaluation models to conduct regular assessments of the development levels of characteristic towns, in order to monitor and adjust urban–rural integration strategies. Investors can select characteristic towns with development potential for investment based on the assessment results. Community residents, by gaining an understanding of the assessment outcomes, can participate in discussions and provide feedback on urban–rural planning, thereby contributing to the realization of a more democratic and scientific approach to urban–rural planning.
Characteristics of the Town in Terms of Social Benefits: (1) The focus should be on the overall development of the town, rather than a single reliance on industrial characteristics. (2) Considerations should be multi-directional and integrated, encompassing production, ecology, and life. (3) Industrial construction should be the core, accompanied by the comprehensive management of environmental pollution and improvement of ecological construction. (4) Public infrastructure construction should be enhanced to fully realize the town’s “livability” function. (4) Local cultural resources should be tapped, leveraging cultural characteristics to drive tourism development. (5) Town system construction should be improved to ensure effective governance. (6) Talent revitalization should be implemented, vigorously introducing technical personnel to promote sustainable town development. (7) A people-oriented approach should be adopted, enhancing public participation to maximize the solution to local residents’ employment problems. (8) The quality of life of local and neighboring residents should be improved as a whole.

5. Conclusions

Starting from the overall requirements of the urban–rural integration development strategy, this study constructs an evaluation index system for the development level of Chinese specialty towns. It utilizes gray rough set theory to build the evaluation system, employs rough set theory to reduce the attributes of evaluation indicators, and calculates the indicator weights based on conditional information entropy. This approach addresses the shortcoming of traditional weight determination methods that rely too heavily on prior experience. Subsequently, the TOPSIS method is applied to evaluate various specialty towns and derive their development-level rankings, guiding decision-makers to take effective measures to improve and optimize the construction of specialty towns. As a result, this study can provide a reference for theoretical research and practical applications in the future construction and operation of specialty towns.
When evaluating the development level of China’s characteristic towns in future research, the following issues should be noted: (1) when constructing the evaluation index system of the development level of characteristic towns, appropriate adjustments and improvements should be made according to the actual situation of different types of towns in different regions within China. (2) The selection of indicators should be comprehensive as much as possible, avoiding single indicators or overly favoring one aspect of the indicators, which will lead to distortion of the evaluation results. At the same time, the indicators should be operable and measurable to facilitate data collection and analysis, and the data sources should be authentic and authoritative. Evaluators should have relevant professional knowledge and practical experience and be able to objectively analyze the development status of characteristic towns. (3) When collecting data for the characteristic town, the evaluation index system needs to be assessed and updated regularly to ensure that it can reflect the latest trends and requirements of the development of the characteristic town. Since the development of characteristic towns is a dynamic process, the evaluation should also consider the time factor and pay attention to the development trend and changes of characteristic towns. (4) The development of characteristic towns is subject to the double influence of policies and markets. When evaluating, attention should be paid to the role of policy orientation in promoting the development of characteristic towns and the role of the market mechanism in resource allocation and industrial development, as well as the adaptability and innovation ability of characteristic towns in coping with policy adjustments and market changes.
Although this study has achieved certain results, there are still some potential limitations that need to be addressed in future work: (1) due to the difficulty in acquiring data on characteristic towns, there may be issues of incomplete or inaccurate data. (2) The indicator system constructed in this study may not be fully applicable to all types of characteristic towns, as characteristic towns in different regions have distinct characteristics and development paths. (3) Changes in policies and market conditions may have significant impacts on the development of characteristic towns, and this study may not have fully considered these dynamic factors in its evaluation. (4) Although the TOPSIS method used in this study has certain scientific and practical value, it may not fully cover all factors affecting the development of characteristic towns. To address these four limitations, we propose the following solutions for future research: (1) strengthen cooperation with relevant government departments to obtain more comprehensive and accurate data, thereby enhancing the accuracy and reliability of evaluations. (2) Adjust and refine the indicator system appropriately based on the actual conditions of different regions to improve its universality and specificity. (3) Strengthen the monitoring and analysis of policy and market dynamics and promptly adjust the evaluation indicator system to reflect the latest trends and requirements in the development of characteristic towns. (4) Attempt to use other evaluation methods or combine multiple methods for evaluation to improve the comprehensiveness and accuracy of assessments.
In conclusion, establishing an evaluation index system for the development level of specialty towns is one of the crucial steps in China’s implementation of the integrated urban–rural integration strategy and new urbanization. Through scientific evaluation and assessments, focusing on the intrinsic connections between various indicators and examining the evaluation metrics of each specialty town in a more optimized manner, we can identify shortcomings and issues in their development. This will allow different specialty towns to target their efforts to compensate for weak indicators, strengthen their strengths, and provide a basis and support for formulating targeted policies and measures. At the same time, it will also help guide and incentivize localities to accelerate the construction of Chinese specialty towns, promoting the comprehensive development of China’s economy and society.

Author Contributions

Conception and methodology, X.H.; Data curation, Q.X.; Writing, J.W.; Editing, X.L.; Review, K.Z. All authors have read and agreed to the published version of the manuscript.

Funding

This research was funded by Natural Science Foundation of Xinjiang Uygur Autonomous (Grant No. 2023D01C188) and Tianchi Talent Program of Xinjiang Uygur Autonomous.

Data Availability Statement

Some or all data that support the findings of this study are available from the corresponding author upon reasonable request. The data are not publicly available due to the questionnaires involved in the study were communicated to all participants to guarantee anonymity and no new data were generated in the conclusions.

Conflicts of Interest

The authors declare no conflicts of interest.

Appendix A. The Results of the Expert Scored Dimensionless Data

normy1y2y3y4y5y6y7y8y9y10y11y12y13y14y15y16y17y18y19y20y21y22y23y24y25
X10.652 0.130 0.652 0.652 0.609 0.391 0.652 0.652 1.000 0.652 0.565 0.652 0.217 0.609 0.000 0.652 0.565 0.652 0.652 0.609 0.783 0.652 0.652 1.000 0.609
X20.500 0.050 0.850 0.650 0.400 0.000 0.500 0.550 0.900 0.500 0.550 1.000 0.150 0.400 0.000 0.500 0.550 0.600 0.650 0.400 0.500 0.500 0.550 0.900 0.600
X30.375 0.438 0.750 0.625 0.625 0.000 0.375 0.500 0.813 0.813 0.438 0.750 0.500 0.625 0.000 0.813 0.438 0.750 0.813 0.625 1.000 0.375 0.500 0.813 0.938
X40.571 0.571 0.857 0.857 0.000 0.000 0.571 0.000 0.714 1.000 0.571 0.857 0.143 0.000 0.000 1.000 0.571 0.857 0.857 0.000 0.571 0.571 0.000 0.714 0.571
X51.000 0.857 0.714 0.786 1.000 0.000 0.643 0.286 0.643 1.000 0.857 0.714 0.071 1.000 0.000 1.000 0.857 0.714 0.786 1.000 0.643 0.929 0.286 0.643 0.786
X60.694 0.500 0.889 0.306 0.528 0.250 0.889 0.722 0.444 0.778 0.000 0.889 0.583 0.694 0.167 0.389 0.056 0.889 0.861 0.194 0.972 0.889 0.722 1.000 0.556
X70.833 0.767 0.933 0.900 0.967 0.000 0.600 0.800 0.933 0.833 1.000 0.933 0.900 0.967 0.000 0.833 1.000 0.933 0.900 0.967 0.933 0.600 0.800 0.933 0.867
X80.800 0.333 0.733 0.700 0.867 0.000 0.767 0.700 0.767 0.800 1.000 0.733 0.367 0.867 0.000 0.800 1.000 0.733 0.700 0.867 0.833 0.467 0.533 0.700 0.767
X90.763 0.263 0.632 0.816 0.947 0.289 0.868 0.895 0.921 0.974 0.947 0.895 0.816 0.947 0.000 0.974 0.947 0.895 0.816 0.947 0.868 0.816 0.974 0.895 1.000
X100.867 0.600 0.800 0.933 0.867 0.000 0.933 0.733 0.900 0.867 0.867 0.800 0.933 0.867 0.000 0.867 0.867 0.800 0.933 0.867 0.900 0.267 1.000 0.667 0.800
X110.879 0.424 0.061 0.394 0.818 0.000 0.303 0.970 0.697 0.879 0.909 0.788 0.697 0.970 0.000 0.879 0.515 0.788 0.697 0.424 0.758 0.606 1.000 0.788 0.909
X120.727 0.773 0.773 0.864 0.864 0.000 1.000 0.864 0.864 0.727 0.955 0.455 0.773 1.000 0.000 0.727 0.955 0.455 0.773 1.000 0.773 0.909 0.909 0.727 0.273
X130.923 0.423 0.808 0.654 0.115 0.269 0.769 0.769 0.808 0.769 0.846 0.846 0.808 1.000 0.077 0.769 0.846 0.000 0.808 1.000 0.692 0.923 0.846 0.308 0.808
X141.000 0.433 0.667 0.833 0.867 0.000 0.967 0.633 0.700 1.000 0.833 0.900 0.867 0.967 0.000 1.000 0.833 0.900 0.867 0.967 0.700 0.667 0.767 0.800 0.800
X150.966 0.138 0.931 1.000 1.000 0.207 0.241 0.931 0.793 0.966 0.966 0.931 0.931 0.000 0.207 0.966 0.966 0.931 0.069 0.862 0.793 0.345 0.759 0.138 0.897
X160.788 0.455 0.879 0.818 0.848 0.394 0.333 0.788 0.273 0.788 0.000 0.697 0.636 0.818 0.394 0.758 0.697 0.758 0.758 0.727 0.848 0.939 0.758 1.000 0.727
X170.900 0.425 0.950 0.800 0.775 1.000 0.875 0.425 0.650 0.900 0.800 0.700 0.600 0.900 0.000 0.750 0.775 0.800 0.825 0.700 0.750 0.750 0.775 0.950 0.800
X180.839 0.129 0.968 0.258 0.871 0.484 0.581 0.581 0.774 0.903 0.839 1.000 0.000 0.903 0.484 0.871 0.677 0.839 0.226 0.774 0.968 0.645 0.710 0.871 0.935
X190.708 0.167 1.000 0.667 0.625 0.083 0.792 0.333 0.417 0.625 0.708 0.750 0.750 0.750 0.083 0.917 0.792 0.875 0.875 0.625 0.792 0.792 0.625 0.000 0.792
X200.615 0.154 0.808 0.731 0.615 0.000 0.692 0.615 0.846 0.731 0.885 0.846 0.846 0.769 0.000 1.000 0.923 0.846 0.885 1.000 0.538 0.808 0.615 0.808 0.885
X210.903 0.516 0.806 0.419 0.871 0.484 0.839 0.548 0.935 0.613 0.742 0.903 0.000 0.774 0.484 0.355 1.000 0.806 0.774 0.968 0.903 0.806 0.613 0.935 0.806
X221.000 0.316 0.737 0.526 0.368 0.000 0.474 0.211 0.895 0.526 0.526 0.947 0.684 0.579 0.000 0.211 1.000 0.895 0.842 0.947 0.895 0.368 0.684 0.895 0.789

Appendix B. Clustering Results after Deletion of Individual Indicators

Figure A1. Clustering results after removing indicator X2.
Land 13 01069 g0a1
Figure A2. Clustering results after removing indicator X3.
Land 13 01069 g0a2
Figure A3. Clustering results after removing indicator X4.
Land 13 01069 g0a3
Figure A4. Clustering results after removing indicator X5.
Land 13 01069 g0a4
Figure A5. Clustering results after removing indicator X6.
Land 13 01069 g0a5
Figure A6. Clustering results after removing indicator X7.
Land 13 01069 g0a6
Figure A7. Clustering results after removing indicator X8.
Land 13 01069 g0a7
Figure A8. Clustering results after removing indicator X9.
Land 13 01069 g0a8
Figure A9. Clustering results after removing indicator X10.
Land 13 01069 g0a9
Figure A10. Clustering results after removing indicator X11.
Land 13 01069 g0a10
Figure A11. Clustering results after removing indicator X12.
Land 13 01069 g0a11
Figure A12. Clustering results after removing indicator X13.
Land 13 01069 g0a12
Figure A13. Clustering results after removing indicator X14.
Land 13 01069 g0a13
Figure A14. Clustering results after removing indicator X15.
Land 13 01069 g0a14
Figure A15. Clustering results after removing indicator X16.
Land 13 01069 g0a15
Figure A16. Clustering results after removing indicator X17.
Land 13 01069 g0a16
Figure A17. Clustering results after removing indicator X18.
Land 13 01069 g0a17
Figure A18. Clustering results after removing indicator X19.
Land 13 01069 g0a18
Figure A19. Clustering results after removing indicator X20.
Land 13 01069 g0a19
Figure A20. Clustering results after removing indicator X21.
Land 13 01069 g0a20
Figure A21. Clustering results after removing indicator X22.
Land 13 01069 g0a21

References

  1. Sarfo, I.; Qiao, J.; Effah, N.A.A.; Djan, M.A.; Puplampu, D.A.; Batame, M.; Ayelazuno, R.A.; Yeboah, E.; Allotey, M.K.; Zhu, X. A Bibliometric Analysis of China’s Rural Revitalization Pradox: Opportunities for Collaboration, Social Innovation and Global Development. Environ. Dev. Sustain. 2024, 26, 1–43. [Google Scholar] [CrossRef]
  2. State Council of the Central Committee of the Communist Party of China. Opinions of the Central Committee of the Communist Party of China and the State Council on Doing a Good Job in Comprehensively Promoting the Key Work of Rural Revitalisation in 2023; State Council of the Central Committee of the Communist Party of China: Beijing, China, 2023. [Google Scholar]
  3. Yu, R.; Liang, Z.; Su, X.; Yan, W. An Assessment of Livelihood Vulnerability of Tourism Smallholders in the Upper Reaches of Yihe River, China. Pol. J. Environ. Stud. 2024, 33, 477–490. [Google Scholar] [CrossRef]
  4. Tang, L.; Yang, M.; Liu, Y.; Zhou, P. Classification, Evolution Trend, and Research Prospect of Rural Multifunction in Metropolitan Suburbs. Trop. Geogr. 2024, 44, 68–78. [Google Scholar]
  5. Tong, J.; Li, Y.; Yang, Y. System Construction, Tourism Empowerment, and Community Participation: The Sustainable Way of Rural Tourism Development. Sustainability 2024, 16, 422. [Google Scholar] [CrossRef]
  6. Li, Z.; Xia, J. 30years of rural tourism research:literature review and research prospect. J. Cent. China Norm. Univ. Nat. Sci. Ed. 2024, 58, 1–12. [Google Scholar]
  7. Gao, R.; Zheng, S. Coupling coordination between agriculture and tourism in the Qinba Mountain area: A case study of Shanyang County, Shanxi Province. Environ. Dev. Sustain. 2024, 26, 1–20. [Google Scholar] [CrossRef]
  8. Chen, W.; Bin, C.; Tang, C.; Liu, X. Industry-Talentcoupling coordination evaluation and integration development model of rural tourism in ethic regions of Yunnan, Guangxi and Guizhou. J. Cent. China Norm. Univ. Nat. Sci. Ed. 2024, 58, 116–125. [Google Scholar]
  9. Xue, B.; Li, H.-Q.; Gang, S.; Ren, W.-X.; Wang, Y.-S.; Fang, L.; Li, Y.-J.; Zhao, X.-Y.; Chen, X.; Li, T.-L. Develop the rural ecology in the New Era. Ying Yong Sheng Tai Xue Bao=J. Appl. Ecol. 2024, 35, 268–274. [Google Scholar] [CrossRef]
  10. Zhang, X.; Zhang, Y.; Chen, H. Research on the development path of resource-based towns under the background of rural revitalizationtaking Chaohu Bantang Hot Spring town as an example. Jiangsu J. Agric. Sci. 2020, 36, 219–226. [Google Scholar]
  11. Zhou, F.; Zhao, F.; Xu, Q.; Yuan, Y.; Zhang, M. Evaluation and Selection Methods of Tourism Characteristic Town: The Case of Liaoning Province, China. Sustainability 2020, 12, 5372. [Google Scholar] [CrossRef]
  12. Ren, K.; Wu, T. Analyzing the Evolution of a Rural Construction Community in China from the Perspective of Cultural Landscape. Buildings 2024, 14, 97. [Google Scholar] [CrossRef]
  13. Zhang, Y.; Liu, B.; Zhao, H.; Lin, W.; Cheng, L.; Wang, X. Analyzing the spatiotemporal pattern of the decoupling degree between carbon metabolism and economic development in village and town units. PLoS ONE 2024, 19, e0296787. [Google Scholar] [CrossRef]
  14. Ren, T.; Wang, N.; Xiao, H.; Zhou, Z. Efficiency of funding to rural revitalization and regional heterogeneity of technologies in China: Dynamic network nonconvex metafrontiers. Socio-Econ. Plan. Sci. 2024, 92, 101825. [Google Scholar] [CrossRef]
  15. Sun, Y.; Zhang, B.; Lei, K.; Wu, Y.; Wei, D.; Zhang, B. Assessing rural landscape diversity for management and conservation: A case study in Lichuan, China. Environ. Dev. Sustain. 2024, 26, 1–29. [Google Scholar] [CrossRef]
  16. Ristic, D.; Vukoicic, D.; Ivanovic, M.; Nikolic, M.; Milentijevic, N.; Mihajlović, L.; Petrović, D. Transformation of Abandoned Railways into Tourist Itineraries/Routes: Model of Revitalization of Marginal Rural Areas. Land 2024, 13, 321. [Google Scholar] [CrossRef]
  17. Zhang, J.; Wang, S.; Zhao, W.; Liu, Y.; Fu, B. Research progress on the interlinkages between the 17 Sustainable Development Goals and their implication for domestic study. Acta Ecol. Sin. 2019, 39, 8327–8337. [Google Scholar] [CrossRef]
  18. Ma, Y.; Ai, X. Evaluation of Sustainable Urbanization Development in Jilin Province Based on the 2030 Sustainable Development Goals. Sci. Geogr. Sin. 2019, 39, 487–495. [Google Scholar] [CrossRef]
  19. Dong, X.; Yang, C.; Liu, X. The Exploration of China New Urbanization Theory. Urban Stud. 2017, 24, 26–34. [Google Scholar] [CrossRef]
  20. Ao, S.; Zhang, P.; Yu, C.; Li, G.Y.; Wang, C.X. The Theory and Practice of New Urbanization in China. Sci. Geogr. Sin. 2014, 34, 641–647. [Google Scholar] [CrossRef]
  21. Sun, J.; Xu, X.; Wang, N.; Xie, Y.; Ma, B.; Zhang, J.; Yang, Y.; Li, F.; Liao, J.-L.; Weng, S.-X. Ways and patterns of tourism’s role in poverty alleviation and rural revitalization: Expert discussion on “Tourism for Poverty Alleviation and Rural Revitalization”. J. Nat. Resour. 2021, 36, 2604–2614. [Google Scholar] [CrossRef]
  22. Zhou, T.; Jiang, G.; Ma, W.; Zhang, R.; Tian, Y.; Zhao, Q.; Tian, Y. A framework for identifying the distribution of revitalization potential of idle rural residential land under rural revitalization. Land Use Policy 2024, 136, 106977. [Google Scholar] [CrossRef]
  23. Xu, Q.; Zhong, M.; Dong, Y. Digital finance and rural revitalization: Empirical test and mechanism discussion. Technol. Forecast. Soc. Change 2024, 201, 123248. [Google Scholar] [CrossRef]
  24. Xiong, Z.; Huang, Y.; Yang, L. Rural revitalization in China: Measurement indicators, regional differences and dynamic evolution. Heliyon 2024, 10, e29880. [Google Scholar] [CrossRef] [PubMed]
  25. Tao, Y.; Wu, Y. An Empirical Study on the Evaluation of the Implementation Effect of the Rural Revitalization Strategy in Chongqing Municipality, China. Iran. J. Sci. Technol.-Trans. Civ. Eng. 2024, 48, 561–576. [Google Scholar] [CrossRef]
  26. Zhou, C.; Liu, J.; Wan, S.; Zheng, H.; Chen, S. Agricultural insurance and rural revitalization-an empirical analysis based on China’s provincial panel data. Front. Public Health 2023, 11, 1291476. [Google Scholar] [CrossRef] [PubMed]
  27. Li, B.; Li, X.; Chen, X.; Dou, Y.; Liu, P. Two-wheel driven construction of characteristic tourist towns under the background of new urbanization. Prog. Geogr. 2021, 40, 40–49. [Google Scholar] [CrossRef]
  28. Li, D.; Zheng, L.; Lin, S.; Yu, X.; Zhang, S.; Wang, F. Study on the Formation Mechanism and Path Optimization of Agricultural Characteristic Towns Case Analysis Based on Chengdu Model. China Soft Sci. 2018, 5, 79–90. [Google Scholar]
  29. Zhan, S.; Song, X. Study on the Development Mode and Spatial Distribution Characterristics of Characteristics Towns in ShaAnXi Province. J. China Agric. Resour. Reg. Plan. 2021, 42, 16–22. [Google Scholar]
  30. Chen, C.; Qian, S. Study on Ecological Restoration of Mining Relics in NanJing TangShan Healthy Pension Characteristic Town. Ind. Constr. 2021, 51, 87–92, 153. [Google Scholar]
  31. Liu, Y.; Hou, H.B.; Zhou, M. Study on Ecological Carrying Capacity of Characteristic Town. Fresen Environ. Bull 2019, 28, 3395–3400. [Google Scholar]
  32. Liao, Z.; Zhang, L. Spatial Distribution Characteristics and Accessibility Analysis of Characteristic Towns in Guangdong Province Based on Ripley’s K Function. J. Math. 2022, 2022, 1–14. [Google Scholar] [CrossRef]
  33. Ling, D.Z.; Bin, H.C.; Juan, X.J. Spatiotemporal Analysis of Development Efficiency of Characteristic Town In China Under the Resource and Enviroment Restrictions. J. Environ. Prot. Ecol. 2021, 22, 362–377. [Google Scholar]
  34. Lin, S.; Tian, P.; Li, D. Study on the Evaluation and Promotion of Agricultural Characteristic Towns’ Competitiveness:Case of 30 Towns in Sichuan Province. J. Sichuan Agric. Univ. 2020, 38, 764–774. [Google Scholar]
  35. GB/T 41410-2022; Chinese National Institute of Standardization. State Administration for Market Regulation; National Standardization Administration Committee: Beijing, China, 2022.
  36. Wang, H.; Zhao, L.; Yan, C.; Gong, Q. Research on the Construction of Evaluation Index System of Featured Town Maturity Based on Ordinal Relationship Analysis Method. Urban Dev. Res. 2021, 28, 26–29. [Google Scholar] [CrossRef]
  37. Wu, Y.; Chen, Q.; Zheng, X. Indicator System and Evaluation Method for the Development Level of Characteristic Towns. Planner 2016, 7, 123–127. [Google Scholar] [CrossRef]
  38. Wen, Y.; Jin, P. Construction of Core Competitiveness and Evaluation Model of Characteristic Towns. Ecol. Econ. 2017, 33, 85–89. [Google Scholar]
  39. Wang, C.; Jia, S. Characteristics Index System and Evaluation of Chinese Characteristic Towns. Nanjing Soc. Sci. 2019, 2, 79–86. [Google Scholar]
  40. Tian, X.; Zhao, X. Research on Evaluation Index System of Development Level of Sports Characteristic Towns. J. Chengdu Sport Univ. 2018, 44, 45–52. [Google Scholar] [CrossRef]
  41. Zhang, T.; Li, M.; Xu, Y. Construction and Empirical Research of Evaluation Index System for Rural Revitalization. Manag. World 2018, 8, 99–105. [Google Scholar] [CrossRef]
  42. Zhao, H. Research on Social Benefits Evaluation of Characteristic Town Projects in China Based on SEM. Master’s Thesis, Shandong Jianzhu University, Jinan, China, 2017; pp. 21–34. [Google Scholar]
Figure 1. Plot of clustering results under all indicators.
Land 13 01069 g001
Figure 2. Clustering results after removing indicator X1.
Land 13 01069 g002
Table 1. Development level evaluation index research summary.
Evaluation Index System NameComposition ElementsScholars (Time)
Indicator System for Evaluating the Development Level of Distinctive Town ConstructionPrimary indicators include the development foundation, industrial resources, economic benefits, ecological environment, and policy support, with 20 secondary indicators.Yanbing Chen et al., 2022 [35]
Characteristic town maturity evaluation index systemIncludes 7 primary, 21 secondary, and 49 tertiary indicatorsWang Hong et al., 2021 [36]
Indicator System for Performance Evaluation of Distinctive Town DevelopmentFour criteria layers, including the industrial dimension, functional dimension, morphological dimension, and institutional dimension, with 37 indicator layers.Yizhou Wu et al., 2016 [37]
Indicator System for Core Competitiveness of Distinctive TownsFive core competencies: environmental resource strength, infrastructure strength, capital resource strength, industrial development strength, government support strength; 18 secondary indicators; and 32 tertiary indicators.Wen Yan et al., 2018 [38]
Characteristic index system of characteristic townsIncluding 9 primary indicators and 18 secondary indicators.Changlong Wang et al., 2019 [39]
Assessment index system for characteristic sports towns in ChinaThree criteria layers: basic information dimension, characteristic industry dimension, public service dimension; twelve element layers.Xueli Tian et al., 2018 [40]
Rural Revitalization Evaluation Index systemFive secondary indicators: thriving industries, livable ecology, civilized rural customs, effective governance, prosperous livelihoods; fifteen tertiary indicators; forty-four quaternary indicators.Zhang Ting et al., 2018 [41]
Social benefit evaluation index system for characteristic townsFive latent variables: social and economic development, social livelihood development, ecological environmental impact, infrastructure construction, relevant institutional construction; twenty-eight observed variables.Haiyang Zhao et al., 2017 [42]
Table 2. Evaluation index system of development level of characteristic towns.
Criteria LayerIndicator LayerUnitNature of Indicators
Thriving industriesindustrial contribution rate X 1 %+
industrial characteristics and innovation X 2 %+
industrial scale and concentration X 3 %+
industrial driving force X 4 %+
level of industrial chain competitiveness X 5 %+
Livable ecologyvisual effect of urban townscape X 6 %+
comprehensive management of environmental pollution X 7 %+
efficient utilization of natural resources X 8 %+
green coverage rate of the town’s vegetation X 9 %+
level of completeness of public infrastructure X 10 %+
Civilized rural customscultural heritage and ideological transformation X 11 %+
level of public participation X 12 %+
tourism appeal X 13 %+
development and utilization of cultural resources X 14 %+
contribution of population quality and education level X 15 %+
Effective governanceconstruction of relevant institutions in the town X 16 %+
talent introduction X 17 %+
degree of rational sharing of public resources X 18 %+
level of completeness of public services X 19 %+
Prosperous livelihoodsincome distribution effect X 20 %+
degree of improvement in residents’ living standards X 21 %+
employment absorption rate of residents X 22 %+
Note: A “+” indicates a positive contribution of the indicator.
Table 3. Raw data on expert scoring.
NormExpert Scores
y 1 y 2 y 3 y 4 y 5 y 6 y 7 y 8 y 9 y 10 y 11 y 12 y 13 y 14 y 15 y 16 y 17 y 18 y 19 y 20 y 21 y 22 y 23 y 24 y 25
X 1 90789090898490909890889080897590889090899390909889
X 2 88799591867888899688899881867888899091868888899690
X 3 85869189897985879292869187897992869192899585879294
X 4 92929494888892889395929489888895929494889292889392
X 5 96949293968291869196949283968296949293969195869193
X 6 83769069776790847486589079836472609089659390849478
X 7 90889392946583899390959392946590959392949383899391
X 8 91778988936790889091978978936791978988939281838890
X 9 84657986916688899092918986915592918986918886928993
X 10 90828892906492869190908892906490908892909172948488
X 11 89746273876070928389908683926089778683748580938690
X 12 87888890907193909087928188937187928188938891918777
X 13 92798985717588888988909089947088906889948692907689
X 14 96798691926695858796919392956696919392958786899090
X 15 93699294947172928893939292657193939267908875876991
X 16 91809492937876917491658886927890889090899396909889
X 17 94759690899893758494908682945888899091868888899690
X 18 91699573928083838993919665938092869172899585879294
X 19 90779789887592818388909191917595929494889292887392
X 20 86749189867088869289939292907096949293968491869193
X 21 93819078928091829484889365898076969089959390849490
X 22 95829086837685809386869489877680959392949383899391
Table 4. Values of F-statistics.
Classification2345
λ 0.65570.65570.71280.8024
F 4.30374.30374.93505.6400
F a 2.61432.61432.74012.8661
( F F a ) / F a 0.64620.64620.80110.9678
Table 5. Optimal clustering results.
IndicatorsOptimal Clustering
All indicators{y1}, {y2}, {y3}, {y4}, {y5}, {y6}, {y7}, {y8}, {y9}, {y10}, {y11}, {y12}, {y13}, {y14’, ‘y15}, {y16}, {y17}, {y18}, {y19}, {y20}, {y21}, {y22}, {y23}, {y24}, {y25}
B-X1{y1}, {y2}, {y3}, {y4}, {y5}, {y6’, ‘y20}, {y7}, {y8}, {y9}, {y10}, {y11}, {y12}, {y13}, {y14’, ‘y15}, {y16}, {y17}, {y18}, {y19}, {y21}, {y22}, {y23}, {y24}, {y25}
B-X2{y1}, {y2}, {y3}, {y4}, {y5}, {y6’, ‘y20}, {y7}, {y8}, {y9}, {y10}, {y11}, {y12}, {y13}, {y14’, ‘y15}, {y16}, {y17}, {y18}, {y19}, {y21}, {y22}, {y23}, {y24}, {y25}
B-X3{y1}, {y2}, {y3}, {y4}, {y5}, {y6}, {y7}, {y8}, {y9}, {y10}, {y11}, {y12}, {y13}, {y14’, ‘y15}, {y16}, {y17}, {y18}, {y19}, {y20}, {y21}, {y22}, {y23}, {y24}, {y25}
B-X4{y1}, {y2}, {y3}, {y4}, {y5}, {y6}, {y7}, {y8}, {y9}, {y10}, {y11}, {y12}, {y13}, {y14}, {y15’, ‘y20}, {y16}, {y17}, {y18}, {y19}, {y21}, {y22}, {y23}, {y24}, {y25}
B-X5{y1}, {y2}, {y3}, {y4}, {y5}, {y6}, {y7}, {y8}, {y9}, {y10}, {y11}, {y12}, {y13}, {y14’, ‘y15}, {y16}, {y17}, {y18}, {y19}, {y20}, {y21}, {y22}, {y23}, {y24}, {y25}
B-X6{y1}, {y2}, {y3}, {y4}, {y5}, {y6’, ‘y14}, {y7}, {y8}, {y9}, {y10}, {y11}, {y12}, {y13}, {y15’, ‘y20}, {y16}, {y17}, {y18}, {y19}, {y21}, {y22}, {y23}, {y24}, {y25}
B-X7{y1}, {y2}, {y3}, {y4}, {y5}, {y6}, {y7}, {y8}, {y9}, {y10}, {y11}, {y12}, {y13}, {y14’, ‘y15}, {y16}, {y17}, {y18}, {y19}, {y20}, {y21}, {y22}, {y23}, {y24}, {y25}
B-X8{y1}, {y2}, {y3}, {y4}, {y5}, {y6}, {y7}, {y8}, {y9}, {y10}, {y11}, {y12}, {y13}, {y14’, ‘y15}, {y16}, {y17}, {y18}, {y19}, {y20}, {y21}, {y22}, {y23}, {y24}, {y25}
B-X9{y1}, {y2}, {y3}, {y4}, {y5}, {y6}, {y7}, {y8}, {y9}, {y10}, {y11}, {y12}, {y13}, {y14’, ‘y15}, {y16}, {y17}, {y18}, {y19}, {y20}, {y21}, {y22}, {y23}, {y24}, {y25}
B-X10{y1}, {y2}, {y3}, {y4}, {y5}, {y6}, {y7}, {y8}, {y9}, {y10}, {y11}, {y12}, {y13}, {y14’, ‘y15}, {y16}, {y17}, {y18}, {y19}, {y20}, {y21}, {y22}, {y23}, {y24}, {y25}
B-X11{y1}, {y2}, {y3’, ‘y6}, {y4}, {y5}, {y7}, {y8}, {y9}, {y10}, {y11}, {y12}, {y13}, {y14’, ‘y15}, {y16}, {y17}, {y18}, {y19}, {y20}, {y21}, {y22}, {y23}, {y24}, {y25}
B-X12{y1}, {y2}, {y3}, {y4}, {y5}, {y6}, {y7}, {y8}, {y9}, {y10}, {y11}, {y12}, {y13}, {y14’, ‘y15}, {y16}, {y17}, {y18}, {y19}, {y20}, {y21}, {y22}, {y23}, {y24}, {y25}
B-X13{y1}, {y2}, {y3}, {y4}, {y5}, {y6}, {y7}, {y8}, {y9}, {y10}, {y11}, {y12}, {y13}, {y14’, ‘y15}, {y16}, {y17}, {y18}, {y19}, {y20}, {y21}, {y22}, {y23}, {y24}, {y25}
B-X14{y1}, {y2}, {y3}, {y4}, {y5}, {y6}, {y7}, {y8}, {y9}, {y10}, {y11}, {y12}, {y13}, {y14’, ‘y15}, {y16}, {y17}, {y18}, {y19}, {y20}, {y21}, {y22}, {y23}, {y24}, {y25}
B-X15{y1}, {y2}, {y3}, {y4}, {y5}, {y6}, {y7}, {y8}, {y9}, {y10}, {y11}, {y12}, {y13}, {y14’, ‘y15}, {y16}, {y17}, {y18}, {y19}, {y20}, {y21}, {y22}, {y23}, {y24}, {y25}
B-X16{y1}, {y2}, {y3}, {y4}, {y5}, {y6’, ‘y20}, {y7}, {y8}, {y9}, {y10}, {y11}, {y12}, {y13}, {y14’, ‘y15}, {y16}, {y17}, {y18}, {y19}, {y21}, {y22}, {y23}, {y24}, {y25}
B-X17{y1}, {y2}, {y3}, {y4}, {y5}, {y6’, ‘y20}, {y7}, {y8}, {y9}, {y10}, {y11}, {y12}, {y13}, {y14’, ‘y15}, {y16}, {y17}, {y18}, {y19}, {y21}, {y22}, {y23}, {y24}, {y25}
B-X18{y1}, {y2}, {y3}, {y4}, {y5}, {y6’, ‘y20}, {y7}, {y8}, {y9}, {y10}, {y11}, {y12}, {y13}, {y14’, ‘y15}, {y16}, {y17}, {y18}, {y19}, {y21}, {y22}, {y23}, {y24}, {y25}
B-X19{y1}, {y2}, {y3}, {y4}, {y5}, {y6}, {y7}, {y8}, {y9}, {y10}, {y11}, {y12}, {y13}, {y14’, ‘y15}, {y16}, {y17}, {y18}, {y19}, {y20}, {y21}, {y22}, {y23}, {y24}, {y25}
B-X20{y1}, {y2}, {y3}, {y4}, {y5}, {y6}, {y7}, {y8}, {y9}, {y10}, {y11}, {y12}, {y13}, {y14’, ‘y15}, {y16}, {y17}, {y18}, {y19}, {y20}, {y21}, {y22}, {y23}, {y24}, {y25}
B-X21{y1}, {y2}, {y3}, {y4}, {y5}, {y6}, {y7}, {y8}, {y9}, {y10}, {y11}, {y12}, {y13}, {y14’, ‘y15}, {y16}, {y17}, {y18}, {y19}, {y20}, {y21}, {y22}, {y23}, {y24}, {y25}
B-X22{y1}, {y2}, {y3}, {y4}, {y5}, {y6}, {y7}, {y8}, {y9}, {y10}, {y11}, {y12}, {y13}, {y14’, ‘y15}, {y16}, {y17}, {y18}, {y19}, {y20}, {y21}, {y22}, {y23}, {y24}, {y25}
Table 6. Comprehensive evaluation results.
Norm Importance   of   Improvement   s i g c i ( c i ) Weights   w k Consolidated   Assessed   Value   s k Rankings
Industry contribution rate (X1)0.58430.04300.26378
industrial characteristics and innovativeness (X2)0.61800.04550.33187
industrial driving force (X4)0.53530.03940.60433
town visual appearance effect (X6)0.58300.04290.60832
cultural heritage and ideological change (X11)0.61200.04500.54275
town-related system construction (X16)0.61080.04490.45216
introduction of talents (X17)0.63910.04700.56414
Reasonable degree of sharing of public resources (X18)0.55060.04050.67971
Table 7. Brief description of each specialty town.
Characteristics TownIndustrial StructureScale and Development Goals
Mahogany Town Z 1 Follow the model of “manufacturing base + cultural tourism + OTO + modern circular community”.Integrate “production, ecology, and life” to create unique and charming tourist destinations and holiday resorts.
Chocolate Sweet Town Z 2 Relying on the “tourism+” development path as its characteristic feature, it integrates agriculture, industry, and leisure industries.With the fashion industry as its core, it advances internationalization, showcases cultural characteristics, and strengthens internet applications.
Leather Fashion Town Z 3 Integrating comprehensive supporting services, such as e-commerce live streaming, e-commerce supply, anchor incubation, education and training, and intelligent warehousing and logistics.Committed to guiding industry practitioners to explore new modes of development that integrate online and offline operations.
Intelligent Automobile Town ( Z 4 )With the new energy automobile industry as the core and intelligence as the feature, grafting the new energy automobile culture and tourism function.Create a new energy vehicle base integrating R&D, large-scale production, industrial support and sightseeing experience.
Silk Town Z 5 A composite town integrating the silk industry, historical heritage, ecotourism, and urban–rural integration.Committed to building a comprehensive platform that integrates brand pavilions, research and development centers, and design supply chains.
Artistic Town Z 6 Integrate “production, ecology, and life” to create unique and charming tourist destinations and holiday resorts.Guided by sustainable development, we are committed to building a comprehensive fashion industry complex and leading the new trend of the fashion industry.
Internet Town Z 7 Based on smart computing and data service platforms, combined with nurturing the data industry, it focuses on areas, such as smart cars, intelligent sensors, and industrial internet.Committed to advancing the smart construction that tightly connects social governance, livelihood services, and residents’ lives.
Monchu Town ( Z 8 )With a solid and diversified industrial development foundation, including industrial design, intelligent design, and business design.Focus on planning projects, such as the Innovation and Design Research Institute, the International Design Institute, and the Design Exhibition Center.
Table 8. Expert scoring raw data set (mean values).
NormX1X2X4X6X11X16X17X18
Z 1 8690888990889190
Z 2 8888879084949089
Z 3 9085898889928887
Z 4 9190858786888984
Z 5 8789929090908588
Z 6 8990909189929291
Z 7 9189929293939194
Z 8 9088918889888985
Table 9. Calculation results of each characteristic town.
Positive   Ideal   Solution   Distance   ( d i * ) Negative   Ideal   Solution   Distance   ( d i ) Relative Closeness (ζ)Sorted
Z 1 0.69710.51970.42716
Z 2 0.51530.66010.56163
Z 3 0.57170.53210.48204
Z 4 0.83980.46930.35858
Z 5 0.59520.54530.47815
Z 6 0.30350.74070.70942
Z 7 0.10900.93390.89551
Z 8 0.71260.48830.40667
Disclaimer/Publisher’s Note: The statements, opinions and data contained in all publications are solely those of the individual author(s) and contributor(s) and not of MDPI and/or the editor(s). MDPI and/or the editor(s) disclaim responsibility for any injury to people or property resulting from any ideas, methods, instructions or products referred to in the content.

